


 Abstract
 HTML
HTML Reference
 Related
 PDF
PDF


-
The energy issue has long remained a critical challenge for human society. Currently, fossil fuels—such as coal, oil, and natural gas—still dominate the global energy structure, most of which are non-renewable resources [1]. Since the 1960s, various renewable energy technologies have been progressively developed, including solar, wind, tidal, and biomass energies [2]. However, these alternatives are subject to limitations such as geographical dependency, weather variability, and low energy density, making it difficult for them to fully replace traditional energy sources. Among all alternatives, nuclear energy is considered a uniquely strategic option due to its long-term availability, high energy density [3]. Since the commissioning of the world’s first nuclear power plant in Obninsk, USSR, in 1954, significant progress has been made in the development and utilization of nuclear fission energy, with more than 400 commercial nuclear reactors now in operation [4]. Meanwhile, controlled thermonuclear fusion—often referred to as the “ultimate energy source”—has become an increasingly prominent research focus, exemplified by the ongoing construction of the International Thermonuclear Experimental Reactor (ITER) [5]. It is widely believed that breakthroughs in advanced nuclear technologies, such as fusion energy, will be decisive in addressing the global energy crisis.
Against the backdrop of rapid advancements in nuclear energy technologies, ensuring safety, controllability, and efficiency fundamentally depends on accurate understanding and modeling of nuclear reactions—a process that relies heavily on high-precision nuclear data [6]. Nuclear data serve as essential input parameters for core aspects such as reactor design, radiation protection analysis, and shielding calculations, and are the cornerstone of the credibility of nuclear science simulations. Among them, neutron nuclear data are particularly critical in nuclear energy systems. In the fission energy region, in particular, the interaction cross sections between neutrons and materials directly affect core design and operational safety [7]. Therefore, to establish a high-precision and reproducible benchmark database, the reliability of experimental methods and the consistency of standard samples are of paramount importance.
Reviewing previous nuclear data measurements, accelerator-based neutron sources such as D-T and D-D are commonly used due to their broad energy coverage and high flux capabilitie [8-11]. However, isotopic neutron sources like 252Cf offer equally valuable advantages, including simple structure, operational ease, and stable neutron output, making them well-suited for compact and reproducible experimental setups [12]. Meanwhile, spherical samples have gained attention for their geometric symmetry and isotropic neutron leakage, which minimize boundary effects and improve the comparability of experimental results [13,14]. Among candidate materials, polyethylene stands out due to its high hydrogen content, well-understood neutron interaction mechanisms dominated by elastic scattering, and well-established cross-section data across major international libraries [15,16]. These characteristics make it a widely accepted reference material in shielding integral and benchmark experiments. Therefore, by combining 252Cf neutron sources with standardized polyethylene spheres, one can effectively validate the accuracy and stability of nuclear data measurement systems—providing a reliable foundation for future studies involving more complex materials and supporting the long-term reliability of fission-spectrum nuclear data for reactor applications.
As early as the 1950s, the United States took the lead in systematically measuring the neutron spectrum of 252Cf, and progressively accumulated a comprehensive body of experimental data and research findings on the source [17−20]. Subsequent studies have further advanced the understanding of its fission neutron emission mechanisms and spectral characteristics [21]. S.P. Simakov and colleagues conducted leakage neutron spectrum measurements for bismuth using both D-T and 252Cf neutron sources [22]. However, due to the limitations of the experimental conditions at that time—particularly the use of paraterphenyl organic scintillators and traditional analog electronics—the time resolution and spectral analysis capabilities were significantly constrained. In contrast, the present study incorporates a modern digital waveform acquisition system, which significantly simplifies the electronics chain and improves the stability and reproducibility of data acquisition. The experiment also employs a combination of EJ-309(0.80–8.00 MeV) and CLYC(0.15–0.80 MeV) detectors to ensure complete coverage of the fission neutron energy spectrum, along with excellent neutron–gamma discrimination capability. The energy range of 0.15–8 MeV was selected as the effective measurement region, which primarily covers the main energy domain of 252Cf spontaneous fission neutrons. This range is representative and well-suited for fission spectrum validation and shielding research. It encompasses both fast and intermediate-energy neutrons, which are of critical importance in neutron transport, structural damage analysis, and shielding design. This study not only represents the first implementation of a 252Cf-based neutron nuclear data benchmark platform in China, but also demonstrates significant advantages over earlier international studies in terms of system configuration, time resolution, and spectral completeness. The platform provides a robust and scalable foundation for future nuclear data validation efforts.
In this work, we developed a time-of-flight (TOF) measurement system based on a 252Cf spontaneous fission source and, for the first time, employed a silicon carbide (SiC) detector as the start-time signal detector for TOF measurements. A large-volume spherical polyethylene sample was used, with the 252Cf source positioned at its geometric center to ensure isotropic neutron emission. The system utilized EJ-309 and CLYC scintillators to detect neutrons across a broad energy range, while background suppression was achieved via shadow cone shielding and pulse shape discrimination. TOF spectra were first acquired under sample-out conditions and compared with Monte Carlo simulations, followed by benchmark measurements using the polyethylene sphere. Monte Carlo simulations were performed using evaluated nuclear data from ENDF/B-VIII.1 [23], CENDL-3.2 [24], JEFF-3.3 [25], and JENDL-5 [26], and the simulated results were systematically compared with the experimentally measured neutron leakage spectra in the 0.15–8.00 MeV energy range. And the calculated-to-experimental (C/E) deviations within 5% at high energies and 13% at low energies.
-
To ensure radiation safety and a low-background environment for 252Cf-based neutron measurements, the experimental area was enclosed by concrete walls and supplemented with local shielding. Monte Carlo simulations confirmed that the dose rates in occupied areas complied with the GB18871-2002 national standard for occupational exposure [27]. A 20 cm-thick paraffin wall was installed around critical locations such as doors and windows to suppress neutron and photon leakage. Personnel entering the source area wore protective garments equivalent to 0.5 mm Pb. These measures ensured both compliance and suitability for long-term experimental operation.
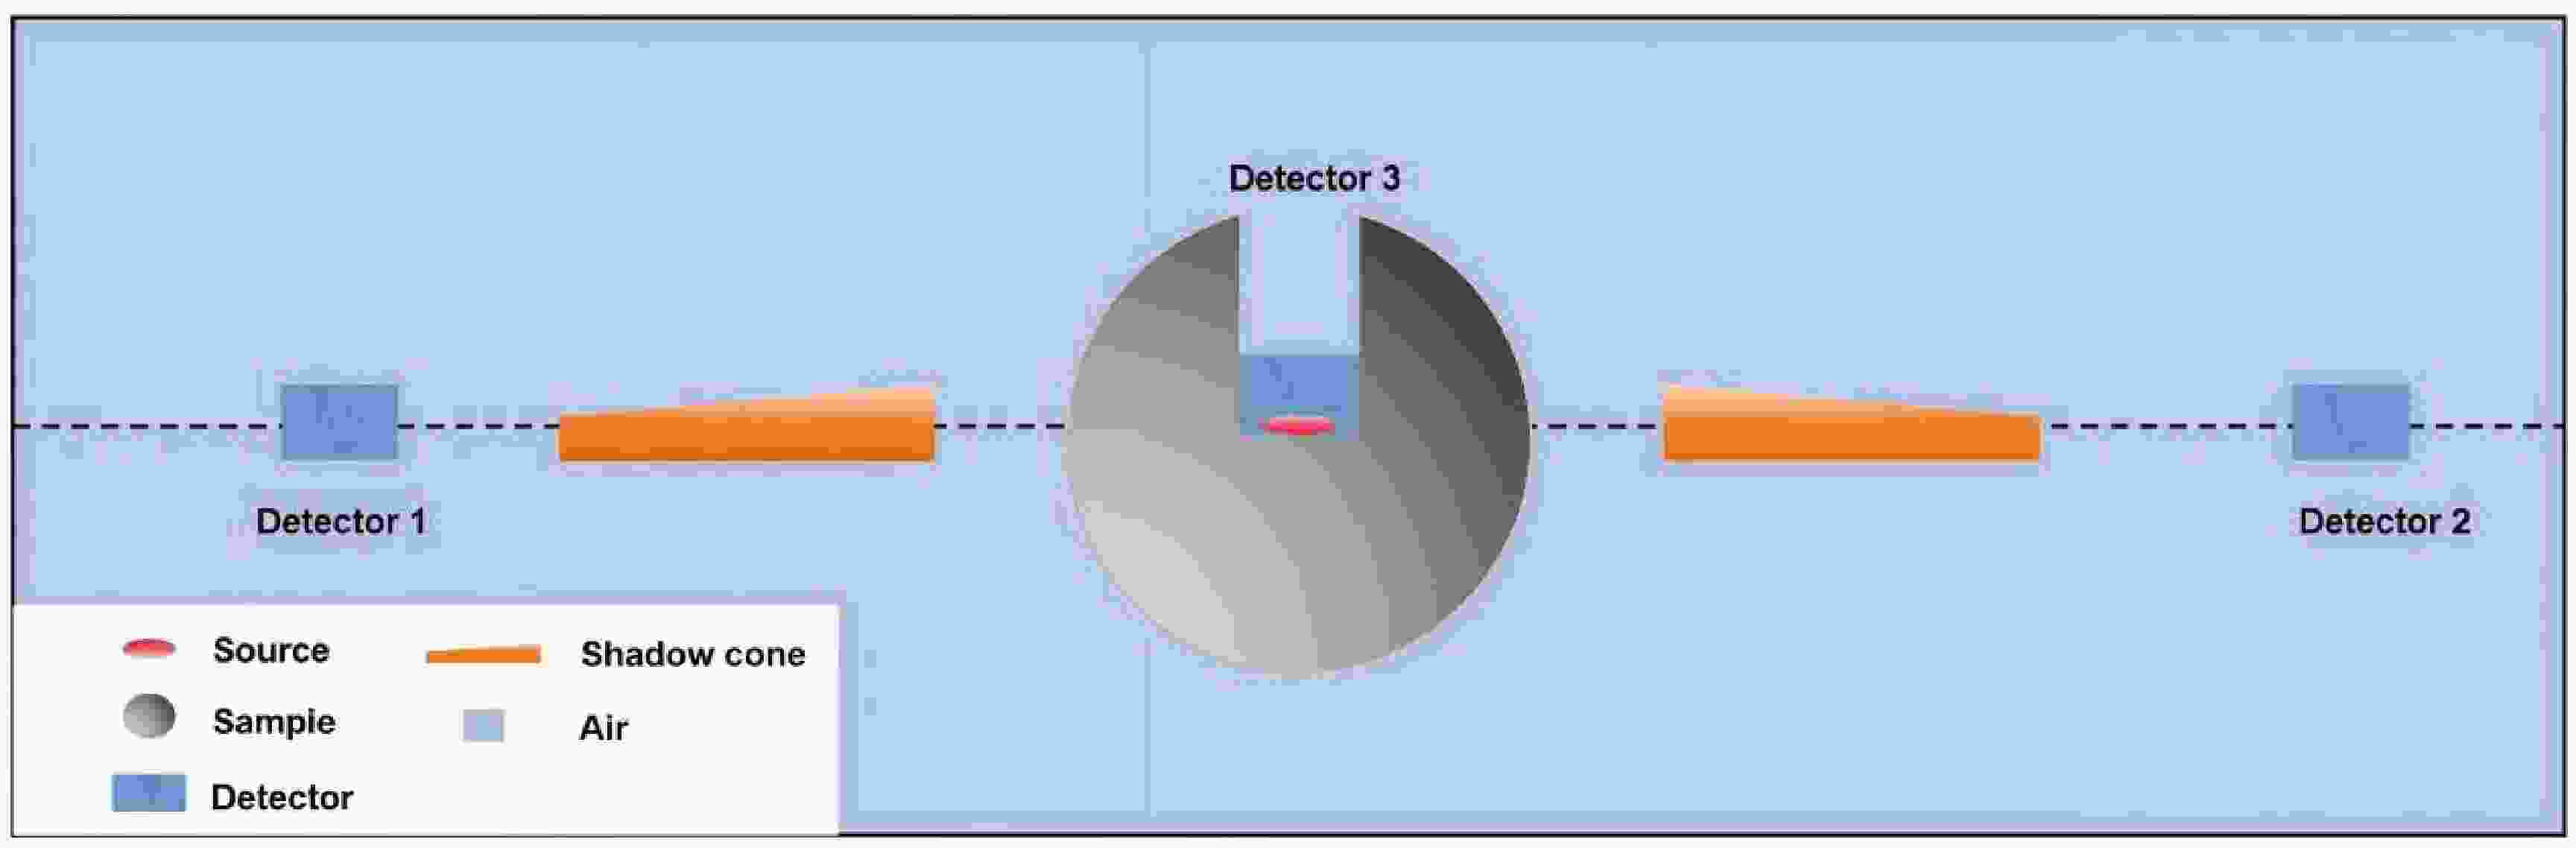
The schematic of the experimental setup is shown in Fig.1, where the spherical sample is positioned at the center. Detector 3 is a silicon carbide (SiC) detector, Detector 1 is an EJ-309 liquid scintillator, and Detector 2 is a CLYC(Cs2LiYCl6:Ce) scintillator detector.
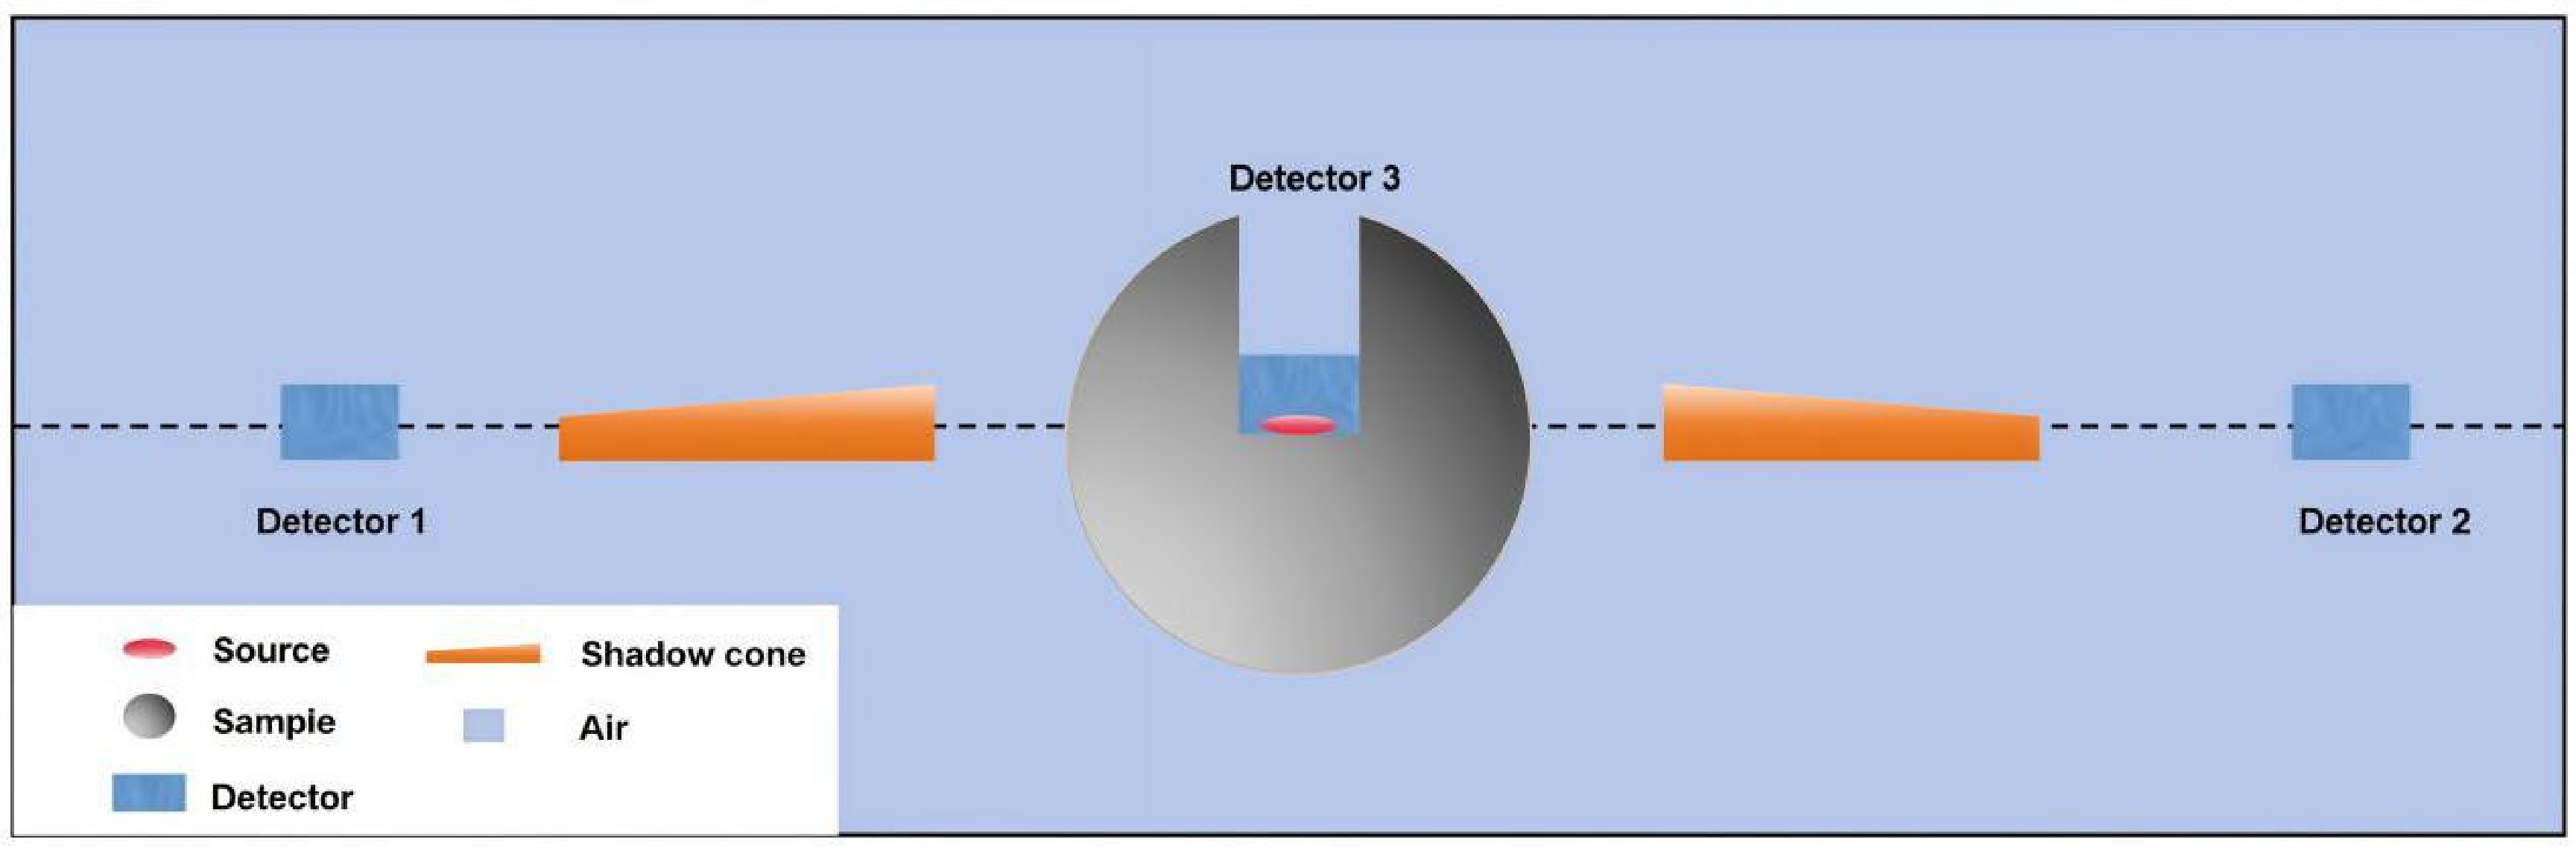
Figure 1. (color online) Experimental arrangement for measuring the neutron leakage TOF spectrum
The EJ-309 detector and the CLYC detector are manufactured by SCIONIX (Netherlands) and RMD (USA) respectively. Both detectors have dimensions of 2 inches in diameter and thickness. Their energy resolutions at 662 keV γ-rays are better than 7% for EJ-309 and 5% for CLYC. In this experiment, the CLYC detector is primarily employed for measuring thermal and low-energy neutrons due to its sensitivity based on the 6Li(n,t)α reaction. The SiC detector is used to detect fission fragments and serves to determine the start time for TOF measurements. It is placed in direct contact with the 252Cf neutron source, as illustrated in Fig.1, which maintains a neutron emission rate exceeding 105 n/s throughout the experiment [28−30].
A spherical polyethylene sample is used in the experiment, with a central cavity designed to accommodate the 252Cf neutron source. This spherical geometry ensures that fission reactions occur uniformly in all directions, thereby minimizing boundary effects and associated measurement disturbances. As a result, the setup allows for more effective acquisition of interaction data between neutrons and the sample over a full 4π solid angle, providing a realistic and symmetric representation of neutron behavior within the material.
The neutron energy was determined using the time-of-flight (TOF) technique, by measuring the time a neutron travels a known distance from the source to the detector [34]. This method directly derives energy from measured flight time without requiring detector response unfolding, offering a clear physical basis and high energy resolution. In this work, start signals were obtained via the SiC detector near the 252Cf source, while EJ-309 and CLYC scintillators were used to detect neutrons at different distances. During the experiment, the complex structural environment of the experimental hall often introduces scattered background, which can adversely affect the accuracy of the measurement data. To mitigate this, a shadow cone is employed, which can effectively block direct neutrons from the source from reaching the detector [31]. Therefore, a background TOF spectrum is measured using the shadow cone.
An 8-channel digital waveform digitizer, model DT5730SB (14-bit, 500 MS/s, 5.12 MS/ch), manufactured by CAEN (Italy), was selected for data acquisition, along with the COMPASS software. This digitizer can directly acquire signals from photomultiplier tubes (PMTs) without the need for traditional electronics modules such as preamplifiers, main amplifiers, or charge-integrating analog-to-digital converters (QDCs), resulting in a simplified setup and convenient signal acquisition. The firmware used in the experiment was DPP-PSD (Digital Pulse Processing–Pulse Shape Discrimination), which is specifically designed by CAEN for its x730 series digitizers. It enables real-time pulse shape discrimination (PSD) analysis, replacing the need for post-processing with Python. By configuring parameters such as the trigger threshold, long gate, and short gate, the system allows for both data acquisition and PSD processing, facilitating real-time monitoring and adjustment of experimental parameters during measurements.Due to the complexity of the experimental data, online analysis alone was insufficient to meet the data processing requirements. Therefore, during data acquisition, the system was used to monitor the measurement results in real time via its online functions, while the digitized waveform signals were simultaneously stored in ROOT format to facilitate subsequent offline analysis [32,33].
-
To support experimental validation, Monte Carlo simulations using the MCNP code were performed to model the neutron transport process and TOF spectrum. The simulations included detailed geometric modeling, detector efficiency calibration, and individual nuclear data inputs from four evaluated libraries. This allowed for a quantitative comparison between measured and simulated spectra.
The MCNP code, based on the Monte Carlo method, is a widely used simulation tool for studying particle transport problems [31,34-35]. In this work, it was employed to construct a model for simulating the neutron TOF spectrum. To accurately represent the neutron transport process, the model must satisfy the following key requirements:
(1) complete and precise geometric modeling;
(2) accurate input of the detector efficiency curve;
(3) detailed and realistic description of the neutron source.
Based on the laboratory layout shown in Fig.2 (sample-in configuration), a comprehensive geometry model was developed to include all relevant structures and components. The detector efficiency was input using the simulation-based calibration curves verified by experimental data, . Given that the 252Cf neutron source used in the experiment was thin, it was modeled as a surface source. The dimensions and material composition of the neutron source backing were also accurately defined.
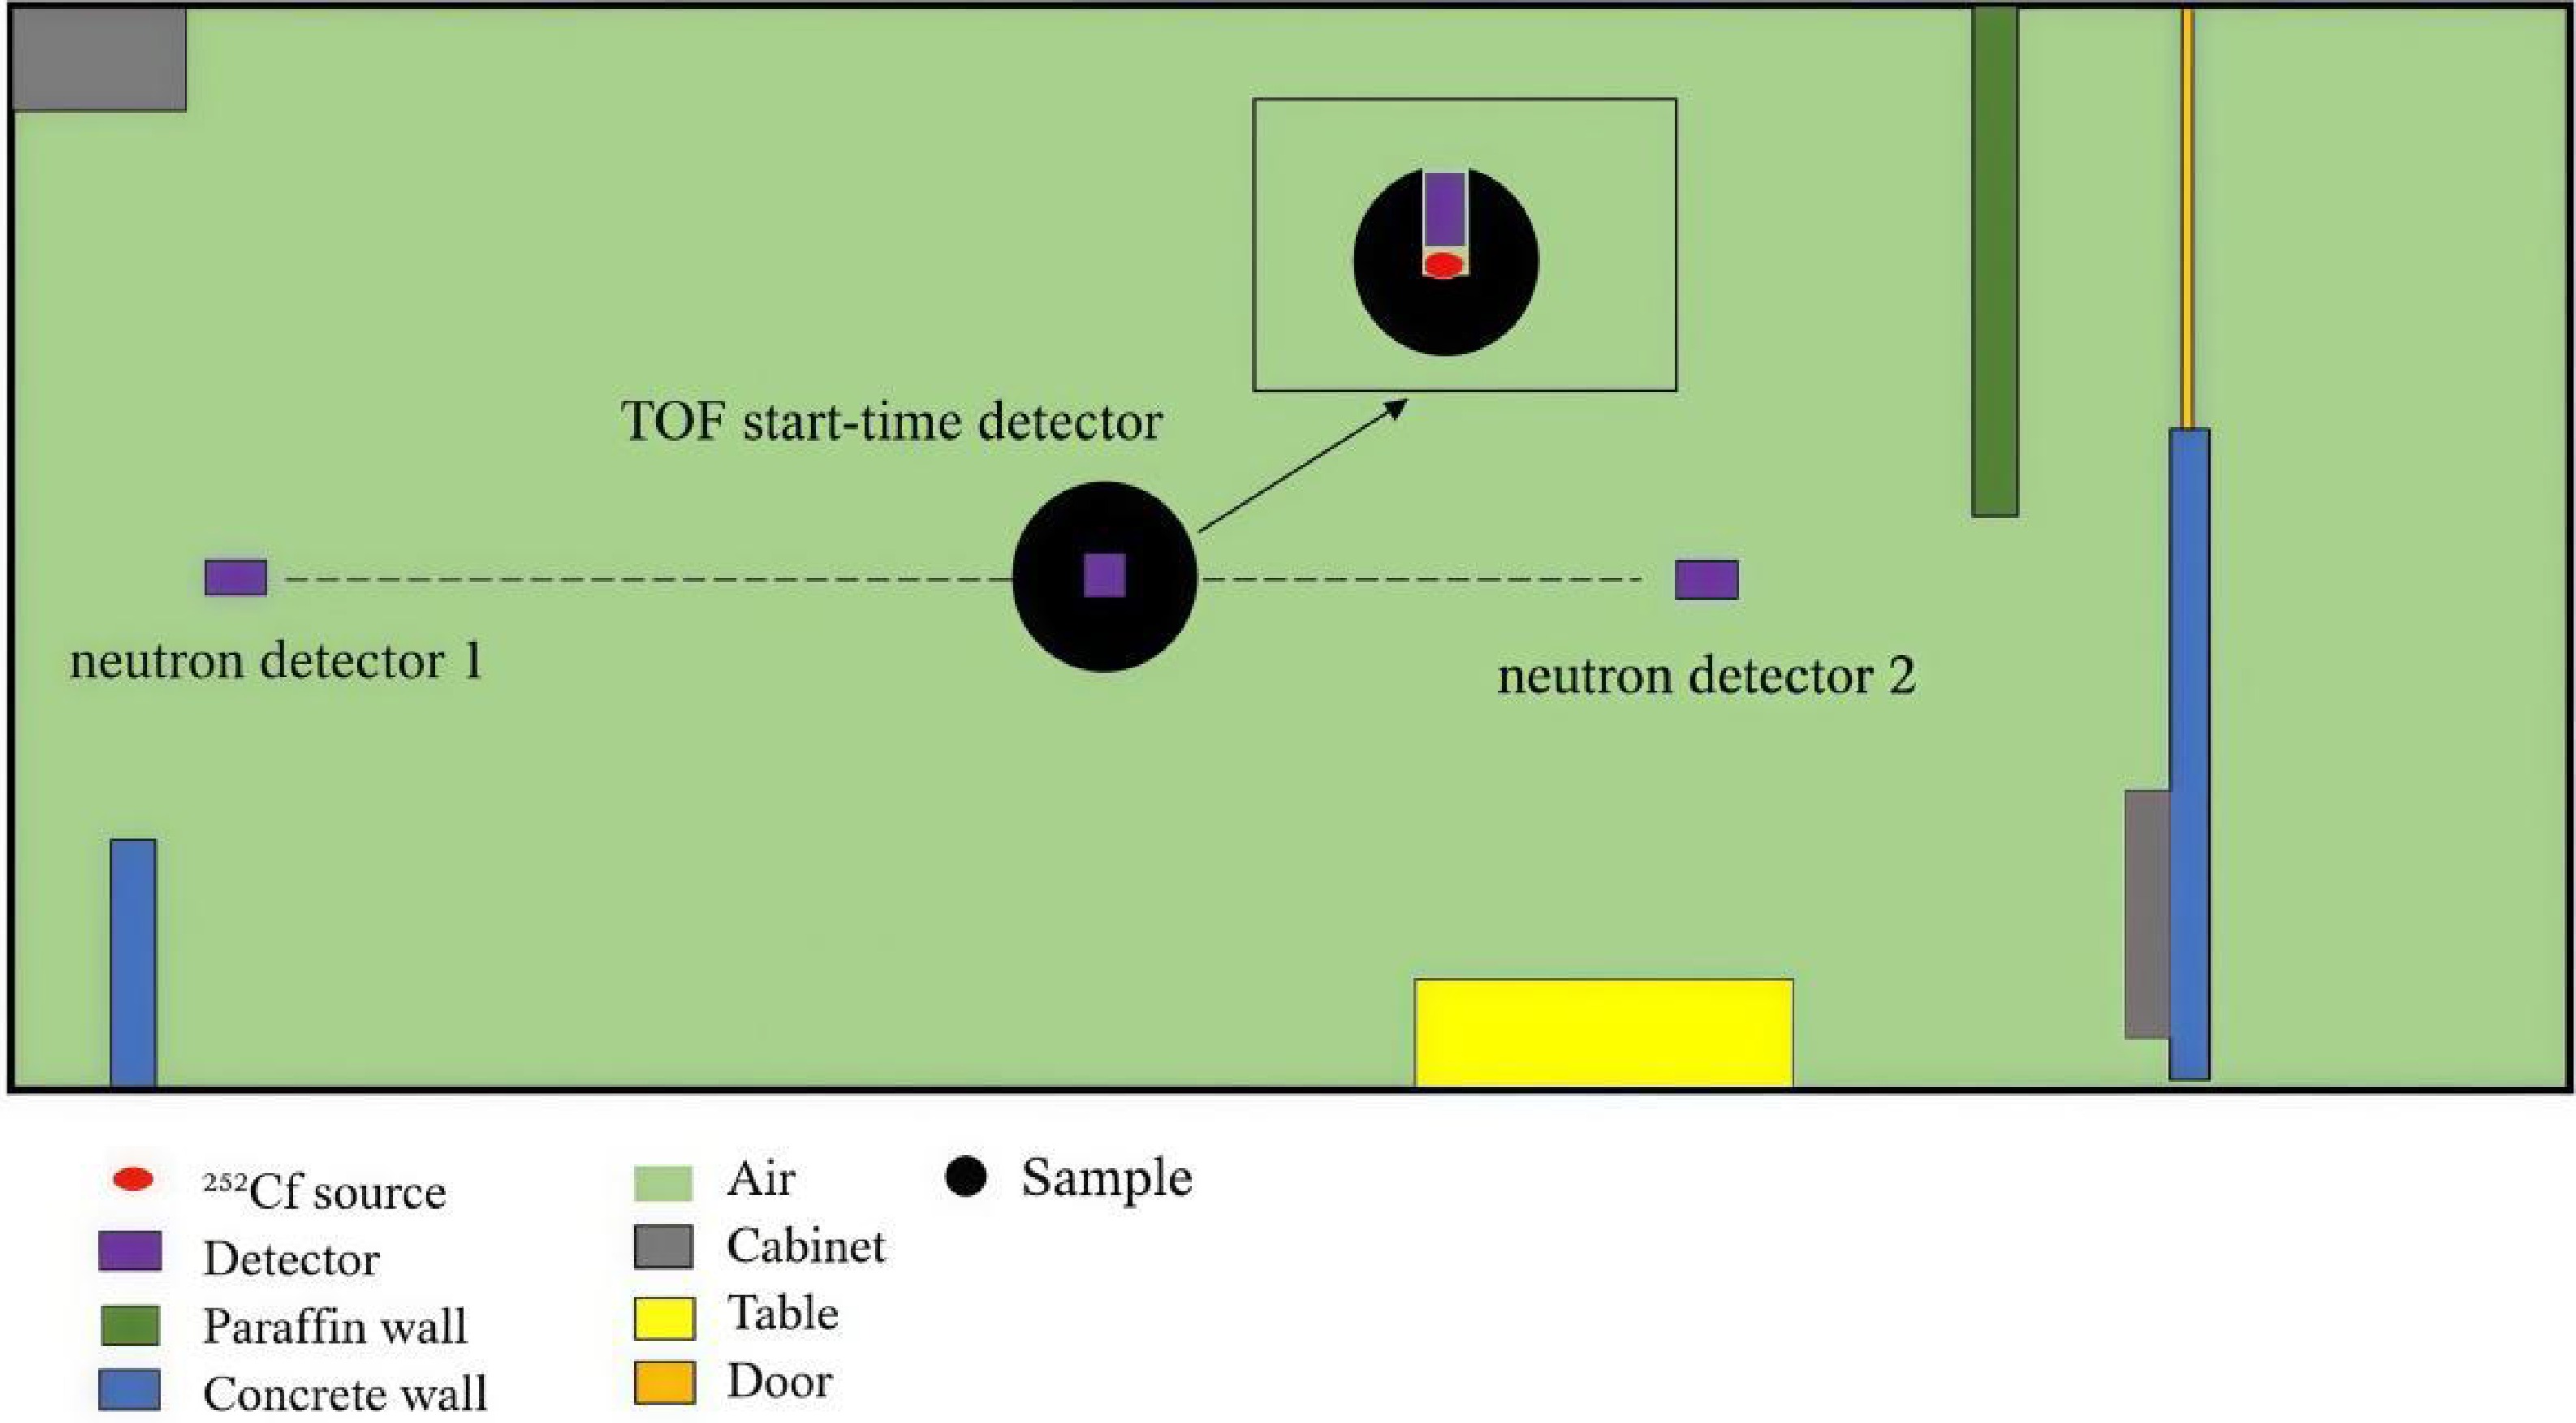
Figure 2. (color online) Top view of the geometry model constructed with the MCNP code. The inset illustrates the placement of the sample and the 252Cf neutron source.
To validate nuclear data from different evaluated libraries, neutron cross-section data for the sample material were individually taken from ENDF/B-VIII.1, CENDL-3.2, JEFF-3.3, and JENDL-5 libraries. All other materials in the model used evaluation data from the ENDF/B-VIII.1 library to ensure consistency.
Compared to conventional plate-shaped or asymmetric samples, spherical geometry possesses inherent isotropic advantages, which significantly reduce the influence of external structural responses on experimental results. This leads to stronger reference value and comparability. Such geometric superiority is particularly important in the cross-validation of nuclear data libraries and under varying detector arrangements, making it especially suitable for shielding integral experiments and nuclear data benchmark evaluations.
-
The SiC detector is a type of semiconductor detector that operates based on the ionization effect to detect charged particles. It features high sensitivity and fast response time. In this experiment, the SiC detector was used to detect fission fragments and thereby provide the take-off time information, while simultaneously offering neutron source characterization.
Fig.3(a) shows the actual SiC detector used in the experiment, which was fabricated by the Institute of Modern Physics, Chinese Academy of Sciences. The overall diameter of the detector is less than 3 cm. To minimize signal loss due to the distance between the fission fragments and the detector, the 252Cf neutron source must be closely attached to the detector surface.
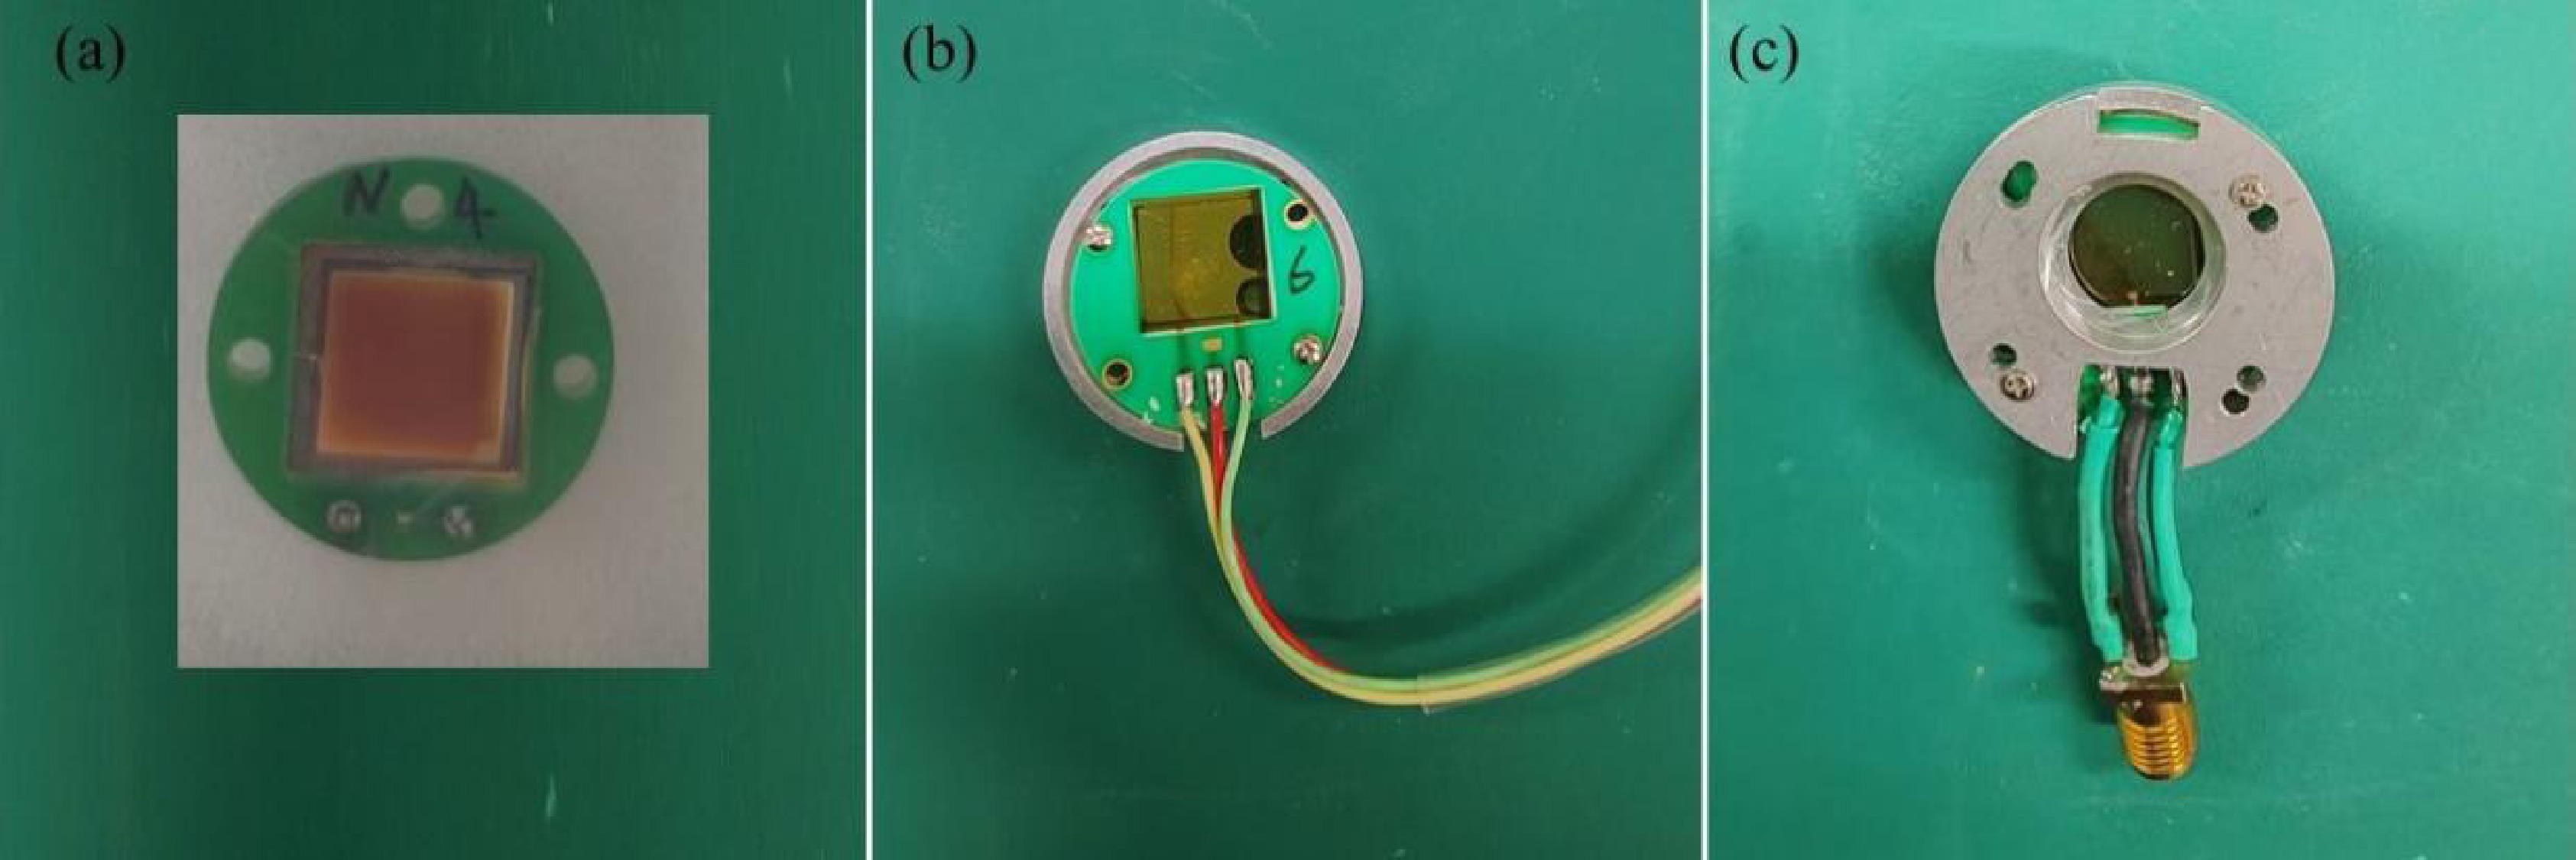
Figure 3. (color online) Photographs of the silicon carbide (SiC) detector:(a) Newly fabricated SiC detector; (b) Signal cable being soldered to the detector; (c) Detector placed inside a custom-made aluminum housing, with the circular area at the top designated for the neutron source.
To achieve this, a non-conductive aluminum housing was custom-built. The housing consists of two sections: one for holding the radioactive source, and the other for accommodating the detector. These two sections are fastened together with screws. The detector-holding section includes side and bottom openings to facilitate signal cable routing and detector heat dissipation, as illustrated in Fig.4.
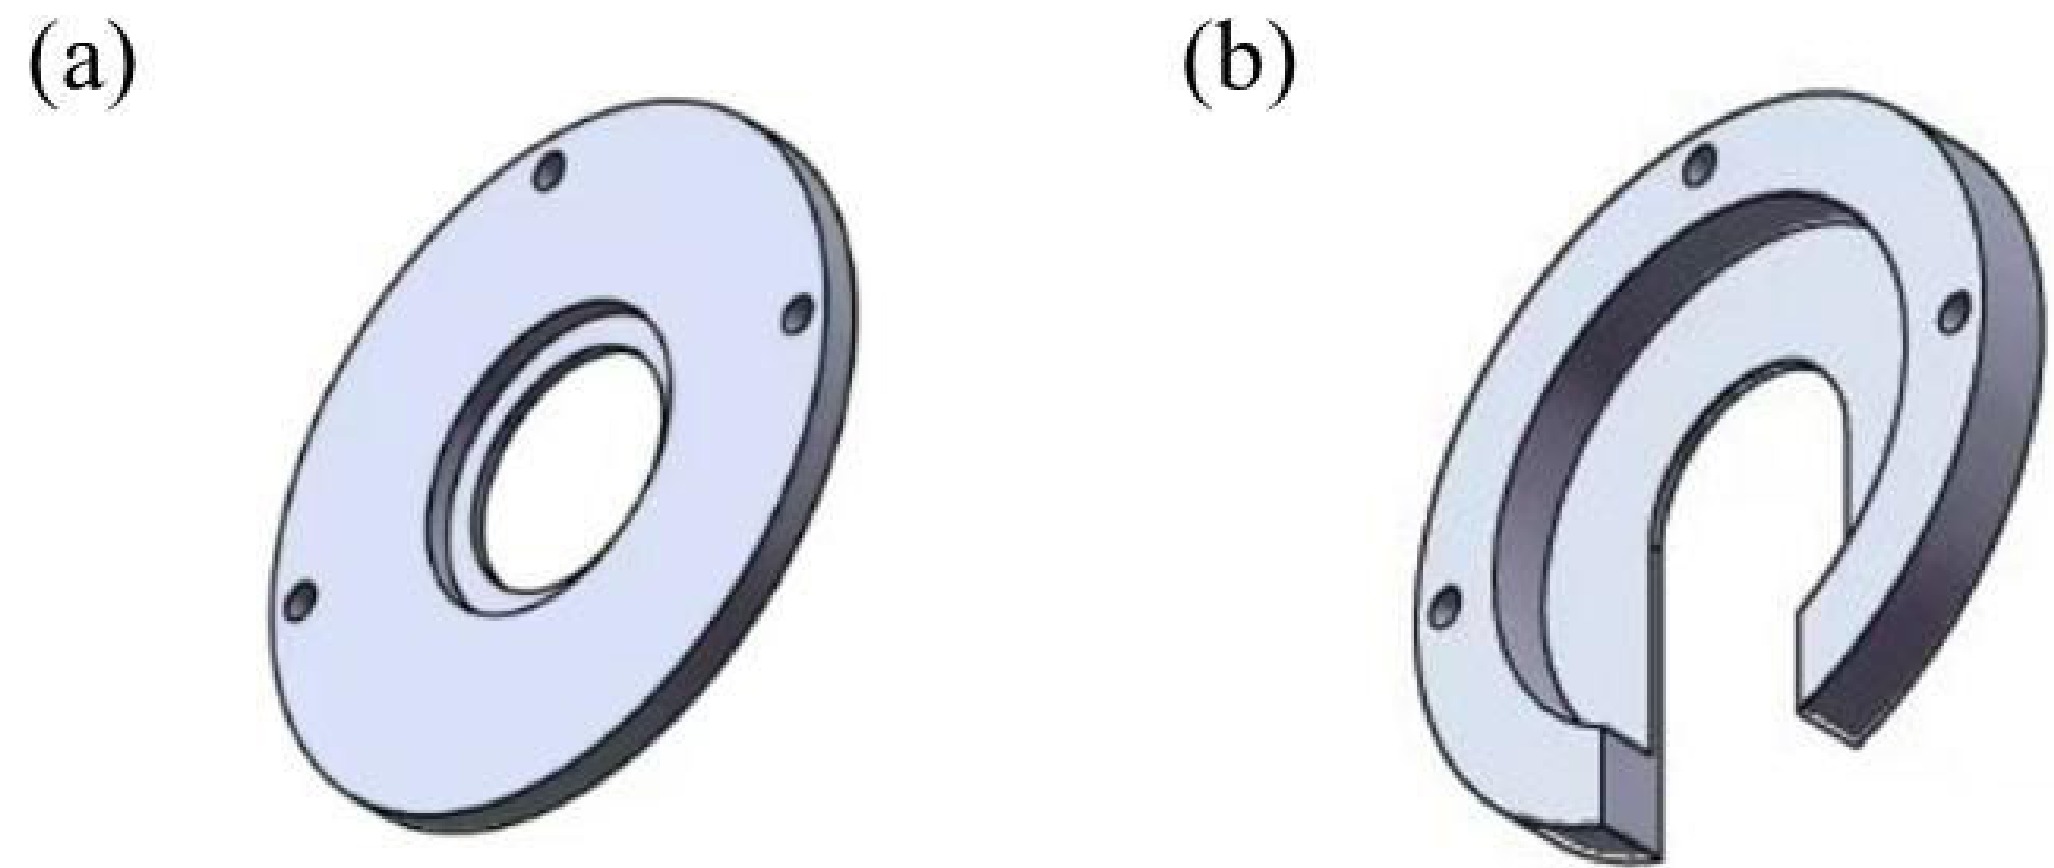
Figure 4. (color online) Schematic diagram of the fabricated aluminum housing:(a) Section for placing the radioactive source; (b) Section for holding the detector.
In this measurement system, a multi-detector architecture was adopted to ensure high-precision acquisition of neutron leakage spectra. The detection system integrates three types of detectors with distinct functions. The SiC detector is responsible for providing the start-time signal for time-of-flight (TOF) measurements and is characterized by its fast response. The EJ-309 organic liquid scintillator serves as the primary detector for high-energy neutrons and offers excellent neutron–gamma discrimination through pulse shape analysis. The CLYC (Cs2LiYCl6:Ce) inorganic scintillator is used for the detection of low-energy and thermal neutrons, featuring high energy resolution and sensitivity. This detection setup enables comprehensive coverage and accurate measurement of neutron events within the energy range of 0.15–8.00 MeV. Given the SiC detector's critical role in TOF start-time acquisition and its prolonged exposure to neutron and gamma irradiation during operation, this section focuses on analyzing its radiation damage characteristics and long-term operational stability.
When measuring fission fragments from 252Cf, fission ionization chambers are commonly used as detectors. However, due to the experimental setup in which the 252Cf neutron source is placed at the center of the sample, this special configuration imposes stringent requirements on the physical dimensions of the ionization chamber. The fabrication timeline of such customized chambers could not meet the scheduling constraints of this study. Therefore, several compact detectors were evaluated as potential substitutes for the ionization chamber. Both diamond detectors and silicon carbide (SiC) detectors were found to be capable of detecting fission fragments. However, the diamond detector exhibited significant degradation under irradiation. As shown in Fig.5, its counting rate dropped from 8000 cps to 800 cps within just two days of operation, indicating unstable performance and rapid deterioration. Ultimately, the SiC detector was selected for fission fragment measurements due to its relatively stable performance under prolonged radiation exposure.
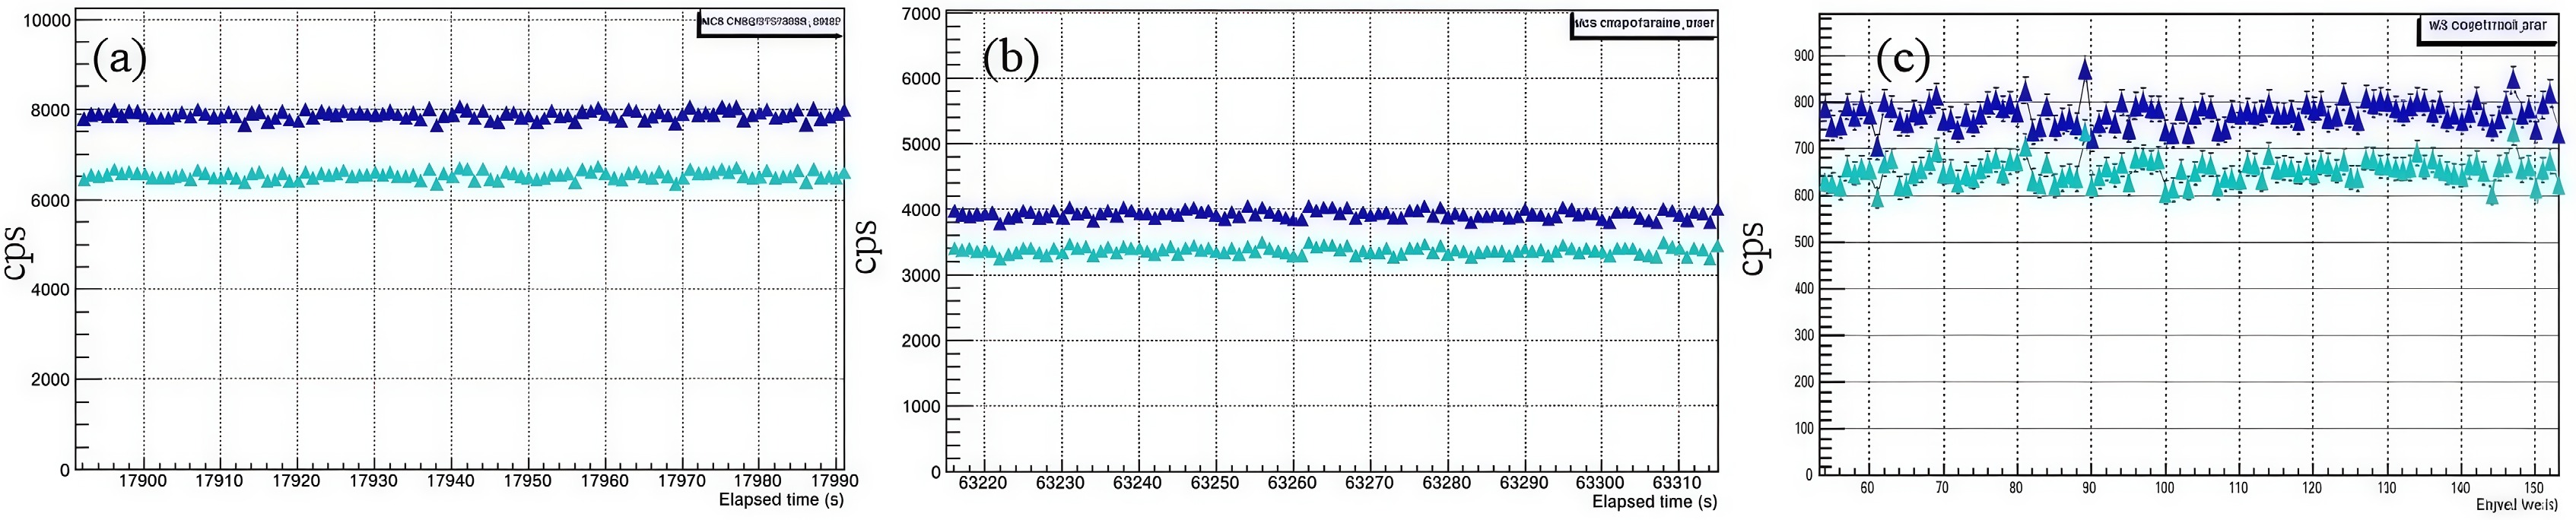
Figure 5. (color online) Counting rate degradation of the diamond detector during measurements with the 252Cf neutron source: (a) after 5 hours, (b) after 18 hours, and (c) after 40 hours.
-
During the experiment, digitized waveform data from all detector channels were recorded, including signal pulse shapes, timestamps, and amplitude information. To obtain an accurate and reliable neutron TOF spectrum, the raw experimental data must be systematically processed, as illustrated in Fig.6. The processing procedure includes baseline calculation, TOF zero-time confirmation, background correction, and pulse shape discrimination. These steps enable the construction of a high-quality neutron TOF spectrum, which serves as a solid foundation for subsequent energy spectrum analysis and uncertainty evaluation.
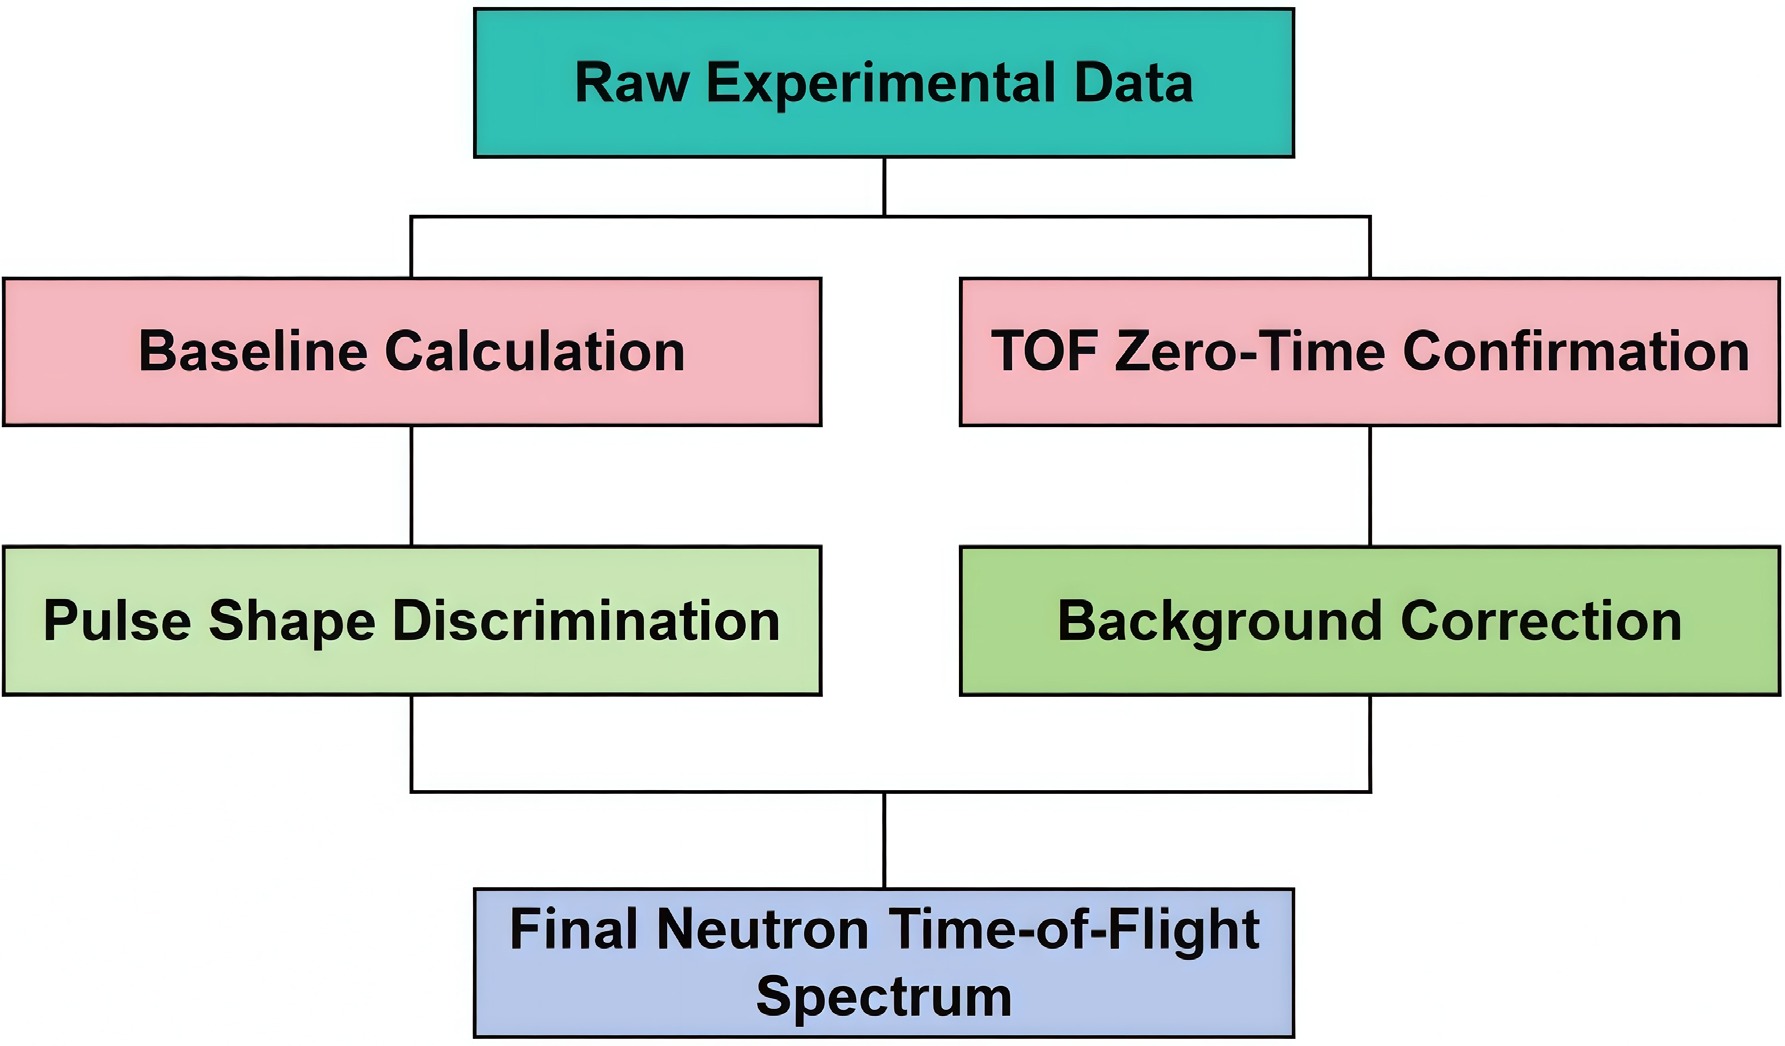
Figure 6. (color online) Flowchart of Neutron TOF Data Processing
-
During the operation of the data acquisition system, the baseline of the waveform signals tends to fluctuate. Moreover, the baseline level of each signal varies slightly due to inherent noise. Typically, the average of the initial portion of the waveform is selected as the baseline value for each signal. Figure 7. shows representative waveform signals collected from the EJ-309 and CLYC detectors.The baseline value is determined by averaging the first 50 points of the waveform, which is subtracted from each signal prior to waveform analysis through an algorithmic implementation.
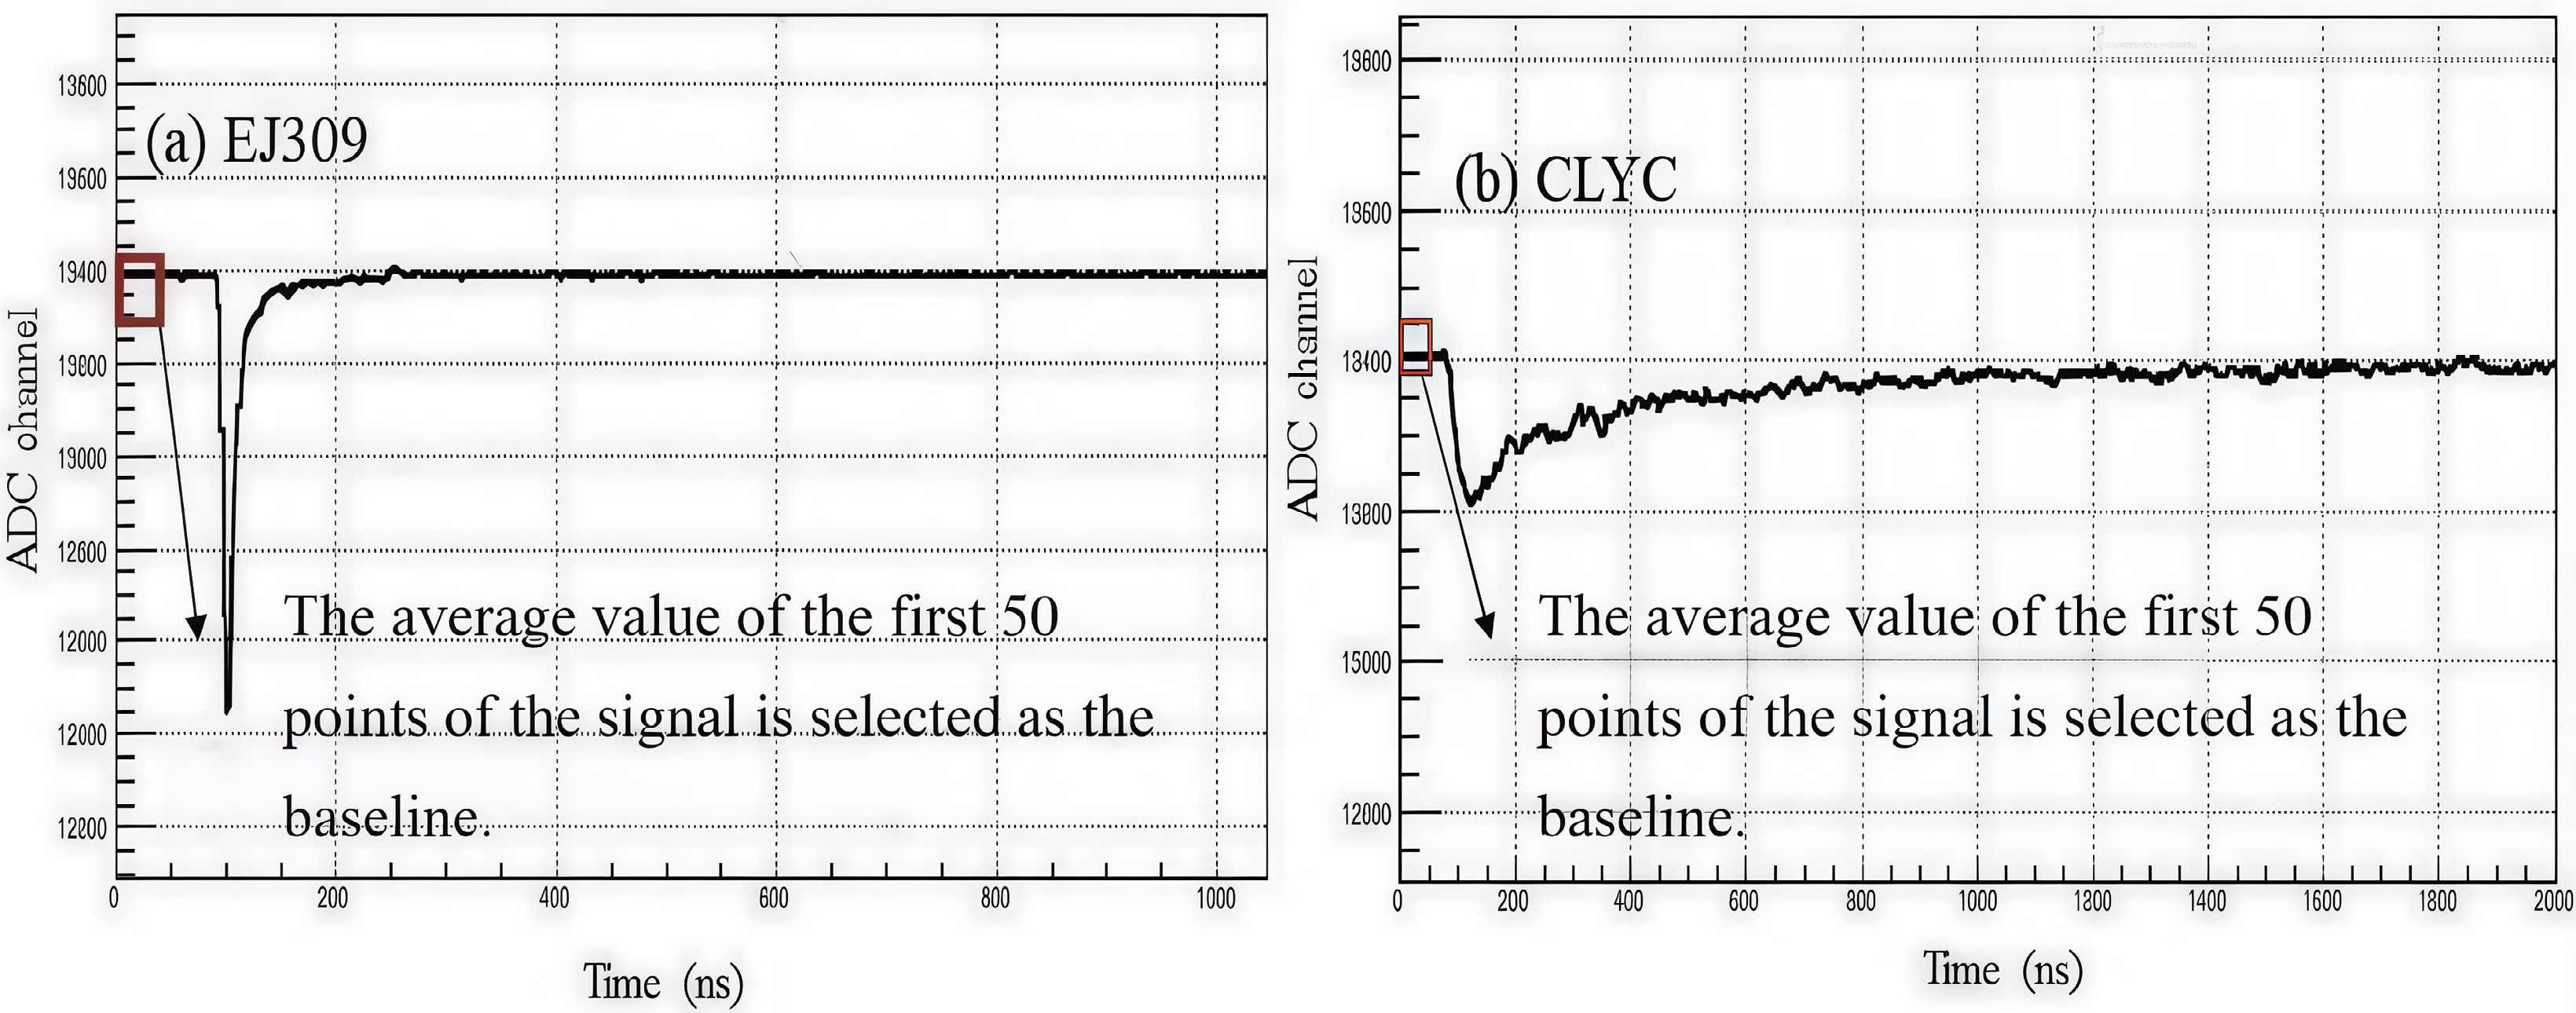
Figure 7. (color online) Baseline calculation of the signal:(a) Signal from the EJ-309 detector;(b) Signal from the CLYC detector.
-
The timestamps of each event’s start and stop signals are sequentially extracted during the construction of the TOF spectrum. The algorithm is designed to first extract the timestamp of the neutron detector signal and then search for the previously recorded start signal that has the shortest time interval before the neutron signal. The time difference between these two signals is recorded as the neutron's flight time.
Using this method, an initial TOF spectrum is obtained, as shown by the black data points in Fig.8. It can be observed that there is a distinct gamma peak at the far left of the spectrum, originating from gamma rays emitted either during the fission process of the 252Cf neutron source or from neutron scattering. This gamma peak marks the beginning of the recorded flight times. If the TOF zero-time is not corrected, a discrepancy arises between the measured flight times and those calculated using the TOF equation.
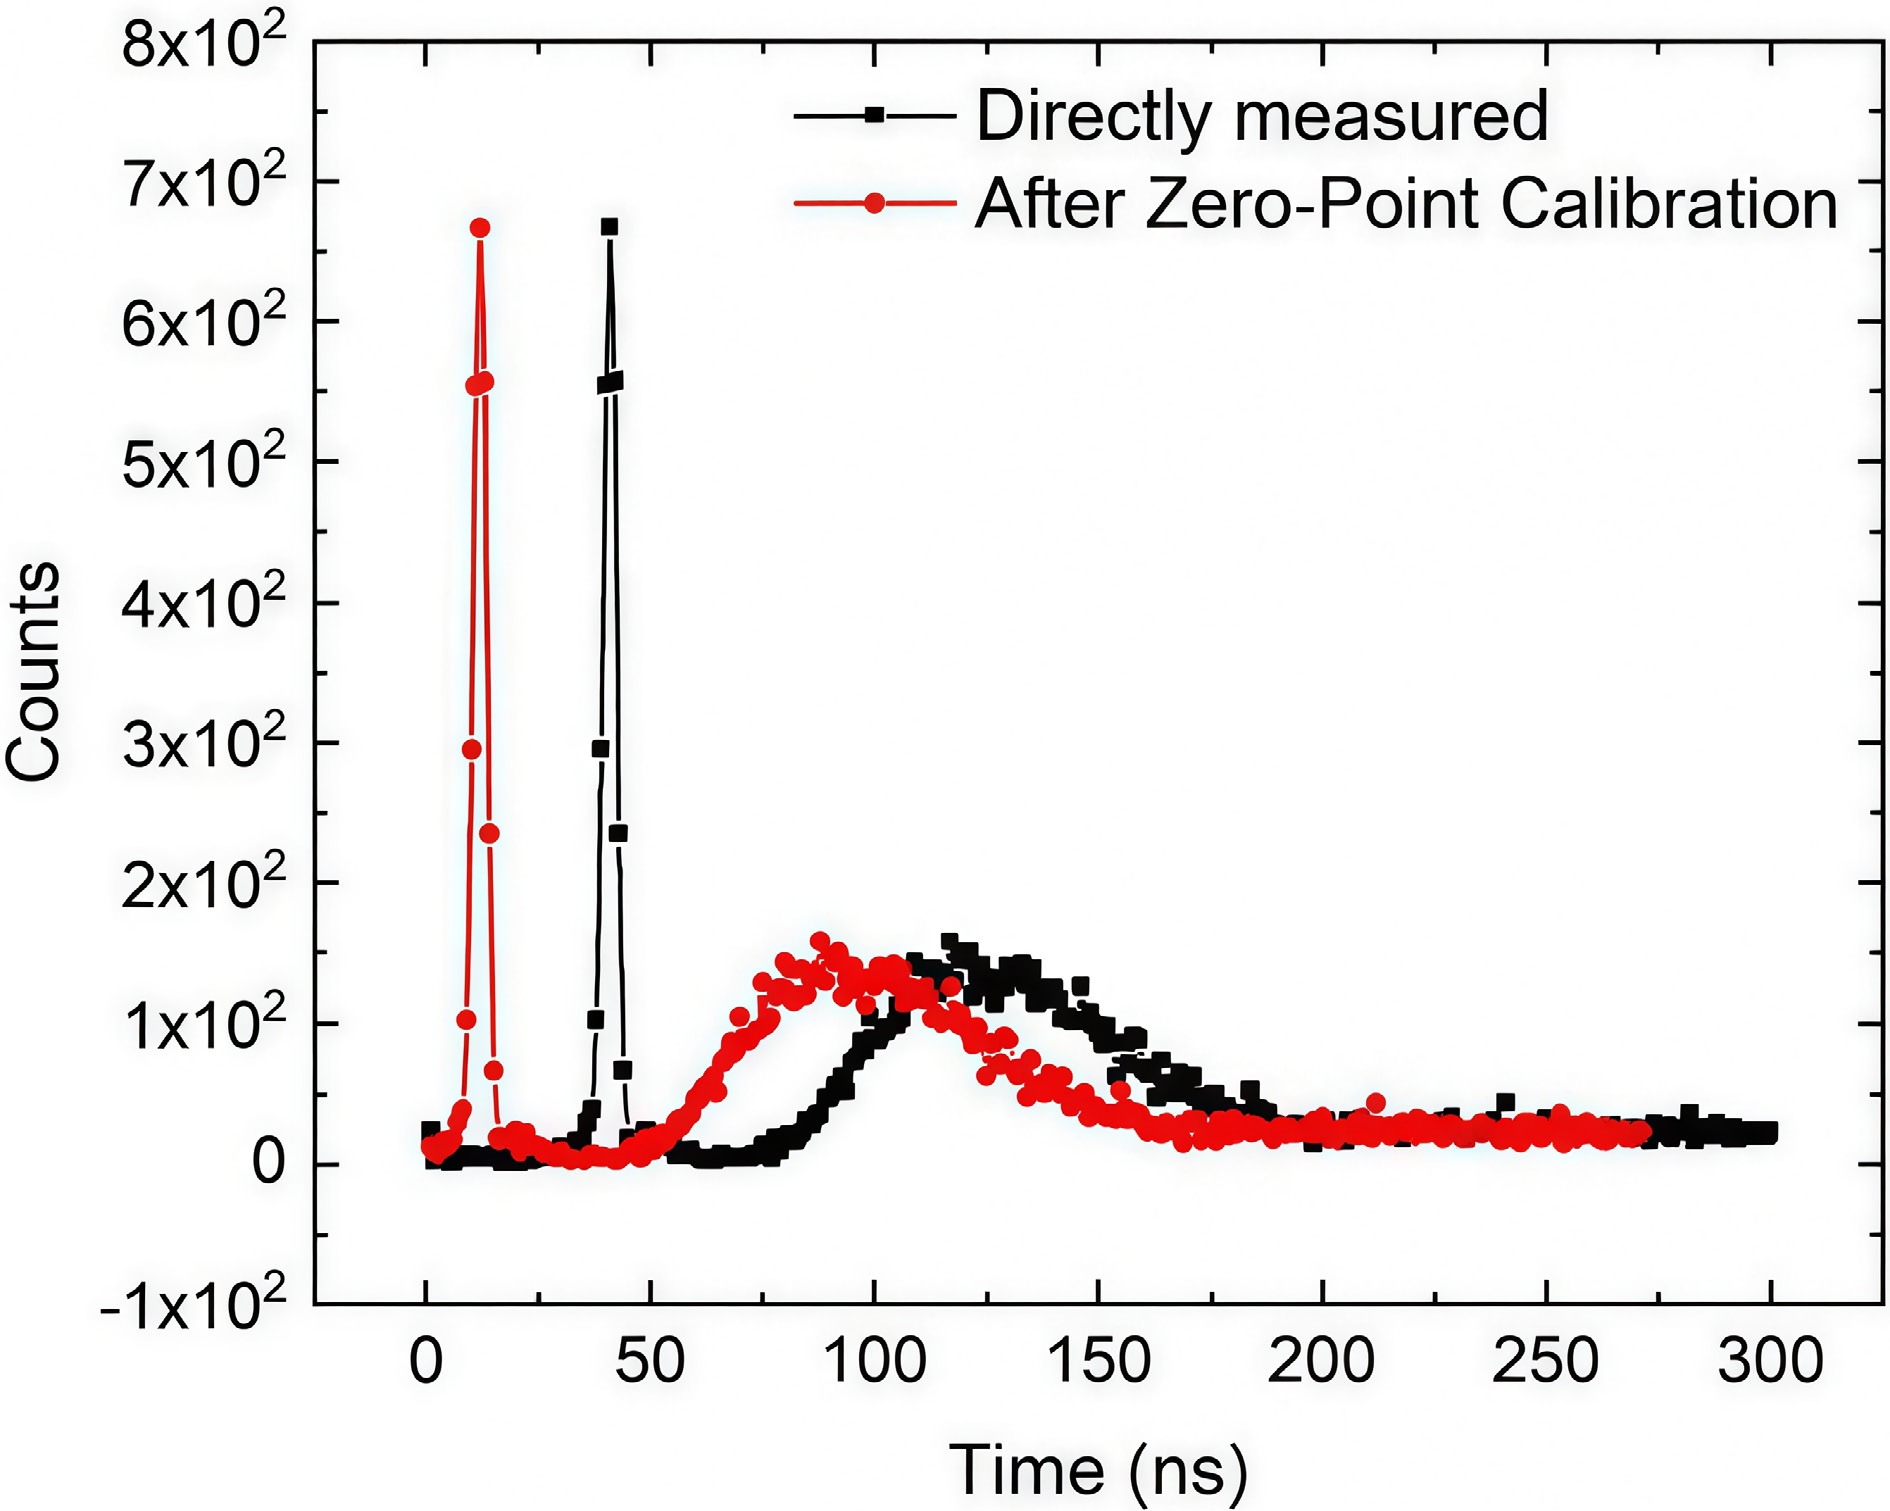
Figure 8. (color online) TOF spectra before and after zero-time correction
To address this, the position of the gamma peak is used to redefine the TOF zero-time and correct the TOF spectrum accordingly. The corrected result is shown by the red data points in Fig. 8.
-
The EJ-309 and CLYC detectors are sensitive not only to neutrons but also to gamma rays. As the 252Cf neutron source emits a large number of gamma rays through spontaneous fission, fission fragment decay, and neutron interactions with surrounding materials, accurate discrimination between neutron and gamma events is essential. In both the EJ-309 and CLYC detectors, neutron-induced signals typically exhibit a smaller contribution from the fast component and a larger contribution from the slow component, whereas gamma-ray signals show the opposite trend, as illustrated in Fig.9. Based on these waveform differences, the charge comparison method was employed in this experiment to perform n-γ discrimination. This approach effectively suppresses the gamma background and selects neutron events, resulting in a purified neutron TOF spectrum.
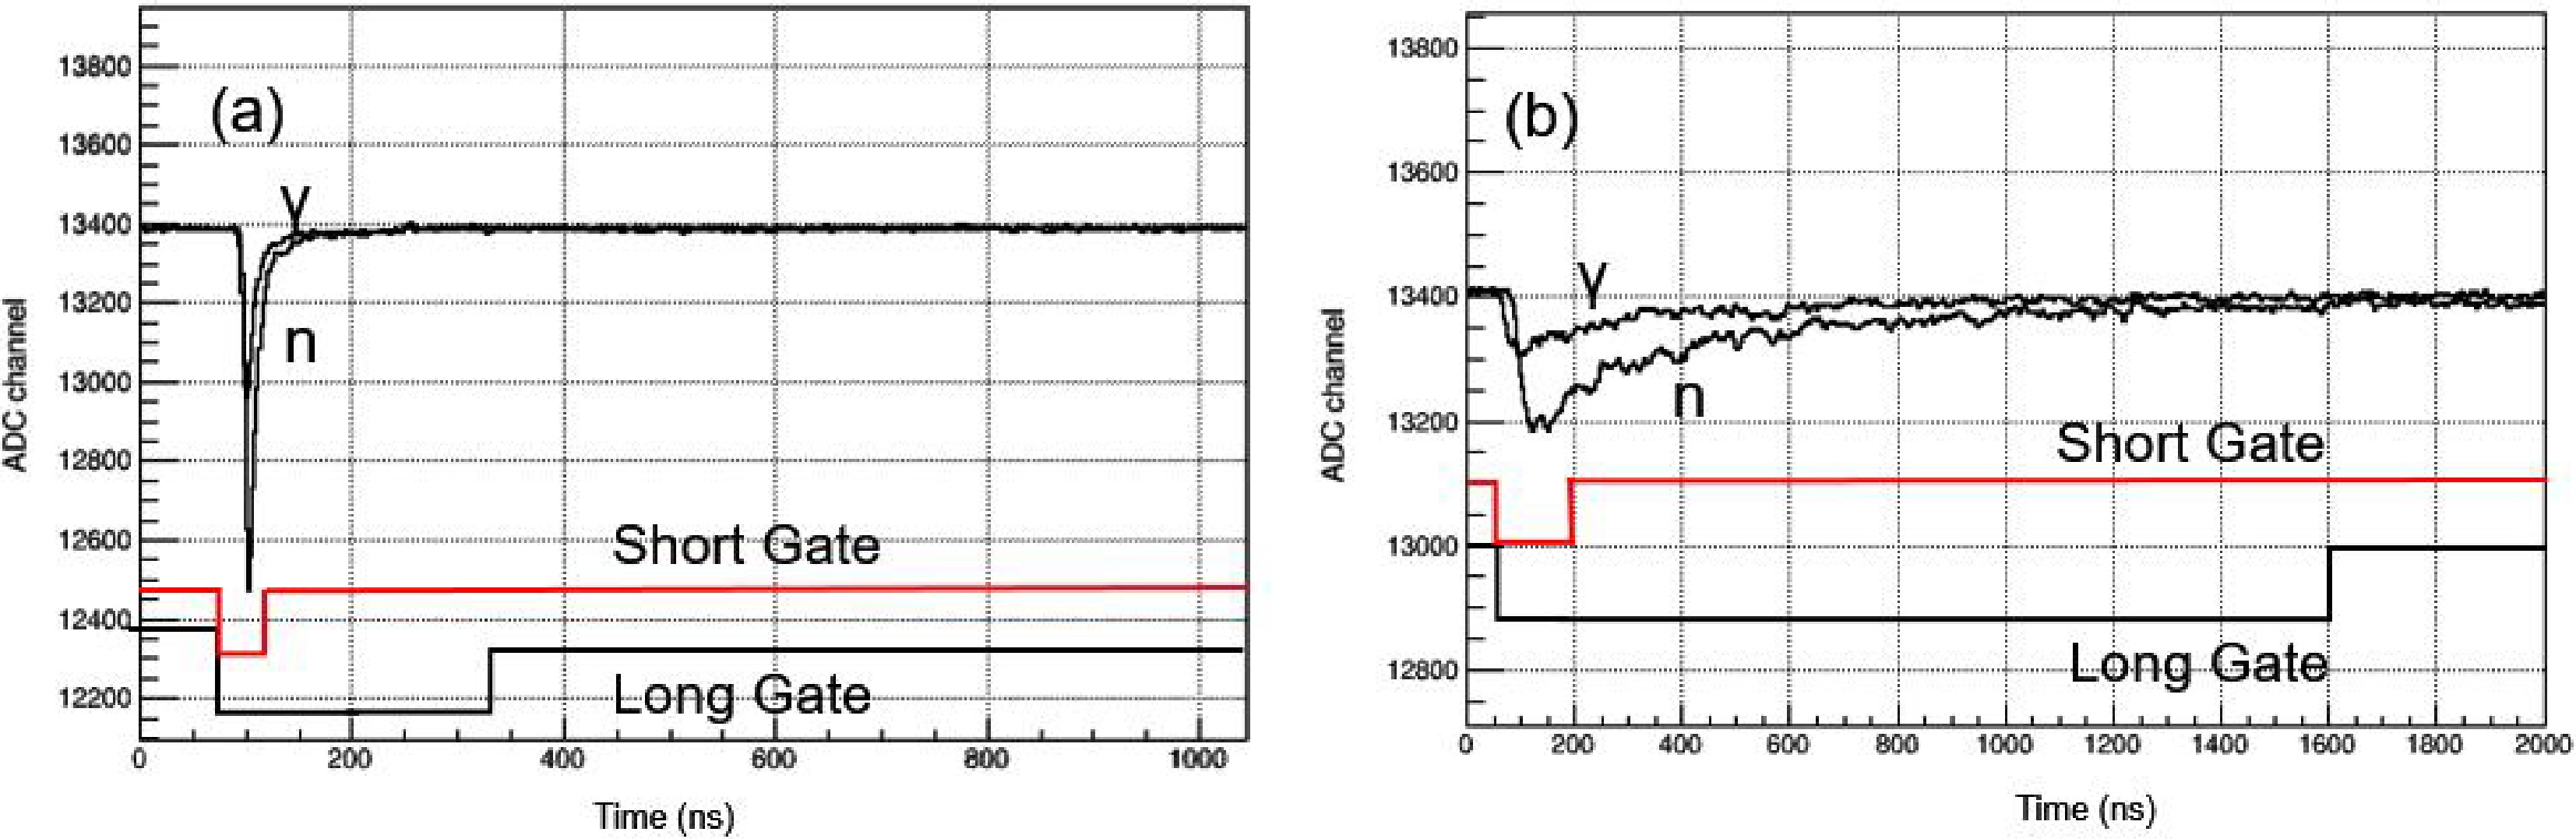
Figure 9. (color online) Measured pulse waveforms and the settings of long and short integration gates (a) EJ-309 detector; (b) CLYC detector.
For both the EJ-309 and CLYC detectors, the pulse signals were integrated within long gate (Q_long) and short gate (Q_short) windows. Q_long and Q_short represent the integrated charge over different time windows: Q_long corresponds to the total charge accumulated over a relatively wide time gate, typically covering the full pulse duration; Q_short represents the charge integrated over a narrower window, usually encompassing the leading edge of the signal. After obtaining Q_long and Q_short by integrating the pulse waveform areas, the PSD value is calculated using Equation (1) to discriminate between neutrons and gamma rays:
$ {PSD}=\frac{{{Q}}_{{long}}-{{Q}}_{{s}{h}{ort}}}{{{Q}}_{{long}}} $

(1) The Q_long and Q_short parameters were iteratively adjusted in the algorithm until the neutron and gamma events could be clearly separated in the 2D PSD spectrum. The final integration windows were determined to be 230 ns (Q_long) and 40 ns (Q_short) for the EJ-309 detector, and 1000 ns (Q_long) and 200 ns (Q_short) for the CLYC detector. Once suitable parameters were found, neutron events were selected based on the PSD distribution. The PSD spectra before and after discrimination are shown in Fig.10. The chosen Q_long and Q_short settings demonstrate good discrimination performance.
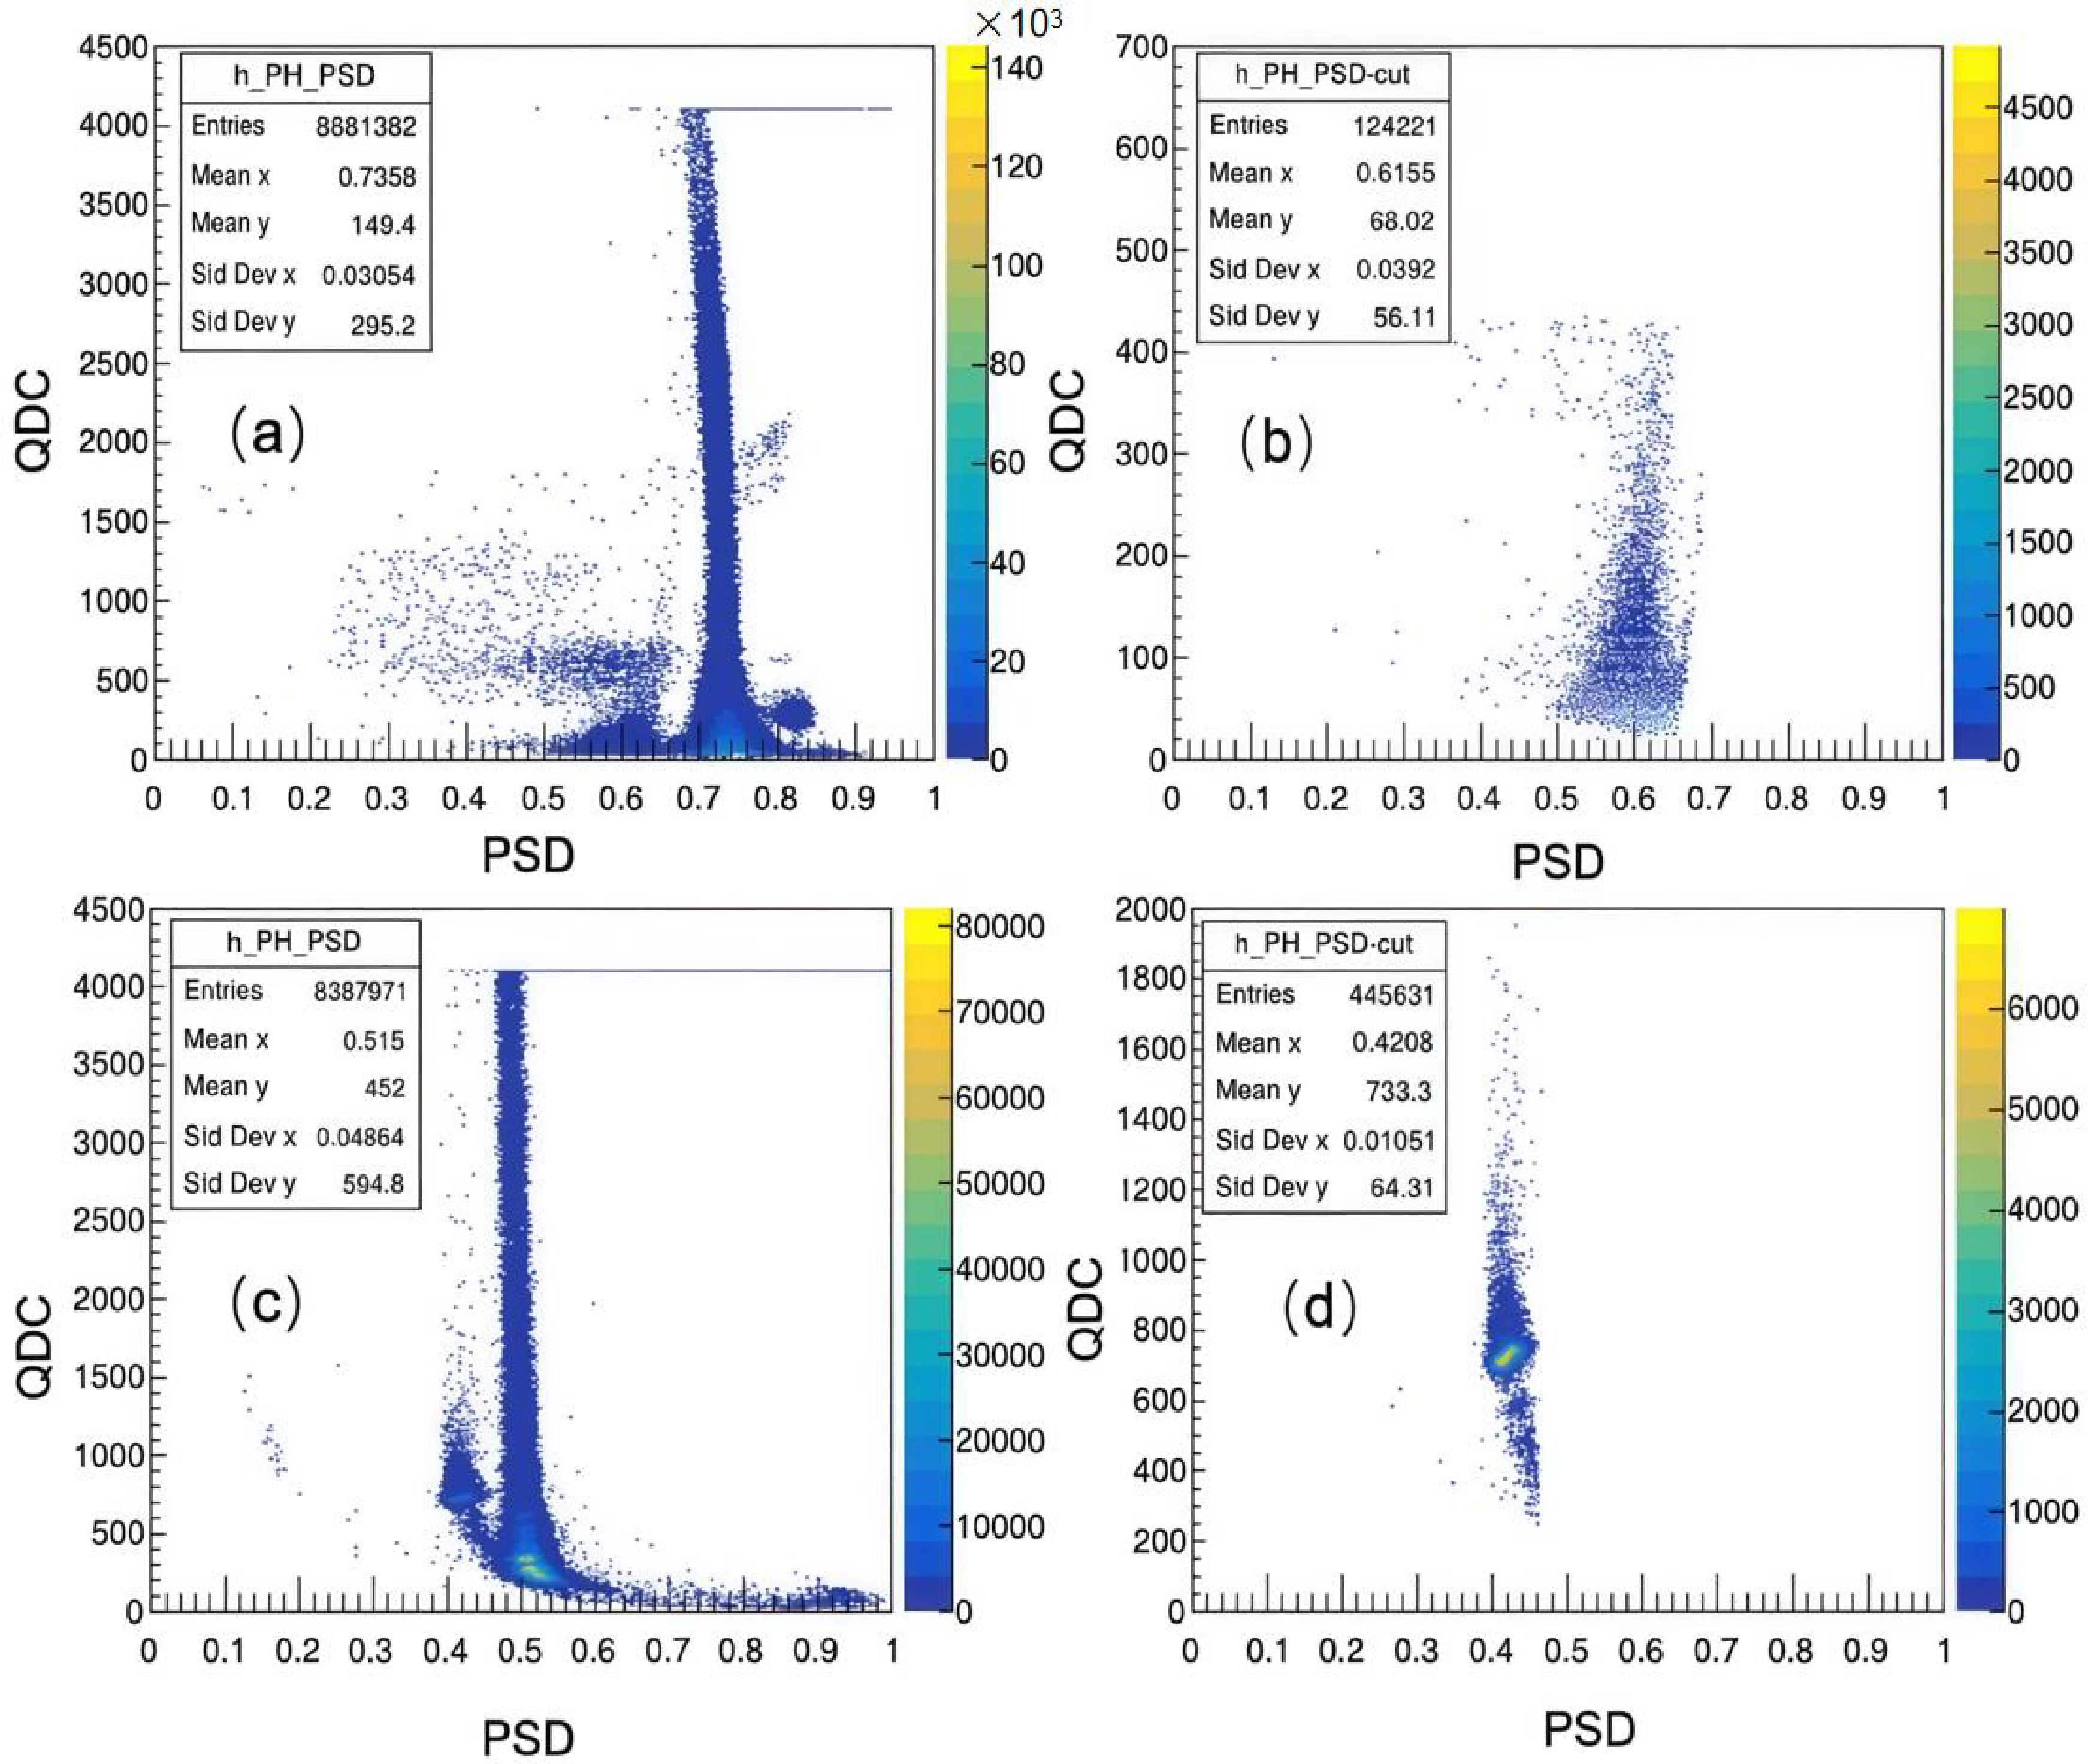
Figure 10. (color online) PSD discrimination for (a) EJ-309 detector and (c) CLYC detector measurements. The results after discrimination are shown in (b) and (d), respectively.
-
Background subtraction is critical for the accurate processing of the TOF spectrum. In this system, three types of background components are present during the experiment. The first component is a time-independent background, originating from random events unrelated to the fission process that occur within the measurement window and are recorded via accidental coincidences. This type of background typically follows a Poisson distribution and appears uniformly distributed over the entire measurement time range. It can be subtracted from the TOF spectrum by calculating the average background counts [36].
In this experiment, the time window was carefully set to minimize accidental coincidence events; however, a portion of such events was still recorded. This background component gradually flattens in the long TOF region. As shown in Fig.11, the average count within the 210–300 ns range of the measured TOF spectrum is subtracted to eliminate this portion of the background.
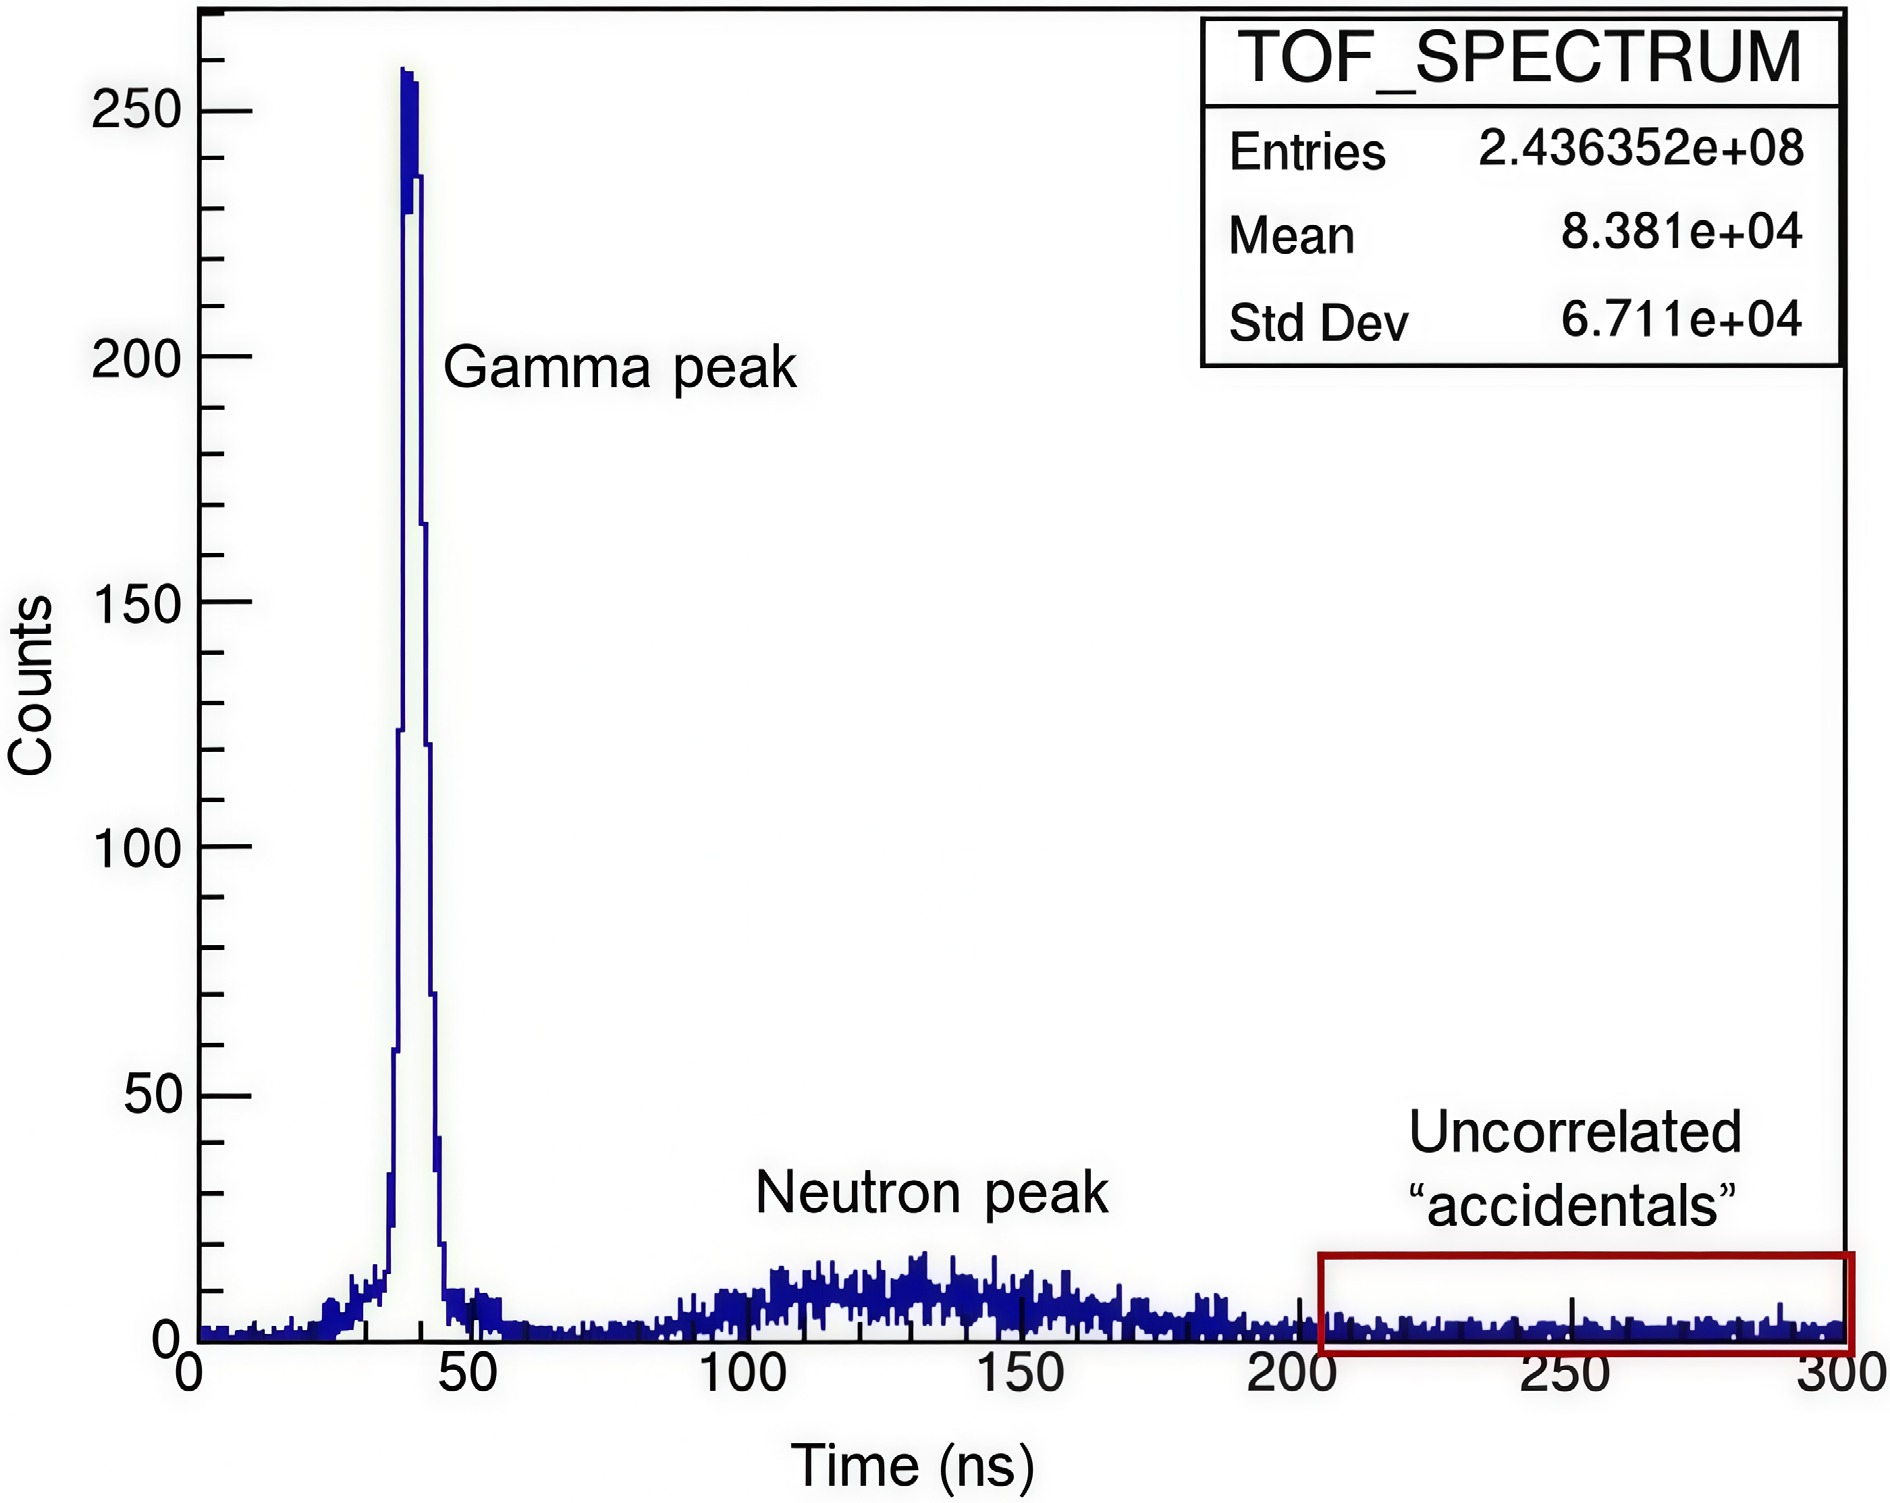
Figure 11. (color online) Initial time-of-flight spectrum measured by the EJ-309 detector; the red box indicates signals recorded due to random coincidences.
The second background component is a time-correlated gamma background, primarily caused by gamma rays produced from the spontaneous fission of the 252Cf source, the decay of fission fragments, and neutron scattering processes. These gamma rays enter the neutron detector and contribute to the background. This component can be effectively removed through pulse shape discrimination (PSD), as shown in Fig.12.
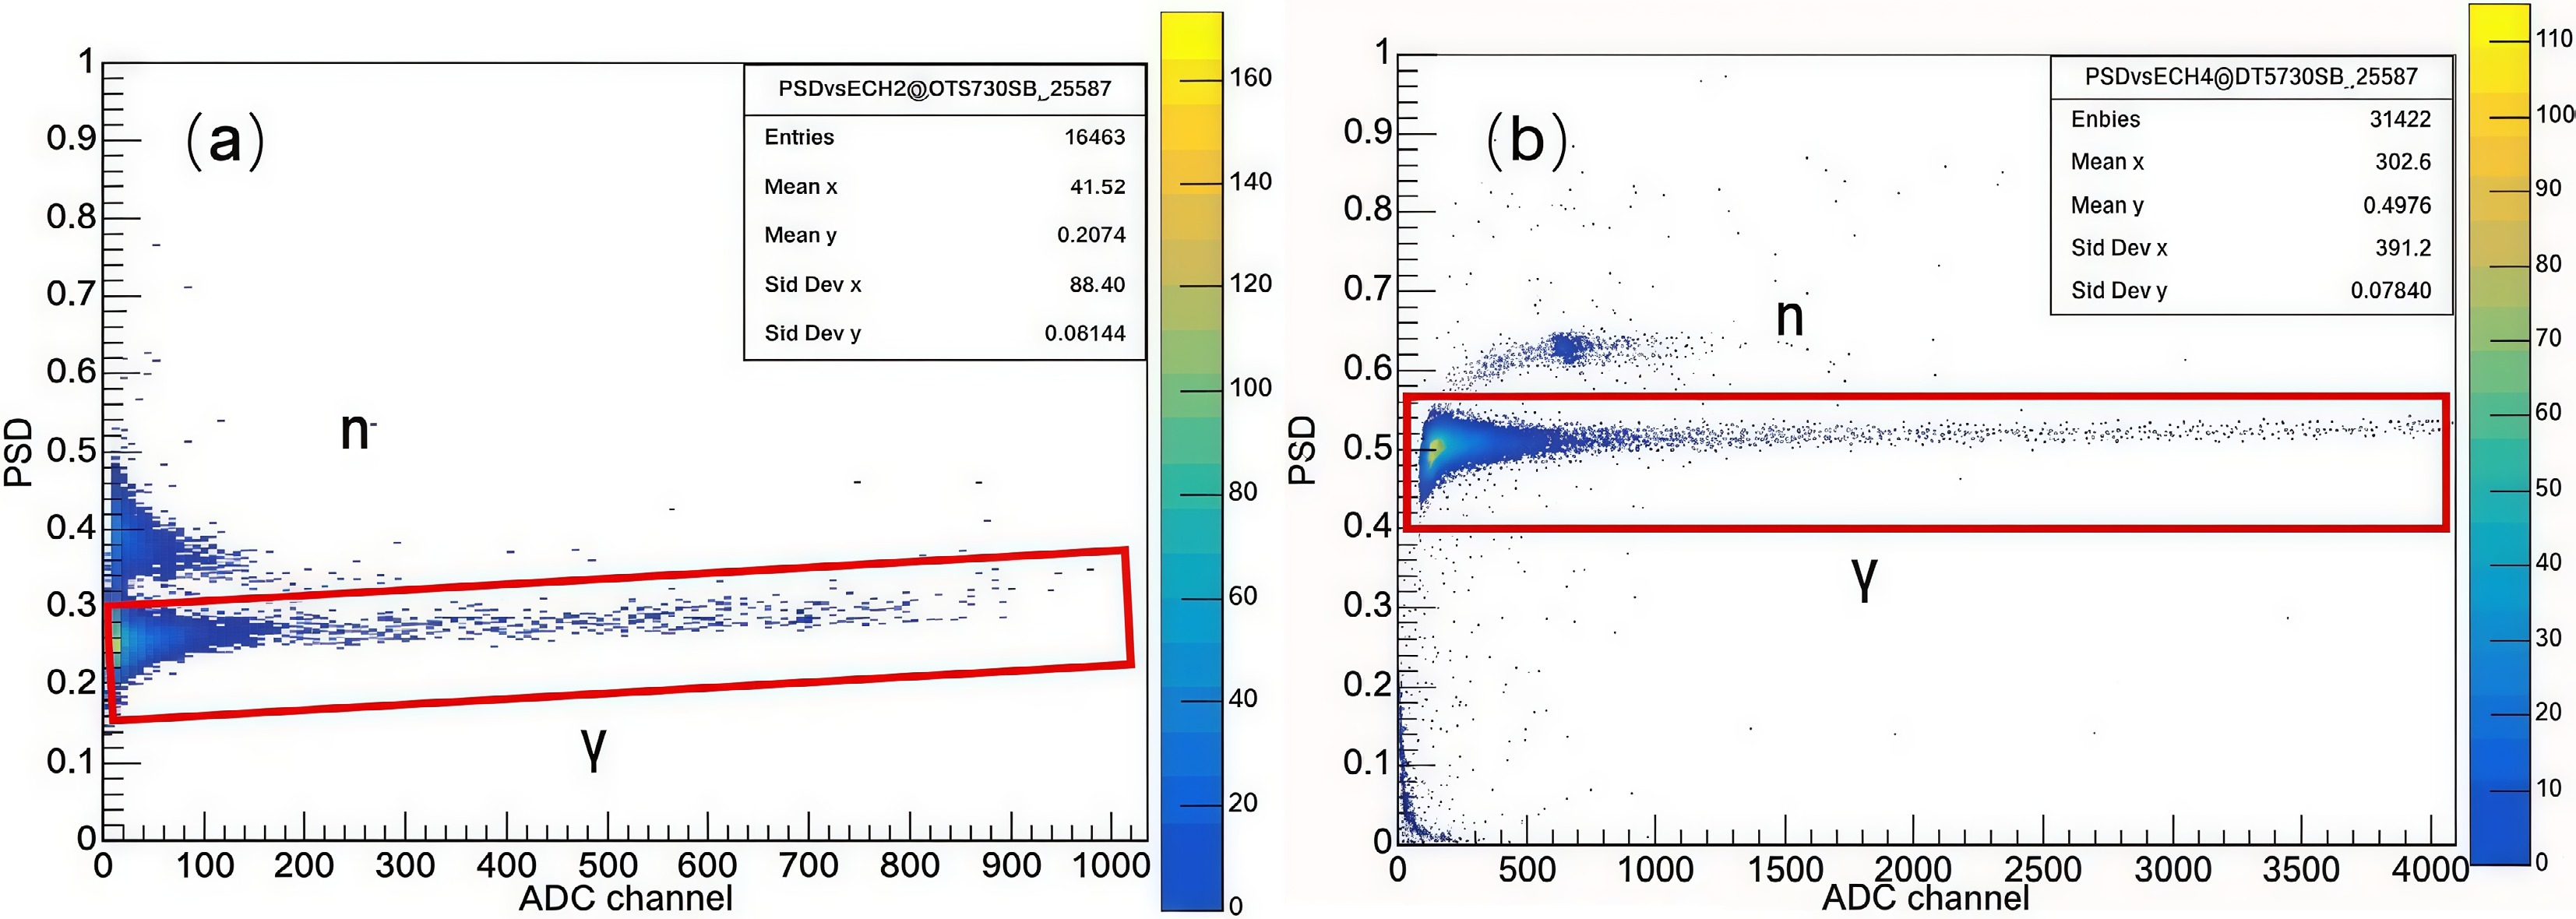
Figure 12. (color online) PSD (Pulse Shape Discrimination) plots obtained during TOF spectrum measurements, clearly showing γ events: (a) EJ-309 detector; (b) CLYC detector.
The third background component is a time-correlated neutron background, primarily arising from scattered neutrons. As illustrated in Fig.13, neutrons produced by fission can undergo scattering interactions with surrounding structural materials. These scattered neutrons may enter Detector 2 (the neutron detector), resulting in time-correlated background signals. Due to energy loss during neutron-matter interactions, the energy of secondary neutrons decreases progressively, leading to an increase in the number of low-energy neutrons. This causes a gradual rise in background counts and produces a sloped background trend in the TOF spectrum.
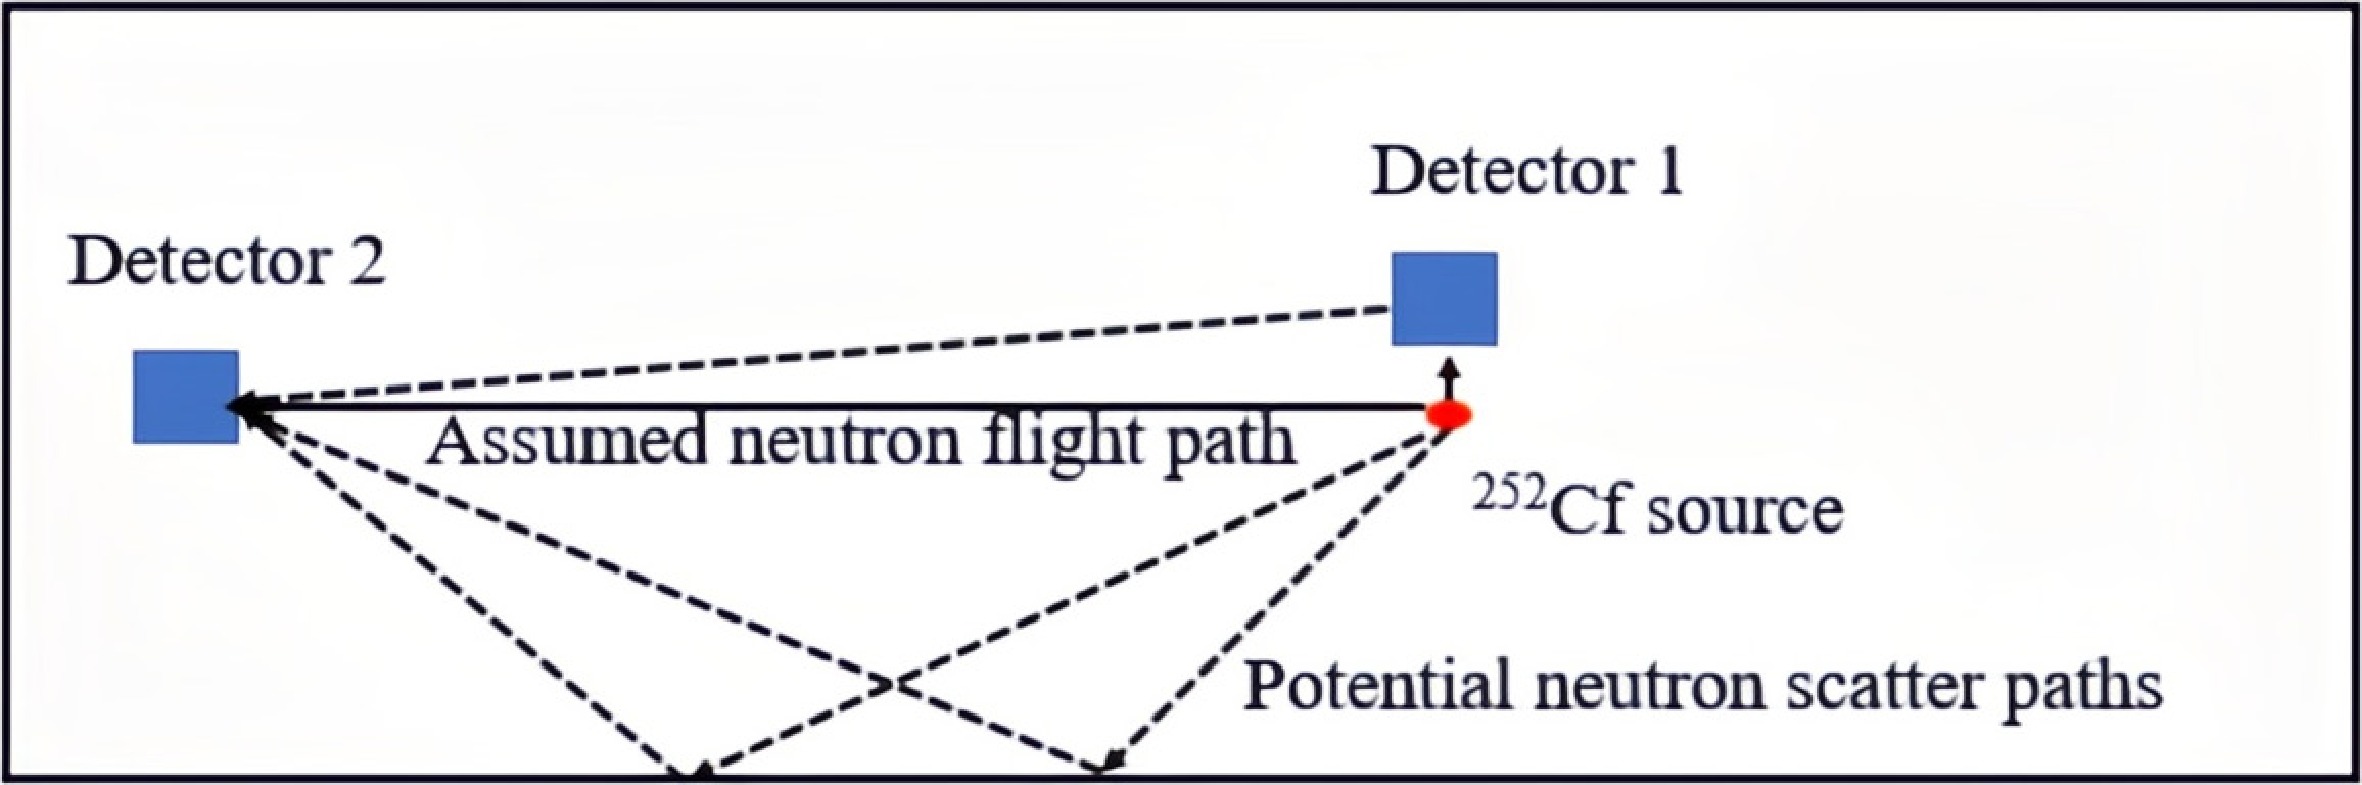
Figure 13. (color online) Influence of scattered neutrons on the time-of-flight spectrum. The dashed lines indicate different possible neutron paths to the detector. Detector 1 is the start signal detector, and Detector 2 is the neutron detector.
To eliminate the influence of this background, a shadow cone was used to measure the background TOF spectrum. Fig.14 (using one representative measurement as an example) shows both the source neutron TOF spectrum and the corresponding background spectrum. By subtracting the background spectrum, the sloped background effect is removed, resulting in a TOF spectrum free from background interference.
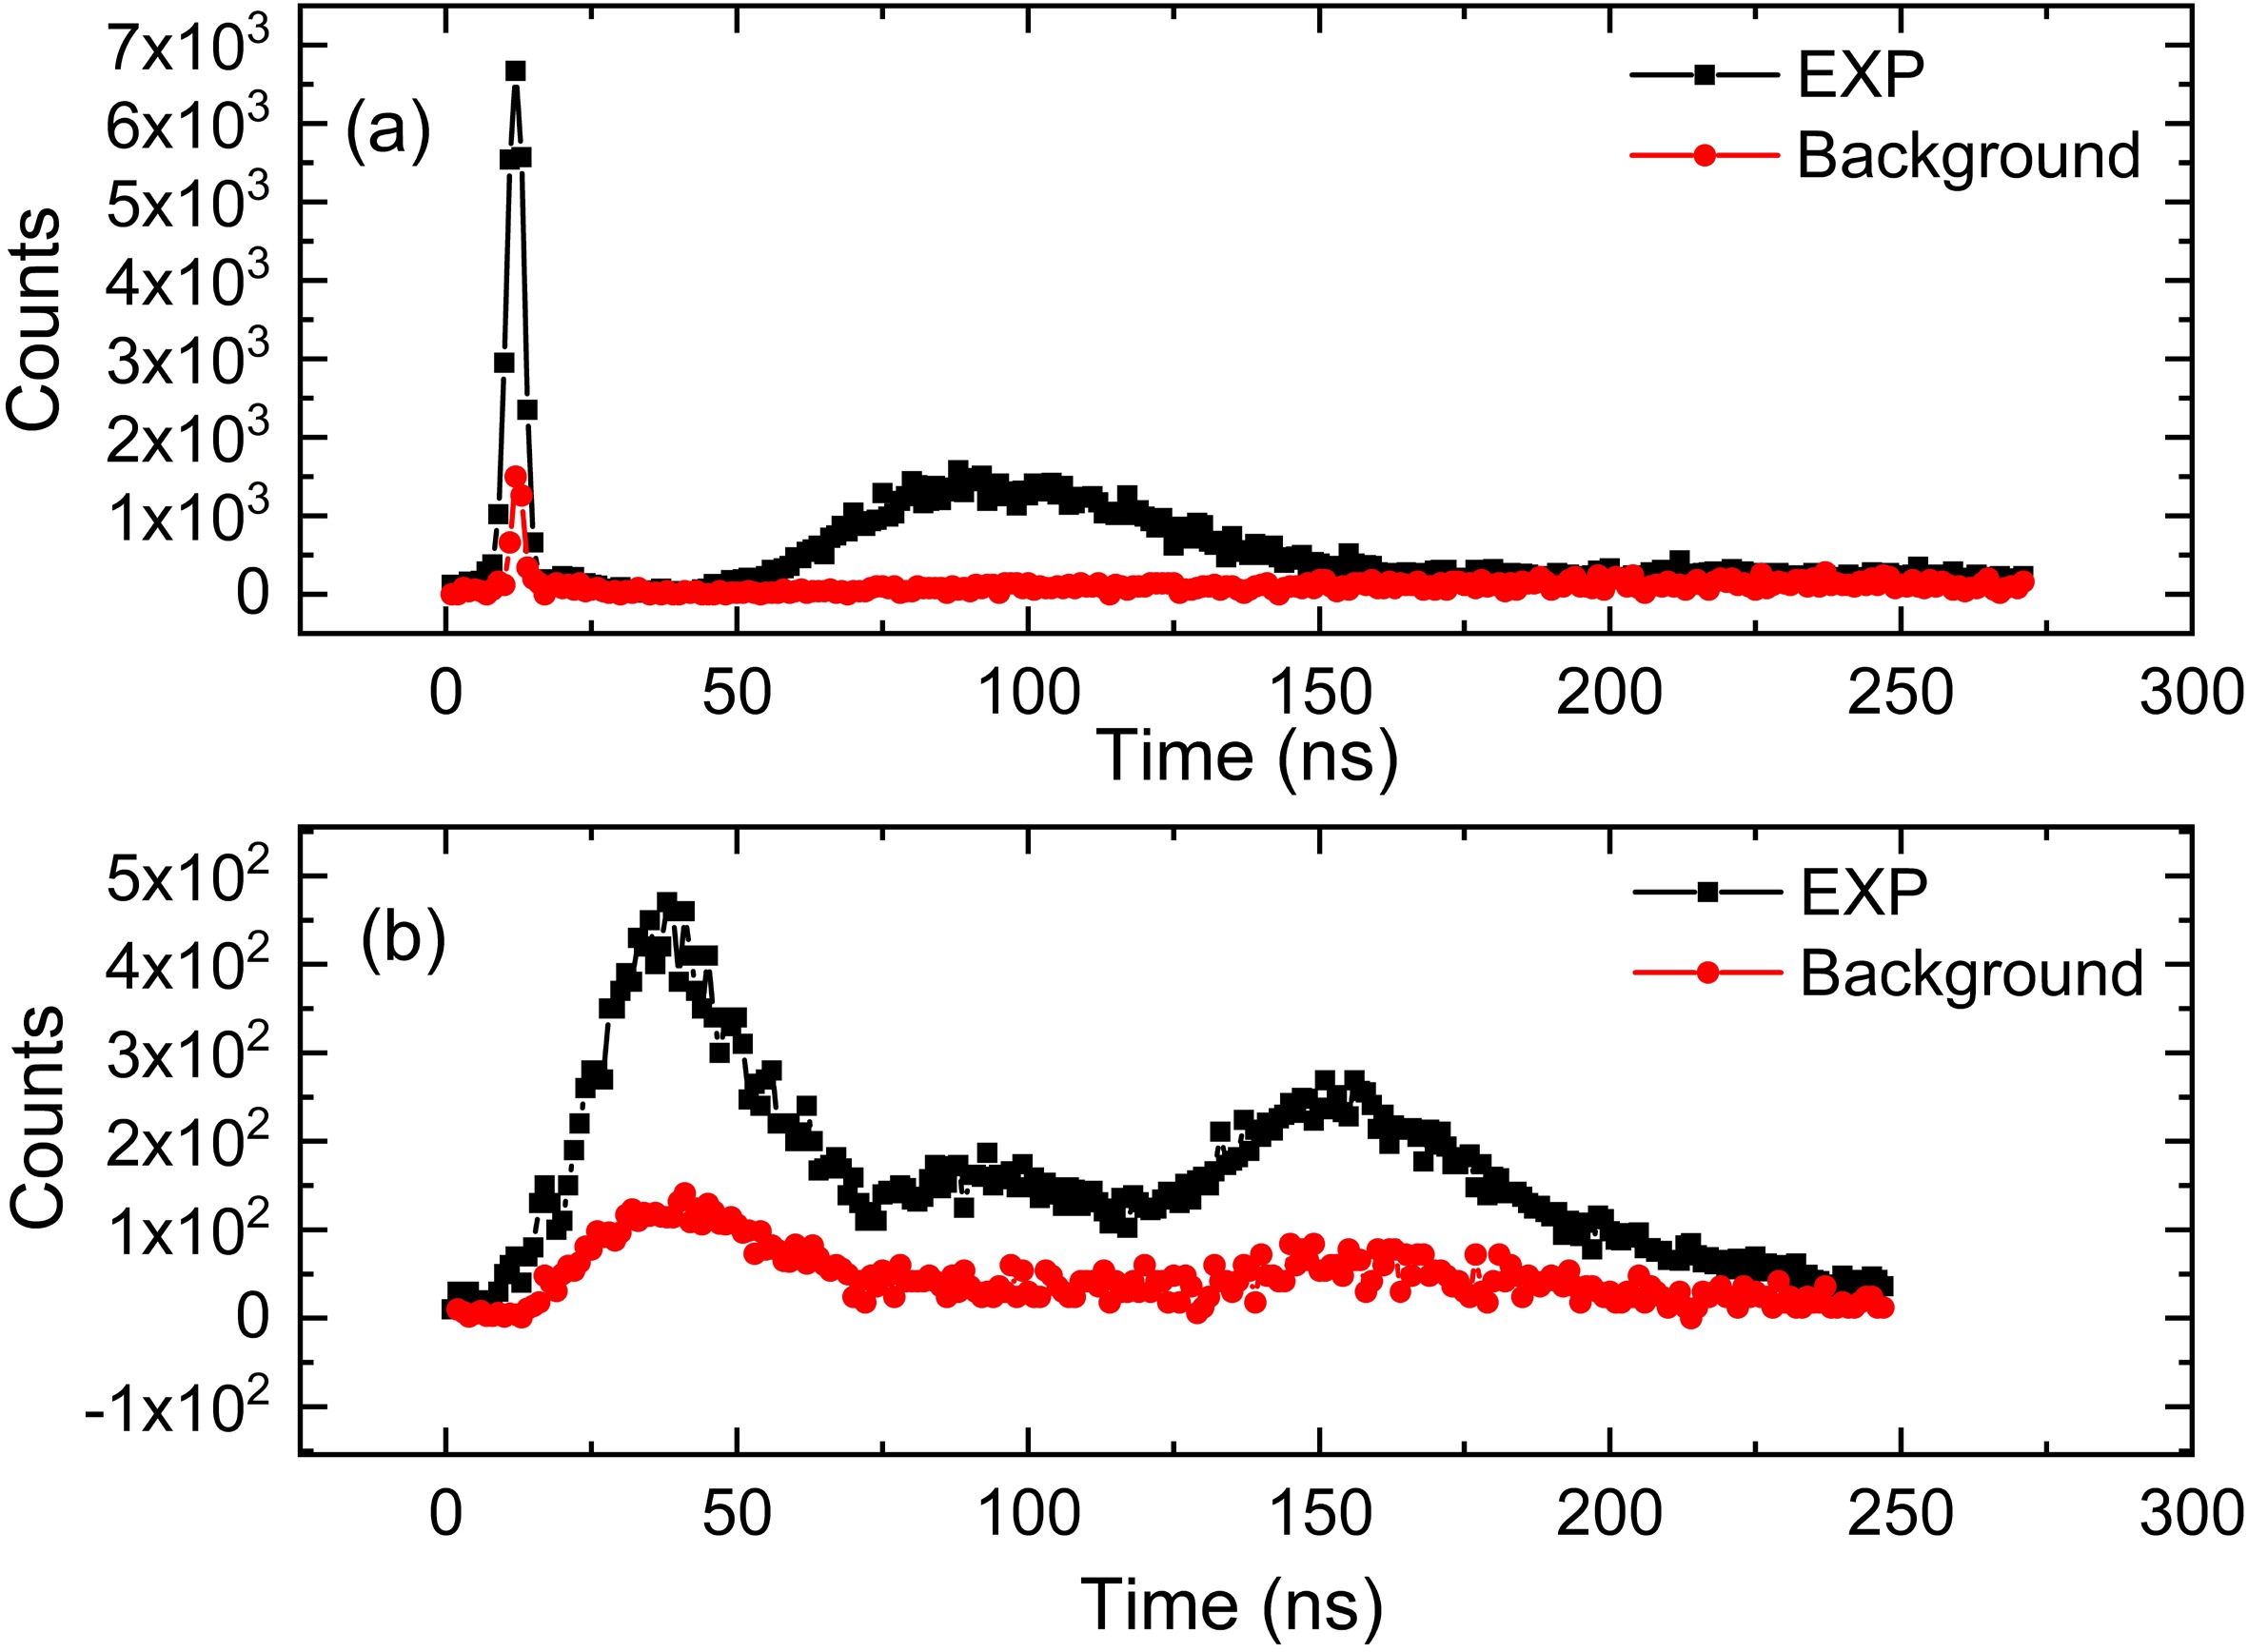
Figure 14. (color online) Comparison between source neutron TOF spectrum and background spectrum: (a) EJ-309 detector; (b) CLYC detector.
It can also be observed that, for most experimental configurations, the effective signal-to-background ratio in the neutron peak region exceeds 7 for the EJ-309 detector and exceeds 4 for the CLYC detector. However, in the low-energy neutron region, background interference becomes more significant.
-
When conducting TOF spectrum measurements using this system, the associated uncertainties primarily arise from two sources:
(1) Statistical Uncertainty:
This includes the uncertainty in the number of detected neutrons as well as that of the source neutrons. The uncertainty in detected neutron counts originates from the statistical fluctuation in the TOF spectrum. For estimation, the maximum statistical error among the data points representing 80% of the TOF spectrum is taken as the representative statistical uncertainty. Since the number of source neutrons is determined by monitoring the fission fragment signals, the uncertainty in source neutron counts stems from the error in fission fragment counting, which is generally less than 2%;
(2) Systematic Uncertainty:
This includes uncertainties due to the relative positions of the detector, sample center, and neutron source, which affect the solid angle, as well as uncertainties in detection efficiency. The solid angle uncertainty due to positioning is generally less than 1%. The detection efficiency uncertainty originates from discrepancies between experimental results and simulation, quantified as 2.88% for the EJ-309 detector and 3.15% for the CLYC detector.
Uncertainties were calculated for all experiments carried out in this study. As the EJ-309 and CLYC detectors cover different energy ranges, the results are reported separately by energy region (see Chapter 5 for energy region definitions). The detailed results are listed in Table 1. The total uncertainty is calculated using Equation (3).
Experimental Sample Measured Energy Range Statistical Uncertainty Systematic Uncertainty Total Uncertainty Counting Uncertainty Source Neutron Uncertainty Solid Angle Uncertainty Detection Efficiency Uncertainty TOF
Measurement Without Sample0.80-8.00 MeV 2.51% 1.31% <1% 2.88% 4.16% 0.15-0.80 MeV 8.16% 1.31% <1% 3.15% 8.90% Polyethylene Standard Sample 0.80-8.00 MeV 2.40% 1.22% <1% 2.88% 4.07% 0.15-0.80 MeV 7.76% 1.22% <1% 3.15% 8.52% Table 1. Uncertainty Information During the Experimental Process of the Shielding Integral Experiment System
$ {{\delta}}_{{total}}=\sqrt{{{\delta}}_{{count}}^{{2}}+{{\delta}}_{{source}}^{{2}}+{{\delta}}_{{solid}{}{angle}}^{{2}}+{{\delta}}_{{efficiency}}^{{2}}} $

(2) As shown in the table, the dominant contribution to total uncertainty comes from the statistical uncertainty of neutron counting. Due to the difference in detection efficiency between the EJ-309 and CLYC detectors, their total event counts differ significantly under the same measurement duration. In the 0.80–8.00 MeV range (measured with EJ-309), the total uncertainty in all experiments remains below 5%. In the 0.15–0.80 MeV range (measured with CLYC), the total uncertainty remains below 9%.
-
The experimental results for the polyethylene standard sample are analyzed both quantitatively and qualitatively. After normalizing the experimental spectrum, a comparative analysis was conducted between the measured time-of-flight (TOF) spectra and those simulated using cross-section data from the ENDF/B-VIII.1, CENDL-3.2, JEFF-3.3, and JENDL-5 nuclear data libraries. The comparison focuses on both the spectral shape and the calculated-to-experimental (C/E) ratios, as shown in Fig. 15 and Fig.16:
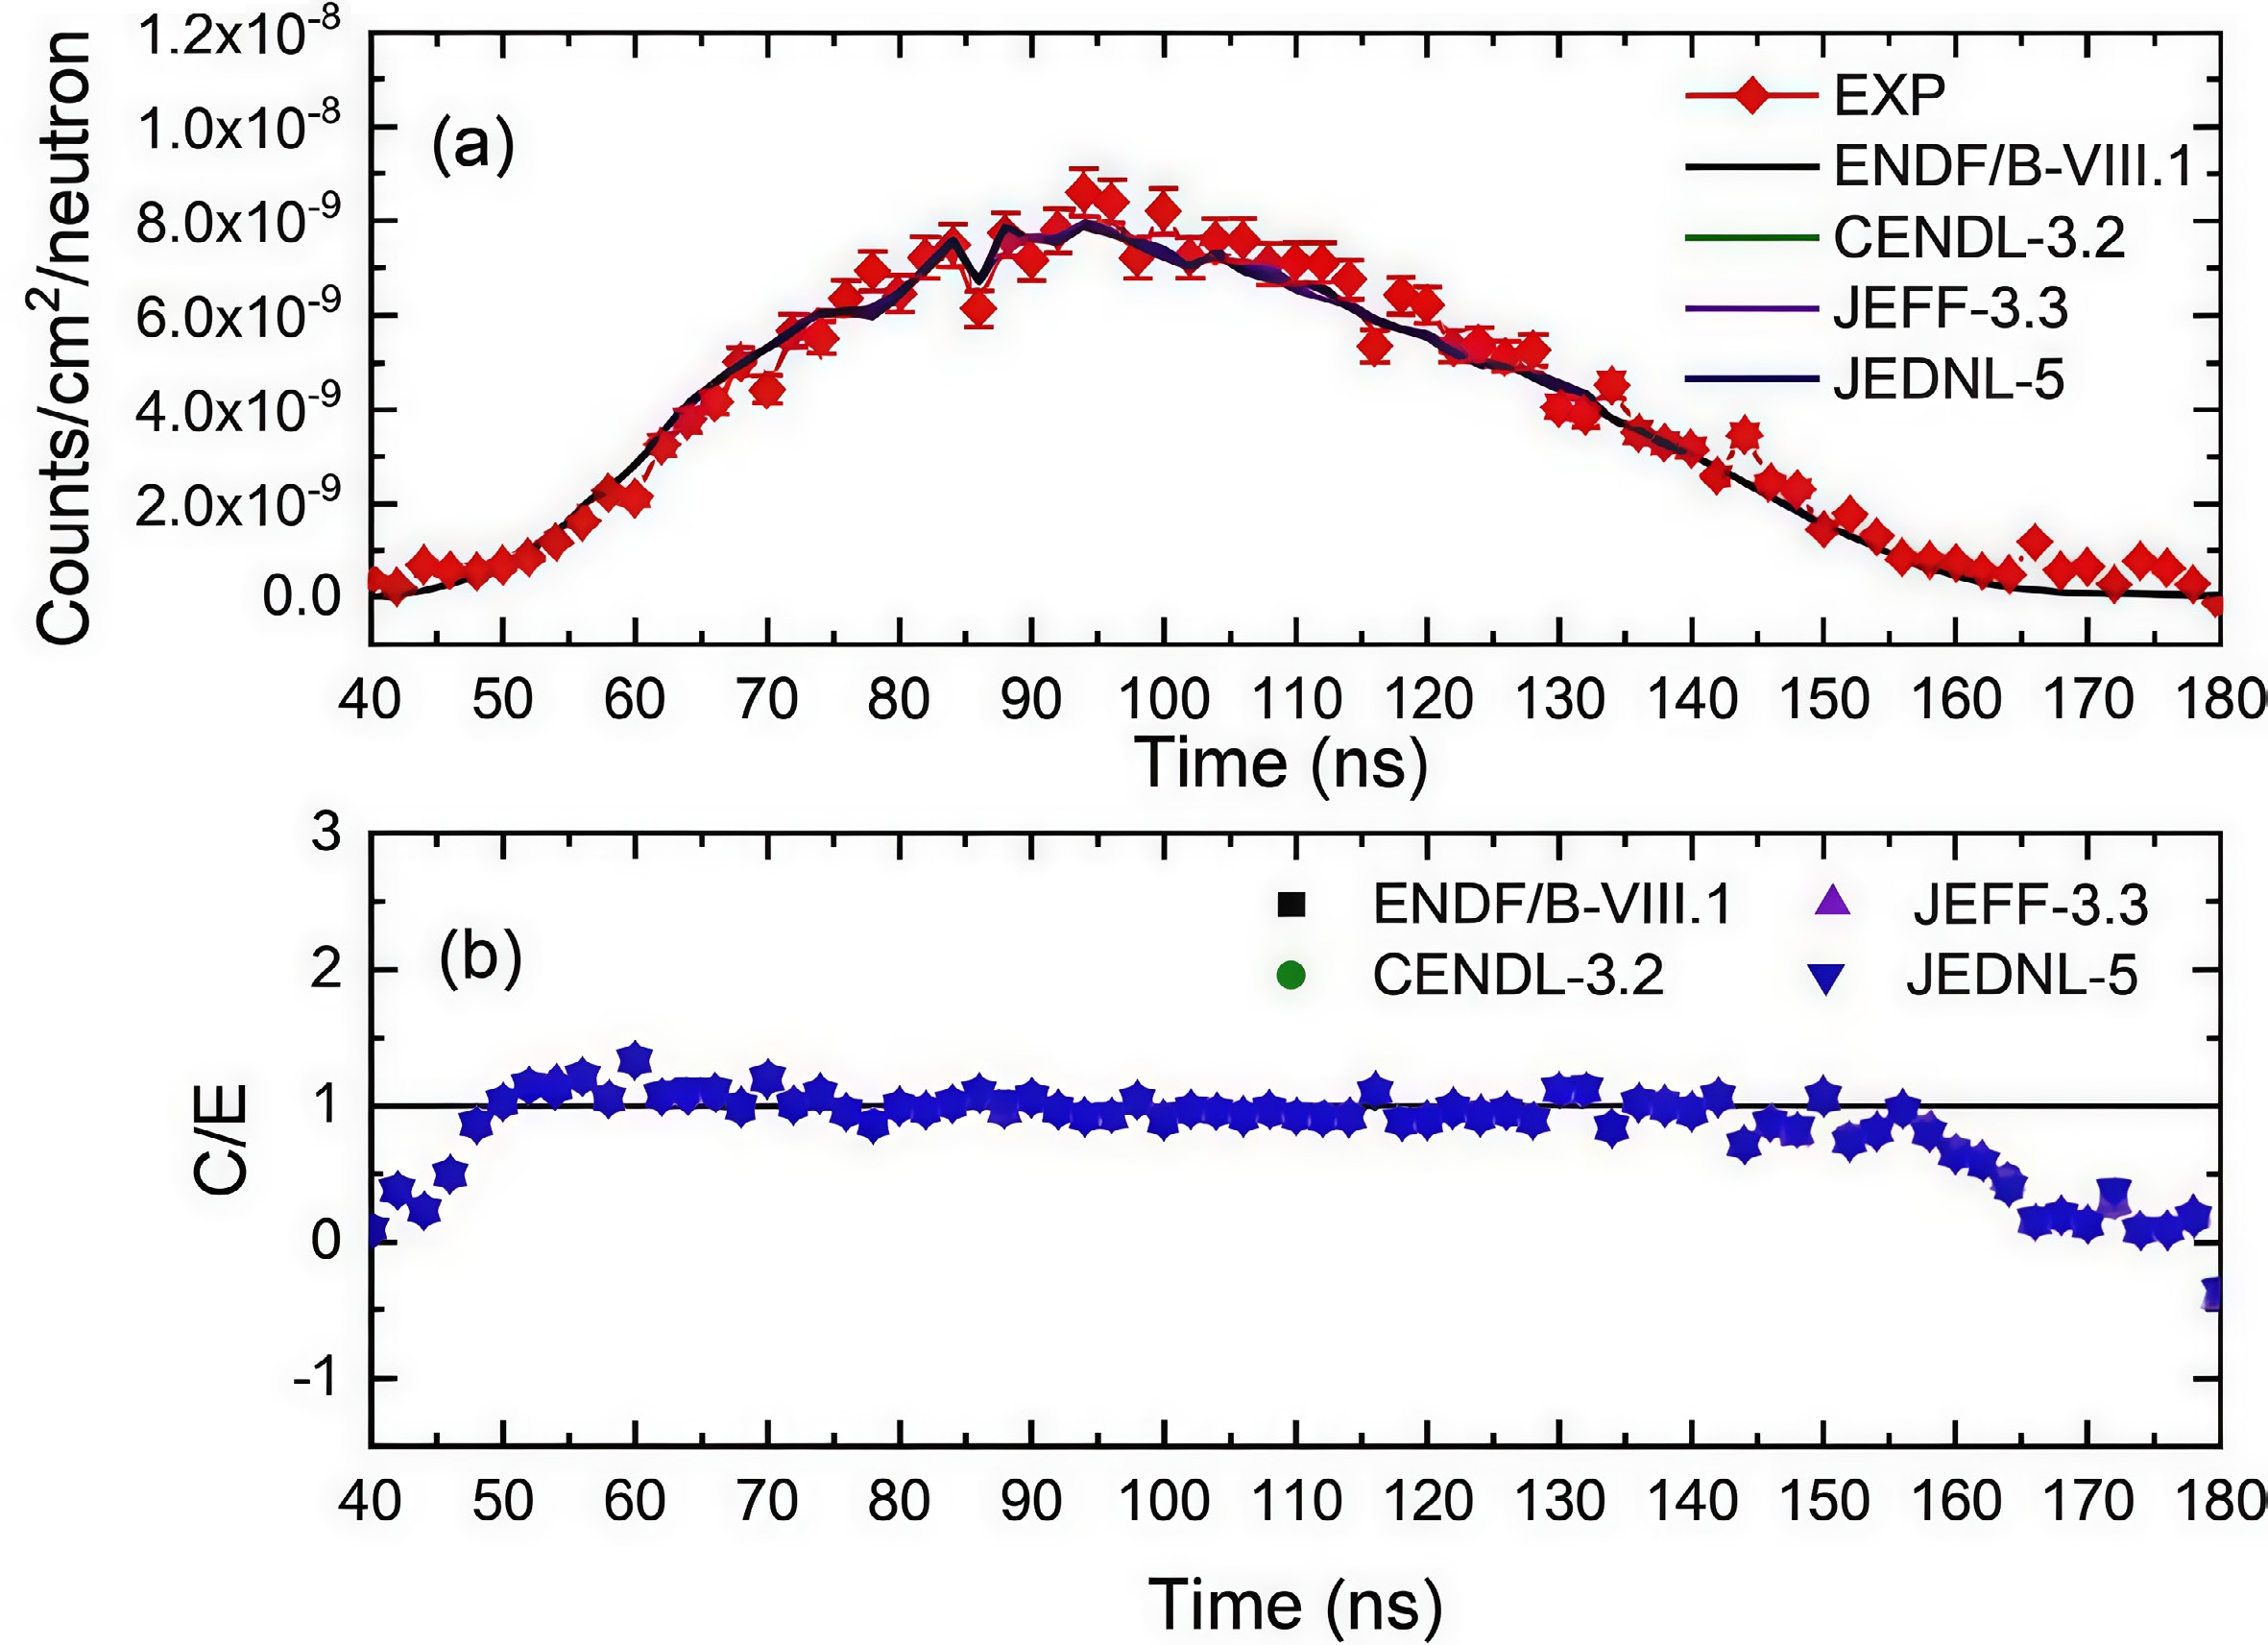
Figure 15. (color online) Comparison between experimental and simulated leakage neutron TOF spectra for the polyethylene standard sample measured by the EJ-309 detector; (b) shows the fluctuation of the calculated-to-experimental (C/E) ratio between the simulated and experimental spectra.
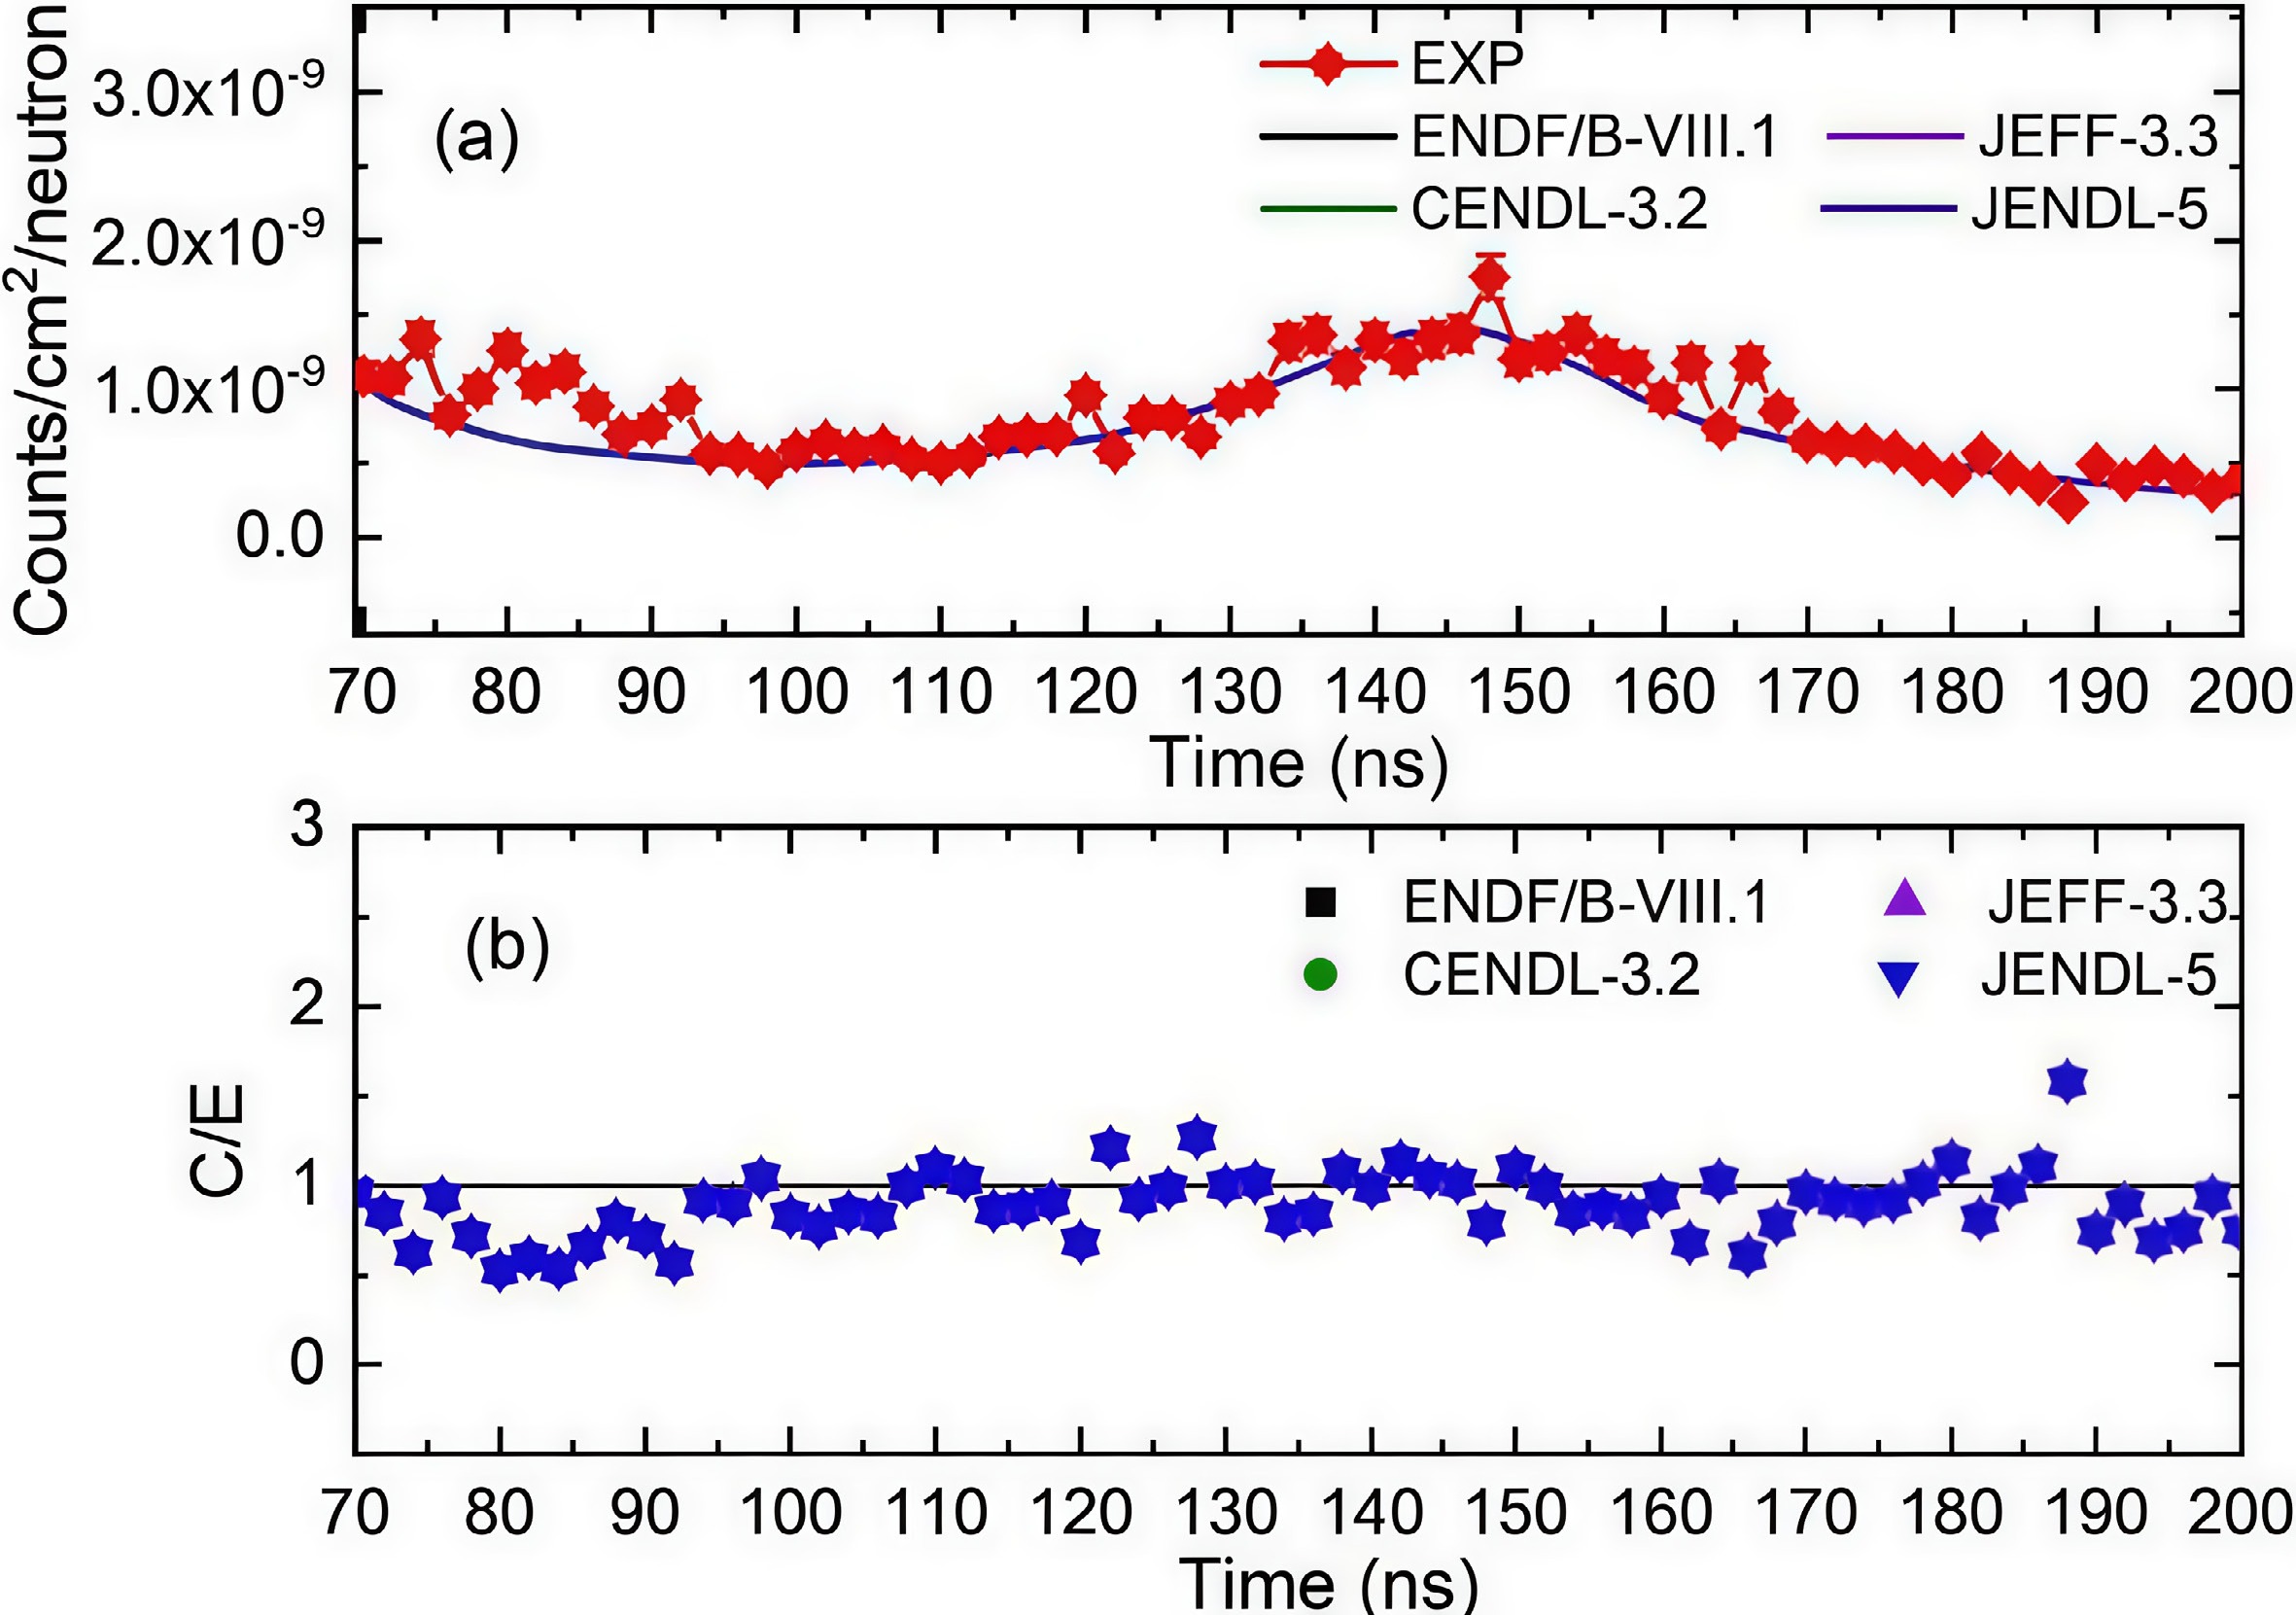
Figure 16. (color online) Comparison between experimental and simulated leakage neutron TOF spectra for the polyethylene standard sample measured by the CLYC detector; (b) shows the fluctuation of the calculated-to-experimental (C/E) ratio between the simulated and experimental spectra.
(1) In the energy range of 0.80–8.00 MeV (t=50–162ns), the simulated spectra based on data from the ENDF/B-VIII.1, CENDL-3.2, JEFF-3.3, and JENDL-5 libraries agree well with the experimental results. As shown in Fig.15(b), the C/E values exhibit minor fluctuations overall, with a slight deviation near 0.80 MeV (155–160ns), where the maximum discrepancy reaches 50%, which is attributed to the energy being close to the detection threshold.
(2) In the lower energy range of 0.15–0.80 MeV (t=80–187ns), the simulated leakage neutron TOF spectra show trends consistent with the experimental spectrum. However, due to the relatively low detection efficiency of the CLYC detector, fewer neutrons were recorded in this range. As shown in Fig.16, the C/E curve exhibits noticeable fluctuations. With the exception of a few data points, the overall deviation remains within 50%. Both detectors show similar deviation levels around the 0.80 MeV energy region.
The relatively large C/E deviation in the 0.15–0.80 MeV region is primarily attributed to low detection efficiency of the CLYC detector and higher background uncertainty, which affect the accuracy of background subtraction. Additionally, the division of energy ranges between EJ-309 and CLYC detectors avoids overlap to minimize systematic errors. CLYC was limited to the low-energy region due to quenching effects and non-standard 35Cl cross sections above 0.8 MeV, ensuring measurement reliability. Hydrogen cross-sections, being internationally accepted standards, were not considered a main source of deviation.
In addition, by integrating the neutron peaks within the effective detection energy range of both the simulated and experimental spectra, C/E values were calculated to quantitatively assess the deviation between the experimental and simulated results, thereby obtaining the evaluation outcome for the polyethylene standard sample. As shown in Table 2, the calculation results from all four nuclear data libraries exhibit good consistency and are all slightly lower than the experimental values. In the energy range of 0.80–8.00 MeV, the deviation between simulation and experiment is approximately 5%, with an uncertainty of less than 4%. In the 0.15–0.80 MeV range, the deviation is around 13%, with an uncertainty within 9%. These results verify the reliability of the system for conducting shielding integral experiments. In future neutron nuclear data validation using this system, relative correction factors will be introduced based on the experimental results: a correction factor of 1.05 for the 0.80–8.00 MeV range, and 1.14 for the 0.15–0.80 MeV range.
Neutron Energy (MeV) C/E Value ENDF/B-VIII.1 CENDL-3.2 JEDNL-5 JEFF-3.3 0.80-8.00 0.949 ± 0.037 0.947 ± 0.037 0.953 ± 0.038 0.949 ± 0.037 0.15-0.80 0.889 ± 0.075 0.888 ± 0.075 0.888 ± 0.075 0.889 ± 0.075 Table 2. C/E values obtained by integrating the neutron peaks in the simulated and experimental spectra
-
In this work, a novel TOF-based neutron leakage spectrum measurement system was established using a 252Cf source and spherical sample configuration. The system’s capability was rigorously tested through TOF spectrum acquisition, detector response characterization, and MCNP-based simulation comparisons. The integration of EJ-309 and CLYC detectors allowed effective discrimination of neutron and gamma signals, while background influences were mitigated through shadow cone measurements and PSD techniques. The system demonstrated reliable performance across the 0.15-8.00 MeV energy range, with experimental-to-simulation (C/E) deviations within 5% in high-energy regions and within 13% in low-energy regions. These findings confirm the system's suitability for benchmark experiments and highlight its potential as a domestic platform for nuclear data validation and reactor shielding research.
The key innovation of this study lies in the introduction of a SiC detector for TOF start-time acquisition—marking the first use of this type of detector in a benchmark measurement system involving a spherical 252Cf source configuration. Compared with traditional fission chambers, the SiC detector offers a compact form factor, fast timing response, and strong radiation resistance, making it well-suited for confined geometries and long-duration experiments. Furthermore, the use of a spherical polyethylene sample with well-characterized neutron scattering properties ensures isotropic emission and enables high-precision comparison across nuclear data libraries. As a result, this work not only establishes a highly reproducible benchmark platform, but also provides valuable experimental references for evaluating and improving evaluated nuclear data, particularly in shielding design and fission-spectrum modeling.
Meanwhile, this work confirms that the developed measurement system is capable of conducting high-quality neutron nuclear data experiments, providing strong support for benchmark studies. Second, a new set of high-precision neutron leakage spectrum data was obtained, offering critical input for the verification and evaluation of existing nuclear data libraries. Lastly, this study lays a solid technical foundation for subsequent measurements involving various materials and energy regions. Through continued systematic experiments, more high-quality data are expected to be accumulated, thereby promoting the advancement of nuclear energy technology and the development of the national nuclear data infrastructure.
Neutron Leakage Spectra Benchmark of Spherical Polyethylene Sample with a 252Cf fission Source
- Received Date: 2025-07-22
- Available Online: 2026-03-01
Abstract: This study presents the development and validation of China’s first benchmark measurement system for neutron leakage time-of-flight (TOF) spectra using a 252Cf spontaneous fission source and a spherical polyethylene sample. EJ-309 and CLYC scintillation detectors were used for neutron detection, and a shadow cone was employed for background suppression. Notably, the SiC detector was, for the first time on this platform, applied as the start-time signal generator in TOF spectrum measurement. The TOF spectrum covering the energy range of 0.15-8.00 MeV was measured, and the results were systematically compared with evaluated data from four major nuclear libraries: ENDF/B-VIII.1, JEFF-3.3, JENDL-5, and CENDL-3.2. The comparison revealed strong agreement across the full spectrum, with calculated to experimental(C/E) deviations remaining within 5% in the high-energy region and within 13% at low energies. These results verify the system’s stability and suitability for integral experiments. The established benchmark platform provides a strong technical foundation for future neutron nuclear data validation, particularly in shielding applications and the improvement of fission-spectrum nuclear databases.


 DownLoad: