


 Abstract
 HTML
HTML Reference
 Related
 PDF
PDF


-
Nuclear data play an important role in applied physics and nuclear physics research, besides the neutron cross-sections are of great significance to fusion reactor [1] and nuclear structures of nuclear reaction [2]. Moreover the cross-section of reaction 39K(n, p)39Ar is of significant importance to the study of the application of 40Ar/39Ar dating technology. There are only three literature contain three data points of the cross-sections of 39K(n, p)39Ar at around 2.5 MeV. The cross-sections of 39K(n, p)39Ar induced by neutron with energy of 2.59 MeV was measured using D-D reactor and n-3He coincidence system by G. Lindström [3] in 1958 for the study of 39Ar nuclear structure. The experimentally obtained cross-sections of 39K(n, p)39Ar was 45 mb with 10% uncertainty. There was an approximately 100% deviation from the 96 ± 6 mb measured by W. R. Dixon [4] in 1961 at 2.49 MeV. Although the results exhibit a law of rapid energy-dependent increase between 2-3 MeV energy in the R. Bass [5] research, the nearly 100% deviation is obviously abnormal. P. B. Johnson replicated the experiment of Dixon in 1967 and acquired the cross-sections data was 95 ± 4 mb at neutron energy of 2.46 MeV [6]. 3He long counter and KI(Tl) detector were used in n-3He coincidence system for the counts of emitted 3He and the 39K neutron induced reactions respectively. The 3He long counter has to resolve the protons, tritons and 3He recoil particles signal of the D(d, p)T and D(d, n)3He reaction from the D-D reaction. Despite considerable efforts to mitigate the influence of charged particles other than 3He, the outcomes have been suboptimal. Existing methods either inadequately shield non-target charged particles or only partially attenuate non-3He charged particles [7-9], thereby compromising the accuracy of the data.
The cross-sections of 39K(n, p)39Ar are also of great significance to improved 40Ar/39Ar geochronology. 40Ar/39Ar dating is one of the most widely applied geochronological methods in Earth sciences [10]. A key step in this method involves converting 39K to 39Ar via neutron irradiation. The 40Ar/39Ar age is calculated using the following equation:
$ t=\frac{1}{\lambda }\mathrm{ln}\left(1+\frac{{}^{40}A{r}^{*}}{{}^{39}Ar}\times J\right) $
(1) J in Eq. (1) is
$ J=\frac{\lambda }{{\lambda }_{\mathrm{e}}}\times \frac{\int\mathit{\Phi }\text{(}E\text{)}\times \sigma \text{(}E\text{)d}E}{{}^{40}K/{}^{39}K} $
(2) Where the E represents the energy of neutron irradiation, the Φ(E), σ(E) represent the neutron fluence and the cross section of 39K(n, p)39Ar at neutron reaction energy E respectively, 40K, 39K is the potassium isotope 40K, 39K content of dating samples, 40Ar* is the radiogenic 40Ar from 40K decay, 39Ar is the content of 39Ar from the neutron reaction 39K(n, p)39Ar, λ is the total decay constant of 40K, and λe is the electron capture decay constant of 40K.
Typically, J value is determined using samples of known age as neutron flux monitors. Renne et al. [11] proposed the use of D-D neutron sources in 40Ar/39Ar dating. Owing to the excellent mono-energetic neutron of D-D neutrons, the Eq. (2) can be reformulated to
$ J=\dfrac{\lambda }{{\lambda }_{\mathrm{e}}}\times \dfrac{\mathit{\Phi }\times \sigma }{{}^{40}K/{}^{39}K} $ , the neutron fluence and cross-section can be directly determined by the irradiation experimental sample to get J-value directly. The D-D neutron source mitigates issues such as the interference reactions and nuclear recoil associated the broad energy spectrum of the conventional reactor-based neutron sources [12-14]. The cross-sections of 39K(n, p) reaction in 2-3 MeV neutron energy range are crucial for absolute 40Ar/39Ar dating, as this energy range corresponds to typical D-D neutron energies and exhibits a rapid increase in cross-section. However, only three data points are available around 2.5 MeV. The evaluated data of 39K(n, p)39Ar cross-sections in ENDF/B-VIII.0 differ from the existing experimental values by over 90%. Moreover, cross-sections values from different nuclear data libraries show substantial discrepancies near 2.5 MeV. The cross-sections of 39K(n, p)39Ar near 2.5 MeV from ENDF/B-VIII.0, JEFF-3.3, TENDL-2021, BROND-3.1, JENDL-5, and relevant published literature are summarized in Table 1 [15-19].Table 1. The cross-sections of 39K(n, p)39Ar in 2-3 MeV neutron energy from available published literature and nuclear databases.
In the 2-3 MeV energy range, there have been no attempts to remeasure the cross-sections of 39K(n, p)39Ar since 1967. Moreover, n-3He coincidence technique has problems of long counter count inaccurate caused by scattered particles at large angles and non-3He signal peak overlap, which directly affect the accuracy of coincidence counts and 3He total counts. As a result, the experimental cross-sections data of 39K(n, p)39Ar around 2.5 MeV are only three data points, the available data differ widely, the precision of the experimental data is low and the development of absolute 40Ar/39Ar dating method was limited by poor reliability and accuracy data. Considering the divergence and scarcity of 39K(n, p) cross-sections in 2-3 MeV energy and the poor accuracy, it is necessary to remeasure the cross section to fill the data gaps and provide reliable data for requirements of modern experiments.
With the development of noble gas mass spectrometry technology, argon can be accurately measured. We have proposed a detection method that combines neutron activation and mass spectrometry to conduct high-precision cross-sections measurements of 39K(n,p)39Ar instead of detecting the n-3He coincidence signal. The combined method above avoids the problems of large-angle particles scattering and 3He spectral overlap of n-3He coincidence system. Neutron activation analysis (NAA) is a highly mature technique used for neutron reaction energy and flux in the detection of cross-sections [20, 21]. As a most sensitive technology for the detection of argon to date, noble gas mass spectrometers have significantly high resolution and low-concentration detection capability of Ar isotope. With the multi-collector and CFM [22, 23] (combined Faraday counting CDD (Compact Discrete Dynote) multiplier), noble gas mass spectrometers have good precision of different mass argon isotopes (36Ar, 37Ar, 39Ar, 40Ar) and weak signal as 39Ar, which is suitable for detection of argon.
In present work, a detection method for cross-sections of 39K(n, p)39Ar based on the combination of neutron activation analysis (NAA) and noble gas mass spectrometer (NGMS) technique was established. The neutron flux can be obtained using the γ-ray spectrum of activity monitor in neutron activation technique, and the number of reaction nucleus 39Ar can be obtained by noble gas mass spectrometry technique. The cross-sections of 39K(n, p)39Ar were determined at 2.56 MeV, 2.69 MeV, 2.96 MeV mean neutron energy using high sensitivity and high-resolution instrument. The reliability and precision of measured cross-sections was discussed by compared with previous literature data, evaluated data of databases and TALYS-1.97 theoretical calculation data.
-
The cross-sections of 39K(n, p)39Ar was determined by measuring the full-energy peak of monitor (58Ni) characteristic γ-ray and the 39Ar content of activated sample. The potassium samples sandwiched with the nickel monitors were irradiated by neutron emitted from D(d, n)3He. The gamma spectrum of activated nickel samples was obtained by off-line γ-ray spectrometric technique with high resolution and low background HPGe detector for the determination of neutron fluence. Then the 39Ar content of irradiated samples was measured by noble gas mass spectrometer. According to the definition of cross-sections, the measurement equation is followed,
$ \sigma =\frac{{N}_{\mathrm{Ar}}}{{N}_{\mathrm{K}}\Phi } $
(3) $ \Phi =\varphi \text{T} $ total neutron fluence;$ \varphi $ neutron flux; T total irradiation time; NAr the mole of 39Ar from 39K(n, p) reaction; NK the mole of 39K from target sample; The NAr representing the number of nuclear reactions. -
The irradiation was carried out using the CPNG-600 neutron generator at China Institute of Atomic Energy (CIAE). The time of lasted irradiation was approximately 94.5 h. The neutrons were produced by D(d, n)3He reaction with a deuteron ion (D+) beam current of 300 μA, and the energy of deuteron ion beam was 300 keV approximately. The thickness of solid deuterium-titanium target used in generator was approximately 1mg/cm2. The yield of CPNG-600 is approximately 7.5×10⁸ n/s. An Au-Si surface barrier detector was installed at 135° respect to the D+ beam. The associated protons of D(d, p)T reaction, representing the neutron of D(d, n)3He, were recorded every three hundreds seconds to determine the neutron fluency fluctuation.
-
Potassium-bearing samples SK01 sanidine, containing 8.62% potassium, were provided by IGGCAS [24]. The selected SK01 sanidine samples are standard materials used in 40Ar/39Ar geochronology and widely applied in age determination. The detail parameters of samples are shown in Table 2. The information of main reaction 39K(n,p)39Ar is shown in Table 4. Three samples were packed into circular discs of 20 mm diameter. Each labeled sample was sandwiched between two nickel foils (99.99% purity, 0.5 mm thick each foil) of the same diameter, which served as neutron flux monitors. The assembled Ni–SK01–Ni structures were wrapped with plastic film. The wrapped samples were placed at 0°,45°,90° relative to the D+ beam direction and center of the D-Ti target at a distance of approximately 4 cm. The placement diagram of sandwiched samples are shown in Fig. 1.
Sample Number Diameter of Samples (mm) Mass of Samples (mg) SK01 1# 20 204.9 2# 20 204.1 3# 20 209.5 The nickel samples were also cut into discs with a diameter of 20mm. Table 2. Samples information
Reaction Abundance of target isotope η (%)a Half-life of product T1/2 γ-ray energy Eγ (keV)b γ-ray intensity Iγ (%)c 58Ni(n,p)58Co 68.007 70.860d 810.759 99.45 39K(n,p)39Ar 93.258 268y - - a. The abundance of target isotope represents 58Ni and 39K isoptopes of natual elements in samples respectively. b. The half-lives of products represents the half-lives of 58Co and 39Ar in irradiated samples respectively. c. The γ-ray energy and intensity are those of the decay γ-rays of product 58Co. Table 4. The main reaction data of irradiated samples
Figure 1. (color online) The geometric model of sample and d-d generater.
The neutron mean energy emitted at angle β was determined by cross-sectional ratio method of reactions 64Zn(n, p)64Cu, 115In(n, n’)115 mIn [25, 26] and checked with the Eq. (4) based on Q equation from J.H. Luo [27]. The mean neutron energy calculated geometric model is shown in Fig. 2.
Figure 2. (color online) The schematic diagram of mean energy calculated geometric model.
$ \overline{E}=\frac{2L}{\pi {R}^{2}}\int\limits_{\beta -\arctan (\frac{R}{L})}^{\beta +\arctan (\frac{R}{L})}{E}_{n}(\theta ,{E}_{d})\frac{\sqrt{{R}^{2}-{L}^{2}{\tan }^{2}\left(\beta -\theta \right)}}{{\cos }^{2}\left(\beta -\theta \right)}\text{d}\theta $
(4) Q equation is as followed,
$ {E}_{n}(\beta ,{E}_{d})={\left\{\frac{\sqrt{2{E}_{d}}}{4}\cos (\beta )+{\left[\left(\frac{1}{2}+\frac{1}{8}{\cos }^{2}(\beta )\right){E}_{d}+\frac{3}{4}\mathrm{Q}\right]}^{\frac{1}{2}}\right\}}^{2} $
(5) The β is the angle between the d+ beam direction and the line from D-Ti center to sample center. The mean neutron energy at samples 1, 2, 3 were calculated as 2.56±0.08 MeV, 2.69±0.08 MeV, 2.96±0.12 MeV respectively.
-
58Ni and 54Fe isotopes are found to be the suitable neutron flux monitors as the cross-sections of 58Ni(n, p)58Co and 54Fe(n, p)54Mn are similar to that of 39K(n, p)39Ar at 2-3 MeV (The cross-sections of these reactions are shown in Fig. 3). The neutron flux detected by the similar cross-section is closer to the actual neutron flux when the sample was irradiated. The isotopic abundance of 54Fe is only 5.845%, while that of 58Ni is 68.077%, and the characteristic gamma-ray intensities of products 58Co and 54Mn are similar. Under the same mass and irradiation conditions, a large number of radioactive product nuclei can be generated from nickel foil, and more γ-ray full-energy peak signal will be detected, reducing the statistical error. If 54Fe is enriched, the preparation would be difficult and the cost would be high. Considering the simplicity and cost of the experiment, 58Ni and 58Ni(n, p)58Co were chosen as the isotope and reaction to monitor neutron flux. The neutron flux were determined by gamma spectrum of activated nickel samples, using low background γ-ray spectrometer equipped with high resolution HPGe detector. The decay γ-ray was emitted by 58Co from the activation reaction 58Ni(n, p)58Co of nickel samples.
Figure 3. (color online) The Cross-sections of 39K(n, p)39Ar, 58Ni(n, p)58Co, and 54Fe(n,p)54Mn at neutron energy of 1-4.5 MeV.
The GEM60P type HPGe detector (provided by Department of Nuclear Physics, CIAE) has a relative efficiency of 68% and a resolution of 1.82 keV at 1.33 MeV energy. The 58Ni was chosen for the activity detection of neutron flux, because the cross-sections excitation function of 58Ni(n, p)58Co is similar to 39K(n, p)39Ar at the 2-3 MeV energy, which reducing system errors. The activated nickel samples were placed 15 cm away from the detector, the dead time is less than 0.5% and the decay γ-ray spectrum of neutron activation product 58Co was detected and unfolded by energy spectrum analysis software MAESTRO from ORTEC (company in USA).
Neutron activation analysis time was divided into 3 parts as T1, T2, T3. T1 is the irradiation time , T2 is the cooling time from the end of irradiation to the start of gamma spectrum detection, T3 is the measurement time of gamma spectrum detection. According to the parameters of monitor and the full-energy peak γ-ray spectrum diagram from off-line γ-ray spectrometry, the equation for neutron activation analysis is as follows,
$ FC=\frac{KM{N}_{A}\eta \varphi \sigma {I}_{\text{γ}}{\varepsilon }^{\text{p}}}{\lambda A}SD $
(6) the neutron flux are calculated by Eq. (7)
$ \varphi =\frac{FC\lambda A}{KM{\mathrm{N}}_{\mathrm{A}}\eta \sigma {I}_{\text{γ}}{\varepsilon }^{\text{p}}SD} $
(7) For a reaction of X(n, b)Y, where M is mass of the sample, A is atomic weight of the parent nucleus, η is the abundance of X, σ is the cross-sections of X(n, b)Y, φ is the mean neutron flux, Iγ is decay γ-ray intensity of activated monitor 58Co , λ is decay constant, NA is Avogadro constant, εp is full-energy peak efficiency, C is the total counts in the γ-ray full-energy peak.
$ S=(1-{e}^{-\lambda {{T}_{1}}}) $ is growth factor,$ D={e}^{-\lambda {{T}_{2}}}(1-{e}^{-\lambda {{T}_{3}}}) $ is counting collection factor.F is total correction factor of the activity,
$ F={F}_{s}\times {F}_{c}\times {F}_{g} $ , Fs, Fc, Fg are γ-ray self-absorption, γ-ray coincidence summing effects and sample geometry factor respectively.K is neutron fluency fluctuation factor [28],
$ K=[\sum\limits_{i}^{L}{\varphi }_{i}(1-{e}^{-\lambda \Delta {{t}_{i}}}){e}^{-\lambda {{T}_{i}}}]/\varphi S $
(8) In this work, we divided total irradiation time into L part, where L is the number of time intervals into which the irradiation time is divided.
$ \Delta {t}_{i} $ is the duration of the ith time interval, Ti is the time interval from the end of the ith interval to the end of irradiation, φi is the neutron flux averaged over the sample during the$ \Delta {t}_{i} $ , φ is the neutron flux averaged over the sample during the total irradiation time T. Long time neutron irradiation as 94.5h may cause neutron flux fluctuation, therefore we calculated K factor by detecting the associated proton particles which represents the neutron flux in L parts of time to fix results. The recorded time$ \Delta {t}_{i} $ was set 300 second in each part of L parts.The measurement neutron flux differences caused by the self-absorption effect were taken into account. The first to consider was the self-absorption effect of gamma rays. The formula of self-absorption coefficient Fs is shown in below,
$ {F}_{s}=\frac{1-{\text{e}}^{\text-\mu \text{(}E\text{)}x}}{\mu \text{(}E\text{)}x} $
(9) μ(E) is the energy-dependent mass attenuation coefficient (cm2∙g-1), E=810.67 keV.
x is the mass thickness,
$ x= \rho d $ , ρ is the density of nickel, d is the thickness of Ni sheet.Secondly, there is the neutrons attenuation in SK01 sample, which is neutron self-absorption. We separately calculated the neutron flux of two sandwiched Ni sheet in each samples. According to neutron attenuation effect, the average neutron flux of sample is calculated by Eq. (10).
$ \overline{\varphi }={\varphi }_{1}\left(\frac{1-{e}^{-\omega s}}{\omega s}\right) $
(10) Where the
$ \overline{\varphi } $ is the average neutron flux of sample, φ1 is the neutron flux determined by Ni which is close to the D-Ti target, ω is the linear attenuation coefficient, s = h2-h1, h1 is the distance between the center of D-Ti target and Ni sheet close to D-Ti target, h2 is the distance between the center of D-Ti target and Ni sheet far away from D-Ti target,In this work the linear attenuation coefficient was determined by Eq. (11)
$ {\varphi }_{2}={\varphi }_{1}\frac{h_{1}^{2}}{h_{2}^{2}}{e}^{-\omega s} $
(11) Where φ2 is the neutron flux determined by Ni which is far away from the D-Ti target,Part of self-absorption parameters of Sample 3# are shown in Table 3.
Parameter symbol value μ(E) 6.846×10⁻² cm2/g x 0.445 g/cm h2 5.25 mm h1 4.25 mm s 1 mm ω 0.803 cm-1 Table 3. The self-absorption parameters of Sample 3#
The gamma self-absorption factor Fs = 1.0153, which results in an increase of about 1.5% in the calculated neutron flux. Taking into account the neutron self-absorption effect, compared with not considering that, the neutron flux of sample 3# decreases approximately 4% and the neutron flux of samples 1# and 2# decease less than 1%. Overall, the impact of self-absorption on the final measured cross-section is approximately 2.5% for sample 3#, and less than 1% for samples 1# and 2#.
The detection efficiency εp was determined by the well-known standard source 152Eu placing 15 cm at HPGe detector, using Eq. (12).
$ {\varepsilon }^{p}=\frac{C'}{{A}_{0}{I}_{\text{γ}}t\exp (-\lambda T)} $
(12) Where the C’ is the nut count of 152Eu full energy peak in the counting time t, A0 is the source activity at time of manufacturing, T is the time from the data of manufacturing to the start time of detection, λ is the decay constant of standard source, and the Iγ is the intensity of characteristic γ-ray.
The detection efficiency was obtained by γ-ray full-energy counts of standard source 152Eu. The half-life and radioactive activity at the manufacturing time of the standard source 152Eu were 13.517 a and 132192 Bq respectively. There is a linear relationship between energy and ε under the exponential form. The fitting formula is as follows,
$ ln(\varepsilon )=\sum\limits_{j=1}^{n}{a}_{j}{(ln(E/{{E}_{0}}))}^{j-1} $
(13) Where the aj is the fitting parameter, the goodness of fit value is observed for j=3 with
$ \dfrac{\chi _{j}^{2}}{(11-3)}\approx 1 $ [29]. May as well set E0 = 1 keV , the polynomial function is given as,$ ln(\varepsilon )=-3.3454+0.03015*ln(E)-0.06037*{(ln(E))}^{2} $
(14) The R square is 0.997.
The σ in Eq. (7) is the standard cross-section of 58Ni(n, p)58Co determined by the mean energy which is calculated in Eq. (4). The cross-sections of activation reaction 58Ni(n, p)58Co were 109.38±12.18 mb, 131.76±16.12 mb, 178.65±19.80 mb relative to the calculated neutron mean energy 2.56±0.08 MeV, 2.69±0.08 MeV, 2.96±0.12 MeV respectively getting from ENDF/B-VIII.0 [15] database.
The measured 58Co γ-ray spectrum is shown in Fig. 4. The constants of Ni samples are shown in Table 4. From the above measured data, we brought it into Eq. (7) to calculate the mean neutron flux.
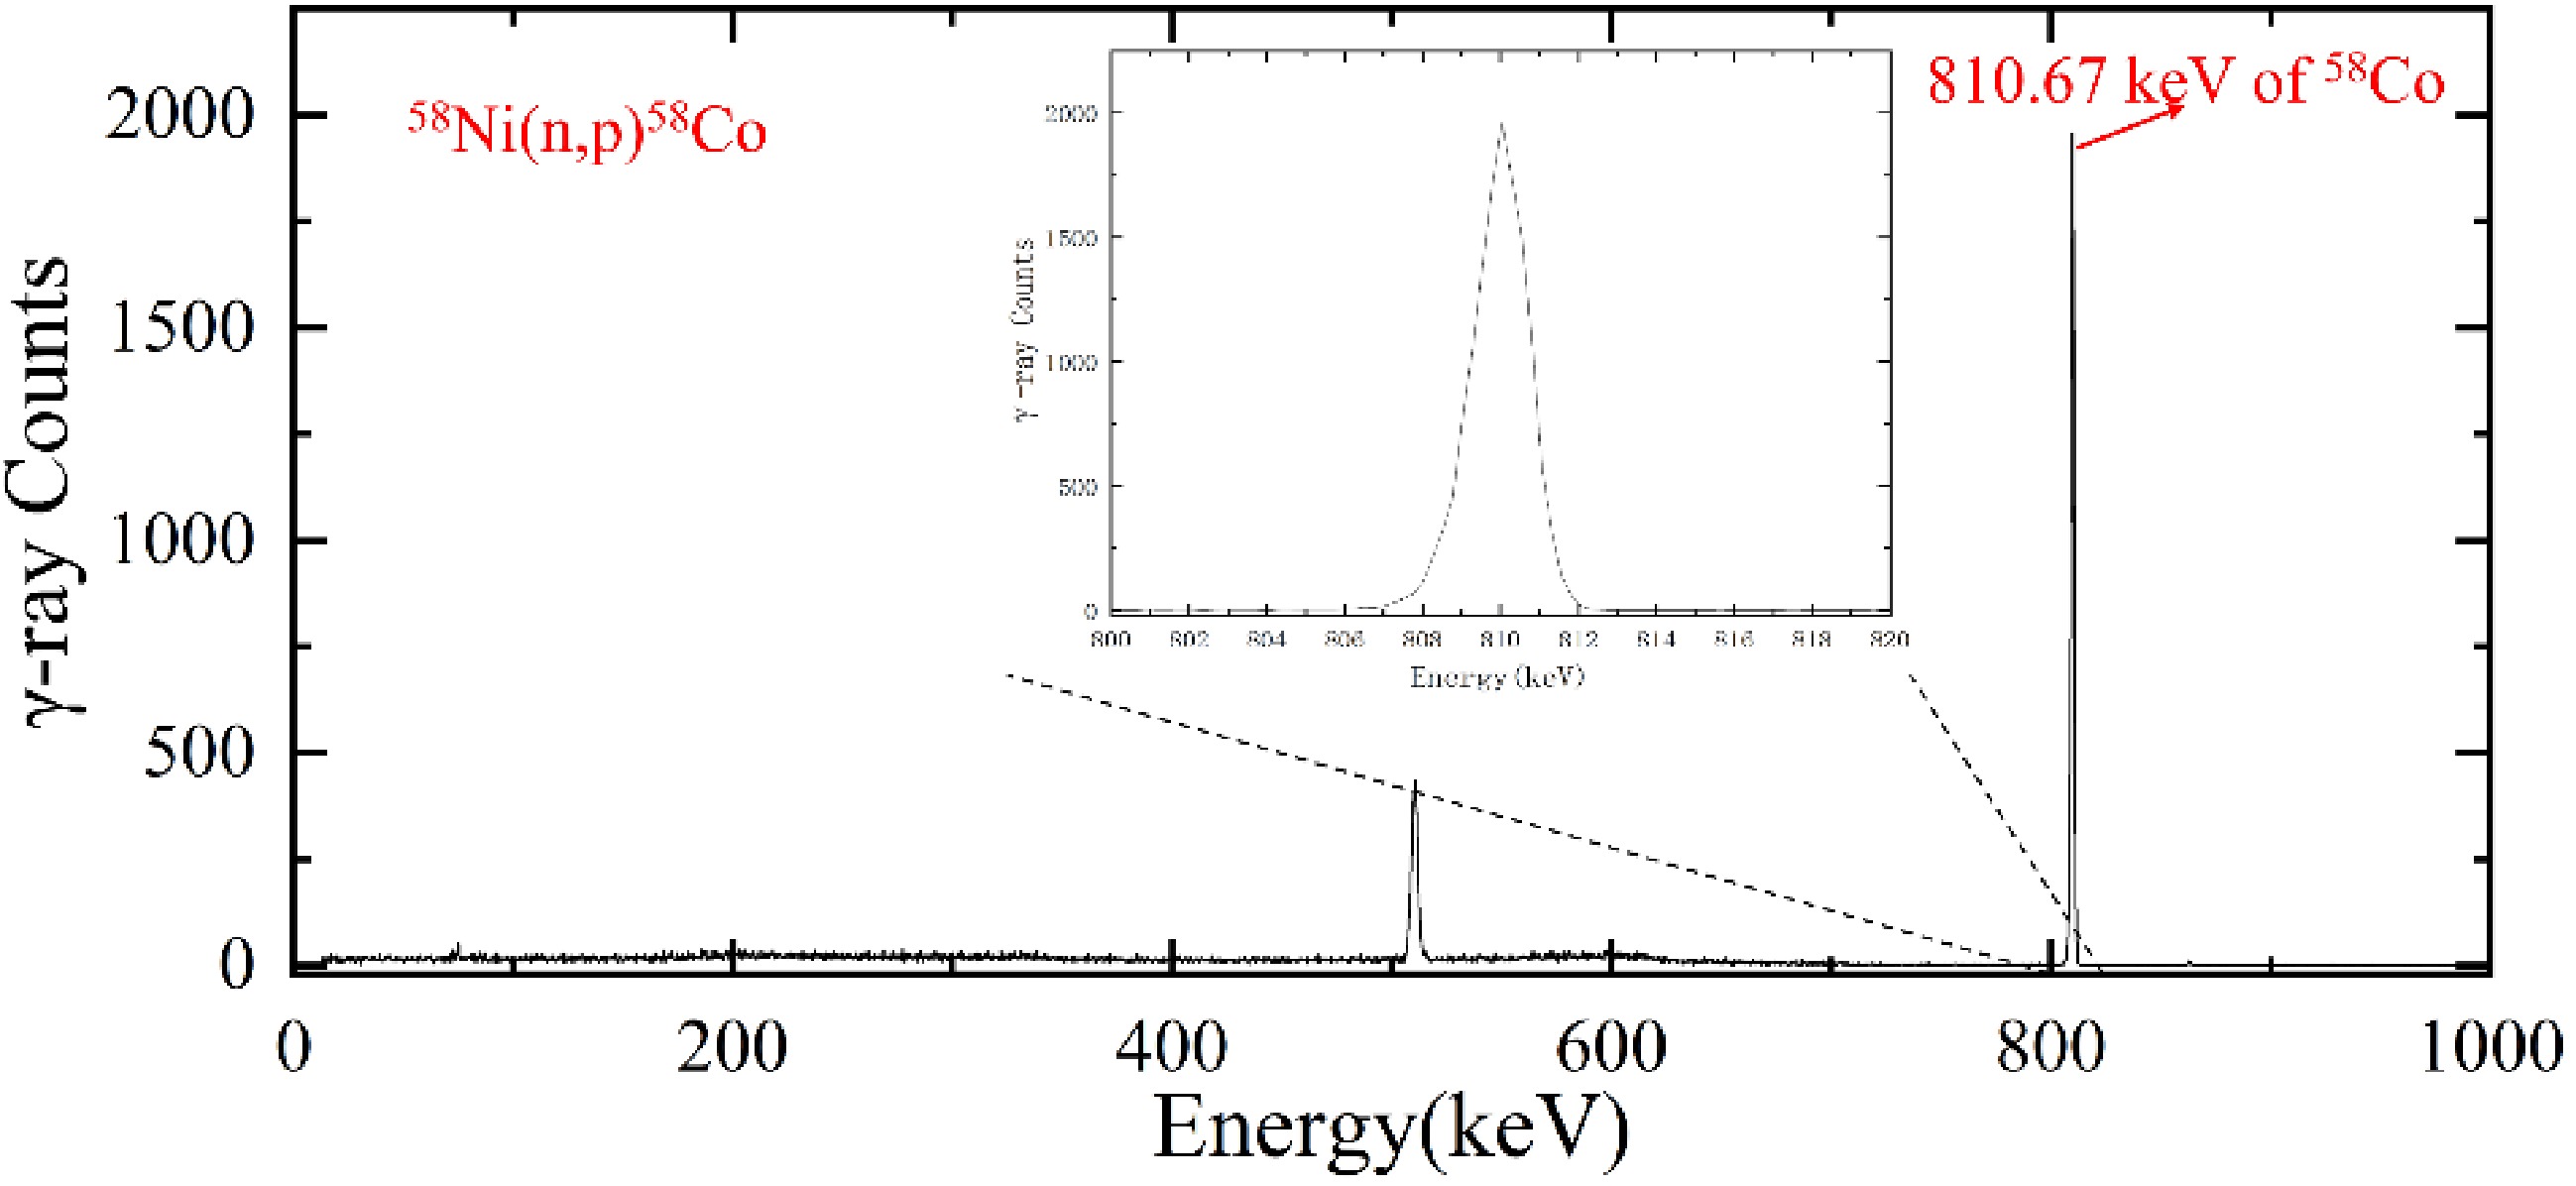
Figure 4. (color online) The tapical γ-ray spectrum of 58Co measured by off-line γ-ray spectrometer equipped with HPGe detector.
-
Ar isotopic analyses were carried out in noble gas laboratory, at Institute of Geology and Geophysics, Chinese Academy of Sciences (IGGCAS, Fig. 5). Samples were step-heated from 970 ℃ to 1300 ℃ in 10–50 ℃ increments to release the gases. During each step noble gases, H2O, CO2, and various hydrocarbons were released concurrently. Liquid-nitrogen traps removed H2O and CO2, and GP50 SAES getters further stripped hydrocarbons before the purified gas entered the mass spectrometer. However, residual hydrocarbons still influenced the low-abundance isotope 39Ar. Argon isotopes were measured with a Noblesse multi-collector mass spectrometer. The instrument is equipped with a Nier-type ion source, a 240 mm radius magnet, one Faraday cup, and three electron multipliers. The 40Ar sensitivity of the mass spectrometer is 1.2×10⁻³ A/Torr, with a mass resolution greater than 700. Isotopes were acquired in peak-jump mode. 40Ar was recorded on the Faraday cup, whereas 39Ar, 38Ar, 37Ar, and 36Ar were measured on the multipliers in ion counting mode. Data reduction included blank subtraction, mass-discrimination correction, interference correction, and correction for the 40Ar peak tail. A procedural blank, following the same extraction sequence as the samples, was run before each unknown. The 40Ar blank contribution was <1 %, and the 38Ar , 36Ar blank was <5 % of the respective signals. Air calibrations (“air shots”) were used to monitor instrumental mass discrimination. The discrimination factor averaged 0.9985 ± 0.0052. Interferences on 39Ar (e.g., H237Cl, C3H3) [30] were minimized by precise peak centering and subsequently corrected (Fig. 6). Because 40Ar is 4–5 orders of magnitude more abundant than 39Ar, the effect of 40Ar tailing on the adjacent 39Ar peak was evaluated. Tests on atmospheric standards devoid of 39Ar showed that 40Ar tailing contributed <0.3 ppm to the apparent 39Ar signal. Corrected 39Ar abundances are reported in Table 5.
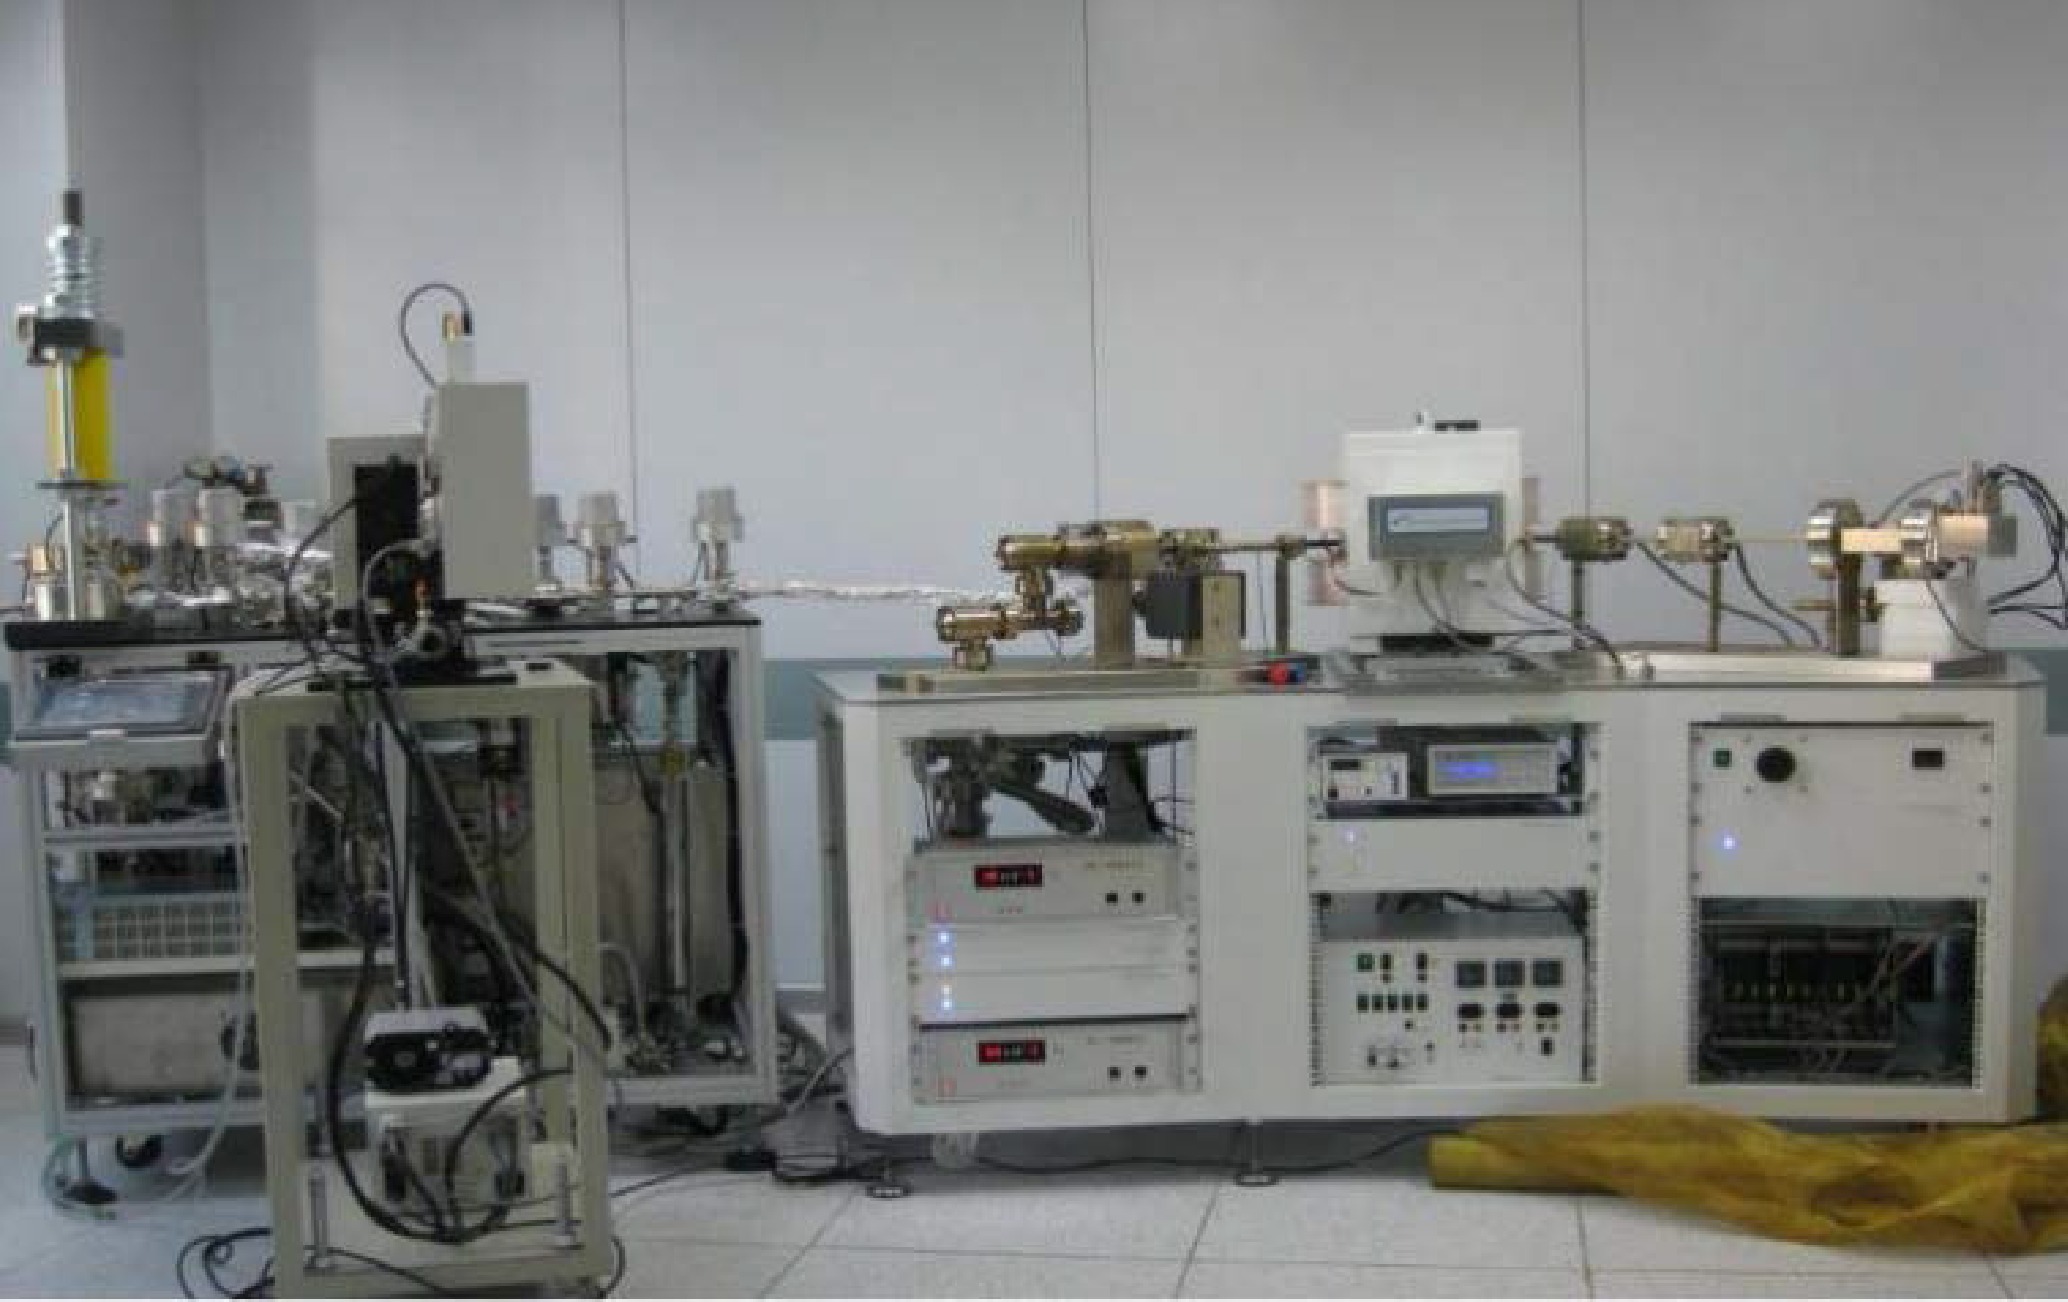
Figure 5. (color online) Photo of Noble gas laboratory in IGGCAS.
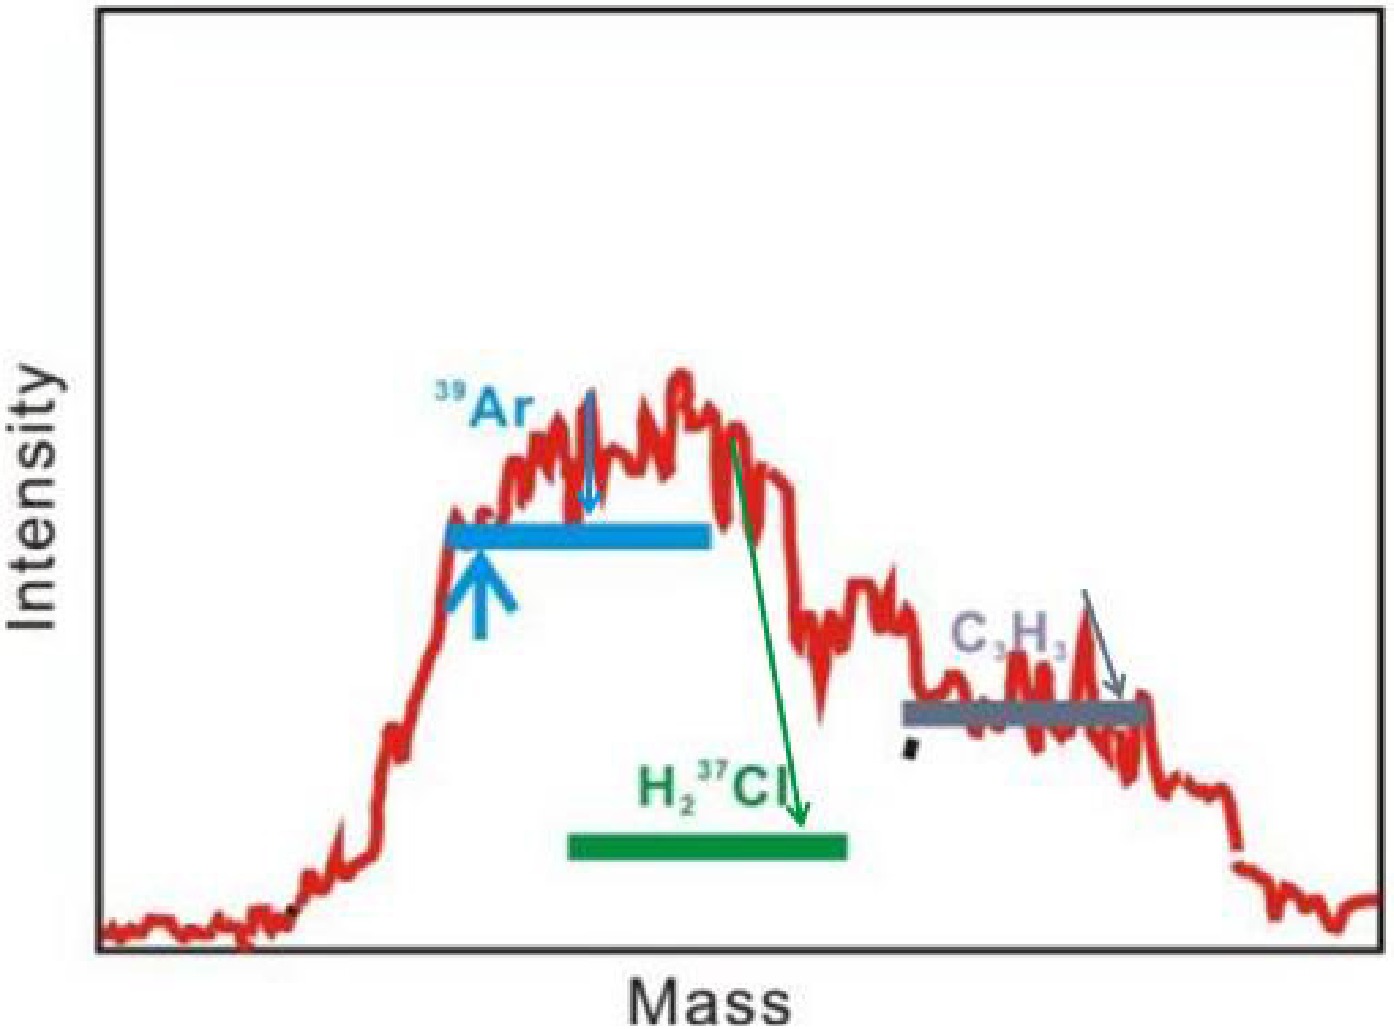
Figure 6. (color online) Schematic diagram of the peak position of mass number 39, where the blue, green and purple lines are the peak widths of 39Ar, H237Cl, C3H3, respectively, and the blue arrows are the measured positions of 39Ar, independent of interference.
Sample No. 39Ar content (mol) 1# (6.96±0.44)×10-17 2# (1.11±0.06)×10-16 3# (4.58±0.29)×10-16 Table 5. The measured 39Ar content of samples
-
TALYS is a computer program that can analysis the nuclear reactions cross-sections of protons [31], neutrons, photons, deuterons, tritons, 3He and α particles, in the eV-200 MeV energy range and target nuclei masses of 12 or heavier. The cross-sections can be obtained considering optical model for direct reactions, pre-equilibrium reactions and compound reactions in TALYS-1.97. The optical model potentials parameters for neutrons were obtained by local and global parameterizations of Koning and Delaroche [32].The direct reaction contribution was considered and calculated with Distorted Wave Born Approximation DWBA using ECIS-06 code. Two-component exciton model developed by Kalbach [33] was used for calculating pre-equilibrium reaction contribution. And the compound reaction contribution was processed using Hauser-Feshbach statistic model with width fluctuation of Moldauer expression model [34, 35]. The default values were used for parameters concerning nuclear masses, discrete levels, pre-equilibrium and photon strength functions in TALYS calculation, and the level densities and optical model were adjusted (ldmodel 2, rvadjust n 1.16, avadjust n 1.04, rwdadjust n 0.98, awdadjust n 0.98). The theoretical data achieved a high consistency with the evaluated data at low and high energy region and achieved a high consistency with the experimental data at medium energy region (4-9 MeV). Meanwhile the all other out going channels were considered include (n, α) induced reactions and inelastic scattering. The cross-sections of 39K(n, p)39Ar were simulated by TALYS-1.97 with the energy reaching up to 20 MeV.
-
The cross-sections of the 39K(n, p)39Ar were determined by the measured content of 39Ar and the characteristic γ-ray full-peak counts of activated monitor γ-ray spectrum. The mean neutron energy, total neutron fluence Φtot, 39Ar content and 39K(n, p) reaction cross-sections values measured for each sample are summarized in Table 6 according to the sample number. The cross-sections of samples are 103.84±16.33 mb, 109.76±15.88 mb, 150.27±24.19 mb at mean neutron energies 2.56±0.08 MeV, 2.69±0.08 MeV, 2.96±0.12 MeV respectively. The measured cross-sections in this study are plotted in Fig. 7 and Fig. 8 along with the already existing experimental data reported in EXFOR database. Moreover, the present results are compared with evaluated nuclear data from ENDF/B-VIII.0, JEFF-3.3, TENDL-2021, BROND-3.1 and JENDL-5 databases and the code TALYS-1.97.
Sample No. Values and results M (mg) En (MeV) Φtot (n/cm2) 39Ar(mol) σK(mb) 1# 204.9 2.56±0.08 1.48×10¹² 6.96×10⁻¹⁷ 103.84±16.33 2# 204.1 2.69±0.08 2.24×10¹² 1.11×10⁻¹⁶ 109.76±15.88 3# 209.5 2.96±0.12 6.58×10¹² 4.58×10⁻¹⁶ 150.27±24.19 σK means the cross-section of 39K(n, p)39Ar. Table 6. The experimental data of 39K(n, p)39Ar cross-sections
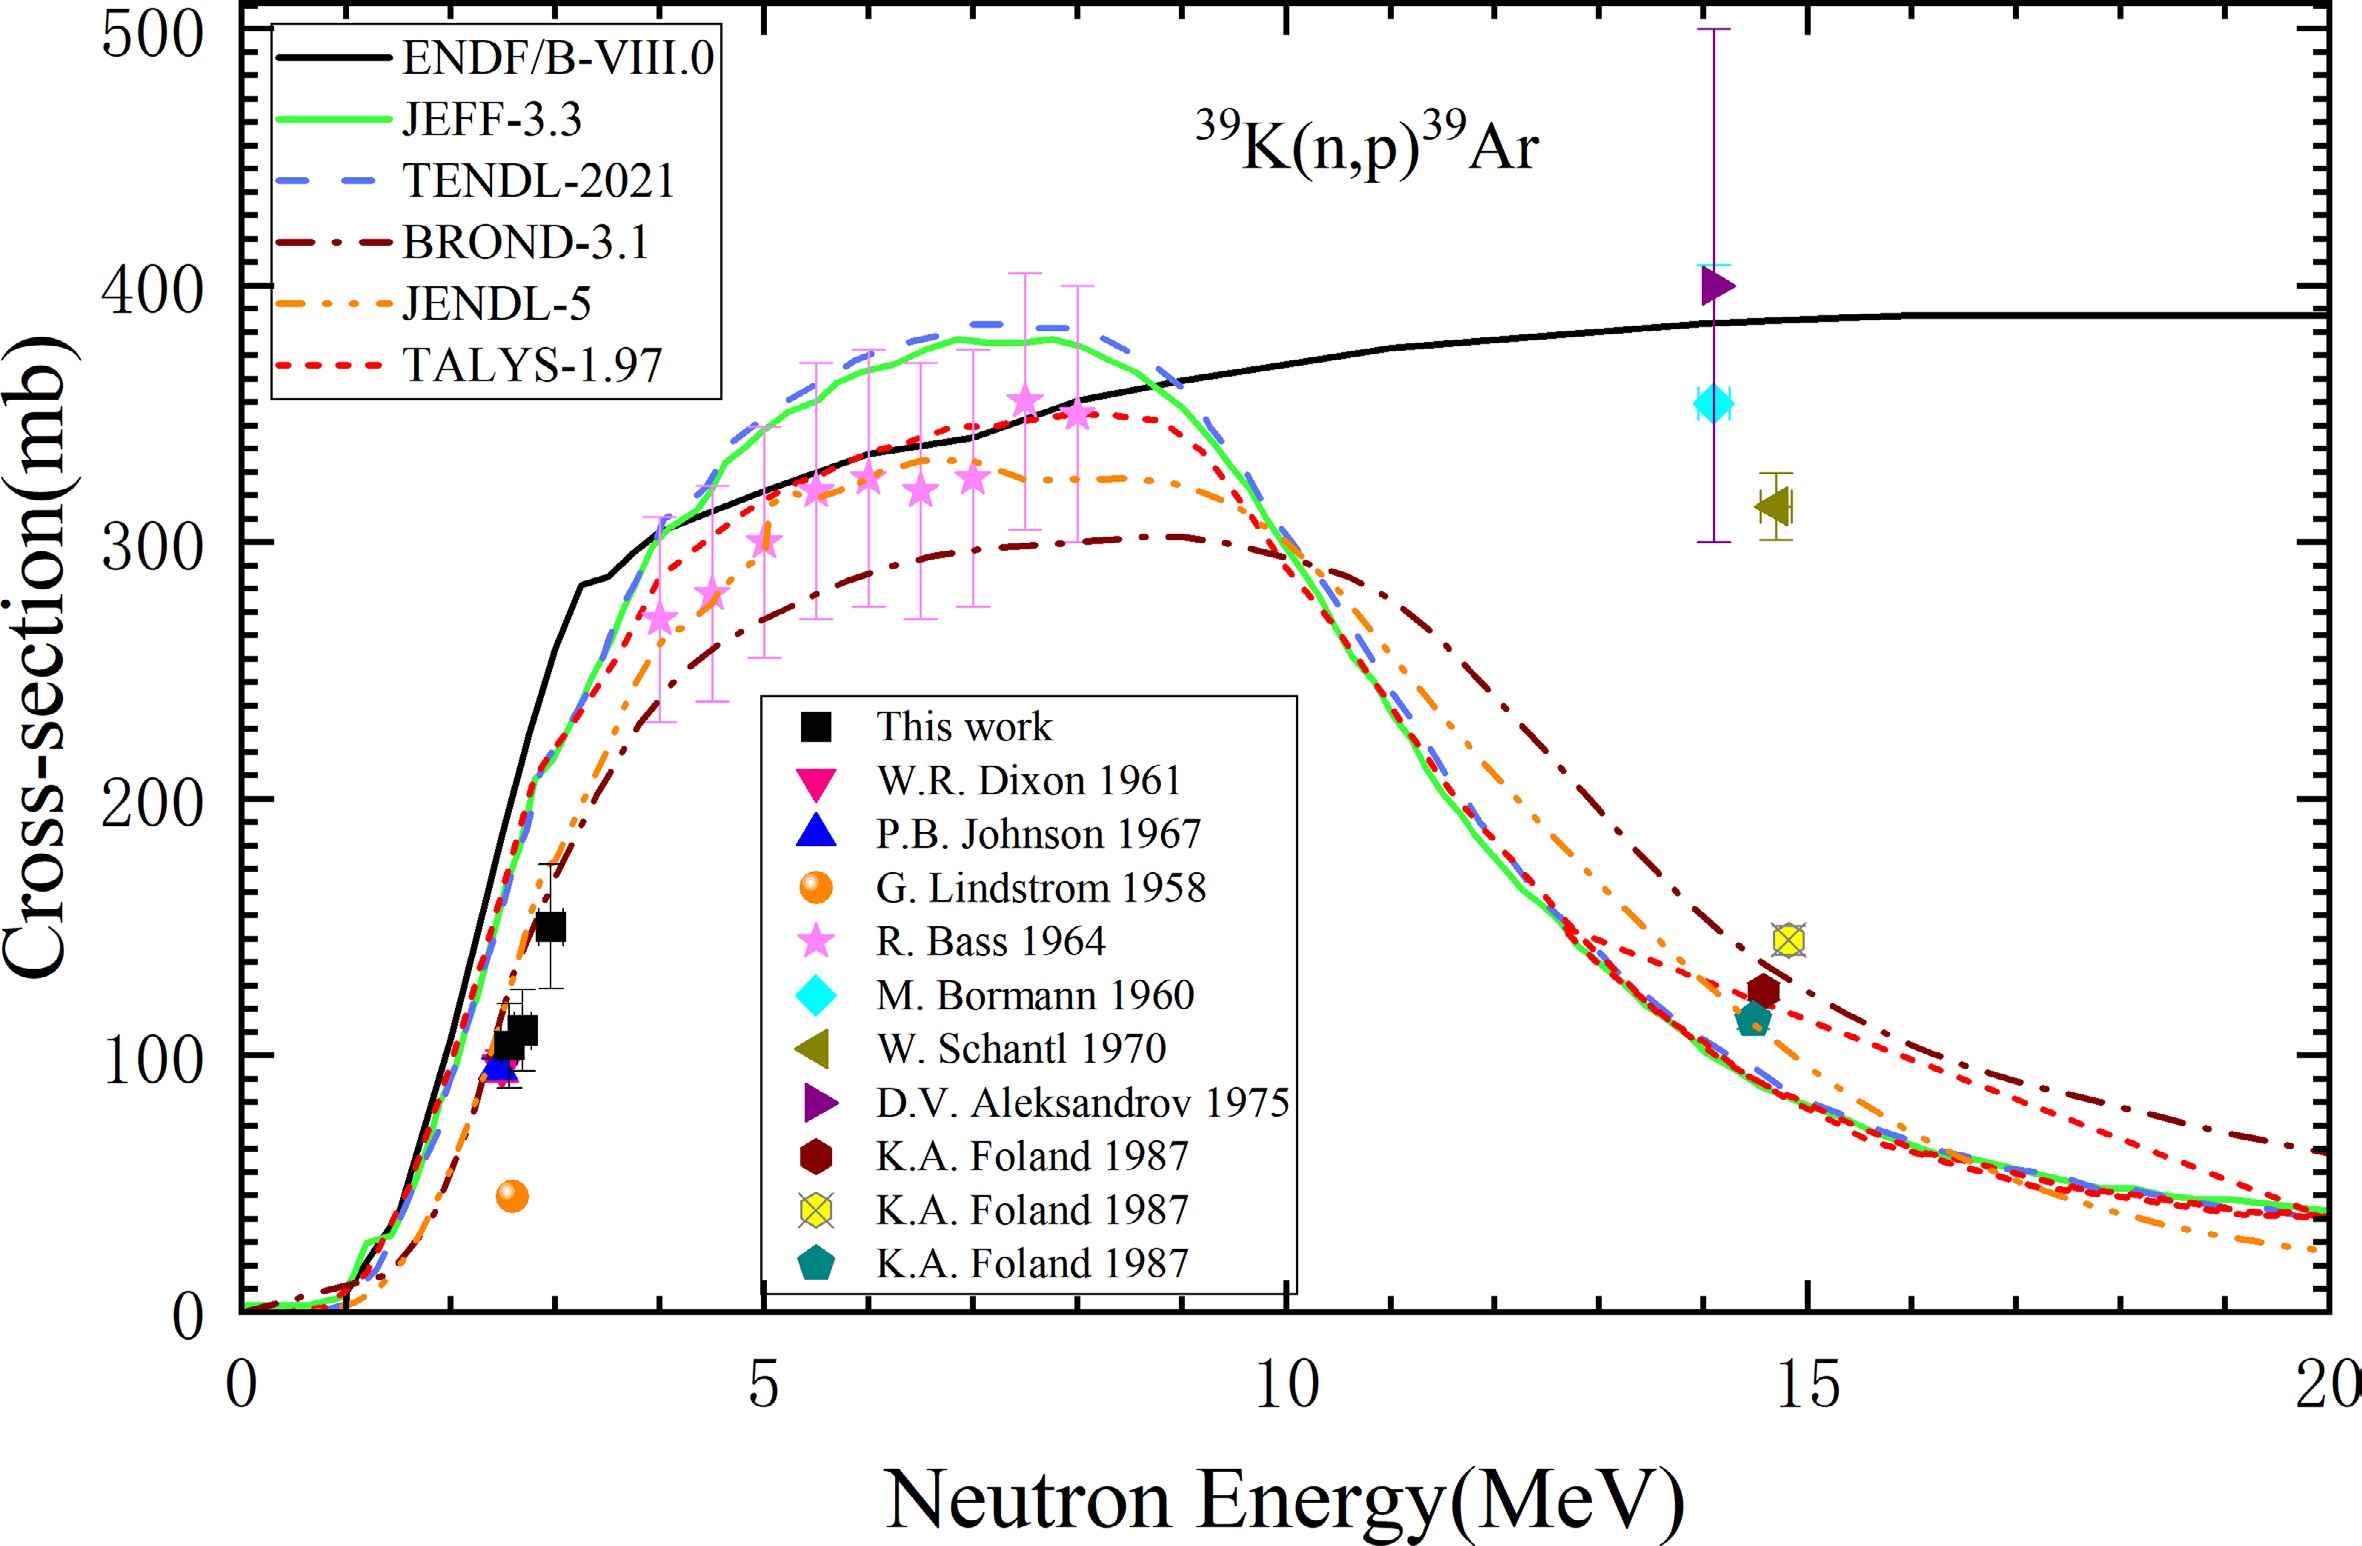
Figure 7. (color online) The comparing of data include the ENDF/B-VIII.0, JEFF-3.3, TENDL-2021, BROND-3.1, JENDL-5, TALYS-1.9 model code, other’s experiment and this work.
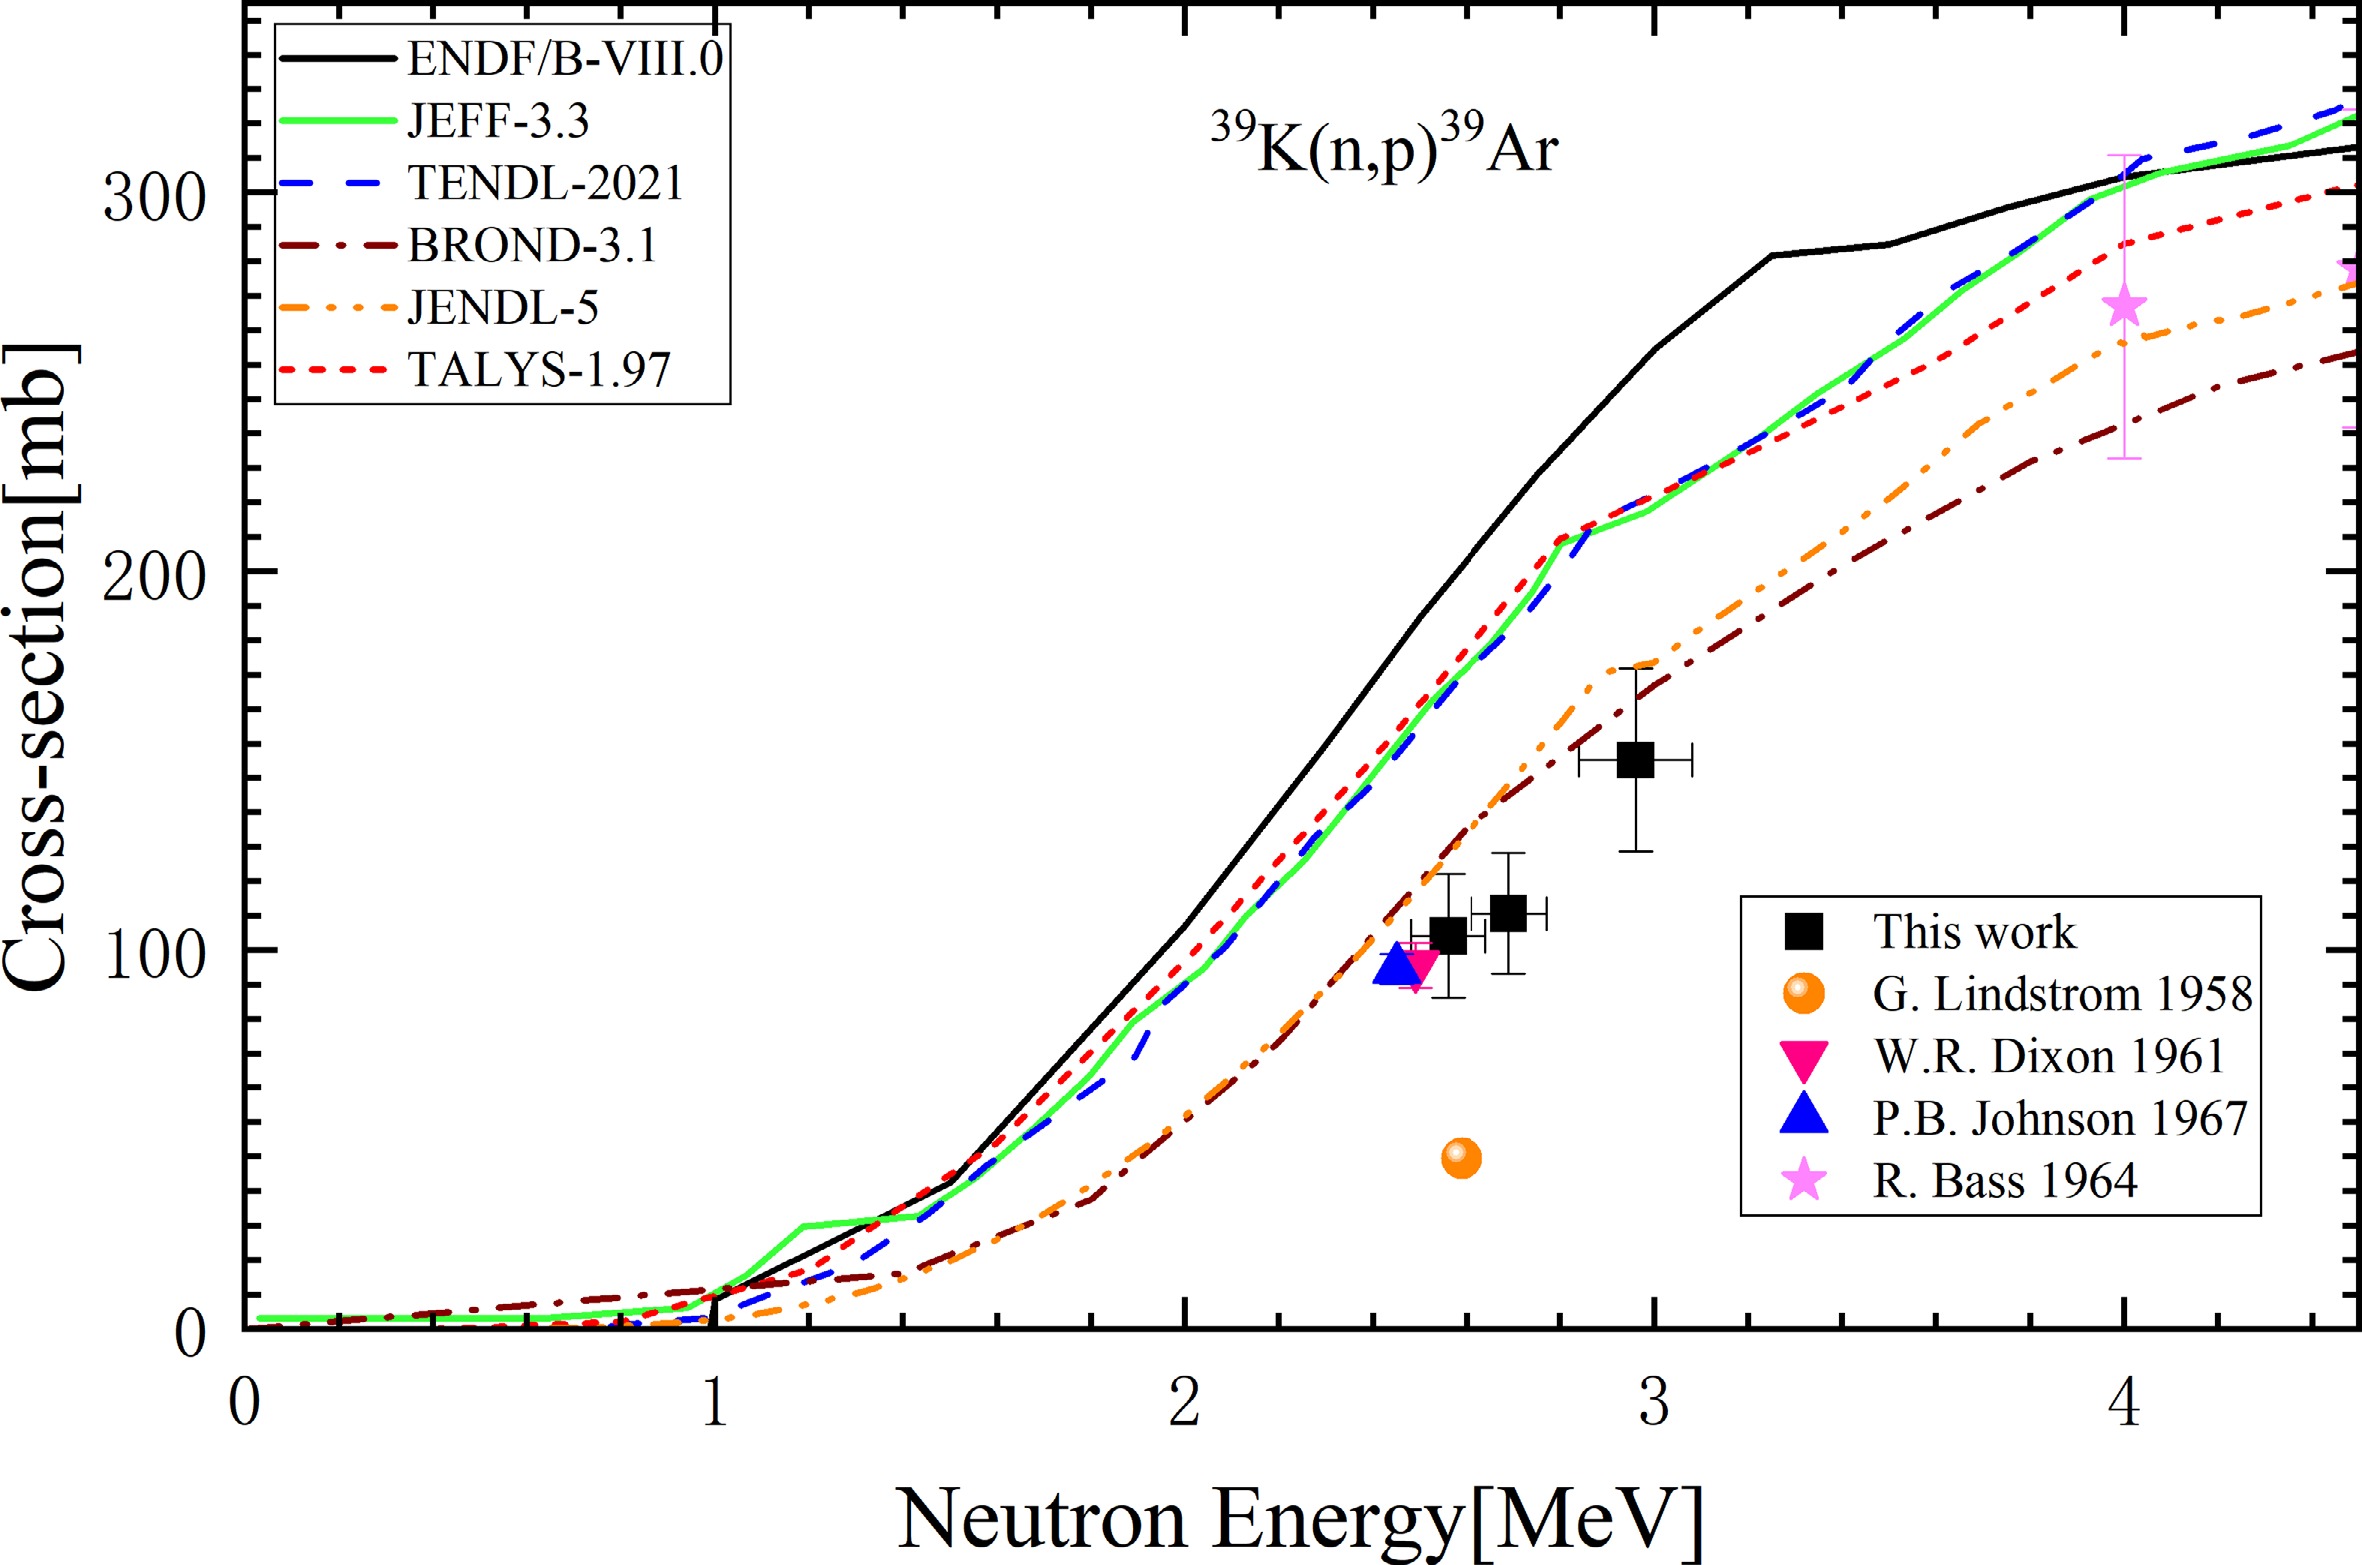
Figure 8. (color online) The cross-sections of 39K(n, p)39Ar at 0-4.5 MeV mean neutron energy region.
-
The uncertainties of neutron flux are caused by detection efficiency of HPGe detector and the mean neutron energy.
The detection efficiency εp is calculated by Eq. (12), according to the polynomial fitting results, the uncertainty of detection efficiency at 810.67 keV is approximately 3%.The monitor reaction cross-sections uncertainty is approximately 5.2%, because of neutron mean energy calculated by the angle β and the diameter of sample. The uncertainty of neutron fluence is calculated approximately 2.5%. The uncertainty of counting statistics is 0.8%. The total correction factor of the activity F are the self-absorption of γ-ray (~1%), the coincidence summing effect of cascade γ-rays (~1%) and the sample geometry (~1%). The weight of samples is less than 0.1%. The neutron fluency fluctuation factor K is approximately 0.1%. The uncertainty of Ar isotopes measurement is approximately 6%, due to the low abundance of mass 39 elements and the uncertainty of the volume of measuring system. The uncertainties have been listed in the Table 7 for reference. The total uncertainty were calculated by quadratic method.
Source of Unertainty Symbol Estimated Values (%) Remarks Counting statistics C 0.8 Calculated by $ 1/\sqrt{C} $ Weight of samples M <0.1 Detection efficiency εp 3 Self-absorption Fs 1 Coincidence summing effect Fc 1 Sample geometry Fg 1 Neutron fluency fluctuation K 0.1 Times T 1.6 Including irradiation(T1), cooling(T2), measuring(T3) times Cross-section of 58Ni(n, p)58Co σNi 5.2 Neutron fluence Φtot 2.5 39Ar isotope measurements 39Ar 6 Table 7. Uncertainties of 39K(n,p)39Ar cross-section
The detection of argon content contributed most of the uncertainty, mainly because the 39Ar produced by neutron irradiation was insufficient, slightly higher than the background mass of 39. 39Ar yield is determined by irradiation neutron flux and time, the irradiation time took into account the half-life of the activation monitor and the yield of argon. The neutron flux was bound by the neutron source intensity of CPNG-600, which was 7.5×10⁸ n/s in this work. The neutron flux generated at the samples was relatively low, and coupled with the time limitation, making the products 39Ar insufficient.
-
Compared with the the available literature determined cross-sections and evaluation databases shown in the Fig. 7, the measured data complied with the law that the cross-sections increased rapidly in the energy range of 2-3 MeV. In order to more clearly comparing the measured data with the other researchers and evaluated data, we enlarged the image in the energy range of 1-4.5 MeV, which is shown in Fig. 8. As shown in Fig. 8, In addition, the excitation function calculated by TALYS-1.97 is shown in Fig. 7 and Fig. 8 which is close to the evaluated data curve of JEFF-3.3 and TENDL-2021. The measured data in this work are close to the data measured by Dixon in 1961, clarifying data deviation between G. Lindström and others. It is highly likely that as P. B. Johnson [6] inferred, in paper of Lindström the (n, α) and (n, p) double peaks are actually a single peak of (n, p). After treating it as a single peak, the cross-section of 81 mb is still much lower than the evaluation value. It can be inferred that the main reason is that deuterium signal and other non-3He signals were confused with the 3He signal, resulting in an overestimation of the 3He reading and ultimately the smaller calculation of cross-sections. measured data in this work are close to evaluated data of JENDL-5 and BROND-3.1 databases. And the JENDL-5 database focuses more on the fitting of experimental data and the evaluation of covariance data [19]. The measured cross-sections are consistent with the physical laws and close to the evaluation excitation function and the previously published experimental data, which shows that our proposed detection method of combined NAA and NGMS techniques to measure the absolute matter content and neutron flux for determination of cross-section is feasible and reliable.
The black filled square are the data determined in this work. The error regarding energy is relatively small and the error bars are covered by the data points. In the following illustration, they have been enlarged for easier reference.
In the enlarged figure, only the data points and legends within the energy range of 0-4.5 MeV are retained, and the retained legends are consistent with Fig. 7.
-
In present work, the cross-sections of 39K(n, p)39Ar reaction were determined by the combined detection method of NAA and NGMS techniques. The cross-sections data were obtained by activated sample and monitor of 103.84±16.33, 109.76±15.88, 150.27±24.19 mb at mean neutron energy 2.56±0.08, 2.69±0.08, 2.96±0.12 MeV respectively. Moreover, the excitation function of cross-sections was calculated theoretically by TALYS-1.97 codes. The measured cross-sections of 39K(n, p)39Ar were compared with the evaluation functions of ENDF/B-VIII.0, JEFF-3.3, TENDL-2021, BROND-3.1, JENDL-5 databases, the previously available literature data, and theoretical calculated evaluation function of TALYS-1.97.
Compared with reported literature data in EXFOR database and evaluated data from five databases and the theoretical calculation from TALYS-1.97, the measured cross-sections of 39K(n, p)39Ar in this study are proved to be reliable enough to fill the data gaps of databases. The absolute measurement of 39K, 39Ar content and γ-ray full peak counts with the high sensitivity and resolution instruments in NAA and NGMS combined detection method avoid peak overlap problem, and the precision of the cross-sections of 39K(n, p)39Ar reaction obviously have been improved by high resolution laboratory apparatus.
Although there is still a problem of insufficient argon production, the problem will be gradually solved as the neutron generator yield increases and the resolution of the mass spectrometer improves. It is foreseeable that the method combined with NAA and NGMS will be more accurate in measuring neutron reaction cross-sections in the future. Furthermore the combined method of NAA and NGMS can be applied to the process of 40Ar/39Ar dating to replace nuclear reactor irradiation and improve the problems of Ar nuclear recoil and excessive interference reactions.
Determination of the cross section of 39K(n, p)39Ar reaction induced by D-D neutrons with neutron activation and noble gas mass spectrometry techniques
- Received Date: 2025-07-10
- Available Online: 2026-04-01
Abstract: The cross-sections of 39K(n, p)39Ar at the 2-3 MeV energy play an important role in nuclear structure research and 40Ar/39Ar geochronology application. Due to the limitations of n-3He coincidence technology and counting instruments, the published data from the literature are before 1967, and the existing data are scarce and of significant divergence. Meanwhile, there are large discrepancies between the measured and evaluation results. By taking advantage of the high sensitivity and resolution noble gas mass spectrometer at Institute of Geology and Geophysics, Chinese Academy of Sciences (IGGCAS), the cross-section of 39K(n, p)39Ar were measured by the methods of combined neutron activity analysis and noble gas mass spectrometry techniques, and the uncertainties were discussed in detail. The cross-section of 39K(n, p)39Ar were measured as 103.84 ± 16.33, 109.76 ± 15.88, 150.27 ± 24.19 mb, at 2.56 ± 0.08, 2.69 ± 0.08, 2.96 ± 0.12 MeV energies respectively. The measured data filled the data gaps and provided more accurate data support for 40Ar/39Ar dating. Furthermore the theoretical excitation function of 39K(n, p)39Ar was calculated using TALYS-1.97 computer codes. Then the experimentally determined cross-sections were analyzed by comparing with literature data available in EXFOR database and evaluated nuclear data in ENDF/B-VIII.0, JEFF-3.2, TENDL-2021, BROND-3.1, and JENDL-5 databases. According to comparative results, the measured cross-sections of 39K(n, p)39Ar exhibit a rapid energy-dependent increase between 2-3 MeV, aligning with higher literature values and resolving previous discrepancies. Compared with the previously reported data, the precision of determined cross-sections in this work have great improvement. The comparison of measured data indicates that the combined detection method of neutron activity analysis and noble gas mass spectrometry techniques is suitable for measuring cross-sections of long-life product nuclei nuclear reaction and the application of 40Ar/39Ar geochronology with D-D neutron source.


 DownLoad: