


 Abstract
 HTML
HTML Reference
 Related
 PDF
PDF


-
Understanding the fusion of neutron-rich light nuclei is essential for both nuclear astrophysics and nuclear structure physics [1, 2].
From an astrophysical perspective, neutron-rich fusion reactions contribute to the heat budget of accreting neutron-star crusts and play a key role in triggering superbursts, exceptionally energetic and long-lived X-ray bursts [3, 4]. Compared to normal Type I bursts, a superburst releases about three orders of magnitude more energy and lasts roughly a thousand times longer. The event is thought to be initiated by carbon-carbon fusion in the deep crust, where heat generated from pycnonuclear fusion of neutron-rich isotopes, such as 24O+24O and
$^{34}{\rm{Ne}}$ +$^{34}{\rm{Ne}}$ , is conducted upward and ignites residual carbon ash [5−7]. Determining accurate reaction rates for these neutron-rich systems is therefore critical for modeling crust heating and ignition condition in accreting neutron stars.At the same time, studies of neutron-rich fusion reactions are directly connected to the long standing question of nuclear stability. Around
$Z \approx 114$ and$N \approx 184$ , theoretical models predict an “island of stability” where superheavy nuclei could have relatively long half-lives [8, 9]. Conventional experiments using stable beams have limited reach into this region; however, neutron-rich projectiles could offer an alternative route. The interplay between extended neutron distributions—which may enhance barrier penetration—and weak binding—which can promote breakup—makes it complicated in theory to predict the reaction cross section. Hence, the investigation of the fusion reactions induced by neutron-rich beams not only help us constrain astrophysical scenarios but also sheds light on how excess neutrons affect nuclear reaction dynamics.Experiments using weakly bound or neutron-rich projectiles have yielded mixed conclusions regarding fusion enhancement. The measurement of
$^6{\rm{He}}$ +$^{208}{\rm{Pb}}$ at Louvain-la-Neuve [10] found no substantial sub-barrier enhancement, with large fission yields explained by two-neutron transfer processes.Carnelli et al. [11] performed systematic fusion studies of
$^{10-15}{\rm{C}}$ +$^{12}{\rm{C}}$ using the MUSIC active target at Argonne National Laboratory. Their average cross sections in the range of$E_{\mathrm{c.m.}}$ = 14–17 MeV followed the expectations of coupled-channel and São Paulo model calculations, confirming the absence of exotic enhancement.More recently, Singh et al. [12] studied the fusion of
$^{19}{\rm{O}}$ +$^{12}{\rm{C}}$ using the RIB facility at Florida State University (FSU) at energies from$E_{\mathrm{c.m.}}$ =7.4 to 18 MeV. The averaged fusion cross section of$^{19}{\rm{O}}$ +$^{12}{\rm{C}}$ in the range of$E_{\mathrm{c.m.}}$ =12–18 MeV is$\approx \,$ 37% higher than that of$^{16,18}{\rm{O}}$ +$^{12}{\rm{C}}$ , suggesting that the extended density tails of the unpaired neutrons increase the fusion cross section significantly. However, a recent measurement of$^{19}{\rm{O}}$ +$^{12}{\rm{C}}$ reported a 34% reduction in the fusion cross section for$E_{\rm{c.m.}}>$ 13 MeV and good agreement with earlier data for$E_{\rm{c.m.}}<10$ MeV [13]. A pronounced suppression feature was also observed near$E_{\rm{c.m.}}\sim12$ MeV, for which no theoretical explanation was offered.In this paper, we present a new measurement of the
$^{19}{\rm{O}}$ +$^{12}{\rm{C}}$ fusion excitation function using an active-target time projection chamber, covering$9.7 \lt E_{\rm{c.m.}} \lt 19$ MeV. Our results are compared with the two previous measurements, and the systematic behavior of the$^{16,17,18,19}{\rm{O}}$ +$^{12}{\rm{C}}$ fusion systems is examined. -
Understanding the fusion of neutron-rich light nuclei is essential for both nuclear astrophysics and nuclear structure physics [1, 2].
From an astrophysical perspective, neutron-rich fusion reactions contribute to the heat budget of accreting neutron-star crusts and play a key role in triggering superbursts, exceptionally energetic and long-lived X-ray bursts [3, 4]. Compared to normal Type I bursts, a superburst releases about three orders of magnitude more energy and lasts roughly a thousand times longer. The event is thought to be initiated by carbon-carbon fusion in the deep crust, where heat generated from pycnonuclear fusion of neutron-rich isotopes, such as 24O+24O and
$^{34}{\rm{Ne}}$ +$^{34}{\rm{Ne}}$ , is conducted upward and ignites residual carbon ash [5−7]. Determining accurate reaction rates for these neutron-rich systems is therefore critical for modeling crust heating and ignition condition in accreting neutron stars.At the same time, studies of neutron-rich fusion reactions are directly connected to the long standing question of nuclear stability. Around
$Z \approx 114$ and$N \approx 184$ , theoretical models predict an “island of stability” where superheavy nuclei could have relatively long half-lives [8, 9]. Conventional experiments using stable beams have limited reach into this region; however, neutron-rich projectiles could offer an alternative route. The interplay between extended neutron distributions—which may enhance barrier penetration—and weak binding—which can promote breakup—makes it complicated in theory to predict the reaction cross section. Hence, the investigation of the fusion reactions induced by neutron-rich beams not only help us constrain astrophysical scenarios but also sheds light on how excess neutrons affect nuclear reaction dynamics.Experiments using weakly bound or neutron-rich projectiles have yielded mixed conclusions regarding fusion enhancement. The measurement of
$^6{\rm{He}}$ +$^{208}{\rm{Pb}}$ at Louvain-la-Neuve [10] found no substantial sub-barrier enhancement, with large fission yields explained by two-neutron transfer processes.Carnelli et al. [11] performed systematic fusion studies of
$^{10-15}{\rm{C}}$ +$^{12}{\rm{C}}$ using the MUSIC active target at Argonne National Laboratory. Their average cross sections in the range of$E_{\mathrm{cm}}$ = 14–17 MeV followed the expectations of coupled-channel and São Paulo model calculations, confirming the absence of exotic enhancement.More recently, Singh et al. [12] studied the fusion of
$^{19}{\rm{O}}$ +$^{12}{\rm{C}}$ using the RIB facility at Florida State University (FSU) at energies from$E_{\mathrm{cm}}$ = 7.4 to 18 MeV. The averaged fusion cross section of$^{19}{\rm{O}}$ +$^{12}{\rm{C}}$ in the range of$E_{\mathrm{cm}}$ =12–18 MeV is$\approx$ 37% higher than that of$^{16,18}{\rm{O}}$ +$^{12}{\rm{C}}$ , suggesting that the extended density tails of the unpaired neutrons increase the fusion cross section significantly. However, a recent measurement of$^{19}{\rm{O}}$ +$^{12}{\rm{C}}$ reported a 34% reduction in the fusion cross section for$E_{\rm{c.m.}}>$ 13 MeV and good agreement with earlier data for$E_{\rm{c.m.}}<10$ MeV [13]. A pronounced suppression feature was also observed near$E_{\rm{c.m.}}\sim12$ MeV, for which no theoretical explanation was offered.In this paper, we present a new measurement of the
$^{19}{\rm{O}}$ +$^{12}{\rm{C}}$ fusion excitation function using an active-target time projection chamber, covering$9.7 < E_{\rm{c.m.}} < 19$ MeV. Our results are compared with the two previous measurements, and the systematic behavior of the$^{16,17,18,19}{\rm{O}}$ +$^{12}{\rm{C}}$ fusion systems is examined. -
The production of the
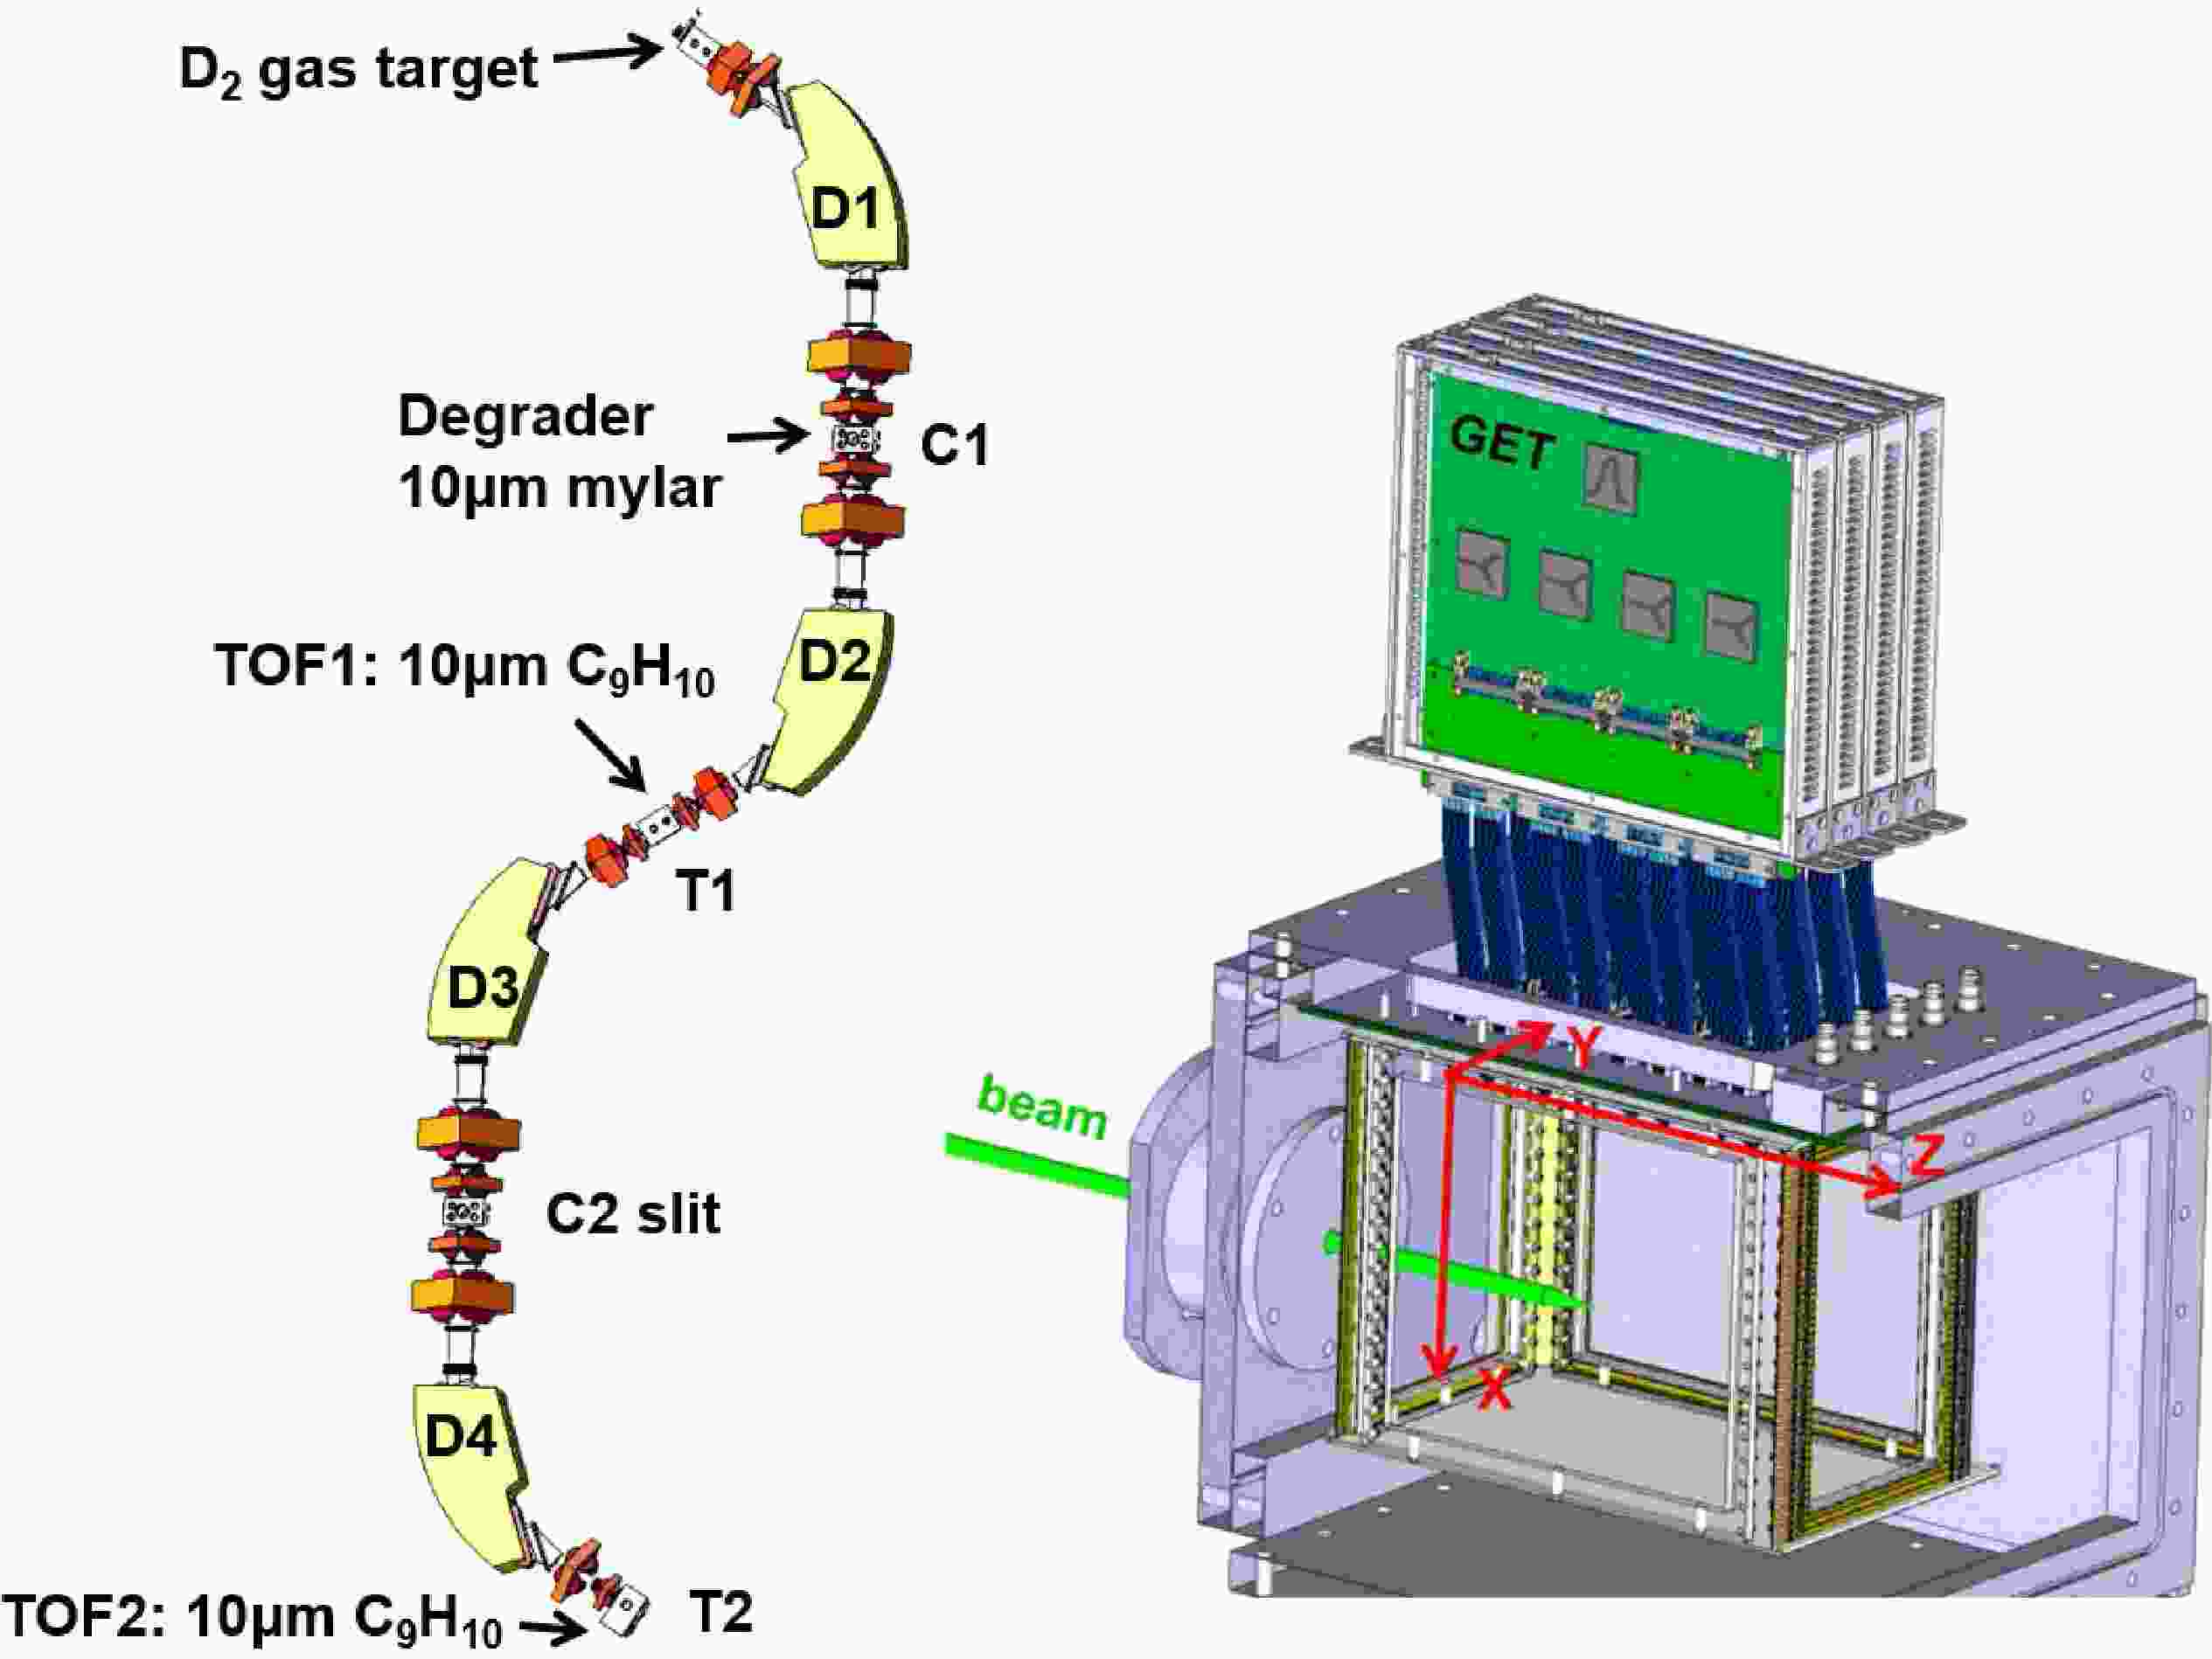
$^{19}{\rm{O}}$ beam using the RIBLL1 recoil separator is illustrated in Fig. 1 [14]. A primary$^{18}{\rm{O}} ^{8+}$ beam at 6.17 MeV/u (260 enA) from HIRFL [15] impinged on a liquid-nitrogen–cooled deuterium gas target (150 mbar) located in the$T_0$ chamber of the RIBLL1 spectrometer, producing$^{19}{\rm{O}} ^{8+}$ through the$^{18}{\rm{O}}$ (d,p)$^{19}{\rm{O}}$ reaction. A 10-μm Mylar degrader positioned at the first dispersion plane (C1) reduced the beam energy before the ions were refocused in the T1 chamber.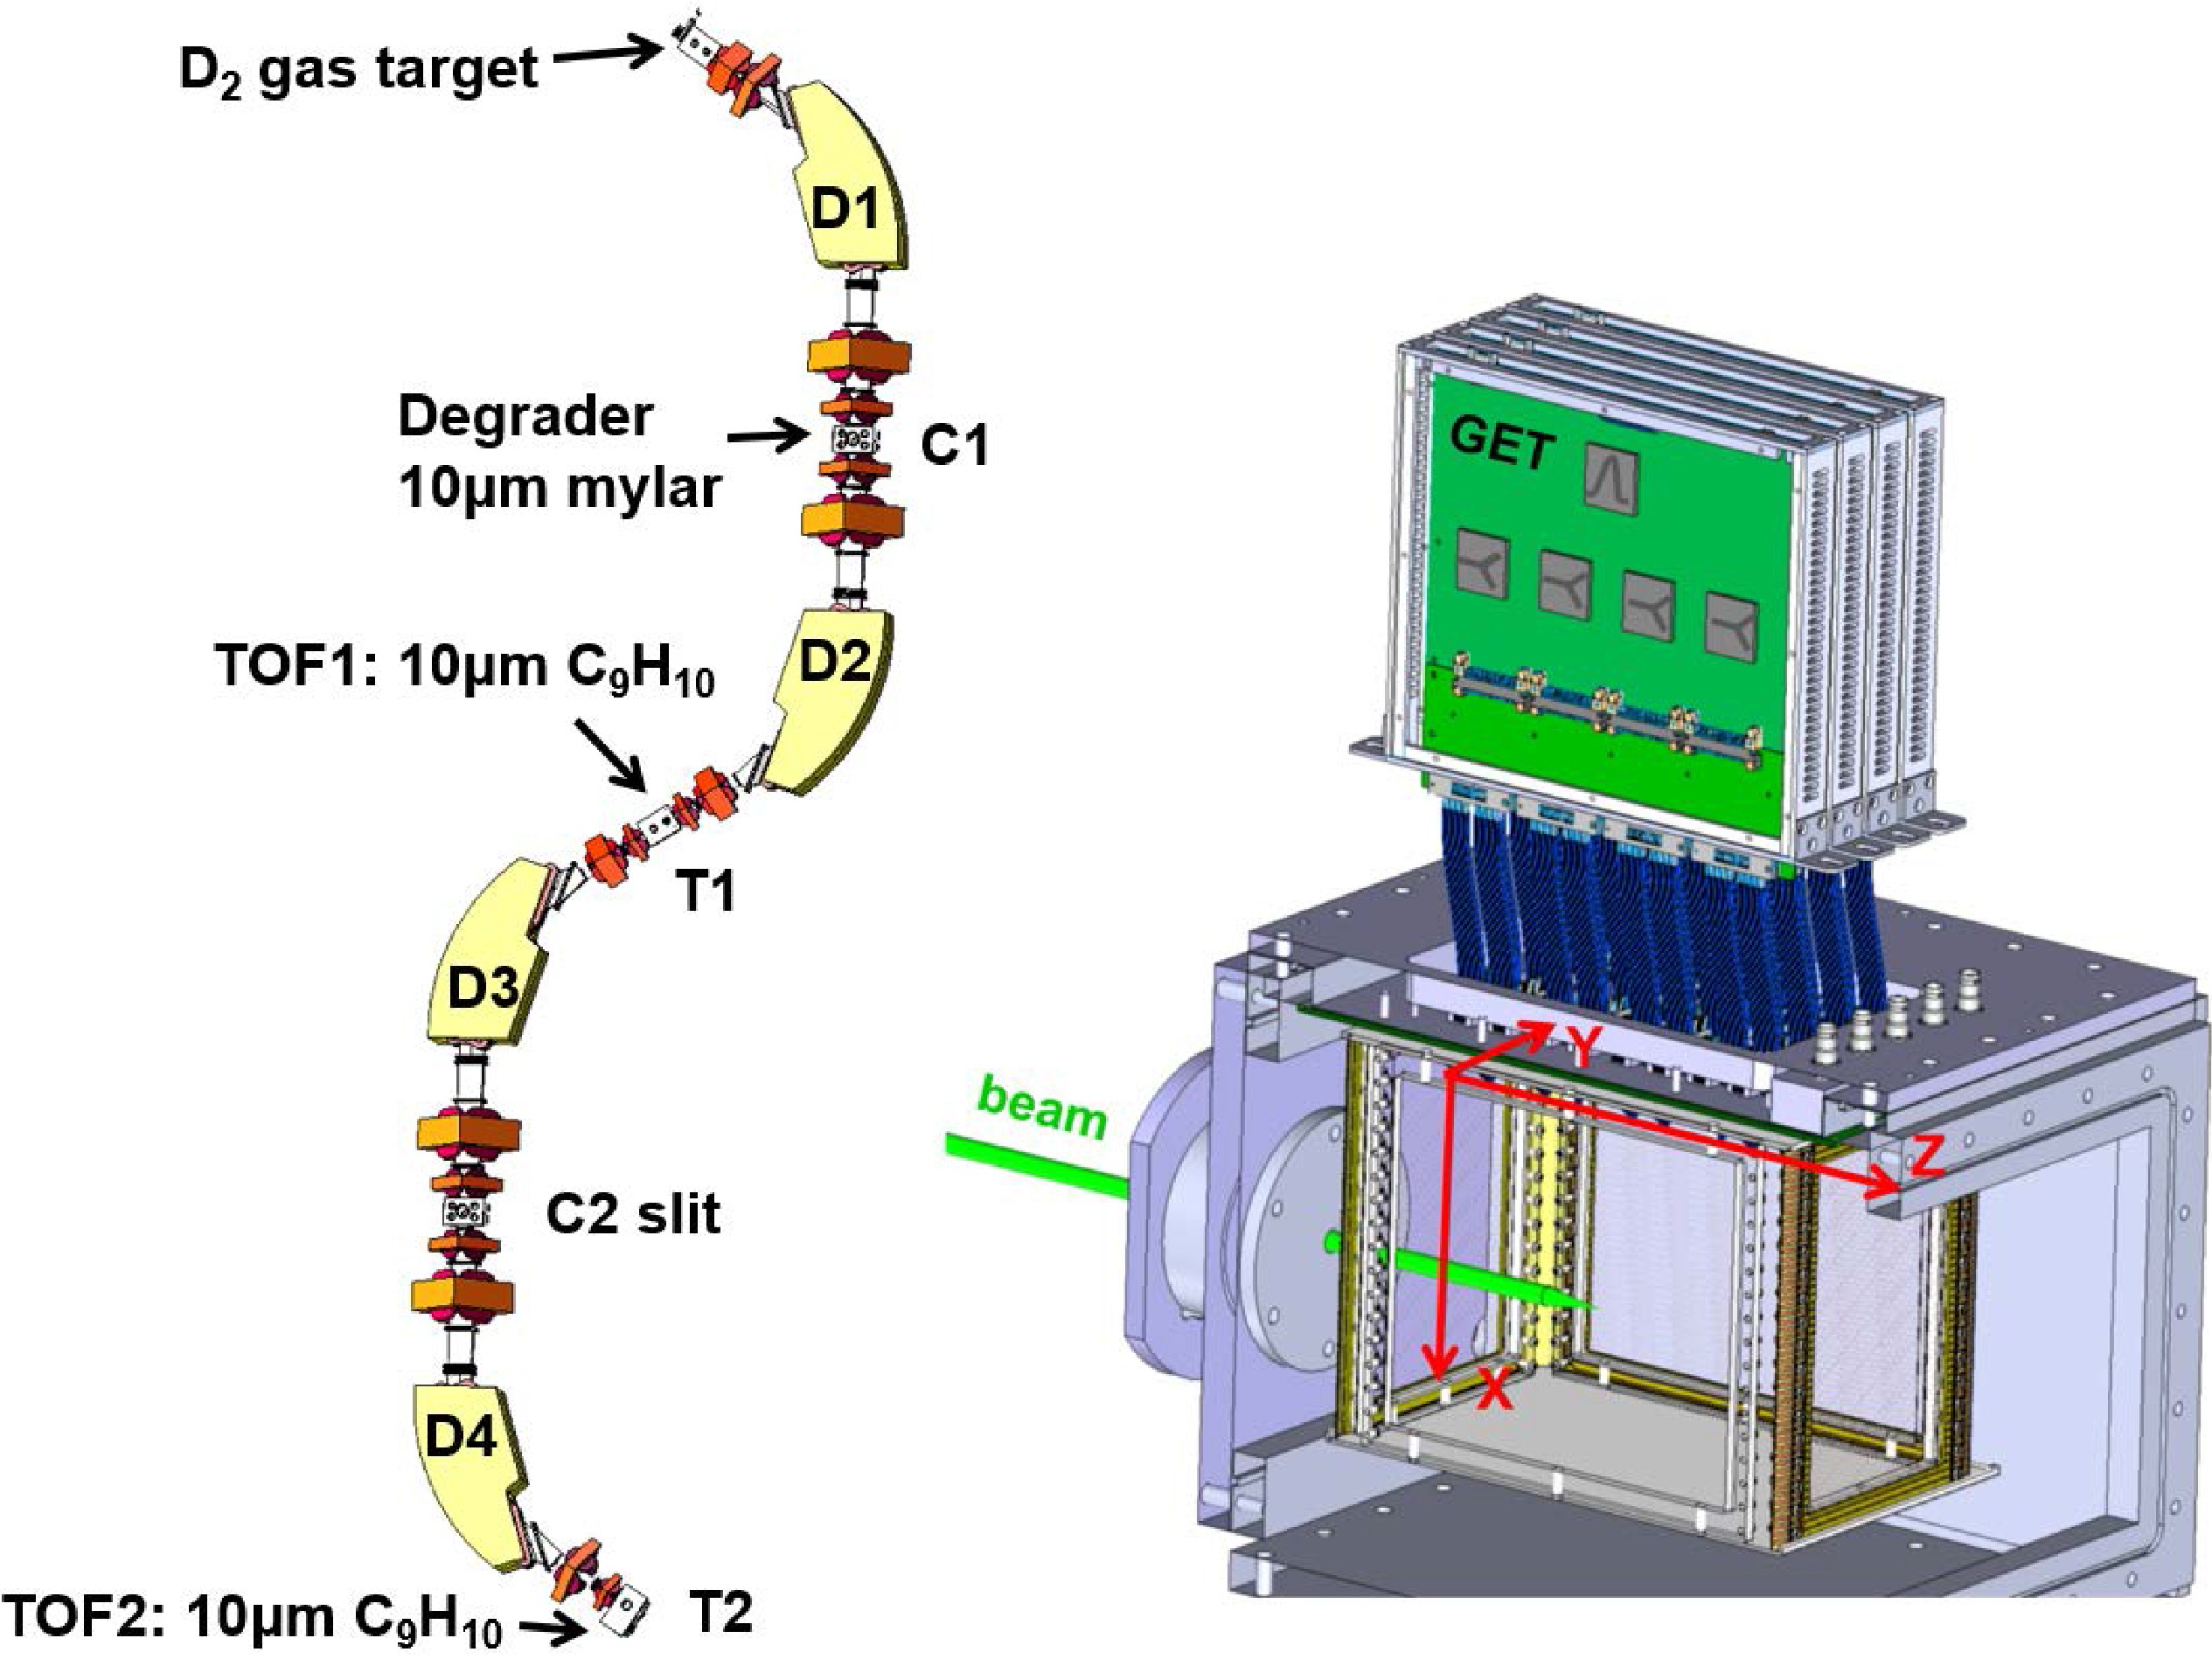
Figure 1. (color online) Drawing of the RIBLL1 and pMate-TPC, with the definition of coordinates in TPC.
The beam was subsequently transported from T1 to T2 using the second stage of RIBLL1. Two 10-μm plastic scintillators placed in the T1 and T2 chambers provided Time-of-Flight (TOF) information, and a 300-μm silicon detector downstream of the T2 scintillator measured the total kinetic energy. To suppress contamination from
$^{19}{\rm{F}}$ , the 7+ charge state of$^{19}{\rm{O}}$ was selected.From the TOF–energy correlations obtained with the plastic detectors and the silicon detector (Fig. 2), the secondary beam intensity was determined to be
$10^{3}$ –$10^{4}$ pps, with a purity of approximately 70%. The main contaminants were$^{18}{\rm{O}} ^{6+}$ and$^{18}{\rm{O}} ^{7+}$ at energies of 51.6 and 76.6 MeV, respectively.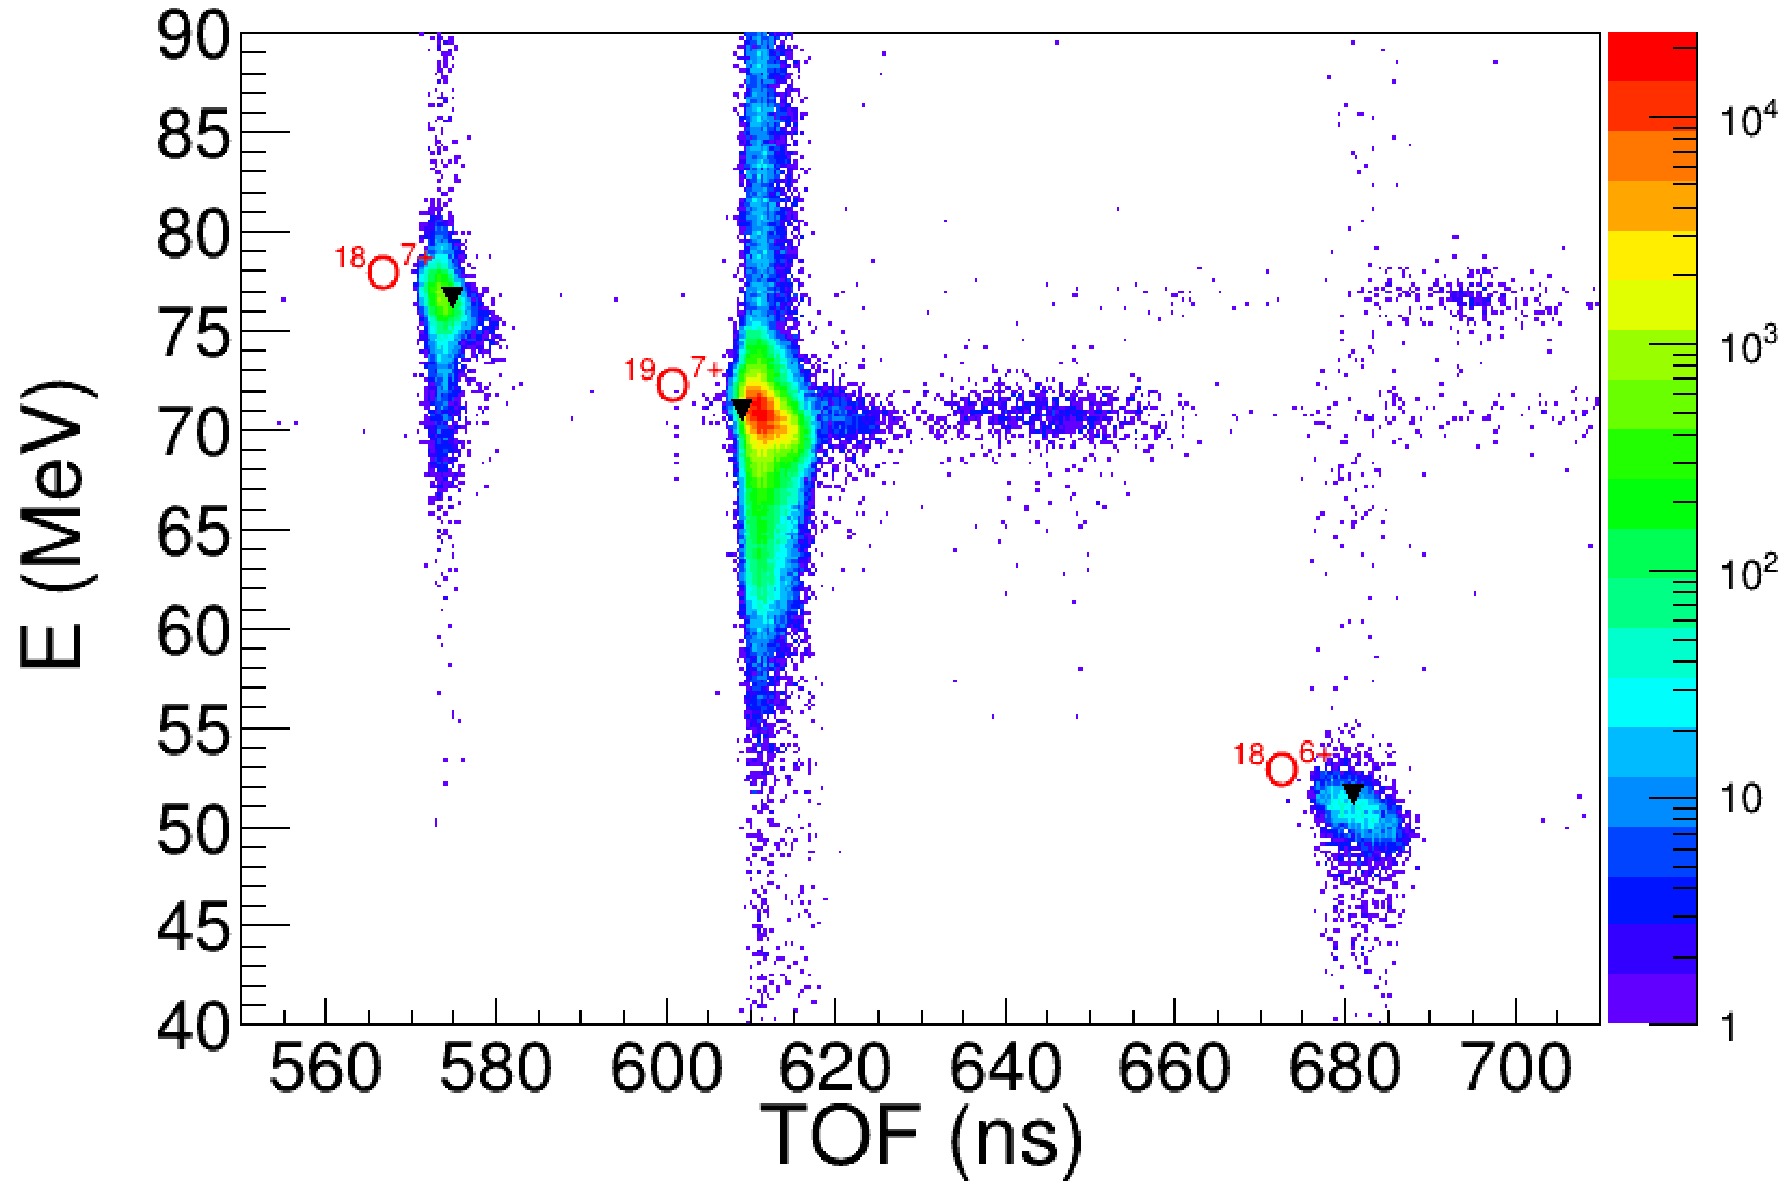
Figure 2. (color online) The E vs. TOF spectrum measured in the T2 chamber with two plastic detectors and a silicon detector.
The prototype MATE-TPC (pMATE-TPC) has an active volume of 10 cm (W) × 20 cm (L) × 25 cm (H) [16]. The drawing of pMATE-TPC is shown in Fig. 1. The field cage uses three layers of Be–Cu wires (diameter 0.1 mm) and double thick-GEM amplification (0.3 mm). The rectangular readout plane comprises 1024 pads of the size of 3.1 mm × 6.3 mm. Signal processing is performed through 1024-channels GET electronics. In this paper, the beam direction is defined as the positive Z-axis, the direction perpendicular to it in the readout plane is defined as the Y-axis, and the electric-field direction is taken as the X-axis, as illustrated in Fig. 1.
pMATE-TPC located at 1.15 m downstream away from the T2 chamber. It was separated from the upstream vacuum by a circular 15 mm-diameter window made of a 10-µm-thick Mylar foil. pMATE-TPC was filled with a Isobutane gas at a pressure of 100 mbar to act as the
$^{12}{\rm{C}}$ target. The$^{19}{\rm{O}}$ beam energy just before the second plastic detector in the T2 chamber was determined to be 72.0 MeV with the magnetic field setting of the last dipole of RIBLL1.During the experiment, the trigger was generated by the signals of the GEM surface layer just next to the readout pad. This signal was vetoed by 6 pads in the beam path, located in the last two columns along the Z-axis, to reject events that penetrated the TPC active volume. The busy signals generated by the GET system introduce a certain amount of dead time. A dead-time efficiency correction was obtained from the scaler by recording the triggers with or without the busy signal. It is therefore applied to correct the counts of the measured fusion events. The event rate generated by the GEM signal was around 1.5-3.3 kHz. After being vetoed by the veto pads and busy signal, the trigger rate was about 70-200 Hz. The gain of TPC was optimized for fusion-residue. With a threhsold of 0.12 MeV on each pad, our detector only detected heavy ion and some α particles and was not sensitive to protons and neutrons.
-
The production of the
$^{19}{\rm{O}}$ beam using the RIBLL1 recoil separator is illustrated in Fig. 1 [14]. A primary$^{18}{\rm{O}} ^{8+}$ beam at 6.17 MeV/u (260 enA) from HIRFL [15] impinged on a liquid-nitrogen–cooled deuterium gas target (150 mbar) located in the$T_0$ chamber of the RIBLL1 spectrometer, producing$^{19}{\rm{O}} ^{8+}$ through the$^{18}{\rm{O}}$ (d, p)$^{19}{\rm{O}}$ reaction. A 10-μm Mylar degrader positioned at the first dispersion plane (C1) reduced the beam energy before the ions were refocused in the T1 chamber.
Figure 1. (color online) Drawing of the RIBLL1 and pMate-TPC, with the definition of coordinates in TPC.
The beam was subsequently transported from T1 to T2 using the second stage of RIBLL1. Two 10-μm plastic scintillators placed in the T1 and T2 chambers provided Time-of-Flight (TOF) information, and a 300-μm silicon detector downstream of the T2 scintillator measured the total kinetic energy. To suppress contamination from
$^{19}{\rm{F}}$ , the 7+ charge state of$^{19}{\rm{O}}$ was selected.From the TOF–energy correlations obtained with the plastic detectors and the silicon detector (Fig. 2), the secondary beam intensity was determined to be
$10^{3}$ –$10^{4}$ pps, with a purity of approximately 70%. The main contaminants were$^{18}{\rm{O}} ^{6+}$ and$^{18}{\rm{O}} ^{7+}$ at energies of 51.6 and 76.6 MeV, respectively.
Figure 2. (color online) The E vs. TOF spectrum measured in the T2 chamber with two plastic detectors and a silicon detector.
The prototype MATE-TPC (pMATE-TPC) has an active volume of 10 cm (W) × 20 cm (L) × 25 cm (H) [16]. The drawing of pMATE-TPC is shown in Fig. 1. The field cage uses three layers of Be–Cu wires (diameter 0.1 mm) and double thick-GEM amplification (0.3 mm thick). The rectangular readout plane comprises 1024 pads of the size of 3.1 mm × 6.3 mm. Signal processing is performed through 1024-channels GET electronics. In this paper, the beam direction is defined as the positive Z-axis, the direction perpendicular to it in the readout plane is defined as the Y-axis, and the electric-field direction is taken as the X-axis, as illustrated in Fig. 1.
pMATE-TPC located at 1.15 m downstream away from the T2 chamber. It was separated from the upstream vacuum by a circular 15 mm-diameter window made of a 10-µm-thick Mylar foil. pMATE-TPC was filled with a Isobutane gas at a pressure of 100 mbar to act as the
$^{12}{\rm{C}}$ target. The$^{19}{\rm{O}}$ beam energy just before the second plastic detector in the T2 chamber was determined to be 72.0 MeV with the magnetic field setting of the last dipole of RIBLL1.During the experiment, the trigger was generated by the signals of the GEM surface layer just next to the readout pad. This signal was vetoed by 6 pads in the beam path, located in the last two columns along the Z-axis, to reject events that penetrated the TPC active volume. The busy signals generated by the GET system introduce a certain amount of dead time. A dead-time efficiency correction was obtained from the scaler by recording the triggers with or without the busy signal. It is therefore applied to correct the counts of the measured fusion events. The event rate generated by the GEM signal was around 1.5–3.3 kHz. After being vetoed by the veto pads and busy signal, the trigger rate was about 70–200 Hz. The gain of TPC was optimized for fusion-residue. With a threhsold of 0.12 MeV on each pad, our detector only detected heavy ion and some α particles and was not sensitive to protons and neutrons.
-
The production of the
$^{19}{\rm{O}}$ beam using the RIBLL1 recoil separator is illustrated in Fig. 1 [14]. A primary$^{18}{\rm{O}} ^{8+}$ beam at 6.17 MeV/u (260 enA) from HIRFL [15] impinged on a liquid-nitrogen–cooled deuterium gas target (150 mbar) located in the$T_0$ chamber of the RIBLL1 spectrometer, producing$^{19}{\rm{O}} ^{8+}$ through the$^{18}{\rm{O}}$ (d,p)$^{19}{\rm{O}}$ reaction. A 10-μm Mylar degrader positioned at the first dispersion plane (C1) reduced the beam energy before the ions were refocused in the T1 chamber.
Figure 1. (color online) Drawing of the RIBLL1 and pMate-TPC, with the definition of coordinates in TPC.
The beam was subsequently transported from T1 to T2 using the second stage of RIBLL1. Two 10-μm plastic scintillators placed in the T1 and T2 chambers provided Time-of-Flight (TOF) information, and a 300-μm silicon detector downstream of the T2 scintillator measured the total kinetic energy. To suppress contamination from
$^{19}{\rm{F}}$ , the 7+ charge state of$^{19}{\rm{O}}$ was selected.From the TOF–energy correlations obtained with the plastic detectors and the silicon detector (Fig. 2), the secondary beam intensity was determined to be
$10^{3}$ –$10^{4}$ pps, with a purity of approximately 70%. The main contaminants were$^{18}{\rm{O}} ^{6+}$ and$^{18}{\rm{O}} ^{7+}$ at energies of 51.6 and 76.6 MeV, respectively.
Figure 2. (color online) The E vs. TOF spectrum measured in the T2 chamber with two plastic detectors and a silicon detector.
The prototype MATE-TPC (pMATE-TPC) has an active volume of 10 cm (W) × 20 cm (L) × 25 cm (H) [16]. The drawing of pMATE-TPC is shown in Fig. 1. The field cage uses three layers of Be–Cu wires (diameter 0.1 mm) and double thick-GEM amplification (0.3 mm). The rectangular readout plane comprises 1024 pads of the size of 3.1 mm × 6.3 mm. Signal processing is performed through 1024-channels GET electronics. In this paper, the beam direction is defined as the positive Z-axis, the direction perpendicular to it in the readout plane is defined as the Y-axis, and the electric-field direction is taken as the X-axis, as illustrated in Fig. 1.
pMATE-TPC located at 1.15 m downstream away from the T2 chamber. It was separated from the upstream vacuum by a circular 15 mm-diameter window made of a 10-µm-thick Mylar foil. pMATE-TPC was filled with a Isobutane gas at a pressure of 100 mbar to act as the
$^{12}{\rm{C}}$ target. The$^{19}{\rm{O}}$ beam energy just before the second plastic detector in the T2 chamber was determined to be 72.0 MeV with the magnetic field setting of the last dipole of RIBLL1.During the experiment, the trigger was generated by the signals of the GEM surface layer just next to the readout pad. This signal was vetoed by 6 pads in the beam path, located in the last two columns along the Z-axis, to reject events that penetrated the TPC active volume. The busy signals generated by the GET system introduce a certain amount of dead time. A dead-time efficiency correction was obtained from the scaler by recording the triggers with or without the busy signal. It is therefore applied to correct the counts of the measured fusion events. The event rate generated by the GEM signal was around 1.5-3.3 kHz. After being vetoed by the veto pads and busy signal, the trigger rate was about 70-200 Hz. The gain of TPC was optimized for fusion-residue. With a threhsold of 0.12 MeV on each pad, our detector only detected heavy ion and some α particles and was not sensitive to protons and neutrons.
-
After the 72.0 MeV
$^{19}{\rm{O}}$ beam passing through the plastic scintillator with a thickness of 10 μm and the Mylar window of the TPC with a thickness of 10 μm, the energy was determined to be 62.2 MeV, according to the energy-loss calculation using SRIM [17]. The LISE calculation based on ATIMA yields an energy of 62.4 MeV [18], only 0.3% higher than the SRIM calculation. The energy spread was measured to be 1.8% (FWHM) using a Si detector placed in vacuum behind the Mylar windows in the TPC chamber.The TPC chamber was filled with isobutane gas at a pressure of 100 mbar. The resulting energy-loss curve of the unreacted
$^{18}{\rm{O}} ^{7+}$ and$^{19}{\rm{O}}$ beam particles along their incident direction (Z-axis) is shown in Fig. 3. In this paper, pads sharing the same Z coordinate are referred to as belonging to the same column, with the column number defined from 0 to 31 from the entrance to the exit of the beam. The energy loss at each column is the sum of the energy deposit on the pads with the same column number. The range of the beam particle was determined by fitting the energy losses in the last four columns to identify the point at which the energy loss drops to zero. It should be noted that the fraction of$^{18}{\rm{O}} ^{6+,7+}$ observed in TPC is 1.3% and 0.7%, respectively. The significant improvement of the 19O purity benefits from the selection with a TOF cut. With the incident energy of 62.2 MeV of the$^{19}{\rm{O}}$ beam after the TPC window, the energy loss in the isobutane gas was simulated using SRIM, and by tuning the gas density, the observed range was well reproduced by the simulation. From this comparison, the energy of the beam particle at the entrance of the TPC active volume was determined to be 49.7 MeV, and the energy loss in each column was normalized to the corresponding simulated energy deposition. The uncertainty of the incident beam energy of each pad was estimated by varying the gas density within$\pm$ 0.95%. The beam energy uncertainty was determined as 0.18 MeV at the beam energy of 44 MeV, 0.44 MeV at the beam energy of 25.6 MeV.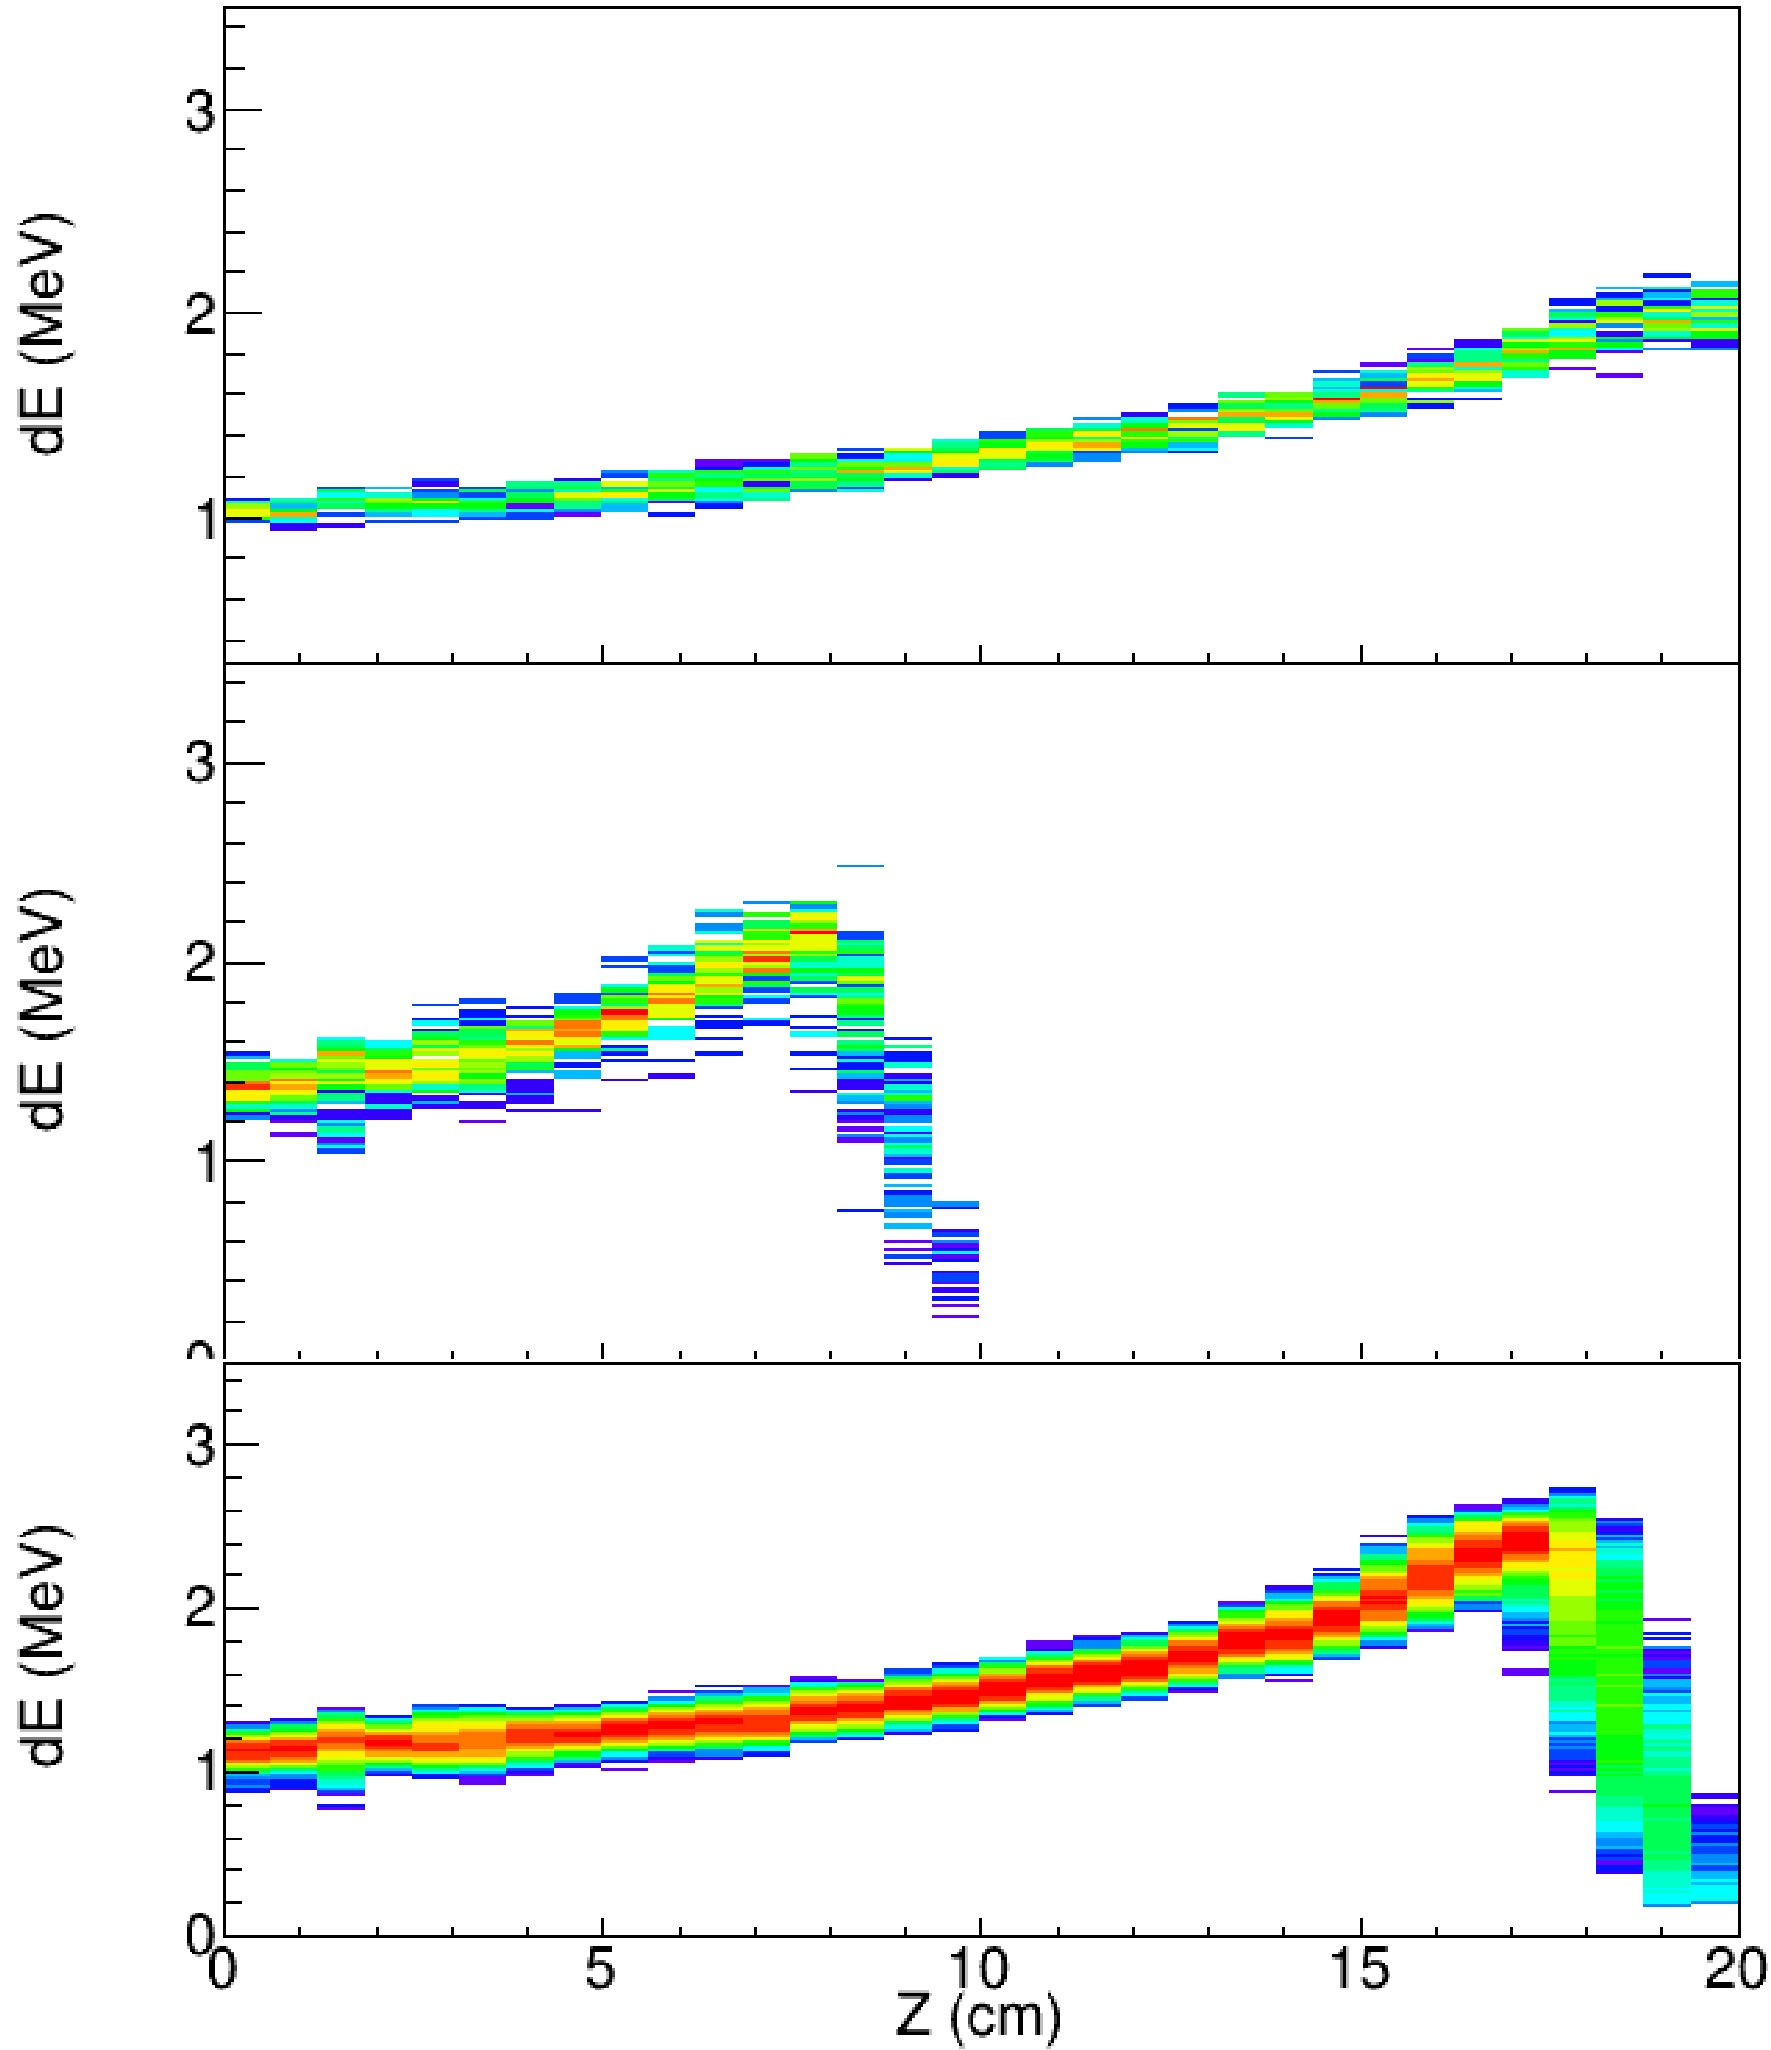
Figure 3. (color online) (Upper panel) The calibrated energy loss curve for the
$^{18}{\rm{O}} ^{7+}$ beam; (Mid panel) The calibrated energy loss curve for the$^{18}{\rm{O}} ^{6+}$ beam; (Lower panel) The calibrated energy loss curve for the$^{19}{\rm{O}} {^{7+}}$ beam. -
The reaction vertex is obtained with the energy loss curve along the beam incident direction.
$ \mathrm{d}E(i) $ represents the energy loss in the$i-{\rm{th}}$ column. The recorded events were classified into two categories, reacted events and un-reacted events, based on the condition$ \mathrm{d}E(i) \gt 1.3\, \mathrm{d}E(i-1) $ , with i ranging from 1 to 31. The location of the i-th column was then identified as the reaction position, and the i-th column was labeled as the react_column in this paper. An example of the reaction vertex determination is shown in Fig. 4. The exact 3D location of the reaction vertex was determined by the intersection of tracks of the beam particle and reaction products.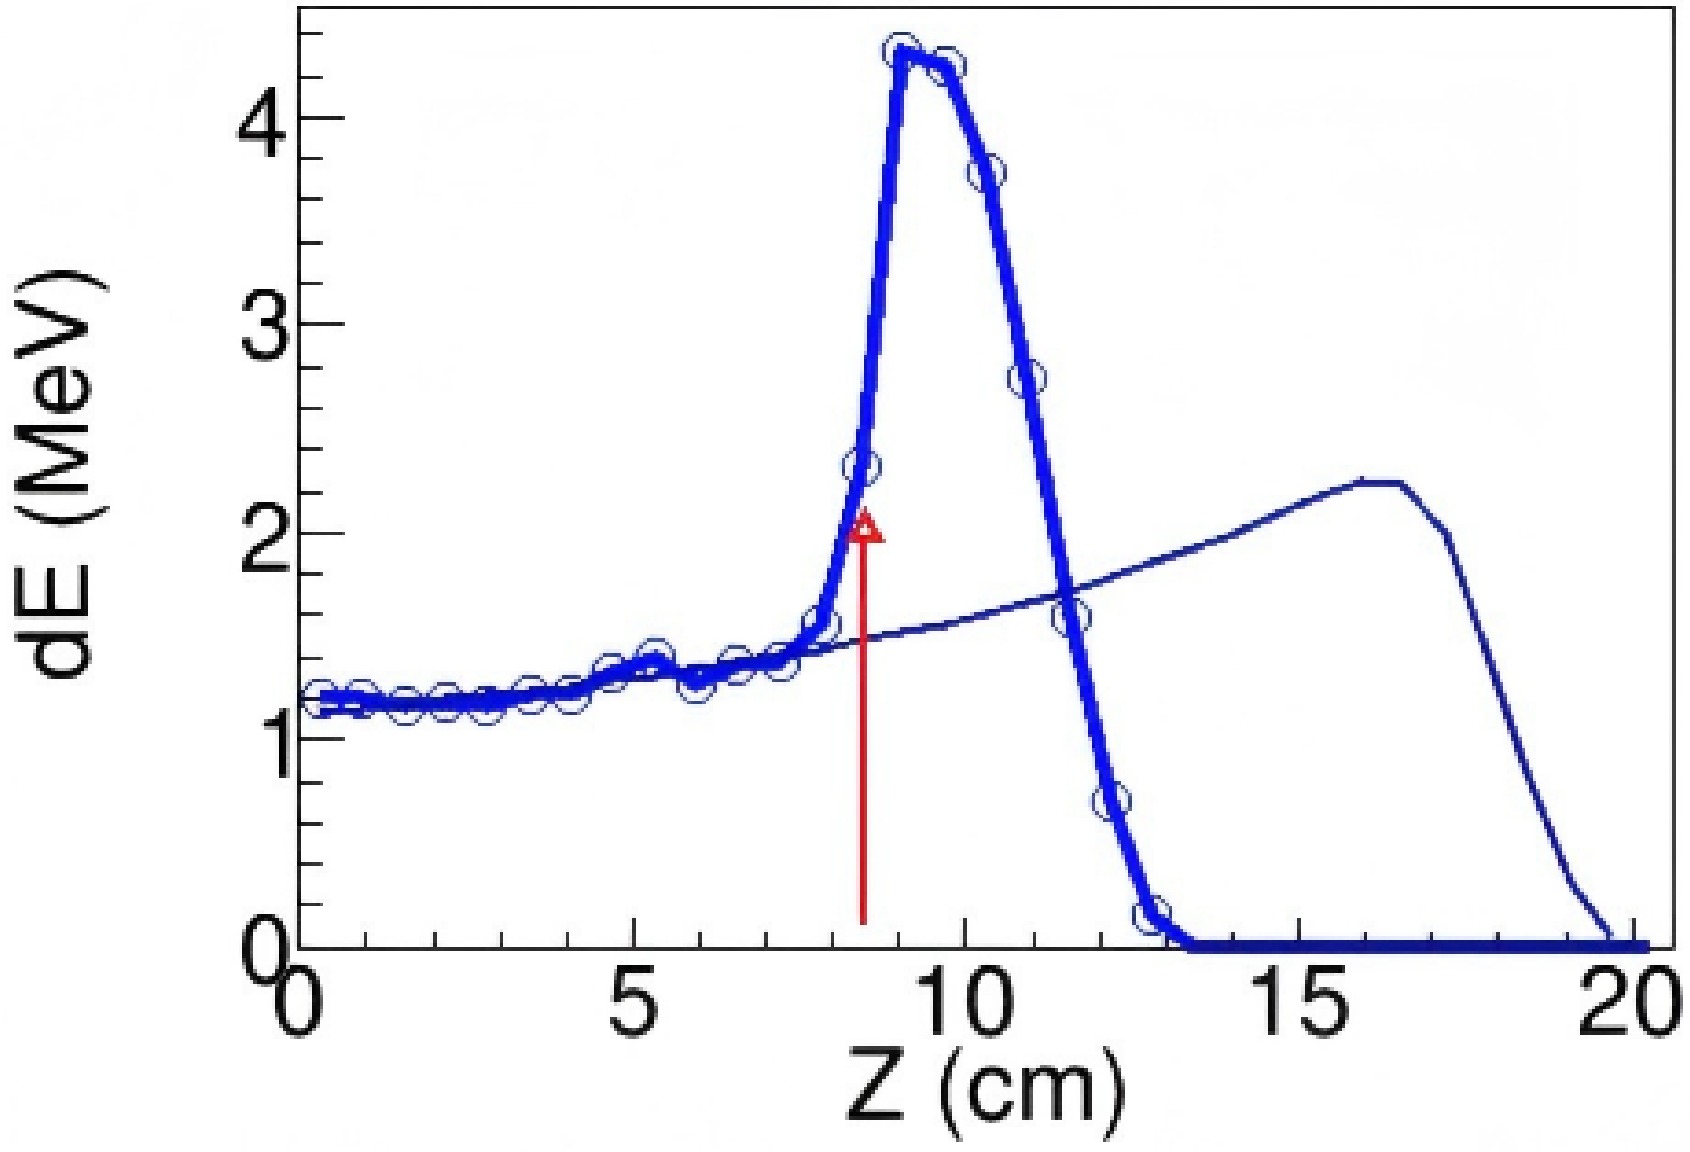
Figure 4. (color online) Determination of the reaction vertex based on the energy loss along the Z-axis. The red arrow marks the reaction-vertex position. The black line represents the pad-by-pad energy loss predicted by the SRIM calculation after tuning the gas density to match the measured beam energy and range.
-
The reaction vertex is obtained with the energy loss curve along the beam incident direction.
$dE(i)$ represents the energy loss in the$i-{\rm{th}}$ column. The recorded events were classified into two categories, reacted events and un-reacted events, based on the condition$dE(i) > 1.3 \, dE(i-1)$ , with i ranging from 1 to 31. The location of the i-th column was then identified as the reaction position, and the i-th column was labeled as the react_column in this paper. An example of the reaction vertex determination is shown in Fig. 4. The exact 3D location of the reaction vertex was determined by the intersection of tracks of the beam particle and reaction products.
Figure 4. (color online) Determination of the reaction vertex based on the energy loss along the Z-axis. The red arrow marks the reaction-vertex position. The black line represents the pad-by-pad energy loss predicted by the SRIM calculation after tuning the gas density to match the measured beam energy and range.
-
The main reaction channels expected from PACE4 calculations [18, 19] are as follows:
$ \begin{array}{*{20}{l}} &^{19}\mathrm{O} + {}^{12}\mathrm{C} \rightarrow {}^{30}\mathrm{Si} + n, & Q = 19.695 \;MeV, \\ &^{19}\mathrm{O} + {}^{12}\mathrm{C} \rightarrow {}^{30}\mathrm{Al} + p, & Q = 11.908 \;MeV, \\ &^{19}\mathrm{O} + {}^{12}\mathrm{C} \rightarrow {}^{29}\mathrm{Si} + 2n, & Q = 9.085 \;MeV, \\ &^{19}\mathrm{O} + {}^{12}\mathrm{C} \rightarrow {}^{29}\mathrm{Al} + p + n, & Q = 6.180 \;MeV, \\ &^{19}\mathrm{O} + {}^{12}\mathrm{C} \rightarrow {}^{29}\mathrm{Mg} + 2p, & Q = -0.633 \;MeV, \\ &^{19}\mathrm{O} + {}^{12}\mathrm{C} \rightarrow {}^{28}\mathrm{Si} + 3n, & Q = 0.612 \;MeV, \\ &^{19}\mathrm{O} + {}^{12}\mathrm{C} \rightarrow {}^{28}\mathrm{Al} + p + 2n, & Q = -3.248 \;MeV, \\ &^{19}\mathrm{O} + {}^{12}\mathrm{C} \rightarrow {}^{27}\mathrm{Mg} + \alpha, & Q = 15.495 \;MeV, \\ &^{19}\mathrm{O} + {}^{12}\mathrm{C} \rightarrow {}^{26}\mathrm{Mg} + \alpha + n, & Q = 9.051 \;MeV, \\ &^{19}\mathrm{O} + {}^{12}\mathrm{C} \rightarrow {}^{26}\mathrm{Na} + \alpha + p, & Q = 0.480 \;MeV, \\ &^{19}\mathrm{O} + {}^{12}\mathrm{C} \rightarrow {}^{25}\mathrm{Mg} + \alpha + 2n, & Q = -2.042 \;MeV, \\ &^{19}\mathrm{O} + {}^{12}\mathrm{C} \rightarrow {}^{25}\mathrm{Na} + \alpha + p + n, & Q = -5.094 \;MeV, \\ &^{19}\mathrm{O} + {}^{12}\mathrm{C} \rightarrow {}^{23}\mathrm{Ne} + 2\alpha, & Q = 3.637 \;MeV. \end{array} $
In this work, we focus on fusion reaction events occurring between the 5th and 18th columns, corresponding to the energy range of 10.0 MeV
$<E_{\rm{c.m.}}<$ 16.5 MeV. The average energy loss recorded in the first four pads was set to be less than 1.5 MeV to reject unrelated events, such as cases where two beam particles enter the TPC simultaneously. The tracks in each event were identified using the Hough-transformation method described in Ref. [20]. For the reacted events, after excluding the pads with the same Z coordinate as the react_column, the remaining tracks were classified into the beam-particle track and the reaction-product track(s). The exact location of reaction vertex was defined by the intersection of the tracks and the$react\_column$ . In this experiment, only one- or two-track reaction-product events were observed, as the TPC pad threshold was set to$\approx$ 0.12 MeV and thus was not sensitive to protons, neutrons, or some high-energy α particles. Accordingly, two types of reaction events,one-reaction-product-track events and two-reaction-product-track events, were distinguished based on the number of reaction-product tracks. In the following sections, we describe the selection of fusion-reaction events. -
The main reaction channels expected from PACE4 calculations [18, 19] are as follows:
$ \begin{array}{*{20}{l}} & ^{19}\mathrm{O}+^{12}\mathrm{C}\rightarrow^{30}\mathrm{Si}+n, & Q=19.695\; \mathrm{MeV}, \\ & ^{19}\mathrm{O}+^{12}\mathrm{C}\rightarrow^{30}\mathrm{Al}+p, & Q=11.908\; \mathrm{MeV}, \\ & ^{19}\mathrm{O}+^{12}\mathrm{C}\rightarrow^{29}\mathrm{Si}+2n, & Q=9.085\; \mathrm{MeV}, \\ & ^{19}\mathrm{O}+^{12}\mathrm{C}\rightarrow^{29}\mathrm{Al}+p+n, & Q=6.180\; \mathrm{MeV}, \\ & ^{19}\mathrm{O}+^{12}\mathrm{C}\rightarrow^{29}\mathrm{Mg}+2p, & Q=-0.633\; \mathrm{MeV}, \\ & ^{19}\mathrm{O}+^{12}\mathrm{C}\rightarrow^{28}\mathrm{Si}+3n, & Q=0.612\; \mathrm{MeV}, \\ & ^{19}\mathrm{O}+^{12}\mathrm{C}\rightarrow^{28}\mathrm{Al}+p+2n, & Q=-3.248\; \mathrm{MeV}, \\ & ^{19}\mathrm{O}+^{12}\mathrm{C}\rightarrow^{27}\mathrm{Mg}+\alpha, & Q=15.495\; \mathrm{MeV}, \\ & ^{19}\mathrm{O}+^{12}\mathrm{C}\rightarrow^{26}\mathrm{Mg}+\alpha+n, & Q=9.051\; \mathrm{MeV}, \\ & ^{19}\mathrm{O}+^{12}\mathrm{C}\rightarrow^{26}\mathrm{Na}+\alpha+p, & Q=0.480\; \mathrm{MeV}, \\ & ^{19}\mathrm{O}+^{12}\mathrm{C}\rightarrow^{25}\mathrm{Mg}+\alpha+2n, & Q=-2.042\; \mathrm{MeV}, \\ & ^{19}\mathrm{O}+^{12}\mathrm{C}\rightarrow^{25}\mathrm{Na}+\alpha+p+n, & Q=-5.094\; \mathrm{MeV}, \\ & ^{19}\mathrm{O}+^{12}\mathrm{C}\rightarrow^{23}\mathrm{Ne}+2\alpha, & Q=3.637\; \mathrm{MeV}.\end{array} $
In this work, we focus on fusion reaction events occurring between the 5th and 18th columns, corresponding to the energy range of 10.0 MeV
$<E_{\rm{c.m.}}<$ 16.5 MeV. The average energy loss recorded in the first four pads was set to be less than 1.5 MeV to reject unrelated events, such as cases where two beam particles enter the TPC simultaneously. The tracks in each event were identified using the Hough-transformation method described in Ref. [20]. For the reacted events, after excluding the pads with the same Z coordinate as the react_column, the remaining tracks were classified into the beam-particle track and the reaction-product track(s). The exact location of reaction vertex was defined by the intersection of the tracks and the$react\_column$ . In this experiment, only one- or two-track reaction-product events were observed, as the TPC pad threshold was set to$\approx$ 0.12 MeV and thus was not sensitive to protons, neutrons, or some high-energy α particles. Accordingly, two types of reaction events, one-reaction-product-track events and two-reaction-product-track events, were distinguished based on the number of reaction-product tracks. In the following sections, we describe the selection of fusion-reaction events. -
For the one-track fusion events, only the fusion residues were recorded as the reaction product. PACE4 calculation indicates that the scattering angles (θ) of the fusion residues are less than 20 degree in the lab frame when
$E_{c.m.}>=$ 9.7 MeV. The largest background comes from the elastic scattering channel. Taking the elastic scattering at$E_{c.m.}$ =10 MeV as an example, when the scattering of$^{19}{\rm{O}}$ is less than 20 degree in the lab frame, the maximum kinetic energy of$^{12}{\rm{C}}$ is less than 4.4 MeV, corresponding to a track length less than 2.2 cm. As our pads width is 0.3 cm along the Y-axis, such a short could only fire not more than 7 pads. If the reaction-product tracks happened to have similar coordinates along the Y-axis, the two tracks would overlap and the pattern of fired pads in the readout plane would appear as a single track. Besides that, few isolated pads occasionally fired by the alpha particles may not recognized as tracks. To better identify the tracks of heavy fusion residual and suppress the elastic events, the least distance from the reaction product track ($d_0$ ) was calculated. In the following analysis, only the pads with$d_{0}< 2.0$ cm were considered as the pads fired by the candidate event of fusion reaction. A typical fusion event and elastic scattering event are shown in Fig. 5 and 6, respectively.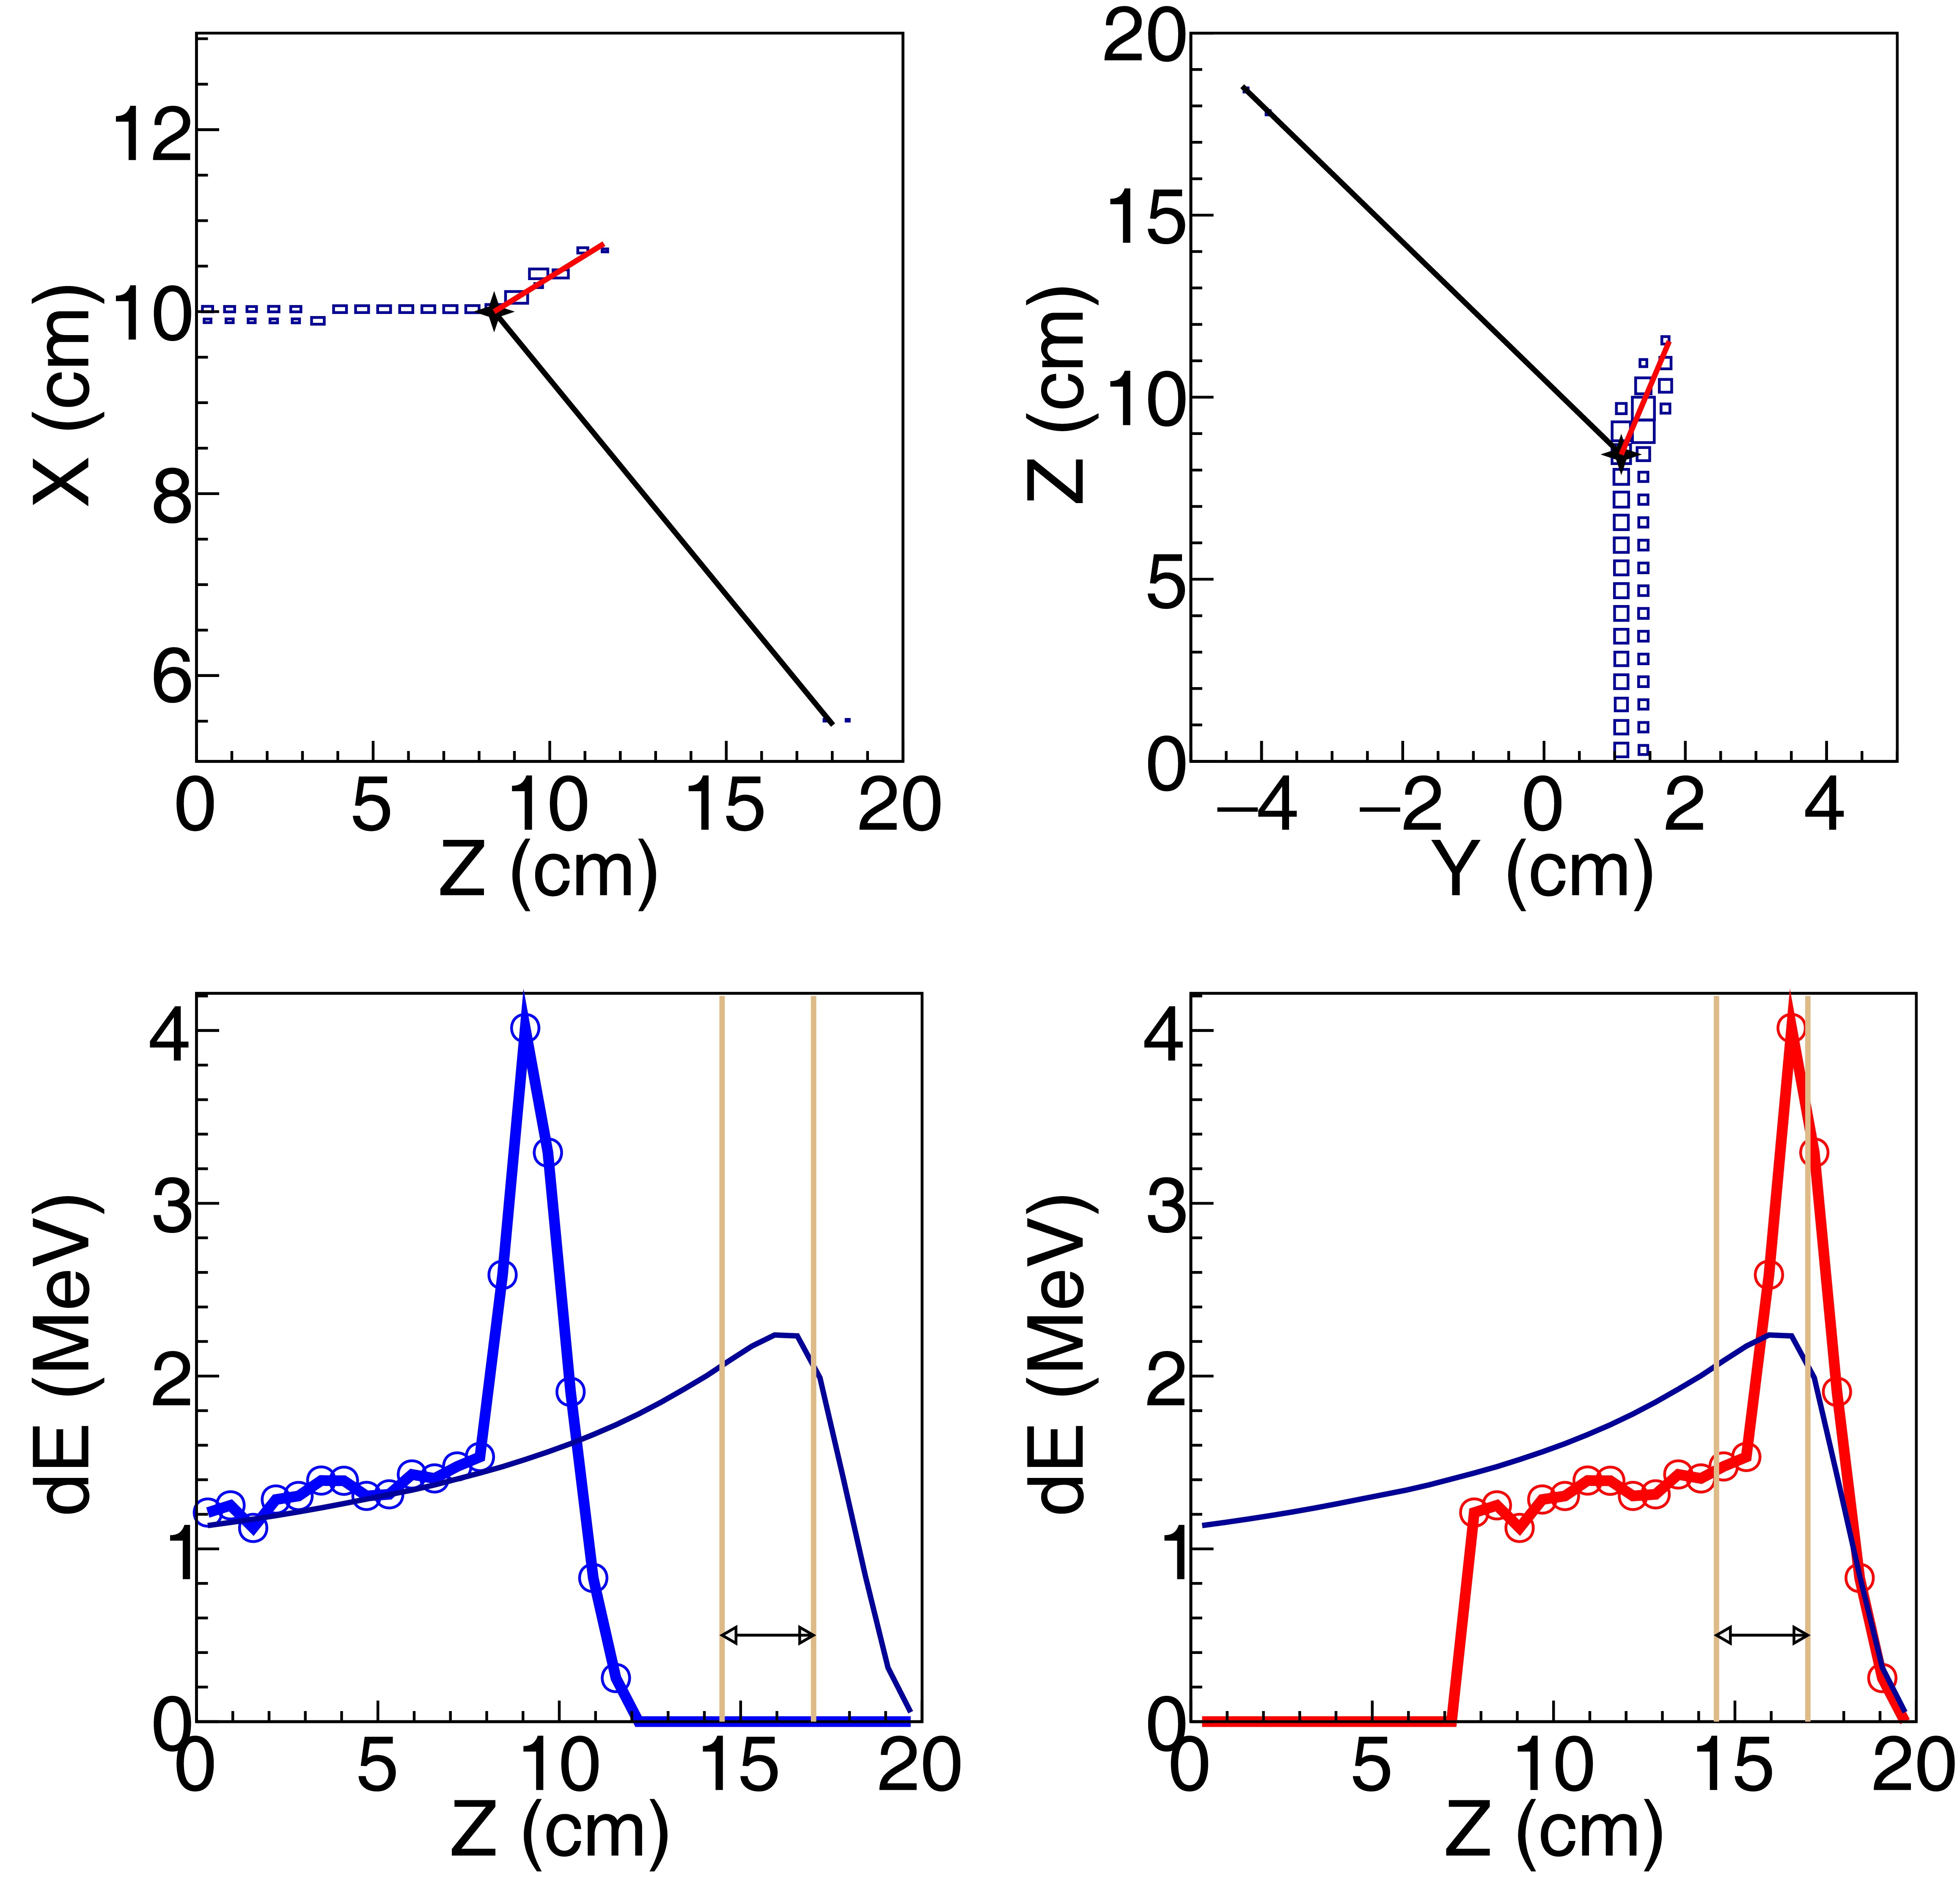
Figure 5. (color online) One-track fusion event. (Upper left) Track projection in the X–Z plane. (Upper right) Track projection in the Y–Z plane. (Lower left) Energy-loss curve along the Z-axis, with the measured energy-loss profile shown in blue and the template curve in black. (Lower right) Energy-loss curve after shifting to the position that yields the minimum
$\chi^2$ , with the shifted curve shown in red and the template curve in black. The red line in the upper panels represents the fitted track of the fusion residue. The black line in the upper panels represents a possible trajectory constructed by connecting the reaction vertex with several fired pads, likely originating from α particles. The vertical lines in the lower panels indicate the range used in the calculation of$(dE/dx)_{\mathrm{Bragg}}$ .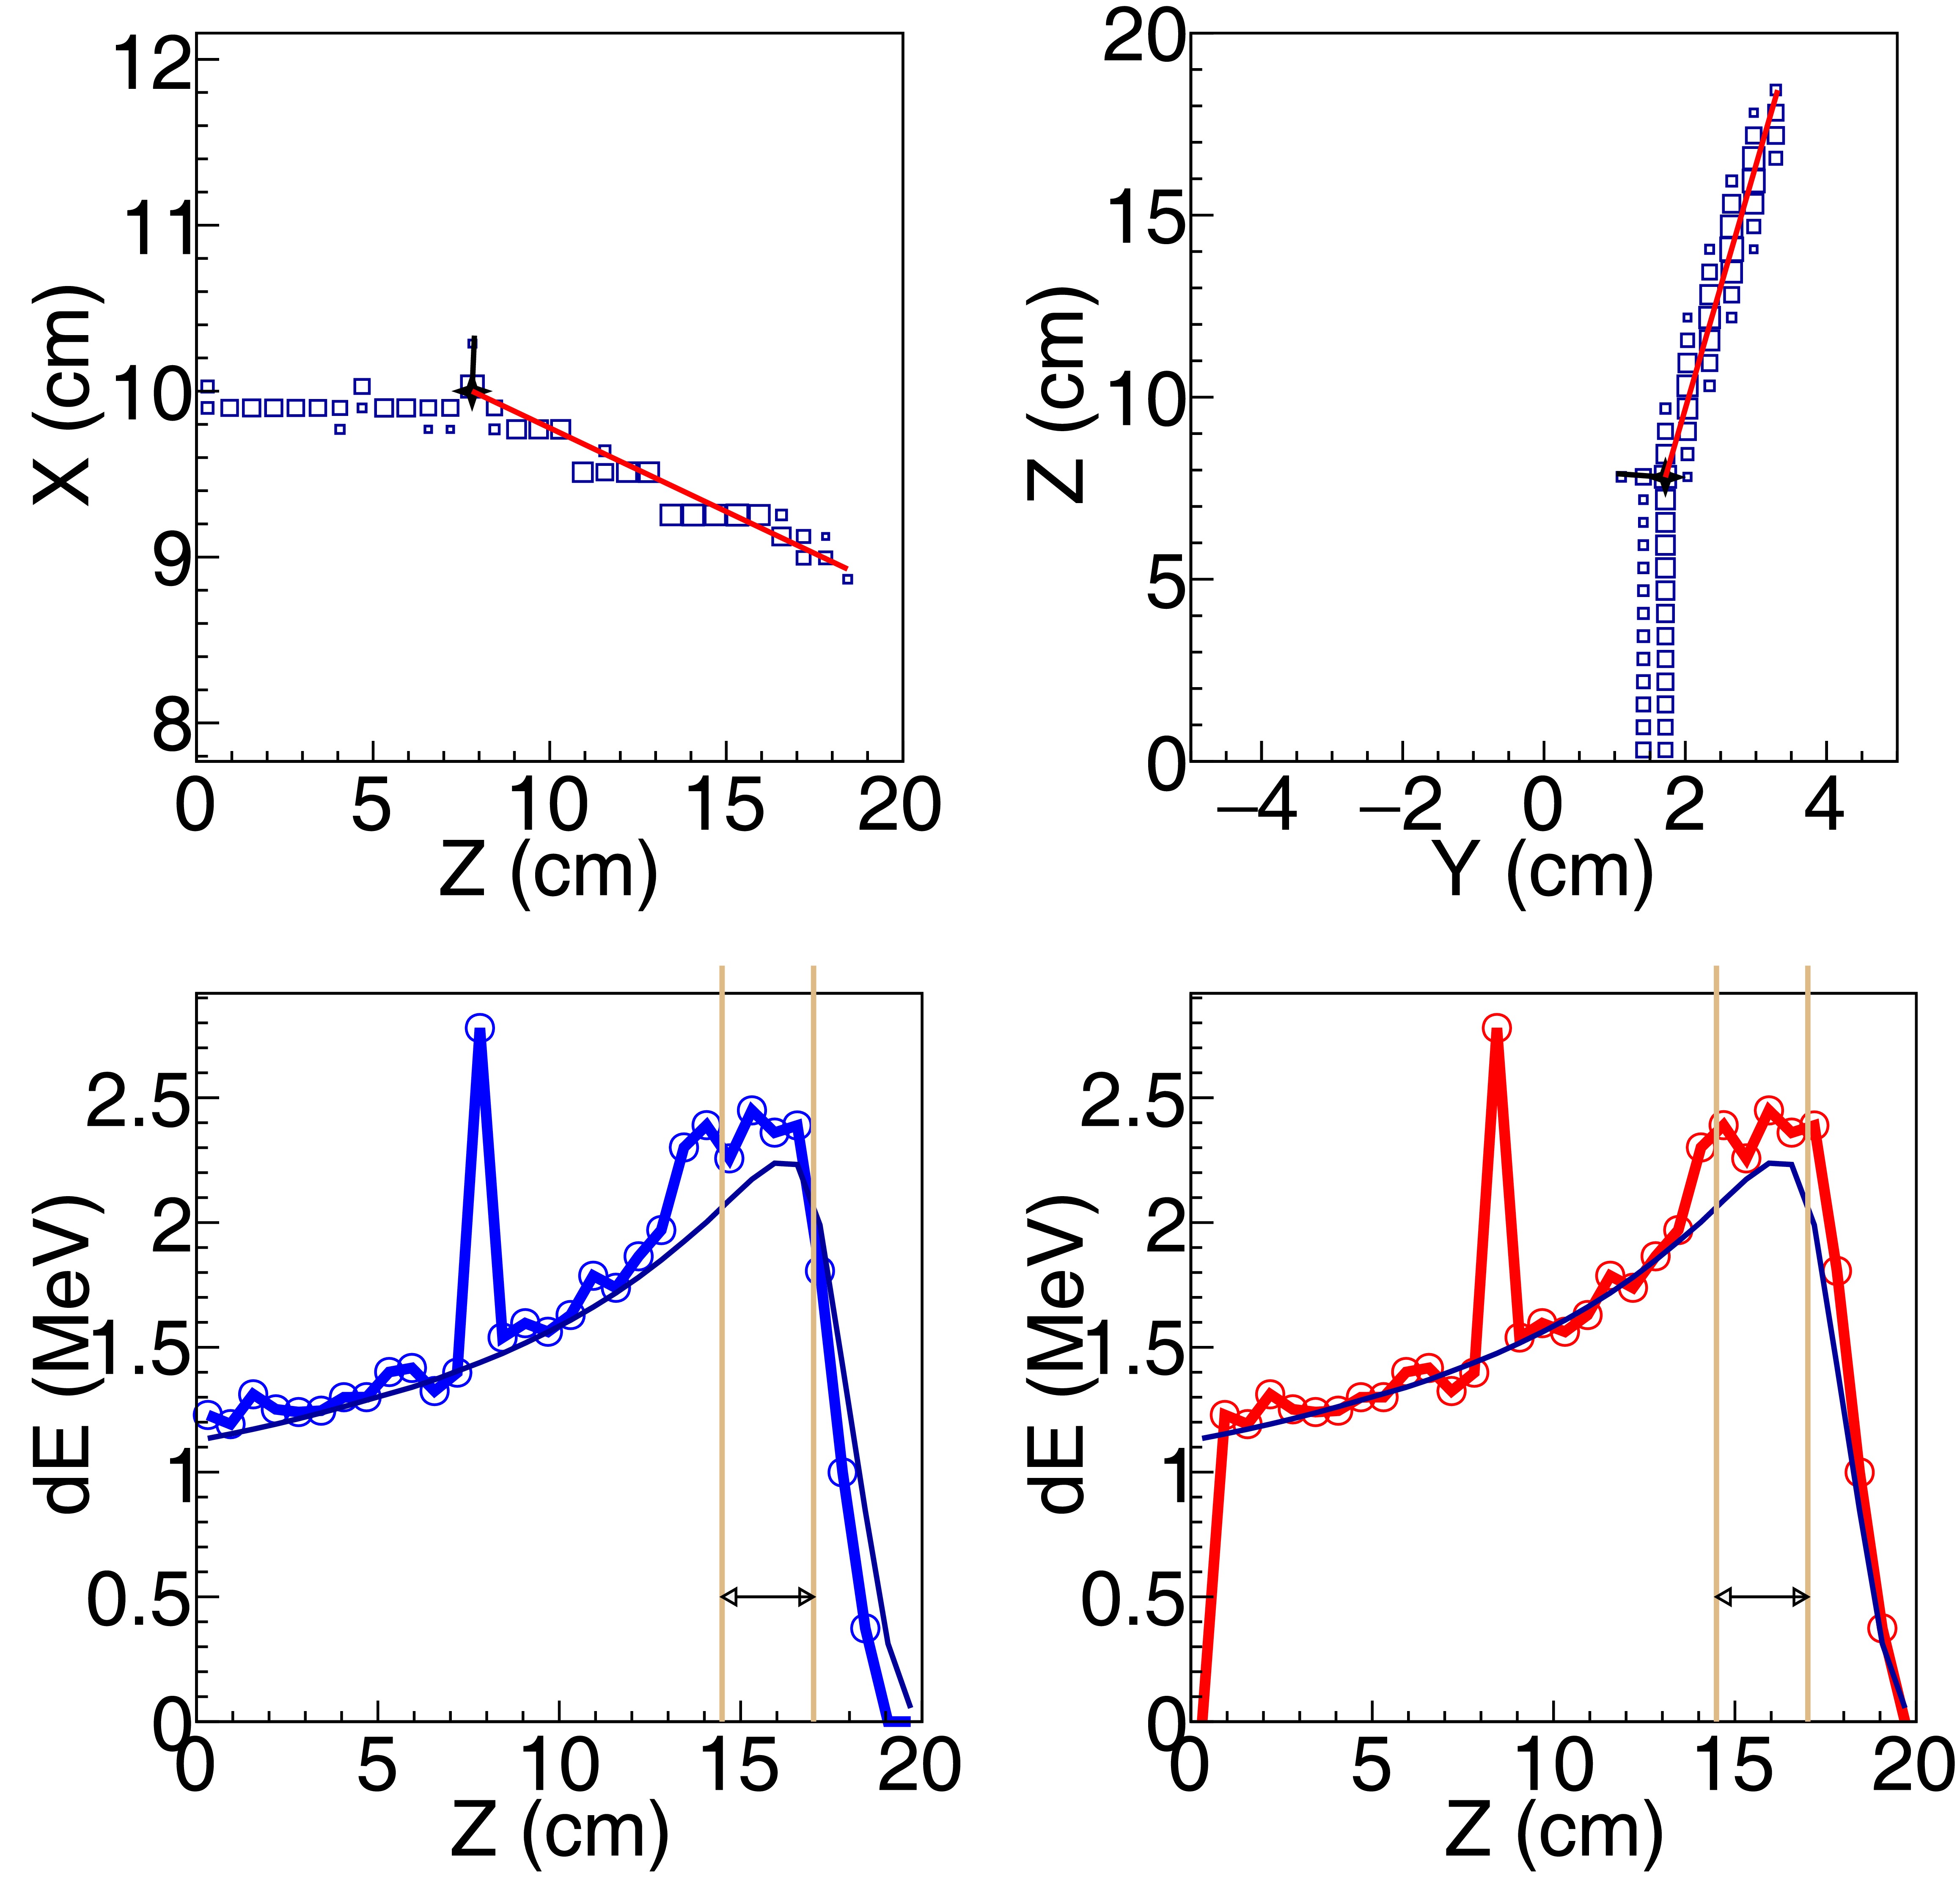
Figure 6. (color online) Example of a one-track event identified as elastic 19O+12C scattering. The panel layout and line descriptions are nearly identical to those in Fig. 5, except that in the upper panels the red line represents the fitted track of the scattered 19O, while the black line indicates a schematic trajectory corresponding to the likely track, unresolved path of the recoiling 12C.
The energy-loss curve of non-reacting
$^{19}{\rm{O}}$ ions was used as a reference template. For each candidate fusion event, its measured energy-loss curve was shifted along the Z-axis until its trailing edge aligned with the template endpoint. The$\chi^{2}$ value between the measured and template energy-loss distributions was then calculated for all pads beyond the reaction point (react_column). By varying the pad-shift amount, the minimum$\chi^{2}$ was obtained, providing an optimized alignment. For determining the Bragg peak region of the shifted energy-loss curve, pads 23–27 defined in the energy loss template were prioritized for scattering angles below$10^{\circ}$ , and pads 25–27 for angles between$10^{\circ}$ and$20^{\circ}$ . If fewer than three valid pads were available in these ranges, subsequent pads beyond 27 were included. The average Bragg energy loss was calculated as$ \left(\frac{dE}{dx}\right)_{\mathrm{Bragg}} = \frac{E_{\mathrm{loss,\,sum}}}{N_{\mathrm{pad}} \times \text{Pad Width (0.63 mm)}}. $
(1) For the events with react_column
$\geqslant 5$ and react_column$\leqslant 18$ , the$dE/dx_{Bragg}$ versus the summing energy of the reaction product tracks(track_e) and the resulting reduced$\chi^{2}$ versus track_e are shown in Fig. 7 and 8, respectively. Using the cut shown in Fig. 7, the candidates of the fusion reaction events were identified.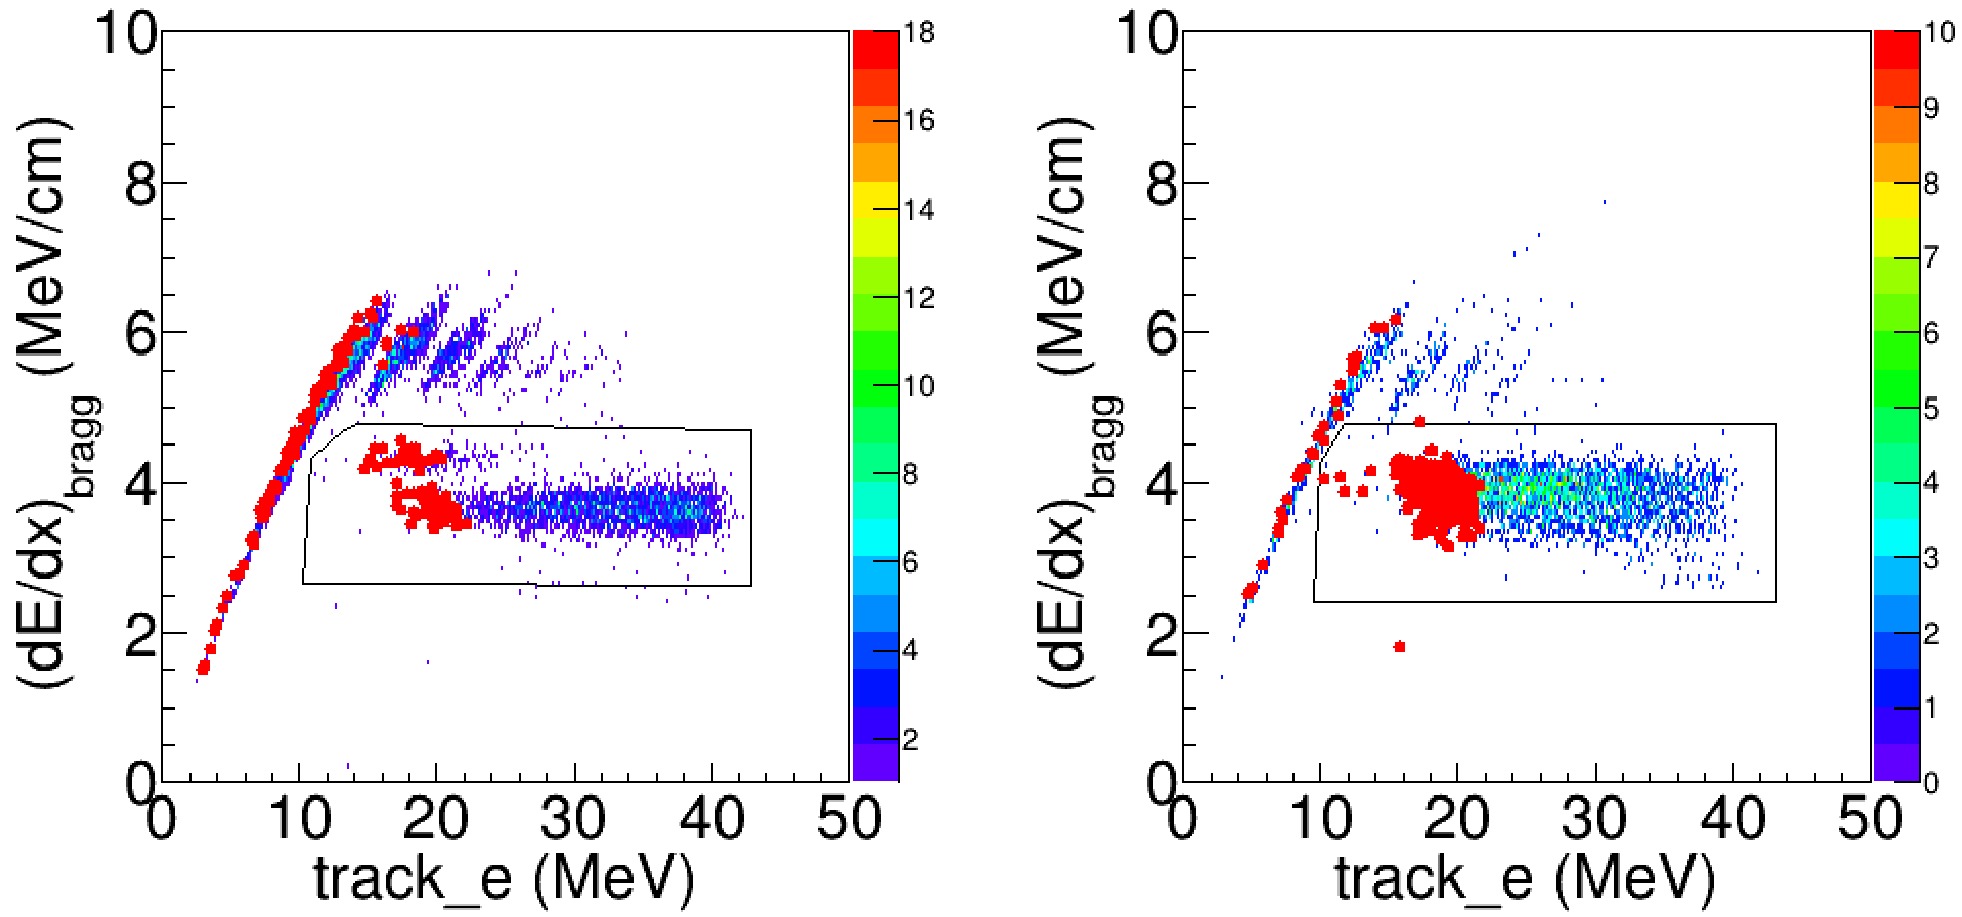
Figure 7. (color online) For one-track events,
$(dE/dx)_{\mathrm{Bragg}}$ versus the summed energies of the reaction-product tracks with laboratory scattering angles less than$10^\circ$ (left panel) and between$10^\circ$ and$20^\circ$ (Right panel). The red dots indicates reaction events on the 18th pad. The black box denotes the non-fusion events.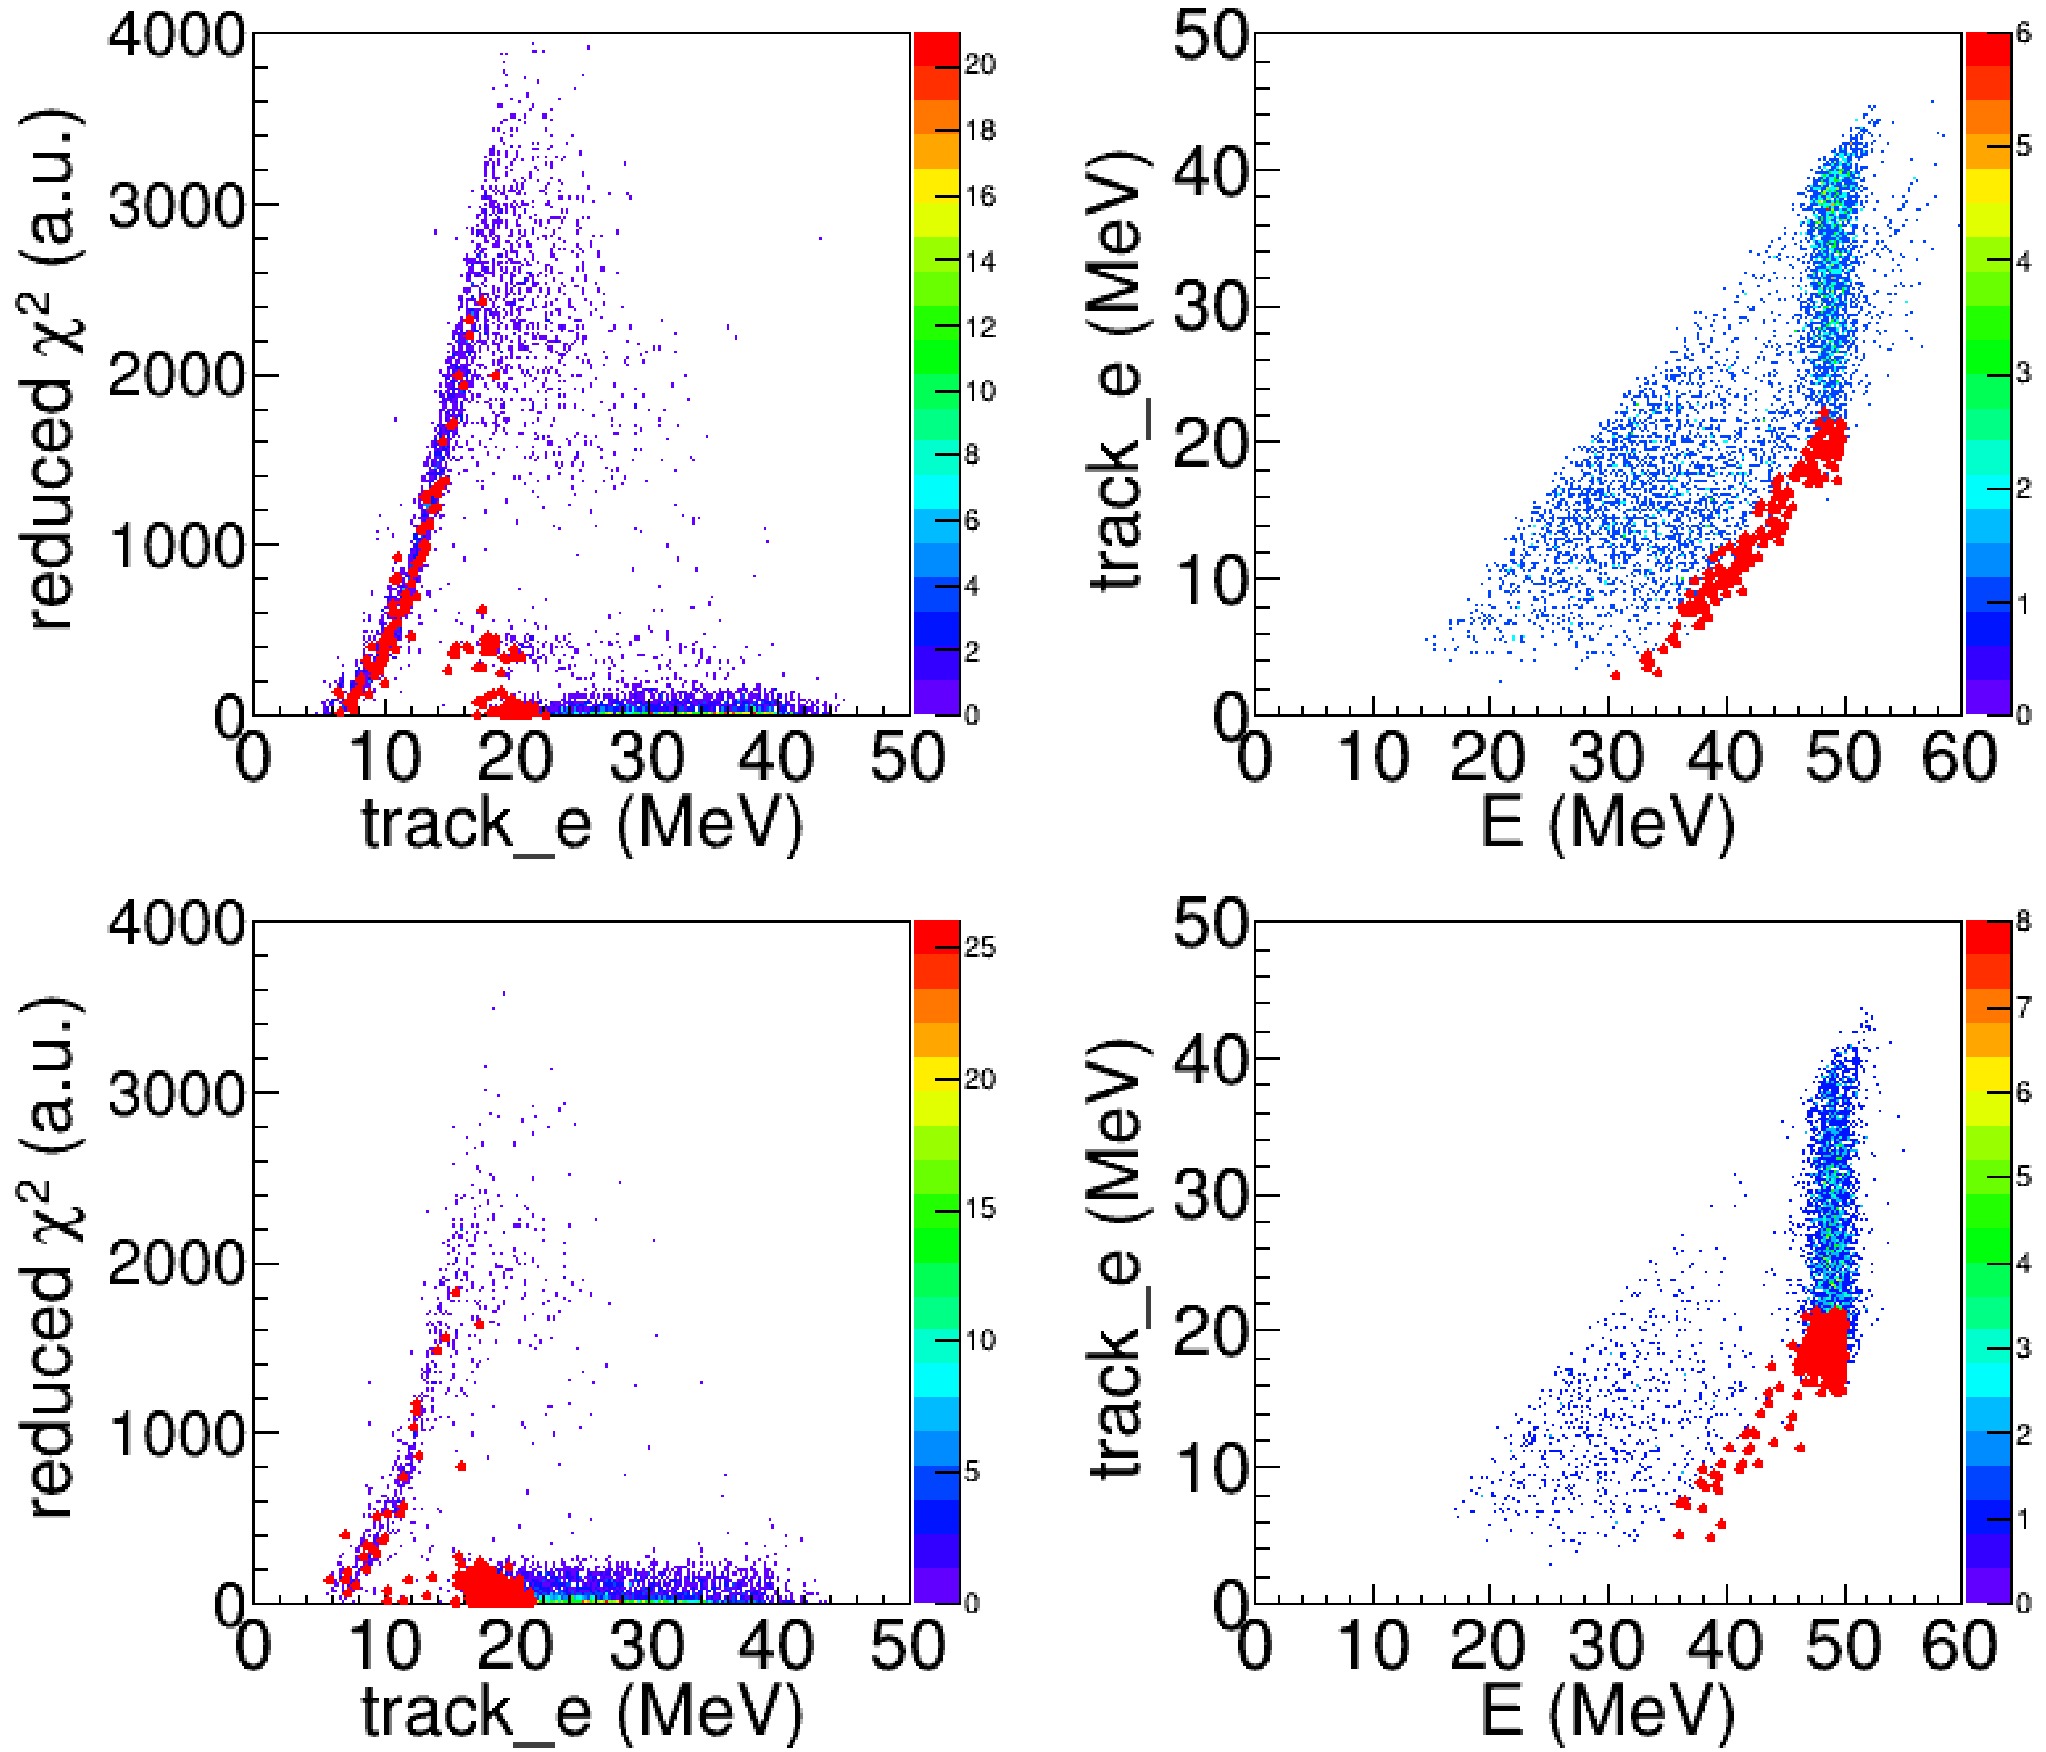
Figure 8. (color online) (Upper left panel) The reduced
$\chi^2$ vs. the summed energy of the reaction-product track for the reacted events with scattering angles less than$10^{\circ}$ ; (Upper right panel) The summed energy of the reaction-product track vs. the total energy deposition in the TPC for the events with scattering angles less than$10^{\circ}$ . The lower left and right panels are identical to the upper left and right panels except for the reacted events with scattering angles between$10^{\circ}$ and$20^{\circ}$ . The red dots indicates the candidates for the fusion reaction, identified by the cut shown in Fig. 7 on the 18th pad.Here we take the reaction events occurring on the 18th pad as an example to illustrate our analysis of the fusion events. These events have the lowest reaction energy,
$E_{\rm{c.m.}} \sim 10 \mathrm{MeV}$ . After applying the cut in$(dE/dx)_{\mathrm{Bragg}}$ versus track_e, 191 fusion-reaction candidates are identified, as shown in Fig. 7. These events were further examined using the distributions of the reduced$\chi^{2}$ versus track_e and track_e versus the total energy recorded by the TPC ($E_{total}$ ).For elastic-scattering events,
$E_{total}$ is equal to the incident energy of the beam particle (49.7 MeV). In most cases, the fusion residues have smaller$E_{total}$ values than the elastic-scattering events, because the light particles emitted in the fusion reaction escape detection in the TPC and carry away part of the energy. However, the PACE4 calculation shows a small probability that the kinetic energy of a fusion residue may exceed the incident beam energy. In contrast, the elastic-scattering events form a well-defined group with$E_{total}$ clustered around the incident beam energy. We inspected the track plots of the candidate events to ensure that none exhibited the two-track topology characteristic of elastic scattering, as illustrated in Fig. 6. In total, we identified 3894 one-track fusion events in the range of in the center-of-mass energy range 9.7 MeV$ \leqslant E_{\rm{c.m.}} \leqslant$ 16.9 MeV. -
For the one-track fusion events, only the fusion residues were recorded as the reaction product. PACE4 calculation indicates that the scattering angles (θ) of the fusion residues are less than 20 degree in the lab frame when
$ E\mathrm{_{c.m.}}\geqslant $ 9.7 MeV. The largest background comes from the elastic scattering channel. Taking the elastic scattering at$ E_{\mathrm{c.m.}} $ =10 MeV as an example, when the scattering of$^{19}{\rm{O}}$ is less than 20 degree in the lab frame, the maximum kinetic energy of$^{12}{\rm{C}}$ is less than 4.4 MeV, corresponding to a track length less than 2.2 cm. As our pads width is 0.3 cm along the Y-axis, such a short could only fire not more than 7 pads. If the reaction-product tracks happened to have similar coordinates along the Y-axis, the two tracks would overlap and the pattern of fired pads in the readout plane would appear as a single track. Besides that, few isolated pads occasionally fired by the alpha particles may not recognized as tracks. To better identify the tracks of heavy fusion residual and suppress the elastic events, the least distance from the reaction product track ($d_0$ ) was calculated. In the following analysis, only the pads with$d_{0}< 2.0$ cm were considered as the pads fired by the candidate event of fusion reaction. A typical fusion event and elastic scattering event are shown in Figs. 5 and 6, respectively.
Figure 5. (color online) One-track fusion event. (Upper left) Track projection in the X–Z plane. (Upper right) Track projection in the Y–Z plane. (Lower left) Energy-loss curve along the Z-axis, with the measured energy-loss profile shown in blue and the template curve in black. (Lower right) Energy-loss curve after shifting to the position that yields the minimum
$\chi^2$ , with the shifted curve shown in red and the template curve in black. The red line in the upper panels represents the fitted track of the fusion residue. The black line in the upper panels represents a possible trajectory constructed by connecting the reaction vertex with several fired pads, likely originating from α particles. The vertical lines in the lower panels indicate the range used in the calculation of$ (\mathrm{d}E/\mathrm{d}x)_{\mathrm{Bragg}} $ .
Figure 6. (color online) Example of a one-track event identified as elastic 19O+12C scattering. The panel layout and line descriptions are nearly identical to those in Fig. 5, except that in the upper panels the red line represents the fitted track of the scattered 19O, while the black line indicates a schematic trajectory corresponding to the likely track, unresolved path of the recoiling 12C.
The energy-loss curve of non-reacting
$^{19}{\rm{O}}$ ions was used as a reference template. For each candidate fusion event, its measured energy-loss curve was shifted along the Z-axis until its trailing edge aligned with the template endpoint. The$\chi^{2}$ value between the measured and template energy-loss distributions was then calculated for all pads beyond the reaction point (react_column). By varying the pad-shift amount, the minimum$\chi^{2}$ was obtained, providing an optimized alignment. For determining the Bragg peak region of the shifted energy-loss curve, pads 23–27 defined in the energy loss template were prioritized for scattering angles below$10^{\circ}$ , and pads 25–27 for angles between$10^{\circ}$ and$20^{\circ}$ . If fewer than three valid pads were available in these ranges, subsequent pads beyond 27 were included. The average Bragg energy loss was calculated as$ \left(\frac{\mathrm{d}E}{\mathrm{d}x}\right)_{\mathrm{Bragg}} = \frac{E_{\mathrm{loss,\,sum}}}{N_{\mathrm{pad}} \times \text{Pad Width (0.63 cm)}}. $
(1) For the events with react_column
$\geqslant 5$ and react_column$\leqslant 18$ , the$ \mathrm{d}E/\mathrm{d}x_{Bragg} $ versus the summing energy of the reaction product tracks (track_e) and the resulting reduced$\chi^{2}$ versus track_e are shown in Figs. 7 and 8, respectively. Using the cut shown in Fig. 7, the candidates of the fusion reaction events were identified.
Figure 7. (color online) For one-track events,
$ (\mathrm{d}E/\mathrm{d}x)_{\mathrm{Bragg}} $ versus the summed energies of the reaction-product tracks with laboratory scattering angles less than$10^\circ$ (left panel) and between$10^\circ$ and$20^\circ$ (Right panel). The red dots indicates reaction events on the 18th pad. The black box denotes the non-fusion events.
Figure 8. (color online) (Upper left panel) The reduced
$\chi^2$ vs. the summed energy of the reaction-product track for the reacted events with scattering angles less than$10^{\circ}$ ; (Upper right panel) The summed energy of the reaction-product track vs. the total energy deposition in the TPC for the events with scattering angles less than$10^{\circ}$ . The lower left and right panels are identical to the upper left and right panels except for the reacted events with scattering angles between$10^{\circ}$ and$20^{\circ}$ . The red dots indicates the candidates for the fusion reaction, identified by the cut shown in Fig. 7 on the 18th pad.Here we take the reaction events occurring on the 18th pad as an example to illustrate our analysis of the fusion events. These events have the lowest reaction energy,
$E_{\rm{c.m.}} \sim 10 \,\, \mathrm{MeV}$ . After applying the cut in$ (\mathrm{d}E/\mathrm{d}x)_{\mathrm{Bragg}} $ versus track_e, 191 fusion-reaction candidates are identified, as shown in Fig. 7. These events were further examined using the distributions of the reduced$\chi^{2}$ versus track_e and track_e versus the total energy recorded by the TPC ($ E_{\mathrm{total}} $ ).For elastic-scattering events,
$ E\mathrm{_{total}} $ is equal to the incident energy of the beam particle (49.7 MeV). In most cases, the fusion residues have smaller$ E\mathrm{_{total}} $ values than the elastic-scattering events, because the light particles emitted in the fusion reaction escape detection in the TPC and carry away part of the energy. However, the PACE4 calculation shows a small probability that the kinetic energy of a fusion residue may exceed the incident beam energy. In contrast, the elastic-scattering events form a well-defined group with$ E\mathrm{_{total}} $ clustered around the incident beam energy. We inspected the track plots of the candidate events to ensure that none exhibited the two-track topology characteristic of elastic scattering, as illustrated in Fig. 6. In total, we identified 3894 one-track fusion events in the range of in the center-of-mass energy range 9.7 MeV$ \leqslant E_{\rm{c.m.}} \leqslant$ 16.9 MeV. -
Although the pad-level threshold of 120 keV rendered our detector insensitive to protons and most α particles, a fraction of α-evaporation events was still detected. For events containing two reconstructed tracks, we first sorted the tracks by their energy (
$track\_e$ ). The track with the larger$track\_e$ was taken as the fusion-residue candidate. The same procedure used to identify fusion events in the single-track case was then applied, and the classification was subsequently confirmed by verifying the presence of the accompanying α track.Figure 9 shows the correlation between
$(dE/dx)_{\mathrm{Bragg}}$ and the total energy of the reaction-product track (track_e). A total of 867 two-track fusion events were identified in the center-of-mass energy range 9.7 MeV$\leqslant E_{\rm{c.m.}} \leqslant$ 16.9 MeV.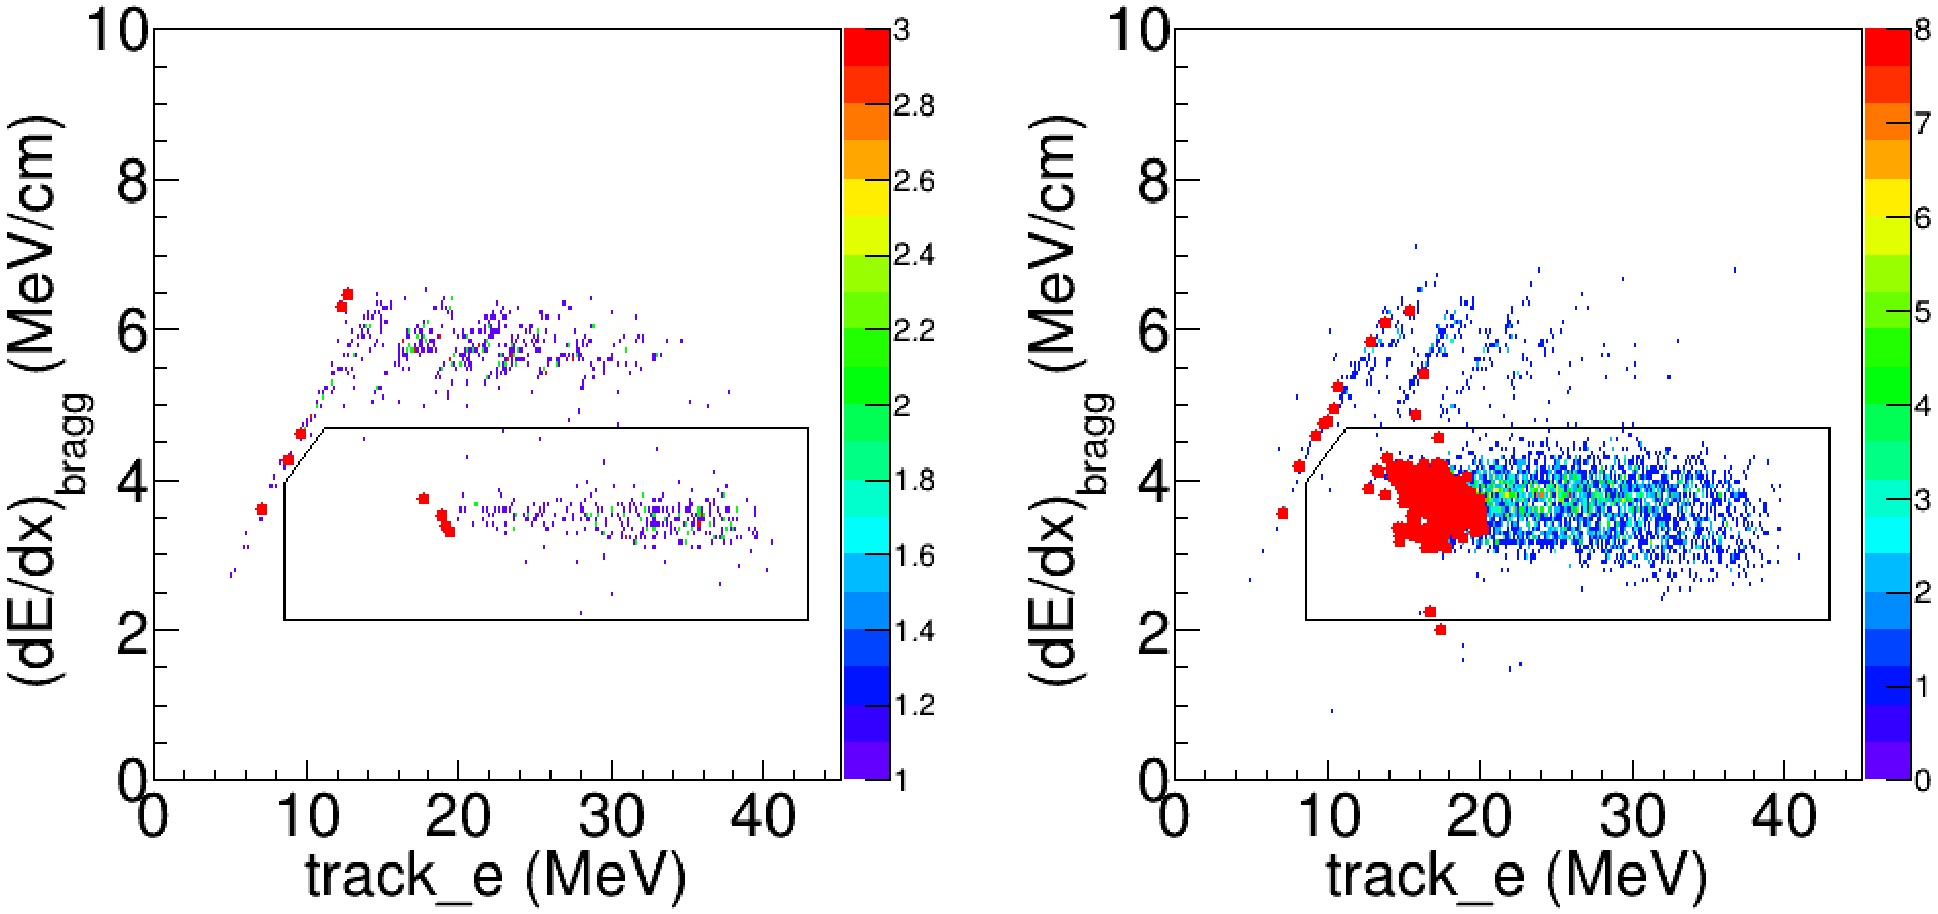
Figure 9. (color online) For two-track events,
$(dE/dx)_{\mathrm{Bragg}}$ versus the summed energies of the reaction-product tracks with laboratory scattering angles less than$10^\circ$ (left panel) and between$10^\circ$ and$20^\circ$ (Right panel). The red dots indicates reaction events on the 18th pad. The black box denotes the non-fusion events. -
Although the pad-level threshold of 120 keV rendered our detector insensitive to protons and most α particles, a fraction of α-evaporation events was still detected. For events containing two reconstructed tracks, we first sorted the tracks by their energy (
$track\_e$ ). The track with the larger$track\_e$ was taken as the fusion-residue candidate. The same procedure used to identify fusion events in the single-track case was then applied, and the classification was subsequently confirmed by verifying the presence of the accompanying α track.Figure 9 shows the correlation between
$ (\mathrm{d}E/\mathrm{d}x)_{\mathrm{Bragg}} $ and the total energy of the reaction-product track (track_e). A total of 867 two-track fusion events were identified in the center-of-mass energy range 9.7 MeV$\leqslant E_{\rm{c.m.}} \leqslant$ 16.9 MeV.
Figure 9. (color online) For two-track events,
$ (\mathrm{d}E/\mathrm{d}x)_{\mathrm{Bragg}} $ versus the summed energies of the reaction-product tracks with laboratory scattering angles less than$10^\circ$ (Left panel) and between$10^\circ$ and$20^\circ$ (Right panel). The red dots indicates reaction events on the 18th pad. The black box denotes the non-fusion events. -
The measured angular distribution of the fusion residues is shown in Fig. 10, together with the PACE4 prediction. The comparison indicates that PACE4 provides a reasonable description of the angular distribution. Because the measurements of Singh and Vadas [12, 21] covered only a limited angular range, their fusion cross sections relied on the PACE4-calculated distribution for extrapolation. Our result therefore provides experimental validation of the angular distribution, helping to reduce the associated systematic uncertainty in those earlier measurements
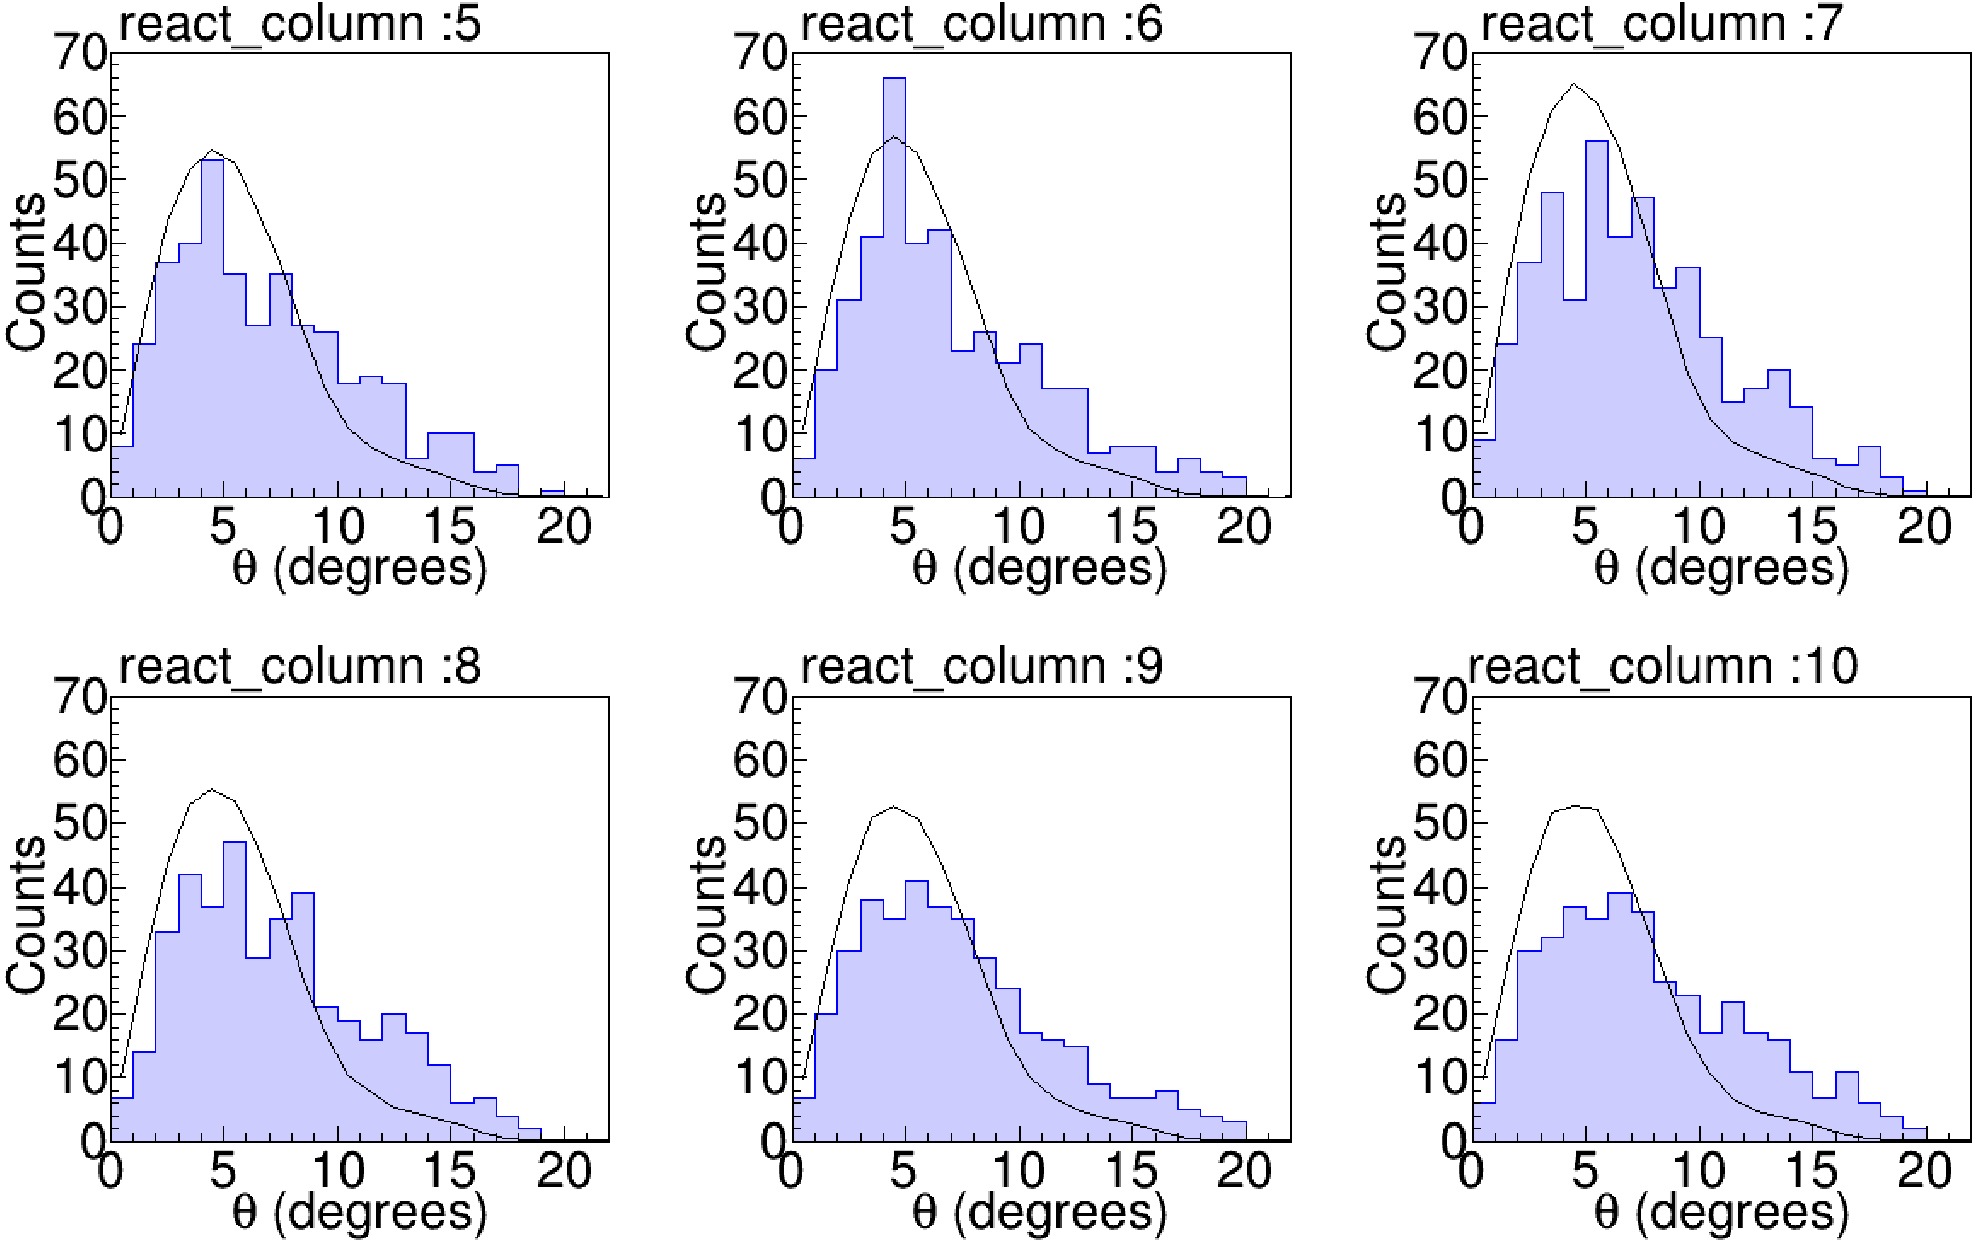
Figure 10. (color online) The measured angular distribution of the fusion reaction products and the prediction obtained with PACE4. The corresponding energies of Pad 5 to 10 are 16.9, 16.3, 15.8, 15.3, 14.7 and 14.2 MeV respectively.
-
The measured angular distribution of the fusion residues is shown in Fig. 10, together with the PACE4 prediction. The comparison indicates that PACE4 provides a reasonable description of the angular distribution. Because the measurements of Singh and Vadas [12, 21] covered only a limited angular range, their fusion cross sections relied on the PACE4-calculated distribution for extrapolation. Our result therefore provides experimental validation of the angular distribution, helping to reduce the associated systematic uncertainty in those earlier measurements.
Figure 10. (color online) The measured angular distribution of the fusion reaction products and the prediction obtained with PACE4. The corresponding energies of Pad 5 to 10 are 16.9, 16.3, 15.8, 15.3, 14.7 and 14.2 MeV respectively.
-
The measured angular distribution of the fusion residues is shown in Fig. 10, together with the PACE4 prediction. The comparison indicates that PACE4 provides a reasonable description of the angular distribution. Because the measurements of Singh and Vadas [12, 21] covered only a limited angular range, their fusion cross sections relied on the PACE4-calculated distribution for extrapolation. Our result therefore provides experimental validation of the angular distribution, helping to reduce the associated systematic uncertainty in those earlier measurements
Figure 10. (color online) The measured angular distribution of the fusion reaction products and the prediction obtained with PACE4. The corresponding energies of Pad 5 to 10 are 16.9, 16.3, 15.8, 15.3, 14.7 and 14.2 MeV respectively.
-
The projection of
$ (\mathrm{d}E/\mathrm{d}x)_{\mathrm{Bragg}} $ for events with track_e$> 10$ MeV and angle$< 10^{\circ}$ is shown in Fig. 11. A small peak appears just above the$^{19}{\rm{O}}$ peak, whose centroid is higher by a factor of 1.22 relative to that of$^{19}{\rm{O}}$ . According to energy-loss calculations, the ratios of the maximum$ \mathrm{d}E/\mathrm{d}x $ values are 1, 1.15, and 1.28 for$^{19}{\rm{O}}$ ,$^{20}{\rm{F}}$ , and$^{23}{\rm{Ne}}$ , respectively. The corresponding complementary partners would be$^{11}$ B for$^{20}{\rm{F}}$ and$^{8}{\rm{Be}}$ for$^{23}{\rm{Ne}}$ . Examination of the reconstructed track images confirms that only$^{23}{\rm{Ne}}$ trajectories were present, without any accompanying heavy recoil ions Fig. 12. This behavior is readily explained if the complementary reaction product,$^{8}{\rm{Be}}$ in its ground or excited state, promptly decays into two α particles. These α particles remain undetected in our TPC because their deposited energies in TPC fall below the detection threshold of 0.12 MeV. Therefore this small peak is attributed to$^{23}{\rm{Ne}}$ . Unfortunately the resolution of$ (\mathrm{d}E/\mathrm{d}x)_{\mathrm{Bragg}} $ gets worse at angles larger than$10^{\circ}$ . Therefore we can not obtain the total yield of$^{23}{\rm{Ne}}$ in this work.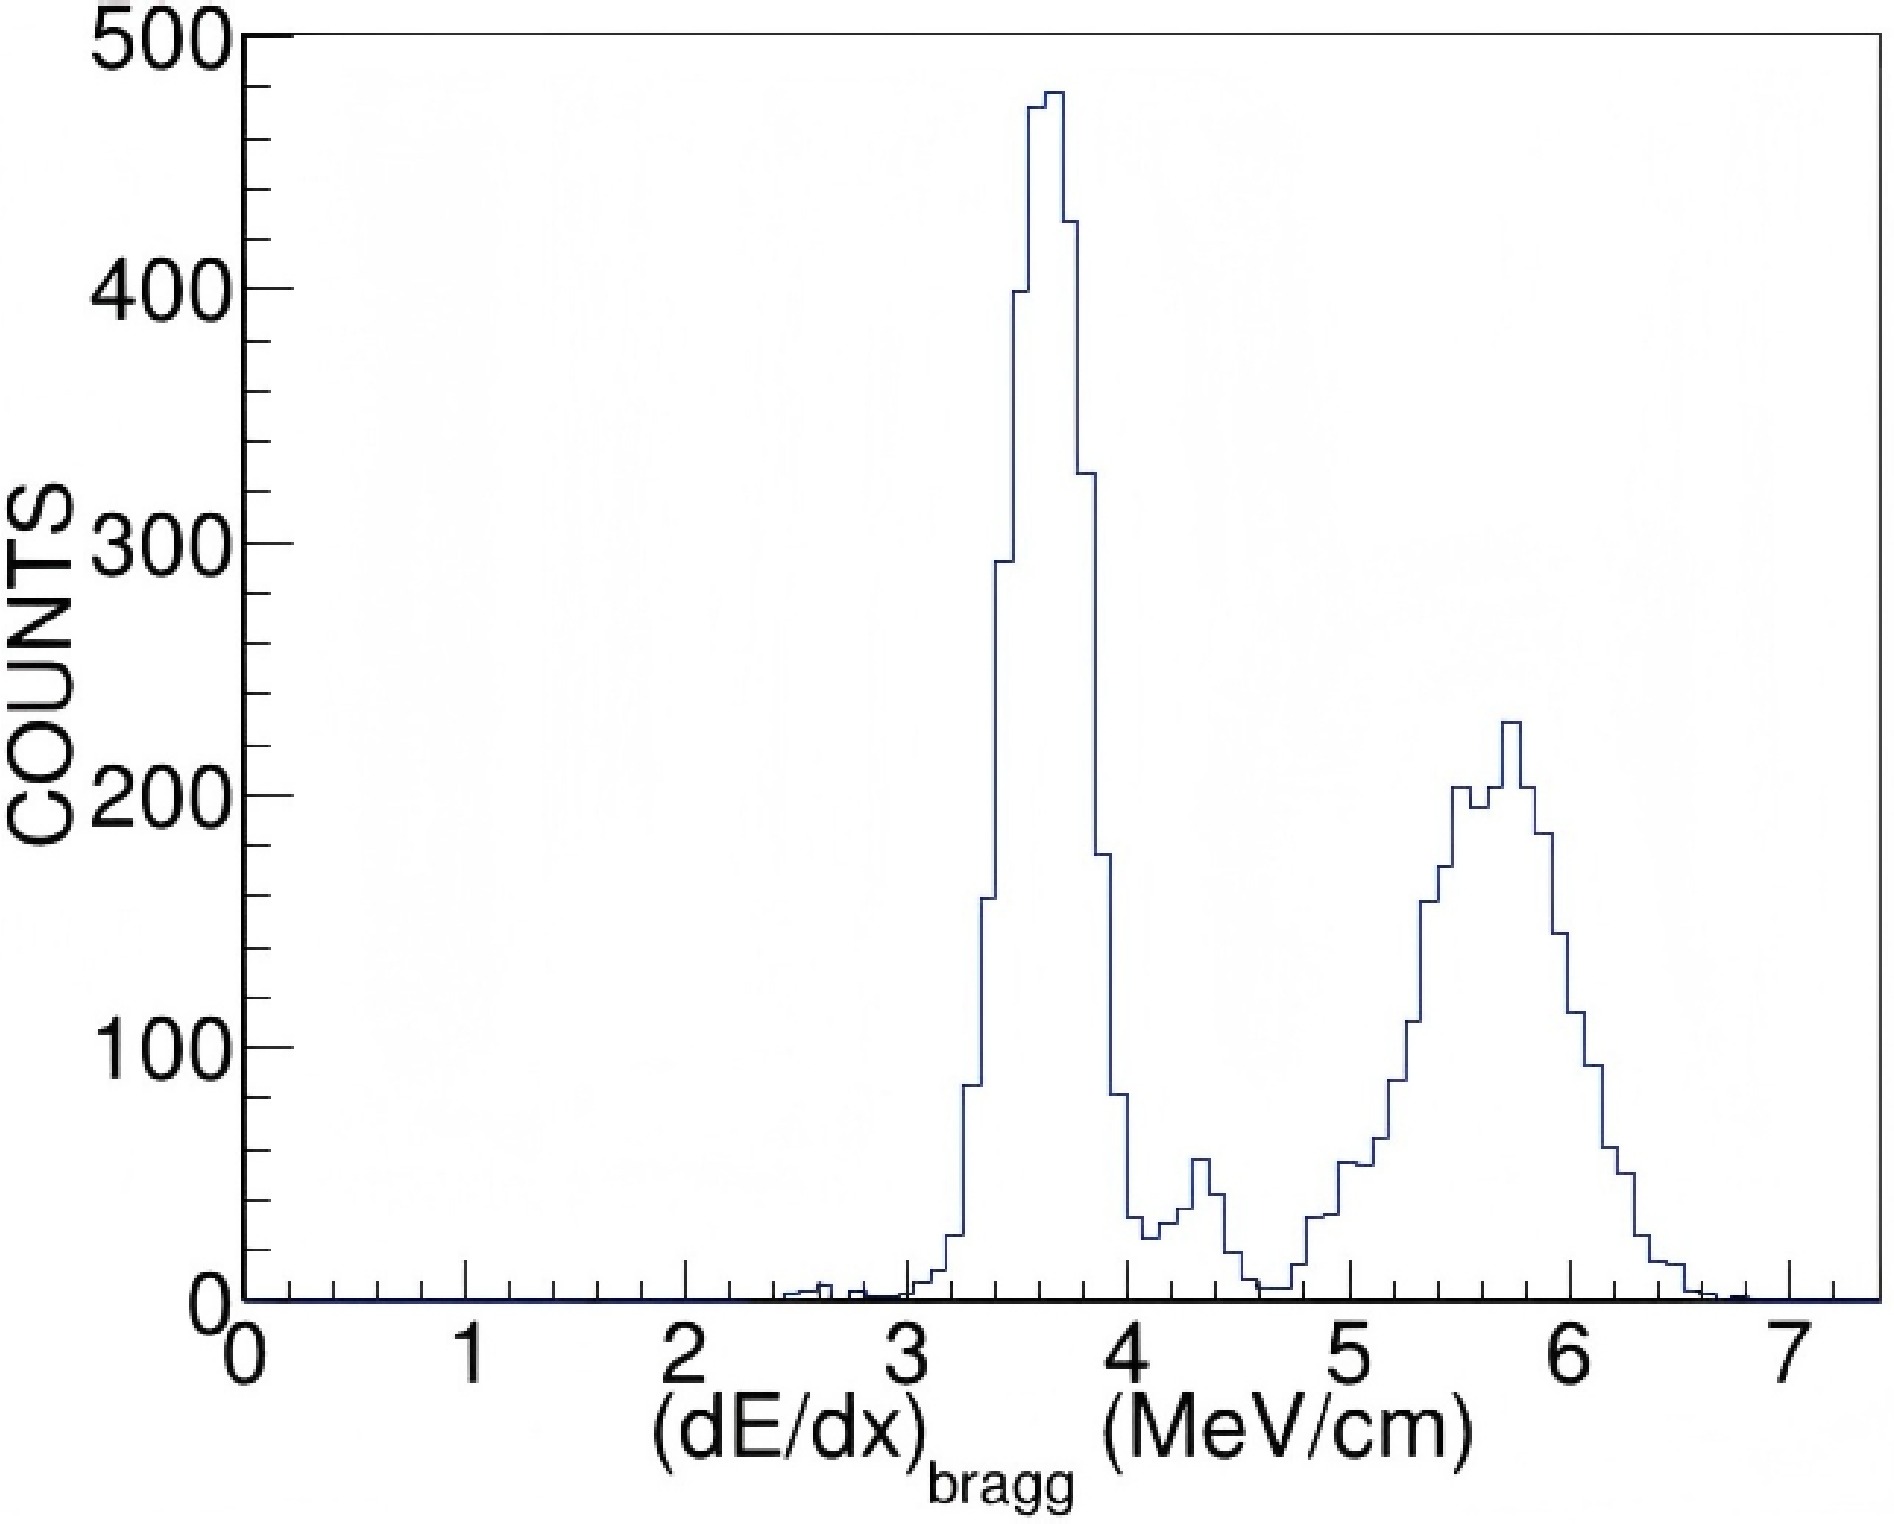
Figure 11. The projection of
$ (\mathrm{d}E/\mathrm{d}x)_{\mathrm{Bragg}} $ for events with track_e$>$ 9.7 MeV.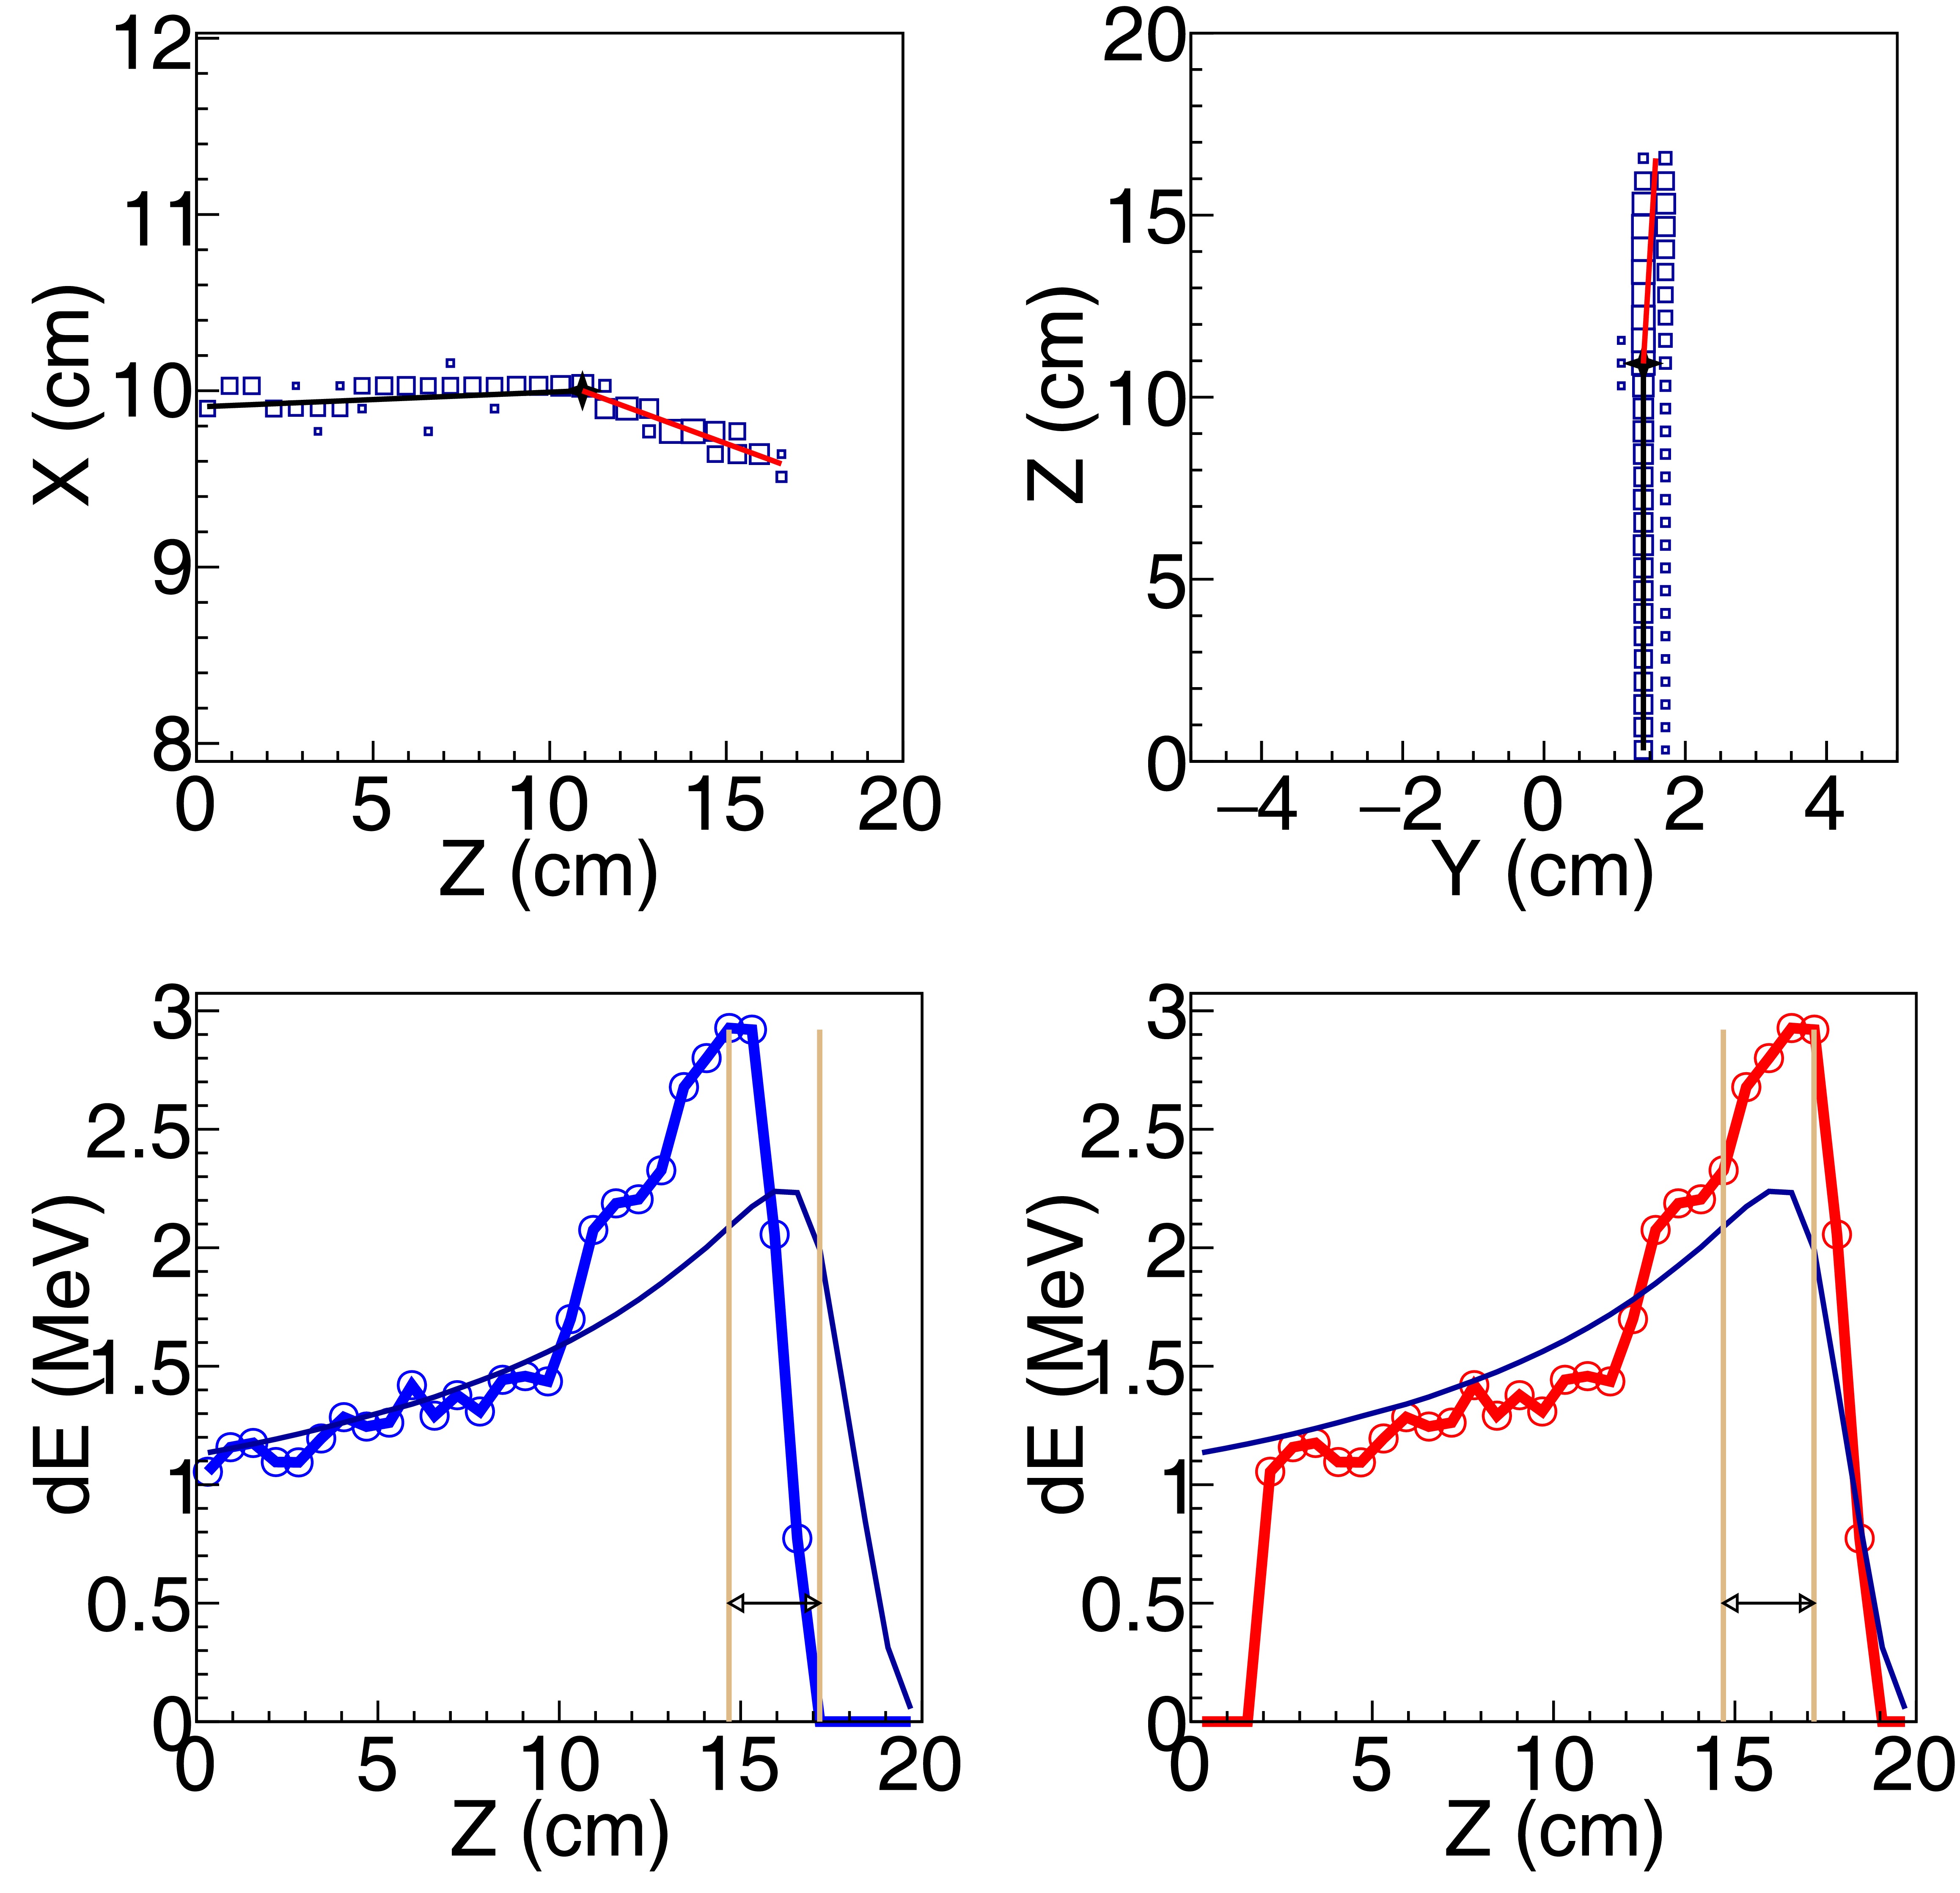
Figure 12. (color online) Candidate 23Ne event from a transfer channel. The panel layout and line representations are almost identical to that of Fig. 5 except the single heavy-ion track (red line) in the upper panels are identified as 23Ne. No accompanying track from a heavy recoil nucleus is observed.
A similar
$2\alpha$ emission channel was observed in the study of$^{12}{\rm{C}}$ +$^{12}{\rm{C}}$ reactions at$E_{\rm{c.m.}}=10-20$ MeV, where it was identified as a transfer process supported by DWBA calculations [20]. Furthermore, PACE4 simulations show that the branching ratio for$^{23}{\rm{Ne}}$ production in the fusion reaction is only about 0.5% at$E_{\rm{c.m.}}=10.0$ MeV and 1.9% at$E_{\rm{c.m.}}=17$ MeV, therefore we do not include$^{23}{\rm{Ne}}$ among the fusion residues. -
The projection of
$(dE/dx)_{\mathrm{Bragg}}$ for events with track_e$> 10$ MeV and angle$< 10^{\circ}$ is shown in Fig. 11. A small peak appears just above the$^{19}{\rm{O}}$ peak, whose centroid is higher by a factor of 1.22 relative to that of$^{19}{\rm{O}}$ . According to energy-loss calculations, the ratios of the maximum$dE/dx$ values are 1, 1.15, and 1.28 for$^{19}{\rm{O}}$ ,$^{20}{\rm{F}}$ , and$^{23}{\rm{Ne}}$ , respectively. The corresponding complementary partners would be$^{11}$ B for$^{20}{\rm{F}}$ and$^{8}{\rm{Be}}$ for$^{23}{\rm{Ne}}$ . Examination of the reconstructed track images confirms that only$^{23}{\rm{Ne}}$ trajectories were present, without any accompanying heavy recoil ions Fig. 12. This behavior is readily explained if the complementary reaction product,$^{8}{\rm{Be}}$ in its ground or excited state, promptly decays into two α particles. These α particles remain undetected in our TPC because their deposited energies in TPC fall below the detection threshold of 0.12 MeV. Therefore this small peak is attributed to$^{23}{\rm{Ne}}$ . Unfortunately the resolution of$(dE/dx)_{\mathrm{Bragg}}$ gets worse at angles larger than$10^{\circ}$ . Therefore we can not obtain the total yield of$^{23}{\rm{Ne}}$ in this work.
Figure 11. The projection of
$(dE/dx)_{\mathrm{Bragg}}$ for events with track_e$>$ 9.7 MeV.
Figure 12. (color online) Candidate 23Ne event from a transfer channel. The panel layout and line representations are almost identical to that of Fig. 5 except the single heavy-ion track (red line) in the upper panels are identified as 23Ne. No accompanying track from a heavy recoil nucleus is observed.
A similar
$2\alpha$ emission channel was observed in the study of$^{12}{\rm{C}}$ +$^{12}{\rm{C}}$ reactions at$E_{\rm{c.m.}}=10-20$ MeV, where it was identified as a transfer process supported by DWBA calculations [20]. Furthermore, PACE4 simulations show that the branching ratio for$^{23}{\rm{Ne}}$ production in the fusion reaction is only about 0.5% at$E_{\rm{c.m.}}=10.0$ MeV and 1.9% at$E_{\rm{c.m.}}=17$ MeV, therefore we do not include$^{23}{\rm{Ne}}$ among the fusion residues. -
The energy loss across each pad varies from 1.2 MeV to 2 MeV within the energy range of interest. It is therefore necessary to determine an effective energy at which the experimentally obtained cross section, measured with a relatively thick target, corresponds to the cross section that would be obtained with an infinitely thin target. The effective energy is obtained by calculating the energy at which the yield integrated over the entire target is equally divided between energies above and below that point [22].
A Monte-Carlo simulation based on the theoretical cross sections predicted by the DC-TDHF calculations (see Section IV) was performed to estimate the beam-energy distribution of fusion events for each pad. In this simulation, the energy and angular distributions of the fusion residues were generated using PACE4. The beam-energy straggling was evaluated with SRIM, and the intrinsic beam-energy spread of the incident beam was also included. As explained in Subsection III A, the uncertainty in the effective energy of the incident
$^{19}{\rm{O}}$ beam at each pad was evaluated by varying the gas density within its allowed range. -
Figure 13 compares the fusion excitation function measured in this work with the earlier measurement of Singh et al. [12], the higher-statistics update by Vadas [21], the recent measurement by Desilets et al. [13], and theoretical predictions from time-dependent Hartree–Fock (TDHF), density-constrained TDHF (DC-TDHF), and density-constrained frozen Hartree–Fock (DC-FHF). The present measurement spans center-of-mass energies from
$E_{\rm{c.m.}}\approx 9.7$ to 16.9 MeV and agrees well with the TDHF and DC-TDHF calculations, both of which incorporate dynamical effects such as neck formation, nucleon transfer, and collective excitation during the fusion process. The only exception is that the TDHF and DC-TDHF predictions lie about 8%–10% below our measured maximum fusion cross section at$E_{\rm{c.m.}}=16$ MeV and do not reproduce the subsequent decline at higher energies. The DC-FHF calculation, which treats fusion as penetration through a static potential, yields cross sections an additional$\sim 10$ % lower than the TDHF and DC-TDHF results, lies systematically below our measurement over this energy range. The comparison with DC-FHF underscores the importance of dynamical effects in accurately describing the fusion process.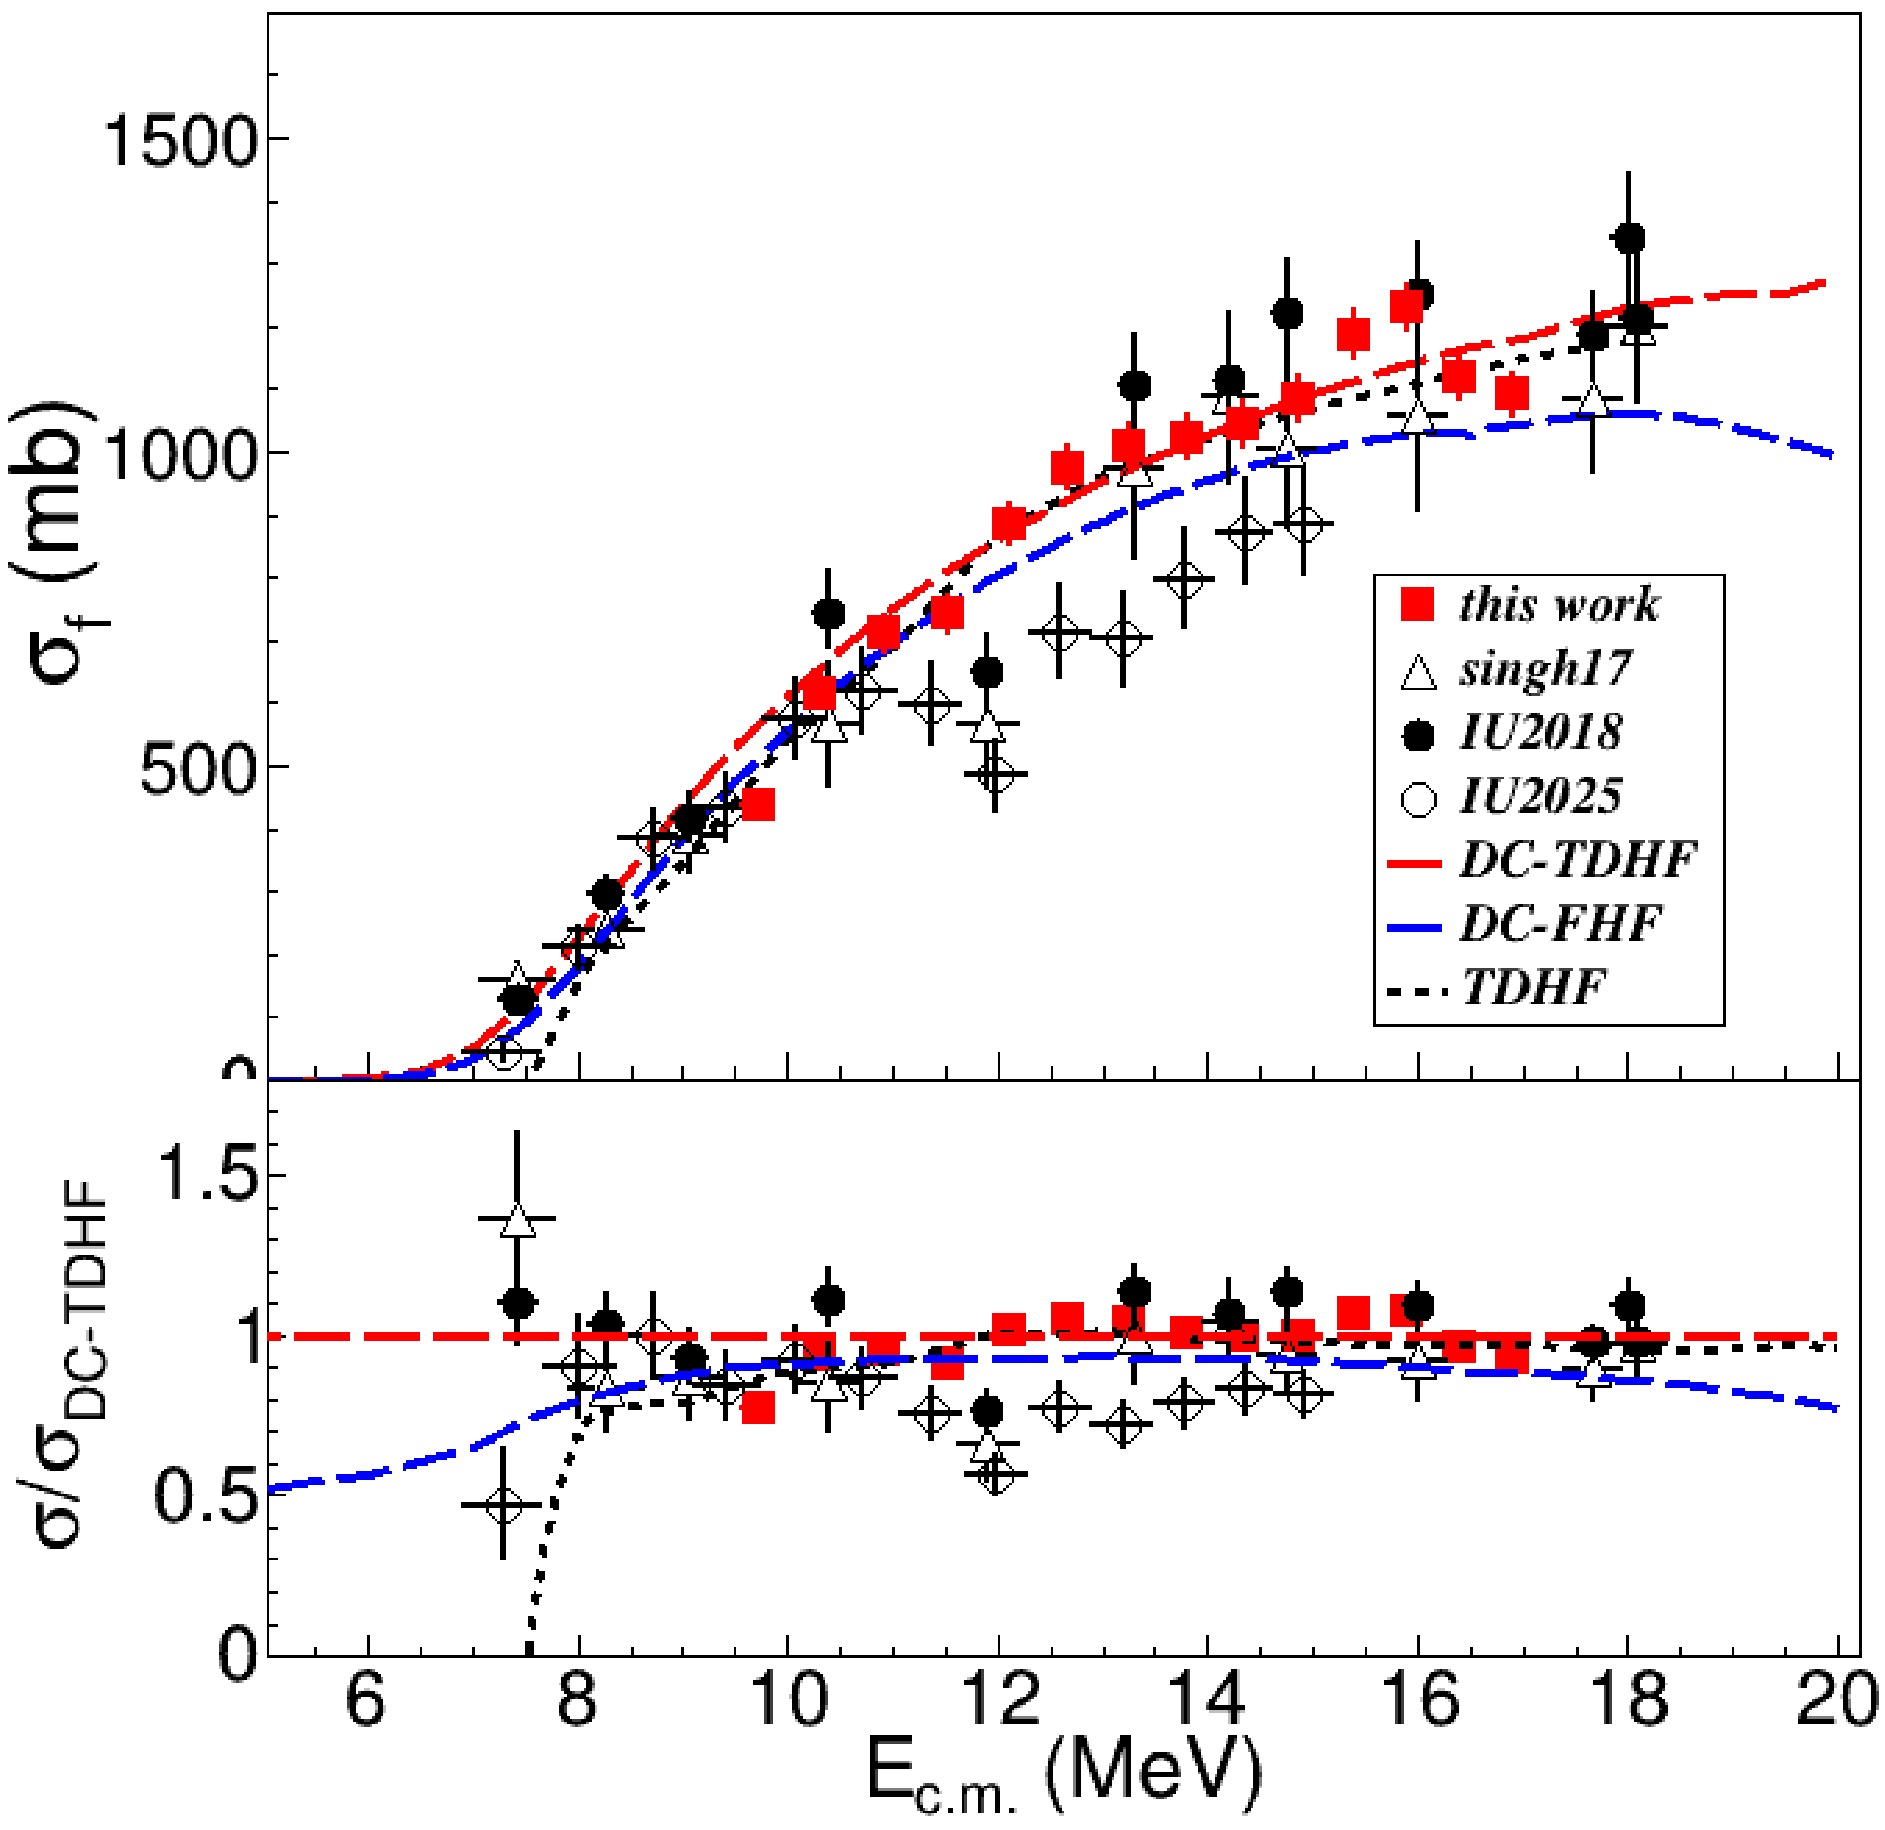
Figure 13. (color online) (Upper) Fusion cross sections for the
$^{19}{\rm{O}}$ +$^{12}{\rm{C}}$ system measured in this work (red stars) compared with those of Singh et al. (black triangles) [12], the IU2018 dataset (black filled circles) [21], and the IU2025 dataset (black open circles) [13]. Also shown are TDHF, DC-TDHF, and DC-FHF calculations. (Lower) Ratios of the measured and theoretical cross sections to the DC-TDHF prediction.Overall, our excitation function is consistent with those reported by Singh et al. and Vadas after introducing a normalization of 0.94 on their data. However, there is an exception near
$E_{\rm{c.m.}}\approx 12$ MeV where both the original Singh data and the improved Vadas data lie$\approx 40$ % below the theoretical predictions and our measurement. The recent measurements by Desilets et al. done using a MUSIC active target seems to confirm the structure reported by Singh et al. and Vadas. Another challenge is that the data of Desilets et al. is 34% lower than that of Singh et al. and Vadas, and 27% lower than our data at$E_{\rm{c.m.}}> 13$ MeV. The measurement of Singh et al. and Vadas was done with a thin carbon target and detector array covering limited angular range. Their final cross sections were obtained with the correction of the branching ratio and angular distribution predicted by statistical model, bring in some systematical uncertainties. However, our measurement using active target Time Projection Chamber does not depend on the statistical model calculation. Our measurement supports the result of Singh et al. and Vadas, and significantly differ from the Desilets et al. measurement.The
$^{23}{\rm{Ne}}$ channel observed in our experiment is attributed to an α-transfer reaction and is therefore excluded from the fusion cross section. The apparent suppression near$E_{\rm{c.m.}}\sim12$ MeV reported in recent MUSIC measurements may arise from the inclusion of this unresolved$^{23}{\rm{Ne}}$ transfer channel. The observed suppression may also reflect inconsistent normalization factors among different$^{19}{\rm{O}}$ +$^{12}{\rm{C}}$ measurements and the treatment of distinct reaction channels. Further experimental and theoretical studies are required to eliminate these systematic deviations and establish a consistent dataset.To investigate systematic trends across the oxygen isotopic chain, we fitted the
$^{16,17,18,19}{\rm{O}}$ +$^{12}{\rm{C}}$ fusion excitation functions using the Wong formula [23],$ \sigma_{\mathrm{fus}}(E) = \left( R_{B}^{2}\,\frac{\hbar\omega}{2E} \right) \ln \left[ 1 + \exp \left( \frac{2\pi(E - V_{B})}{\hbar\omega} \right) \right], $
(2) where
$R_B$ ,$V_B$ , and$\hbar\omega$ represent the barrier radius, height, and curvature, respectively. At sufficiently high energies, Eq. (2) reduces to the classical limit,$ \sigma_{\mathrm{fus}} = \pi R_{B}^{2} \left( 1 - \frac{V_{B}}{E} \right). $
(3) To compare the systems at energies above the barrier, we define a reduced fusion cross section
$ \sigma_{\mathrm{reduced}} = \sigma \left( \frac{A_p^{1/3} + 12^{1/3}} {18^{1/3} + 12^{1/3}} \right)^{2}, $
(4) where
$A_p$ is the projectile mass number. This corrects for the small ($\sim2$ % per mass unit) geometric changes in the interaction radius across the oxygen isotopes. The experimental reduced cross sections plotted against$1/E_{\rm{c.m.}}$ are shown in Fig. 14 together with the fitting results and the TDHF predictions.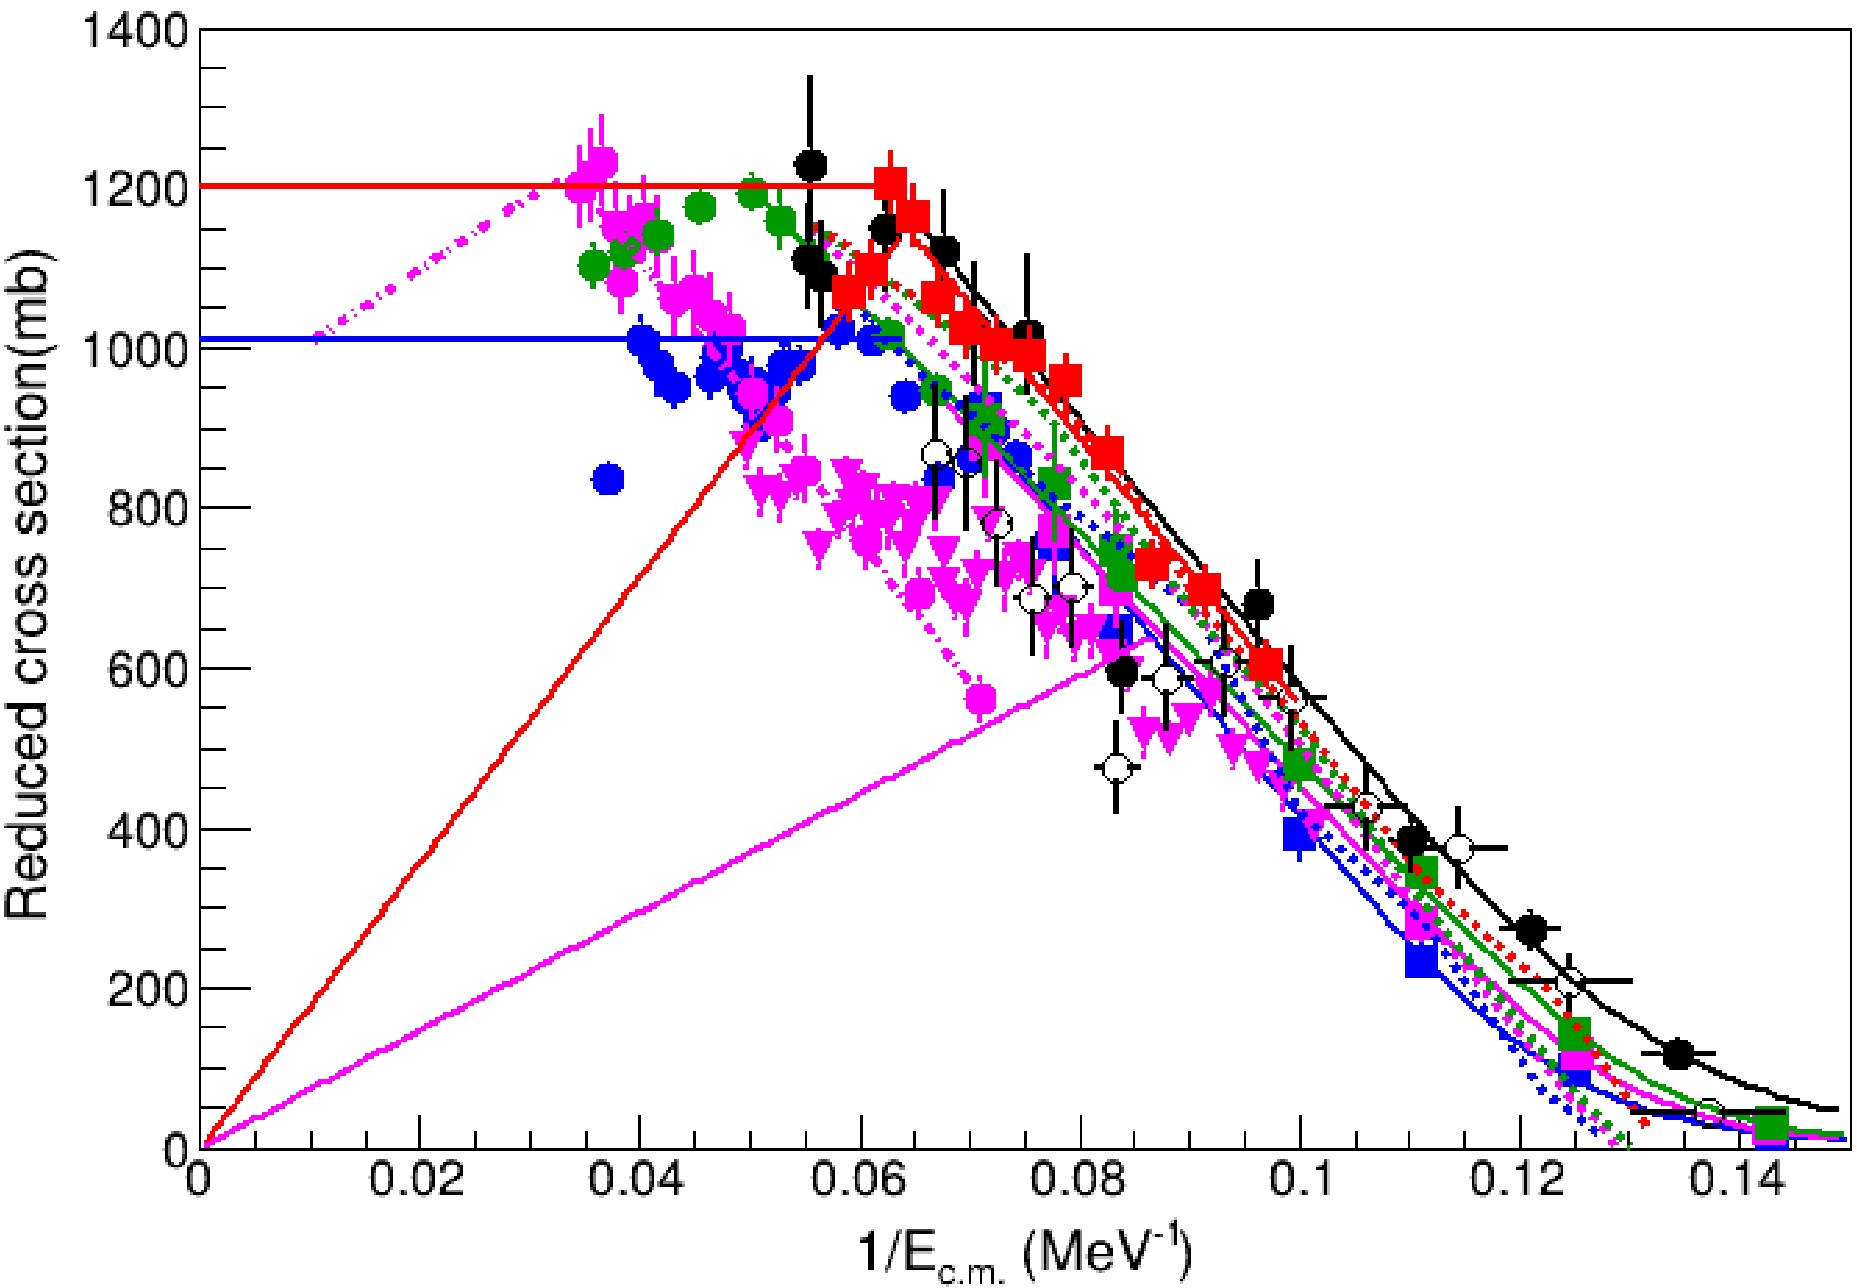
Figure 14. (color online) The reduced fusion cross section vs. the 1/
$E_{\rm{c.m.}}$ for the$^{16,17,18,19}{\rm{O}}$ +$^{12}{\rm{C}}$ fusion reaction. The$^{16}{\rm{O}}$ +$^{12}{\rm{C}}$ data from Refs. [24, 25] are shown as blue circles and squares; the$^{17}{\rm{O}}$ +$^{12}{\rm{C}}$ data from Refs. [25−27] as magenta squares, circles and triangles; the$^{18}{\rm{O}}$ +$^{12}{\rm{C}}$ data from Refs. [24, 25] as green circles and squares, and the$^{19}{\rm{O}}$ +$^{12}{\rm{C}}$ data from Refs. [13, 21] as black filled circles and unfilled circles. The data of this work are shown as red filled circles. The magenta dotted-dashed line shows the best fit to the Hertz measurement of$^{17}{\rm{O}}$ +$^{12}{\rm{C}}$ . The diagonal magenta and red solid lines mark the angular-momentum values of$8\hbar$ and$13\hbar$ , respectively, around which the$^{17}{\rm{O}}$ +$^{12}{\rm{C}}$ and$^{19}{\rm{O}}$ +$^{12}{\rm{C}}$ systems exhibit the V-shaped structure in their excitation functions.It was reported in Ref. [28] that the
$\sim37$ % enhancement in the average above-barrier fusion cross section for$^{19}{\rm{O}}$ in the range 12 MeV$< E_{\rm{c.m.}} <$ 18 MeV, relative to the β-stable oxygen isotopes, could not be reproduced by existing theories. In contrast, our results show that TDHF provides a good description of the$^{19}{\rm{O}}$ +$^{12}{\rm{C}}$ data, although it slightly overpredicts the fusion cross sections for the$^{17,18}{\rm{O}}$ +$^{12}{\rm{C}}$ systems as shown in Fig. 14.The extracted barrier parameters are listed in Table 1. Figure 15 compares the deduced
$R_B$ and$V_B$ values with the predictions of the São Paulo [29] and Bass potentials [30] and with TDHF [6, 31]. Experimentally,$R_B$ exhibits a relatively constant trend from A=16 to 18, followed by a$\sim0.6$ fm rise at$A=19$ . In contrast, all three theoretical models predict a more modest variation of only 0.2–0.4 fm. A similar trend is observed in the barrier heights ($V_B$ ): while both experiment and theory show an overall decrease with projectile mass number, the experimental spread ($\approx 0.6$ MeV) is significantly larger than those predicted by the São Paulo and Bass potentials ($\approx 0.2$ MeV) or by TDHF ($\approx 0.4$ MeV). TDHF also predicts a noticeably lower barrier for the odd-mass isotope, presumably due to the unpaired valence neutron occupying the$1d_{5/2}$ orbital, but such a signature is not evident in the experimental data.Reaction $R_B$ /fm$V_B$ /MeV$\hbar\omega$ /MeVRange/MeV ${}^{16}\mathrm{O}+{}^{12}\mathrm{C}$ a$8.0 \pm 0.1$ $8.0 \pm 0.1$ $3.2 \pm 0.3$ $6.9\text{–}13.9$ ${}^{17}\mathrm{O}+{}^{12}\mathrm{C}$ b$7.8 \pm 0.2$ $7.7 \pm 0.1$ $2.6 \pm 0.3$ $7.0\text{–}15.4$ ${}^{18}\mathrm{O}+{}^{12}\mathrm{C}$ a$7.8 \pm 0.1$ $7.5 \pm 0.1$ $2.5 \pm 0.2$ $6.9\text{–}20.0$ ${}^{19}\mathrm{O}+{}^{12}\mathrm{C}$ c$8.5 \pm 0.3$ $7.4 \pm 0.3$ $3.5 \pm 1.5$ $7.4\text{–}15.4$ ${}^{19}\mathrm{O}+{}^{12}\mathrm{C}$ d$8.4 \pm 0.2$ $7.3 \pm 0.3$ – $10.0\text{–}15.4$ a Data from Refs. [24, 25]. The Ref. [25] dataset is renormalized to Ref. [24] using a factor of 1.14.
b Ref. [25] renormalized using the factor above.
c Data from Ref. [21], renormalized to the present work by a factor of 0.935. A fit to the unrenormalized data gives Rb = 8.8 ± 0.3 fm.
d Present work.Table 1. Barrier parameters extracted from fusion excitation functions for
$^{16,17,18,19}{\rm{O}}$ +$^{12}{\rm{C}}$ systems. The final column lists the center-of-mass energy range used in the fits.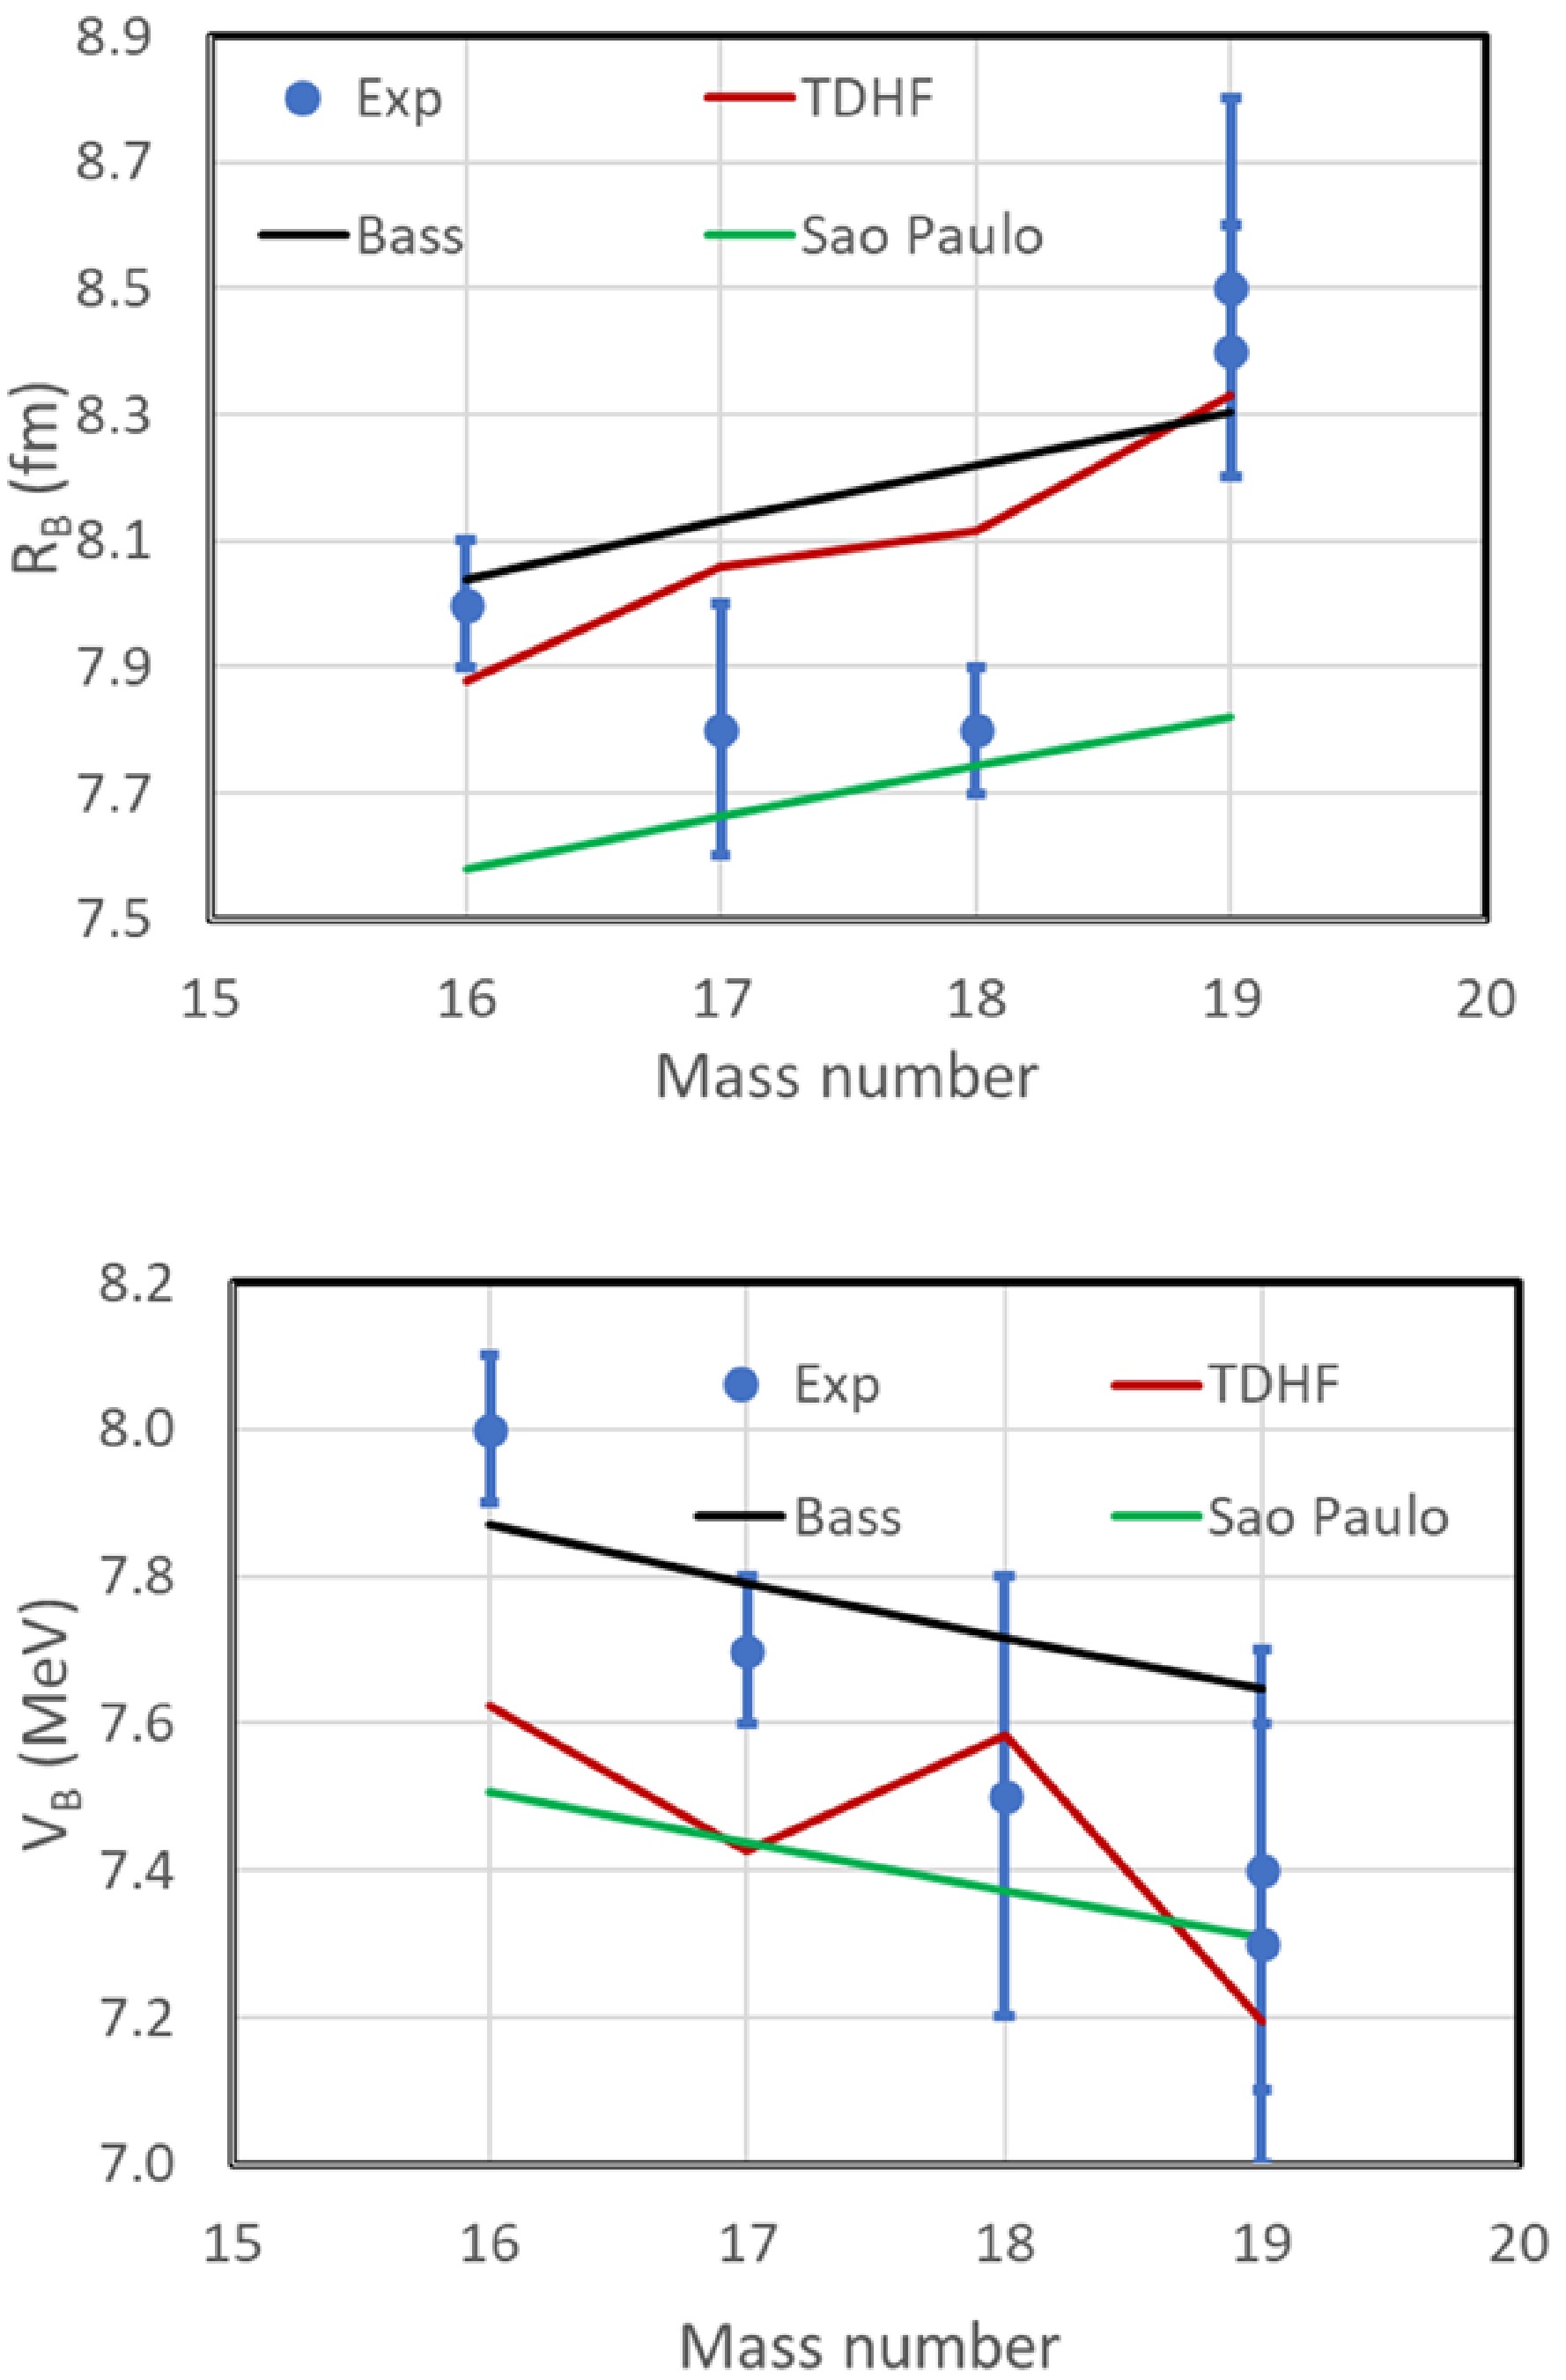
Figure 15. (color online) (Upper panel) Coulomb barrier radius (RB) vs. the projectile mass number for the 16,17,18,19O+12C fusion reaction; (Lower panel) Coulomb barrier height (VB) vs. the projectile mass number. The green, black and dark red lines represent the theoretical prediction of São-Paulo potential, Bass potential and TDHF, respectively.
For the
$^{16}{\rm{O}}$ +$^{12}{\rm{C}}$ system, which contains no$sd$ -shell valence neutrons, the maximum fusion cross section is 970 mb (reduced value of 1011 mb). In contrast, the β-stable isotopes with$sd$ -shell neutrons, such as$^{17,18}{\rm{O}}$ +$^{12}{\rm{C}}$ , reach maximum values near 1200 mb [32]. In the present work, the$^{19}{\rm{O}}$ +$^{12}{\rm{C}}$ system is found to reach a maximum complete-fusion cross section of$1229 \pm 41$ mb, a value consistent with the β-stable$sd$ -shell systems. The result is shown together with parameters of other C+O fusion reactions in Table 2. This result provides the first evidence that the systematic enhancement associated with$sd$ -shell neutrons extends into the neutron-rich, β-unstable isotope$^{19}{\rm{O}}$ .Reaction $E_{\mathrm{cr}}$ /MeV$\sigma_{m}$ /mb$\sigma_{m,\mathrm{err}}$ /mb$\ell_{\mathrm{cr}}$ ($\hbar$ )$^{12}\mathrm{C}+{}^{16}\mathrm{O}$ 24.95 970.0 30 12.9 $^{12}\mathrm{C}+{}^{17}\mathrm{O}$ 24.78 1140.3 52 18.6 $^{12}\mathrm{C}+{}^{18}\mathrm{O}$ 19.95 1195.0 24 16.2 $^{12}\mathrm{C}+{}^{19}\mathrm{O}$ 15.89 1229.0 41 14.8 Table 2. Fusion reaction parameters at the critical energy
$ E_{\mathrm{cr}}$ .$ \sigma_{m}$ ,$ \sigma_{m,\mathrm{err}}$ , and$ \ell_{\mathrm{cr}}$ are the maximum complete fusion cross section, the cross section error and the critical angular momentum, respectively.The energy at which the fusion cross section reaches its maximum is defined as the critical energy (
$ E_{\mathrm{cr}} $ ). The values of$ 1/E_{\mathrm{cr}} $ exhibit a linear dependence on the oxygen mass number, as shown in Fig. 16, indicating that fusion in the neutron-rich isotopes with more valence neutrons outside of the core reaches its maximum at increasingly lower energies. With such a empirical linear relationship, we predict that the critical energies of$^{20,21}{\rm{O}}$ +$^{12}{\rm{C}}$ to be 13.3 MeV and 11.3 MeV, respectively. The critical angular momentum$l_{\rm{cr}}$ , which defines the highest partial wave contributing to complete fusion, can be inferred from the maximum fusion cross section and the critical energy [33]. For$^{16,17,18,19}{\rm{O}}$ +$^{12}{\rm{C}}$ , the critical angular momenta are determined as$12.9\hbar$ ,$18.6\hbar$ ,$16.2\hbar$ and$14.8\hbar$ , respectively. The closest approach distance ($R_{c}$ ) at the critical energy ($ \rm{\mathit{E}}_{\mathrm{cr}} $ ) is obtained with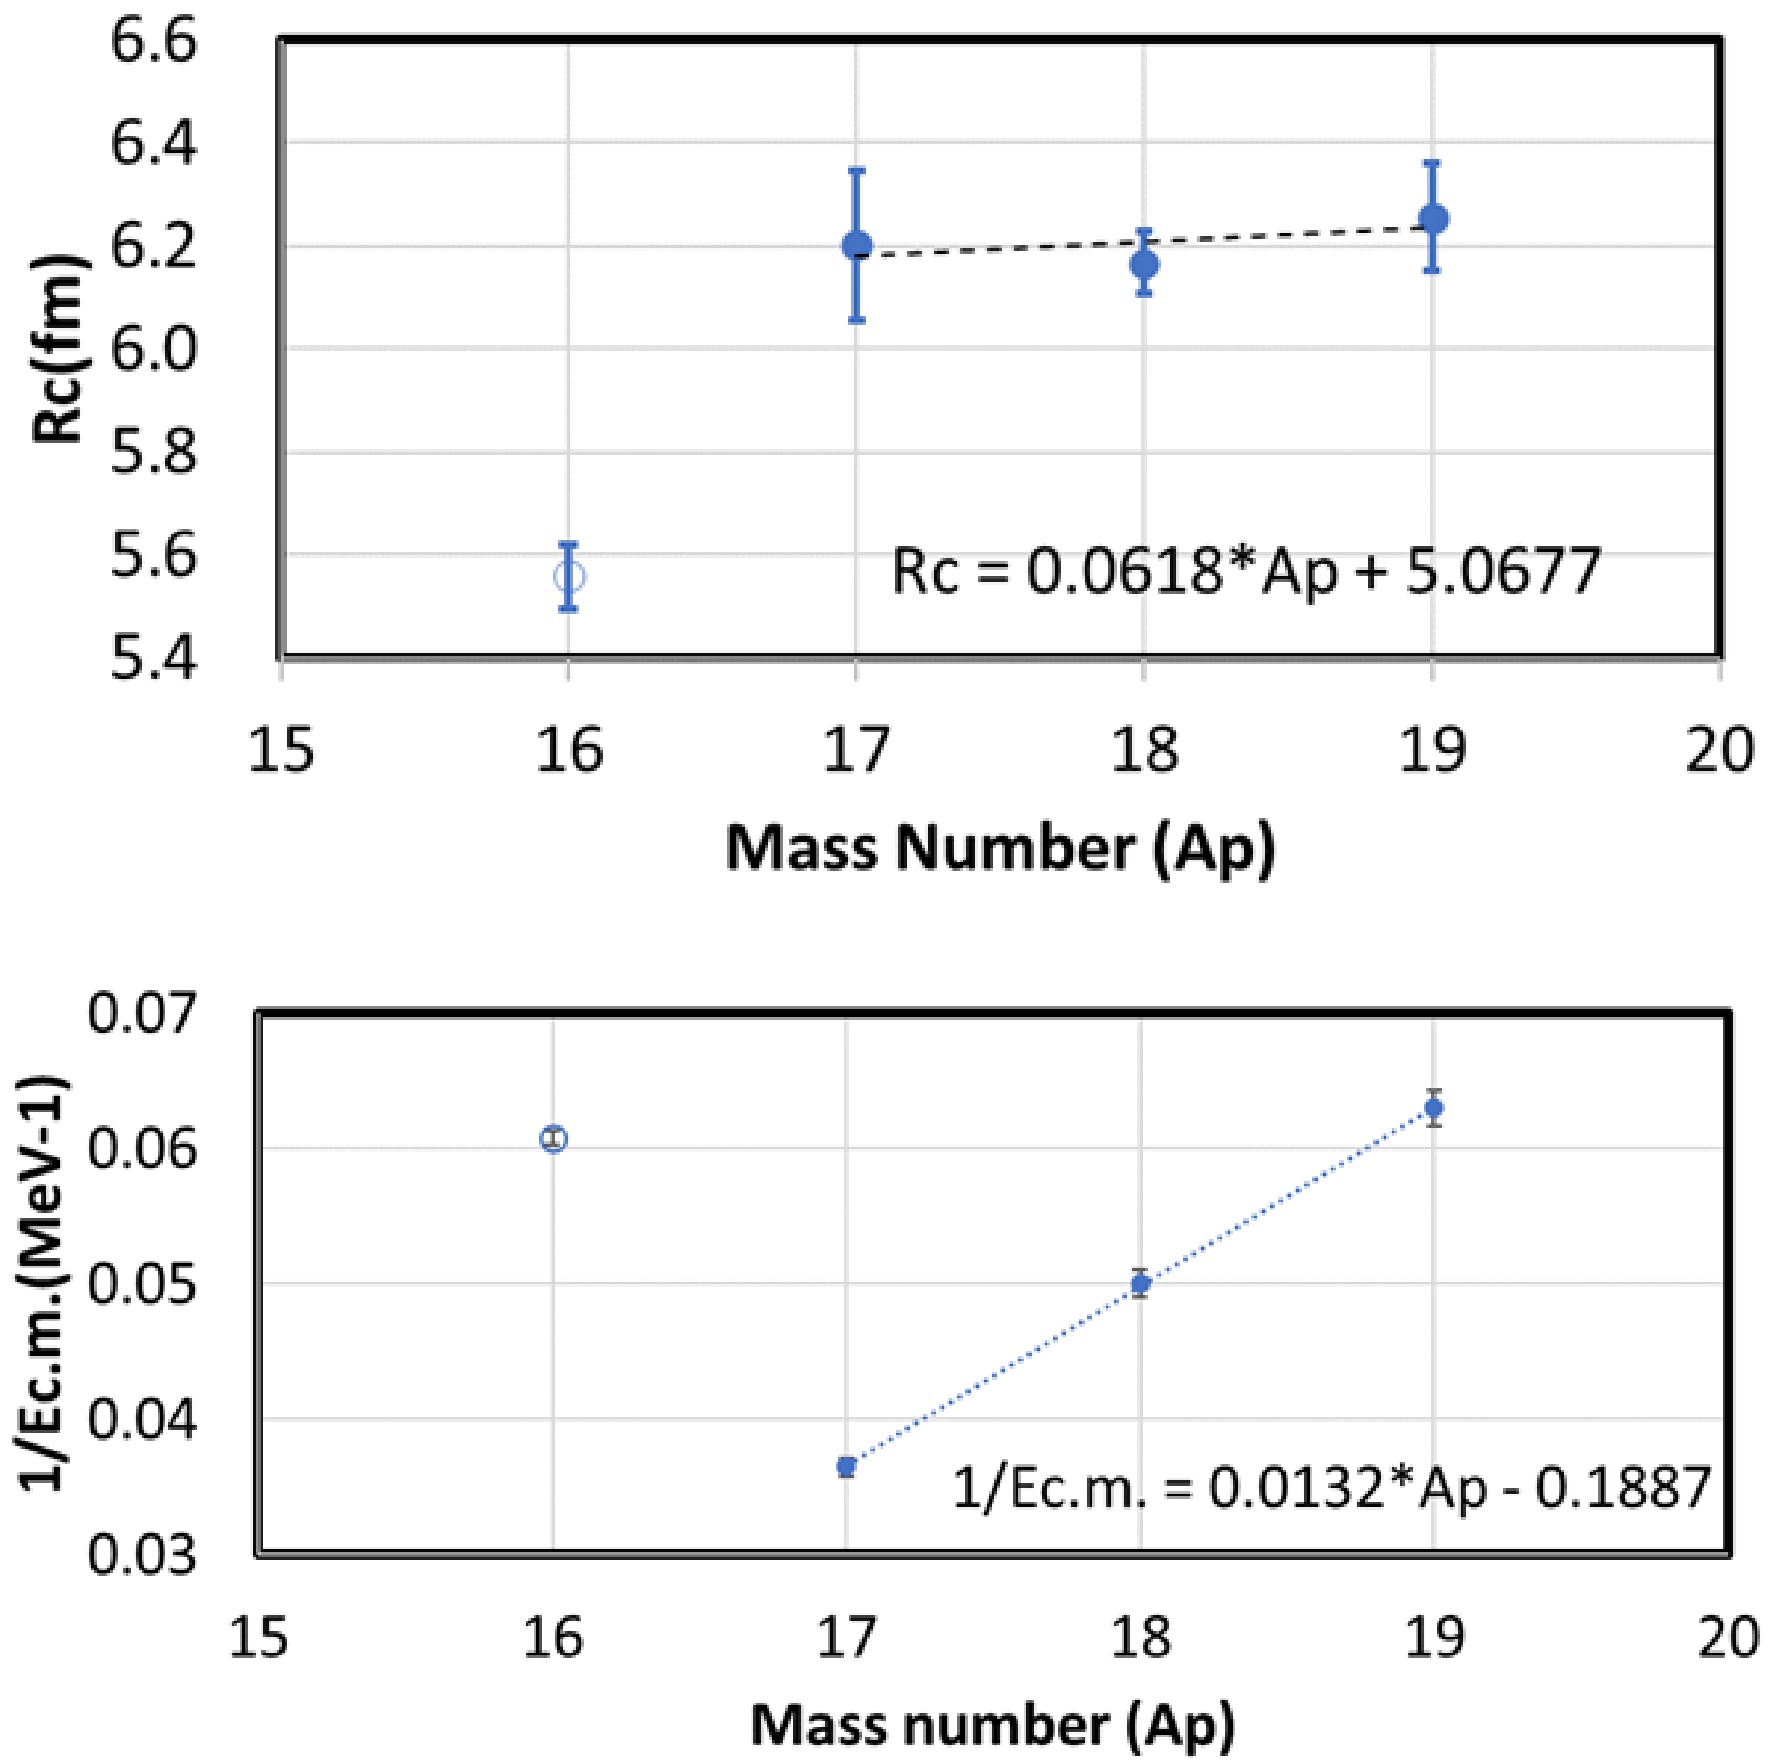
Figure 16. (color online) (Upper panel) The dependence of the closest approach distance on the mass number of oxygen isotopes. (Lower panel) The dependence of the inverse of critical energy on the mass number of the oxygen isotopes. The open and filled circles represent
$^{16}{\rm{O}}$ and$^{17,18,19}{\rm{O}}$ , respectively. The dashed line is the best fit to the systems involving$^{17,18,19}{\rm{O}}$ . The best fit equations to the$^{17,18,19}{\rm{O}}$ are also shown in the figures.$ R_{c} = {l_{\rm cr}{\rlap-\lambda }(E_{\rm cr})}. $
(5) A weak linear correlation between
$R_c$ and the mass number of oxygen isotopes with$sd$ -shell valence neutrons is also observed and presented in Fig. 16.The valence neutrons outside the core increase the nuclear radius and lower the effective interaction barrier. Furthermore, when neutron transfer channels have positive Q-values, coupling to these channels enhances the fusion probability. For example, an upper limit of
$^{12}{\rm{C}}$ +$^{12}{\rm{C}}$ has been reported in the carbon isotopic chain: the$^{12}{\rm{C}}$ +$^{12}{\rm{C}}$ fusion cross section is bounded above by those of$^{12}{\rm{C}}$ +$^{13}{\rm{C}}$ and$^{13}{\rm{C}}$ +$^{13}{\rm{C}}$ at energies below and above the barrier [34]. Both our data and the theoretical models considered here indicate such enhancements near the barrier, forming an upper limit for the$^{16}{\rm{O}}$ +$^{12}{\rm{C}}$ fusion cross section from the energies around the Coulomb barrier to$E_{\rm{c.m.}}\approx$ 12.5 MeV.With the unpaired neutron in the
$1d_{5/2}$ orbital, the$^{17,19}{\rm{O}}$ +$^{12}{\rm{C}}$ fusion cross sections are expected to upper bound that of the$^{16}{\rm{O}}$ +$^{12}{\rm{C}}$ system. For$^{19}{\rm{O}}$ +$^{12}{\rm{C}}$ , this expectation is indeed confirmed. Its fusion probability exceeds those of all other systems discussed in this work. In addition, its reduced cross section exhibits a V-shaped dependence on$1/E_{\rm{c.m.}}$ at energies above the critical energy, similar to the oscillatory behavior observed in$^{16}{\rm{O}}$ +$^{12}{\rm{C}}$ .The
$^{17}{\rm{O}}$ +$^{12}{\rm{C}}$ system shows a similar V-shaped pattern, but not at the location of its fusion maximum. Instead, at$1/E_{\rm{c.m.}}\approx 0.08$ MeV$^{-1}$ ($E_{\rm{c.m.}}\approx 12.5$ MeV), the high-energy data of Hertz et al. [26] lie about 40% below both the lower-energy measurements of Eyal et al. [25] and the fusion cross sections of all other O+C systems. This long-standing discrepancy between the two earlier measurements [25, 26] motivated two recent active-target experiments at FSU and IU [27, 35], which identified transitional behavior between the two datasets, although some differences remain [27].The anomalous suppression observed in
$^{17}{\rm{O}}$ +$^{12}{\rm{C}}$ at energies above the barrier calls for additional experimental and theoretical investigation. The V-shaped excitation patterns and the linear correlation of the critical energies in$^{17,18,19}{\rm{O}}$ +$^{12}{\rm{C}}$ may be related to the specific role played by the unpaired neutron in the$1d_{5/2}$ orbital. A more complete understanding of the fusion behavior above the Coulomb barrier would provide valuable constraints on nuclear interaction potentials and reaction models, which is essential for reliable extrapolations to sub-barrier energies. -
Figure 13 compares the fusion excitation function measured in this work with the earlier measurement of Singh et al. [12], the higher-statistics update by Vadas [21], the recent measurement by Desilets et al. [13], and theoretical predictions from time-dependent Hartree–Fock (TDHF), density-constrained TDHF (DC-TDHF), and density-constrained frozen Hartree–Fock (DC-FHF). The present measurement spans center-of-mass energies from
$E_{\rm{c.m.}}\approx 9.7$ to 16.9 MeV and agrees well with the TDHF and DC-TDHF calculations, both of which incorporate dynamical effects such as neck formation, nucleon transfer, and collective excitation during the fusion process. The only exception is that the TDHF and DC-TDHF predictions lie about 8–10% below our measured maximum fusion cross section at$E_{\rm{c.m.}}=16$ MeV and do not reproduce the subsequent decline at higher energies. The DC-FHF calculation, which treats fusion as penetration through a static potential, yields cross sections an additional$\sim 10$ % lower than the TDHF and DC-TDHF results, lies systematically below our measurement over this energy range. The comparison with DC-FHF underscores the importance of dynamical effects in accurately describing the fusion process.
Figure 13. (color online) (Upper) Fusion cross sections for the
$^{19}{\rm{O}}$ +$^{12}{\rm{C}}$ system measured in this work (red stars) compared with those of Singh et al. (black triangles) [12], the IU2018 dataset (black filled circles) [21], and the IU2025 dataset (black open circles) [13]. Also shown are TDHF, DC-TDHF, and DC-FHF calculations. (Lower) Ratios of the measured and theoretical cross sections to the DC-TDHF prediction.Overall, our excitation function is consistent with those reported by Singh et al. and Vadas after introducing a normalization of 0.94 on their data. However, there is an exception near
$E_{\rm{c.m.}}\approx 12$ MeV where both the original Singh data and the improved Vadas data lie$\approx 40$ % below the theoretical predictions and our measurement. The recent measurements by Desilets et al. done using a MUSIC active target seems to confirm the structure reported by Singh et al. and Vadas. Another challenge is that the data of Desilets et al. is 34% lower than that of Singh et al. and Vadas, and 27% lower than our data at$E_{\rm{c.m.}}> 13$ MeV. The measurement of Singh et al. and Vadas was done with a thin carbon target and detector array covering limited angular range. Their final cross sections were obtained with the correction of the branching ratio and angular distribution predicted by statistical model, bring in some systematical uncertainties. However, our measurement using active target Time Projection Chamber does not depend on the statistical model calculation. Our measurement supports the result of Singh et al. and Vadas, and significantly differ from the Desilets et al. measurement.The
$^{23}{\rm{Ne}}$ channel observed in our experiment is attributed to an α-transfer reaction and is therefore excluded from the fusion cross section. The apparent suppression near$E_{\rm{c.m.}}\sim12$ MeV reported in recent MUSIC measurements may arise from the inclusion of this unresolved$^{23}{\rm{Ne}}$ transfer channel. The observed suppression may also reflect inconsistent normalization factors among different$^{19}{\rm{O}}$ +$^{12}{\rm{C}}$ measurements and the treatment of distinct reaction channels. Further experimental and theoretical studies are required to eliminate these systematic deviations and establish a consistent dataset.To investigate systematic trends across the oxygen isotopic chain, we fitted the
$^{16,17,18,19}{\rm{O}}$ +$^{12}{\rm{C}}$ fusion excitation functions using the Wong formula [23],$ \sigma_{\mathrm{fus}}(E) = \left( R_{B}^{2}\,\frac{\hbar\omega}{2E} \right) \ln \left[ 1 + \exp \left( \frac{2\pi(E - V_{B})}{\hbar\omega} \right) \right], $
(2) where
$R_B$ ,$V_B$ , and$\hbar\omega$ represent the barrier radius, height, and curvature, respectively. At sufficiently high energies, Eq. (2) reduces to the classical limit,$ \sigma_{\mathrm{fus}} = \pi R_{B}^{2} \left( 1 - \frac{V_{B}}{E} \right). $
(3) To compare the systems at energies above the barrier, we define a reduced fusion cross section
$ \sigma_{\mathrm{reduced}} = \sigma \left( \frac{A_p^{1/3} + 12^{1/3}} {18^{1/3} + 12^{1/3}} \right)^{2}, $
(4) where
$A_p$ is the projectile mass number. This corrects for the small ($\sim2$ % per mass unit) geometric changes in the interaction radius across the oxygen isotopes. The experimental reduced cross sections plotted against$1/E_{\rm{c.m.}}$ are shown in Fig. 14 together with the fitting results and the TDHF predictions.
Figure 14. (color online) The reduced fusion cross section vs. the 1/
$E_{\rm{c.m.}}$ for the$^{16,17,18,19}{\rm{O}}$ +$^{12}{\rm{C}}$ fusion reaction. The$^{16}{\rm{O}}$ +$^{12}{\rm{C}}$ data from Refs. [24, 25] are shown as blue circles and squares; the$^{17}{\rm{O}}$ +$^{12}{\rm{C}}$ data from Ref. [25−27] as magenta squares, circles and triangles; the$^{18}{\rm{O}}$ +$^{12}{\rm{C}}$ data from Refs. [24, 25] as green circles and squares, and the$^{19}{\rm{O}}$ +$^{12}{\rm{C}}$ data from Ref. [13, 21] as black filled circles and unfilled circles. The data of this work are shown as red filled circles. The magenta dotted-dashed line shows the best fit to the Hertz measurement of$^{17}{\rm{O}}$ +$^{12}{\rm{C}}$ . The diagonal magenta and red solid lines mark the angular-momentum values of$8\hbar$ and$13\hbar$ , respectively, around which the$^{17}{\rm{O}}$ +$^{12}{\rm{C}}$ and$^{19}{\rm{O}}$ +$^{12}{\rm{C}}$ systems exhibit the V-shaped structure in their excitation functions.It was reported in Ref. [28] that the
$\sim37$ % enhancement in the average above-barrier fusion cross section for$^{19}{\rm{O}}$ in the range 12 MeV$< E_{\rm{c.m.}} <$ 18 MeV, relative to the β-stable oxygen isotopes, could not be reproduced by existing theories. In contrast, our results show that TDHF provides a good description of the$^{19}{\rm{O}}$ +$^{12}{\rm{C}}$ data, although it slightly overpredicts the fusion cross sections for the$^{17,18}{\rm{O}}$ +$^{12}{\rm{C}}$ systems as shown in Fig. 14.The extracted barrier parameters are listed in Table 1. Figure 15 compares the deduced
$R_B$ and$V_B$ values with the predictions of the São Paulo [29] and Bass potentials [30] and with TDHF [6, 31]. Experimentally,$R_B$ exhibits a relatively constant trend from A=16 to 18, followed by a$\sim0.6$ fm rise at$A=19$ . In contrast, all three theoretical models predict a more modest variation of only 0.2–0.4 fm. A similar trend is observed in the barrier heights ($V_B$ ): while both experiment and theory show an overall decrease with projectile mass number, the experimental spread ($\approx 0.6$ MeV) is significantly larger than those predicted by the São Paulo and Bass potentials ($\approx 0.2$ MeV) or by TDHF ($\approx 0.4$ MeV). TDHF also predicts a noticeably lower barrier for the odd-mass isotope, presumably due to the unpaired valence neutron occupying the$1d_{5/2}$ orbital, but such a signature is not evident in the experimental data.Reaction $R_b$ (fm)$V_b$ (MeV)$\hbar\omega$ (MeV)Range (MeV) ${}^{16}\mathrm{O}+{}^{12}\mathrm{C}$ a$8.0 \pm 0.1$ $8.0 \pm 0.1$ $3.2 \pm 0.3$ $6.9\text{-}13.9$ ${}^{17}\mathrm{O}+{}^{12}\mathrm{C}$ b$7.8 \pm 0.2$ $7.7 \pm 0.1$ $2.6 \pm 0.3$ $7.0\text{-}15.4$ ${}^{18}\mathrm{O}+{}^{12}\mathrm{C}$ a$7.8 \pm 0.1$ $7.5 \pm 0.1$ $2.5 \pm 0.2$ $6.9\text{-}20.0$ ${}^{19}\mathrm{O}+{}^{12}\mathrm{C}$ c$8.5 \pm 0.3$ $7.4 \pm 0.3$ $3.5 \pm 1.5$ $7.4\text{-}15.4$ ${}^{19}\mathrm{O}+{}^{12}\mathrm{C}$ d$8.4 \pm 0.2$ $7.3 \pm 0.3$ – $10.0\text{-}15.4$ a Data from Refs. [24, 25]. The Ref. [25] dataset is renormalized to Ref. [24] using a factor of 1.14.
b Ref. [25] renormalized using the factor above.
c Data from Ref. [21], renormalized to the present work by a factor of 0.935. A fit to the unrenormalized data gives Rb = 8.8 ± 0.3 fm.
d Present work.Table 1. Barrier parameters extracted from fusion excitation functions for
$^{16,17,18,19}{\rm{O}}$ +$^{12}{\rm{C}}$ systems. The final column lists the center-of-mass energy range used in the fits.
Figure 15. (color online) (Upper panel) Coulomb barrier radius (RB) vs. the projectile mass number for the 16,17,18,19O+12C fusion reaction; (Lower panel) Coulomb barrier height (VB) vs. the projectile mass number. The green, black and dark red lines represent the theoretical prediction of São-Paulo potential, Bass potential and TDHF, respectively.
For the
$^{16}{\rm{O}}$ +$^{12}{\rm{C}}$ system, which contains no$sd$ -shell valence neutrons, the maximum fusion cross section is 970 mb (reduced value of 1011 mb). In contrast, the β-stable isotopes with$sd$ -shell neutrons, such as$^{17,18}{\rm{O}}$ +$^{12}{\rm{C}}$ , reach maximum values near 1200 mb [32]. In the present work, the$^{19}{\rm{O}}$ +$^{12}{\rm{C}}$ system is found to reach a maximum complete-fusion cross section of$1229 \pm 41$ mb, a value consistent with the β-stable$sd$ -shell systems. The result is shown together with parameters of other C+O fusion reactions in Table 2. This result provides the first evidence that the systematic enhancement associated with$sd$ -shell neutrons extends into the neutron-rich, β-unstable isotope$^{19}{\rm{O}}$ .Reaction $E_{\mathrm{cr}}$ (MeV)$\sigma_{m}$ (mb)$\sigma_{m,\mathrm{err}}$ (mb)$\ell_{\mathrm{cr}}$ ($\hbar$ )$^{12}\mathrm{C}+{}^{16}\mathrm{O}$ 24.95 970.0 30 12.9 $^{12}\mathrm{C}+{}^{17}\mathrm{O}$ 24.78 1140.3 52 18.6 $^{12}\mathrm{C}+{}^{18}\mathrm{O}$ 19.95 1195.0 24 16.2 $^{12}\mathrm{C}+{}^{19}\mathrm{O}$ 15.89 1229.0 41 14.8 Table 2. Fusion reaction parameters at the critical energy
$ E_{\mathrm{cr}}$ .$ \sigma_{m}$ ,$ \sigma_{m,\mathrm{err}}$ , and$ \ell_{\mathrm{cr}}$ are the maximum complete fusion cross section, the cross section error and the critical angular momentum, respectively.The energy at which the fusion cross section reaches its maximum is defined as the critical energy (
$E_{cr}$ ). The values of$1/E_{cr}$ exhibit a linear dependence on the oxygen mass number, as shown in Fig. 16, indicating that fusion in the neutron-rich isotopes with more valence neutrons outside of the core reaches its maximum at increasingly lower energies. With such a empirical linear relationship, we predict that the critical energies of$^{20,21}{\rm{O}}$ +$^{12}{\rm{C}}$ to be 13.3 MeV and 11.3 MeV, respectively. The critical angular momentum$l_{\rm{cr}}$ , which defines the highest partial wave contributing to complete fusion, can be inferred from the maximum fusion cross section and the critical energy [33]. For$^{16,17,18,19}{\rm{O}}$ +$^{12}{\rm{C}}$ , the critical angular momenta are determined as$12.9\hbar$ ,$18.6\hbar$ ,$16.2\hbar$ and$14.8\hbar$ , respectively. The closest approach distance ($R_{c}$ ) at the critical energy (${\rm{E}}_{cr}$ ) is obtained with
Figure 16. (color online) (Upper panel) The dependence of the closest approach distance on the mass number of oxygen isotopes. (Lower panel) The dependence of the inverse of critical energy on the mass number of the oxygen isotopes. The open and filled circles represent
$^{16}{\rm{O}}$ and$^{17,18,19}{\rm{O}}$ , respectively. The dashed line is the best fit to the systems involving$^{17,18,19}{\rm{O}}$ . The best fit equations to the$^{17,18,19}{\rm{O}}$ are also shown in the figures.$ R_{c} = {l_{cr}{\rlap- \lambda }(E_{cr})}. $
(5) A weak linear correlation between
$R_c$ and the mass number of oxygen isotopes with$sd$ -shell valence neutrons is also observed and presented in Fig. 16.The valence neutrons outside the core increase the nuclear radius and lower the effective interaction barrier. Furthermore, when neutron transfer channels have positive Q-values, coupling to these channels enhances the fusion probability. For example, an upper limit of
$^{12}{\rm{C}}$ +$^{12}{\rm{C}}$ has been reported in the carbon isotopic chain: the$^{12}{\rm{C}}$ +$^{12}{\rm{C}}$ fusion cross section is bounded above by those of$^{12}{\rm{C}}$ +$^{13}{\rm{C}}$ and$^{13}{\rm{C}}$ +$^{13}{\rm{C}}$ at energies below and above the barrier [34]. Both our data and the theoretical models considered here indicate such enhancements near the barrier, forming an upper limit for the$^{16}{\rm{O}}$ +$^{12}{\rm{C}}$ fusion cross section from the energies around the Coulomb barrier to$E_{\rm{c.m.}}\approx$ 12.5 MeV.With the unpaired neutron in the
$1d_{5/2}$ orbital, the$^{17,19}{\rm{O}}$ +$^{12}{\rm{C}}$ fusion cross sections are expected to upper bound that of the$^{16}{\rm{O}}$ +$^{12}{\rm{C}}$ system. For$^{19}{\rm{O}}$ +$^{12}{\rm{C}}$ , this expectation is indeed confirmed. Its fusion probability exceeds those of all other systems discussed in this work. In addition, its reduced cross section exhibits a V-shaped dependence on$1/E_{\rm{c.m.}}$ at energies above the critical energy, similar to the oscillatory behavior observed in$^{16}{\rm{O}}$ +$^{12}{\rm{C}}$ .The
$^{17}{\rm{O}}$ +$^{12}{\rm{C}}$ system shows a similar V-shaped pattern, but not at the location of its fusion maximum. Instead, at$1/E_{\rm{c.m.}}\approx 0.08$ MeV$^{-1}$ ($E_{\rm{c.m.}}\approx 12.5$ MeV), the high-energy data of Hertz et al. [26] lie about 40% below both the lower-energy measurements of Eyal et al. [25] and the fusion cross sections of all other O+C systems. This long-standing discrepancy between the two earlier measurements [25, 26] motivated two recent active-target experiments at FSU and IU [27, 35], which identified transitional behavior between the two datasets, although some differences remain [27].The anomalous suppression observed in
$^{17}{\rm{O}}$ +$^{12}{\rm{C}}$ at energies above the barrier calls for additional experimental and theoretical investigation. The V-shaped excitation patterns and the linear correlation of the critical energies in$^{17,18,19}{\rm{O}}$ +$^{12}{\rm{C}}$ may be related to the specific role played by the unpaired neutron in the$1d_{5/2}$ orbital. A more complete understanding of the fusion behavior above the Coulomb barrier would provide valuable constraints on nuclear interaction potentials and reaction models, which is essential for reliable extrapolations to sub-barrier energies. -
We have measured the
$^{19}{\rm{O}}$ +$^{12}{\rm{C}}$ fusion excitation function using the MATE active-target TPC at IMP over the range$9.7 \leqslant E_{\rm{c.m.}} \leqslant 16.9$ MeV. The results show good agreement with DC-TDHF and TDHF calculations, confirming the importance of dynamical effects near the Coulomb barrier, but differ significantly from the previous measurement performed with a MUSIC active target. We suspect that the inclusion of the α-transfer channel and differences in normalization may have contributed to this discrepancy. The maximum fusion cross section ($\sim$ 1200 mb) reported in the β-stable O+C systems remains valid in the$^{19}{\rm{O}}$ +$^{12}{\rm{C}}$ system. A linear dependence of both$1/E_{\rm{cr}}$ and the closest-approach distance ($R_c$ ) on the oxygen mass number is observed for$^{17,18,19}{\rm{O}}$ , indicating that additional valence neutrons systematically lower the critical energy..The V-shaped patterns are observed in the excitation functions of
$^{17,19}{\rm{O}}$ +$^{12}{\rm{C}}$ systems. The anomalous suppression observed in$^{17}{\rm{O}}$ +$^{12}{\rm{C}}$ at energies above the barrier calls for additional experimental and theoretical investigation. Future measurements with even more neutron-rich oxygen beams, such as$^{21,22}{\rm{O}}$ at FRIB ReA3, will provide further critical tests and new opportunities for theoretical developments.The planned CiADS + HIAF facilities [36, 37] will be capable of providing neutron-rich beams such as
$^{90-93}{{{\mathrm{Kr}}}}$ and$^{140-142}{{{\mathrm{Xe}}}}$ , potentially offering a new pathway toward producing nuclei in the predicted island of stability [38]. Our experimental results and analysis highlights the effect of the valence neutrons on the complete fusion reaction cross sections. Further experimental studies of the fusion reaction or multi-nucleon transfer reaction with the heavier neutron-rich isotopes are needed to guide the development of nuclear reaction theory. -
We have measured the
$^{19}{\rm{O}}$ +$^{12}{\rm{C}}$ fusion excitation function using the MATE active-target TPC at IMP over the range$9.7 \leqslant E_{\rm{c.m.}} \leqslant 16.9$ MeV. The results show good agreement with DC-TDHF and TDHF calculations, confirming the importance of dynamical effects near the Coulomb barrier, but differ significantly from the previous measurement performed with a MUSIC active target. We suspect that the inclusion of the α-transfer channel and differences in normalization may have contributed to this discrepancy. The maximum fusion cross section ($\sim$ 1200 mb) reported in the β-stable O+C systems remains valid in the$^{19}{\rm{O}}$ +$^{12}{\rm{C}}$ system. A linear dependence of both$1/E_{\rm{cr}}$ and the closest-approach distance ($R_c$ ) on the oxygen mass number is observed for$^{17,18,19}{\rm{O}}$ , indicating that additional valence neutrons systematically lower the critical energy.The V-shaped patterns are observed in the excitation functions of
$^{17,19}{\rm{O}}$ +$^{12}{\rm{C}}$ systems. The anomalous suppression observed in$^{17}{\rm{O}}$ +$^{12}{\rm{C}}$ at energies above the barrier calls for additional experimental and theoretical investigation. Future measurements with even more neutron-rich oxygen beams, such as$^{21,22}{\rm{O}}$ at FRIB ReA3, will provide further critical tests and new opportunities for theoretical developments.The planned CiADS + HIAF facilities [36, 37] will be capable of providing neutron-rich beams such as
$^{90-93}{{{\mathrm{Kr}}}}$ and$^{140-142}{{{\mathrm{Xe}}}}$ , potentially offering a new pathway toward producing nuclei in the predicted island of stability [38]. Our experimental results and analysis highlights the effect of the valence neutrons on the complete fusion reaction cross sections. Further experimental studies of the fusion reaction or multi-nucleon transfer reaction with the heavier neutron-rich isotopes are needed to guide the development of nuclear reaction theory. -
The authors thank Prof. Umar of Vanderbilt University for providing their orignal data of the TDHF, DC-TDHF and DC-FHF calculations, Prof. Gasques of University of São Paulo for providing the code to calculate the fusion cross section based on the Sao Paulo potential. The authors also acknowledge the use of OpenAI’s ChatGPT to assist with English grammar refinement. Contributions from the MATE-TPC development team and the operational team of the HIRFL facility are gratefully acknowledged.
-
The authors thank Prof. Umar of Vanderbilt University for providing their orignal data of the TDHF, DC-TDHF and DC-FHF calculations, Prof. Gasques of University of São Paulo for providing the code to calculate the fusion cross section based on the Sao Paulo potential. The authors also acknowledge the use of OpenAI’s ChatGPT to assist with English grammar refinement. Contributions from the MATE-TPC development team and the operational team of the HIRFL facility are gratefully acknowledged.
Fusion reaction of 19O + 12C studied with an active-target time projection chamber in the energy range 9.7 < Ec.m. < 16.9 MeV
- Received Date: 2026-01-08
- Available Online: 2026-04-15
Abstract: We measured the 19O+12C fusion excitation function using the MATE active-target TPC at IMP for $ 9.7 \leqslant E_{\rm{c.m.}} \leqslant 16.9$ MeV. The results agree well with DC-TDHF and TDHF predictions, demonstrating the importance of dynamical effects near the barrier, but disagree with earlier MUSIC-based measurements. The 19O+12C system exhibits a maximum fusion cross section consistent with those of β-stable O+C systems. A linear dependence of $ 1/E_{\rm{cr}}$ and closest-approach distance on oxygen mass number is observed for 17,18,19O+12C, indicating that additional valence neutrons lower the critical energy. V-shaped excitation structures appear for 17O and 19O, and the anomalous suppression previously reported for 17O calls for further experimental and theoretical study.


 DownLoad: