


 Abstract
 HTML
HTML Reference
 Related
 PDF
PDF


-
Information about neutron-nucleus interactions is essential for both fundamental and applied physics. The neutral electric charge of a neutron provides a unique opportunity for studying the structure of matter at the molecular and nuclear levels and for revealing the nature of nuclear forces. Data on neutron-nuclear reactions are also necessary for designing nuclear power plants and for modeling various devices and objects that interact with neutron radiation in one way or another. For example, neutrons are widely used in inspection complexes and installations for neutron logging, non-destructive elemental analysis of matter, nuclear medicine, and radio-pharmaceutical production. The fact that most queries on the NEA Nuclear Data High Priority Request List (HPRL) [1] are directly related to neutron-nuclear reactions indicates the relevance of studying the characteristics of neutron-nucleus interactions. The most important task faced by the nuclear power industry is the creation of Generation IV fast neutron reactors, as they must be economically efficient and have high safety and reliability across all technological processes. The design and construction of new reactors impose serious requirements on the quality of neutron-nuclear data for the largest possible number of nuclides across a wide range of neutron energies, especially for fast neutrons.
Oxygen is one of the most abundant elements on Earth. In addition to water, it is a part of several chemical compounds, mainly oxides, emphasizing the need to focus on its study [1]. Phosphorus and sulfur are also widespread. For example, they form components of apatite, a valuable raw material for producing mineral fertilizers. The timely control of the elemental composition of apatite ores is important for technological processes to run smoothly. Methods to enable the rapid elemental analysis of this raw material have already been proposed [2]. Sulfur, in turn, is part of several products in the chemical industry, particularly rubbers and explosives. However, it pollutes oil products, significantly worsening their properties. Therefore, developing a technique for measuring its content is of great importance.
Our research aims to study the characteristics of γ radiation arising from the interaction of fast neutrons with atomic nuclei. On the one hand, γ-quanta marks the presence of the corresponding nuclide in the medium. On the other hand, this radiation is an important component of inelastic neutron scattering, and its characteristics are necessary to model neutron-nuclear interaction processes completely. The experiments were performed at the Frank Laboratory of Neutron Physics (JINR, Dubna) in the framework of the TANGRA (TAgged Neutrons and Gamma RAys) project to study the inelastic scattering of neutrons with an energy of 14.1 MeV with atomic nuclei using the tagged neutron method (TNM) [3, 4].
The TNM is based on registration of the
$ 3.5 $ MeV α-particle from the reaction$ \begin{array}{*{20}{l}} d + t \rightarrow n + \alpha. \end{array} $

(1) According to the reaction's kinematics, the neutron is emitted in the direction opposite to that of the α-particle (in the center-of-mass frame). Thus, knowing the direction of emission of the α-particle, it is possible to determine the direction of motion of the neutron. This way, forming a beam of "tagged" neutrons with a well-defined energy and flux is possible. The α-particles are registered in coincidence with the pulses from the characteristic nuclear γ-radiation emitted from excited products of neutron-induced reactions on the nuclei A in the sample:
$ \begin{array}{*{20}{l}} A(n,x)B^* \xrightarrow{\gamma} B. \end{array} $

(2) Using this time-correlated associated particle technique (TC-APT), which significantly reduces the effect of background radiation on the quality of experimental data, a multi-pixel α-particle detector, and a set of detectors for products of neutron-induced nuclear reactions, performing elemental and/or isotopic analysis (visualization, radiography, tomography) of any substance and/or object to determine the differential and total cross sections of neutron-induced nuclear reactions and the energy and angular distributions of these reactions' products with higher accuracy and reliability is possible.
The experimental study of the inelastic scattering of neutrons with an energy of 14.1 MeV by some light and medium nuclei [5−9] is continued within the framework of the TANGRA project. Here, we present the results on the yields and angular distributions of γ-quanta emitted in the
$ (n, X\gamma) $ type reactions of oxygen, phosphorus, and sulfur nuclei, where$X = n',\; p,\; d,\; \alpha$ . -
A portable neutron generator, ING-27, manufactured by VNIIA (Moscow, Russia), was used as a neutron source. It is a small-size device based on a sealed gas-filled neutron tube with a built-in multi-pixel α-particle detector capable of producing a maximal neutron flux of
$5 \times 10^7$ s$ ^{-1} $ . Reaction (1) is induced by a continuous beam of deuterons with a kinetic energy of$ 80 - 100 $ keV focused on a titanium tritide target.The position-sensitive α-particle detector placed in the ING-27 neutron tube at a distance of 100 mm from the target consists of 16 (8 + 8) mutually perpendicular semiconductor strips, each 6 mm wide and 55 mm long. The overlapping strips form 64 (8×8) pixels with a pixel size of 6×6 mm. The count rate of each pixel of the α-detector uniquely determines the associated beam of tagged neutrons. This way, depending on the neutron source-to-target solid angle, one can use up to 64 tagged neutron beams of well defined energy, direction, and flux.
The TANGRA setup can be used with multifunctional detector systems of various configurations. Two detector systems were used to study the properties of nuclear reactions that occur when samples are irradiated with 14 MeV neutrons: the "Romasha" system with 18 BGO [10] (Bi
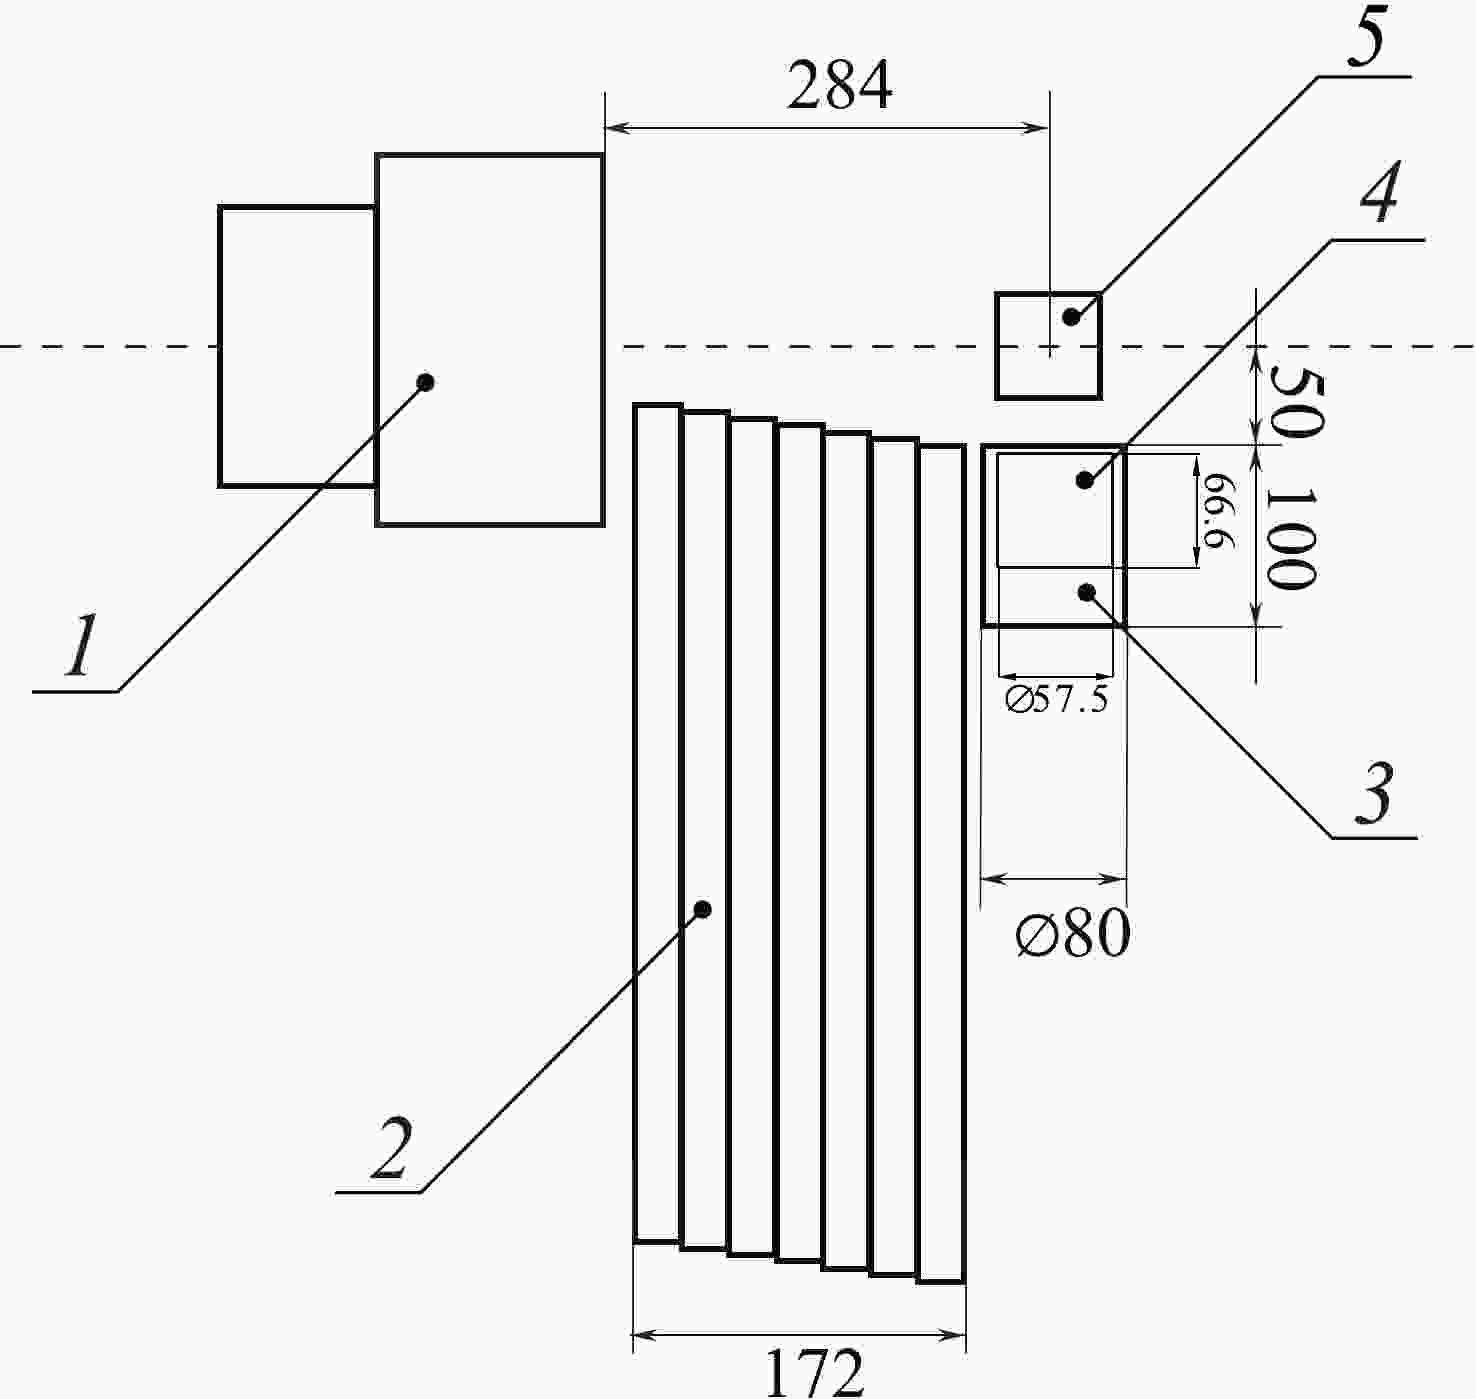
$ _4 $ Ge$ _3 $ O$ _{12} $ ) scintillation γ-rays detectors and a high-purity germanium (HPGe) [11] γ-ray spectrometer. The energy resolution for the BGO detectors was approximately 110 keV at 1.33 MeV, and for the HPGe detector, it was 1.9 keV.The layout of the TANGRA setup for γ-quanta yield measurement using a HPGe γ-ray detector is shown in Fig. 1. The HPGe crystal had a diameter of
$ 57.5 $ mm and a thickness of$ 66.6 $ mm. The detector was located at the minimum possible distance from the sample and protected from the direct neutrons emitted from the generator by 172 mm thick lead shielding. With this configuration, the energy spectra of γ-rays were measured with high resolution.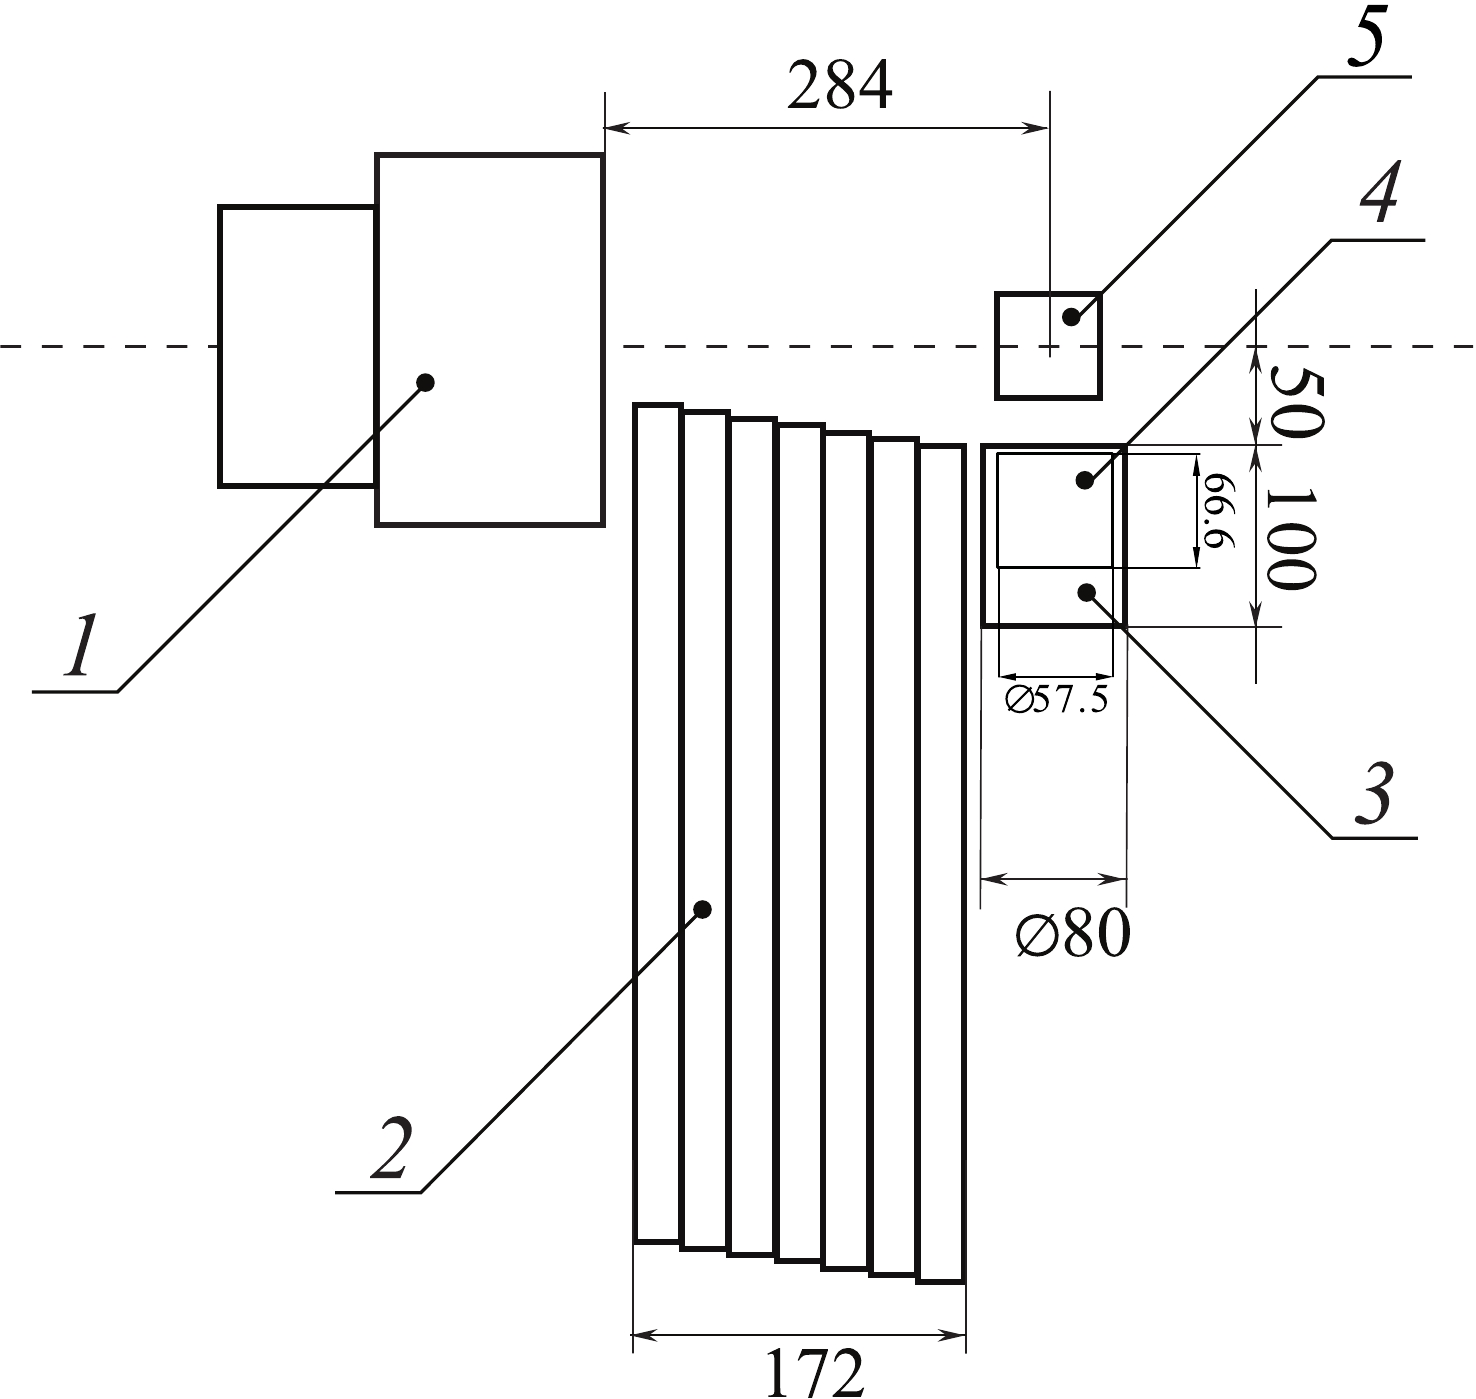
Figure 1. Scheme of the TANGRA setup with the HPGe detector in the reaction plane: 1 – neutron generator ING-27, 2 – lead shielding, 3 – housing of HPGe detector, 4 – HPGe crystal, 5 – sample. The axis of the experimental setup is indicated by a horizontal dashed line. The tritium-enriched target is marked with an asterisk. All dimensions are given in mm.
Figure 2 presents the layout of the TANGRA setup for the γ-radiation angular distribution measurement using the "Romasha" detector system. It consisted of 18 BGO gamma scintillation detectors arranged in 14 degree increments in a circle with a radius of 75 cm and a sample in its center.
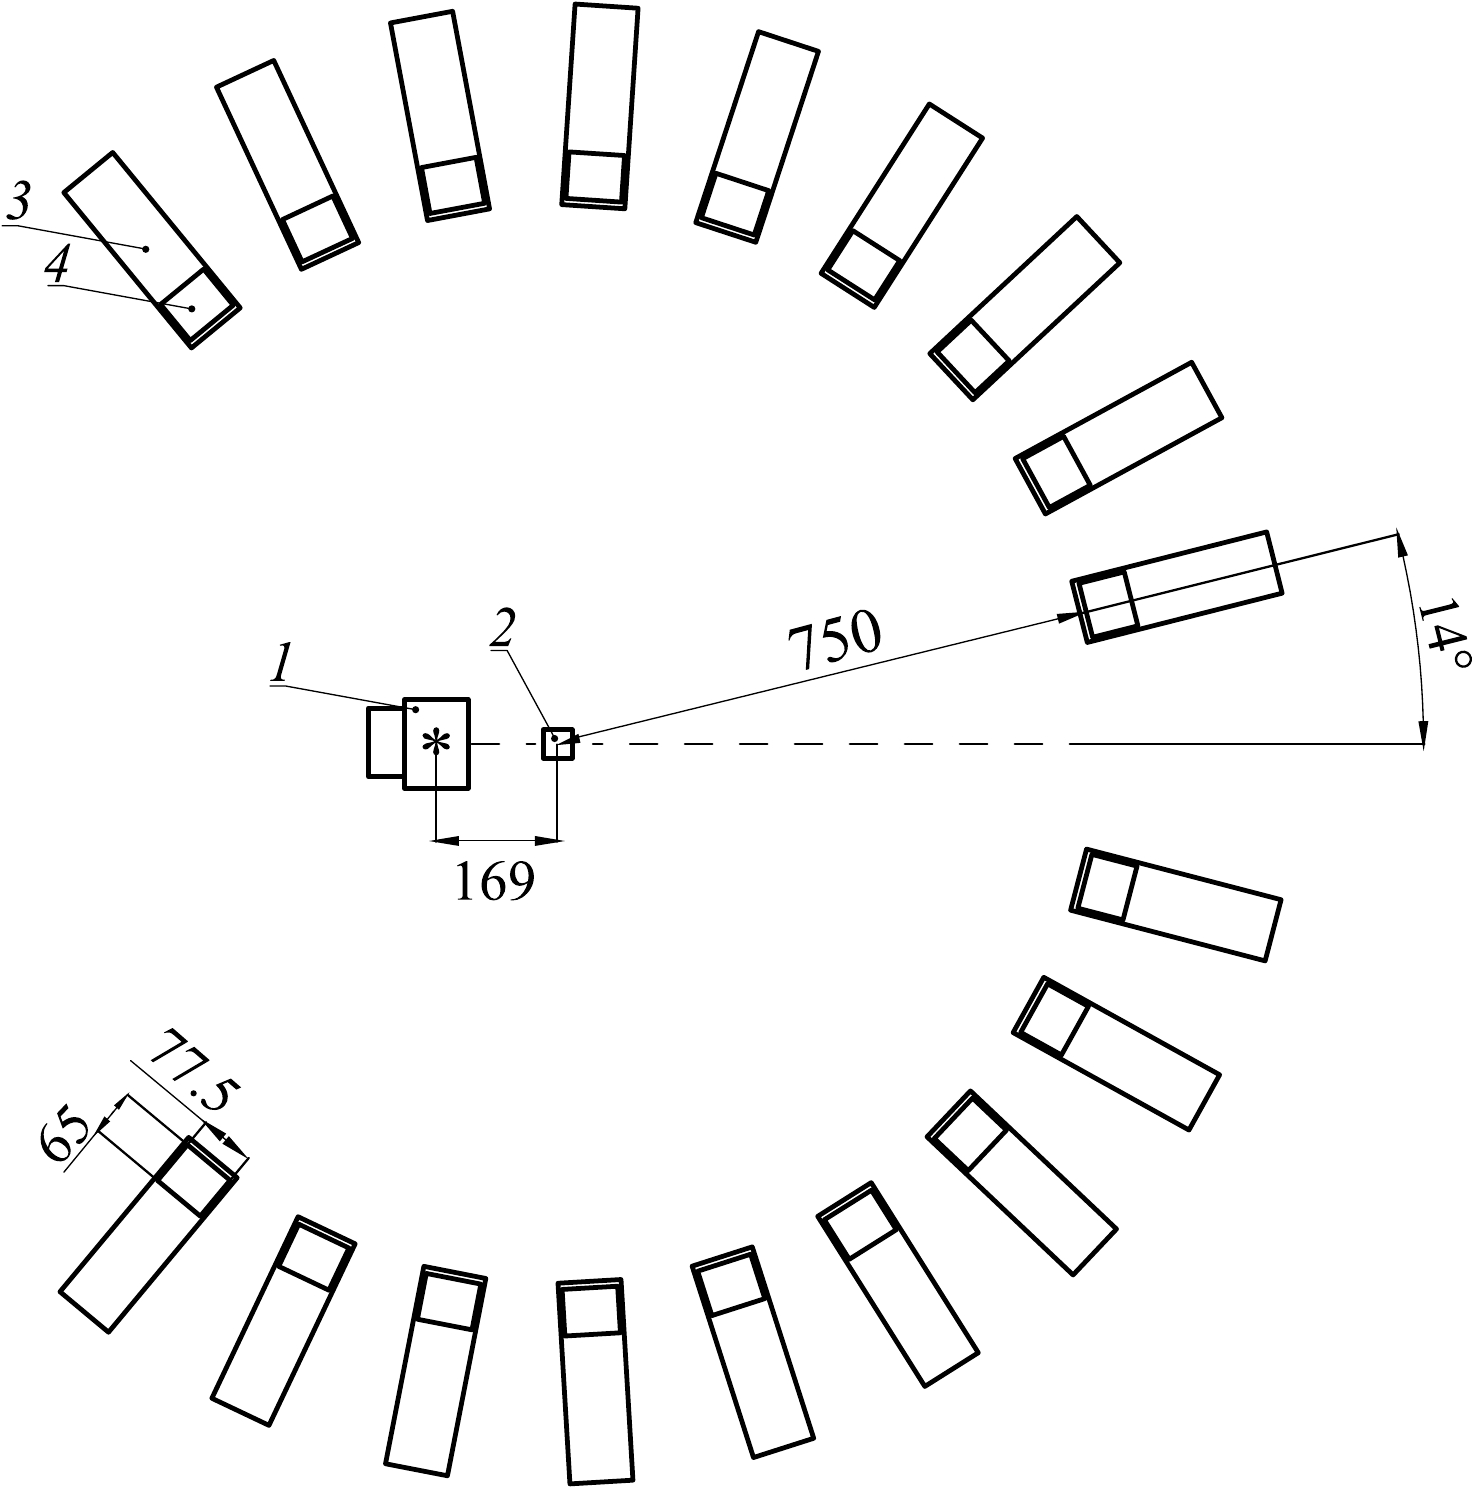
Figure 2. Scheme of the TANGRA setup with BGO detectors in the reaction plane: 1 – portable neutron generator ING-27, 2 – sample in the center of Romasha γ-ray registration system, 3 – BGO detector housing, and 4 – BGO crystal. The symmetry axis of the experimental setup is indicated by a horizontal dashed line. The tritium-enriched target is marked with an asterisk. All dimensions are given in mm.
The samples used in this experiment were rectangular boxes made of 0.1 mm thick aluminum foil filled with the substances being investigated. The bulk density of each sample was determined as a ratio of net weight to volume. The main characteristics of the samples are shown in Table 1.
Sample Bulk density /(g/cm3) Size /cm3 Mass /g Isotopic composition Purity P2O5 0.903 6 × 6 × 14 455 31P – 100%, 16O – 99.757%, 17O – 0.038%, 18O – 0.25% > 99% S 1.244 6 × 6 × 14 627 32S – 94.99%, 33S – 0.75%, 34S – 4.25%, 36S – 0.01% > 99% Table 1. Sample characteristics.
Two computerized ADCs were used to collect and digitize the analog signals from the systems: ADCM-32 for the "Romasha" detector system with BGO detectors and CRS-6/16 for experiments with the HPGe detector. Both devices were developed at JINR. The characteristics of the digitizers are shown in Table 2. The data acquisition system was controlled by the "Romana" computer program, which we wrote using CERN's ROOT [12] framework. The list-mode data were saved on the computer hard drive for further offline analysis using several ROOT-based programs.
Characteristic ADCM-32 CRS-6/16 Number of channels 32 6 ADC bit depth 14 bit 11/16 bit Sampling frequency 66 MHz 100 MHz Input amplitude range $-1 \div 1$ V

$-1 \div 1$ V

Data transfer rate ~250 MB/s ~190 MB/s Interface type PCI-e USB-3 Max. count rate $\sim10^5$ ev/s

$\sim5\times10^6$ ev/s

Table 2. Characteristics of the digitizers used for data acquisition.
Before the experiment, the tagged neutron beam profiles were measured using a position-sensitive silicon detector of charged particles capable of detecting fast neutrons via a
$ ^{28} $ Si($ n,\alpha $ ) reaction [13]. This information was used to optimize the sample dimensions and correct the position of the tagged neutron beams incident on it. The horizontal dimensions of the target (6 cm$ \times $ 6 cm) were optimized to achieve γ-absorption not exceeding 20% for the considered γ-lines. Thus, only four neutron beams, corresponding to the four innermost vertical strips of the α-detector, covered the target.The procedure and methods used to obtain and analyze the experimental data were discussed in detail in our previous article [6]. Here, we briefly outline their main content.
-
Using the TNM made it possible to significantly reduce the contribution of the background events (correlated and random) to the recorded energy spectra of γ-quanta by organizing the coincidence of signals from the γ-ray detectors and position-sensitive α-detector. To implement this technique correctly, we conducted a thorough analysis of the time spectra of
$ \gamma-\alpha $ coincidences, which, following the terminology in neutron spectroscopy, can be called time-of-flight (TOF) spectra.Figure 3 shows the different analysis steps of the data obtained from the BGO-"Romasha" detector system. The upper figure shows the components of the TOF spectra: black curve (labeled A) – the total spectrum recorded with the sample; pink curve (labeled B) – the background spectrum recorded in a separate experiment without a sample but with a sample holder and empty aluminum box; red curve (labeled C) – the difference between the two spectra. The background spectrum was normalized to the same total neutron flux as the spectrum with the sample. The first peak in all the TOF spectra corresponds to the γ-rays, while the second peak is due to the scattered neutrons. The energy spectra components (Fig. 3 (b)) were constructed from events that fall inside the corresponding windows in the TOF spectra: the γ-window was selected as
$ \pm2\sigma_{\gamma} $ , where$ \sigma_{\gamma} $ is the standard deviation of the Gaussian fit of the corresponding γ-peak marked by pink vertical lines. The neutron window, marked by blue vertical lines, was chosen in such a way that events from γ-rays do not fall into it.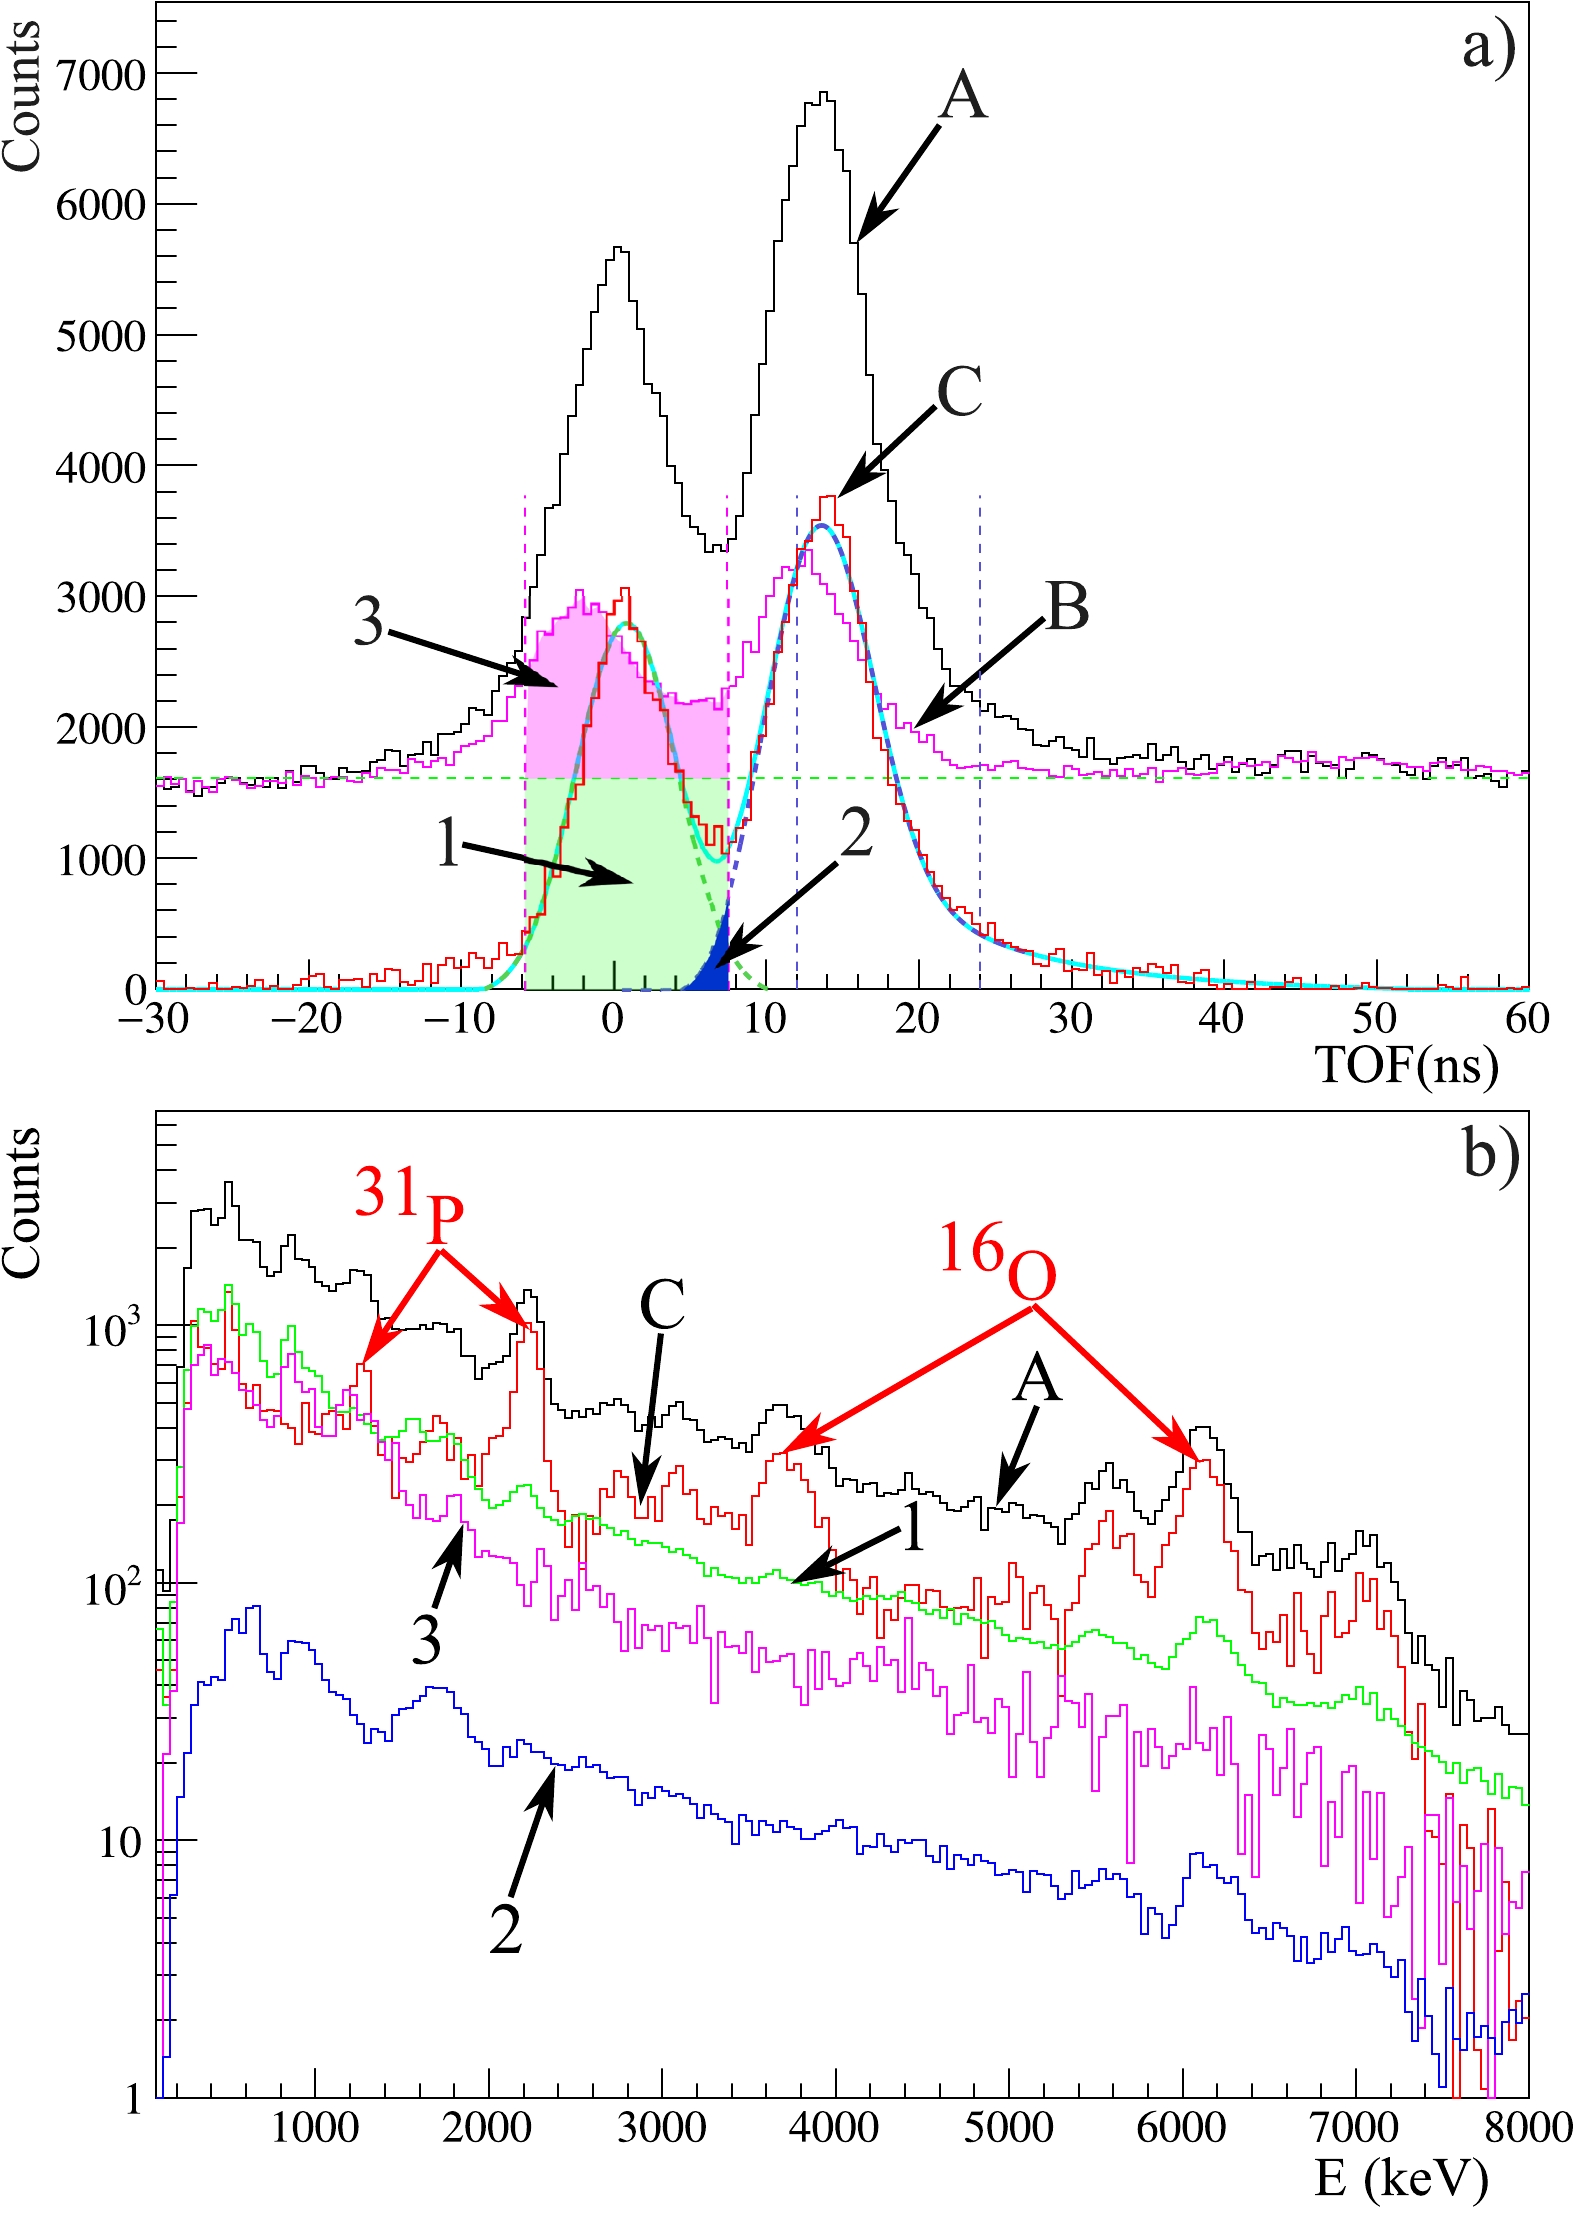
Figure 3. (color online) An example of the TOF spectrum for the BGO detector
$\rm (a)$ and components of the energy spectra obtained at same detector$\rm (b)$ . See text for details.We identified three main sources of the background that must be considered when processing data:
1. Random coincidences (labeled 1 in Fig. 3). It is constant in the time spectrum, and its height is determined by the counting rate in the detectors of α-particles and γ-quanta involved in the coincidences. The background energy spectrum of the random coincidences was constructed by selecting events from the time spectrum to the left of the γ-peak. We used a time window of
$ -200 $ to$ -30 $ ns. The random coincidence spectra were normalized by the ratio of the widths of the corresponding coincidence windows.2. Neutrons scattered on the sample and its surrounding (labeled 2 in Fig. 3). Such events fall into the second peak in the TOF spectrum, but owing to partial overlap with the γ-peak (blue region in Fig. 3 (a)), these events also form a background in the γ-ray spectrum. The energy spectrum of the neutron background was determined in the neutron window, marked by blue vertical lines in Fig. 3 (a), and normalized to the ratio of the corresponding components in the TOF spectra.
3. Gamma-quanta formed during the interaction of neutrons by the environment near the sample (labeled 3 in Fig. 3). The contribution of this background was determined from a separate measurement without a sample. The energy spectrum of the γ-background was obtained in the same coincidence window of
$ \pm2\sigma_{\gamma} $ as the sample spectrum.The net energy spectrum, which is the difference between the total spectrum and the sum of all background components, was approximated by a special fitting function. Examples of the BGO energy spectra fit are shown in Fig. 4. The fitting function includes a smooth background and a sum of the response functions of the BGO detector for each γ-line, as described in [14]. The integral of the response function for the corresponding γ-line is proportional to the number of γ-quanta recorded by the detector and was used to determine the angular distribution of the γ-ray emission.
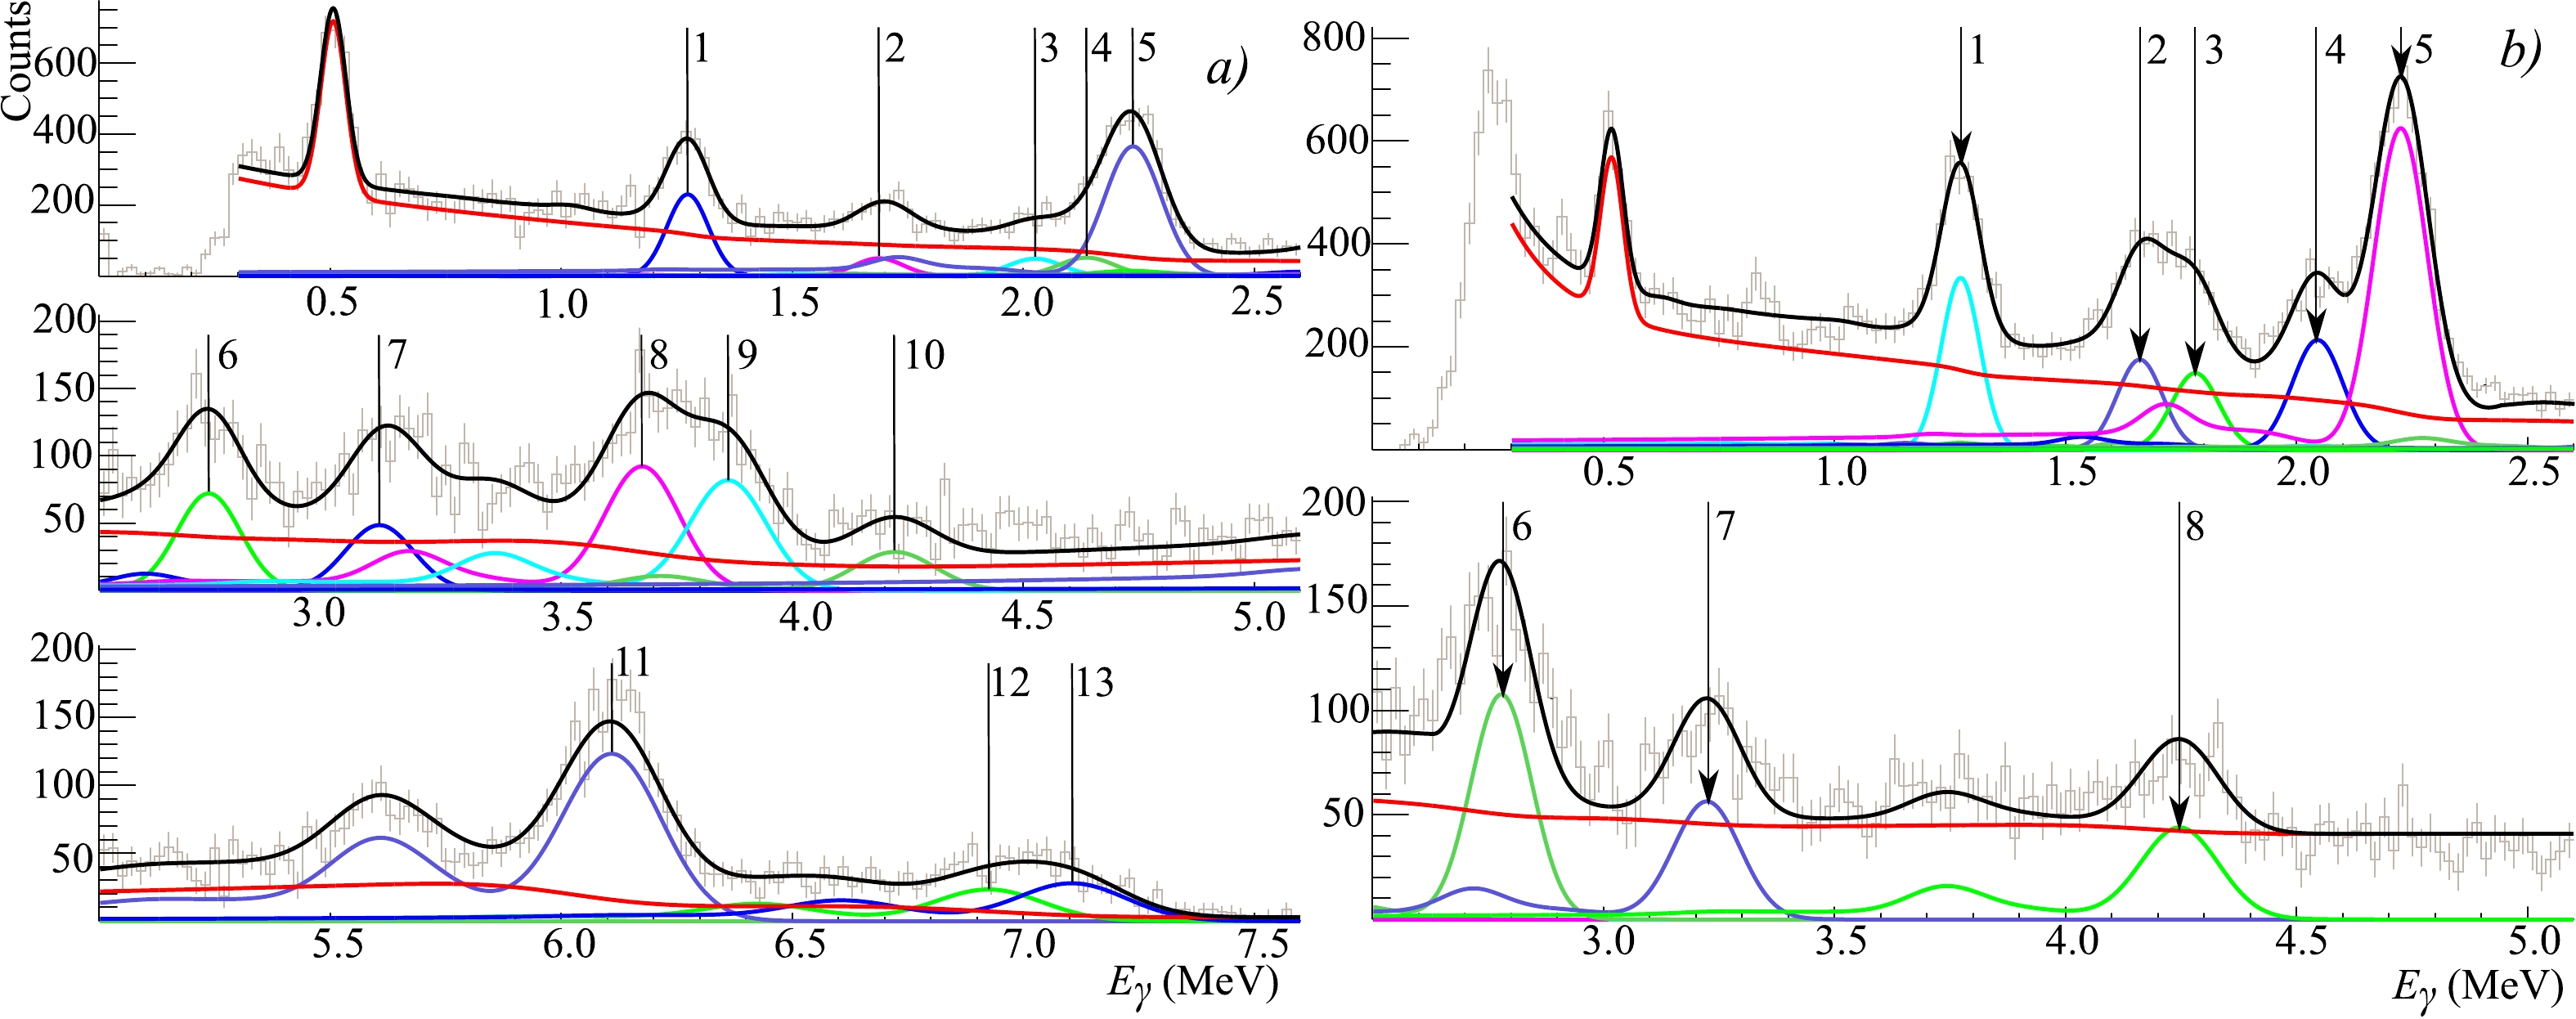
Figure 4. (color online) Energy spectra, obtained using a BGO-detector at an angle of
$33^{\circ}$ with phosphorus oxide$\rm (a)$ and sulfur$\rm (b)$ , approximated by the response function. The gray dots with error bars are the experimental data, the solid black line is the full fitting function, the red line is the sum of all background components, and other colored lines are the response functions for the strongest characteristic γ-lines from oxygen, phosphorus, and sulfur, marked by vertical lines (see Tables 3, 4 , and 7).The time resolution of the HPGe gamma detector does not separate useful events from the background as effectively as the BGO scintillation detector. Meanwhile, the TOF technique can still be used to isolate the time-constant background of random events generated mainly in the interaction between "untagged" neutrons and the environment. Owing to the small distance from the sample and lower time resolution of the HPGe detector, the only peak in the time spectrum contains events from both γ-rays and secondary neutrons emitted from the target.
The time resolution of the HPGe detector shows strong dependence on the event energy [15]. Therefore, a special procedure was applied to select the proper time window for each γ-ray energy, improve background separation, and prevent the loss of good events.
We defined a 2-dimensional coincidence window, as shown in Fig. 5, by approximating the 1-dimensional TOF profiles of the locus in different energy windows using the Gaussian fit. The window width in the TOF-coordinate was defined as
$ \pm3\sigma $ of the Gaussian for each energy window. The random coincidence window used for the energy spectra analysis is below the coincidence window, having a width of 300 ns.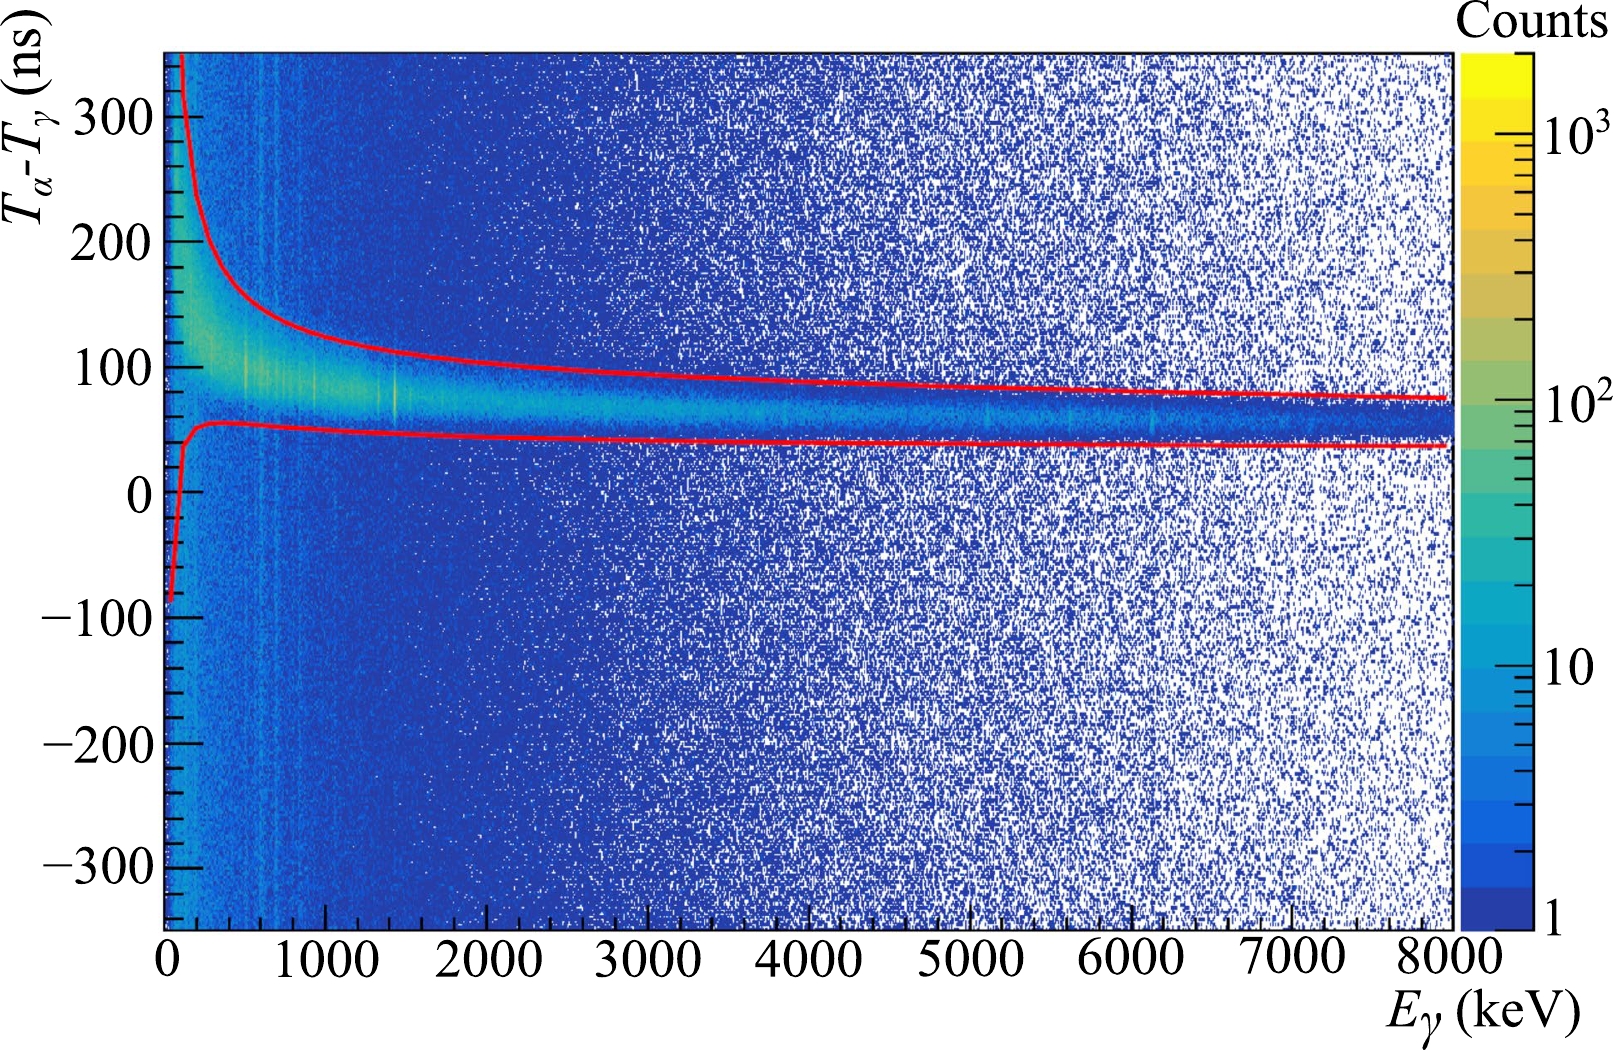
Figure 5. (color online) Full TOF-Energy spectrum from measurement with the HPGe detector. The color represents the number of counts. The coincidence window is marked by solid lines.
According to our estimation, after the procedure described above, the HPGe time resolution in different energy ranges is between
$ 26 $ ns (in the$ 600 $ –$ 900 $ keV energy interval) and$ 17 $ ns (in the$ 3600 $ –$ 3900 $ keV energy interval).Figure 6 shows a fragment of the energy distributions of γ-rays measured by the HPGe detector for a P
$ _2 $ O$ _5 $ sample for the coincidence window (A), random coincidences (B), and the spectrum of "pure coincidences" (C), which is the difference between spectra A and B. Since the width of the coincidence window varies as a function of energy and is different from the width of the random coincidence window, a special energy-dependent procedure was developed to normalize the random coincidence spectrum to the ratio of the corresponding window widths.
Figure 6. (color online) A fragment of the energy spectrum of γ-rays measured by the HPGe detector for a P
$_2$ O$_5$ sample. A – events in the coincidence window (blue line), B – background of random coincidences in the same window (grey line), C – difference (pure) spectrum ($\rm A-B$ ) (magenta line). Characteristics of peaks indicated by numbers are: 1 –$E_{\gamma}$ =$140$ keV from background; 2 –$E_{\gamma}$ =$169.3$ keV from$^{16}$ O$(n,\alpha$ )$^{13}$ C; 3 –$E_{\gamma}$ =$200$ keV from background; and 4 –$E_{\gamma}$ =$298.2$ keV from$^{16}$ O$(n,p)^{16}$ N.In the coincidence and "pure coincidence" spectra, the lines from the elements contained in the sample are significantly enhanced, and the background peaks are either absent or suppressed.
After this procedure, the number of registered events, which correspond to the γ-ray emission from different discrete states of nuclear reaction products, could be extracted from the γ-spectra. The full energy absorption peaks were approximated by Gaussian functions with a linear background to obtain these values.
In our experiments, we used relatively thick samples, resulting in the tangible absorption and scattering of γ-rays and neutrons in the sample. Therefore, for each γ-detector, a correction function was calculated by the Monte Carlo method, considering the re-scattering of neutrons in the sample and the absorption and detection probabilities of γ-quanta based on their energies [14].
-
High-resolution γ-spectra were obtained using the HPGe spectrometer. This allowed us to identify several γ-lines and determine their yields.
Yields of γ-quanta
$ Y_{i} $ here and below are defined as the emission cross-sections for γ-quanta of a particular energy$ E_{i} $ , normalized to the cross section of the strongest (reference) transition ($ E_{0} $ ) for a given element:$ Y_i = \frac{N_i}{N_0}, $

(3) where
$ N_i $ and$ N_0 $ are the numbers of emitted γ-quanta with energy$ E_i $ and$ E_0 $ , respectively. The γ-quanta emission cross-sections obtained in other experiments or calculated with the program TALYS 1.96 [16] for comparison with our data were converted into yields using the following formula:$ Y_i = \frac{\eta_j\sigma^{\gamma}_i}{\eta_0\sigma^{\gamma}_0}, $

(4) where
$ \eta_j $ is the abundance of the j-th isotope,$ \sigma^{\gamma}_i $ is the γ-quanta emission cross-section with energy$ E_i $ ,$ \eta_0 $ is the abundance of the element with reference γ-transition,$ \sigma^{\gamma}_0 $ is the γ-quanta emission cross-section with the reference energy.The angular distributions of γ-quanta
$ W(\theta) $ obtained in our experiments using BGO detectors were determined from the normalized number of γ-quanta in the detectors, corrected for absorption and scattering of γ-quanta and neutrons in the sample, according to the procedure described in [6]. The coefficients of anisotropy in the angular distributions of γ-quanta are obtained by approximating the angular distributions using the following expression:$ W(\theta)=1+\sum\limits_{k=2,4...}^{2J}a_kP_k(\cos\theta). $

(5) The obtained parameters of the angular anisotropy were used to correct the yields of the strong γ-lines, for which we determined the angular distribution. The other γ-lines were assumed to be isotropic.
Systematic and statistical errors are considered in our analysis. The primary sources of systematic errors in our measurements are the uncertainties in the positions of elements in the experimental setup, which led to changes in the geometrical efficiencies of the detectors and γ-ray absorptions in the sample. The systematic errors were determined using Geant4 Monte Carlo simulations by varying the sample and detectors' positions to determine the differences in the corresponding experimental values. The resulting systematic errors are given in the corresponding tables.
The TALYS code [16] is widely used for theoretical calculations of various nuclear reactions induced by n, p, d,
$ ^3 $ H,$ ^3 $ He, and α in a wide energy range. We have compared our results for γ-ray yields with values calculated by TALYS 1.96 using the "default" set of parameters.The RIPL-3 [17] database is used as an information source regarding nuclear structure and the properties of nuclear reaction calculations in TALYS, which makes it useful for γ-spectra decoding. We are developing a special software program named TalysLib to simplify the use of the nuclear structure data from RIPL-3 and the TALYS calculation results in data processing programs. It is an object-oriented C++ library that uses ROOT [12] capabilities for data drawing, storage, and theoretical model parameter adjustments.
The main approach used in TALYS for neutron-induced reactions is the optical model (OM). However, the following modifications have been implemented to describe inelastic processes: distorted wave Born approximation (DWBA), symmetric rotational (ROT), harmonic vibrational (VIB), vibration-rotational (VROT), and asymmetric rotational (AROT) models (see [18] for details). The approach chosen depends on the nuclear structure and available data on the nucleon scattering. For 54 nuclides, there are predefined sets of optical model parameters in the TALYS nuclear structure. For other nuclei, Koning parametrization [19] is used.
For the nuclei discussed in this paper, predefined OM parameters and deformations are available for
$ ^{31} $ P and$ ^{32} $ S. For$ ^{16} $ O, they were calculated using Koning parameterization. Strictly speaking, light nuclei in the oxygen region border on the limit of applicability of Koning parameterization. However, as provided in [20], the calculations for oxygen are generally in good agreement with the experimental data.The origin of the lowest excited states in
$ ^{32} $ S was investigated in several papers [21, 22], and it was established that they are vibrational in nature. By default, for$ ^{32} $ S in TALYS, two bands with slightly different deformations are set. The first band consists of vibrational excited states with spin-parity$ 2^+_1 $ and$ 0^+_2 $ ,$ 2^+_2 $ , and$ 4^+_1 $ . It has a deformation parameter$ \beta = 0.29 $ . The state$ 3^- $ forms the second band with$ \beta = 0.3 $ .The OM parameterizations used in our calculations are given in the Appendix.
-
The γ-ray yields of phosphorus and oxygen were obtained from measurements with phosphorus oxide P
$ _2 $ O$ _5 $ . The parameters of the sample are listed in Table 1. The high resolution spectrum of γ-quanta obtained in this experiment is shown in Fig. 7, also showing the identified γ-lines; single (SE) and double (DE) escape peaks for the high-energy transitions are also marked. All lines were identified using the TalysLib library.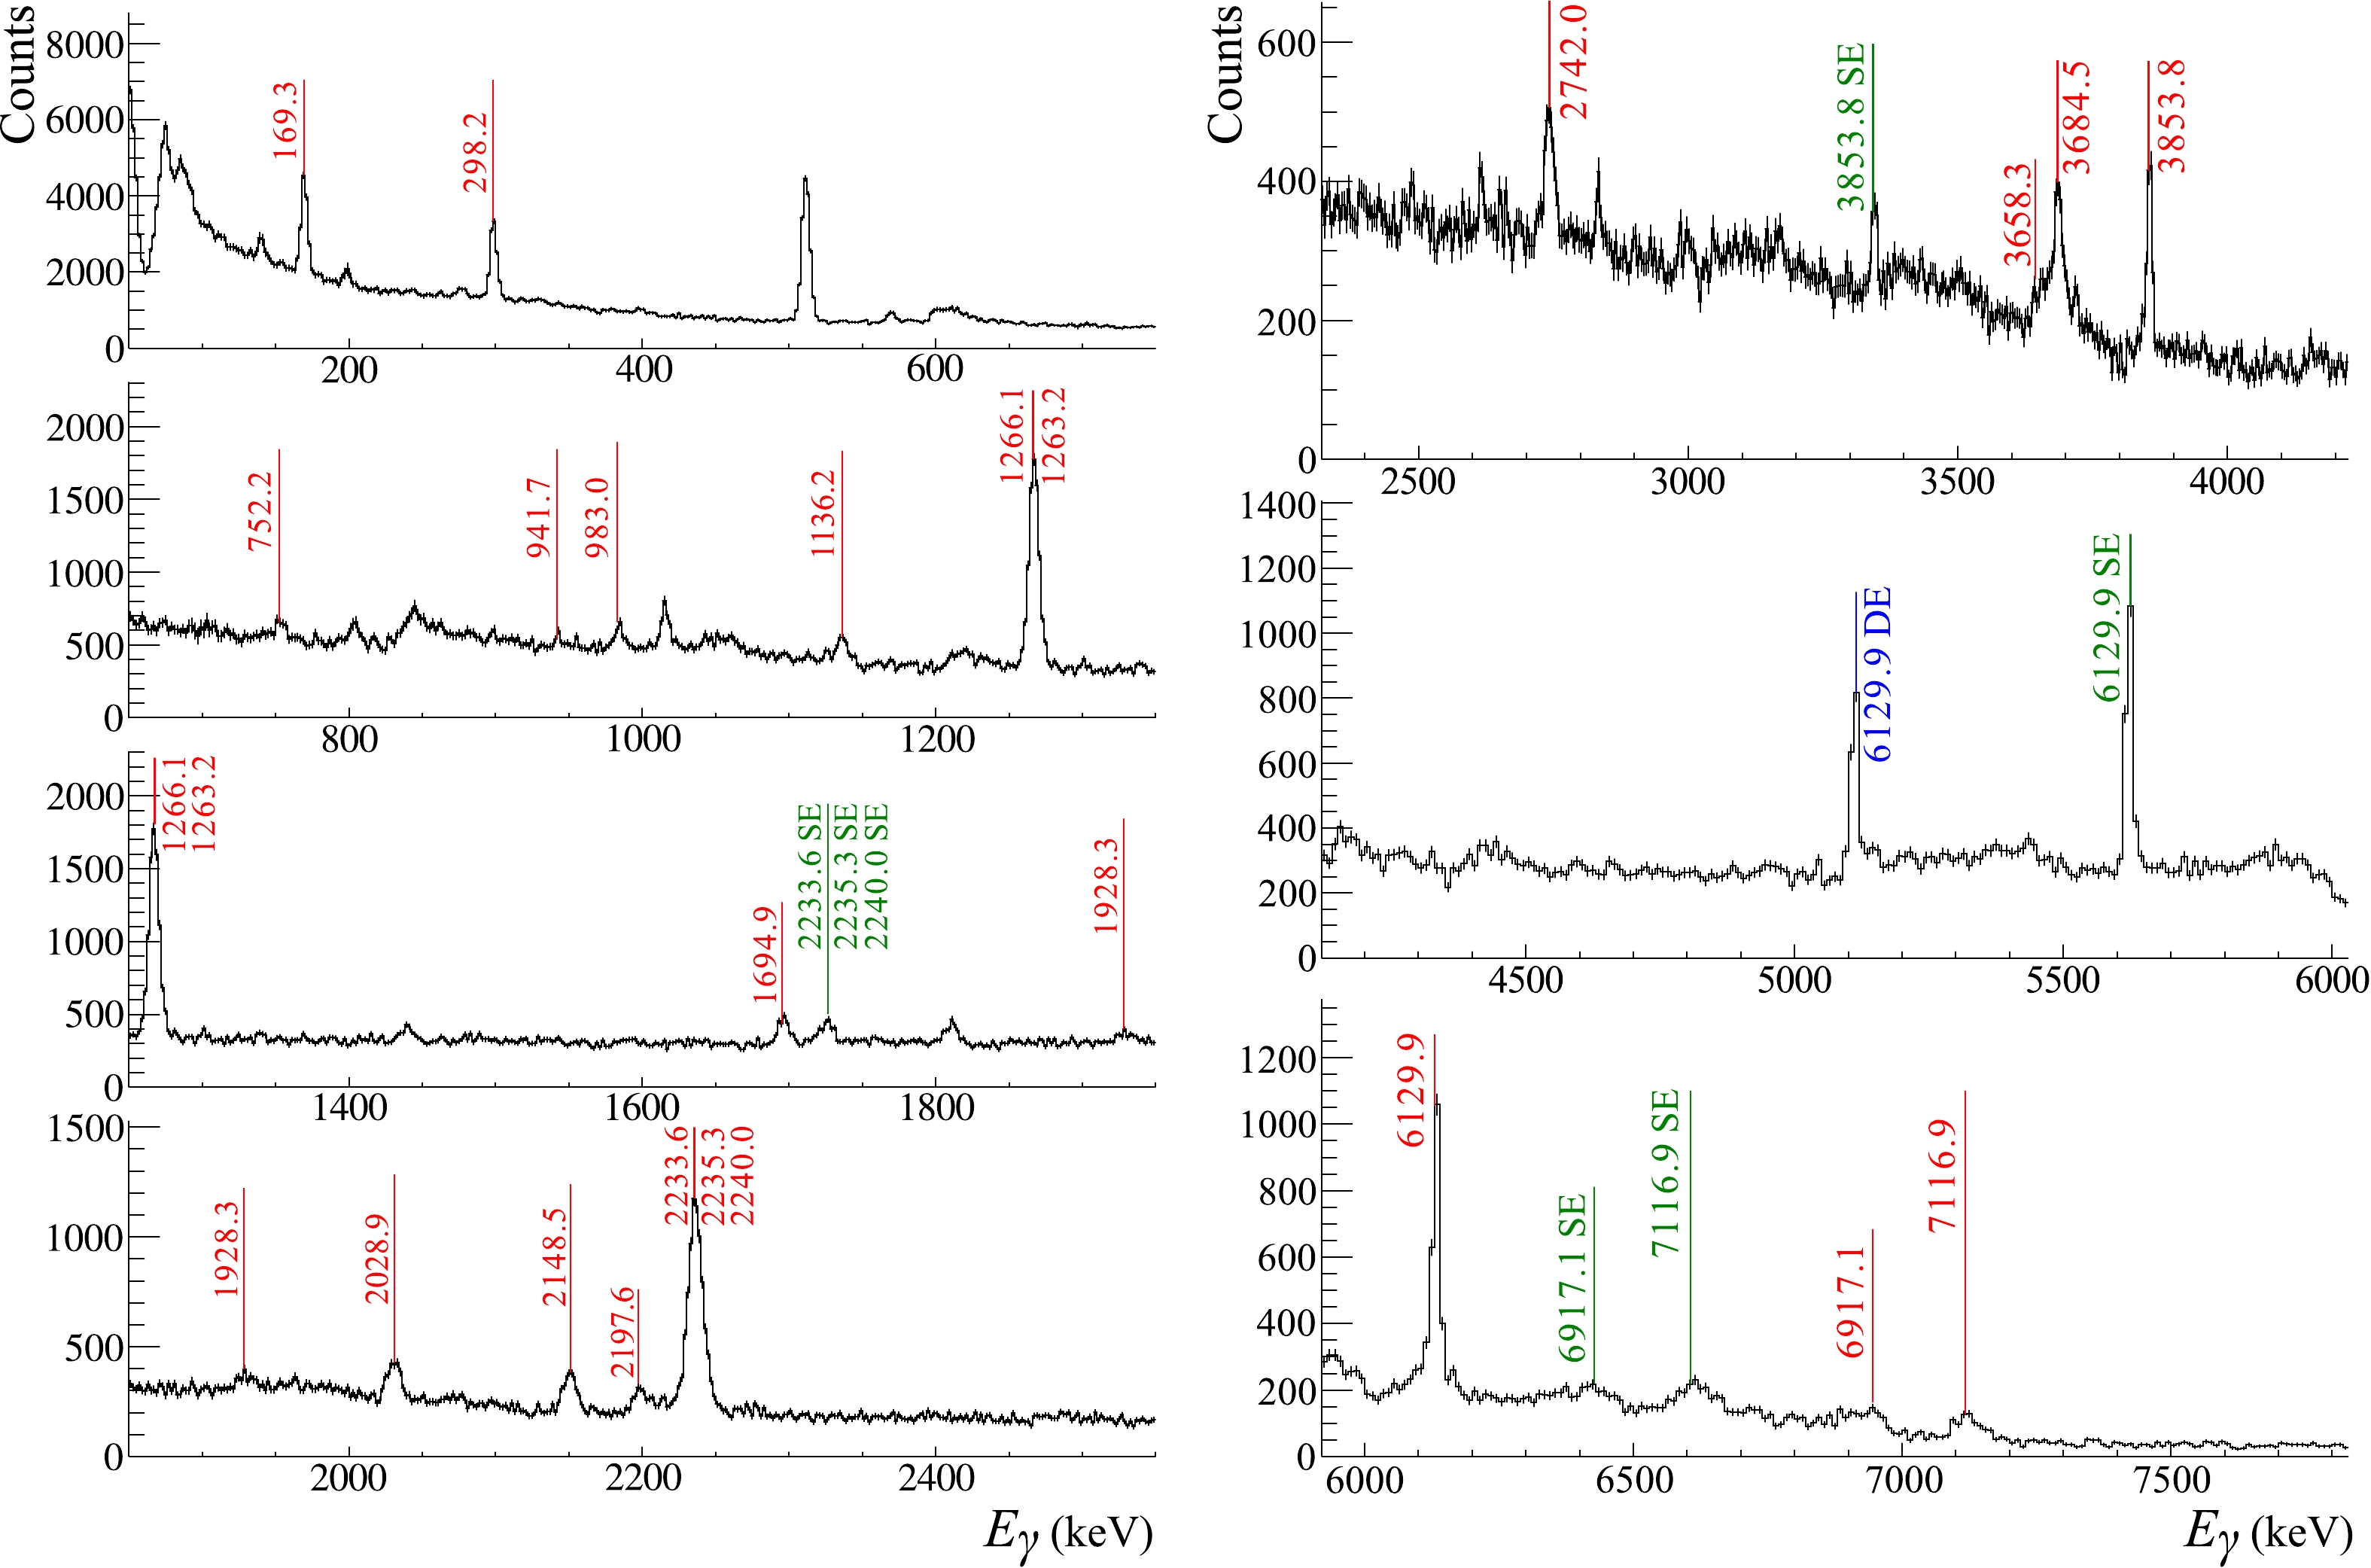
Figure 7. (color online) Energy spectrum of γ-quanta from the P
$_2$ O$_5$ sample in the$50-7600$ keV range, measured by the HPGe detector. Position of γ-peaks identified by TalysLib and attributed to reactions with oxygen or phosphorus are marked by red lines. Single escape (SE) and double escape (DE) peaks of strong γ-transitions are marked by green and blue lines, respectively. The peak at 511 keV corresponds to electron-positron annihilation processes.The yields of individual γ-transitions in the reactions of 14.1 MeV neutrons with oxygen nuclei were determined by formula (3) and normalized to the yield of the most intense γ-line with an energy of 6129.9 keV. The results are presented in Table 3, which includes eight transitions that we consider to be fairly reliably identified in our measurements and five transitions cited in [23] and present in the TALYS 1.9 database but not observed in our spectra. For the lowest two γ-transitions (
$ E_{\gamma} = 169.3 $ and 298.2 keV), the yields of γ-quanta were experimentally determined for the first time. For the γ-transitions shown in bold type, the angular distributions of γ-rays were also determined. The full errors (stat+sys) of γ-ray yields are indicated in brackets.No $E_{\gamma}$ /keV

Reaction $Y_{\gamma}$ /%

This work TALYS [23] [24] 169.3 $^{16}$ O

$(n,\alpha)^{13}$ C

32.9 (3.7) 16.0 298.2 $^{16}$ O

$(n,p)^{16}$ N

43.4 (3.9) 15.6 987.0 $^{16}$ O

$(n,n')^{16}$ O

− − 4.2 (0.8) 1755.1 $^{16}$ O

$(n,n')^{16}$ O

− 5.2 4.6 (0.9) 1954.8 $^{16}$ O

$(n,n')^{16}$ O

− 1.6 4.1 (2.6) 6 2742.0 $\bf^{16}$ O

$(\boldsymbol{n,n'})^{\bf 16}$ O

34.7 (4.3) 35.1 25.7 (3.2) 31.3 (7.0) 7 3089.4 $^{16}$ O

$(n,\alpha)^{13}$ C

− 20.7 14.9 (1.7) 8 3684.5 $\bf^{16}$ O

$(\boldsymbol{n,\alpha})^{\bf 13}$ C

35.9 (6.3) 50.5 38.9 (4.5) 29.6 (6.2) 9 3853.8 $\bf^{16}$ O

$(\boldsymbol{n,\alpha})^{13}$ C

33.0 (4.1) 27.6 22.8 (3.3) 23.5 (4.9) 10 4438.9 $^{16}$ O

$(n,n'\alpha)^{12}$ C

− − 11.6 (1.7) 11 6129.9 $\bf^{16}$ O

$(\boldsymbol{n,n'})^{\bf 16}$ O

100 100 100 100 12 6917.1 $^{16}$ O

$(n,n')^{16}$ O

31.9 (3.9) 82.9 31.8 (3.7) 34.8 (7.3) 13 7116.9 $^{16}$ O

$(n,n')^{16}$ O

34.5 (5.1) 32.6 36.1 (4.4) 39.1 (8.4) Table 3. Experimental γ-ray yields from oxygen compared with TALYS 1.96 calculations and the published data of other authors. Statistical uncertainties are indicated in brackets. Estimated systematic uncertainties do not exceed 5% of the yield values. For γ-transitions in bold type, the angular distributions of γ-quanta were also determined. The numbers in the first column indicate the peaks in the energy spectra obtained with the Romasha BGO detector system (see Fig. 4 (a)).
Gamma-quanta with an energy of 987 keV correspond to γ-transitions
$ 1^-(7117\rm{ keV})\rightarrow3^-(6130\rm{ keV})) $ , whereas the branching ratio of this transition is significantly lower than that of the main transition$ 1^-(7117\rm{ keV}))\xrightarrow{E1} 0^+_{gs} $ . Similarly, the transitions$ E_\gamma $ = 1954.8 keV ($2^-(8872\rm{ keV})\rightarrow 2^+(6917\rm{ keV})$ ) and 1755.1 keV ($ 2^-(8872\rm{ keV})\rightarrow1^-(7117$ keV)) have a much lower probability than the transition with$ E_\gamma $ = 2741.5 keV ($ 2^-(8872\rm{ keV})\xrightarrow{E2}3^-(6130\rm{ keV}) $ ). The results of the TALYS calculations generally confirm these ratios. The sensitivity of our experiment is not sufficient to measure the characteristics of transitions with such a low probability.Notably, the discrepancy in the results of the TALYS model calculations for
$ E_\gamma=6917.1 $ keV ($ 2^+\rightarrow0^+_{g.s.} $ ). The overestimated values of the model calculations were pointed out by the authors [21]. The discrepancies in the description of the ($ n,\alpha $ ) channels are not so significant and are attributable to the model description difficulties of this type of reaction in TALYS.The yields of γ-rays for phosphorus were normalized to the sum of three lines:
$ 2233.6 $ ,$ 2235.3 $ , and$ 2240.0 $ keV, which could not be separated in our experiment. The results are summarized in Table 4. The yields of individual γ-lines for nine γ-transitions were determined experimentally for the first time. The angular distributions, measured for the most intense γ-transitions, are marked in bold.No $E_{\gamma}$ /keV

Reaction $Y_{\gamma}$ /%

This work TALYS [23] 752.2 $^{31}$ P

$(n,p)^{31}$ Si

5.1 (2.1) 3.6 983.0 $^{31}$ P

$(n,\alpha)^{28}$ Al

4.1 (0.9) 5.0 1136.2 $^{31}$ P

$(n,n')^{31}$ P

6.9 (1.2) 1.7 1 1263.3 $^*$ 

$^{\bf 31}$ P

$(\boldsymbol{n,d})^{\bf 30}$ Si

56.9 (9.0) 3.9 1266.1 $^*$ 

$^{\bf 31}$ P

$(\boldsymbol{n,n'})^{\bf 31}$ P

42.0 43.8 (10.6) 1438.6 $^{31}$ P

$(n,p)^{31}$ Si

5.5 (1.8) 3.2 2 1694.9 $^{31}$ P

$(n,p)^{31}$ Si

11.2 (2.2) 6.7 1928.3 $^{31}$ P

$(n,n')^{31}$ P

5.5 (1.8) 3.0 3 2028.9 $^{31}$ P

$(n,n')^{31}$ P

14.8 (2.5) 12.7 4 2148.5 $^{31}$ P

$(n,n')^{31}$ P

14.0 (3.0) 12.7 14.6 (3.3) 2197.6 $^{31}$ P

$(n,n')^{31}$ P

5.4 (1.1) 2.3 5 2233.6 $^*$ 

$^{\bf 31}$ P

$(\boldsymbol{n,n'})^{\bf 31}$ P

100 18.9 100 2235.3 $^*$ 

$^{\bf 31}$ P

$(\boldsymbol{n,d})^{\bf 30}$ Si

78.1 2240.0 $^*$ 

$\bf^{31}$ P

$(\boldsymbol{n,n'})^{\bf 31}$ P

2.9 3658.3 $^{31}$ P

$(n,n')^{31}$ P

12.6 (2.9) 1.3 Table 4. Experimental γ-ray yields from phosphorus. See Table 3 for explanations. An asterisk (*) marks unresolved γ-transitions.
Overall, the agreement in yields between our results, the literature, and the calculated data can be considered satisfactory. However, the spectroscopy of odd-even nuclei has a somewhat more complicated structure. For
$ ^{31} $ P, some peaks are overlapped with γ-lines from other reactions, such as$ (n,p) $ ,$ (n,d) $ , and$ (n,\alpha) $ . In particular, the strongest γ-line, which is identified in [23] as the second excited state to ground state$(\dfrac{5}{2}^+ (2234\rm{ keV})\rightarrow {\dfrac{1}{2}}^+(g.s.))$ transition in$ ^{31} $ P from the$ (n,n') $ reaction, according to our calculations by TALYS, is a triplet with the dominant γ-line at 2235.3 keV, which is the first excited state to ground state$(2^+ \rightarrow 0^+_{gs})$ transition, emitted from$ ^{30} $ Si after the$ ^{31} $ P$ (n,d)^{30} $ Si reaction. Meanwhile, the second strongest peak at 1266.1 keV, which is the first excited state to ground state$(\dfrac{3}{2}^+ \rightarrow {\dfrac{1}{2}}^+_{gs})$ transition in$ ^{31} $ P has an admixture of the$ (2^+ (3499\rm{ keV})\rightarrow 2^+ (2235\rm{ keV}) $ ) transition in$ ^{30} $ Si. This circumstance significantly complicates the choice of transition for normalization when determining reaction yields.The angular distributions
$ W(\theta) $ determined for the strongest γ-transitions corresponding to reactions of fast neutrons with oxygen are shown in Fig. 8 and with phosphorus in Fig. 9. The parameters of the Legendre polynomials used to approximate$ W(\theta) $ are given in Table 5 for oxygen and in Table 6 for phosphorus, compared with the results of other published works and with ENDF/B-VIII.0 data [25]. If not given by the authors, the anisotropy parameters were calculated for the literature data from the published angular distributions using Eq. (5).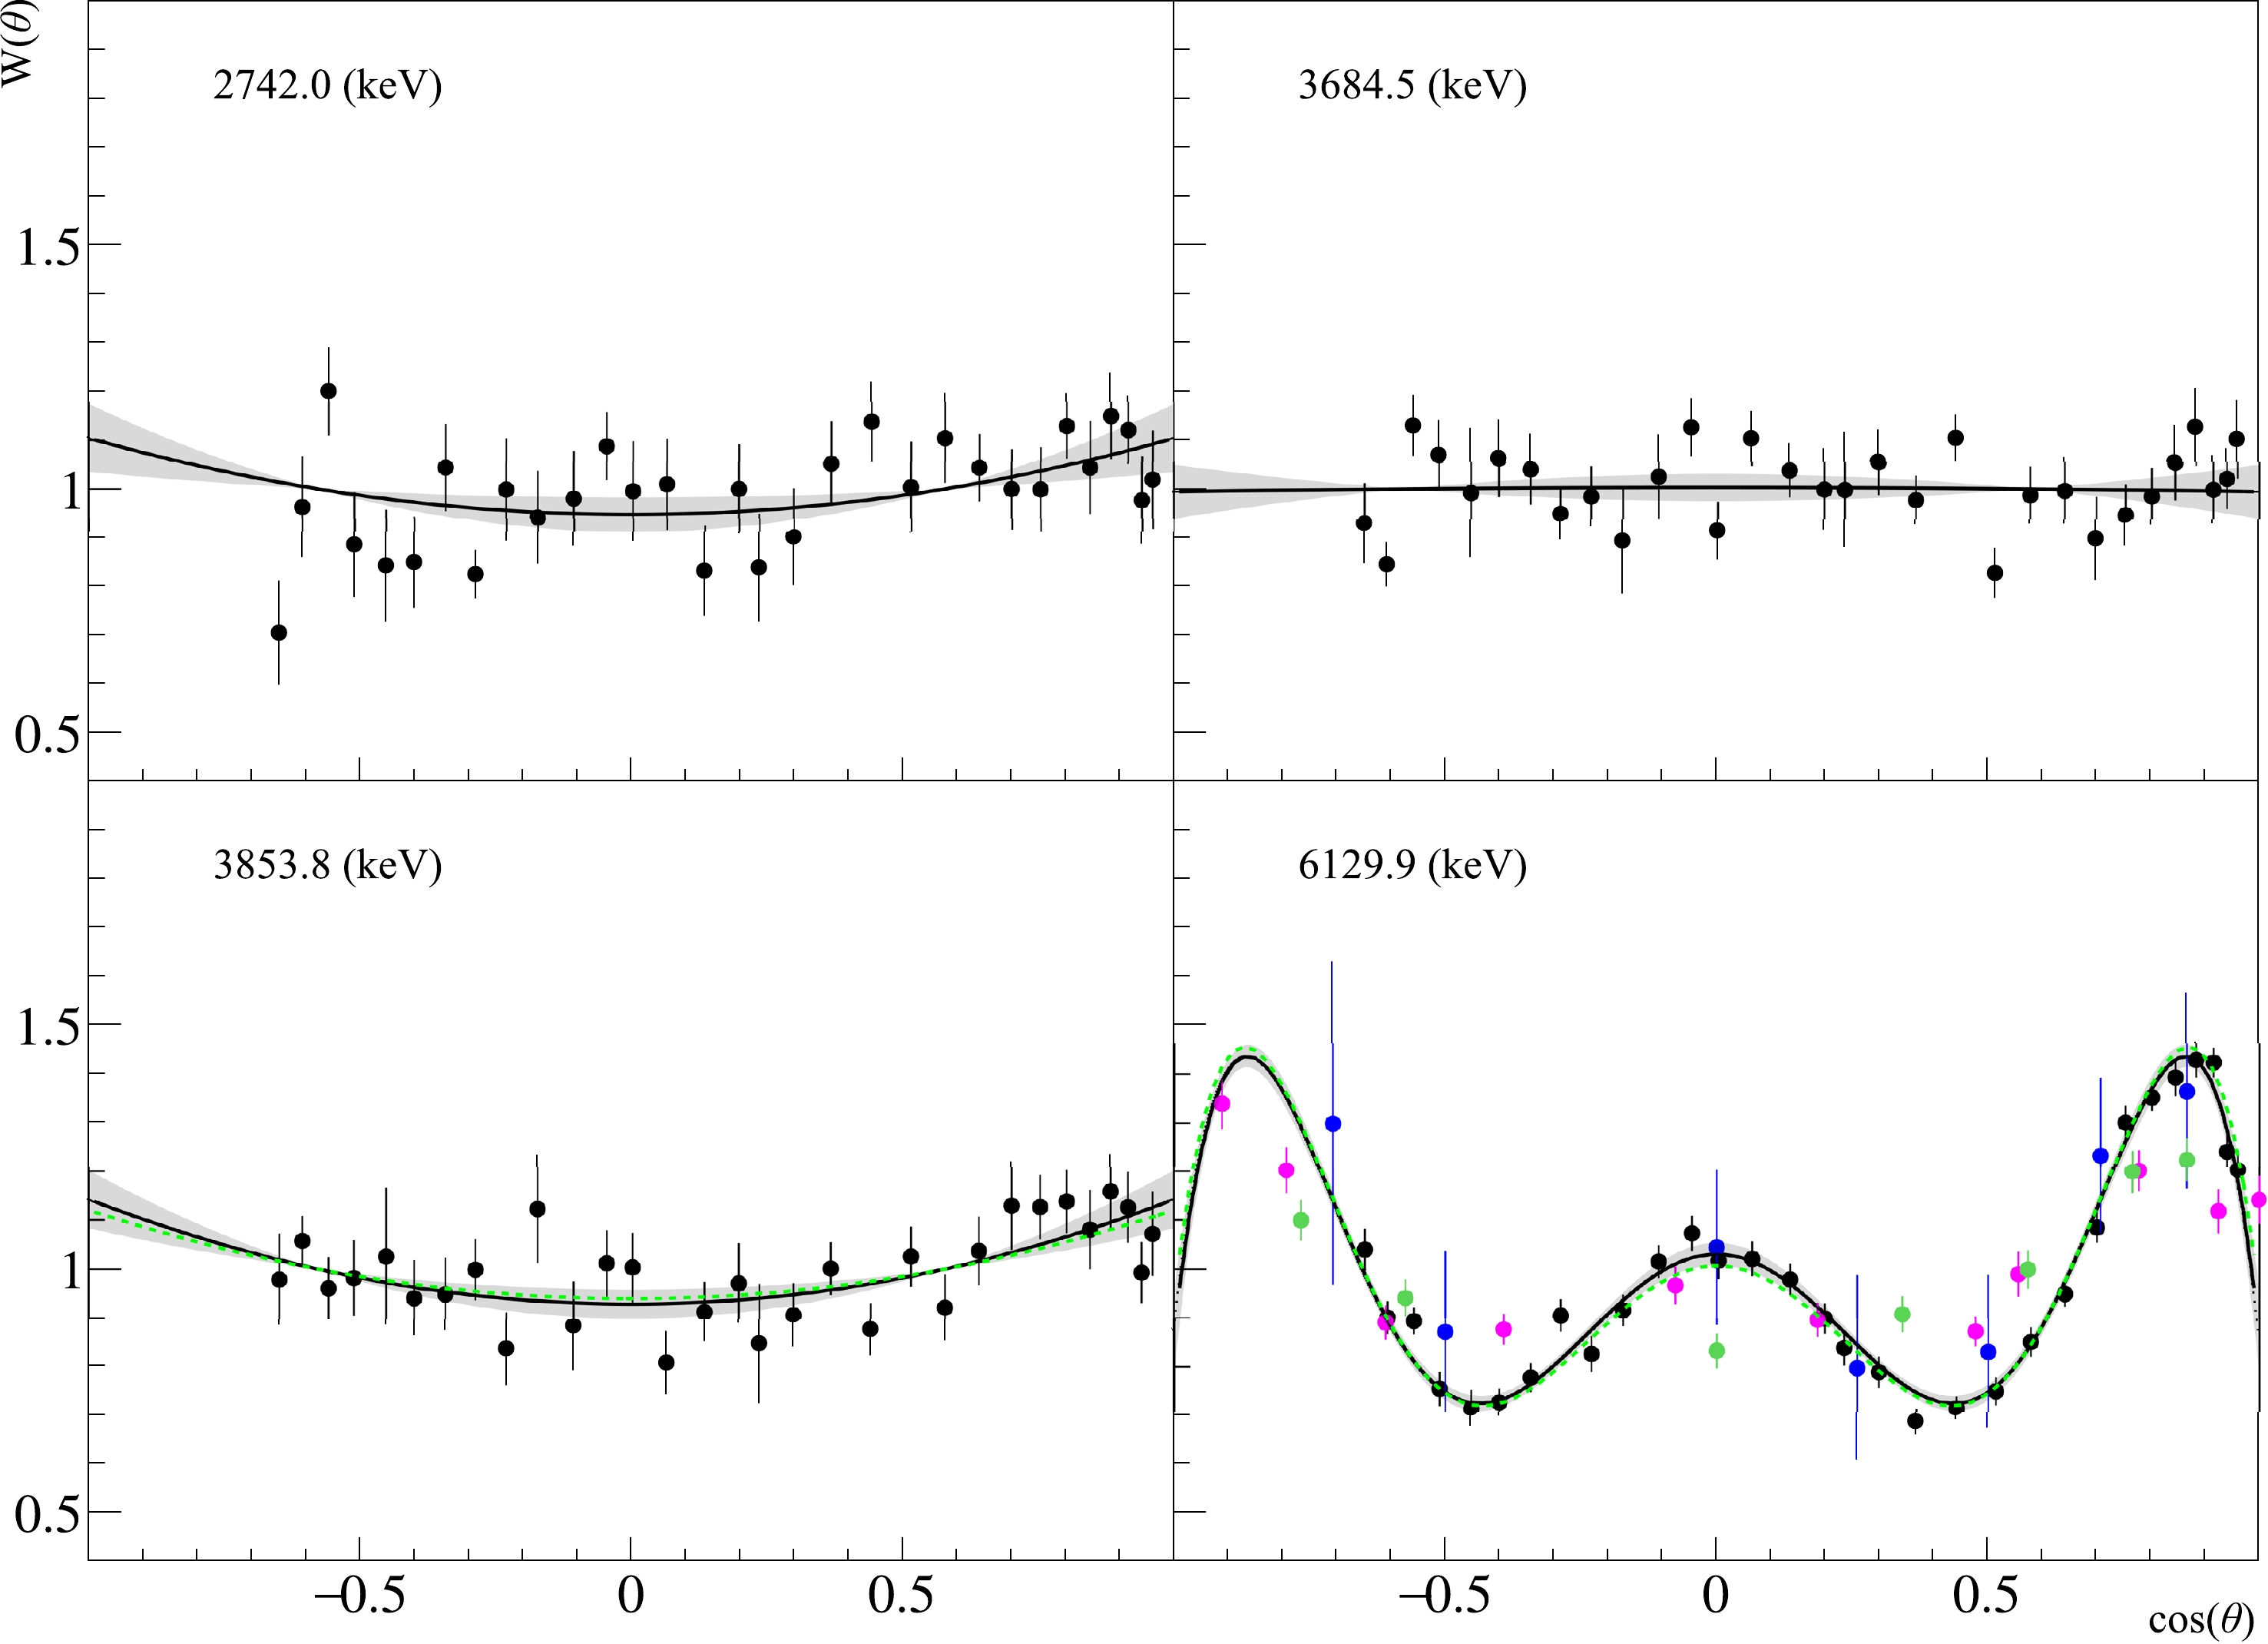
Figure 8. Angular distributions of
$\gamma-$ quanta from transitions in oxygen. The black dots correspond to data from this study, blue – from [26], purple – [27], and green – [28]. The black solid line is the Legendre polynomial fit of data from this work using Eq. (5); the green dashed line is the angular distribution from ENDF/B-VIII [25]. The gray area indicates a 95% confidence interval for the approximation of our data, considering the statistical and systematic errors of the angular anisotropy parameters.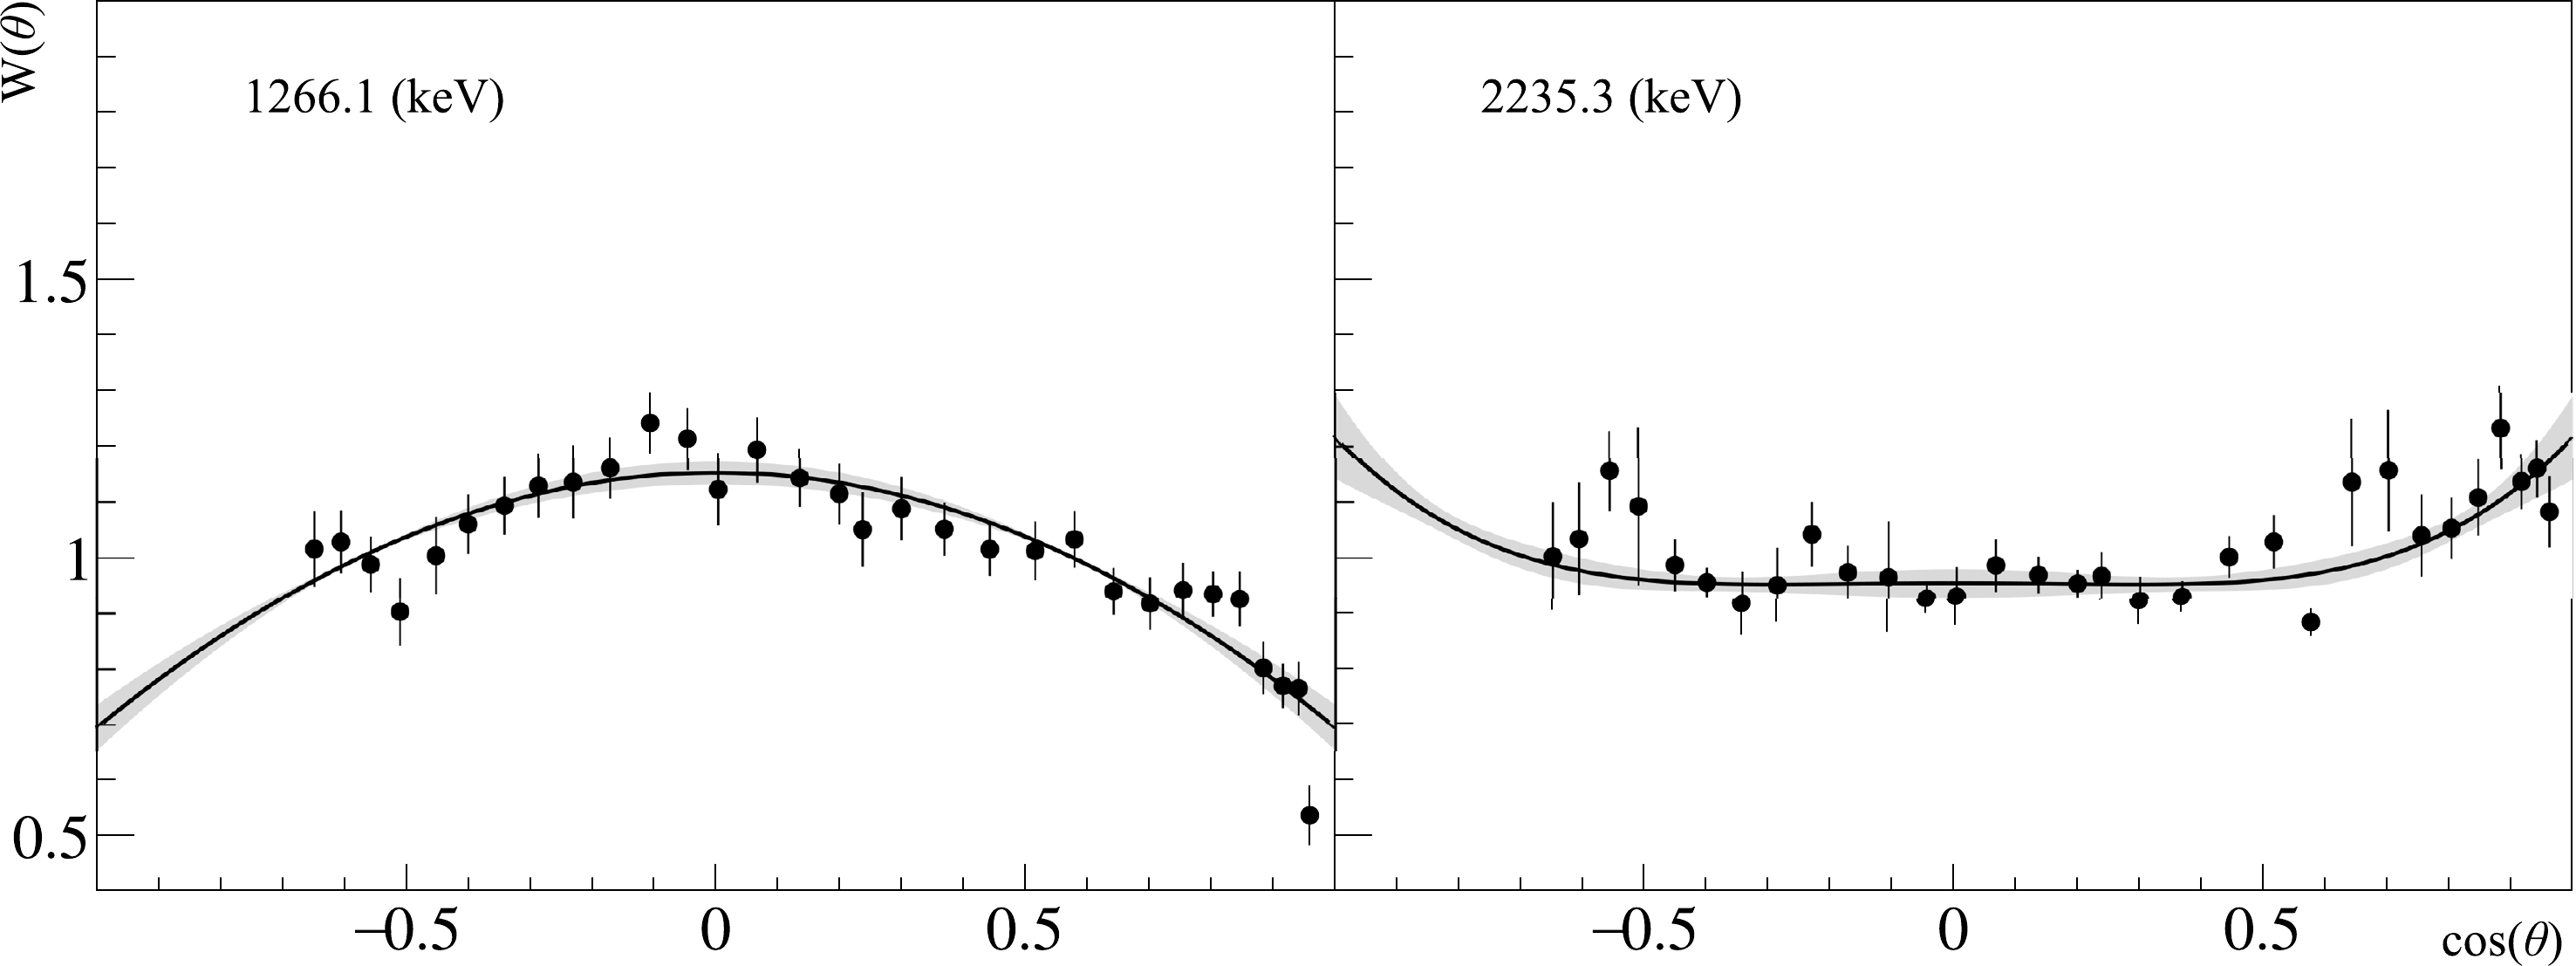
Figure 9. Angular distributions of γ-quanta from radiative transitions in phosphorus. The energies correspond to the strongest transition in the unresolved peaks. The black dots correspond to the data from this study. The black solid line is an approximation of these data based on the Legendre polynomials in Eq. (5). The gray areas show the 95% confidence interval of the approximation made, considering the statistical and systematic errors of the angular anisotropy parameters.
$E_{\gamma}$ /keV

Reaction $J_i^P$ (

$E_i$ /keV)

$J_f^P$ (

$E_f$ /keV)

Ref. $a_2$ 

$a_4$ 

$a_6$ 

2742.0 $^{16}$ O

$(n,n')^{16}$ O

2 $^-$ (8871.9)

3 $^-$ (6129.9)

This work $0.10\left(0.04\atop0.01\right)$ 

* 3684.5 $^{16}$ O

$(n,\alpha)^{13}$ C

$\dfrac{3}{2}^-$ (3684.5)

$\dfrac{1}{2}^-$ (0)

This work $-0.01 \left(0.04\atop0.01\right)$ 

3853.8 $^{16}$ O

$(n,\alpha)^{13}$ C

$\dfrac{5}{2}^+$ (3853.8)

$\dfrac{1}{2}^-$ (0)

[25] 0.12 This work $0.14\left(0.03\atop0.01\right)$ 

6129.9 $^{16}$ O

$(n,n')^{16}$ O

3 $^-$ (6129.9)

0 $^+$ (0)

[25] 0.40 0.09 $-0.55$ 

[26] 0.35 (0.07) 0.02 (0.08) $-0.03$ (0.08)

[27] 0.18 (0.06) $-0.27$ (0.08)

$-0.68$ (0.08)

[28] 0.26 (0.04) 0.06 (0.05) $-0.21$ (0.05)

[5] 0.34 (0.02) 0.10 (0.02) $-0.26$ (0.08)

This work $0.36 \left(0.02\atop0.01\right)$ 

$0.08 \left(0.02\atop0.03\right)$ 

$-0.57 \left(0.03\atop0.03\right)$ 

Table 5. Expansion coefficients of Legendre polynomials for angular distributions of γ-quanta from radiative transitions in oxygen. Statistical and systematical uncertainties are indicated in the top and bottom brackets, respectively. The energies of γ-quanta
$E_{\gamma}$ and the spin, parity, and energy$J^P(E)$ of the initial (i) and final (f) states are taken from [29].$E_{\gamma}$ /keV

Reaction $J_i^P$ (

$E_i$ /keV)

$J_f^P$ (

$E_f$ /keV)

Ref. $a_2$ 

$a_4$ 

1263.3 $^{31}$ P

$(n,d)^{30}$ Si

2 $^+$ (3498.5)

2 $^+$ (2235.3)

$ \begin{cases} \rm{This work} \end{cases}$ 

$-0.31 \left(0.02\atop0.01\right)$ 

1266.1 $^{31}$ P

$(n,n')^{31}$ P

$\dfrac{3}{2}^+$ (1266.1)

$\dfrac{1}{2}^+$ (0)

2233.6 $^{31}$ P

$(n,n')^{31}$ P

$\dfrac{5}{2}^+$ (2233.6)

$\dfrac{1}{2}^+$ (0)

$\begin{cases}\;\\{\rm{This~ work} } \\ \;\end{cases}$ 

$0.14 \left(0.02\atop0.01\right)$ 

$0.07 \left(0.03\atop0.04\right)$ 

2235.3 $^{31}$ P

$(n,d)^{30}$ Si

2 $^+$ (2235.3)

0 $^+$ (0)

2240.0 $^{31}$ P

$(n,n')^{31}$ P

$\dfrac{3}{2}^+$ (3506.1)

$\dfrac{3}{2}^+$ (1266.1)

Table 6. Expansion coefficients of Legendre polynomials for angular distributions of γ-quanta from radiative transitions in phosphorus. Statistical and systematical uncertainties are indicated in the top and bottom brackets, respectively. The energies of γ-quanta
$E_{\gamma}$ and the spin, parity, and energy$J^P(E)$ of the initial (i) and final (f) states are taken from [29].Notably, experimental literature data for the γ-ray angular anisotropy in oxygen exist only for the strongest
$ 6129.9 $ keV line. The angular correlation coefficients were obtained for the first time for the remaining three transitions. Overall, we can note the acceptable agreement of our data with the literature and library data.The anisotropy parameters obtained in this experiment for the 6129.9 keV transition in oxygen are comparable with the results of our previous work, where measurements were performed with a SiO
$ _2 $ target [5].For the 2742.0 keV and 3684.5 keV transitions in oxygen, the isotropic distribution of γ-quanta is indicated in the ENDF/B-VIII library, which agrees well with our data (falling within the 95% confidence interval of our approximation).
In the case of phosphorus, the strongest γ-lines, 1266.1 keV and 2235.3 keV, could not be separated from the neighboring transitions. Therefore, the angular anisotropy parameters in Table 6 are given for the sum of unresolved transitions. We have not found published experimental data on the angular anisotropy of γ-ray emission in neutron-induced reactions for phosphorus. The ENDF/B-VIII library also lacks data on the evaluated γ-ray angular anisotropy. Therefore, we cannot compare our results presented in Table 6 with any other data.
-
The high resolution energy spectrum of γ-quanta from sulfur obtained with the HPGe detector is shown in Fig. 10. The vertical lines point to the observed γ-transitions, attributed to the reactions of 14.1 MeV neutrons with sulfur and identified by TalysLib.
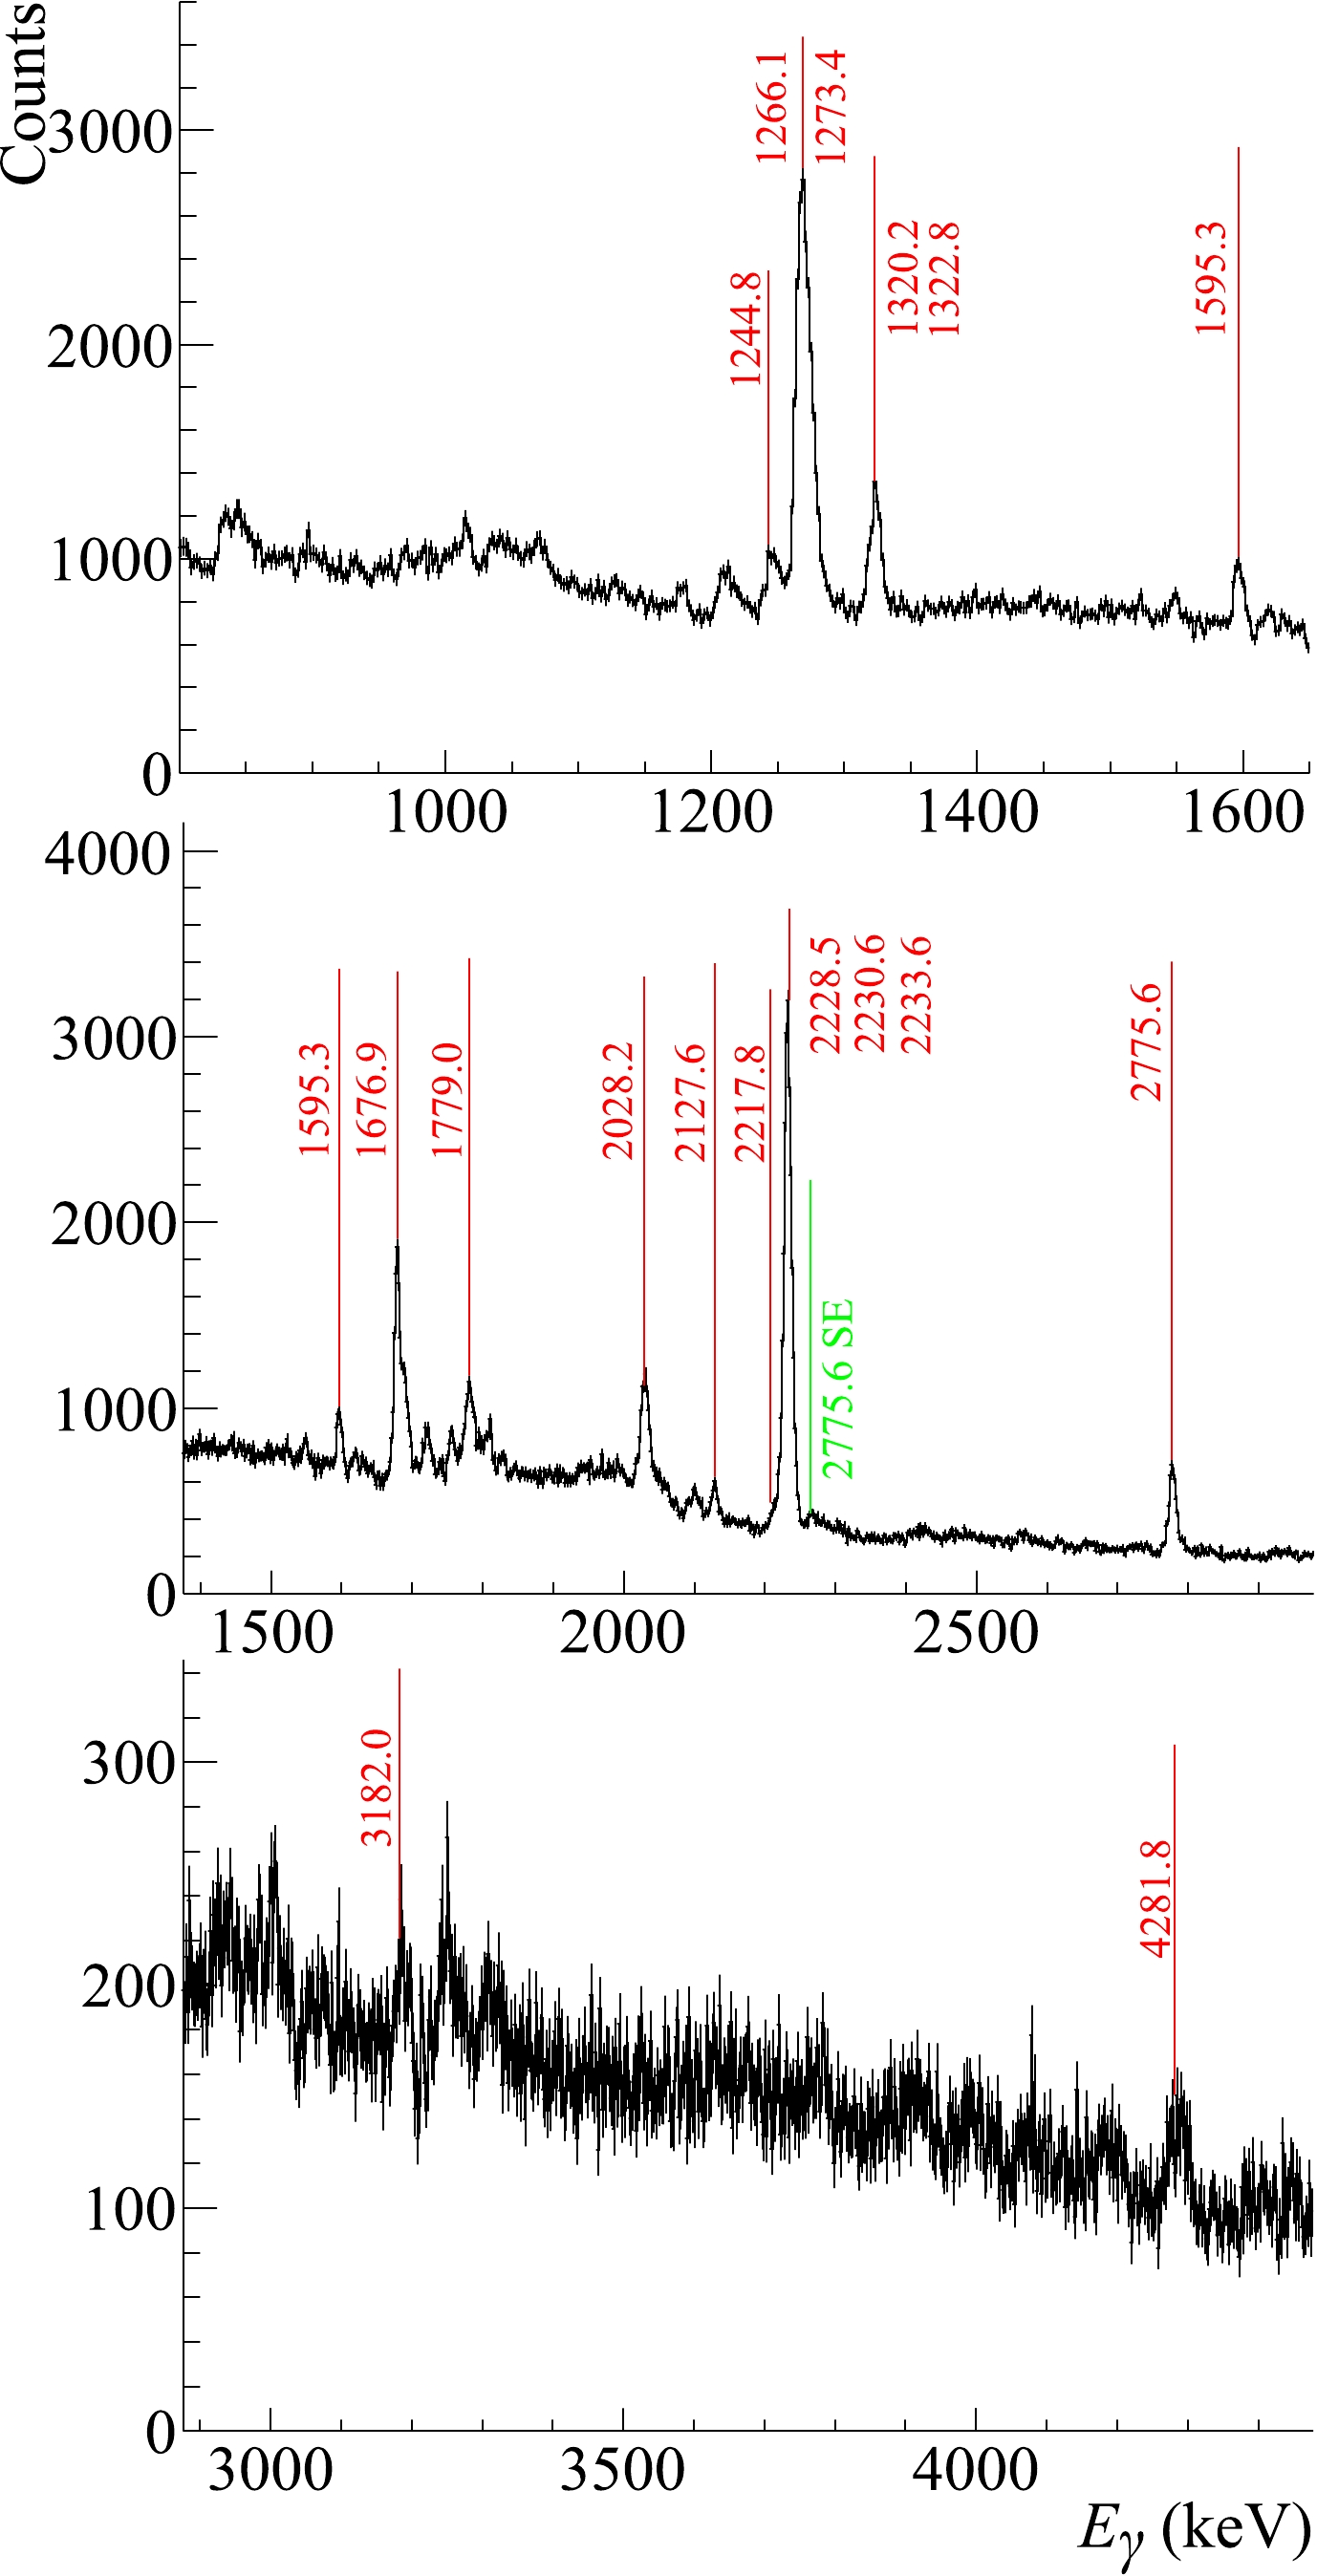
Figure 10. Energy spectrum of γ-quanta in the
$800-4500$ keV range, measured with the HPGe detector during the irradiation of a sulfur sample. Green line – single escape peak. Identification of the γ-peaks was performed via TalysLib. See details in the text.The γ-ray yields of sulfur were determined using Eq. (3) and normalized to the sum of three lines:
$ 2228.5 $ ,$ 2230.6 $ , and$ 2233.6 $ keV. Although the transition to the ground state$ 2^+ (2230.6\rm{ keV})\rightarrow0^+_{gs} $ is dominant, the resolution of our detector was not sufficient to separate it from the neighboring γ-lines. Table 7 includes ten single γ-transitions, two unresolved doublets, and one unresolved triplet identified in our experiment. The experimental yields obtained are compared with the TALYS calculations and literature data [23].No $E_{\gamma}$ /keV

Reaction $Y_{\gamma}$ /%

This work TALYS [23] 1244.8 $^{32}$ S

$(n,p)^{32}$ P

5.3 (1.0) 3.8 1 1266.1 $^*$ 

$^{\bf 32}$ S

$(\boldsymbol{n,d})^{\bf 31}$ P

40.1 (1.6) 35.4 1273.4 $^*$ 

$^{\bf 32}$ S

$(\boldsymbol{n,\alpha})^{\bf 29}$ Si

31.6 43.6 (7.0) 1320.2 $^*$ 

$^{34}$ S

$(n,n')^{34}$ S

10.2 (3.7) 1.5 1322.8 $^*$ 

$^{32}$ S

$(n,p)^{32}$ P

5.5 1595.3 $^{32}$ S

$(n,\alpha)^{29}$ Si

6.4 (0.5) 11.0 2 1676.9 $^{32}$ S

$(n,p)^{32}$ P

24.7 (1.0) 18.7 3 1779.0 $^{32}$ S

$(n,n\alpha)^{28}$ Si

9.3 (0.9) 16.8 4 2028.2 $^{\bf 32}$ S

$(\boldsymbol{n,\alpha})^{\bf 29}$ Si

18.1 (1.3) 40.1 39.5 (9.6) 2127.6 $^{34}$ S

$(n,n')^{34}$ S

4.7 (0.4) 9.1 2217.8 $^{32}$ S

$(n,p)^{32}$ P

7.1 (0.6) 1.7 5 2228.5 $^*$ 

$^{\bf 32}$ S

$(\boldsymbol{n,n'})^{\bf 32}$ S

10.4 2230.6 $^*$ 

$^{\bf 32}$ S

$(\boldsymbol{n,n'})^{\bf 32}$ S

100 79.0 100 2233.6 $^*$ 

$^{\bf 32}$ S

$(\boldsymbol{n,d})^{\bf 31}$ P

10.6 6 2775.6 $^{32}$ S

$(n,n')^{32}$ S

17.0 (1.1) 18.5 14.8 (2.4) 7 3182.0 $^{32}$ S

$(n,n')^{32}$ S

4.1 (1.0) 3.0 8 4281.8 $^{32}$ S

$(n,n')^{32}$ S

5.4 (1.0) 6.1 Table 7. Experimental yields of γ-rays from sulfur obtained by the HPGe detector compared with TALYS 1.96 calculations and the published data of other authors. Statistical uncertainties are indicated in brackets. Estimated systematic uncertainties do not exceed 5% of the yield values. For γ-transitions in bold type, the angular distributions of γ-quanta were also determined. An asterisk (*) marks unresolved γ-transitions. The numbers in the first column indicate these peaks in the energy spectra obtained with the Romasha BGO detector system (see Fig. 4 (b)).
In this study, we determined the γ-ray yields of eight individual γ-transitions and one doublet for the first time. For the γ-transitions in bold, the angular distributions were also determined. Generally, there is a reasonable agreement between our results and the literature data for strong γ-transitions, except for the γ-line at
$ E_{\gamma} = $ 2028.2 keV. We believe that the reason for this discrepancy is the admixture of lines 2127.6 keV and 2217.8 keV in the data from [23] obtained by a low resolution NaI(Tl) γ-detector. Our results do not agree perfectly with the TALYS calculations. However, the accuracy of the TALYS data can be quite poor, especially for the reactions$ (n,p) $ ,$ (n,d) $ , and$ (n,\alpha) $ .The angular distributions
$ W(\theta) $ determined for the strongest gamma transitions from reactions induced by neutrons with an energy of 14.1 MeV on a sulfur sample are shown in Fig. 11. The obtained parameters of the angular distributions are given in Table 8 in comparison with the results of other works.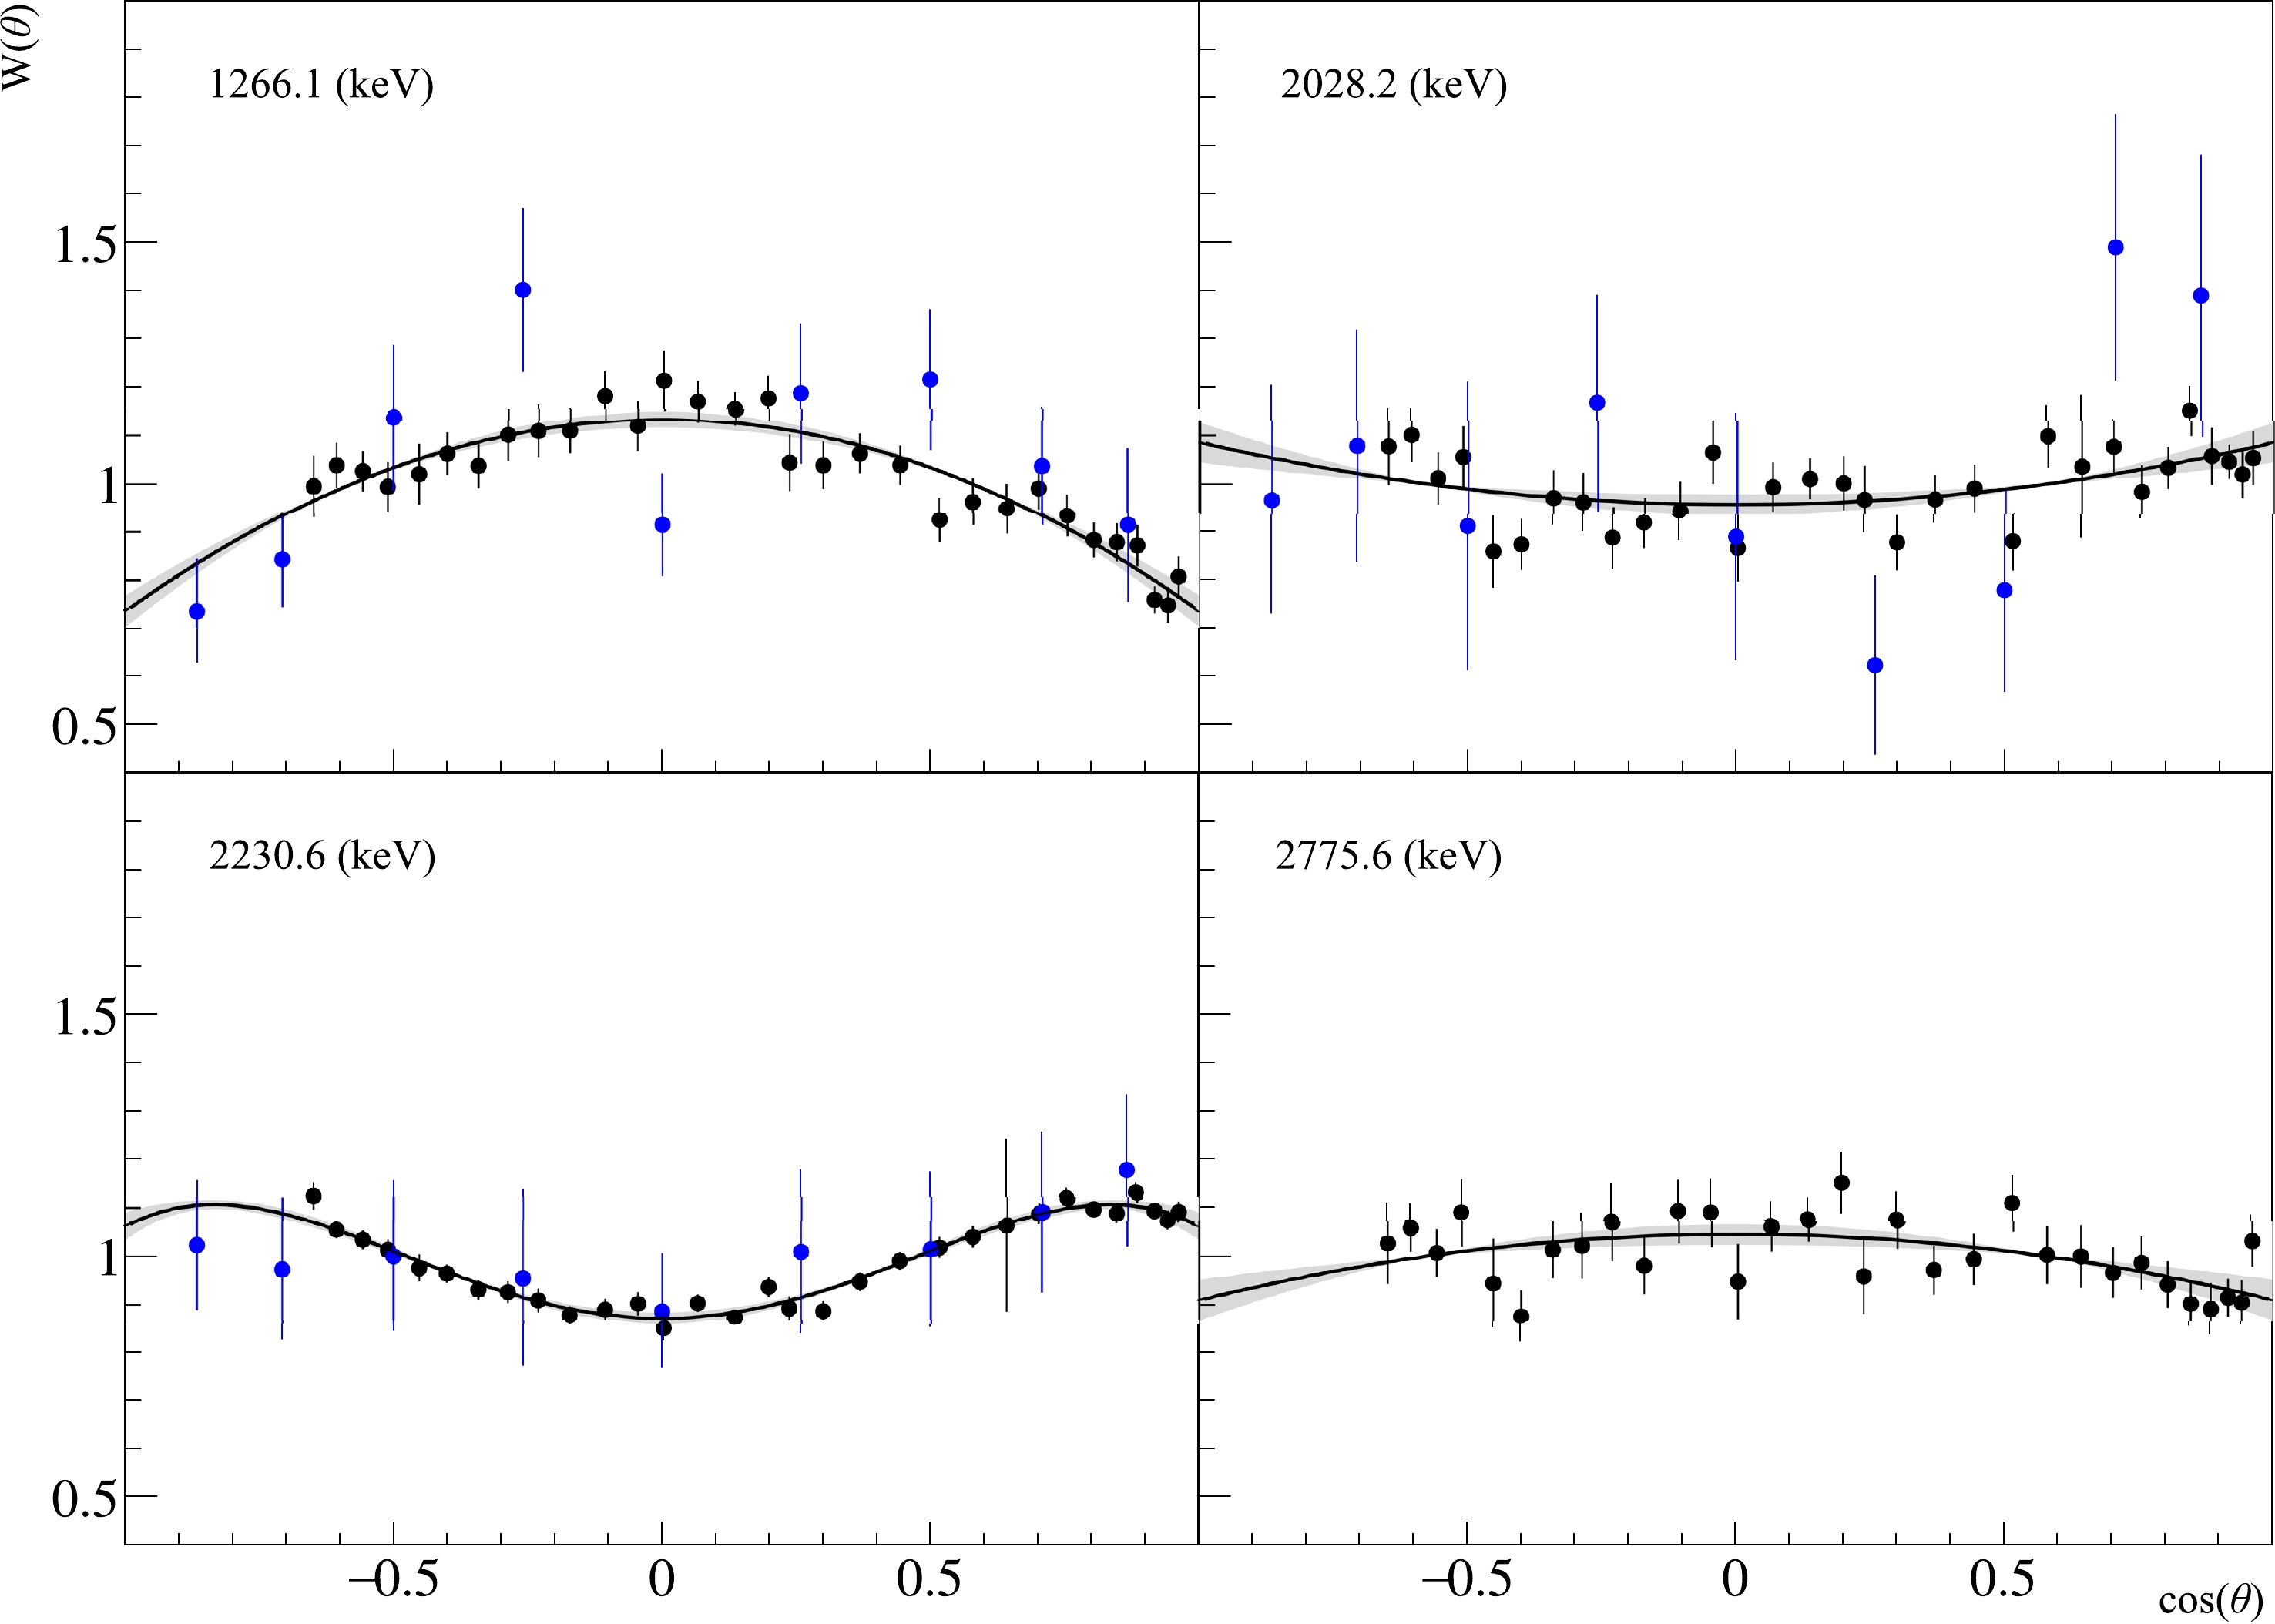
Figure 11. Angular distributions of γ-quanta from radiative transitions in sulfur. The energies correspond to the strongest transition in the unresolved peaks. The black dots show the data in this study, and blue dots indicate data from [30]. The black solid line is the polynomial approximation of our data by the Legendre polynomials in Eq. (5). The gray areas show the 95% confidence interval of the approximation made, considering the statistical and systematic errors of the angular anisotropy parameters.
$E_{\gamma}$ /keV

Reaction $J_i^P$ (

$E_i$ /keV)

$J_f^P$ (

$E_f$ /keV)

Ref. $a_2$ 

$a_4$ 

1266.1 $^{32}$ S

$(n,d)^{31}$ P

$\dfrac{3}{2}^+$ (1266.1)

$\dfrac{1}{2}^+$ (0)

$\begin{cases}[30]\\ \rm{This work}\end{cases}$ 

$-0.28 (0.13)$ 

1273.4 $^{32}$ S

$(n,\alpha)^{29}$ Si

$\dfrac{3}{2}^+$ (1273.4)

$-0.26\left(0.02\atop0.01\right)$ 

2028.2 $^{32}$ S

$(n,\alpha)^{29}$ Si

$\dfrac{5}{2}^+$ (2028.2)

$\dfrac{1}{2}^+$ (0)

$\begin{cases}[30]\\ \rm{This work}\end{cases}$ 

0.35 (0.20) $0.08 \left(0.02\atop0.01\right)$ 

2228.5 $^{32}$ S

$(n,n')^{32}$ S

4+ (4459.1) 2+ (2230.6) $\begin{cases}[30]\\ \rm{This work}\\ \;\end{cases}$ 

0.13 (0.05) −0.04 (0.08) 2230.6 $^{32}$ S

$(n,n')^{32}$ S

2+ (2230.6) 0+ (0) $0.17 \left(0.01\atop0.01\right)$ 

$-0.11\left(0.01\atop0.02\right)$ 

2233.6 $^{32}$ S

$(n,d)^{31}$ P

$\dfrac{5}{2}^+$ (2233.6)

$\dfrac{1}{2}^+$ (0)

2775.6 $^{32}$ S

$(n,n')^{32}$ S

3− (5006.2) 2+ (2230.6) This work $-0.09\left(0.02\atop0.01\right)$ 

* Table 8. Legendre polynomial expansion coefficients for the angular distribution of γ-quanta for sulfur. Statistical and systematical uncertainties are indicated in the top and bottom brackets, respectively. The γ-quanta energies
$E_{\gamma}$ and the spin, parity, and energy$J^P$ (E) of the initial (i) and final (f) states are taken from [29].From Fig. 11, the errors in our data are smaller than those in the data of other authors. This also resulted in smaller errors in the angular distribution coefficients shown in Table 8. Data from the evaluated data library are not presented in the table because angular distributions for these transitions in ENDF/B-VIII are treated as isotropic.
-
The main goal of this study was to investigate the characteristics of γ radiation emitted by atomic nuclei from the reactions induced by
$ 14.1 $ MeV neutrons. During its implementation, measurements of the yields and angular distributions of γ-quanta were performed with two different experimental setups for samples containing natural oxygen, phosphorus, and sulfur. The joint use of two different detector systems and the improvement of the data processing procedures allowed us to significantly increase the reliability of the experimental data.Comparing the experimentally obtained yields of γ-rays with the data from other published works and with the data of the nuclear data library generally shows a fairly good agreement between them. Meanwhile, significant discrepancies are observed for several individual γ-transitions. The agreement between the experimental yields of γ-quanta and those theoretically obtained using the TALYS 1.96 program for most of the observed transitions is quite good, except for the
$(n,p) \; (n,d)$ and$ (n,\alpha) $ reactions, which is obviously because nuclei with insufficiently known parameters of their optical potentials are formed in these reactions.Despite the comprehensive study of neutron-nuclear reactions, there is still much work to be done in this field. Data on the yields and emission cross-sections of γ-quanta at certain energies are needed for the currently developed methods to perform rapid elemental analysis of various substances using
$ D-D $ and$ D-T $ neutron generators as neutron sources.Using portable neutron generators for fast and high-quality elemental analysis requires large samples and long measurement times due to the relatively low intensity of the neutron flux from these devices. Therefore, the development and application of methods for correcting the obtained data for the scattering and absorption of γ-quanta and neutrons in large samples is necessary, and the results of this work show that this is quite feasible.
-
The authors are grateful to VNIIA (Moscow, Russia) for providing a portable neutron generator ING-27. We thank D. N. Borisov and S. I. Negovelov for their help in preparing the experiments.
-
The default optical model (OM) parameter set used in TALYS are the local and global parameterizations of Koning and Delaroche.
The phenomenological optical potential U for nucleon-nucleus scattering is usually defined as
$ \begin{aligned}[b] U(r, E) =& - \mathcal{V}_{V}(r, E) - {\rm i}\mathcal{W}_{V}(r, E) - {\rm i}\mathcal{W}_{D}(r, E) \\&+(\vec{l} \cdot \vec{\sigma})(\mathcal{V}_{SO}(r, E) + {\rm i}\mathcal{W}_{SO}(r, E)) + \mathcal{V}_{C}(r), \end{aligned}\tag{A1} $

where
$\mathcal{V}_{V,SO}$ and$\mathcal{W}_{V,D,SO}$ are the real and imaginary components of the volume-central V, surface-central D, and spin-orbit$ S O $ potentials, respectively, and l and σ are spin and angular momentum operators. All components are separated in E-dependent well depths,$ V_{V} $ ,$ W_{V} $ ,$ W_{D} $ ,$ V_{SO} $ , and$ W_{SO} $ , and energy-independent radial parts f, given as$ \begin{aligned}[b] \mathcal{V}_{V}(r, E) =& V_{V}(E)f(r, R_{V}, a_{V}),\\\mathcal{W}_{V}(r, E) =& W_{V}(E)f(r, R_{V}, a_{V}),\\\mathcal{W}_{D}(r, E) =& -4a_{D}W_{D}(E)\dfrac{\rm d}{{\rm d}r}f(r, R_{D}, a_{D}),\\\mathcal{V}_{SO}(r, E) =& V_{SO}(E) \rlap- \lambda ^{2}_{\pi}\dfrac{1}{r}\dfrac{\rm d}{{\rm d}r}f(r, R_{SO}, a_{SO}),\\\mathcal{W}_{SO}(r, E) =& W_{SO}(E) \rlap- \lambda ^{2}_{\pi}\dfrac{1}{r}\dfrac{\rm d}{{\rm d}r}f(r, R_{SO}, a_{SO}), \end{aligned}\tag{A2} $

where the geometry parameter, the radius
$ R_{i} = r_{i}A^{1/3} $ , and the diffuseness parameter$ a_{i} $ determine the form-factor$ f(r, R_{i}, a_{i}) $ .All components of the potential depend on
$ (E-E_{F}) $ , where$ E_{F} $ , the Fermi energy for neutron or proton in MeV, is defined as the energy halfway between the last occupied and the first unoccupied shell of the nucleus$ \begin{aligned}[b]E^{n}_{F} =& -\frac{1}{2}[S_{n}(Z,N) + S_{n}(Z,N+1)],\\ E^{p}_{F} =& -\frac{1}{2}[S_{p}(Z,N) + S_{p}(Z+1,N)]. \end{aligned}\tag{A3} $

TALYS uses the OM potentials parametrization given below:
$ \begin{aligned}[b] V_{V}(E)=& v_{1}[1-v_{2}(E-E_{F})+v_{3}(E-E_{F})^{2}-v_{4}(E-E_{F})^{3}], \\ W_{V}(E)=& w_{1} \frac{(E-E_{F})^{2}}{(E-E_{F})^2 + (w_{2})^{2}}, \\W_{D}(E)=&d_{1}\frac{(E-E_{F})^{2}}{(E-E_{F})^{2} + (d_{3})^{2}}\exp[-d_{2}(E-E_{F})], \end{aligned} $

$ \begin{aligned}[b] V_{SO}(E)=&v_{so1}\exp[-v_{so2}(E-E_{F}],\\ W_{SO}(E)=&w_{so1}\frac{(E-E_{F})^{2}}{(E-E_{F})^{2} + (w_{so2})^{2}} . \end{aligned}\tag{A4} $

Parameters
$ r_{V} $ ,$ a_{V} $ ,$ r_{D} $ ,$ a_{D} $ ,$ r_{SO} $ ,$ a_{SO} $ , and$ r_{C} $ do not depend on energy. This parametrization is valid for incident energy E from 1 keV up to 200 MeV.For the nuclei discussed in this paper, predefined OM parameters and deformations are available for
$ ^{31} $ P and$ ^{32} $ S. Notably, sulfur is a fairly attractive object for OM testing [31, 32]. For$ ^{16} $ O, they were calculated using Koning parametrization. In Table A1, the OM parameters are listed according to Eq. (9).Nuclide $^{16}$ O

$^{31}$ P

$^{32}$ S

$v_1$ 

$ 58.916 $ 

$ 57.8 $ 

$ 59.5$ 

$v_2$ 

$ 7.2\times 10^{-3}$ 

$ 7.2\times 10^{-3}$ 

$ 7.2\times 10^{-3}$ 

$v_3$ 

$ 1.962\times 10^{-5}$ 

$ 1.9\times 10^{-5}$ 

$ 1.9\times 10^{-5}$ 

$v_4$ 

$ 7.1\times10^{-9}$ 

$ 0 $ 

$ 0 $ 

$w_1$ 

$ 12.462 $ 

$ 12.4 $ 

$ 12.6$ 

$w_2$ 

$ 74.822 $ 

$ 76 $ 

$ 75 $ 

$d_1$ 

$ 16 $ 

$ 15.4 $ 

$ 15.6 $ 

$d_2$ 

$ 0.0218 $ 

$ 0.0214 $ 

$ 0.0215 $ 

$d_3$ 

$ 11.5 $ 

$ 11.5 $ 

$ 11 $ 

$v_{so1}$ 

$ 5.97 $ 

$ 6 $ 

$ 6 $ 

$v_{so2}$ 

$ 0.004 $ 

$ 0.004 $ 

$ 0.004 $ 

$w_{so1}$ 

$ -3.1 $ 

$ -3.1 $ 

$ -3.1 $ 

$w_{so2}$ 

$ 160 $ 

$ 160 $ 

$ 160 $ 

Approach DWBA DWBA VIB Table A1. Optical model parameters.
-
According to the ENDF-6 format manual describing the Evaluated Nuclear Data Files ENDF/B-VI, ENDF/B-VII, and ENDF/B-VIII (Eq. (14.1) in [33]), the angular distribution of γ-radiation in the ENDF format is described in terms of
$ p_k(\theta,E) $ , i.e., the probability of γ-quantum emission with number k emitted owing to nuclear reaction induced by particles with energy E.$ p_k(\theta,E)=\frac{2\pi}{\sigma_k^\gamma (E)}\frac{{\rm d}\sigma_k^\gamma (E)}{{\rm d}\Omega}, \tag{B1} $

Meanwhile, in the ENDF file,
$ p_k(\theta,E) $ is presented in terms of Legendre series expansion:$ p_k(\theta,E)=\sum\limits_{l=0}^{2J} \frac{2l+1}{2} b_l^k(E)P_l(\cos\theta),\tag{B2} $

where J represents the multipolarity of the γ-quantum. Eq. (5) can be represented as follows:
$ \frac{4\pi}{\sigma_k^\gamma (E)}\frac{{\rm d}\sigma_k^\gamma (E)}{{\rm d}\Omega}=1+\sum\limits_{l=2,4...}^{2J}a_l^k(E)P_l(\cos\theta), \tag{B3} $

and thus, Eqs. (11) and (12) differ only in terms of the normalization coefficient. We converted
$ b_l^k $ values to$ a_l^k $ using the following formula:$ a_l^k=(2l+1) b_l^k. \tag{B4} $

The
$ b_l^k(E) $ coefficients were extracted from the ENDF-B/VIII.0 database, file "n_0825_8-O-16", MF=14, MT=4, rows 36449-36452 for the 6128.9 keV transition in$ ^{16} $ O and MF=14, MT=107, rows 38118-38121 for the 3684.5 keV transition in$ ^{13} $ C. We have interpolated the values of$ b_l^k $ corresponding to two projectile energies to obtain the value for 14.1 MeV neutrons.
Measurement of yields and angular distributions of γ-quanta from the interaction of 14.1 MeV neutrons with oxygen, phosphorus, and sulfur
- Received Date: 2023-09-22
- Available Online: 2024-03-15
Abstract: A study of the inelastic scattering of neutrons with an energy of


 DownLoad: