


 Abstract
 HTML
HTML Reference
 Related
 PDF
PDF


-
Cosmic Rays (CRs) were discovered about a century ago. First evidence of this radiation from space came from the measurements performed by Victor Hess in 1912 during seven balloon flights at different altitudes. Before the development of accelerators in the fifties, the cosmic rays served as the main source of high-energy particles: positrons, in 1932, muons in 1937, pions and strange particles (kaons and hyperons) in the late 1940s were discovered in cosmic rays. Presently, cosmic rays are studied since they are messengers of extreme phenomena involving very high energies. Indeed, their power-law energy spectrum extending up to
$ 10^{20} $ eV (see Fig. 1) and beyond witnesses their non-thermal origin. High-energy cosmic rays are the manifestation of the relativistic Universe involving physical processes at energies by far in excess of what could ever be achieved in man made laboratories. How cosmic accelerators can boost particles to these energies and which is their nature are primary questions that yet need a firm answer. At the same time, these sources are natural laboratories to explore how the laws of physics behave at the highest energies. The center-of-mass energy of the LHC pp collisions is reached with the interaction on fixed target of a proton with energy$ \approx10^{17} $ eV. The highest energy cosmic rays may provide the opportunity to probe new physics beyond the Standard Model of particle physics as, for instance, a tiny violation of the Lorentz invariance at energies not reached at terrestrial accelerators. A sudden change of the hadronic interaction at the highest energies is another example. Thus, both astrophysics and particle physics are central topics of the cosmic ray research.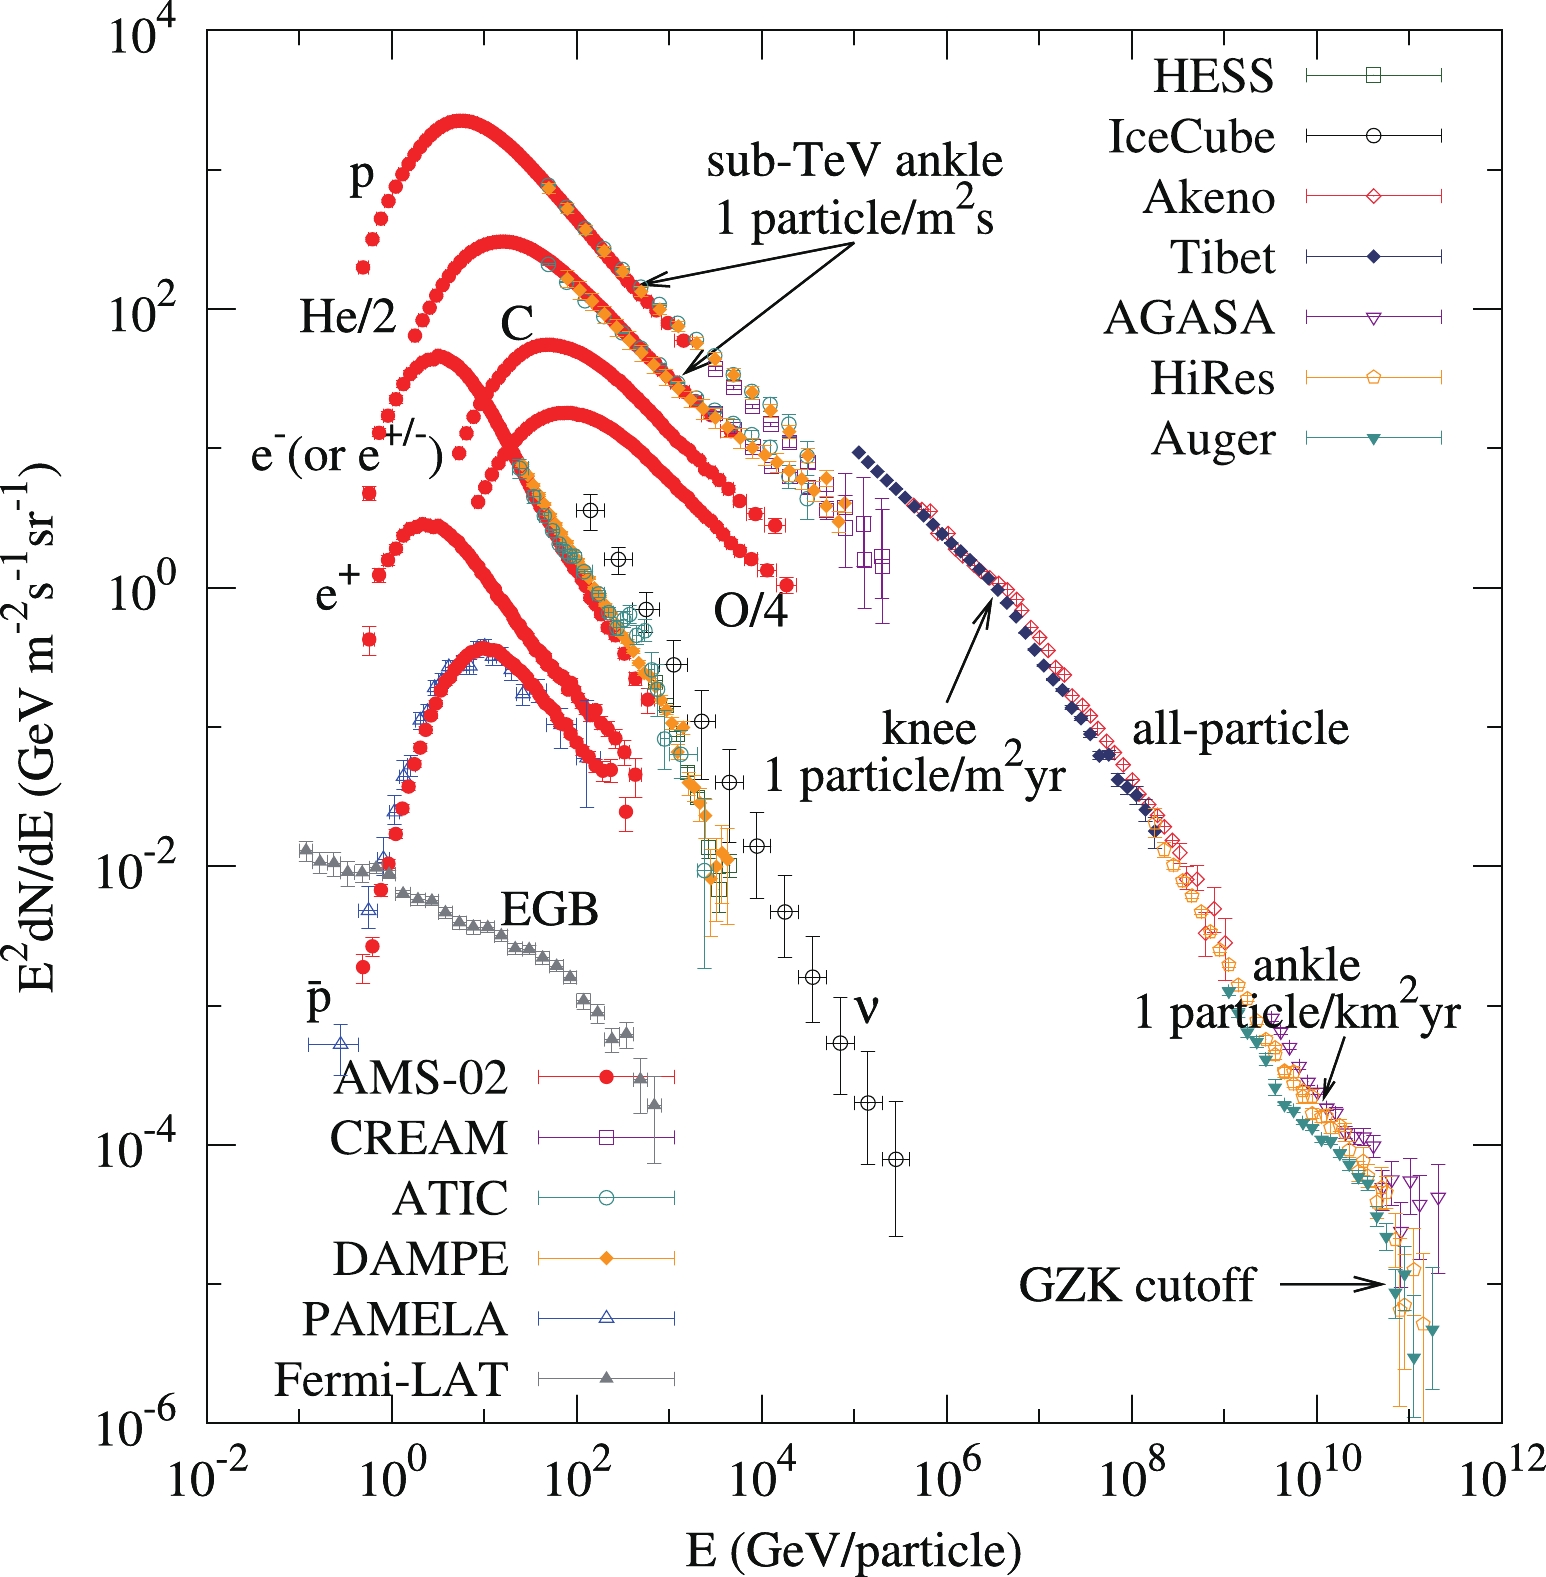
Figure 1. (color online) Cosmic-ray energy spectra. For energies below ~ 100 TeV, the spectra of different species are shown, and for higher energies the all-particle spectra are plotted. References of data: CREAM [1]; ATIC [2, 3]; AMS-02 [4-8]; PAMELA [9]; DAMPE [10-12]; Fermi-LAT [13]; HESS [14]; IceCube [15]; Akeno [16]; Tibet [17]; AGASA [18]; HiRes [19, 20]; Auger [21].
-
The problem of the cosmic ray origin has been debated extensively. This issue concerns the nature of the cosmic ray sources, how cosmic rays are accelerated at very high energies and how they propagate in the interstellar or intergalactic medium. Two extreme models have been discussed: the galactic model, in which the cosmic ray sources are supposed being concentrated in the Galaxy, and the extragalactic models which postulate that cosmic rays occupy the extragalactic space from which they may flow into the Galaxy. Many aspects concerning the chemical composition, the energy spectrum, the anisotropy as well as the energetic requirements rule out and made unacceptable the extragalactic origin of all cosmic rays, favoring, instead, the galactic model. An exhaustive account is given in [22] and Sec. 20 of [23]. According to the hypothesis first suggested by Baade and Zwicky [24] the sources of the bulk of cosmic rays are the supernova (SN) explosions. The strongest arguments in favor of this assumption come from the energetics characterizing the SN explosions and from the models of stochastic acceleration by shock waves in SN being able to reproduce the cosmic ray power-law energy spectrum (see next Sections). However, the energy range above
$ 10^{18} $ eV is likely dominated by extragalactic cosmic rays because of the limit of the maximum energy achievable in SN explosions, and because the Galactic magnetic field cannot confine particles of very high energy. The anisotropy of the highest energy cosmic rays also call for their extragalactic origin (see Sec. I.J). -
The large scale magnetic field of the Galaxy is measured in several ways. The evidence comes from the Zeeman splitting of the 21 cm line of neutral hydrogen and of molecular radio lines, from the polarization of the radio emission and of the light of nearby stars, and from the Faraday rotation of linearly polarized radio signals. All estimates of the magnetic field strength lie in the range 1-10 μG, and a typical value of 3 μG is usually assumed. The gyro-radius of a particle of rigidity R in a field of strength B, assuming its velocity orthogonal to B, is r = 1.1 × 10⁻⁶R(GV)/B(µG) pc. For protons of
$ 10^{15} $ eV, this gives r ≈ 0.37 pc to be compared with the galactic radius of about 15 kpc and a galactic thickness 2h ≈ 400 pc at the radius of Earth (8.5 kpc). The gyro-radius of a proton of$ 10^{18} $ eV is about 370 pc, comparable to the galactic thickness. One can conclude that particles up to$ 10^{15} $ eV are well confined within the Galaxy. At higher energies, cosmic rays start to escape more freely from the Galaxy, providing a possible explanation of the steepening of the spectrum at$ 10^{15} $ eV.The steepening would then happen at different energies for each element since the gyro-radius depends on the charge Z of the particle. The primary information on the propagation of cosmic rays in the galactic volume comes from the presence of secondary elements more abundant in the cosmic radiation than in solar system material and substantially absent as end products of stellar nucleosynthesis. These secondary elements are produced by fragmentation of primary cosmic rays, such as carbon and oxygen (to Li, Be, B) and iron (to Sc, Ti, Cr, Mn), in the interstellar medium. From the ratio of secondaries to primaries, decreasing as energy increases (Fig. 2), the mean amount of matter traversed is determined to be of the order of 2-10 g·cm−2. With a nominal density in the disk of one proton per cm3, the distance travelled up to the Earth is about 500-2000 kpc, far greater than the galactic dimensions. This implies that cosmic ray confinement is a diffusive process in which the particles follow a very tortuous path before escaping into the extragalactic space. Typical residence times are then in the range
$ 10^6-10^7 $ years. High energy cosmic rays diffuse out of the Galaxy faster. However, even cosmic rays with energy$ \ge 10^{15} $ eV do not stream freely away from the galactic disk as proved by their low anisotropy ($ \approx 10^{-3} $ ), and an estimate of the residence time of the order of$ 10^5 $ years, or less, looks more appropriate. Escape times of the order of$ 10^7 $ years are also found for GeV CRs from the study of the abundances of radioactive isotopes produced in the spallation reactions, as for instance 10Be that undergoes β-decay into 10B with a characteristic lifetime τ = 3.9$ \times 10^6 $ y [26].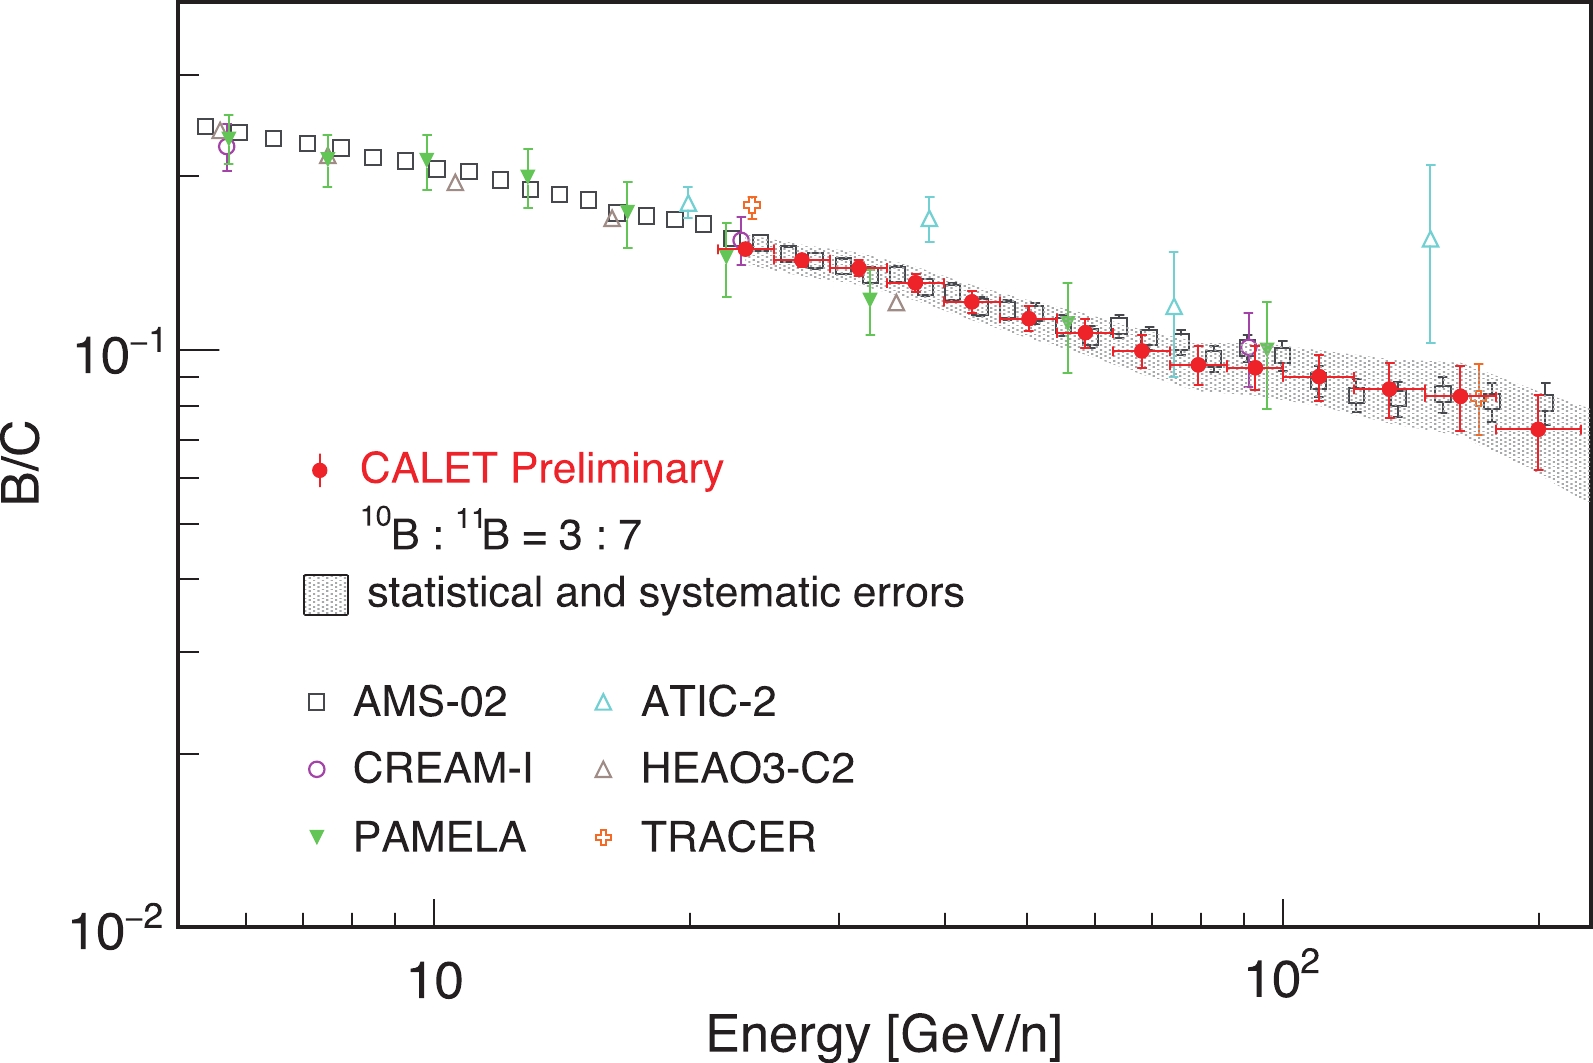
Figure 2. (color online) Preliminary result of boron-to-carbon flux ratio with CALET compared with previous observations [25].
In summary, in the current propagation models, the Galaxy is assumed to be a ‘leaky box’ in which cosmic rays diffuse staying confined for a long time and undergoing, before escaping, frequent scatterings either with random magnetic irregularities or with waves excited by the high energy particles themselves. A high isotropy ensues. The residence time decreases with the energy so that higher energy cosmic rays
$ \ge10^{15} $ eV escape quicker and have less time to produce the lower energy secondaries. They are less confined in the galactic volume and this effect as well as the limit of the acceleration process via shock waves (see next Sections) are usually invoked to explain the steepening of the spectrum above$ 10^{15} $ eV (see Sec. 6 of [27]). -
Cosmic rays constitute a remarkable component of the galactic inventory accounting for an important energetic and dynamical factor. Their energy density (≈ 1 eV/cm−3) is comparable to the magnetic energy density (≈0.25 eV/cm−3), to the energy density of the interstellar gas (≈ 1 eV/cm−3) and is also of the same order of magnitude as the energy density of the relic thermal radiation (≈0.26 eV/cm−3). Such a situation must be expected in quasi-stationary conditions and implies that cosmic rays play an essential role in the dynamics of the Galaxy. The cosmic ray luminosity at Earth, about
$ 3\times10^{40} $ erg/s, is second only to the galactic luminosity of the optical radiation. It is generally accepted from simple energetic considerations that among the galactic sources the supernova remnants (SNRs) are the main source of cosmic rays since they may provide the total energy budget of cosmic ray in the Galaxy. Due to the falling off energy spectrum, the power required to sustain the high energy cosmic rays is considerably less, about$ 5\times 10^{37} $ erg/s for above$ 10^{16} $ eV cosmic rays. The mechanical energy input to the Galaxy from each SN is about$ 10^{51} $ erg so that with a rate of about one explosion every 30 years the total mechanical power input from SNs is of the order of$ 10^{42} $ erg/s [28]. Thus SNs have enough power to drive the galactic cosmic ray acceleration if there is a mechanism for channeling about 10% of the mechanical energy into relativistic particles. An appropriate acceleration mechanism, the diffusive shock acceleration process (DSA), has been known since 1977 [29].The diffusive acceleration process at supernovae blast waves driven by expanding SNRs can provide the spectral power-law shape of cosmic rays. In this picture, a supersonic flow, as due to the ejecta from a supernova explosion or a pulsar wind moving at speeds of about
$ 10^4 $ km/s, terminates in a shock balancing the pressure of the ambient medium. High energy particles scattered off turbulent magnetic fields on both sides of the shock may diffusively cross the shock front many times gaining each cycle an average energy$ \delta E/E\approx\beta(4/3) $ , where β is the velocity of the plasma flow. A small fraction of these particles are advected downstream of the shock and may escape in the downstream flow acquiring a power-law spectrum with a spectral index mainly dependent on the ratio of the upstream and downstream gas velocity in the shock reference. This model naturally produces a power-law spectrum$ {\rm d}N/{\rm d}E\approx E^{-2.0} $ at source ($ {\rm d}N/{\rm d}E\approx E^{-2.3} $ in highly relativistic shocks), consistent with the locally observed cosmic ray spectrum$ {\rm d}N/{\rm d}E\approx E^{-2.7} $ after correcting for the propagation effects. Indeed, in the conventional models the large-scale propagation in the Galaxy is governed by the diffusion. The spectrum becomes steeper of a quantity ≈ 0.3-0.6, the diffusion index, as it results from the spectra of the secondary cosmic rays produced by spallation of heavier primaries with the interstellar matter, and from the secondary-to-primary ratios, in particular the ratios Boron/Carbon (Fig. 2) and 10Be/9Be.The maximum attainable energy depends on the time the particle remains in the acceleration region before escaping. This is related to the size of the region and on the strength and structure of the magnetic field. The first estimate of the maximum energy is due to Lagage and Cesarsky [30]. Assuming that the shock remains strong enough for about 1000 y and a typical interstellar magnetic field of a few micro-Gauss, the acceleration rates give a maximum cosmic ray energy of roughly
$ Z\cdot 10^{14} $ eV, ignoring any energy loss mechanism. In this simplified derivation the accelerated particles do not affect the conditions in the acceleration region. However, there are strong theoretical and observational reasons that argue for a significant amplification of the magnetic field as a result of the pressure gradient of the accelerating CRs, triggering instabilities in the precursor of the SNR shock. The most important consequence of magnetic field amplification in SNRs is the substantial increase of the maximal energy of CRs accelerated by SN shocks, which presumably provides the formation of Galactic CR (GCR) spectrum inside SNRs up to the energy$ 10^{17} $ eV. It is also discussed possibilities of formation GCR spectrum up to significantly higher energies$ \; 3\times10^{18} $ eV due to reacceleration of CRs generated in SNRs [31, 32], or due to contribution of more powerful type IIb supernovae [33]. The theory of particle acceleration by strong shock associated to SNRs is sufficiently well developed. Important theoretical progresses have been achieved with the development of the kinetic nonlinear theory of diffusive shock acceleration (for reviews see Refs. [34-37]). The current theoretical framework, consistently including the most relevant physical factors, allows to make quantitative predictions of the expected properties of cosmic rays accelerated in SNRs.In Fig. 3, the calculated cosmic ray intensities of different species accelerated in SNRs are shown together with experimental data. Two different possibilities of maximal energies are shown by thin and thick curves [38]. The SNR origin model of cosmic rays via DSA has received some support from the observation of radio emissions, X rays, and GeV-TeV gamma rays from putative sources belonging to different classes of objects, such as pulsar wind nebulae, supernova remnants, compact binary systems, clusters of massive stars, and the Galactic center. These observations give direct evidence of the acceleration of electrons to beyond
$ 10^{14} $ eV. However, the evidence that high energy cosmic rays have the same origin needs confirmation [39]. TeV gamma rays are tracer for high energy particles and can be used to search for PeV cosmic ray sources, the so-called PeVatrons. In the ‘hadronic scenario’ gamma rays come from the decay of neutral pions produced by the interaction of cosmic ray nuclei with the ambient matter or radiation. In the competing ‘leptonic scenario’ the inverse Compton scattering of ambient photons with energetic electrons may lead to the TeV gamma ray emission. Current data do not allow us to distinguish between the hadronic or leptonic origin of high energy TeV gamma rays [40]. Since the inverse Compton scattering at high energies is strongly suppressed by the Klein-Nishina effect, the observation of a gamma ray power-law spectrum extending with no break up to the 100 TeV and beyond would be a good proof of the hadronic nature of the interaction.
Figure 3. (color online) Differential intensity
$J_k$ of different species of cosmic rays as a function of the kinetic energy$\epsilon_k$ . Experimental data obtained in the CAPRICE [41], BESS [42], ATIC-2 [43], CREAM [44], JACEE [45] and KASCADE [46] experiments are shown. Thin and thick curves refer to two different models of cosmic-ray acceleration in SNRs discussed in [45].Unfortunately, current γ-ray observations show that SNRs with hard GeV spectra always have evident spectral softening in the TeV band with a potential cutoff near ~ 10 TeV. For SNRs with soft γ-ray spectra, no emission beyond 100 TeV has been detected either [39, 40]. Fig. 4 shows the multiwavelength spectra of a sample of 35 γ-ray SNRs and their distribution in the Galaxy. The only source with emission close to 100 TeV, W30, is actually associated with a pulsar wind nebula. All other sources do not have detectable fluxes above 50 TeV. Indeed, HAWC searched for TeV gamma ray emission from GeV detected SNRs. Among 9 sources with significant emission above 56 TeV, three SNRs that emit above 100 TeV have been observed. These 9 sources are close to ATNF radio-pulsars and exhibit a curved spectrum, implying a dominant leptonic origin of the emission. However, that does not immediately disqualify them from being PeVatrons [47, 48]. The half-completed LHAASO facility has reported twelve sources, including Crab Nebula, of > 100 TeV gamma rays [49]. Data collected for a livetime of 308.33 days evidence a gradual spectral steepening with energy up to 500 TeV. Apart from Crab, all sources exhibit an extended morphology up to one degree. The energy of the most energetic photon from an extended source positionally overlapping with the Cygnus Cocoon is about 1.4 PeV.
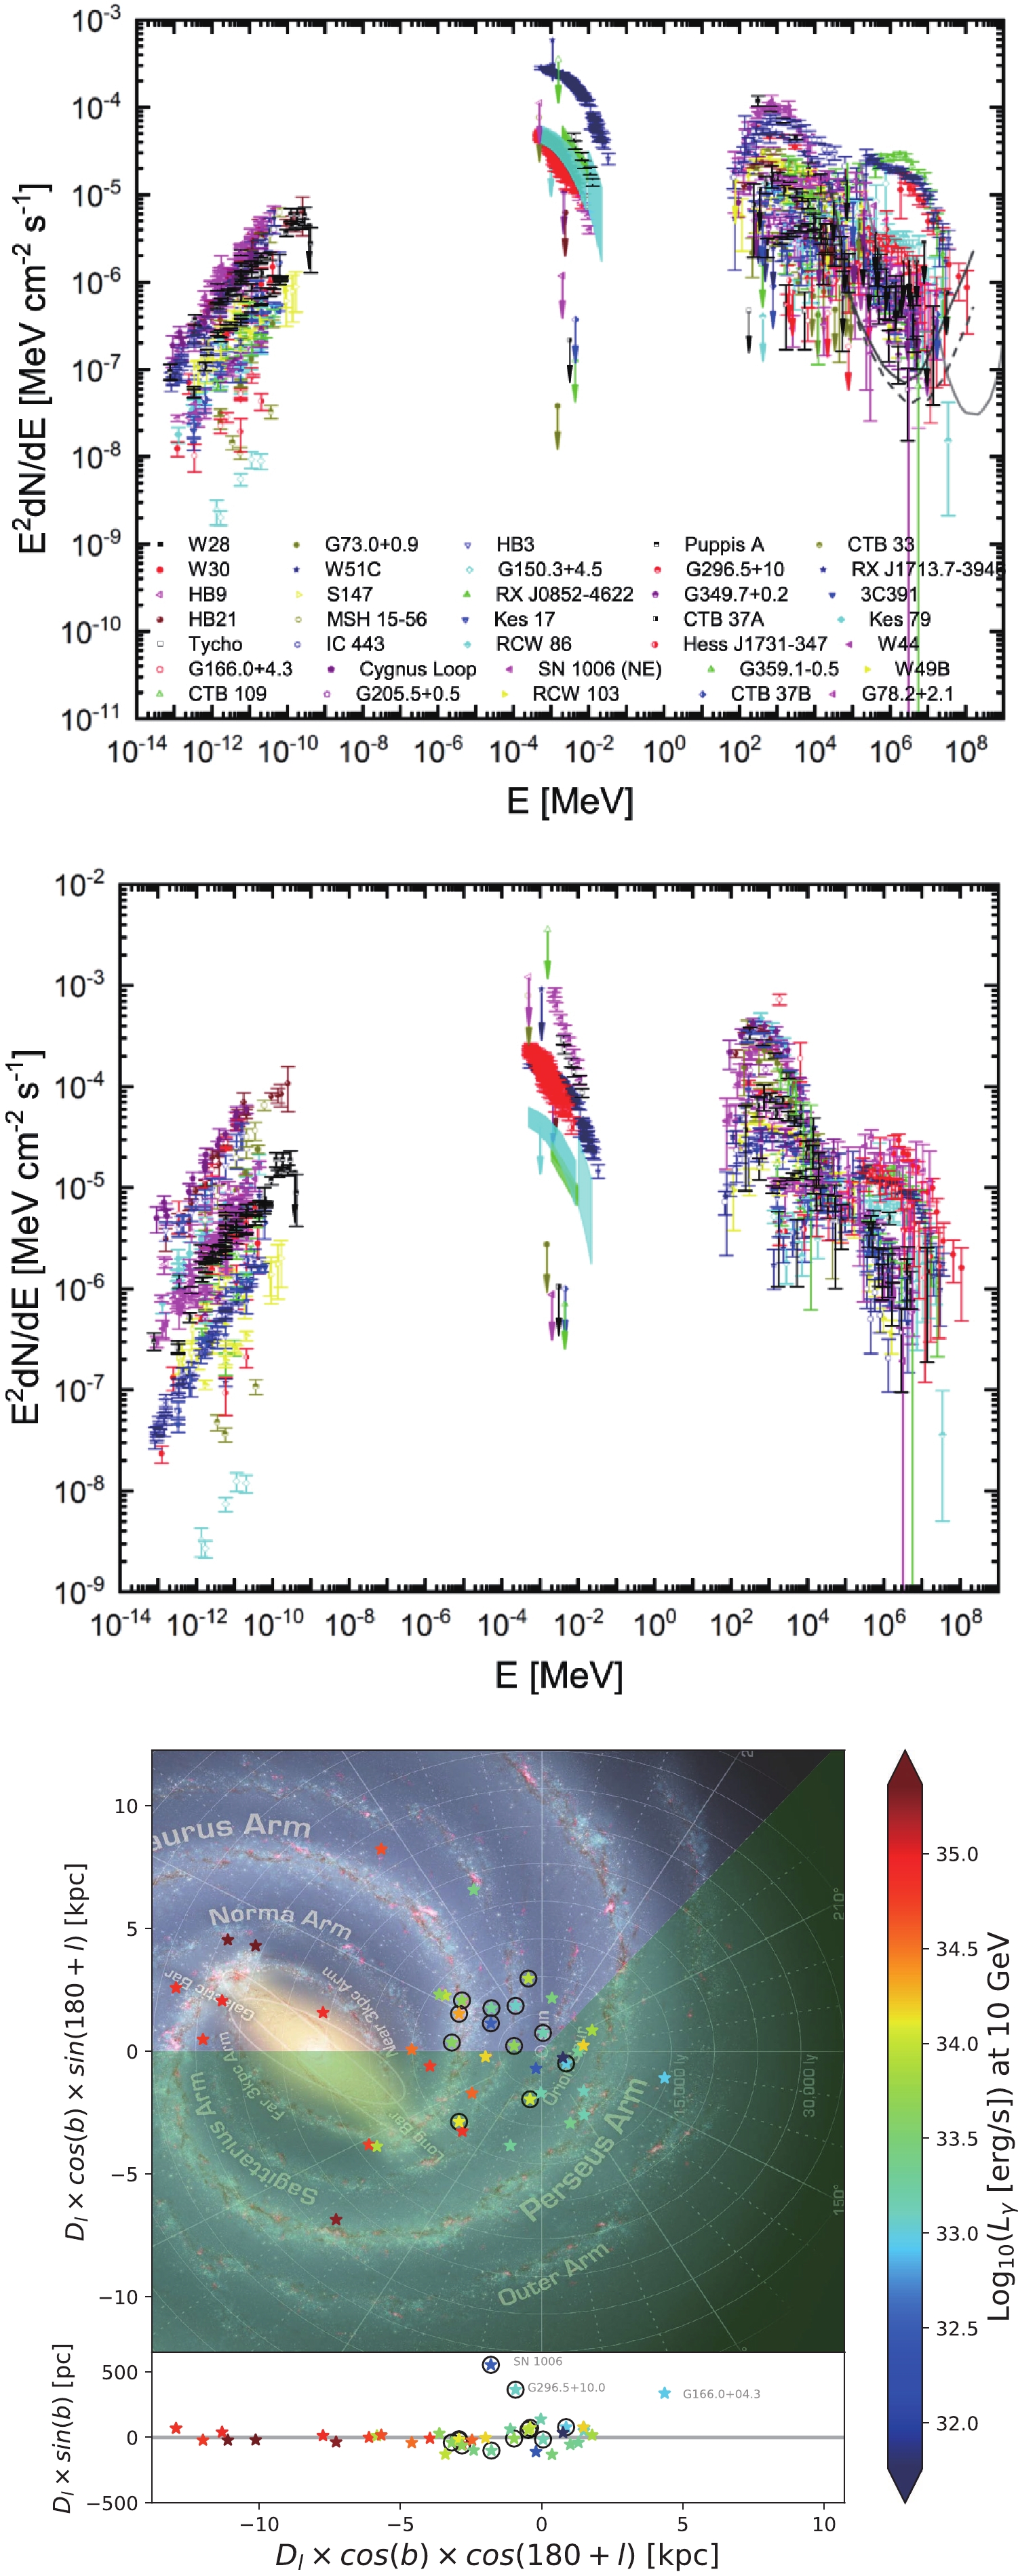
Figure 4. (color online) The upper panel shows the multiwavelength spectral data of 35 SNRs. The middle panel shows the spectra normalized at 100 GeV. Lower panel distribution of γ-ray SNRs in the Galaxy. The color indicates the luminosity at 10 GeV. Sources with hard GeV spectra are shown with open black circles [39]. The light green color indicates the region covered by molecular survey observations of the Delingha millimeter telescope.
Much larger photon statistics will allow detailed studies of the spectral and morphological features of these sources needed to assess the origin, leptonic or hadronic, of the detected radiation. The Crab Nebula spectrum measured by LHAASO [50] is shown in Fig. 5. It extends up to the PeV range including one event of
$ \simeq \;1.1$ PeV energy. The spectrum shows a gradual steepening over three energy decades that can be explained by a combination of synchrotron radiation and inverse Compton scattering of relativistic electrons, accelerated at the termination shock of the pulsar wind, interacting with the ambient magnetic and radiation fields, respectively. A contribution of PeV protons to the production of the highest-energy gamma rays cannot be excluded. Gamma ray emission extending up to 50 TeV with no evidence of a cutoff has been observed by HESS from a small region surrounding the Galactic center [51]. However, the black hole Sgr A* at the Galactic center cannot be a viable alternative to SNRs as source of PeV galactic cosmic rays since at present it does not have a high enough rate of particle acceleration to substantially contribute to the population of Galactic cosmic rays [52]. Accordingly, one would expect that a few PeVatrons are currently at work in the Galaxy.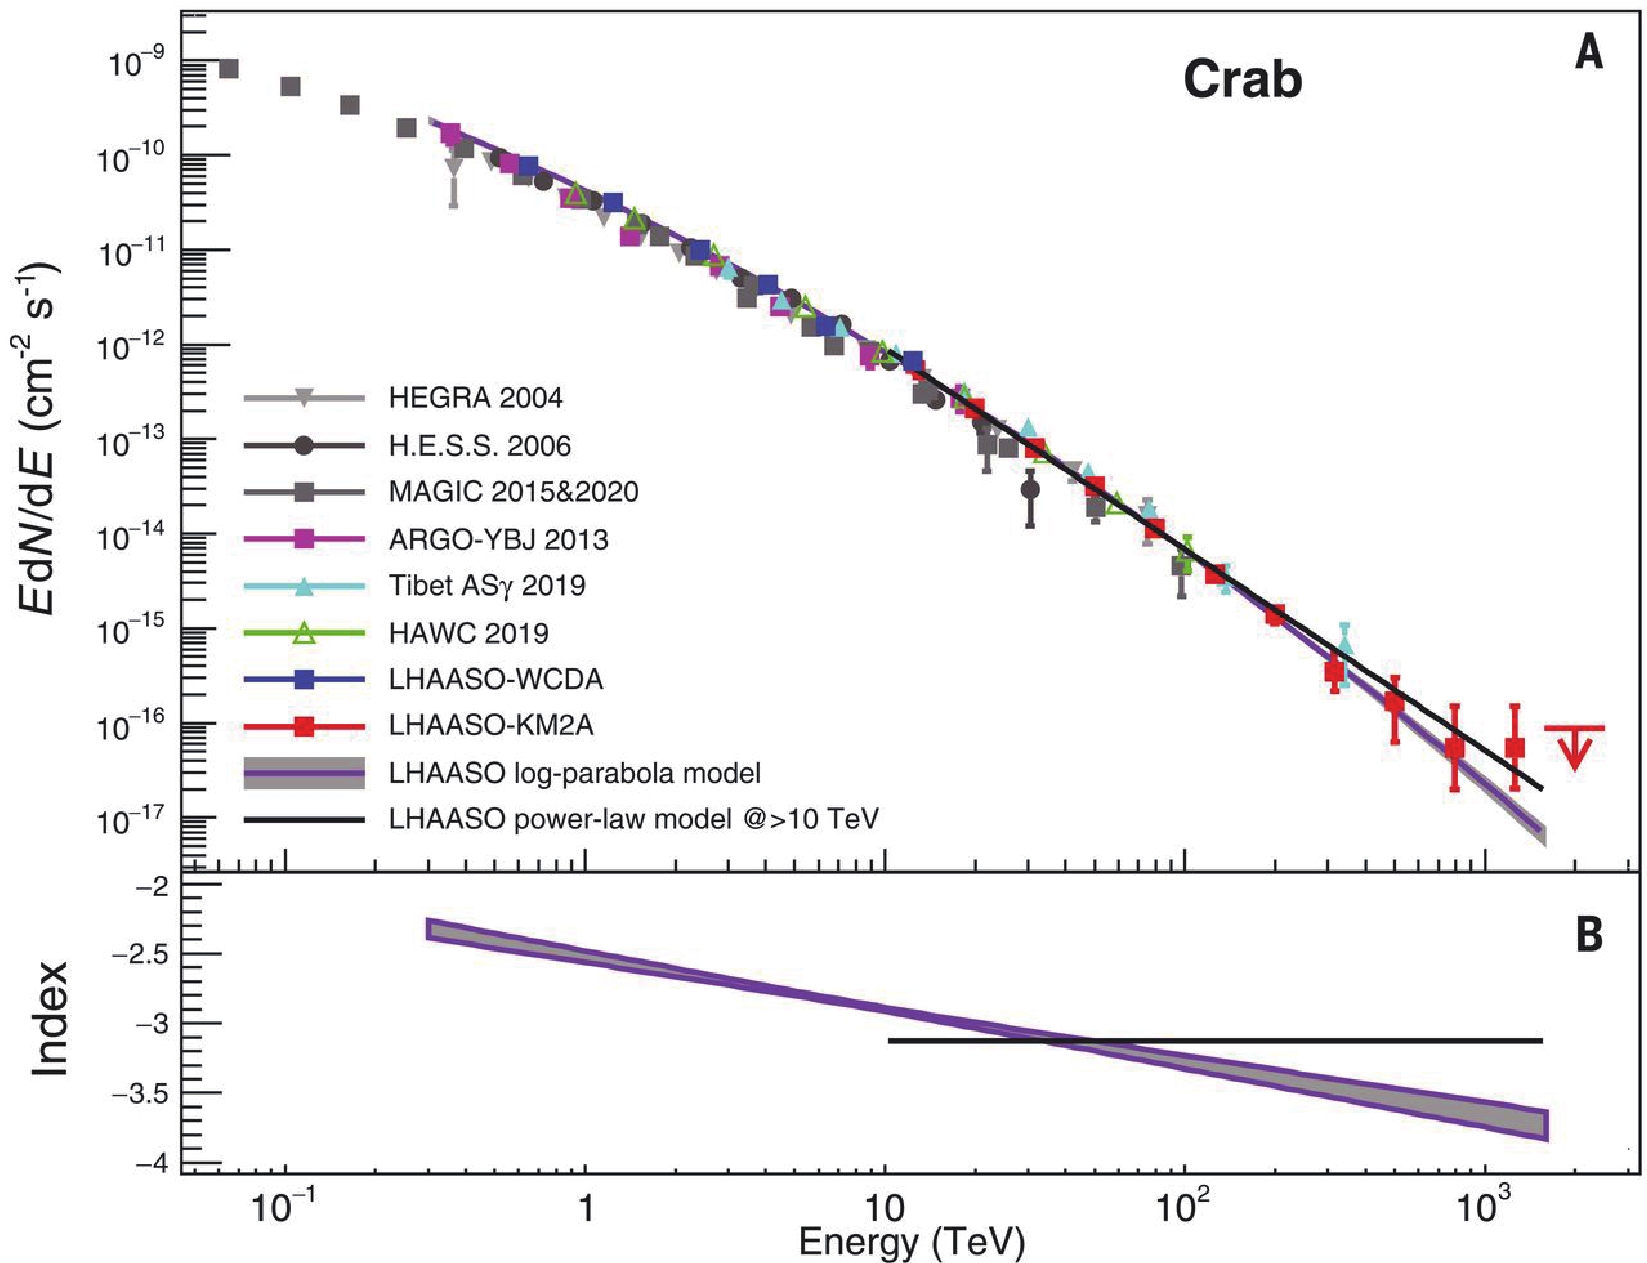
Figure 5. (color online) The gamma-ray flux of the Crab measured by LHAASO (top) and the energy-dependent local power law index derived by the log-parabola model fitting as indicated by the purple band (bottom). See [50] for details.
In conclusion, even if the experimental findings are not conclusive, there is a general consensus that SNRs, as well as pulsars, clusters of massive stars, and the black hole at the Galactic center or, more in general, all the high-energy systems, end-points of the stellar evolution, are able to generate the cosmic power-law spectrum and to account for the total amount of cosmic-ray energy contained in the Galaxy, at least up to
$ 10^{17} $ eV. Galactic sources are believed to run out of power at$ 10^{17}-10^{18} $ eV, where the transition from galactic to extra-galactic component should take place. Higher energies beyond$ 10^{17} $ eV are essentially reachable by extra-galactic phenomena. The need of confining the particles in the accelerator region for long times provides a basic geometric criterion, due to Hillas [53], useful in selecting potential accelerator sites. This is a simple dimensional argument which makes it possible to identify objects that are able to accelerate particles up to a given energy. By demanding that the Larmor radius of the particle,$ r = E/ZB $ , does not exceed the size of the acceleration region, we obtain a limit to the maximum attainable energy$ E_{\max} = \beta ZBL $ where L the size of the acceleration region, and β the speed of the magnetic scattering centers. A simplified version of the Hillas plot, not accounting for energy losses [54], is given in Fig. 6, showing, for a given maximum energy, the relation between the source magnetic field strength B and its size.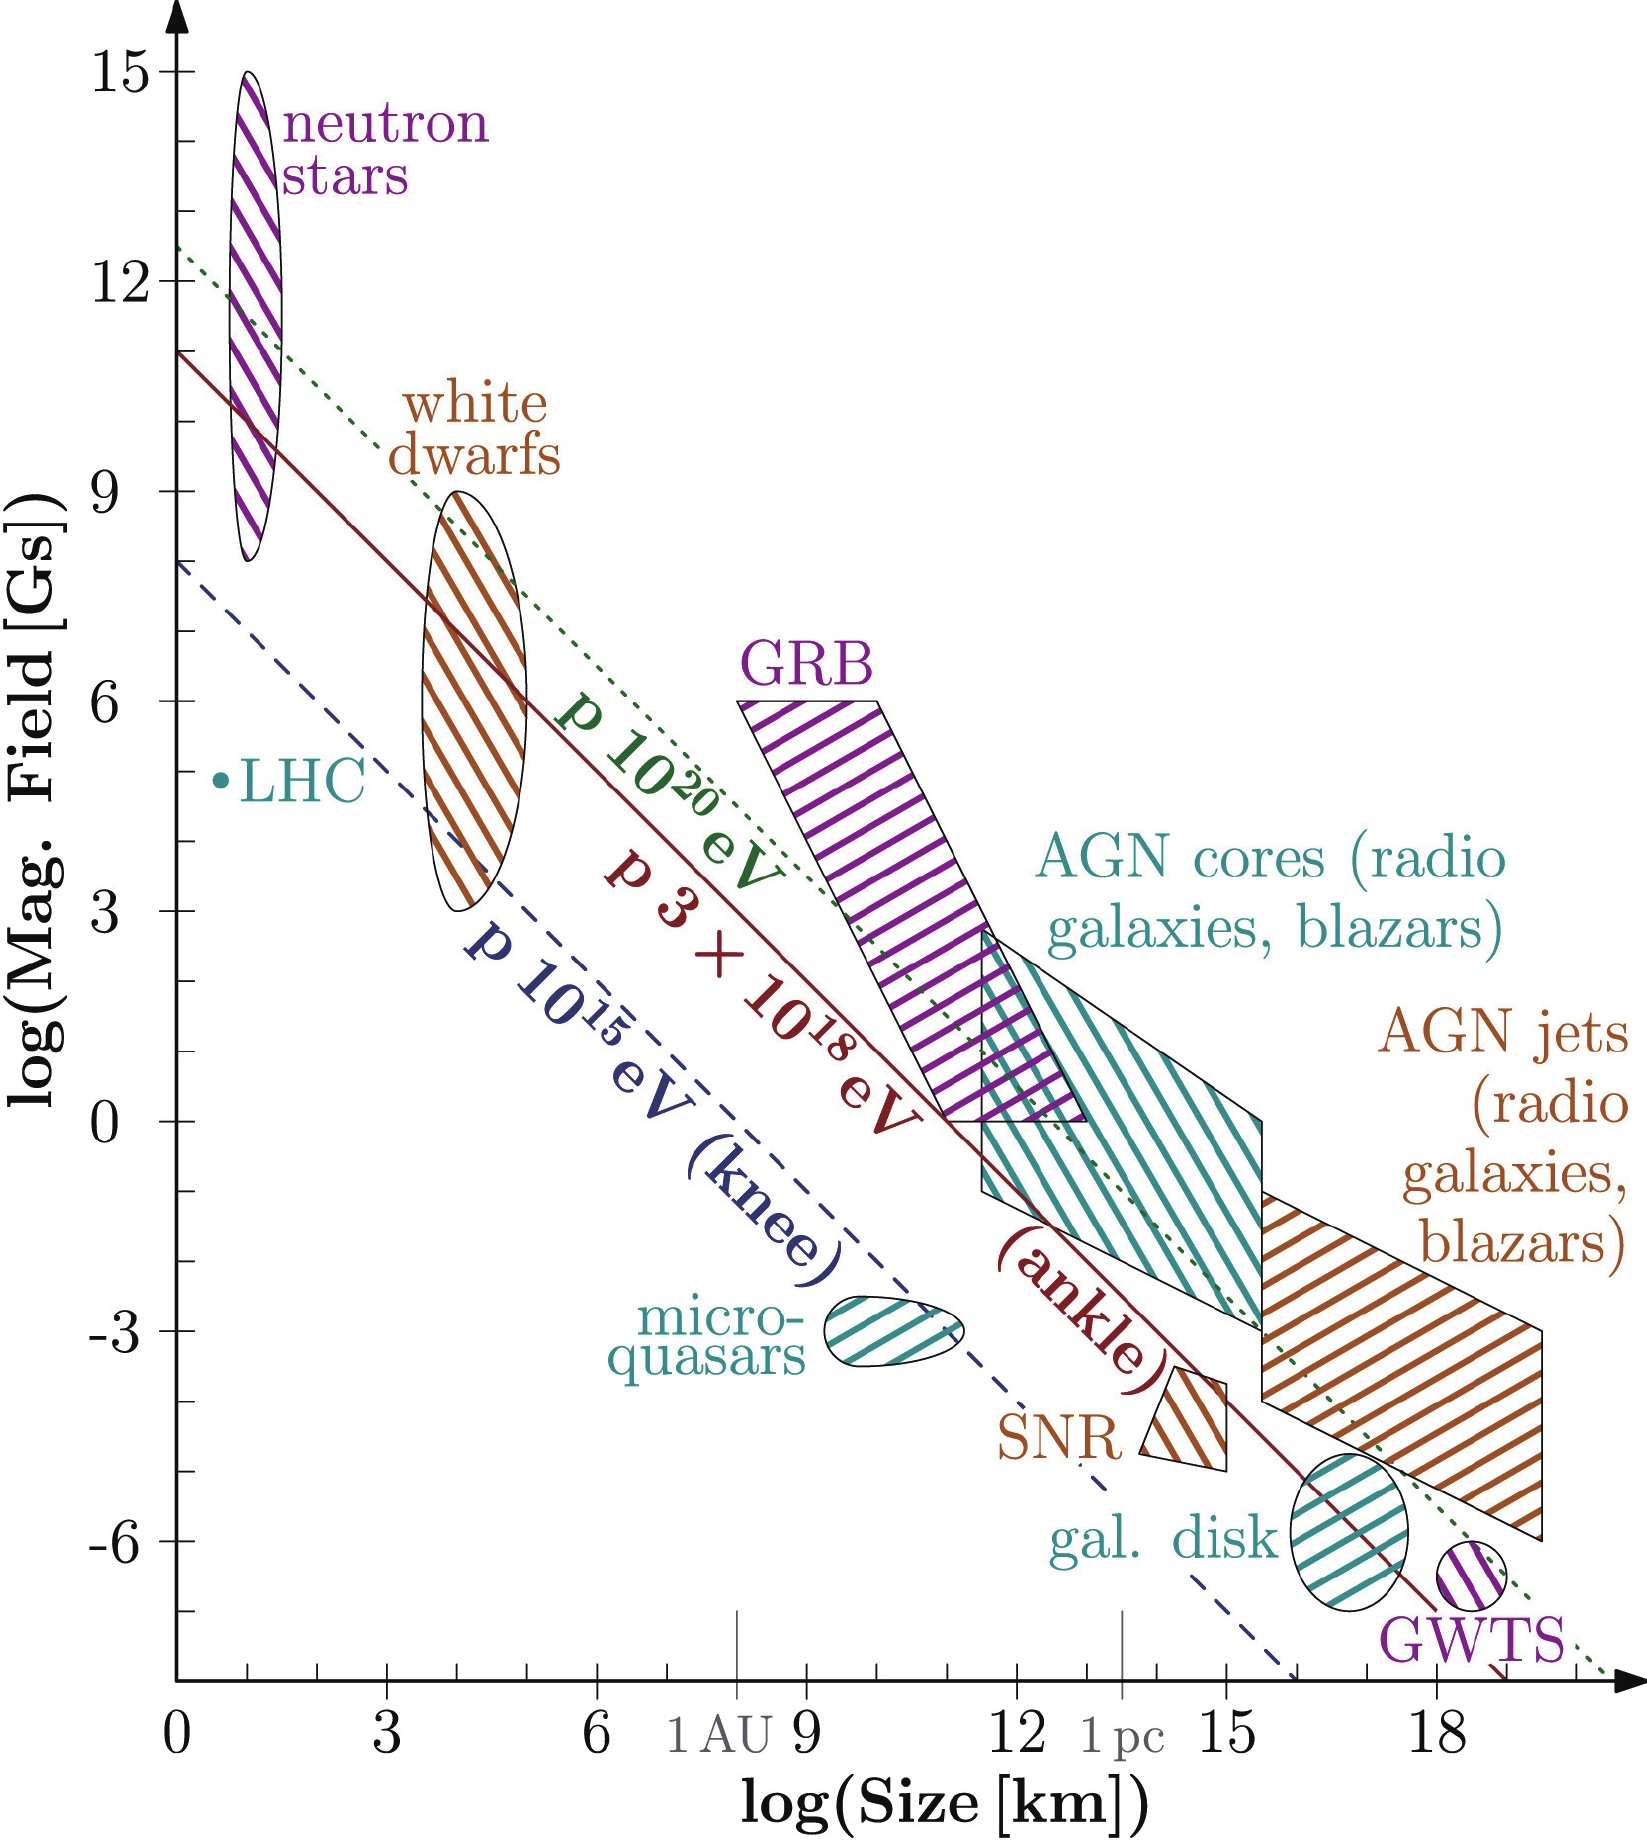
Figure 6. (color online) The classical Hillas plot. The knee (1015 eV), ankle (3×10¹⁸ eV) and maximum energy (1020 eV) lines are shown (blue dashed, red solid and green dotted, respectively). See [55] for details. (Reprinted with permission from Elsevier)
As shown in this plot, the most luminous types of candidate sources are the Active Galactic Nuclei (AGNs) and Gamma Ray Bursts (GRBs). In many AGNs, as for instance the Fanaroff-Riley class II (FR-II) radio galaxies hosting supermassive black holes at the core, high-energy jets of radiation and relativistic material emerge along the disk’s axis, with scales of pc to kpc. Shock waves propagating along these jets with Lorentz boost factors of
$ \Gamma = 10-30 $ may be the sources of the highest energy cosmic rays [56]. GRBs, believed to occur when two neutron stars (black holes) merge or a massive star collapses into a black hole, may also provide the requisite environment for acceleration to ultrahigh energies. These events would be accompanied by jet formation where shock with speeds very close to c can occur and energies up to$ 10^{21} $ eV can be reached [57]. Other suggested extragalatic CR sources are the shock associated with colliding galaxies or starburst galaxies. The observed luminosity of all these systems may deliver the required flux of ultrahigh energy cosmic rays.To be thorough, we mention the ‘top-down’ scenarios in which the cosmic rays are not accelerated, but are the result of the decay of supermassive ‘X’ particles that have been trapped in topological defects since the time of the early Universe [58]. Nevertheless, in all conceivable top-down theories photons and neutrinos should dominate at the end of the hadronic cascade, a scenario not supported by observations.
-
Protons make up about 90% of all cosmic-ray components while helium nuclei amount to nearly 10% and all other nuclei comprise only about 1% of the total flux. Traditionally, the term ‘cosmic rays’ refers solely to the fast charged nuclei of cosmic origin. Other charged particles in the cosmic radiations are electrons, positrons and antiprotons with far lower fluxes (see Fig. 1). The abundance of nuclei in cosmic rays reflects their concentration in outer space. Indeed, the chemical composition of cosmic rays exhibits remarkable similarities to the solar system abundances. The main difference is the presence of two groups of elements, (Li, Be, B) and (Sc, Ti, V, Cr, Mn), more abundant in the cosmic radiation than in the solar system material as shown in Fig. 7.

Figure 7. Solar System (SS) and galactic cosmic rays relative abundances at 2 GeV/nuc normalized to 14Si = 1 [59].
These elements are absent as end-products of stellar nucleosynthesis and are present in the cosmic radiation as spallation products of Carbon and Oxygen and Iron nuclei, respectively. The differences can be accounted for by the collision of cosmic rays with the interstellar gas during their propagation from sources to Earth. These secondary nuclei have energy spectra steeper than the primary nuclei. At energies above a few TeV, cosmic rays are conventionally grouped into five groups: protons, helium nuclei, M(medium: Z = 6-9), H(heavy: Z = 10-20), VH(very heavy: Z = 21-30). Another classification often used in the literature, and mainly referred to the data analysis, subdivides cosmic rays in ‘light’ (protons plus helium nuclei) and ‘heavy’ (all other nuclei) or in three mass groups (‘light’, ‘medium‘, ‘heavy’).
Cosmic rays of energies up to about 100 TeV can be studied with telescopes on board of balloons, satellites or installed on the International Space Station (ISS). These devices achieve a reliable charge identification and a high resolution measurement of the primary energy on an event-by-event basis. Energy spectra for individual elements can be obtained, often displayed versus the energy per nucleon. At higher energies the primary radiation is studied with experiments detecting the secondary particles generated in extensive air showers (EAS). These experiments have limited sensitivity to identify the charge of the primaries, and the total flux as a function of the particle energy, the so-called all-particle spectrum, are typically displayed. As shown in Fig. 1, the all-particle spectrum follows a power-law with a spectral index of about -2.7 up to about 3×
$ 10^{15} $ eV, where a break of the spectral index is observed (‘knee’). Above this knee the spectrum becomes steeper with an index of -3.0 up to the ‘ankle’ around 5×$ 10^{18} $ eV where the spectrum becomes flatter again for about one energy decade. Above 4×$ 10^{19} $ eV the spectrum appears to fall-off.Direct measurements with satellites, balloon-based detectors or detectors installed on the ISS (AMS [4], ISS-CALET [60], ISS-CREAM [61]) have provided excellent description of the evolution of each cosmic ray component up to 100 TeV, as shown in Fig. 8. These detectors consist of tracking planes and devices to measure the charge of the incoming particles. The energy measurement is accomplished with magnetic spectrometers at lower energies and calorimeters at higher energies. The measurement of the proton spectrum from GeV to TeV energies is one of the main target of these observations. Some spectral features have been observed, as shown in Fig. 9. A break in the spectrum is evident near 500 GV followed by a spectral hardening. There is also strong evidence of a softening above ~10 TV. Data from ATIC [43], CREAM [62], and JACEE [45] demonstrate a decrease of the proton-helium flux ratio at TeV energies (Fig. 10). CREAM [1, 62], DAMPE [11], and HAWC [63] report a hardening of the helium energy spectrum near 500 GV, surpassing the proton spectrum at approximately 10 TeV, a trend confirmed by the space-based observations of ISS-CALET [64]. Possible explanations to these spectral features include different source populations, nearby proton-rich source up to TeV energies or proton-poor sources in the TeV range and anomalous diffusion [65, 66].

Figure 8. (color online) Fluxes of nuclei of the primary cosmic radiation in particles per energy-per-nucleus plotted vs energy-per-nucleus. The inset shows the H/He ratio as a function of rigidity [67].
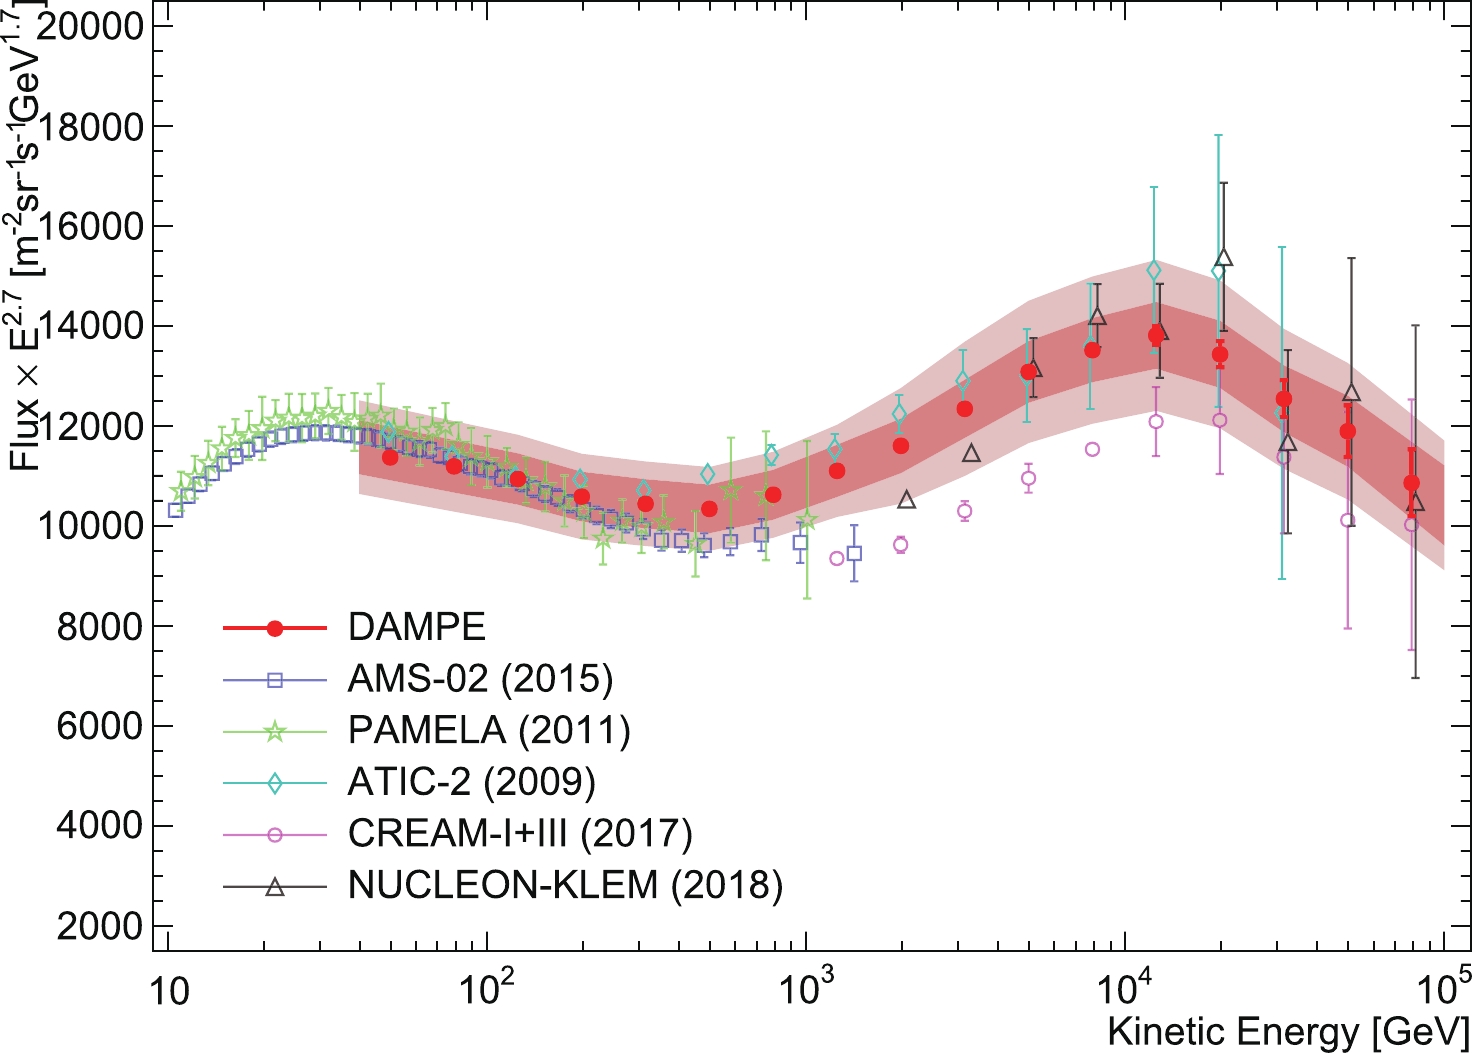
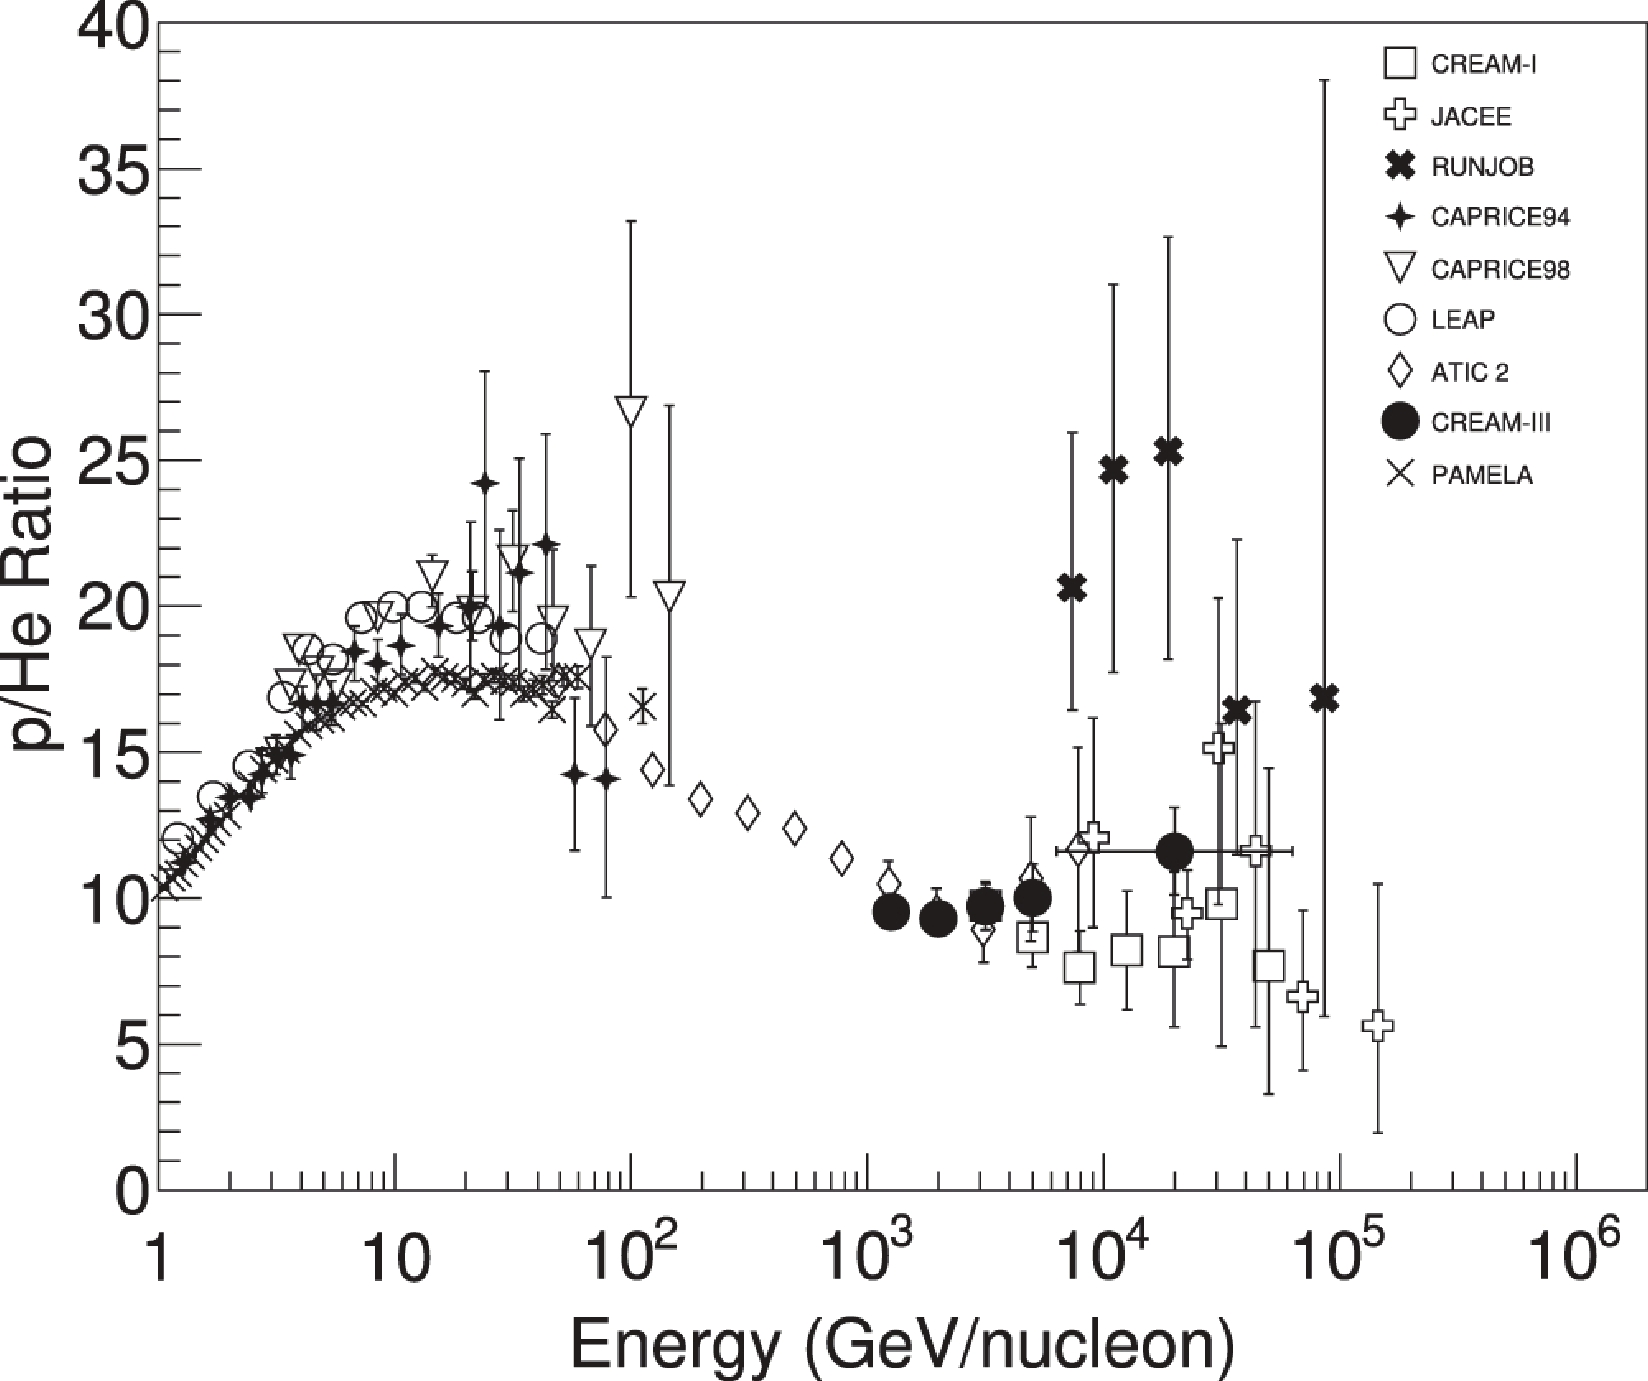
Figure 10. Proton to Helium ratio in cosmic rays as measured by different experiments [62]. (Reprinted with permission from AAS)
In the energy region >10 TeV, air shower arrays operating at high altitude, such as Tibet AS [68], ARGO-YBJ [69] and HAWC [63], can efficiently separate the light component providing an useful complement to the direct measurements affected, due to their limited detector exposure, by large statistical uncertainties. A comparison of direct and indirect measurements shows a reasonable agreement for the light component up to 100 TeV and beyond within estimated systematic and statistical uncertainties (
$ \simeq 30 $ %, Fig. 11).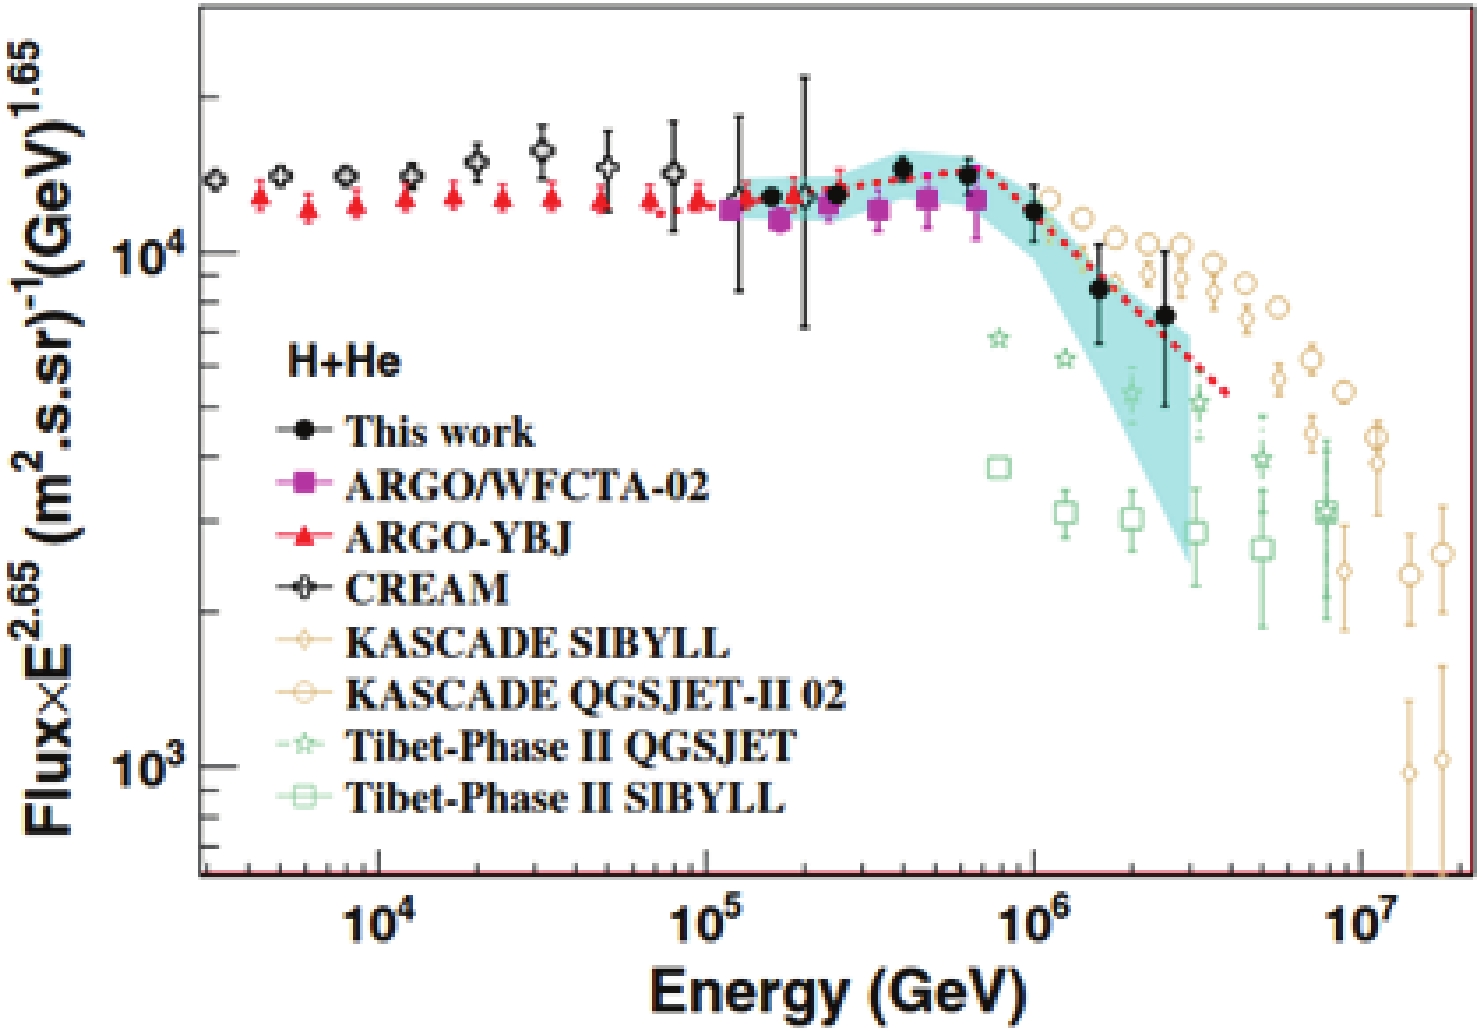
Figure 11. (color online) Energy spectrum of the cosmic-ray light component (p+He) measured by different experiments. See [69] for details. (Reprinted with permission from the American Physical Society)
The higher energies above 100 TeV are the domain of indirect methods exploiting the observation of secondary particles in the extensive air showers (EAS) produced by the primary cosmic rays colliding with air nuclei of Earth’s atmosphere. Last generation experiments operating up to
$ 10^{16} - 10^{17} $ eV, and measuring different EAS components with good resolution (mainly the electron number$ N_e $ and the muon number Nμ, or Cherenkov light as in TUNKA [70] and BASJE [71] experiments), have reached the sensitivity to separate into two mass groups (light and heavy) with an analysis technique not critically depending on EAS simulations, or in more mass groups using unfolding techniques heavily based on EAS simulations. Studies at the highest energies by detecting ultra-high-energy cosmic rays (UHECRs) were carried out by many pioneering experiments (Volcano Ranch, Haverah Park, AGASA, Fly’s Eyes, HiRes, see [72] for a short summary). Fly’s Eyes and HiRes explored the observation of the ultraviolet light produced by the nitrogen fluorescence, fully demonstrating the extraordinary potential of this technique. Two giant observatories (Auger in the Southern hemisphere and Telescope Array (TA) in the Northern hemisphere) are steadily observing the ultra-high energy cosmic rays whose origin and nature represent one of the most intriguing mystery of astrophysics. Both detectors combine two techniques with surface arrays of particle detectors overlooked by large field-of-view telescopes allowing for the reconstruction of the shower development in the atmosphere by imaging the ultraviolet fluorescence light produced from atmospheric nitrogen molecules excited by the EAS particles. The shower size, measured for both electrons and muons, and the distribution of the shower maximum in the atmosphere are combined to measure energy and mass composition.In Fig. 12, where the fluxes are multiplied by
$ E^{2.7} $ , it is shown the cosmic ray all-particle spectrum versus the energy-per-nucleus above 10 TeV, as obtained by air shower experiments. Features as the knee and the ankle are well evident. A less evident feature around$ 10^{17} $ eV, the so-called second knee, is also visible.
Figure 12. (color online) Energy spectrum of high-energy cosmic rays obtained from air shower measurements. For details see [73].
-
The origins of these spectral changes are still uncertain. Many astrophysical models assume a dependence of such features on the charge Z of the primary nuclei, mainly related to the end of the acceleration mechanism or escape from the Galaxy volume. These models produce rigidity-dependent break-offs. Other mechanisms associate with new physics processes, e.g. the cannonball model of [74], may generate atomic number A-dependent knees.
Unfortunately, still large uncertainties affect the composition measurements preventing any conclusive assessment. According to the KASCADE measurements the knee at
$ 3\times 10^{15} $ eV is due to the steepening of the light primary masses, implying an increase of the contribution of the heavy component up to about$ 8\times 10^{16} $ eV, where a knee-like break has been observed by KASCADE-Grande, caused by a steepening in the spectrum of this heavy component. This is the energy where the charge-dependent knee of the iron is expected, if the knee at 3 PeV is due to a decrease of the primary proton flux. However, a number of experiments, in particular those located at high altitude, seems to indicate that the bending of the light-nuclei component is well below the PeV and the knee of the all-particle spectrum can be due to heavier nuclei.Observational results of the cosmic ray spectra up to
$ 10^{17} $ eV can be summarized as follows:● Some ground-based air shower arrays can extend their measurements into the energy range covered by direct experiments. The all-particle spectra in the range 10-500 TeV measured by ARGO-YBJ [75], GRAPES-3 [76], Tibet AS [17], and HAWC [77] exhibit a fair agreement within the statistical and systematic uncertainties;
● The proton + Helium spectra obtained by direct (CREAM) and indirect (ARGO-YBJ) measurements are in good agreement in the energy range covered by both experiments [69], showing the reliability of the hadronic interaction models used for the energy calibration of indirect experiments, at least until 200 TeV (Fig. 11);
● All EAS experiments detect a change of slope (known as "knee" of the primary "all-particle" spectrum at about 2-4 PeV. The "all-particle" spectrum above the knee cannot be described by a single power law (KASCADE- Grande [78], IceTop [79], TUNKA-133 [70], TALE [80]), showing a hardening around
$ 10^{16} $ eV and a steepening at around (8-9)$ \times 10^{16} $ eV;● The knee has been observed in the main EAS components at different atmospheric depths (i.e. observation height and zenith angle), including electromagnetic (EAS-TOP [81], KASCADE [82], TibetAS [68] among the others), muonic (EAS-TOP [83], KASCADE [82]), and hadronic (KASCADE [84]) components. The results obtained on every single component at different depths are in agreement with the EAS development models
● The experiments located at high altitude - EAS-TOP, CASA-MIA [85], ARGO-YBJ, Tibet-AS, and BASJE show evidence that the knee is due to primaries heavier than protons, or, more in general, than the light component. As a consequence, the composition already before the knee is expected rich of heavy nuclei;
● In addition to the knee-like features in the heavy primary spectrum at about
$ 8 \cdot 10^{16} $ eV, the KASCADE-Grande experiment claims a flattening of the light component (electron-rich sample) near$ 10^{17} $ eV [86].The results obtained by ground-based arrays are still conflicting with each other and the composition around the knee is being questioned. A key-point is the identification of the proton knee, at about 3 PeV as quoted by KASCADE experiment at sea level, or below 1 PeV according to the high altitude experiments. This crucial datum is the cornerstone of the interpretation of the spectral evolution at higher energies. The measurement of the helium/proton ratio, that looks increasing up to 100 TeV and beyond, brings into question the proton dominance of the spectrum. It is thus clear that a firm and precise determination of the proton knee is the key point to further improve our knowledge of the CR composition at
$ 10^{15} $ eV and beyond. The energy range between$ 10^{16} $ and$ 10^{18} $ eV, which encompasses the transition region from galactic to extragalactic components is of crucial importance to determine origin and propagation of cosmic rays. Open questions concern the mass composition, presence of sources other than SNRs, the onset of the extragalactic component. The KASCADE-Grande results provide a general picture of the evolution of the mass composition: from lighter mean mass at$ 10^{16} $ eV to a heavier mean mass at$ 10^{17} $ eV to lighter again at$ 10^{18} $ eV. This spectral behavior, observed also by other experiments, is likely suggesting the contribution of different components. For instance, in ref. [87] a three component model is proposed including contributions from ‘regular’ SN explosions, exploding Wolf-Rayet stars, and extragalactic sources.Different models have been proposed to explain the ankle, in terms of source characteristics or propagation effects. The ankle could reflect the transition between the galactic component at low energies towards a harder extragalactic component at higher energies. In this scenario extragalactic cosmic rays dominate only above
$ 10^{19} $ eV, and one needs some kind of process providing the extension of the galactic component beyond$ 10^{18} $ eV [88]. Possible solutions imply re-acceleration of the most energetic cosmic rays or cosmic rays due to massive stars exploding into their own wind (e.g. Wolf Rayet stars) or cosmic rays accelerated at a Galactic wind termination shock. In an alternative scenario the ankle is formed as a dip in the extra-galactic proton spectrum, dominating above$ 10^{18} $ eV, from the energy loss of the protons via$ e^+-e^- $ pair production in interactions with the CMB. The cosmic ray chemical composition is expected to be very different at energies from$ 10^{17} $ to$ 10^{19} $ eV in these two cases. It is also not clear whether the suppression of the energy spectrum above$ 4\cdot 10^{19} $ eV is due to the interaction of protons with the CMB via pion production (the Δ-resonance reaction$ p+\gamma\rightarrow \Delta^+ $ ), the so-called GZK cut-off, or to the photo-disintegration of heavy nuclei like the iron, or simply to the maximum energies achievable at the sources. The GZK cutoff could imply a nearby distribution of sources within 50-100 Mpc. In this case UHECRs are expected to propagate with less deflection by magnetic fields and their arrival directions should be correlated with the direction of powerful extragalactic sources. From the energy spectrum alone it is not possible to distinguish among these different scenarios whose assessment would be made easier by the measurement of the composition and anisotropy. The most recent results on the cosmic ray composition above$ 10^{17} $ eV come from the Auger experiment. Data point to a composition getting lighter up to about 2.1×$ 10^{18} $ eV, in agreement with the KASCADE-Grande findings, and going towards intermediate-heavy masses above, implying a non-negligible fraction of heavier elements at the highest energies [89]. -
All the features observed in the cosmic-ray spectra are naturally related to different types of sources, to acceleration mechanisms, propagation effects, and interactions ‘en route’ from sources to Earth. Generally, apart from some tension between the flux measured by Auger and Telescope Array above
$ 10^{19} $ eV, the measurements of the energy spectrum from different experiments are in agreement on the form of the major features in the spectrum when taking into account statistical, systematic, and energy scale uncertainties (see Fig. 12). From the spectral results alone, however, it is not possible to understand the causes for the observed features. Indeed, many underlying source, acceleration and propagation models, though to predict similar energy spectra, differ considerably in composition. To gain insight into this issue it is important to measure the composition by disentangling this degeneracy. The traditional approach, consisting in comparing data with the expected results according to different mass composition models (for instance: all-proton, all-iron, mixed ‘light’ plus ‘heavy’ as suggested by some theoretical model) may provide partial solutions but fails to give a firm and definitive answer to this question. Measuring the energy spectra of individual components is a challenging task. The mentioned goal could be achieved by selecting, on an event-by-event basis, the single elements or the main mass groups. It is a common believing that an efficient sampling of many shower components, as for instance electrons, muons, Cherenkov and/or fluorescence light and also hadrons and radio output, allowing the simultaneous reconstruction of the lateral and longitudinal shower distributions, could provide a reasonable identification of mass and energy of the primary inducing each observed events. The study of mass-sensitive parameters is carried out in Section II. Taking advantage of the high altitude site and of the hybrid detection approach by a large deployment of different kind of detectors, the LHAASO experiment is expected to be highly sensible to the individual cosmic ray components. -
The interpretation of shower data relies on the output of hadronic Monte Carlo models. High energy hadronic interaction models such as QGSJET or SYBILL are used, while the FLUKA or GHEISHA codes have been adopted to simulate low energy interactions. In recent years interaction models tuned to LHC data, such as EPOS-LHC, have been developed. Indeed, all LHC experiments feature detection capabilities with a wide phase-space coverage, in particular in the forward direction that drives the shower development. EPOS event generator is based on a combination of Gribov-Regge theory and perturbative-QCD, and can be used to simulate pp, pA, and AA collisions. The use of different models may introduce some residual uncertainty in addition to the experimental systematic and statistical uncertainties. These uncertainties are commonly quoted in summarizing the experimental results. Many results are derived, by unfolding analysis techniques, from the two-dimensional
$ N_e-N_\mu $ correlation. The electromagnetic component is less dependent on the choice of the hadronic interaction model, while the muon content is more affected. A test of the hadronic interaction models has been carried out by the Auger experiment by comparing the measurement of a number of air shower parameters to the predictions of Monte Carlo simulations [90]. None of the currently used interaction models provides a consistent description of air showers at energies above$ 10^{17} $ eV, in particular of the muon production profile. A muon deficit in simulations between 38% and 53% is found. A comprehensive study shows that all these models give reasonable description, within a few percent, of experimental data up to a few$ 10^{16} $ eV. At higher shower energies a growing muon deficit in simulations is observed in all models [91]. No clear explanation of this effect is given so far. -
The measurement of the anisotropy in the arrival direction distribution of cosmic rays is a complementary way to gather information on the origin and propagation of this radiation. Indeed, cosmic ray anisotropy is expected to reflect the source distribution and the structure of the galactic magnetic field. Furthermore, heliosphere and local magnetic fields may represent a significant source of perturbation for low energy particles. The gyro-radius of cosmic rays of
$ 10^4 $ GV rigidity (10 TeV protons) is about 0.0037 pc, comparable to the heliosphere width. The anisotropy study is thus an important tool to trace the potential sources and to probe the structure of the magnetic fields through which cosmic rays travel.In the last few decades, the anisotropy in the cosmic-ray (CR) arrival direction distribution has been observed from tens of GeV to tens of PeV by a number of experiments located in the northern and southern hemispheres, with an intensity of
$ 10^{-4}-10^{-3} $ with respect to the isotropic background. Before the late 1990s, the anisotropy was usually measured as a variation of the cosmic-ray flux over the sidereal day and local solar day based on harmonic analysis in one dimension. With the development of ground-based and underground/under-ice experiments, two-dimensional map of the CR arrival directions distribution was provided [92-98], thanks to the long-term stable observations and large statistic. Detailed morphological studies of the anisotropy structures became then possible. In the two-dimensional anisotropy map at multi-TeV, a few large scale structures have been identified, as shown in Fig. 13. One is the “tail-in” [100], an excess confined in a narrow cone with a half opening angle of 68° from the direction (right ascension$ \alpha\approx $ 90°, declination$ \delta\approx $ -24°) coincident with the heliospheric magnetotail direction (right ascension$ \alpha\approx $ 90°, declination$ \delta\approx $ -29°). Another feature is the so-called “loss-cone”, a broad deficit in the direction of the Galactic North Pole. A small diffuse excess around α = 310° and δ = 40°, corresponding to the Cygnus region direction, has been reported by Tibet AS and ARGO-YBJ experiments, likely due to a large contribution of gamma rays.
Figure 13. (color online) Combined cosmic ray anisotropy of Tibet-AS and IceCube experiments in the equatorial coordinate system [99].
The maximum of the dipole anisotropy, about
$ 10^{-3} $ , is reached around 10 TeV, above which the amplitude begins to decrease with the phase gradually shifting. As the energy increases a major change in the morphology of the anisotropy is observed in several experiments in theNorthern hemisphere as well as in the Southern hemisphere (EAS-TOP, IceCube, Tibet AS [101], and ARGO-YBJ [102]). Data collected by Tibet AS and ARGO-YBJ over 7 and 5 years, respectively, of data taking show that at energies above 50 TeV the ‘tail-in’ and the ‘loss-cone’ features gradually fade away, while above 100 TeV a sudden change of the phase is observed, and the amplitude begins to increase with energy with an evident new pattern. At energies above 150 TeV the ‘tail-in’ and ‘loss-cone’ features completely disappear and the 2D map is dominated by an excess in the interval α = 20°-300° and a deficit around α = 0°-100°. The direction of the new excess is very close to the direction of the galactic center (α = 268.4°), suggesting this region as a possible source of cosmic rays. Similar results are obtained by the IceCube collaboration in the Southern hemisphere up to 5 PeV [103]. The 2D maps of relative intensity for 8 median energies, from 4 to 520 TeV, as measured by ARGO-YBJ, are shown in Fig. 14.
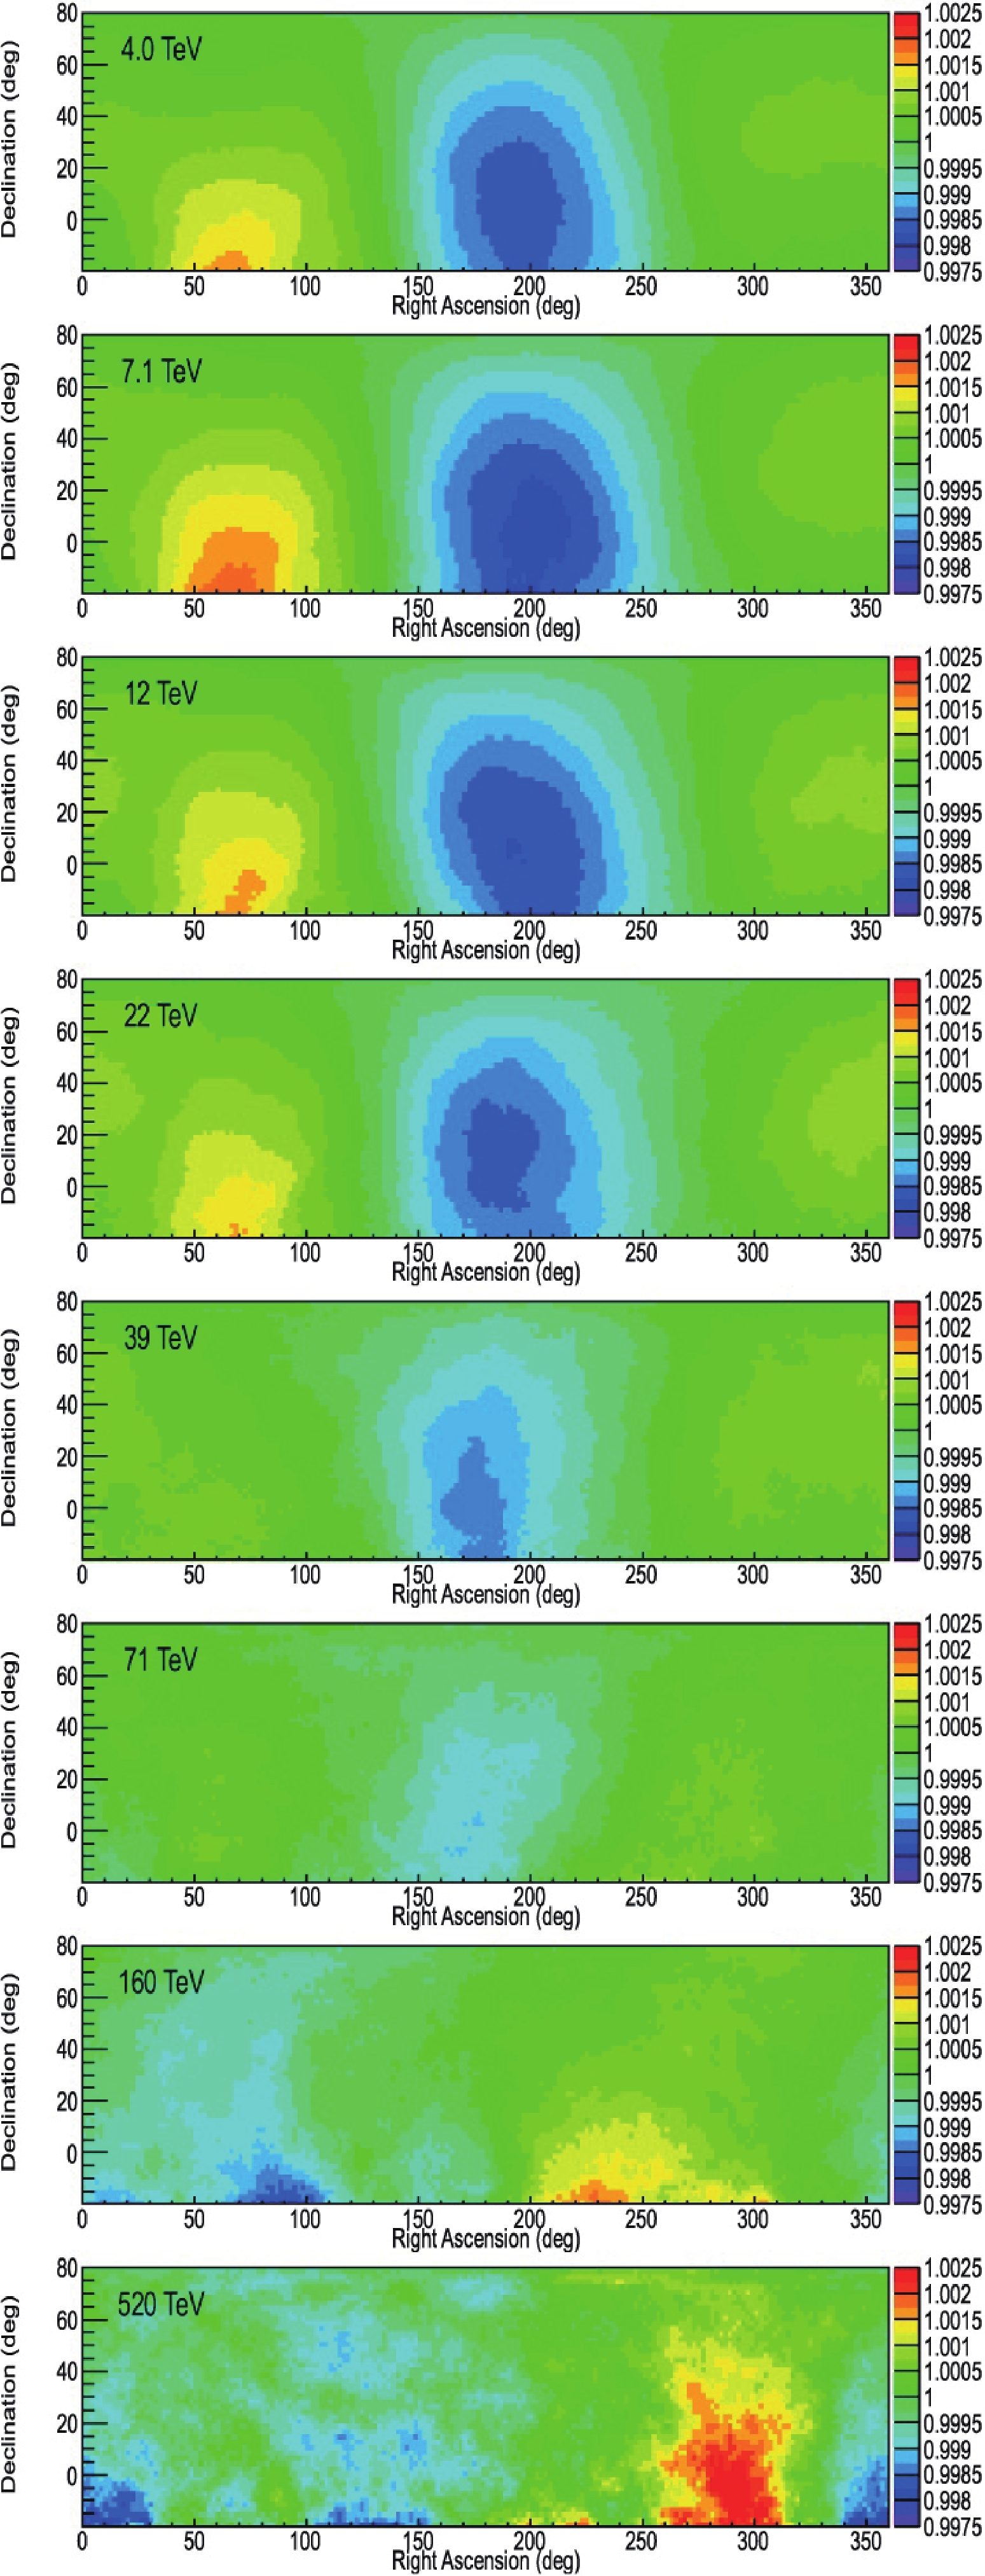
Figure 14. (color online) The 2D maps of the large-scale anisotropy measured by ARGO-YBJ for eight energy bins of median energies (from top to bottom) 4, 7, 12, 22, 39, 71, 160, 520 TeV [102]. (Reprinted with permission from AAS)
The cosmic ray anisotropy is not well described by a simple dipole moment which is, however, commonly used to illustrate the energy dependence of the phase and strength of the anisotropy. The amplitude and phase of the first harmonic measured by many experiments, obtained by a projection of the 2D map onto the right ascension axis, is shown in Fig. 15.
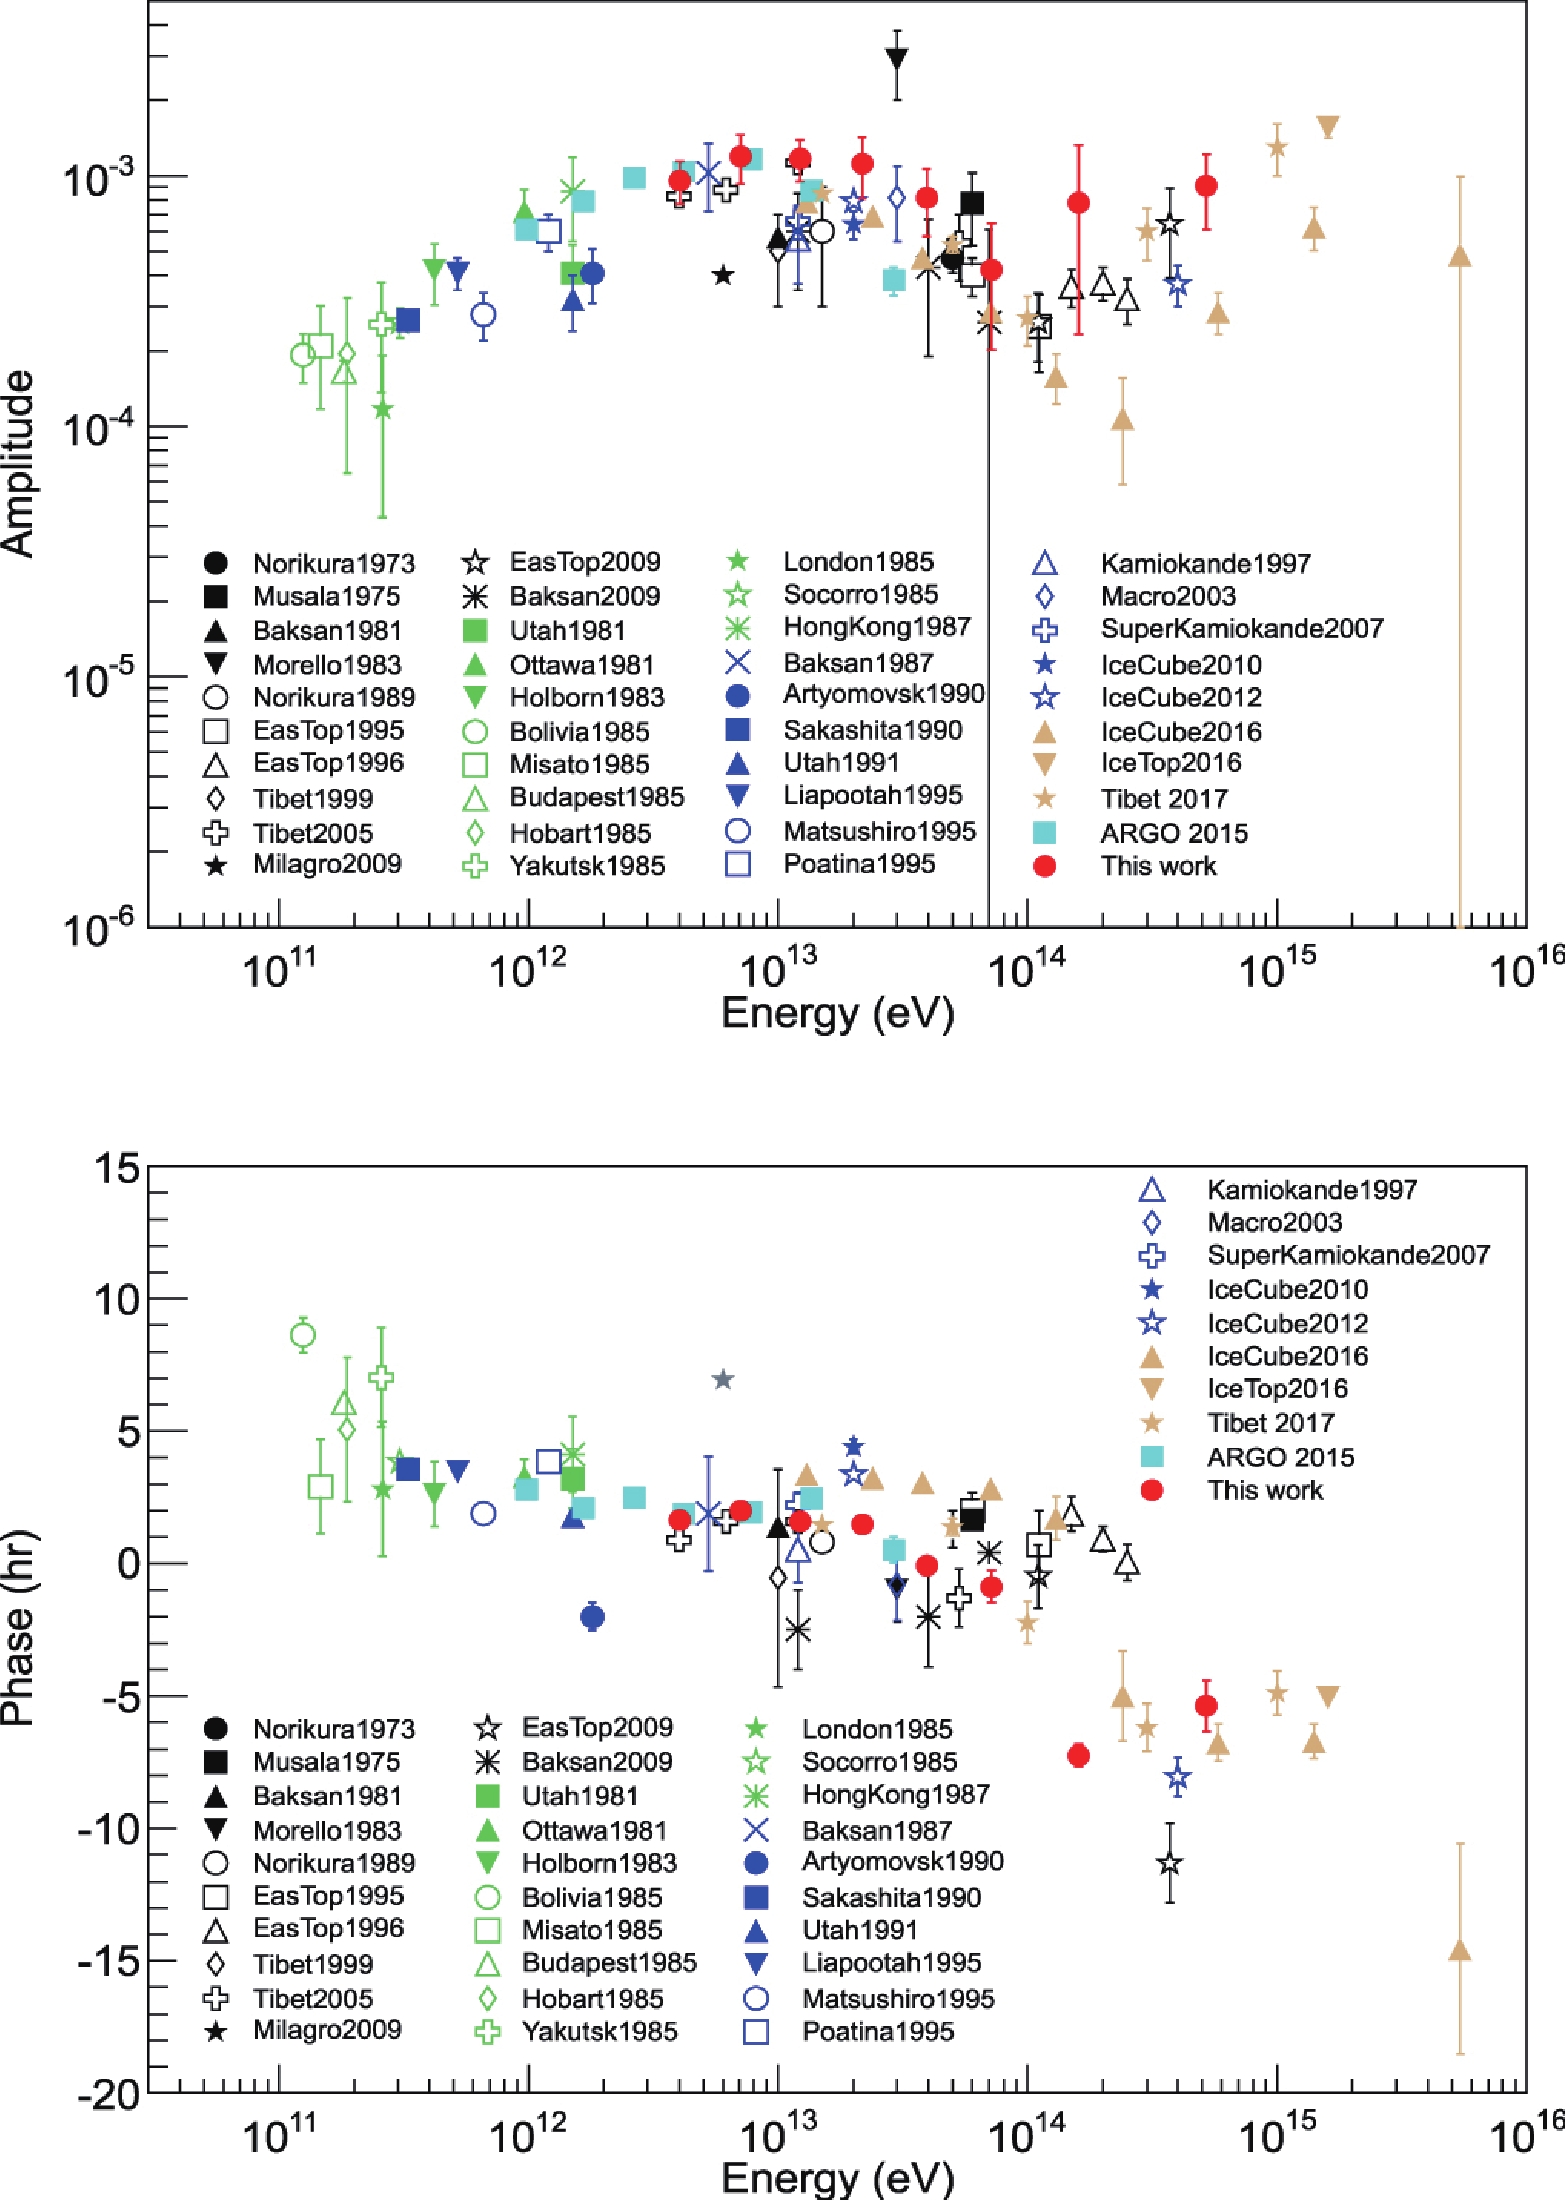
Figure 15. (color online) The amplitude (top panel) and the phase (bottom panel) of the first harmonic of the sidereal anisotropy as a function of the cosmic-ray energy measured by many experiments. For details and references see [102]. (Reprinted with permission from AAS)
A time variation of the anisotropy in association with the 11 year solar cycle could be evidence for a heliospheric influence. Milagro [94] reported a steady increase of the ‘loss-cone’ amplitude at a mean energy of 6 TeV over a period of seven years as the solar activity varied from near maximum to minimum. This challenging result is not confirmed by Tibet AS [104], ARGO-YBJ [102], and IceCube [103] experiments. A comparison of data collected by the experiments located in the Northern hemisphere is shown in Fig. 16. This result implies that the anisotropy of multi-TeV cosmic rays essentially reflects the structure of the interstellar magnetic field.

Figure 16. (color online) Temporal variation of the ‘loss-cone’ amplitude measured by ARGO-YBJ, Tibet-AS, and Milagro experiments [102]. (Reprinted with permission from AAS)
By filtering out the large scale structure from the CR anisotropy, several localized regions of significant cosmic-ray excess have been observed. The Milagro cosmic-ray sky map [105] first indicated two excess regions at (
$ \alpha\sim 69.4^\circ $ ,$ \delta\sim 13^\circ $ ) and ($ \alpha\sim 130^\circ $ ,$ 15^\circ<\delta< 50^\circ $ ), the relative intensity of them being$ 6 \times 10^{-4} $ , and$ 4 \times 10^{-4} $ , respectively. Both regions were confirmed by Tibet ASγ and ARGO-YBJ experiments. The ARGO-YBJ experiment [106] presented evidence for two additional excess regions at ($ \alpha\sim 240^\circ $ ,$ 15^\circ<\delta< 55^\circ $ ) and around ($ \alpha = 210^\circ $ ,$ \delta = 30^\circ $ ) with a maximum relative intensity of$ 2.3 \times 10^{-4} $ and$ 1.6 \times 10^{-4} $ , respectively. The last excess region has been confirmed by HAWC [107]. In the southern sky, an excess localized at ($ \alpha = 122.4^\circ,\ \delta = -47.4^\circ $ ) were suggested by IceCube experiment [108].The study of the anisotropy at high energies above
$ 10^{16} $ eV is a very difficult and challenging task because of the low CR rate. Thus a very long duration of data taking is needed to reach a good statistical sensitivity, implying stability and a strict control of the detector performance. For instance, the Auger results come from the analysis of 14 years data collected with the surface array. Anisotropies are expected to be stronger at the higher energies since both source distance and magnetic deflections are reduced. The amplitude and the phase of the first harmonic measured by KASCADE-Grande, IceCube, IceTop, and Auger at energies above$ 10^{15} $ eV are shown in Fig. 17.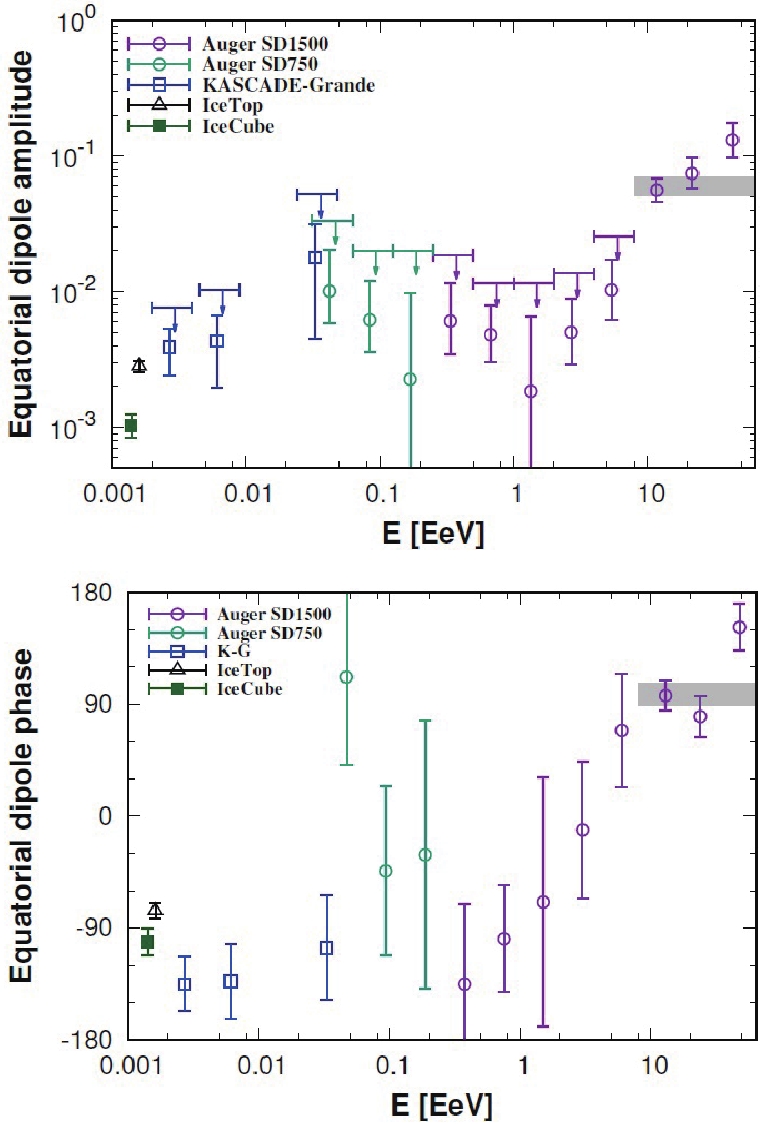
Figure 17. (color online) Amplitude (top) and phase (bottom) of the equatorial dipole of the cosmic-ray large-scale anisotropy at ultra-high energies [109].
The measured amplitudes increase from
$ 10^{-3} $ to$ 10^{-2} $ up to an energy of about$ 8\times 10^{18} $ . Below$ 10^{18} $ eV all the measured phases point near the Galactic center ($ \alpha\approx $ -94° in this plot). An amplitude of about$ 6.6\times 10^{-2} $ and pointing$ \approx 125^\circ $ away from the Galactic center is instead observed by Auger above$ 8\times 10^{18} $ eV. The 2D map of the anisotropy is shown in Fig. 18. Taken together, these results suggest a transition from a predominantly Galactic to an extra-galactic origin of cosmic rays somewhere between 1 and a few EeV.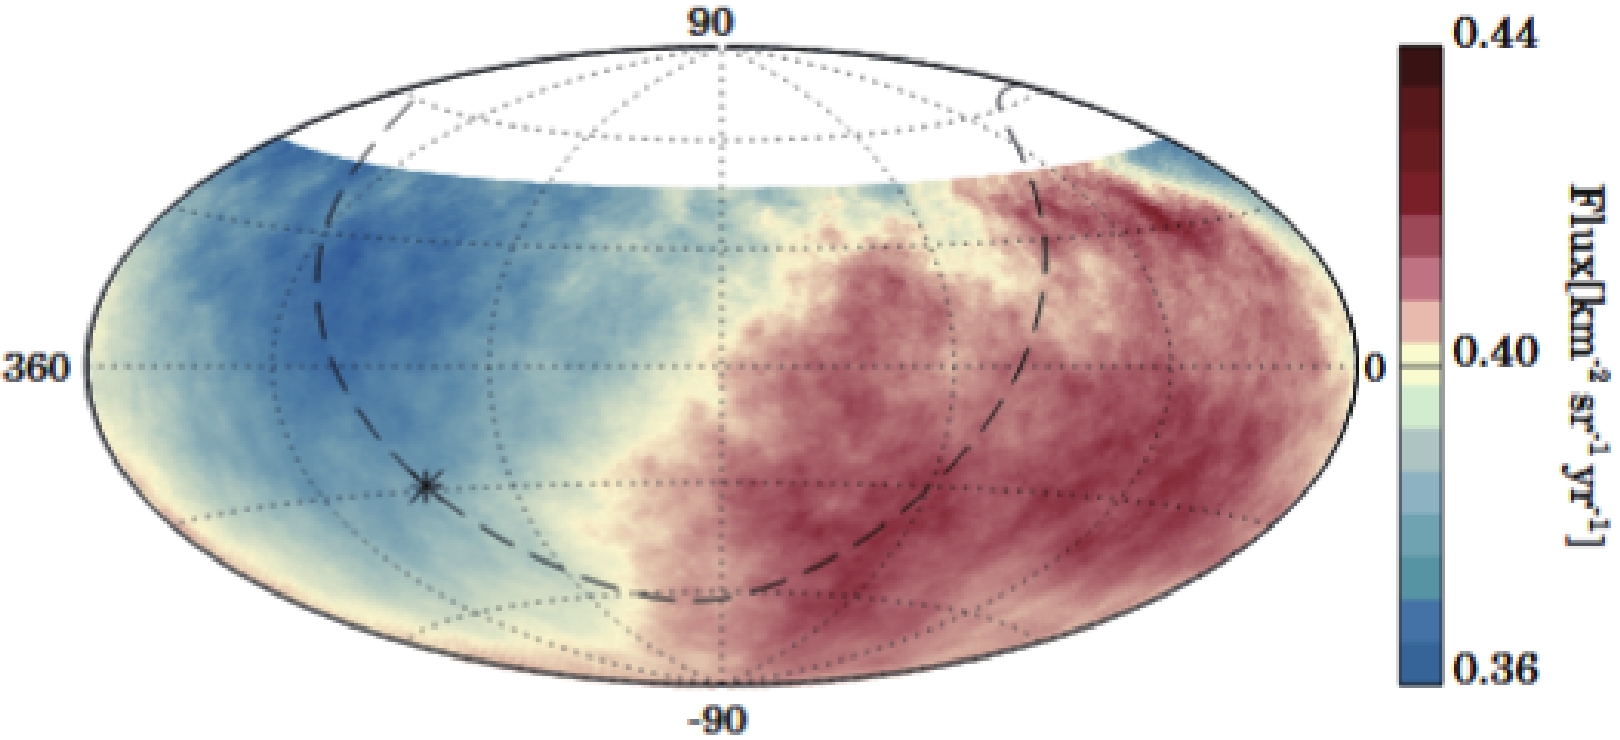
Figure 18. (color online) Smoothed cosmic ray flux for E >8 EeV measured by Auger. The dashed line and the star indicate the Galactic plane and the center, respectively. The direction of the dipole lies 125° from the Galactic center, disfavoring a galactic origin for these cosmic rays [110].
A number of explanations for the CR anisotropy have been discussed, pertaining to uneven distribution of CR sources in the galaxy, propagation effects, the galactic magnetic field and the local magnetic field. The global anisotropy changes with energy, however, are intriguing. According to numerical studies of CR propagation in a scenario of homogeneous and isotropic diffusion in the galaxy, the small magnitude and the energy dependence of the anisotropy amplitude can be explained with nearby and recent SN explosions [111-113], mixed mass composition, the smoothing effect of the galactic halo and the position of the Sun on the inner edge of the Orion arm [114].
The local origin model of the anisotropies was proposed by Amenomori et al. (2010) [115], Zhang et al. (2014) [116] and Schwadron et al. (2014) [117]. In their model, the global anisotropy may be generated by galactic cosmic rays interacting with the magnetic field in the local interstellar space of scale
$ \sim 2 $ pc surrounding the heliosphere. In addition, Qu et al. (2012) [118] proposed a global galactic CR stream model by extending the observed CR anisotropy picture from the solar system to the whole galaxy, connecting GCR streaming and the structure of the galactic halo magnetic field. On the other hand, a dipolar anisotropy is expected due to the motion of the observer relative to the CR plasma by Compton & Getting [119]. Such CR anisotropy due to the solar system rotation around the Galactic center at a speed of$ \sim 220 $ km s−1 was excluded [92], implying that GCRs corotate with the local galactic magnetic field environment. The models for mid-scale anisotropies have been also discussed since 2008. The excess could be due to the magnetic mirror effect on CRs from a local source [120], or could be related to the Geminga pulsar [121]. Cosmic ray acceleration from magnetic reconnection in the magnetotail has been proposed as a possible source [122]. The reconstruction errors in the presence of a large angular gradient in the cosmic ray flux could also cause small-scale features [123]. Recently it has been argued that small-scale structures could be due to cosmic ray scattering in local turbulent magnetic fields [124]. Models proposed for explaining the small-scale anisotropies are reviewed in [99]. -
The CR electrons (the total electrons + positrons) and antiprotons are less abundant species in the CR family. Nevertheless, they are crucial for studies of various fundamental problems in physics and astrophysics, including the propagation of CRs, the search for anti-matter Universe, and the detection of particle dark matter (DM). Usually these particles need to be detected in space, by e.g. magnetic spectrometers, in order to be robustly identified from the very high proton and nuclei background.
The extension of the measurements to high energies by space detectors is difficult due to the limited counting statistics of high energy particles. Therefore, the ground-based experiments are expected to play important roles in the study of high energy (
$ \gtrsim $ TeV) electrons and antiprotons. Due to improving separation power between hadronic and electro-magnetic showers, high energy electrons can be detected by the ground-based experiments. Using the Earth's magnetic field as a huge magnetic spectrometer, the antiproton-to-proton ratio can also be measured via the observations of the moon shadow by air shower arrays (Tibet AS, ARGO-YBJ, HAWC). -
The propagation of electrons in the Milky Way is very different from that of nuclei. The radiative cooling of electrons, with cooling time scales proportional to
$ E^{-1} $ , becomes very important and dominates the propagation processes at high energies. Therefore high energy electrons can only retain for a limited time scale and propagate within a limited distance range. The detection of high energy electrons and the precise measurement of their spectral features provide unique diagnostic of local sources of CR electrons.The electron spectra have been measured to TeV energies with very high precision by space- and balloon-borne detectors in the past few years [3, 125-128]. The ground-based Imaging Cherenkov Telescope Arrays (IACTs) extended such measurements to about 5 TeV with relatively large systematic uncertainties [14, 129, 130]. Figure 19 summarizes the current measurements of the total
$ e^++e^- $ spectra. Data up to a few TeV have been provided by ISS-CALET [64] and the DAMPE instrument on board a satellite [12]. DAMPE is operating with high energy resolution and effective rejection of the hadronic cosmic-ray background. The observed energy spectrum is shown in the right panel. A spectral hardening near 50 GeV and a spectral break near 0.9 TeV have been reported after 530 days of operation. In the energy range of 55 GeV to 2.36 TeV the spectrum is well represented by a smoothly broken power-law model shown as a dashed line in Fig. 19.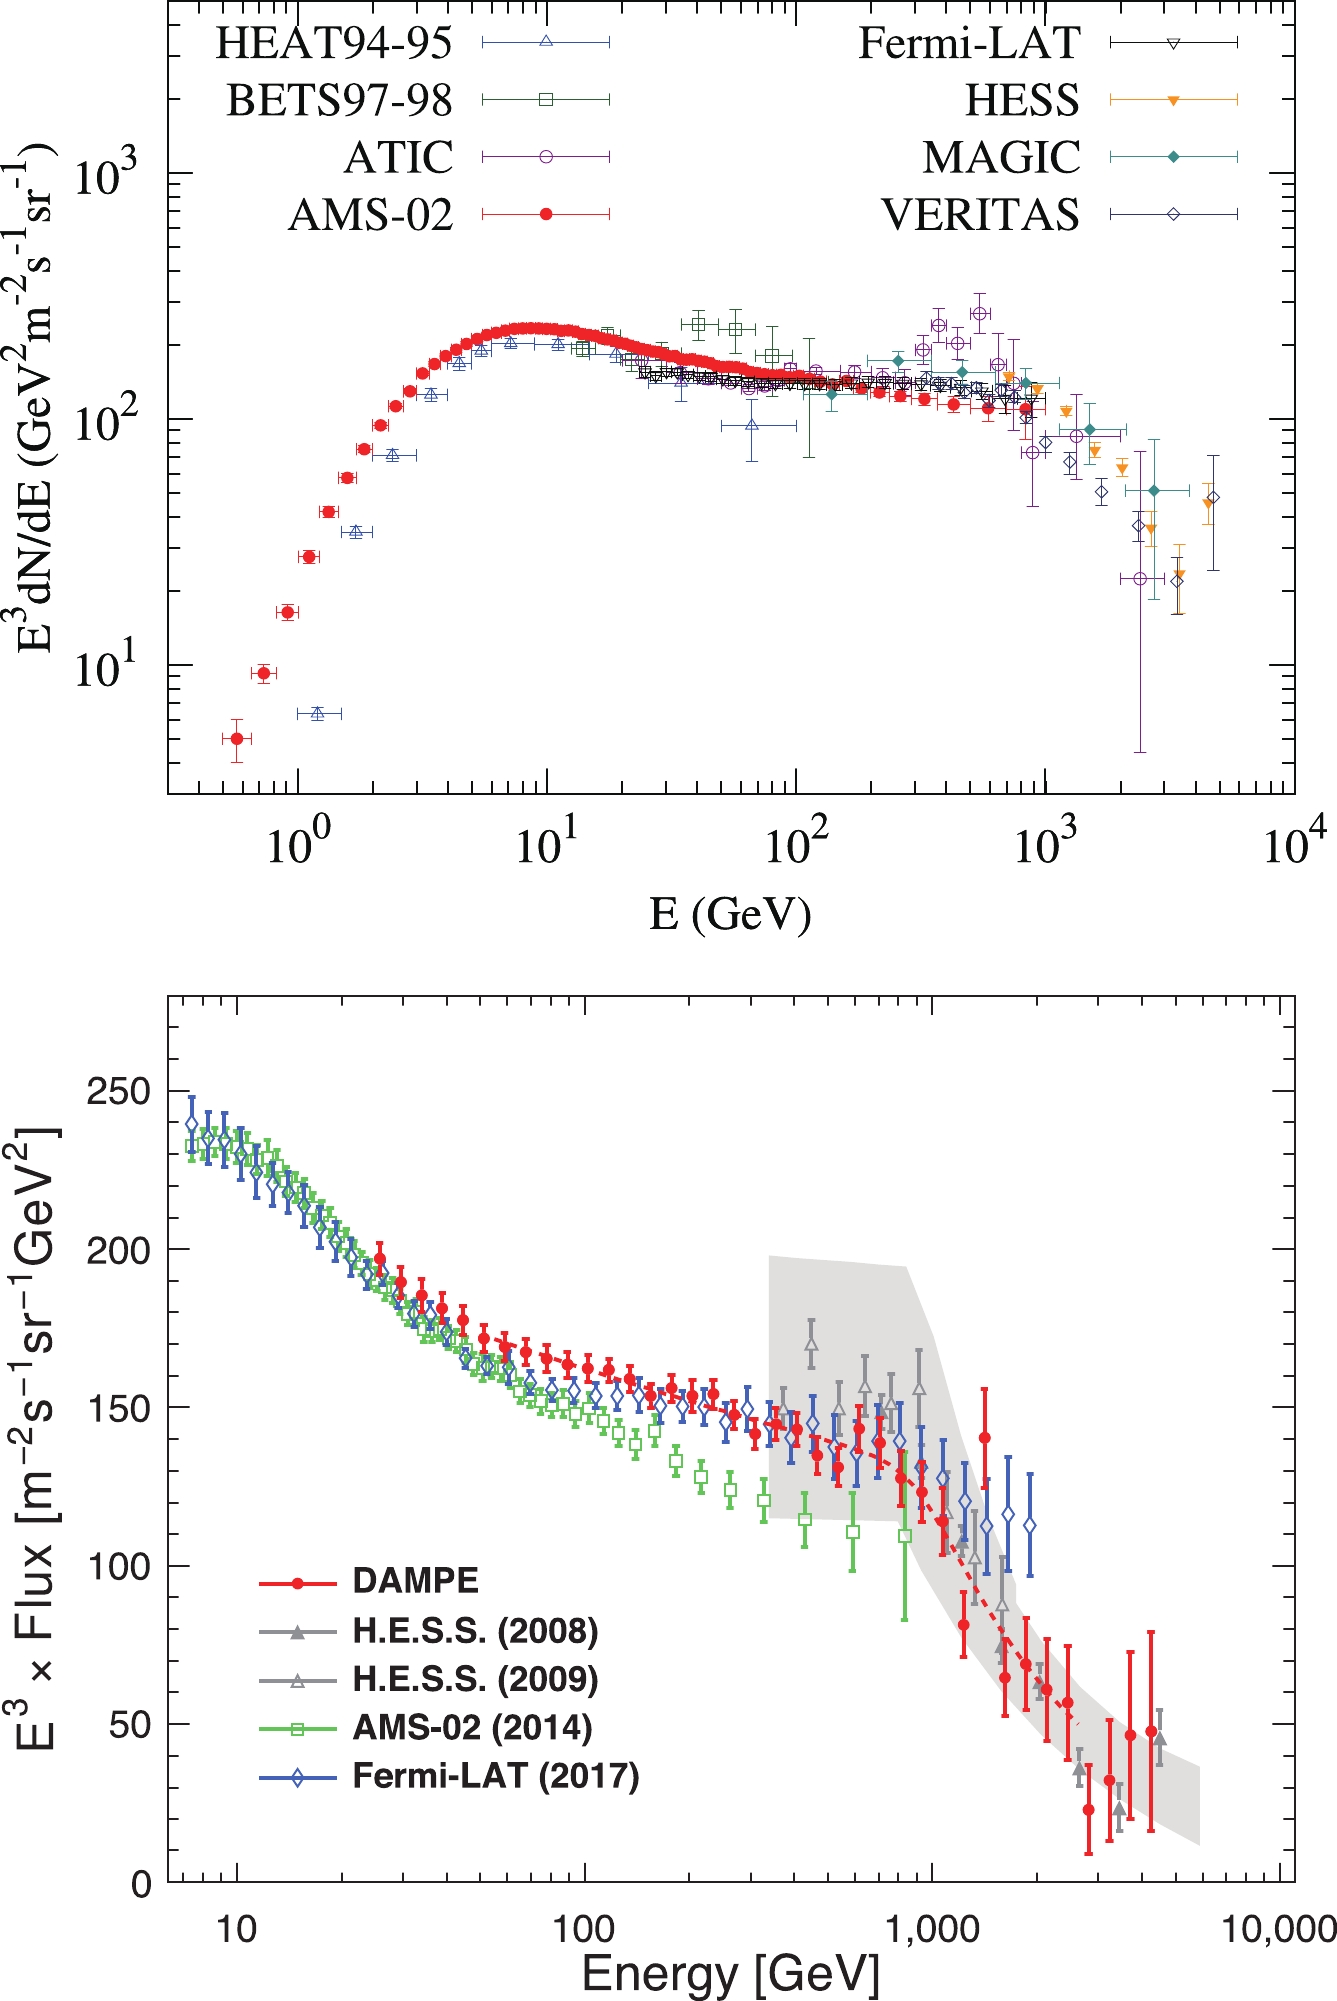
Figure 19. (color online) Top: Fluxes (weighted by E3) of the total
$e^++e^-$ measured by balloon- and space-borne experiments [3, 125-128], and the ground-based IACTs [14, 129, 130]. The bottom panel shows the electron + positron spectrum measured by DAMPE [12]. The grey band represents the systematic uncertainty affecting the HESS data.The CALET results exhibit a lower flux than those of DAMPE from 300 GeV up to near 1 TeV, likely indicating the presence of unknown systematic effects. The energy spectrum measured by CALET above 1 TeV suggests a flux suppression consistent, within the errors, with the DAMPE results [131]. Thus both experiments confirm the change of the spectrum slope above 1 TeV firstly observed with large systematic uncertainties by the ground-based IACTs.
Theoretically, CR electrons include the primary component which may be accelerated simultaneously with nuclei, by e.g., supernova remnants (SNRs) and many other types of CR sources, and the secondary component from inelastic collisions between CR nuclei (mostly protons and Helium) and the interstellar medium (ISM). The secondary contribution is only a small fraction (~ 10%) of the total electrons. In addition, there might be leptonic sources which produce dominantly electron/positron pairs. Candidate sources include pulsars [132] and sources with
$ e^+e^- $ pair production via$ \gamma\gamma $ interaction [133] or photo-nuclei interaction [134]. The existence of such primary$ e^+e^- $ pair sources has been suggested by the observations of remarkable excesses of the positron fraction above ~10 GeV [135-138]. The simultaneous fitting to the positron fraction and total electron spectra further indicates the existence of high energy spectral hardenings of the primary electrons [139-141]. Such a result implies nearby sources of CR electrons [142, 143].The annihilation or decay of DM particles can produce electrons and positrons, which may also explain the electron/positron excesses [144-146]. However, observations of γ-rays strongly constrain such models, leaving only a class of decaying DM models with leptonic decaying products [147-150]. The precise measurement by CALET and DAMPE of the electron/positron spectrum up to 10 TeV is expected to narrow down the parameter space of all proposed models.
-
Antiprotons are important probe of the propagation of CRs and the search for DM particles. It is generally accepted that galactic antiprotons are produced via the inelastic collisions between high energy CRs and the ISM during their propagation in the Galaxy. Such a production mechanism is similar to the process of nucleus fragmentation which produces secondary nuclei (such as Lithium, Beryllium, and Boron) in CRs.
Figure 20 shows the current measurements of the
$ \bar{p}/p $ flux ratio by balloon- and space-borne experiments from 0.1 to 500 GeV [7, 9, 151-153]. The$ \bar{p}/p $ ratio shows an increase from the lowest energy up to ~10 GeV, which reflects the antiproton production threshold of the pp collision. The high energy behavior of the$ \bar{p}/p $ ratio is expected to follow a power-law declination due to the energy-dependent diffusion of CRs. The current data from AMS-02 is consistent with either a flat or a shallow decline at high energies [7]. It is still unclear whether there are antiproton excesses for$ E\gtrsim 100 $ GeV. Based on a semi-analytical model of CR propagation [158], it has been shown that the observed$ \bar{p}/p $ ratio is well consistent with the model inferred from the Boron-to-Carbon ratio [159, 160], leaving limited room for contribution from the particle DM annihilation①.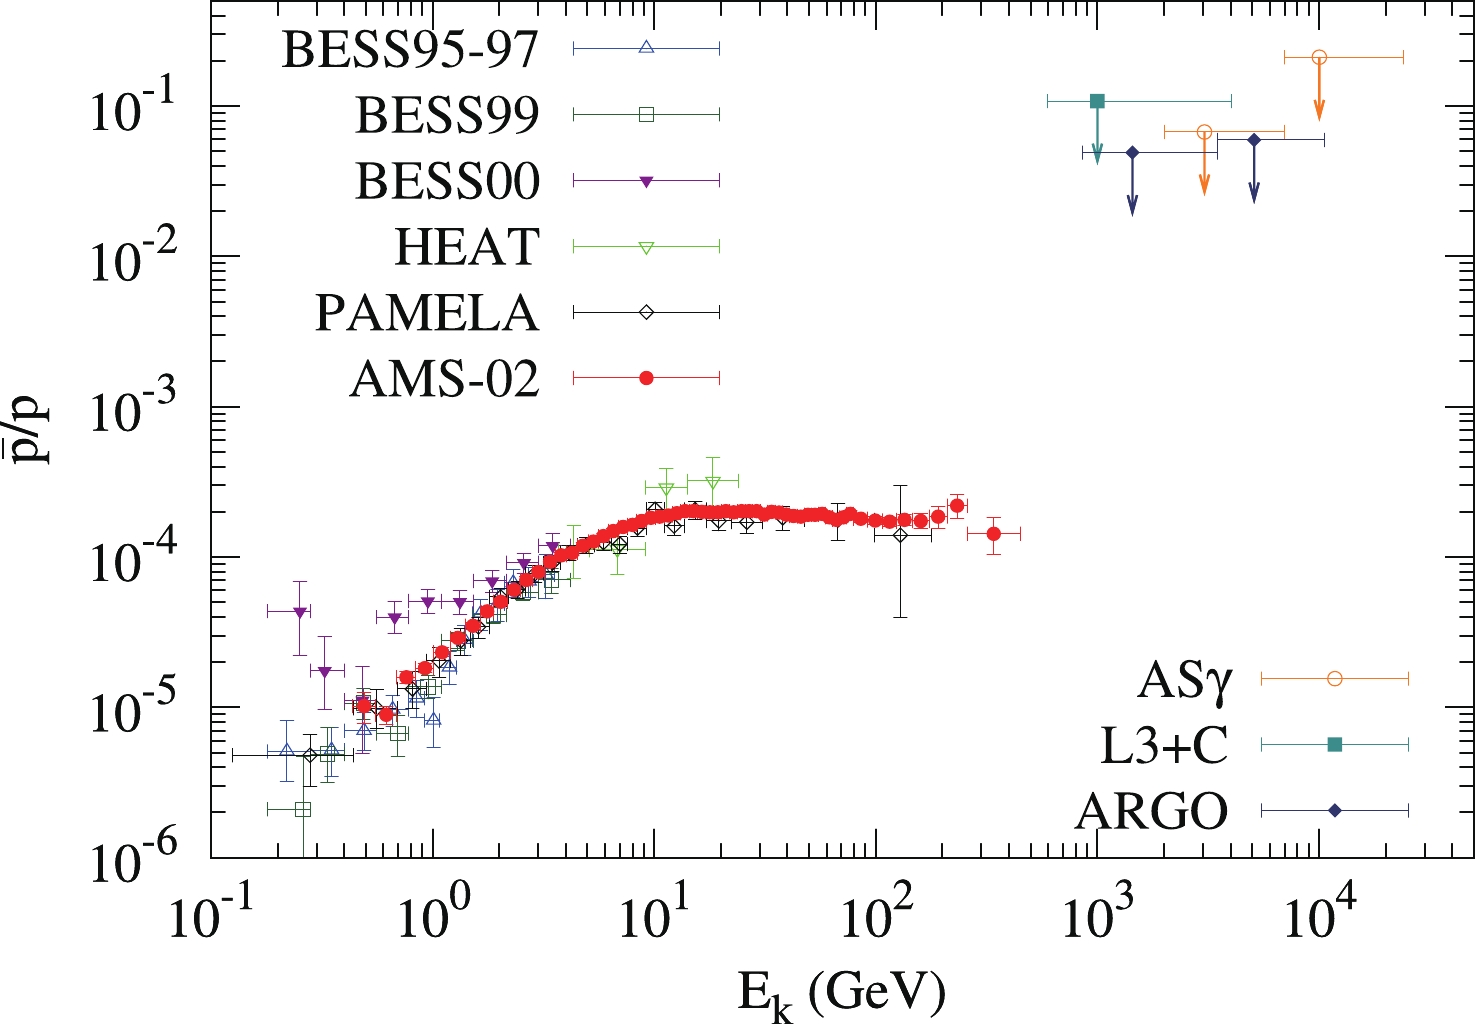
The extension of the measurements to higher energies is very difficult. For the direct detection in space, the event statistics is very challenging due to the extremely low fluxes of antiprotons. The ground-based experiments are, however, lack of effective charge-sign separation capability. A smart idea is to use the deflection of the moon shadow by the Earth's magnetic field to separate antiprotons and protons [165]. Analyses from a few experiments have been done, and no significant deviation of the moon shadow's deflection from Monte Carlo expectation based on pure positive CRs was found [154-156]. The corresponding upper limits of the
$ \bar{p}/p $ ratio were derived, as shown by arrows in Fig. 20. These upper limits are$ 10^2-10^3 $ times higher than the direct measurements at lower energies and can only constrain few exotic theoretical models such as the antimatter model [166]. -
Since CRs are electrically charged, their paths are bent by the cosmic magnetic fields. As a consequence, they do not point back to their sources. In contrast to cosmic rays, gamma rays produced at these sources propagate along a straight line.
They are produced in the interaction of accelerated particles, cosmic rays or electrons, with ambient matter or radiation fields, thus TeV gamma rays do trace the emission sites with the acceleration sites nearby. Since the photon production processes, hadronic interaction or inverse-Compton, are well known, TeV gamma-ray observations provide crucial information about the intensity and the spectrum of the accelerators. After the pioneering observation of the Whipple Telescope that detected in 1989 the first source, the Crab Nebula, the gamma-ray astronomy above a few tens of GeV by ground-based detectors developed rapidly thanks to the IACT techniques. Nowadays more than 200 TeV sources are reported in the TeV-cat [167] catalog. Wide-angle devices like MILAGRO, ARGO, HAWC may complement the observations by IACT due to their better survey capabilities and better sensitivity to extended sources. The status of this field and the LHAASO performance in the gamma-ray observations are discussed in Chapter 2.
In the context of the search of cosmic-ray sources, high energy neutrinos play a crucial role being able to provide an uncontroversial proof of their hadronic character; moreover, they can reach us from cosmic regions which are opaque to other type of radiation, including high-energy gamma rays. High energy neutrinos, as well as photons, are expected to be produced by UHECRs interacting with extragalactic background photons during intergalactic propagation. An attractive plot, see Fig. 21, has been proposed by the IceCube collaboration [168]. The energy flux of diffuse extragalactic gamma rays, ultra-high energy cosmic rays, and high energy neutrinos have similar spectra despite their disparate energy regimes, implying a common origin of these radiations. The expected neutrino fluxes from sources are of the same order of magnitude as the gamma-ray fluxes, however the km3-scale neutrino detectors currently in operation have a sensitivity far lower than the LHAASO sensitivity (
$ \approx10^{-14} $ erg cm−2 s−1) in the most relevant, 100 TeV to 1 PeV, energy range, envisaging at this time only a marginal contribution to the LHAASO search for cosmic-ray sources. A dedicated study of the Multi-messanger physics with LHAASO is given in Chapter 6.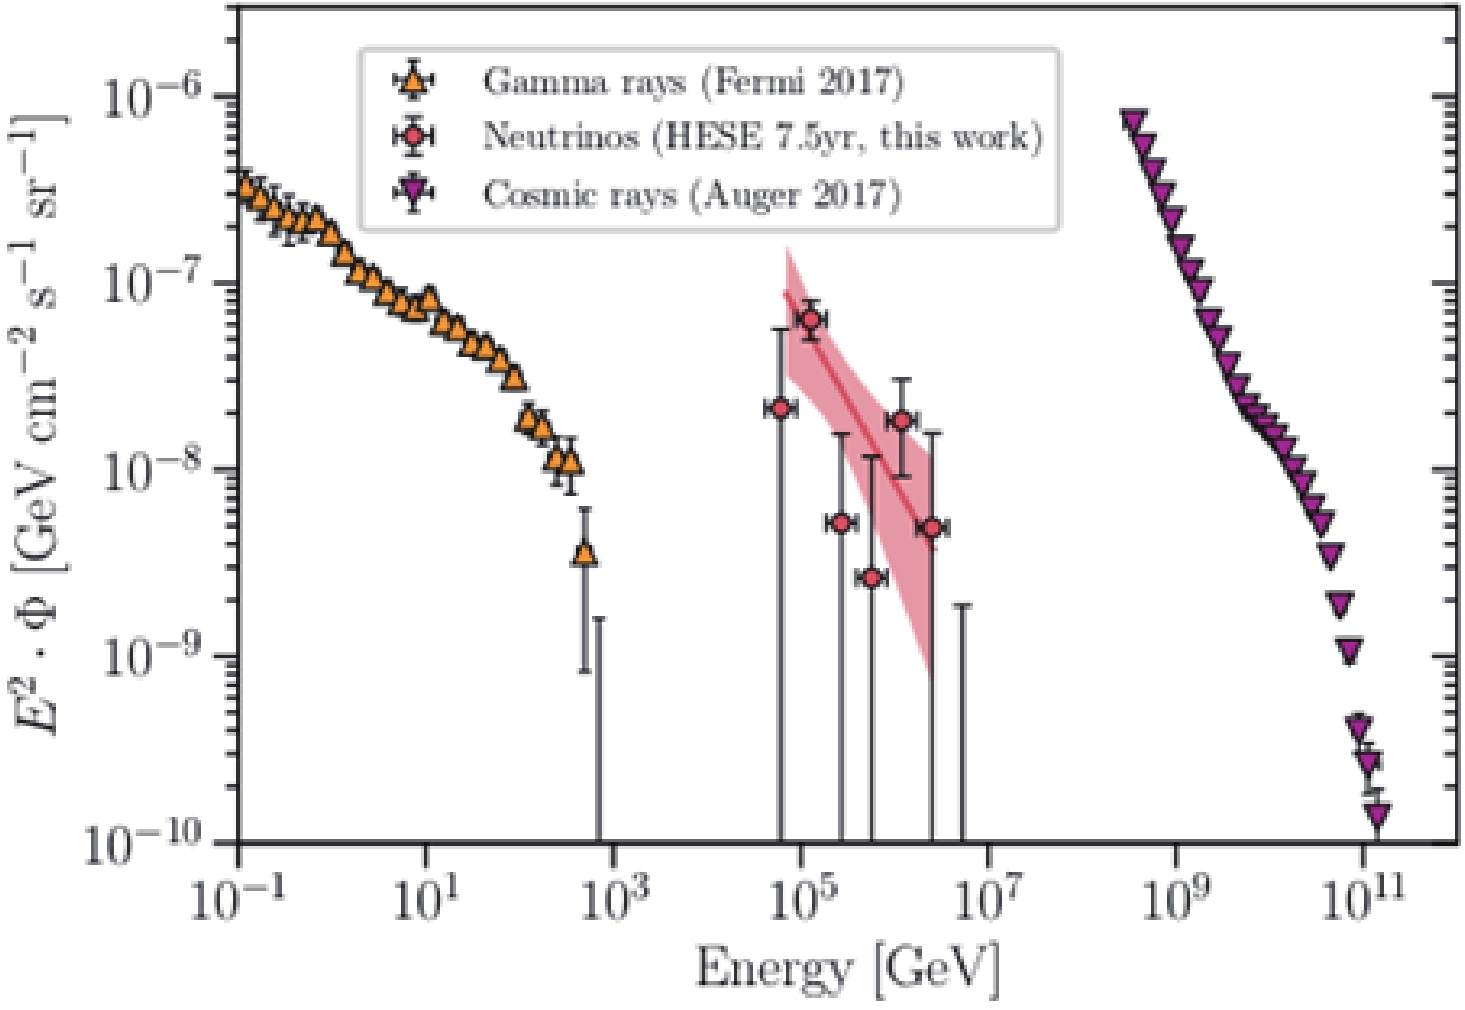
Figure 21. (color online) Energy flux of extragalactic diffuse gamma rays, high-energy astrophysical neutrinos, and UHECRs [168]. (Reprinted with permission from the American Physical Society)
-
Cosmic rays are the most energetic particles in nature and their studies address fundamental issues as the nature of the non-thermal Universe and the violent cosmic processes there at work. In 1938 Pierre Auger and his colleagues detected extensive air showers with two Geiger-Muller counters operated in coincidence 300 m apart. The energy of the primary particle inducing these events was estimated to be about
$ 10^{15} $ eV. In 1989 the Whipple telescope discovered TeV gamma rays from the Crab Nebula. That represents the first direct evidence of a cosmic source accelerating particles at multi-TeV energies. Since then a wealth of information about putative sources of high energy cosmic rays has been produced by the observations of a remarkable suite of experiments. The emerging general picture evidences that cosmic rays are a varying mixture of protons and nuclei of galactic origin up the energies below$ 10^{17} $ eV, the second knee, and that a transition from the galactic to an extragalactic component takes place in the energy region between the second knee and the ankle. The energy range above a few$ 10^{18} $ eV is likely dominated by extragalactic cosmic rays. These findings point out the existence of many types of candidate sources as anticipated by theoretical models. However, "neither the most energetic galactic nor the extragalactic sources of cosmic rays have been discovered, yet... " [73]. To shed light on this fundamental question, information about the spectrum and anisotropy of each cosmic ray component is of paramount importance. Indeed, understanding the cosmic ray origin and propagation is made difficult by the poor knowledge of the elemental composition of the radiation as a function of the energy. Direct measurements by above-the-atmosphere detectors may provide the energy spectrum of each cosmic ray elements. Probing these spectra via direct detection becomes a challenge beyond 100 TeV, due to the limited detector exposure. Present ground-based air shower arrays, which exploit the atmosphere as target and a calorimeter, do not suffer of this limitation, but have limited sensitivity to the charge of the primaries. Separating as much as possible the mass groups is thus a mandatory goal of new generation experiments.In summary, high energy spectral features such as breaks, bumps or cut-offs of the all particle spectrum may reflect the superposition of many contributions that could be solved only by comparing the proposed models to the measured energy dependence of the single components or mass groups. In this respect, the most fundamental topics concern
1. the measurement of the single component, or mass groups, energy spectrum through the knee at 3 PeV, allowing the determination of the energy of the knees of each element or mass groups;
2. the detailed study of the energy range
$ 10^{16}-10^{18} $ eV, where the shape of the mean of the logarithmic mass$ \left<\ln A\right> $ measured by various experiments (see Fig. 22) cannot be explained by a single galactic component with rigidity-dependent energy cut-offs in the individual spectra of different elements;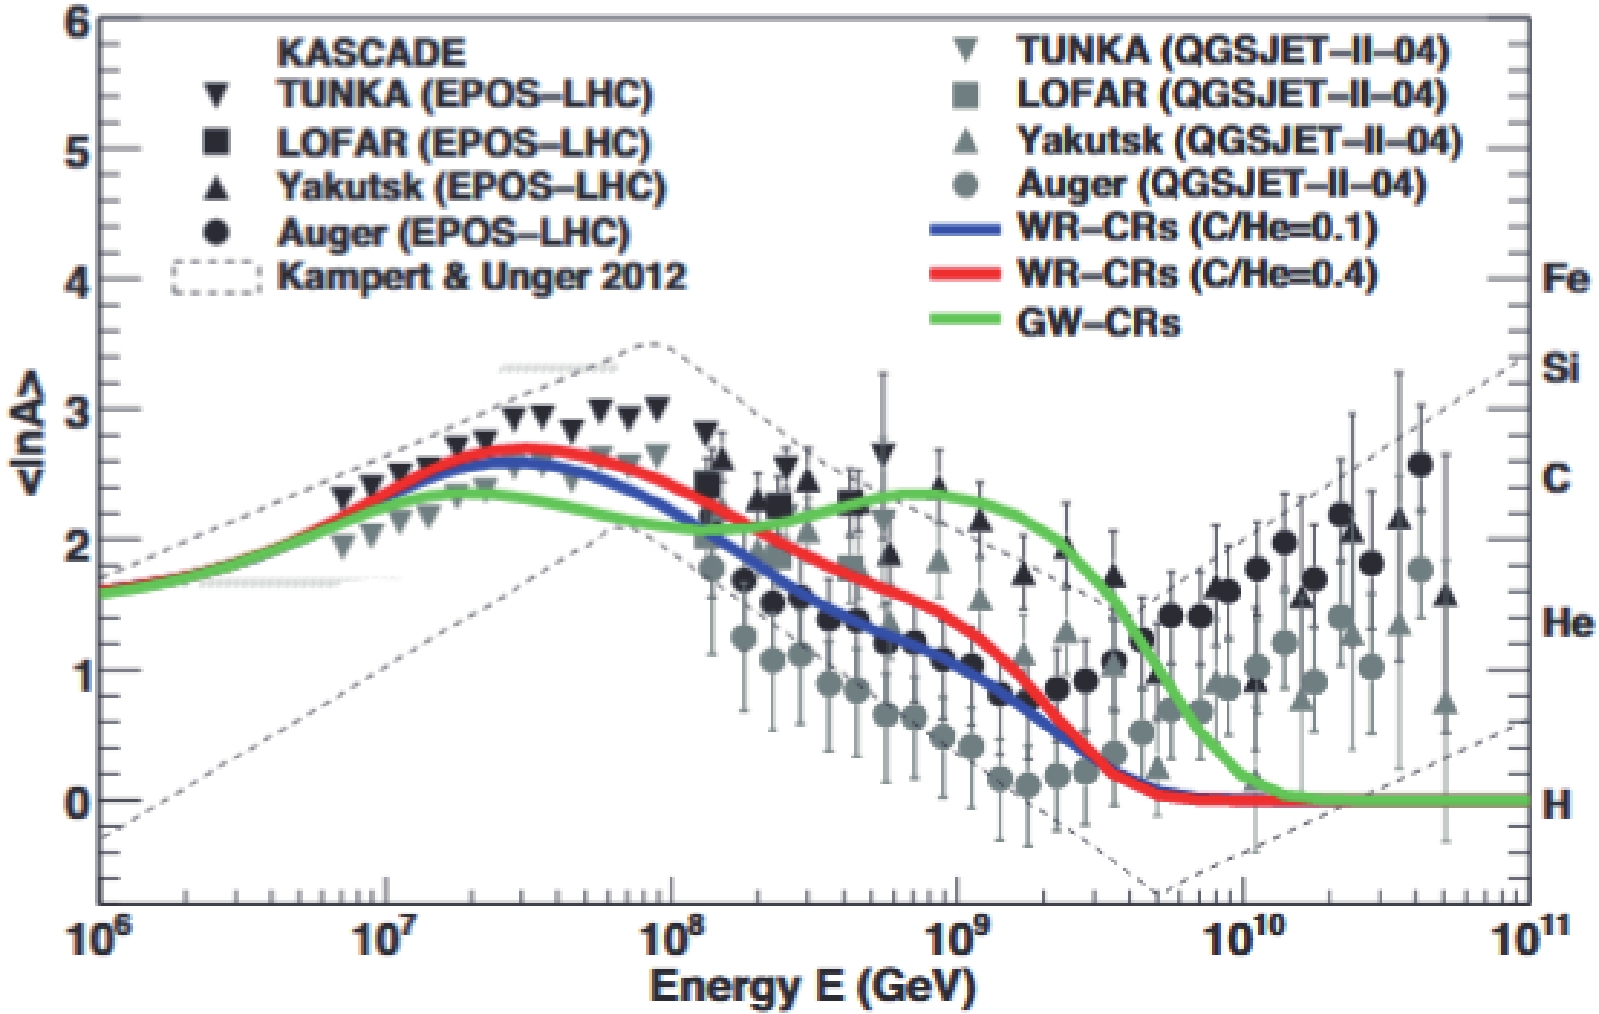
Figure 22. (color online) Mean of the logarithmic mass
$<\ln A>$ as measured by various experiments interpreted with two hadronic interaction models (EPOS-LHC and QGSJET-II-04). Predictions are shown for three different models of the additional Galactic component: cosmic rays from Wolf-Rayet stars (C/He = 0.1 and C/He = 0.4) and cosmic rays being re-accelerated by the galactic wind. For details and references see [87]. (Reproduced with the permission @ ESO)3. the measurement of the anisotropy for different mass groups.
How LHAASO may accomplish this task is discussed in the second part of this Chapter. In the search for cosmic sources LHAASO will greatly benefit of its remarkable sensitivity in gamma astronomy. Indeed, magnetic fields prevent the direct identification of the sources by simply detecting cosmic rays. Observation of high energy gamma rays produced by the interaction of PeV protons or nuclei is widely recognized as a very powerful tool to identify the cosmic ray accelerators. The need of ruling out their possible leptonic origin requires a proper sensitivity to survey the sky at above 100 TeV photon energies. In this respect, LHAASO’s sensitivity and wide field of view may provide a unique discovery potential, as discussed in Chapter 2.
By combining the study of the cosmic ray elemental composition and the observation of very high energy gamma rays, LHAASO will become one of the most powerful instrument to search for PeVatrons.
Important contributions to this search may come from a correlated study with low frequency components of the electromagnetic spectrum. Radio data at the GHz scale are produced at the source sites as well as by the interaction of cosmic rays with the ISM. Results from LHAASO gamma-ray observations in the multi-TeV range may be usefully combined with data from the next generation SKA observatory to deepen the problems related to the cosmic ray acceleration and propagation in the Galaxy. An overview of this topic is hereinafter reported.
-
Multiwavelength observations can be used to study the Galactic cosmic rays' origin, propagation, and distribution in the Galaxy. With the next generation telescopes, such as LHAASO and SKA, we may make one giant leap for understanding GCRs by finding PeVatrons, measuring the magnetic field amplification, examining the energy conversion rate and nonlinear effect, increasing evidence for TeV CRs diffusive propagation and studying their distribution in our Galaxy.
-
Supernova remnants (SNRs) are known as the best origination candidate for GCRs (other candidates include pulsar wind nebular, X-ray binaries, Galactic center, superbubbles, and so on). Multi-wavelength observations have provided lots of evidence supporting SNRs as the origin of GCRs: (1) Radio observations display bright filaments and twisty structures of SNRs which are predicted by DSA. (2) The average spectral index, α, of SNRs is about 0.5 (
$ S_v \propto v^{-\alpha} $ ) indicating a particle energy index, γ, of about 2 (γ = 1+2α). (3) The magnetic fields derived from observing OH 1720 MHz masers in the SNRs shocked regions are significantly amplified to magnitude of mG. (4) X-ray observations detect synchrotron emissions from young SNRs showing that electrons have been accelerated up to 100 TeV and the magnetic fields are amplified to 100-600 μG. (5) Molecular spectral line observations detect enhanced ionization rate surrounding SNRs implying efficient low energy CR acceleration. (6) Many SNRs interacting with molecular clouds or neutral hydrogen clouds, which are identified by infrared, centimeter, millimeter and sub-millimeter observations, are also GeV and/or TeV emitting objects. (7) The discovery of two components of optical Hα line supports the existence of CRs induced shock precursor. (8) Fermi satellite has detected the pion bump feature from SNRs IC443 and W44 giving the first direct evidence that both SNRs accelerate CRs to GeV.A combination of DSA and CRs propagation in our Galaxy is usually referred as the SNR paradigm. The theoretical and observational works mentioned above are in favor of this paradigm. However, many questions in the paradigm are still open. Multi-wavelength observations from next generation telescopes especially LHAASO and SKA should play a key role in solving the problems in DSA theory, CRs diffusive propagation and distribution.
-
Some key predictions or requirments of DSA are that: SNRs could accelerate CRs to the knee, i.e., about 4 PeV; magnetic field amplification is needed to accelerate CRs; the energy conversion rate should be high, i.e., larger than 10%, and CRs should have important nonlinear effect on the structure of the shock [169, 170].
The CRs are usually traced by 4 emission processes. For electrons, the tracers are synchrotron radiation (
$ \propto {N_{\rm CRe}}{B^2} $ , where$ {N_{\rm CRe}} $ is the number density of electron), bremsstrahlung ($ \propto {N_{\rm CRe}}{N_{\rm H}} $ , where$ N_{\rm H} $ is the number density of ionized, neutral and molecular hydrogen) and inverse Compton (IC) scattering ($ \propto {N_{\rm CRe}}{N_{*}} $ , where$ N_{*} $ mean the number density of background photon). For protons, the tracer is neutral pion decay ($ \propto {N_{\rm CRp}}{N_{\rm H}} $ , where$ {N_{\rm CRp}} $ is the number density of protons). The first process usually dominates in the radio band and sometimes appears in the X-ray band. The last three processes produce radiation in the γ-ray band. The key to illustrate SNRs as the origin of GCRs is to separate the hadronic process from the leptonic processes. Since both bremsstrahlung and pion decay are proportional to$ N_{\rm H} $ , their relative intensity is determined by the density ratio between electrons and protons ($ K_{\rm ep} $ ). Because$ K_{\rm ep} $ is usually smaller than 0.01, bremsstrahlung is much less efficient than pion decay (see the estimation from [171]). The main confusion is from IC.Multi-wavelength observations are so far the best way to solve the problem. From synchrotron radiation (radio and X-ray bands), we could investigate the electron energy index which can be used to restrict the IC radiation. Furthermore, the ratio of electron energy loss between synchrotron radiation and IC is
$ {P_{\rm sy}}/{P_{\rm IC}} = {U_{\rm B}}/{U_{\rm ph}} $ , where$ U_{\rm B} $ and$ U_{\rm ph} $ are the energy densities of magnetic field and background photon field, respectively. Higher magnetic field strength will lead to less IC radiation. The OH 1720 MHz maser (centimeter band), X-ray synchrotron radiation (X-ray band) can be used to estimate the magnetic field strength. The background photon field includes the 3 K cosmic background radiation. However, for some SNRs, the infrared radiation from dust (infrared band) also has a great contribution to the photon field. For pion decay, it depends on the material distribution which can be inferred by the molecular lines observation (centimeter, millimeter/submillimeter band), dust observation (infrared band) and X-ray observation.1. PeVatrons
In the γ-ray band, there are two crucial spectral windows to distinguish pion decay from leptonic processes. The first one is the sub-GeV window. In this window, the spectrum of pion decay is characterized by the pion bump---rises steeply below ~ 200 MeV. This feature has been observed as the first direct evidence for SNR accelerating protons at GeV. Since the current ongoing γ-ray satellites are not sensitive at this band, further MeV-GeV telescopes, such as PANGU [172], may have a large sample investigation. Another window is the band well beyond 10 TeV, such as 100 TeV. In this band, the γ-ray contribution from the IC component is greatly suppressed due to the Klein-Nishina effect. The hadronic origin could be established through detailed modeling with multi-wavelength information. So far, LHAASO has the best sensitivity at the energy above 10 TeV (see Fig. 23). It will not only give the first SNR observation above 30 TeV, but also greatly reduce the error bar of the data which is critical to distinguish different models. The SNR paradigm predicts that young SNRs should be PeVatrons, which can be verified with LHAASO observations.
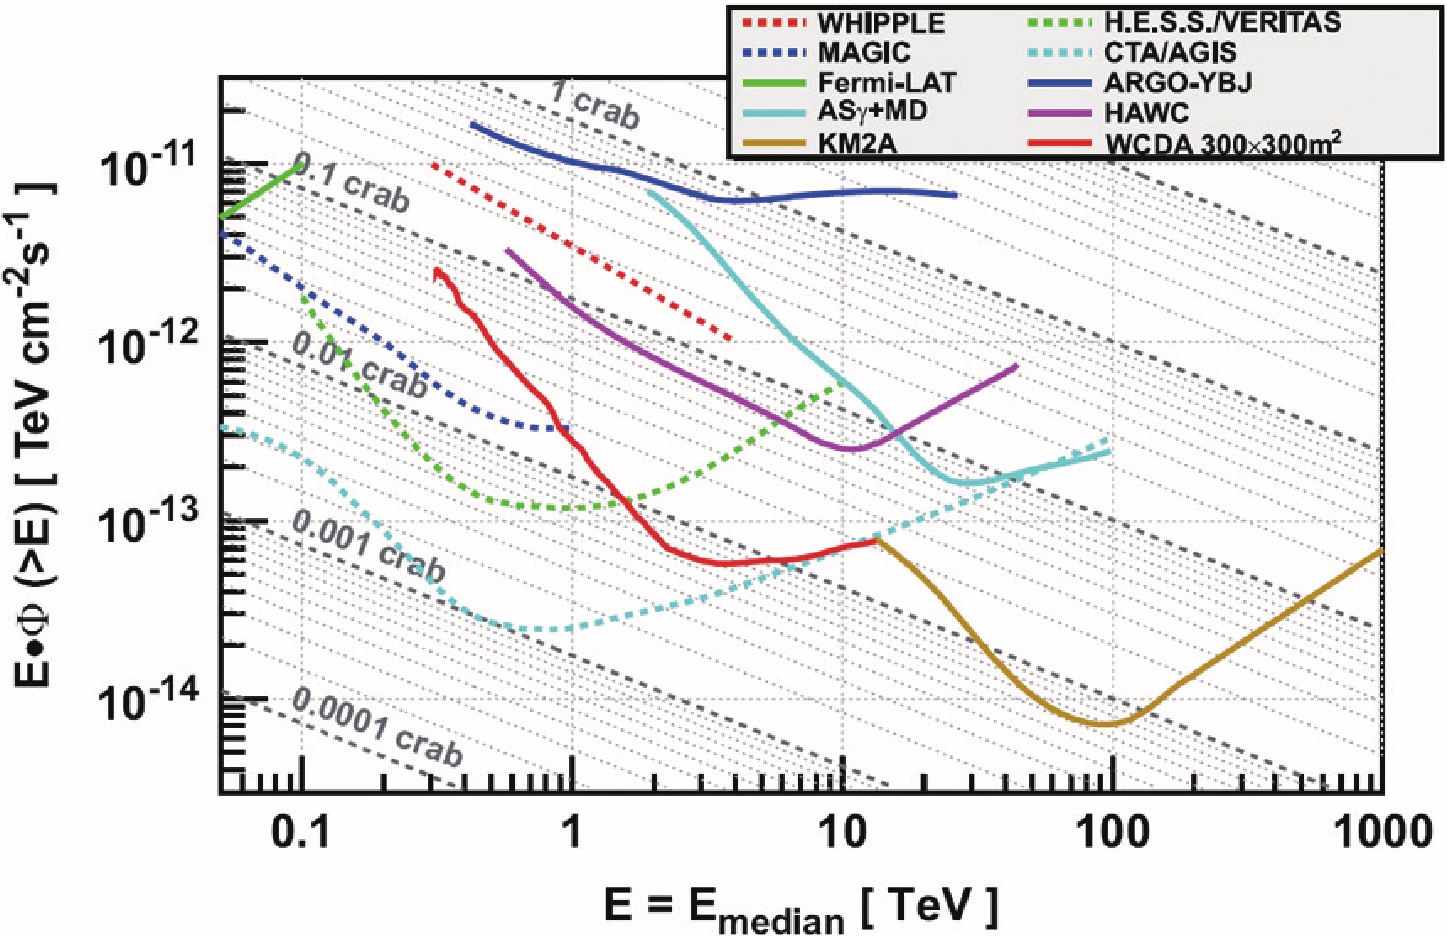
Figure 23. (color online) The sensitivity of LHAASO-WCDA and LHAASO-KM2A [173].
2. Magnetic field amplification
Magnetic filed amplification is a prediction of sufficient CRs acceleration and is also required if SNRs can indeed accelerate CRs to PeV. LHAASO could give direct evidence of PeVatrons, but the process of how the CRs are accelerated to PeV is not within its reach. As mentioned above, previous magnetic field strength studies are mainly based on OH 1720 MHz maser and X-ray synchrotron radiation observations. Both studies indicate significant magnetic filed amplification. The OH 1720 MHz masers only appear in shocked molecular cloud with density of about 105 cm-3. That means the magnetic field strength measurement is constrained to a compact region. For most parts of an SNR, OH maser observation is not able to measure the magnetic field strength. For young SNRs, X-ray synchrotron emission is only identified in narrow regions close to shock front. So, does magnetic field amplification really appear in the whole region of an SNR?
The Zeeman effect of neutral hydrogen has been used to measure the magnetic field strength of the interstellar medium. The difficulty of this method is the superposition of different hydrogen clouds similar line-of-sight velocities. Recently, observations have shown that some SNRs are associated with high velocity neutral hydrogen clouds [174]. Since those clouds are distinct from background ones, to measure their magnetic fields is possible. SKA with its sensitivity, angular resolution and big field of view (see Fig. 24), will bring us a chance to map the magnetic field strength with great details in the large area of an SNR. It could help to reveal where the magnetic field amplification happens and how large the amplification is.

Figure 24. (color online) The basic parameters for SKA [175].
Magnetic field amplification is believed to be associated with turbulence. This turbulence will cause scattering, scintillation of background light, and might cause the background point source to become an "extended" one. The scintillation of pulsars has been widely used to detect interstellar cloud physical properties to study the Kolmogorov spectrum. When a pulsar is located behind an SNR, even behind the shock region, we could use it to detect the turbulence in the shock region with the same method used to study the interstellar electron clouds. Since most pulsars are faint (previous studies usually use pulsars with flux larger than 20 mJy at 400 MHz), a more sensitive telescope like SKA is needed to do this work.
3. Energy conversion rate and nonlinear effect
To explain the observed CRs energy density, an energy conversion rate of about ~10% is needed. In the nonlinear DSA theory, the conversion rate in effective CRs acceleration shock can reach up to 50%. However it is not true for some SNRs. One case is Cas A. Abdo et al. (2010) claimed [176] that only less than 2% of the total energy is used to accelerate CRs. LHAASO may push this study further by measuring and modeling many SNR energy spectra with high sensitivity and broad energy coverage and give more accurate conversion rate estimates to a sample of SNRs.
A general condition for the 10% conversion rate is a Galactic supernova explosion rate of 2-3 per century. Considering the typical life time of about 105 years for an SNR, the total number of Galactic SNRs should be more than 1000. This is much larger than ~300 SNRs currently detected in our Galaxy. Is this gap real or just because we miss lots of SNRs due to observation selection effects? For the first one, we need reconsider the theory of SNR paradigm. For the second one, we need to find the missing ones. Previous Galactic radio surveys are usually sensitivity limited or resolution limited which lead to the failed detection of old, faint, large remnants or young, small remnants. The ability of SKA (high resolution, sensitivity, and big field of view) gives us a chance to discover the missing SNRs in our Galaxy. It will answer how many SNRs are in our Galaxy and even tell us how the SNRs are distributed in our Galaxy. The total number of SNRs is critical to answer whether they are the main accelerator of Galactic CRs. The distribution of SNRs affect the CRs injection model which is important when modeling the diffuse γ-ray emission of our Galaxy.
Another way to find SNRs is to identify the lower energy counterparts of unidentified GeV/TeV sources. One example is the discovery of SNR G353.6-0.7 which is the first SNR discovered at TeV band and then identified at radio band [177]. Till now, more than 200 TeV sources have been discovered, however, more than 1/3 of them have no lower energy counterparts [178]. It is undoubted that LHAASO will find more TeV sources and some of them should be SNRs. The combination of SKA and LHAASO, will identify those missing SNRs, which allows us a compelling population study of the conversion rate problem.
When the energy is effectively converted into CRs, the shock structure will be modified that will lead to a curvature of electron spectrum with spectral hardening toward high energies. It has been claimed that this effect was detected for a few SNRs [179], but there are still lack of a large sample and spatially detailed studies, e.g. more convincing nonlinear effect towards TeV SNRs. To do this study, the SKA and LHAASO need work together.
-
When CRs are accelerated to high energies in SNRs and the shock also slows down, the CRs will propagate diffusively from SNRs to the Galaxy. These CRs interact with the interstellar medium forming the non-thermal diffuse background emissions from radio to γ-ray bands.
1. Escape
The escaped CRs take energy away from their mother SNRs. Therefore it is a possible explanation why some TeV bright SNRs have a very low energy conversion rate. One case for CRs escape is from the Fermi observation of W44 in the GeV band [180]. While, for young SNRs like Cas A, the escaped CRs should have very high energy. These CRs can interact with surrounding materials and produce TeV emission. Compared with CTA, LHAASO has higher sensitivity to extended sources, which makes it a perfect facility to detect the TeV halo surrounding young SNRs. Since pion decay also depends on the material density, the infrared, centimeter or millimeter observations are also needed to derive the density distribution surrounding SNRs. High energy CRs will escape earlier and faster than lower energy CRs, so the halo may also have a GeV/TeV ratio change with distance away from the SNR. But the angular resolution of LHAASO is low, so CTA is more suitable for this kind of studies.
2. Distribution
The energy distribution of electrons can be obtained via modeling the diffuse emission from radio to γ-ray bands. Their spatial distribution can be obtained via measuring the emissivity of electrons from radio observations with the help of absorption from HII regions and planetary nebulae. The first one will only give two dimensional information and the second one may map the three dimensional electron distributions.
By employing the 21 months Fermi data, [181] used the GALPROP software to analyse the Galactic diffuse γ-ray emission. Their work successfully reproduces the observed γ-ray emission and gives the γ-ray composition and contributions from electrons and protons, respectively. However, they do not consider whether the electrons and protons, which are used to model γ-ray emission, could produce the observed radio emission or not. A combination modeling of radio and γ-ray is necessary. However, the angular resolution of current radio surveys in frequency of a few tens MHz to a few hundreds MHz is poor (usually worse than 1 degree) and can not effectively separate point sources from diffuse emission. SKA can provide the needed high resolution low frequency radio data and LHAASO will supplement the high energy TeV data.
Generally speaking, if we could get the synchrotron emission and magnetic field information at each position, it is possible to give a three dimensional model of electron distribution in our Galaxy. The only problem is how to get the distance information for synchrotron emission. A long time ago, people have noticed that HII regions can absorb the background low frequency radio emission though free-free absorption. This gives us a chance to estimate averaged foreground synchrotron emissivity as the background emission has been screened. Furthermore, if there are many HII regions distributed close to one line of sight, we could even estimate the emissivity between those HII regions. Figure 25 displays the relation between optical depth and frequency for typical HII regions and planetary nebulae [182].
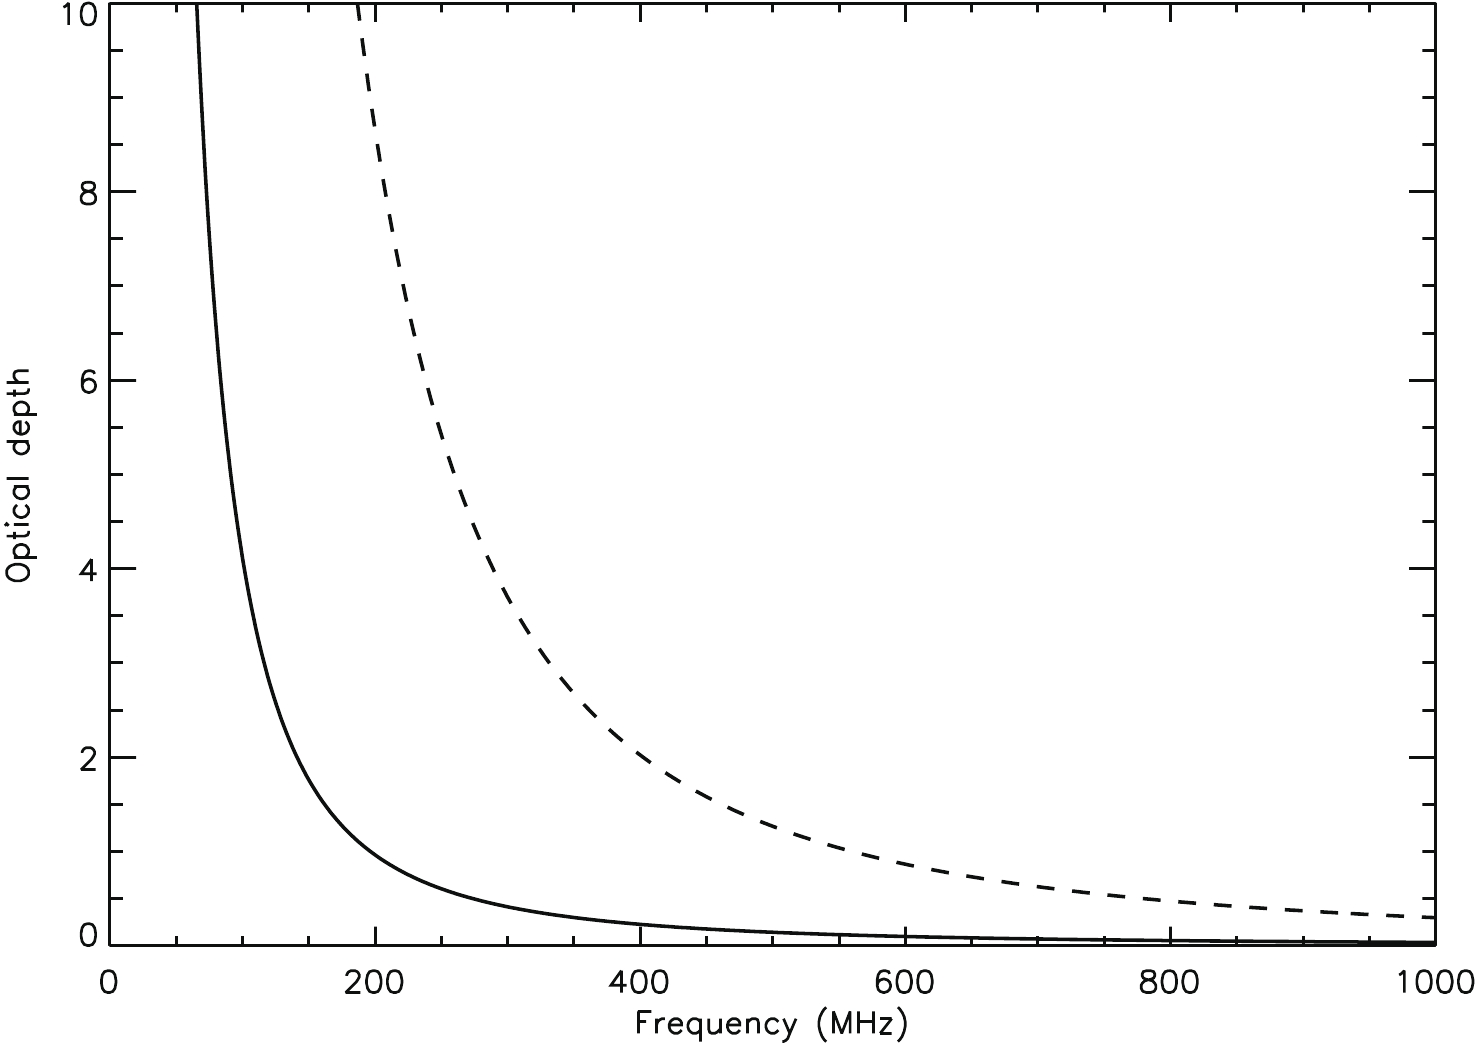
Figure 25. Optical depth vs observation frequency of typical HII region and planetary nebulae. The solid line is for HII with temperature
$T_{\rm e}$ = 10000 K, electron density$n_{\rm e}$ = 100 cm-1, size Δl = 10 pc. The dashed line is for planetary nebulae with temperature$T_{\rm e}$ = 10000 K, electron density$n_{\rm e}$ = 3000 cm-1, size Δl = 0.1 pc.Figure 26 shows the spatial distribution of HII regions and planetary nebulae [182]. For HII regions, they are big, so easy to be detected. Their distances are also easily determined. However, the total number of known HII regions is small and they are mainly located on the Galactic plane. For planetary nebulae, their distribution is wider than HII regions, so they can be used to estimate the emissivity of middle latitude regions. The total number of planetary nebulae is big and planetary nebulae become optical thick at higher frequency which mean they can measure the emissivity at broader region and dynamical range. The disadvantages are that their sizes are small and measuring the distances are not easy for most of them.

Figure 26. The distribution of HII regions (upper) and planetary nebulae (lower) in Galactic coordinates.
Currently, only a few tens absorption features from HII regions have been detected and no absorption detections for planetary nebulae. The main problem is due to the poor angular resolution and sensitivity of current low frequency radio surveys. SKA has enough resolution (such as a few arcsecond) and sensitivity to carry out this study. This will be a great step to know the CRs-electron's distribution in our galaxy.
-
It has been long considered that SNRs are the origin of primary Galactic Cosmic Rays, and the diffusive shock acceleration is regarded as the main acceleration mechanism. CRs are accelerated at SNRs and then diffuse in the Galaxy due to magnetic turbulence, suffering from fragmentation and energy losses in the interstellar medium (ISM) and interstellar radiation field (ISRF), and other processes. Considering those processes, the CRs propagation equation can be written as
$ \begin{aligned}[b] \frac{\partial \psi(\vec r, p, t)}{\partial t}=& Q(\vec r,p,t)+ \nabla \cdot (D_{xx} \nabla \psi- V_{c} \psi) \\& + \frac{\partial}{\partial p}p^2D_{pp}\frac{\partial}{\partial p}\frac{1}{p^2}\psi -\frac{\partial}{\partial p}\left[\dot p \psi- \frac{p}{3}(\nabla \cdot V_c \psi)\right] \\& -\frac{\psi}{\tau_f}-\frac{\psi}{\tau_r}, \end{aligned} $

(1) where
$ \psi(\vec r, p, t) $ is the density of CR particles per unit momentum p at position$ \vec r $ ②,$ Q(\vec r, p, t) $ is the source distribution,$ D_{xx} $ is the spatial diffusion coefficient,$ V_c $ is the convection velocity,$ D_{pp} $ is the diffusive reacceleration coefficient in momentum space,$ \dot p \equiv \dfrac{{\rm d}p}{{\rm d}t} $ is momentum loss rate, and$ \tau _f $ and$ \tau_r $ are the characteristic time scales for fragmentation and radioactive decay respectively.In the conventional model (CM), CR diffusion is assumed to be uniform in space and only energy-dependent, and the diffusion coefficient is parametrized as
$ D_{xx} = \beta D_0 (\rho/\rho_0)^\delta $ , a function where ρ is the rigidity and δ reflects the property of the ISM turbulence. The reacceleration can be described by the diffusion in momentum space and the momentum diffusion coefficient$ D_{pp} $ is coupled with the spatial diffusion coefficient$ D_{xx} $ as [183].$ D_{pp}D_{xx} = \frac{4p^2v_A^{2}}{3\delta(4-\delta^2)(4-\delta)\omega}, $

(2) where
$ v_A $ is the Alfvén speed, and ω is the ratio of magnetohydrodynamic wave energy density to magnetic field energy density, which can be fixed to 1 for strong turbulence. In this formula, the observed CRs are modulated by three main processes: injection, propagation and solar modulation.It is generally believed that SNRs are the sources of Galactic CRs. The spatial distribution of SNRs is usually described by the following empirical formula:
$ f(r,z) = \left( \frac{r}{r_\odot} \right)^a \exp\left( -b\cdot\frac{r- r_\odot}{r_\odot} \right)\exp\left( -\frac{\left|z\right|}{z_s} \right), $

(3) where
$ r_\odot = 8.5 $ kpc is the distance from the Sun to the Galactic center,$ z_s\approx0.2 $ kpc is the characteristic height of the Galactic disk, a = 1.25 and b = 3.56 are adopted from [184], which are suggested from Fermi studies on diffuse γ-ray emission in the 2nd Galactic quadrant [185]. The accelerated spectrum of primary CRs at source region is assumbed to be a broken power law function:$ q(p) = q_0\times \left \{ \begin{array}{ll} (p/p_{\rm br})^{-\nu _1} & {\rm if} (p<p_{\rm br}), \\ (p/p_{\rm br})^{-\nu _2}\cdot f(\hat p)& {\rm if} (p\geq p_{\rm br}) \end{array} \right. $

(4) where p is the rigidity,
$ q_0 $ is the normalization factor for all nuclei, relative abundance of each nuclei follows the default value in GALPROP or DRAGON package.$ p_{\rm br} $ is the broken energy and$ \nu_1,\nu_2 $ are the spectrum indexes before and after the broken energy$ p_{\rm br} $ , respectively.$ f(\hat p) $ is used to describe the high energy cut-off.Recent measurements have shown a spectral hardening for the CR proton and He at several hundreds GeV, which suggests a new component in the CR spectra. By assuming that this spectral hardening origins from the propagation process, a spatial dependent diffusion is introduced and attributed to different magnetic turbulence between the galactic plane and the outer galaxy region.
As described in [186], a 1D spatial-dependent diffusion model, the two halo model (THM), has been studied and can give a good description of the primary proton and He spectra. As described by the THM, the diffusion process of the CRs can be separated into two regions, the inner halo and the outer halo. The inner halo contains the galactic plane with a lower diffusion coefficient owing to a higher magnetic confinement, and the outer halo is the rest region with a higher diffusion coefficient. The scenario is shown in Fig. 27. Based on the discussion about the THM, the spatial-dependent diffusion coefficient,
$ D_{xx} $ , depends on both the spatial coordinates$ (r,z) $ and the particle rigidity, which is parameterized as [187]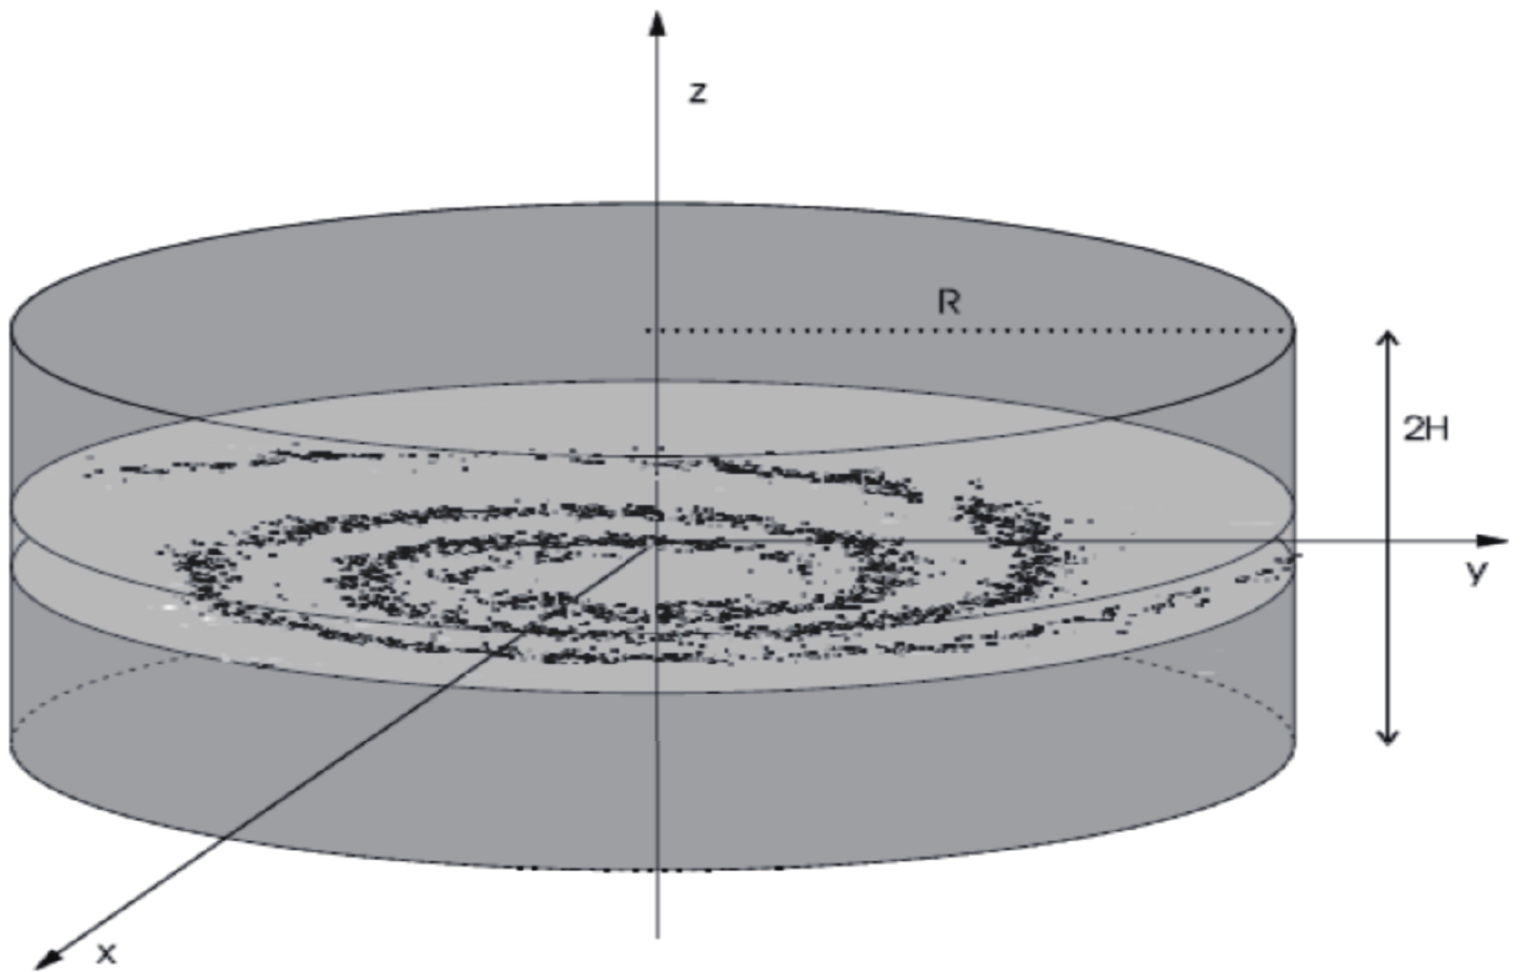
Figure 27. The cartoon of two halo physical scenario.
$ D_{xx}(r,z,\rho) = \left \{ \begin{array}{lll} \eta(r,z)\beta\left(\dfrac{\rho}{\rho_0}\right)^{\varepsilon(r,z)}, &|z|<\xi z_h & ({\rm disk})\\ D_0\beta\left(\dfrac{\rho}{\rho_0}\right)^{\delta_0} , &|z|>\xi z_h & ({\rm halo}) \end{array} \right. $

(5) where β is the velocity of the particle in unit of the light speed c,
$ D_0 $ represents the normalization of the halo diffusion efficient at$ \rho_0 = 4 $ GV,$ \delta_0 $ characterizes the rigidity dependence of the diffusion coefficient,$ \xi z_h $ denotes the thickness of the disk,$ \eta(r,z) $ and$ \varepsilon(r,z) $ describes the spatial dependence of the diffusion coefficient in the disk.$ \eta(r,z) $ and$ \varepsilon(r,z) $ can be related to the source distribution.The numerical code DRAGON is used to calculate the spatial dependent diffusion of CRs [194]. Figure 28 shows the model calculation results for the Z-dependent scenario to compare with the data. In this figure, panels (a)-(c) are the spectra of protons, Helium, and p+He, corresponding to three different data set of the light component knee as described above. The model parameters are also different. Panel (d), (e), and (f) is for C and O, for Mg, Al, and Si, and for Fe, respectively. Panels (g)-(i) are for the all-particle spectra. It is obvious that CREAM data prefers a relatively lower energy knee of the light components, which under-shoots the all-particle spectra. The KASCADE data gives the highest energy of the knee, which slightly over-shoots, but nevertheless is roughly consistent with the all-particle spectra. The Tibet AS data, taken at high altitude close to the shower maximum depth, are expected to provide the best reference for the all-particle spectrum. In all these fittings, it seems that there is some tension between the CREAM data and the ground-based measurements. However a good agreement is found between CREAM and ARGO-YBJ measurements concerning the spectrum of the light component (see Fig. 11).
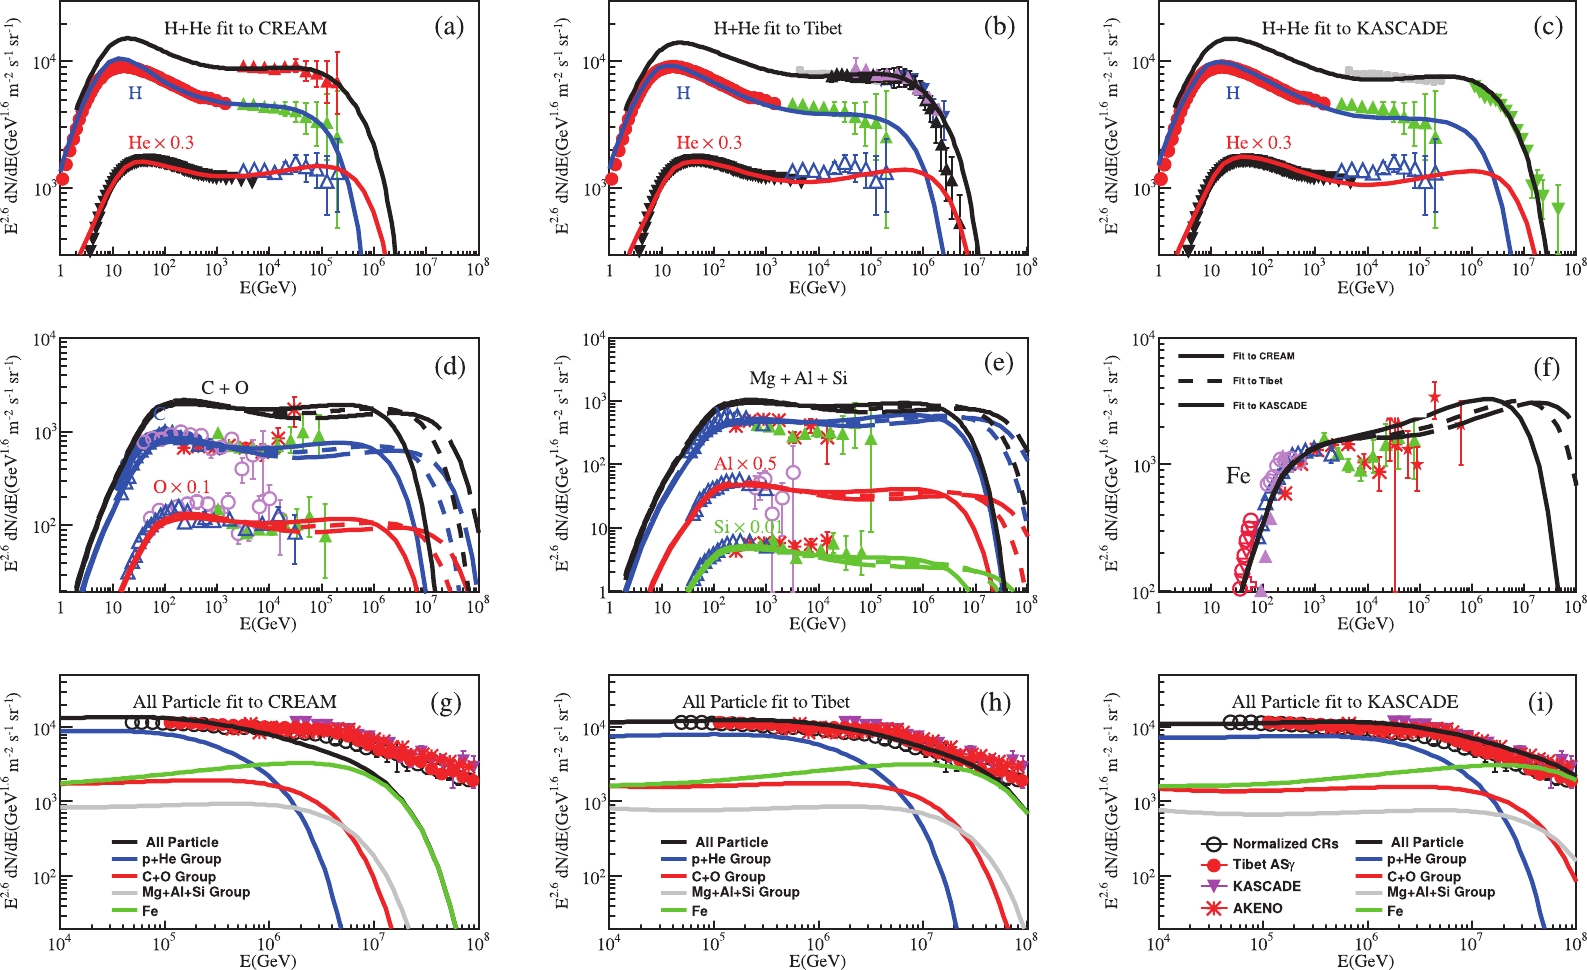
Figure 28. (color online) The comparison between the model calculations and the experimental data for the Zdependent cases. The proton data are from: AMS-02 [4], CREAM [1], ATIC-2 [43]; the Helium data are from: AMS-02 [5], CREAM [1]; ATIC-2 [43]; the Carbon, Oxygen, Magnesium, Aluminium, Silicon, and Iron data are from: HEAO-3 [188], the proton + Helium data are from: KASCADE [189], Tibet-ASγ [190], ARGOWFCTA [69], ARGO-YBJ [191, 192]; the allparticle data are from: Tibet-ASγ [17], KASCADE [189], Akeno [16], and the normalized allparticle spectrum is from [193].
In general, as shown in Figs. 9 and 10, discrepancies between the direct measurements of different detectors may become increasingly larger at the highest energies approaching 100 TeV, due to both statistical and systematic uncertainties. For example, the proton and Helium spectra by CREAM [1] differ much from that by ATIC-2 [43]. A direct comparison of the AMS-02 measured fluxes of Helium and that by CREAM shows that the CREAM ones are higher by about 20% at 1 TeV/nucleon [5]. The spectrum measured by AMS-02 is also softer than that by CREAM. Further more precise measurements of the energy spectra of various species, by e.g., ISS-CALET [195], DAMPE [196], and LHAASO [197] will be very important to address this issue and better determine the model parameters.
-
As illustrated in the previous Section, the energy spectrum of cosmic rays follows roughly a power-law shape from about
$ 10^{10} $ eV to$ 10^{20} $ eV and is characterized by many features. The slope changes at least at three points, one around 3 PeV energy where the spectral index steepens from -2.7 to -3.1, the so-called knee, another around 80 PeV, the second knee, and then around$ 5\times10^{18} $ eV, the so-called ankle, where the spectrum again flattens. Any viable model of origin and propagation of cosmic rays has to explain all these features that contain the imprints of the energy spectra of each cosmic ray component. The measurement of spectra of five mass groups (p, He, CNO, MgSi, Fe) up to$ 10^{17} $ eV should be a high priority for LHAASO. The approach based on an event-by-event classification, which has a low dependence on hadronic interaction models and can be used for anisotropy studies, appears very promising with respect to the traditional reconstruction of the cosmic ray elemental composition carried out by means of complex unfolding techniques, procedures that heavily depend on the hadronic interaction model. Indeed LHAASO consists, in its basic configuration, of four types of detectors which may provide the lateral distribution and the size of the soft and muon shower components, the particle density near the shower core, and the image of the Cherenkov light produced along the longitudinal development of the shower. A large area densely instrumented enabling sensitive measurements up to$ 10^{17} $ eV, and a high altitude site approaching the atmospheric depth of maximum development of showers, where fluctuations are smaller and all nuclei produce the same electromagnetic size in a large energy range, are prominent figures of merit of LHAASO. The envisaged strategy to exploit, event-by-event, the experimental observables may be implemented through the following steps:● combining the experimental observables in order to obtain an energy estimator and a set of mass sensitive parameters.
● use of selection criteria or multivariate analysis to separate the event samples according to the nature of the primary cosmic ray or mass group.
● estimate of the purity of the selected samples.
This program has been pursued using data obtained from the simulation of the shower development and detector response, based on CORSIKA and dedicated codes for each detector. The performance of the ‘simulated LHAASO’ is then applied to determine the spectrum of the light components in a wide energy range up to 10 PeV including the knee of the all-particle spectrum, and to reconstruct the heavy nuclei spectrum above 10 PeV (see Secs. II.D, II.E, and II.F). The envisaged implementation of the basic layout with neutron detectors and antenna for radio-detection will add further EAS observables sensitive to the nature of primary particles with energies above
$ 10^{15} $ eV. The expected results based on preliminary studies are reported in Sec. II.g and Sec. II.H. -
The LHAASO layout has been extensively described in Chapter 1. However we find convenient to shortly recall here some of its main features.
The Large High Altitude Air Shower Observatory (LHAASO) consists of a 1.3 km2 EAS array (KM2A), a water Cherenkov detector array (WCDA), a wide field of view Cherenkov/fluorescence telescope array (WFCTA). KM2A includes 5195 scintillator detectors, with 15 m spacing, for electromagnetic particle detection and 1188 underground water Cherenkov tanks (36 m2 each), with 30 m spacing, for muon detection.
A comparison with other large experiments concerning the number and active area of the deployed electron and muon detectors is reported in Table 1, singling out the relevance of this installation to reconstruct the lateral distribution of the main shower components.
Experiment depth/(g/cm)2 Detector ΔE/eV e.m. Sensitive area/m2 Instrumented area/m2 Coverage ARGO-YBJ 606 RPC/hybrid $3\times 10^{11} - 10^{16}$ 

6700 11,000 0.93 (central carpet) BASJE-MAS 550 scint./muon $6\cdot 10^{12}-3.5\cdot 10^{16}$ 

$10^4$ 

TIBET ASγ 606 scint./burst det. $5\times 10^{13}-10^{17}$ 

380 $3.7\times 10^4$ 

$10^{-2}$ 

CASA-MIA 860 scint./muon $10^{14}-3.5\cdot 10^{16}$ 

$1.6\times 10^3$ 

$2.3\times10^{5}$ 

$7\times 10^{-3}$ 

KASCADE 1020 scint./mu/had $10^{15}-10^{17}$ 

$5\times10^{2}$ 

$4\times 10^{4}$ 

KASCADE-Grande 1020 scint./mu/had $10^{16}-10^{18}$ 

$370$ 

$5\times 10^{5}$ 

$7\times10^{-4}$ 

Tunka 900 open Cher.det. $3\cdot10^{15}-3\cdot10^{18}$ 

− $10^{6}$ 

− IceTop 680 ice Cher.det. $10^{15}-10^{18}$ 

$4.2\times 10^2$ 

$10^{6}$ 

$4\times 10^{-4}$ 

LHAASO 600 Water C
scint./mu/had
Wide FoV Cher.Tel$3\times10^{11}-10^{18}$ 

$5.2\times 10^3$ 

$1.3\times 10^{6}$ 

$4\times 10^{-3}$ 

[KM2A]Muon detectors Experiment m asl µ Sensitive area/m2 Instrumented area /m2 Coverage LHAASO 4410 $4.2\times10^{4}$ 

$10^{6}$ 

$4.4\times10^{-2}$ 

TIBET ASγ 4300 $4.5\times 10^{3}$ 

$3.7\times 10^{4}$ 

$1.2\times10^{-1}$ 

KASCADE 110 $6\times10^{2}$ 

$4\times 10^4$ 

$1.5\times10^{-2}$ 

CASA-MIA 1450 $2.5\times10^{3}$ 

$2.3\times 10^5$ 

$1.1\times10^{-2}$ 

Table 1. LHAASO vs other EAS arrays.
WCDA consists of two 150 m × 150 m water pools plus one of dimensions 300 m × 110 m, all filled to a depth of 4.5 m. The total area is about 78000 m2 divided in 3120 cells of size 5 m × 5 m each. The first pond of 150 m × 150 m (WCDA-1) is equipped with 900 pairs of 8-inch and 1.5-inch of PMTs to enhance the dynamical range. The other ponds are equipped with pairs of 20-inch and 3-inch PMTs.
WFCTA is composed of 18 telescopes each consisting of a segmented spherical mirror of 4.7 m2 with a SiPM based camera installed at its focal plane. Each camera has a 16° × 16° FoV and is equipped with 1024 pixels each with a size of about 0.5° × 0.5°. The telescopes are arranged in a mobile design allowing the array to cover a wide patch of the sky for diffused cosmic ray measurements in both Cherenkov and fluorescence mode. They can work also with full Moon light, except the case of Moon directly in their FoV, with increased energy threshold, achieving a large duty cycle.
More details concerning construction, calibration and performance of these detectors can be found in Chapter 1. A schematic drawing of the LHAASO layout is shown in Fig. 29. Combining and integrating the information delivered by all detectors WCDA, KM2, WFCTA, it is possible to explore the energy range up to about 10 PeV selecting showers with core inside KM2A or WCDA. At low energies below 100 TeV, the LHAASO measurements will thus overlap with those from space detectors. At higher energies above 10 PeV WCDA cannot be used to sample the shower core due to saturation problems, and the mass sensitive parameters will be mainly obtained from the KM2 and WFCTA data. Figure 30 shows a simulated shower event induced by a 20 PeV iron nucleus as imaged by the LHAASO detectors. The map of hits in the scintillator array, muon counter array and the Cherenkov image in the cameras are shown (from left to right). According to the shower geometry determined by the scintillator counter array the impact parameter
$ R_{p} $ , the distance between the Cherenkov image and the core location on the ground, is about 200 m.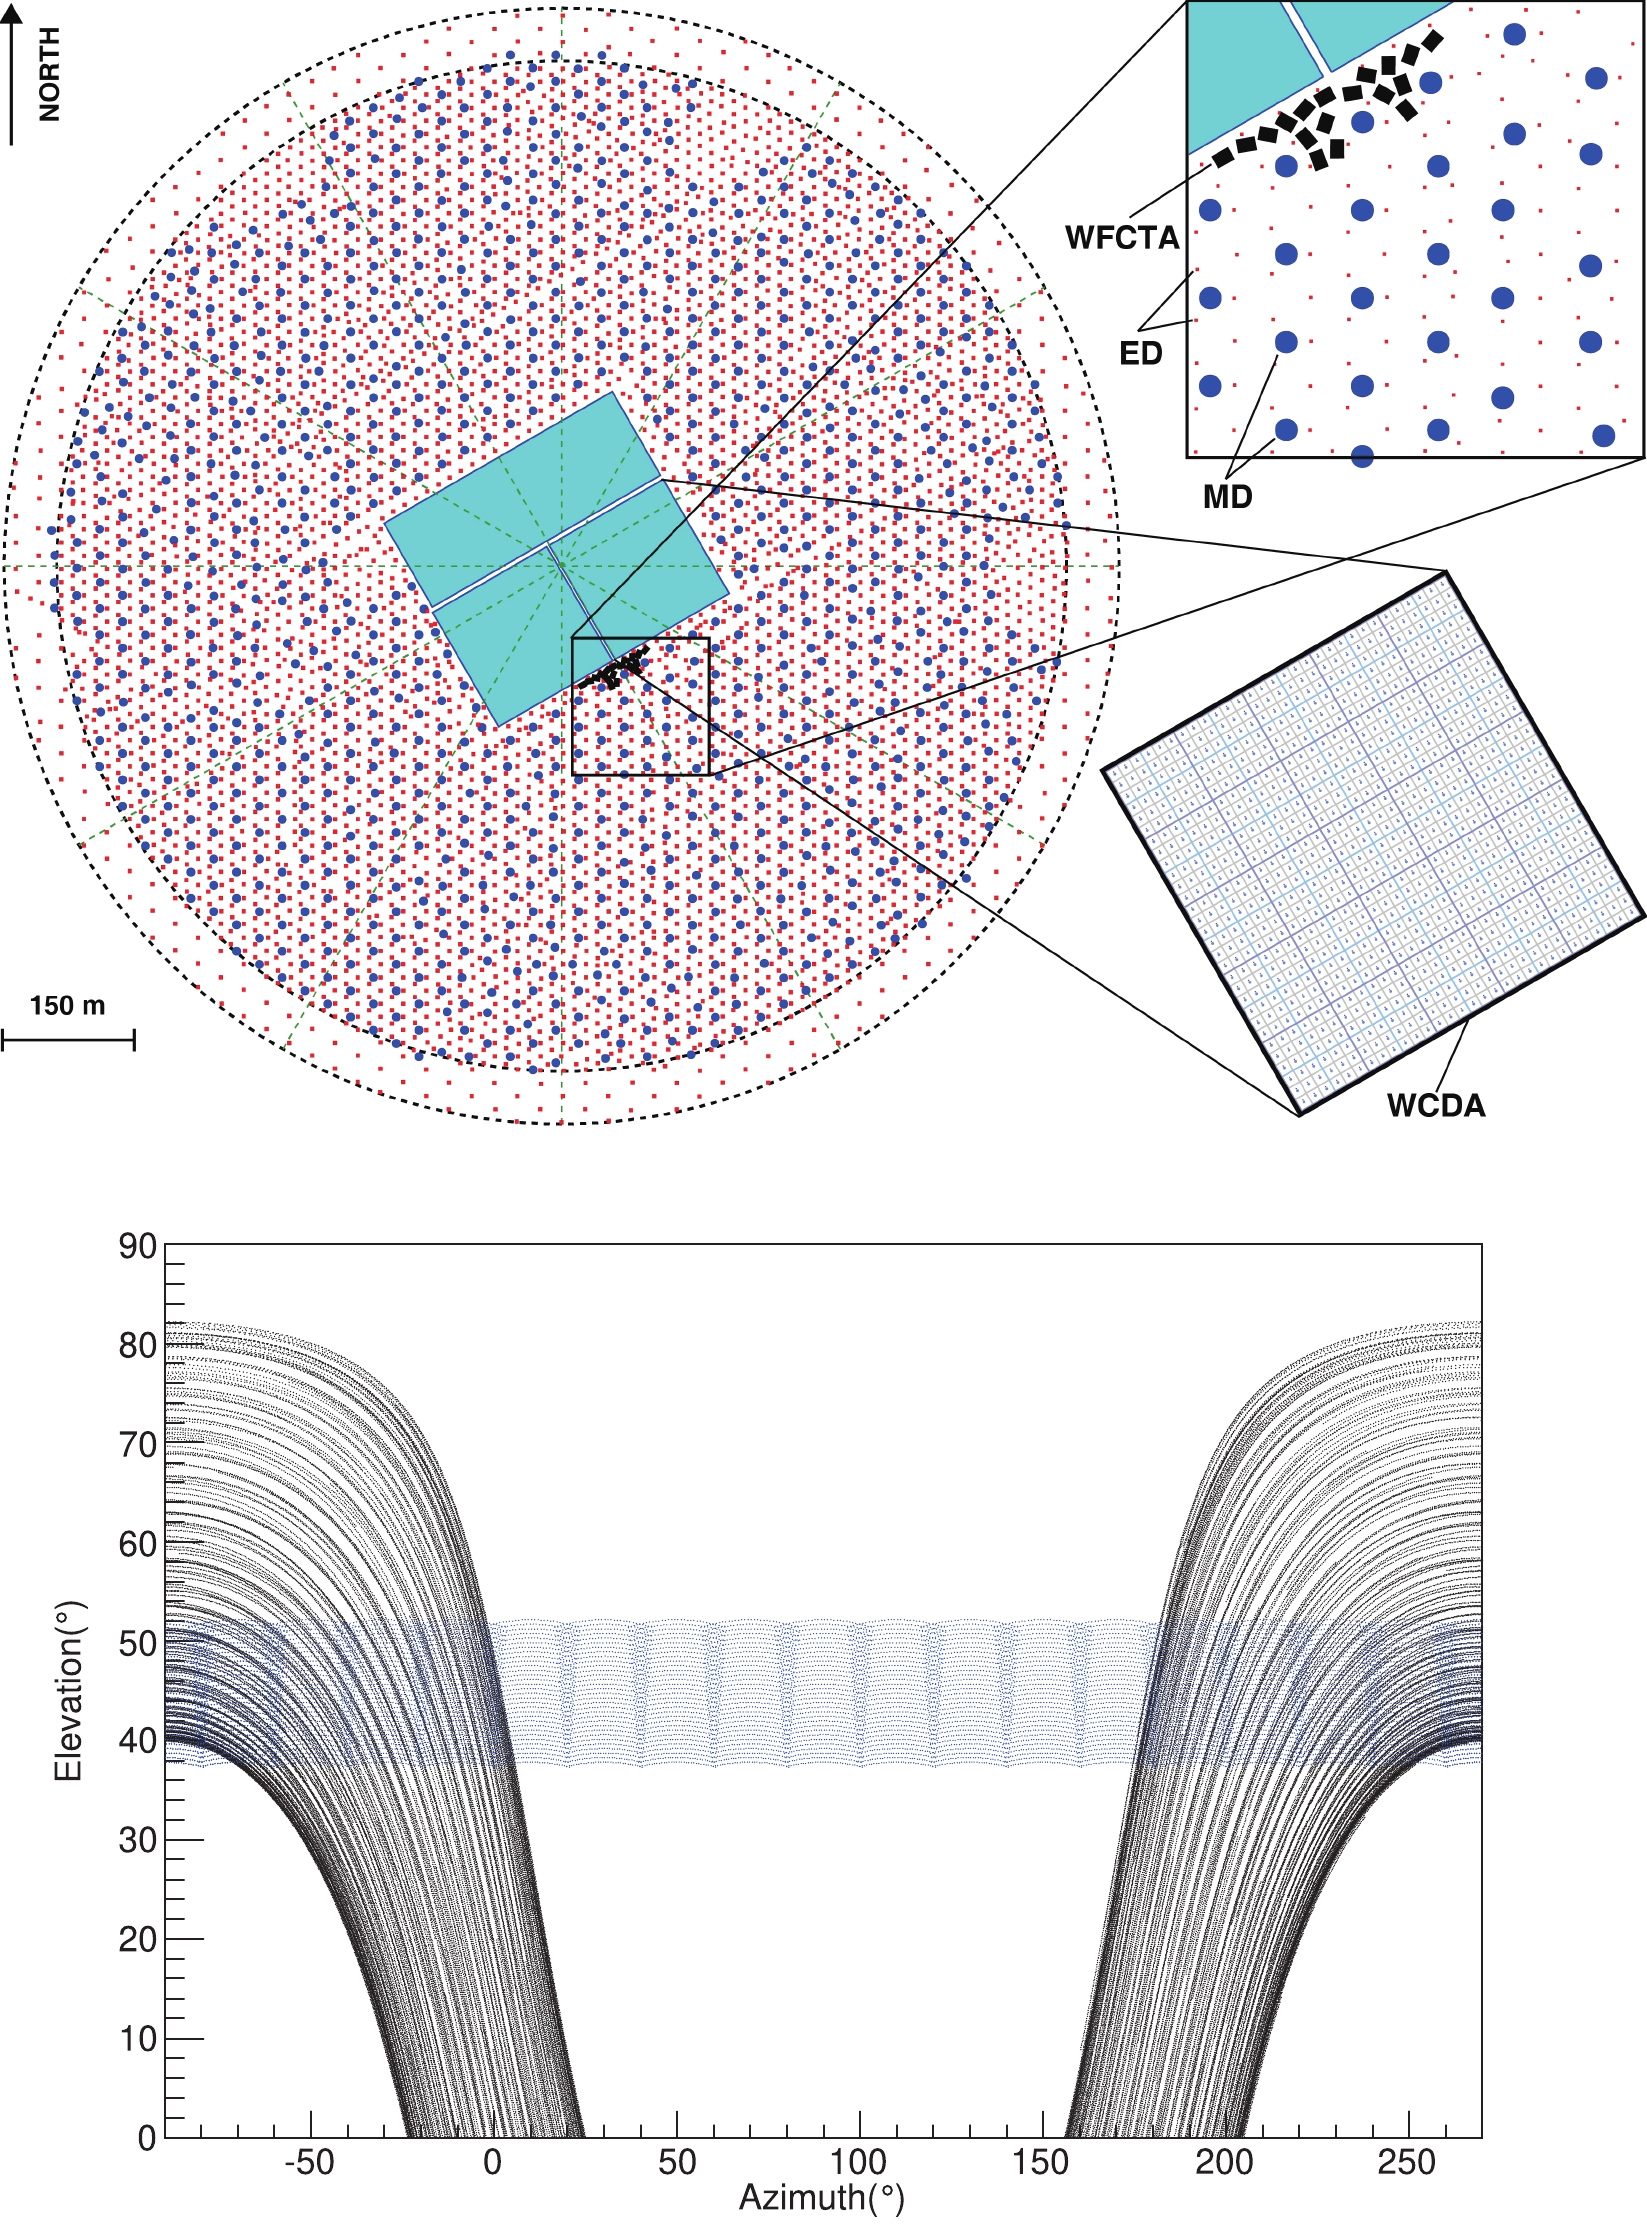
Figure 29. (color online) The layout of the scintillator counter (small dots) array, muon counter (big dots) array, water Cherenkov detector (rectangle in the center) array and the location of the wide field of view (FoV) Cherenkov telescope (small squares) array in the LHAASO experiment (upper panel). The FoV of the telescopes in the northern sky (lower panel). The azimuth angle 90° is the north direction. Curves in the sky indicate the trajectories of the moon in one year. The FoV of the array covers a ring in the sky with a 16° elevation width, from 37° to 53° as shown in the figure.

Figure 30. (color online) A 20 PeV iron induced shower as imaged by the LHAASO detectors. The maps of the scintillation counters and of the muon counters of KM2A are shown in the upper two panels. The dimensions of the points are proportional to the logarithm of the particle number, the color scale indicates the time (in 10−2 ns) of each hit. The image of the shower taken by the Cherenkov telescopes at a distance
$R_p\simeq$ 200 m is shown in the lower panel. The color scale indicates the number of photoelectronsFor observations above 100 PeV WFCTA will be operated to detect fluorescence light.
-
The basic information concerning the detector set up and operation is reported in Chapter 1. Here we shortly summarize the detector performance and describe the combination of the experimental observables currently studied to build up an energy estimator independent of composition and a set of mass sensitive parameters.
-
Showers are sampled by WCDA and KM2A at a fixed depth (600
$ /\cos \theta $ , θ being the zenith angle of the arrival direction) of their development in atmosphere. These detectors provide the basic information, namely the shower core position, the shower lateral profile, the arrival direction, the electron and muon content ($ N_{e} $ and$ N_{\mu} $ respectively) from which an energy estimate is obtained, as well as a first indication of the nature of the primary particle based on the ratio$ N_{\mu}/N_{e} $ . The Cherenkov image carries additional information about the shower energy, mainly from the total number of photons.KM2A. The charge output of each scintillation counter is used to measure the number of crossing shower particles with excellent linearity up to more than
$ 10^{4} $ particles. The shower trigger logic allows high efficient detection of shower events at an energy threshold of about 10 TeV. The signals from the scintillation counters are used to determine the impact point of the shower axis, the arrival direction, and fitting particle densities by a N-K-G like function, the shower profile. The electron size$ N_{e} $ , the muon number$ N_{\mu} $ and/or the particle density at a fixed distance may be used as energy estimators. The weighted combination of$ N_{e} $ and$ N_{\mu} $ is a robust way to determine an energy estimator insensitive to composition. Work to fix the best combination is in progress. An energy resolution of about 15%-40% is expected, depending on the shower energy and zenith angle of the arrival direction [198].WCDA. Each cell of the detector collects the Cherenkov light signals generated by the shower particles in the water. The total amount of Cherenkov photons is proportional to the energies carried by the particles, except muon traversing the water. The energy resolution depends on the shower energy and core location, with typical values in the 20%-35% range [199].
WFCTA. The Cherenkov image is an integration of the light yield along the longitudinal shower development in atmosphere and turns out to be an excellent estimator of the shower energy after corrections to account for the impact parameter
$ R_{{p}} $ , that is the distance between the telescope and the core location on the ground, and at a minor extent, for the angular offset$ \delta\theta $ of the centroid of the shower image from the shower arrival direction. Thus the shower energy is basically a function of the number of detected photoelectrons$ N_{\rm{pe}} $ and the impact parameter$ R_p $ (Fig. 31 upper). The energy resolution depends on these parameters, being about 20% with a bias less than 3% (Fig. 31 lower) [200].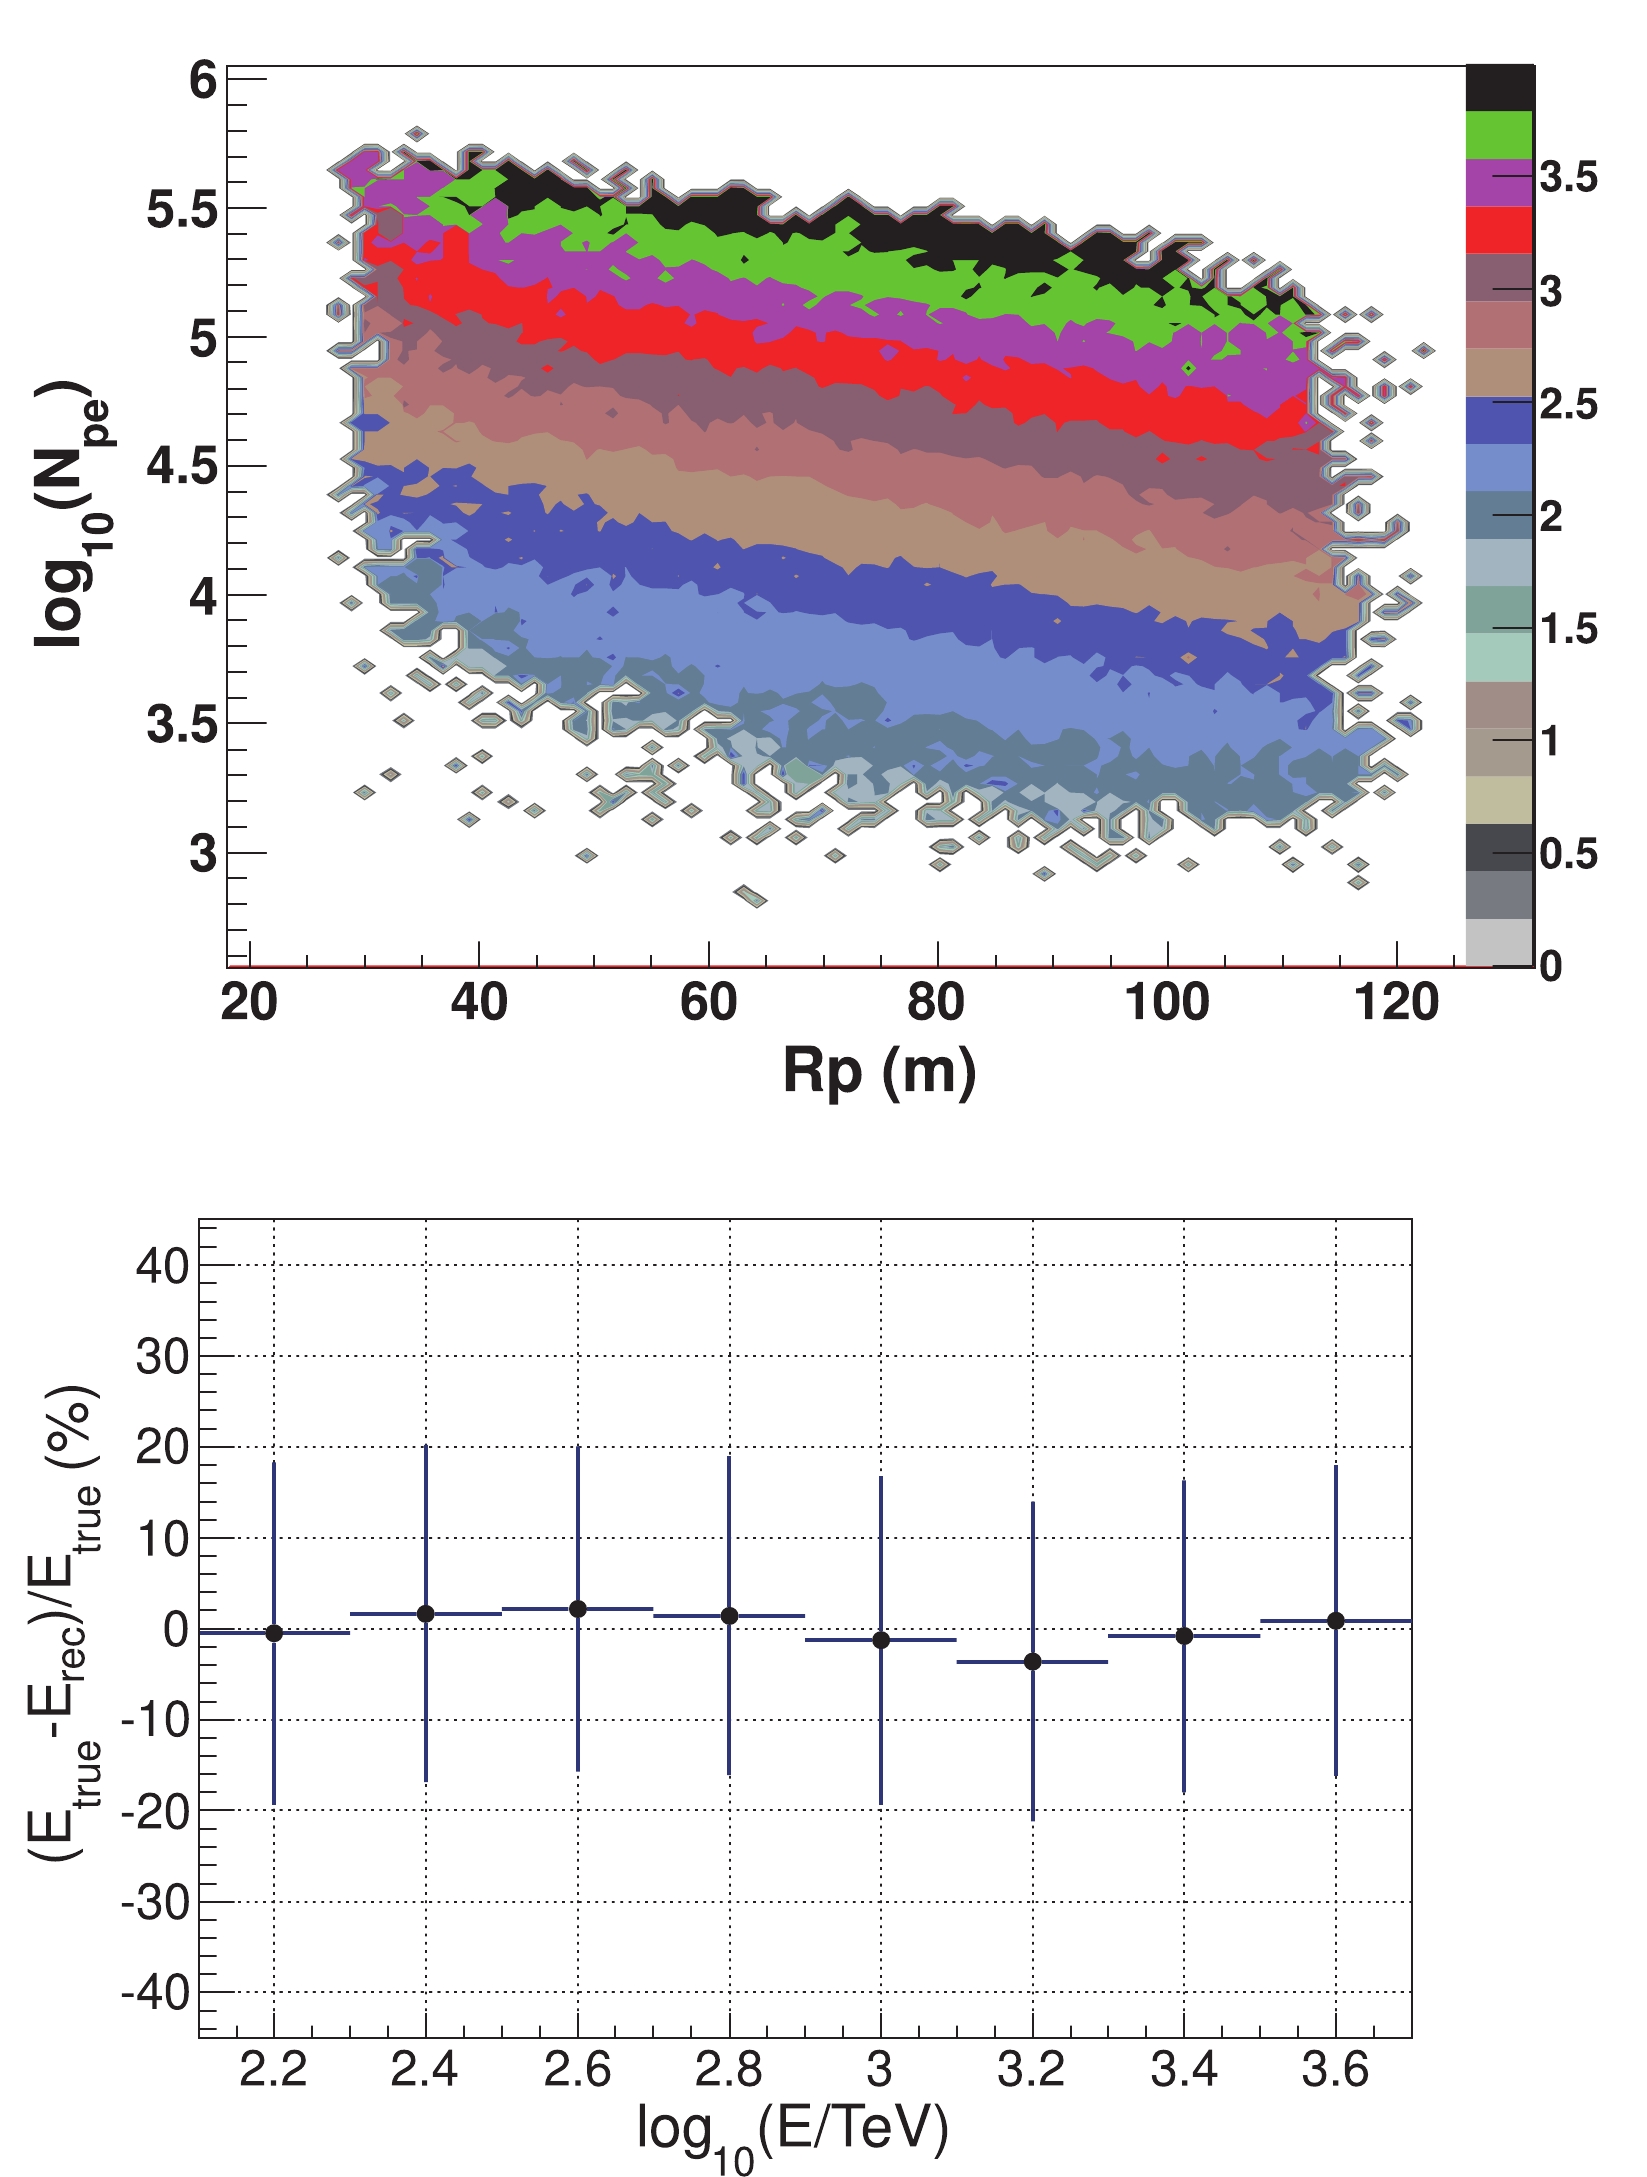
Figure 31. (color online) The total number of photoelectrons
$N_{\rm{pe}}$ as a function of the impact parameter$R_{{p}}$ for primary protons. The color scale represents the shower energy in bins of$\Delta \log_{10}E = 0.2$ , covering primary energies from 30 TeV to 10 PeV (upper). The shower energy resolution of the Cherenkov telescopes (vertical bars) as a function of the energy of primary protons. Etrue and Erec are the simulated and reconstructed energies, respectively. A bias less than 3% is visible (lower). -
The muon content, the particle density in the shower core, the depth in atmosphere of the shower maximum, and the length to width ratio of the Cherenkov image are experimental observables that can be correlated and combined to define a set of mass sensitive parameters. A preliminary study, based on Monte Carlo simulations (by Corsika version 74005 with EGS4 to simulate electromagnetic processes, and QGSJET-II04 and FLUKA to model high and low energy hadronic interactions respectively), has been carried out to identify the most suitable parameters allowing an efficient selection of showers generated by light primaries (protons and Helium nuclei) and by nuclei of the iron group. Indeed, an accurate measurement of the proton and iron spectra can allow to set the relevant energy scale for all the other components.
Two different cases have been envisaged in this study corresponding to events with shower core impacting on WCDA or on the surface instrumented with the KM2A detectors. They address different energy intervals, below 10 PeV in the first case and up to 100 PeV for showers with core landing on the large area of KM2A. The aim of the first selection is the study of the light component and the measurement of its spectrum across the knee of the all particle spectrum. Selecting showers with core on KM2A allows the collection a sufficient number of events covering the relevant energy range from 10 to 100 PeV where the knee of the galactic iron component is expected.
Mass sensitive parameters are obtained by a hybrid approach, simultaneously using Cherenkov light and particle data. What is crucial for the development of an air shower is the distribution
$ {\rm d}P/{\rm d}x = \text{exp}[- x/\lambda] $ of the first interaction point of the incoming cosmic ray, where x is the slant depth measured from the top of the atmosphere, and λ is the interaction length.At TeV-PeV energies the proton interaction length is about 80 g/cm2, while the interaction length for an iron nucleus is about 2.3 g/cm2. Thus showers initiated by light elements, such as protons and helium nuclei, penetrate more deeply into the atmosphere than those from heavier nuclei. That means that the particle density nearby the core is higher in proton-showers than that of iron-showers whose lateral extension is more spread. Thus the measurement of the particle density distribution around the core of showers landing on WCDA may provide a sensitive mass parameter.
Usually, the cells with the largest number of particles recorded,
$ N_{\max} $ , are the closest to the core of the event. The value of$ N_{\max} $ in cores due to a heavy nucleus is lower than that due to a light nucleus. Obviously,$ N_{\max} $ is energy dependent and, therefore, a normalization procedure is necessary before it can be used to assess the composition. According to the simulation,$ N_{\max} $ is proportional to$ (N_{0}^{\rm pe})^{1.44} $ , where$ N_{0}^{\rm pe} $ is the total number of photo-electrons measured by WFCTA normalized for$ R_p = 0 $ and α =$ 0^{\circ} $ .A good indicator of the shower composition is the reduced parameter,
$ p_{\max} $ , defined as$ p_{\max} = \log_{10}\big(N_{\max}\big) - 1.44\cdot \log_{10}\big(N_{0}^{\rm pe}\big). $

(6) The other mass sensitive parameter is the total number of photoelectrons measured by the WCDA,
$ N_{\rm WCDA}^{\rm pe} $ . Obviously,$ N_{\rm WCDA}^{\rm pe} $ is primary energy dependent. The reduced parameter$ p_{Npe}^{\rm WCDA} = \log_{10}\big(N_{\rm WCDA}^{\rm pe}\big)-1.18\cdot \log_{10}\big(N_{0}^{\rm pe}\big), $

(7) may serve as a good indicator of the shower composition.
Another consequence is that the proton initiated showers develop to their maximum deeper in atmosphere than ones from heavy nuclei. The atmospheric slant depth of shower maximum,
$ X_{\max} $ , is the traditional mass sensitive parameter, which can be reconstructed from the Cherenkov image with a resolution of about 50 g/cm2 (see Sec. II.F). Since$ X_{\max} $ depends on the primary energy, a good indicator of the primary mass is the reduced parameter$ p(X_{\max}) = X_{\max} - k\cdot\log_{10} N_0^{\rm{pe}}\, $ where$ k = 49 $ is a fitting parameter.The Cherenkov images look like an ellipse and are more stretched,i.e. narrower and longer, for showers more deeply developed in atmosphere. The ratio of the length to the width (
$ L/W $ ) is therefore a good parameter that is sensitive to the nature of the primary particle. It is also known that the image is more elongated when the shower is farther away from the telescope, i.e. the image becomes longer and narrower for showers located farther away. Before they are used as indicators of the composition, images must be normalized to showers with different impact parameters,$ R_p $ . Furthermore, the images are also more stretched for the more energetic showers. According to simulation, the ratio$ L/W $ of images is linearly proportional to$ R_p $ and$ N_{0}^{\rm pe} $ . The reduced parameter$ L/W-0.018R_p + 0.28\log_{10}N_{0}^{\rm pe} $ , denoted as$ p_C $ , is related to the primary cosmic ray mass.Muons in air are mostly from decay of charged pions and kaons. They do not multiply but only lose energy by ionization. The muon content of a shower builds up to a maximum then attenuates very slowly. On the contrary, the electron component attenuates relatively rapidly after maximum. At a fixed observation level the electron number
$ N_e $ is smaller for a heavy nucleus initiated shower than for a proton-shower of the same energy, whereas the low energy muon number$ N_\mu $ (> 1 GeV) is larger approximately of a factor$ A^{1-p} $ with$ p \approx 0.86-0.93 $ according to different hadronic interaction models [27].The ratio
$ N_\mu/N_e $ for vertical shower at the LHAASO altitude (4410 m a.s.l.), obtained by CORSIKA, is shown in Fig. 32.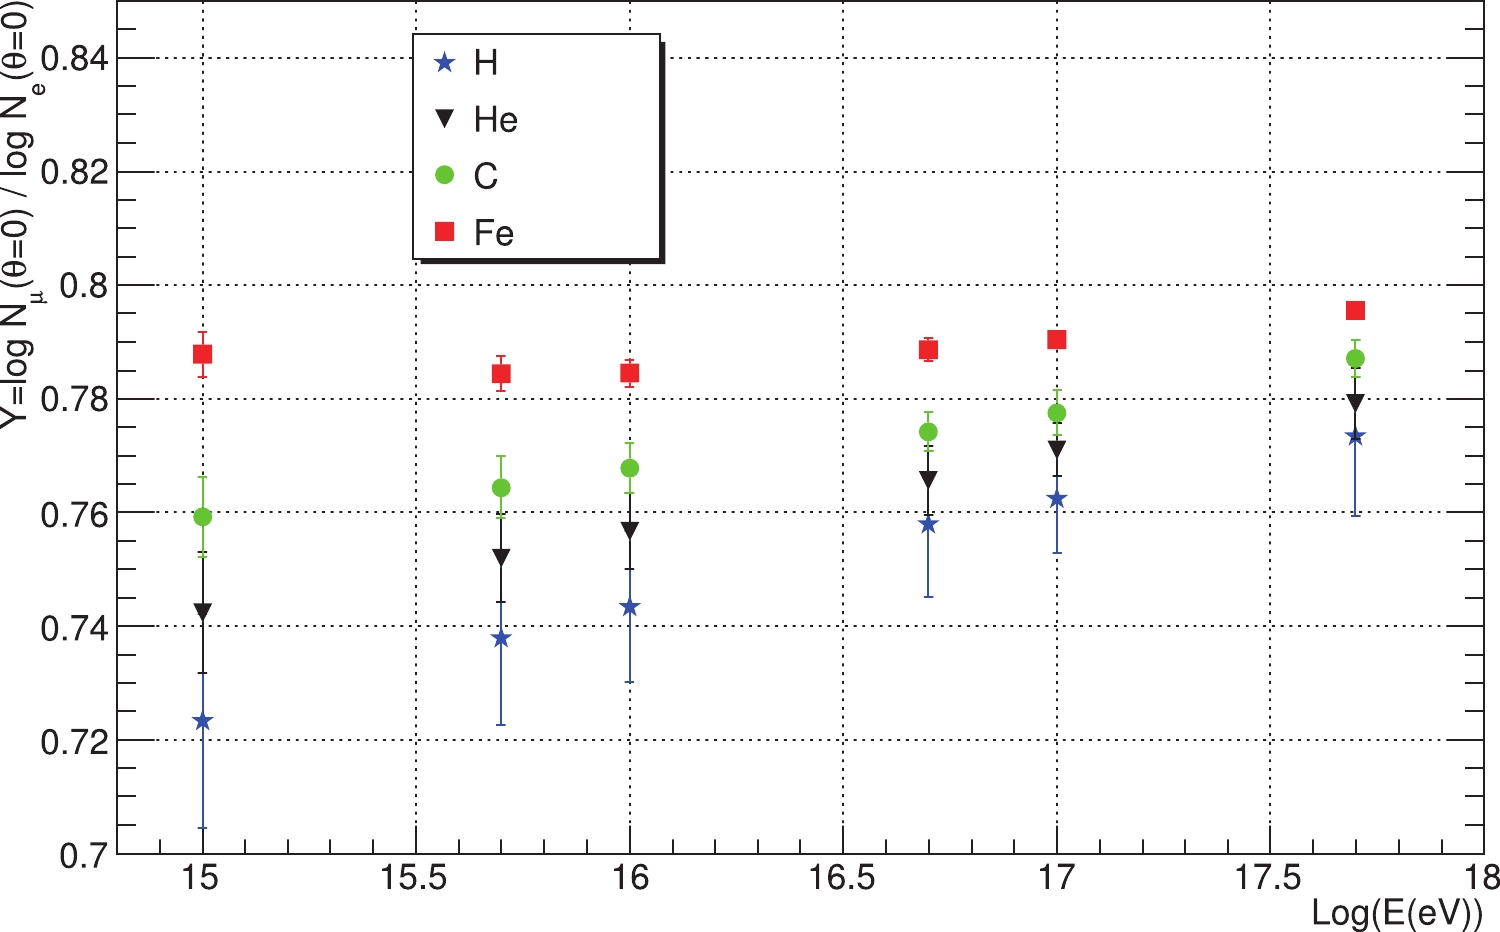
Figure 32. (color online)
$N_\mu/N_e$ calculated for EAS observed at the LHAASO altitude (4410 m above sea level) in the ideal case of a full coverage experiment without detection errors.The low energy muon size
$ N_\mu $ is itself a mass sensitive parameter, once the dependence on the energy is taken into account. From simulations we find that the parameter$ p_\mu = \log(N_\mu)+0.001\cdot R_p-0.86\cdot N^{\rm pe}_0 $

(8) is strongly related to the nature of the primary.
Many other parameters have been studied. The quoted parameters are not independent, there is some correlation between them. The correlations between mass sensitive parameters
$ p_{\max} $ and$ p_c $ ,$ p_{\max} $ and$ p_\mu $ ,$ p_{X_{\max}} $ and$ p_{\max} $ are shown in Figs. 33, 34, 35, respectively.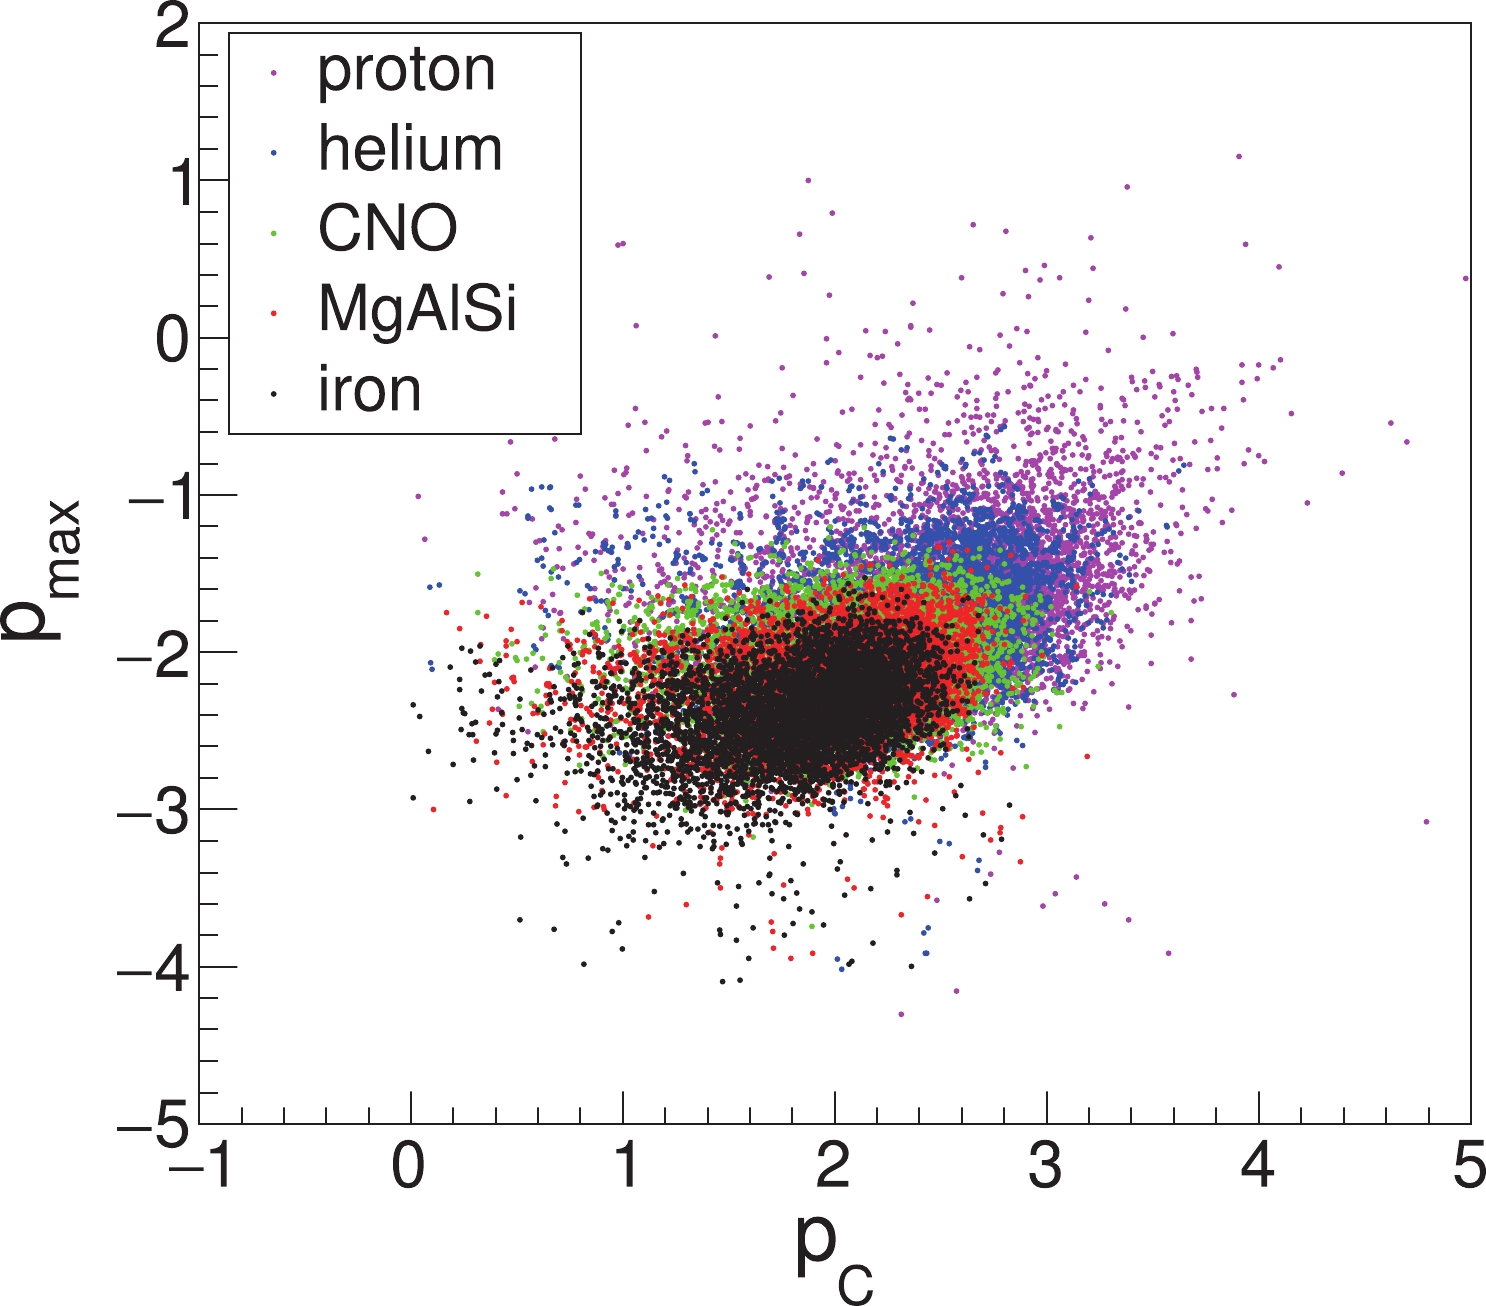
Figure 33. (color online) Composition-sensitive parameters
$p_{\max}$ and$p_{\rm c}$ for each primary cosmic ray element/group.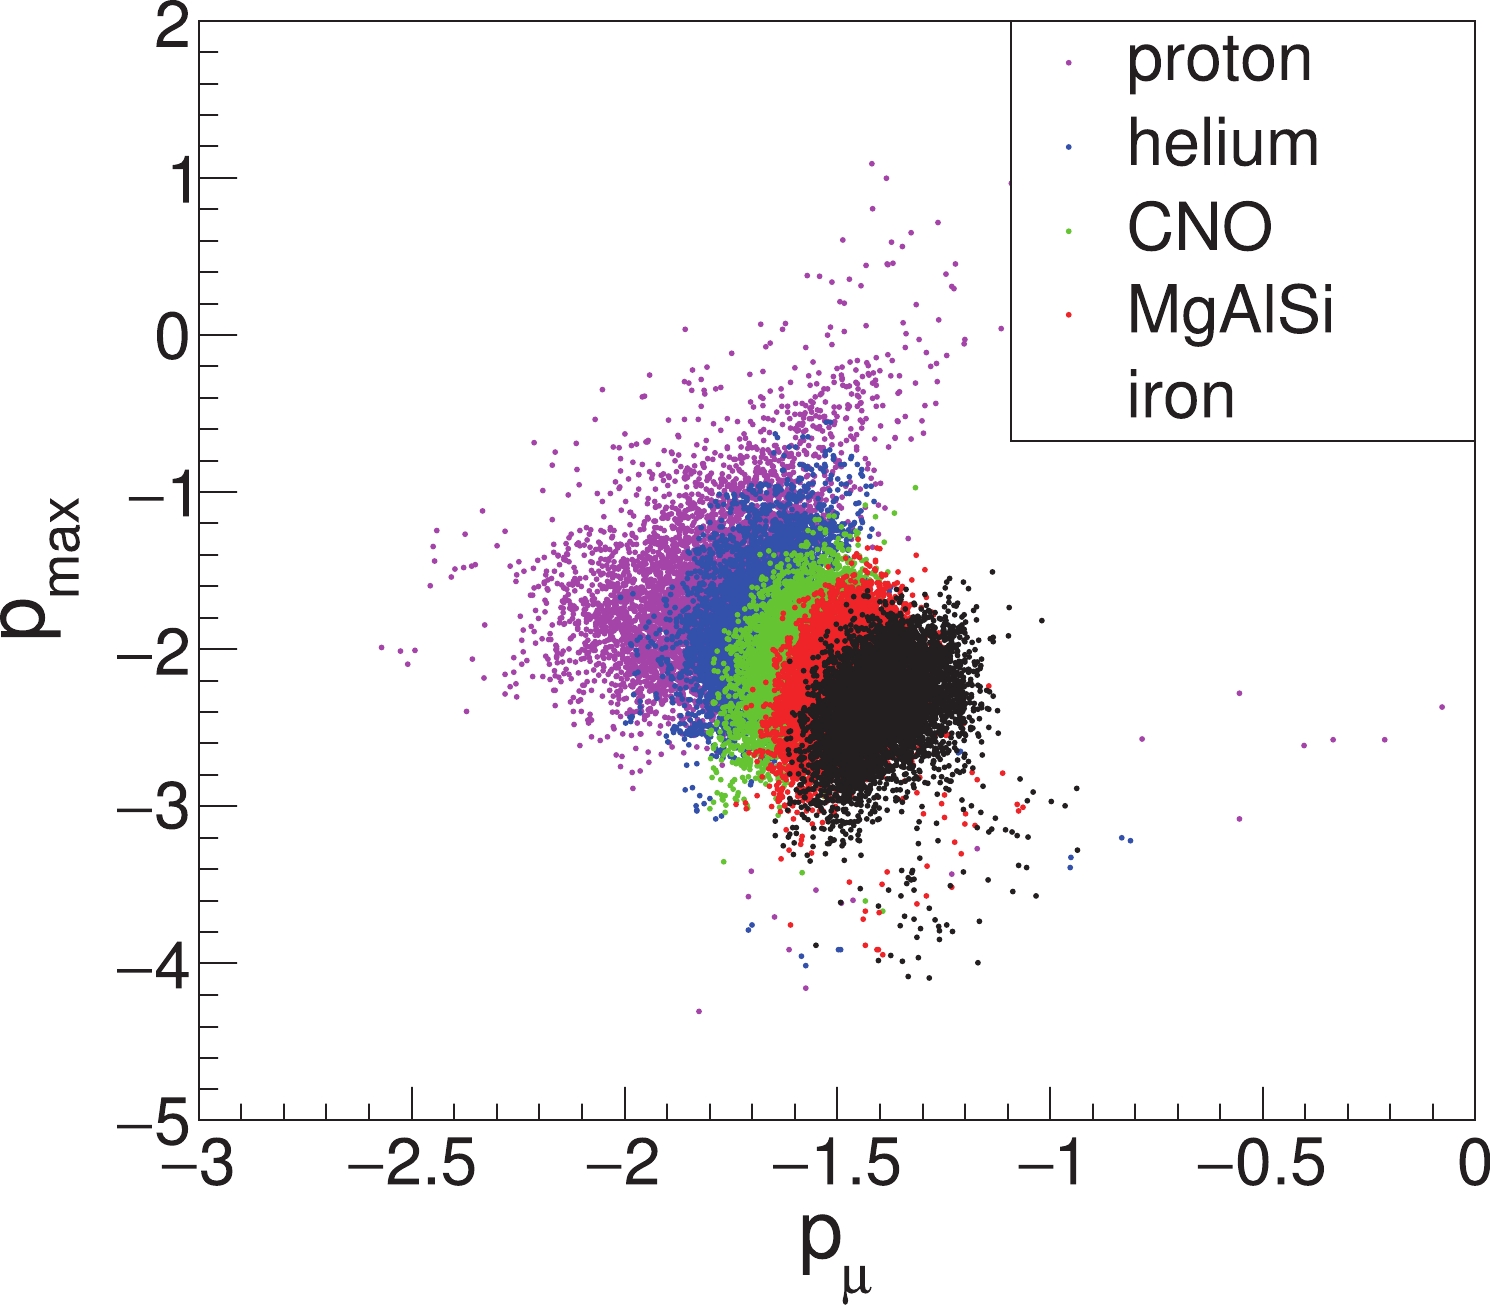
Figure 34. (color online) Composition-sensitive parameters pmax and pµ for each primary cosmic ray element/group.
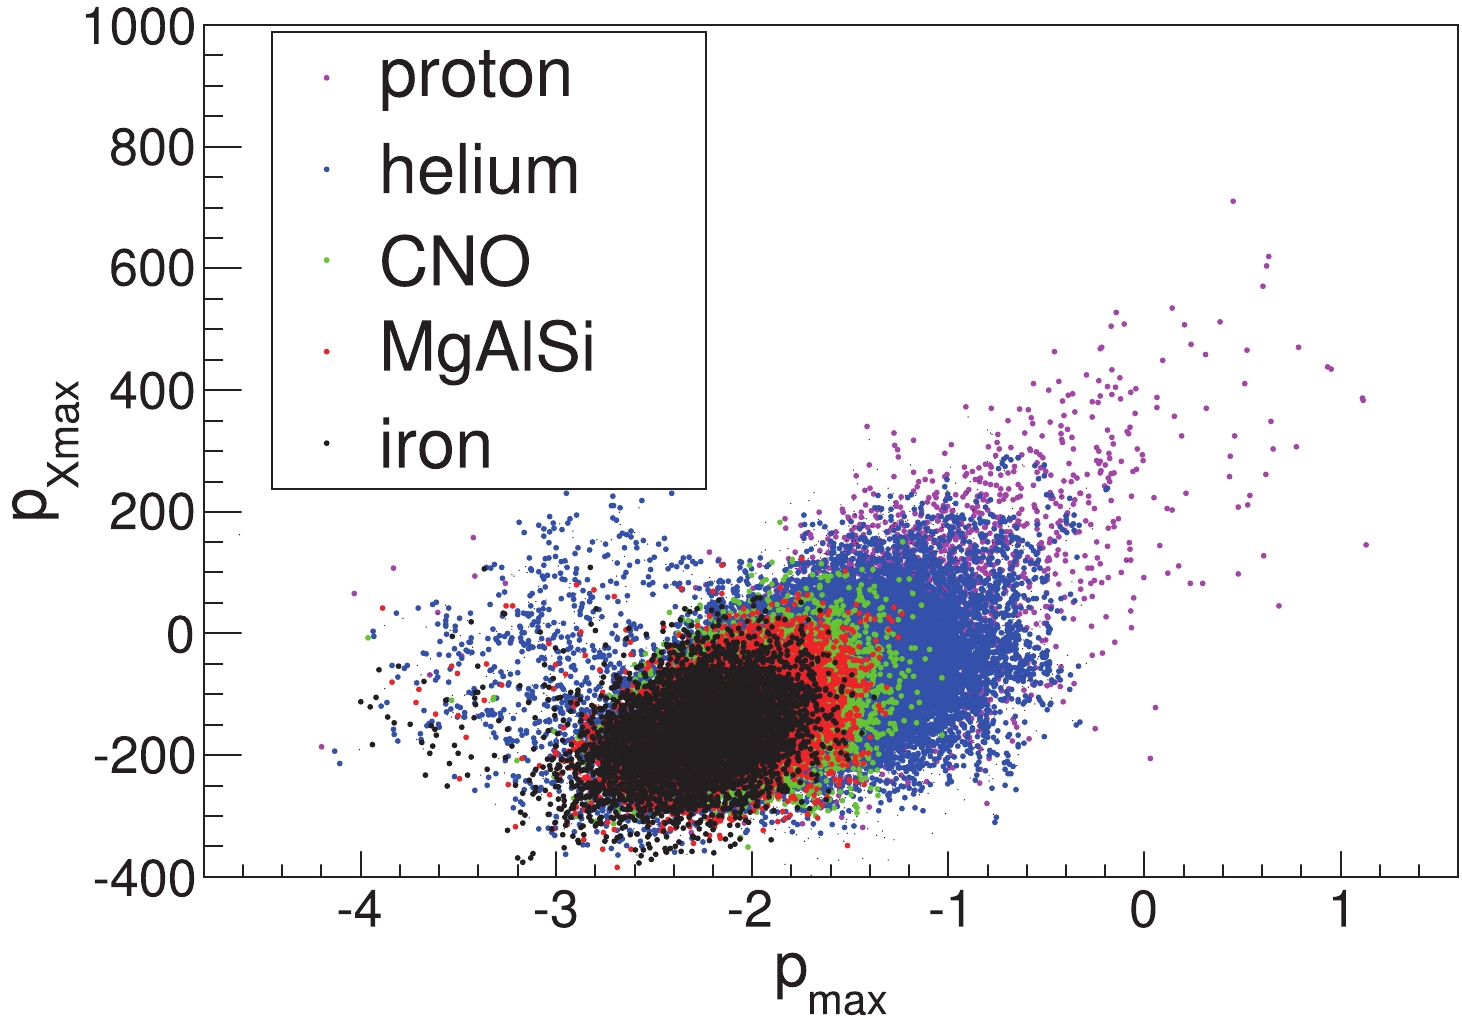
Figure 35. (color online) Composition-sensitive parameters pXmax and pmax for each primary cosmic ray element/group.
These five parameters combine information from different detectors and turn out to be well suitable to implement the separation between cosmic ray components. Two different studies have been carried out concerning the identification of proton and proton+Helium nuclei around the knee of the all-particle spectrum, and the separation above 10 PeV of the iron nuclei from the other cosmic ray elements in order to identify the knee of this component. In this preliminary study only the correlation of two parameters are used for particle identification. The use of more parameters can be accomplished by means of a Multivariate Analysis currently in progress.
-
The sample of proton (H event) induced showers is selected from the coincident events by combining the two composition-sensitive parameters
$ p_{\max} $ and$ p_\mu $ . This sample can be statistically separated on the$ p_{\max} - p_\mu $ map shown in Fig. 34.The cuts
$ p_{\max}\geq -1.0 $ and$ p_{\mu}\leq -1.9 $ result in a selected sample of proton showers with a purity of 85% assuming the Hörandel composition models [193]. The aperture, defined as the geometrical aperture times the selection efficiency, gradually increases to 2600 m2 sr at 100 TeV and remains nearly constant at higher energies (see Fig. 36). The selection efficiency is defined as the ratio of the selected number of proton events to the total number of injected proton events in the simulation.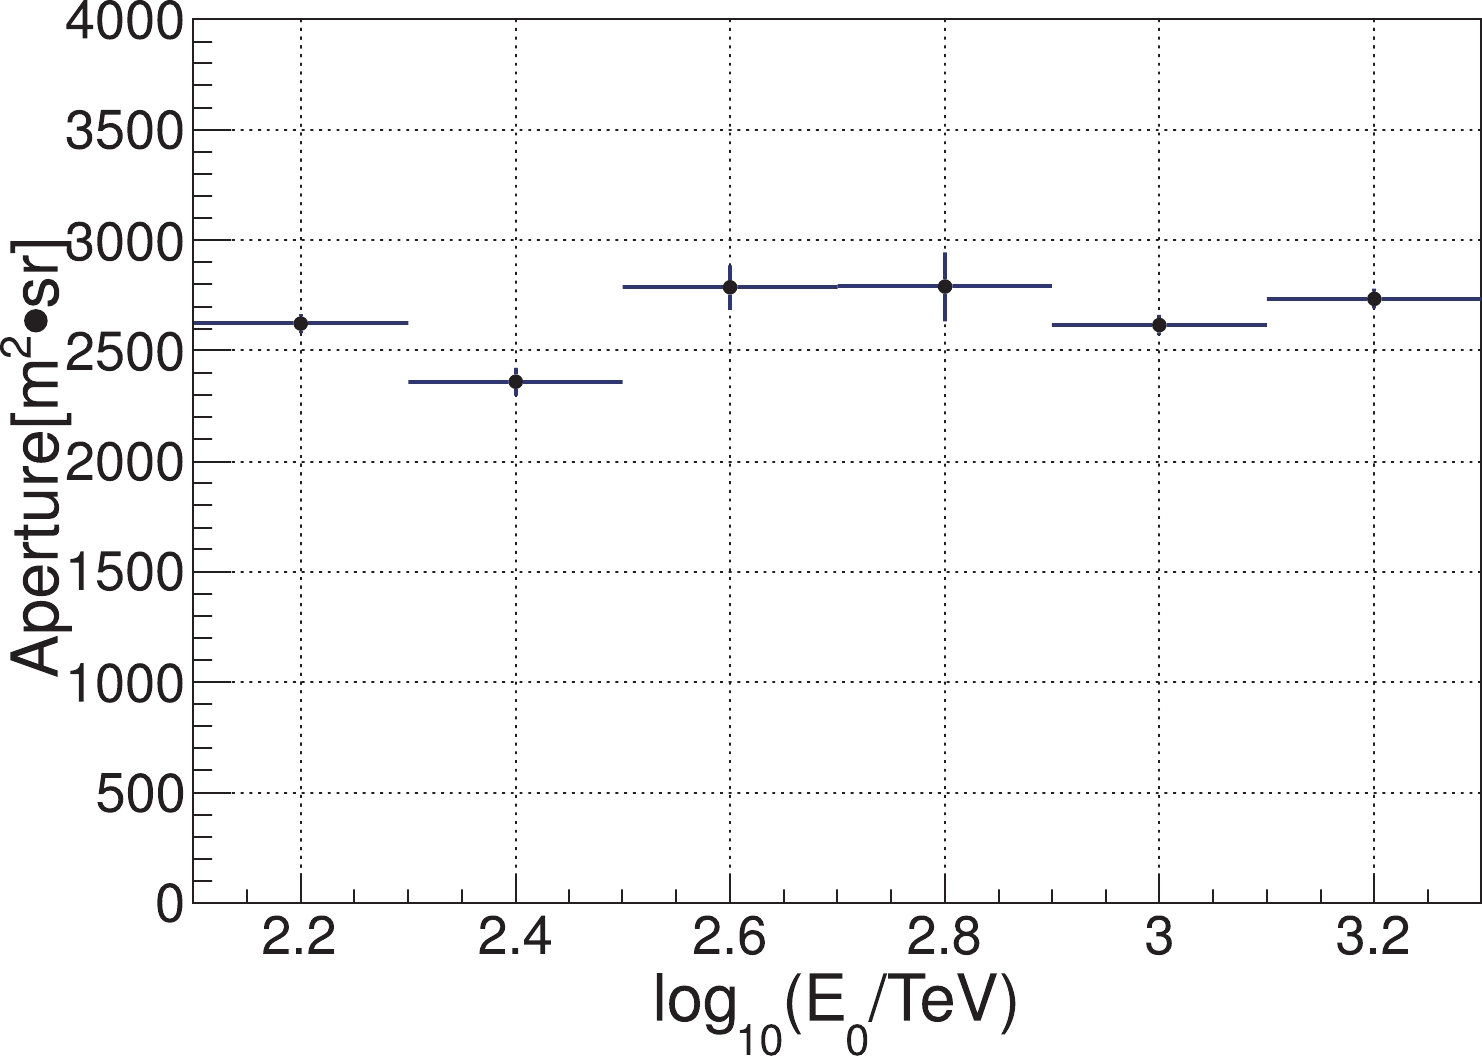
Figure 36. (color online) The aperture for proton selected events as a function of the primary energy
$E_o$ .In the selected sample, the contamination from the heavy species (CNO, MgAlSi, Iron groups) depends on the composition. Assuming the Hörandel composition [193], the contamination of heavy species is found to be less than 15% at energies ranging from 100 to 3 PeV, as shown in Fig. 37. After the composition selection, H like events from 100 TeV to 10 PeV are selected. The total exposure time of 1
$ \times 10^6 $ seconds per year (~3.2% duty cycle) is assumed. The number of events in the each energy bin ($ \Delta \log_{10}(E_{0}/{\rm TeV}) = 0.2 $ ) is shown in Fig. 38. About 1000/year proton-like events around 1 PeV can be measured after the composition selection.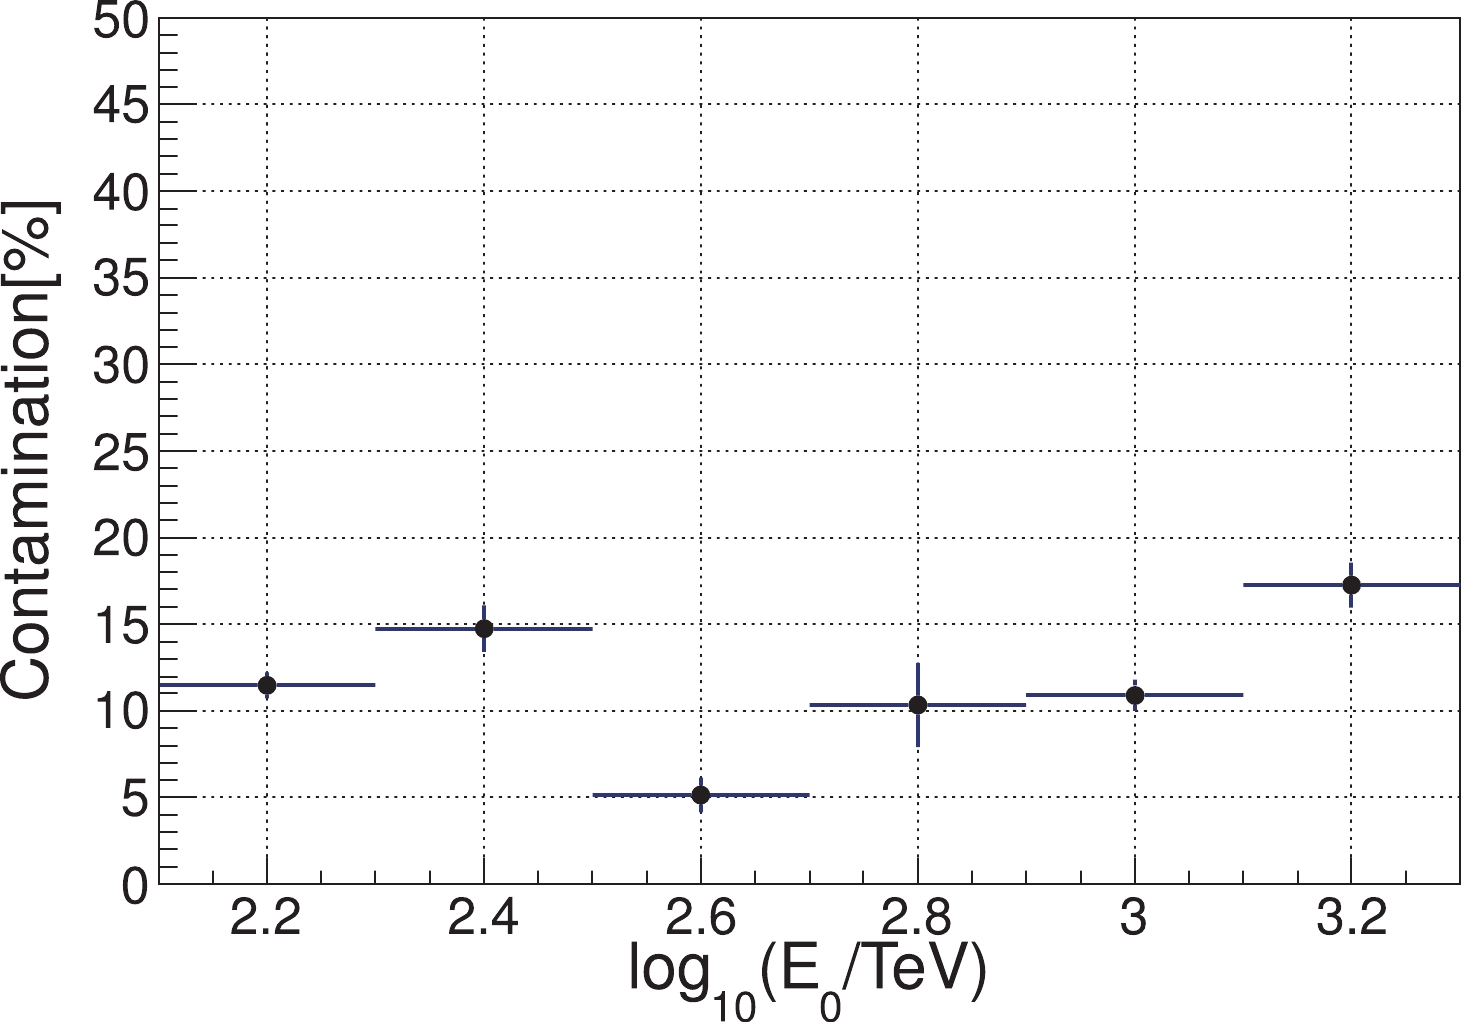
Figure 37. (color online) The fraction of heavy nuclei that contaminates the proton sample as a function of the primary energy
$E_o$ . The Horandel composition model is assumed.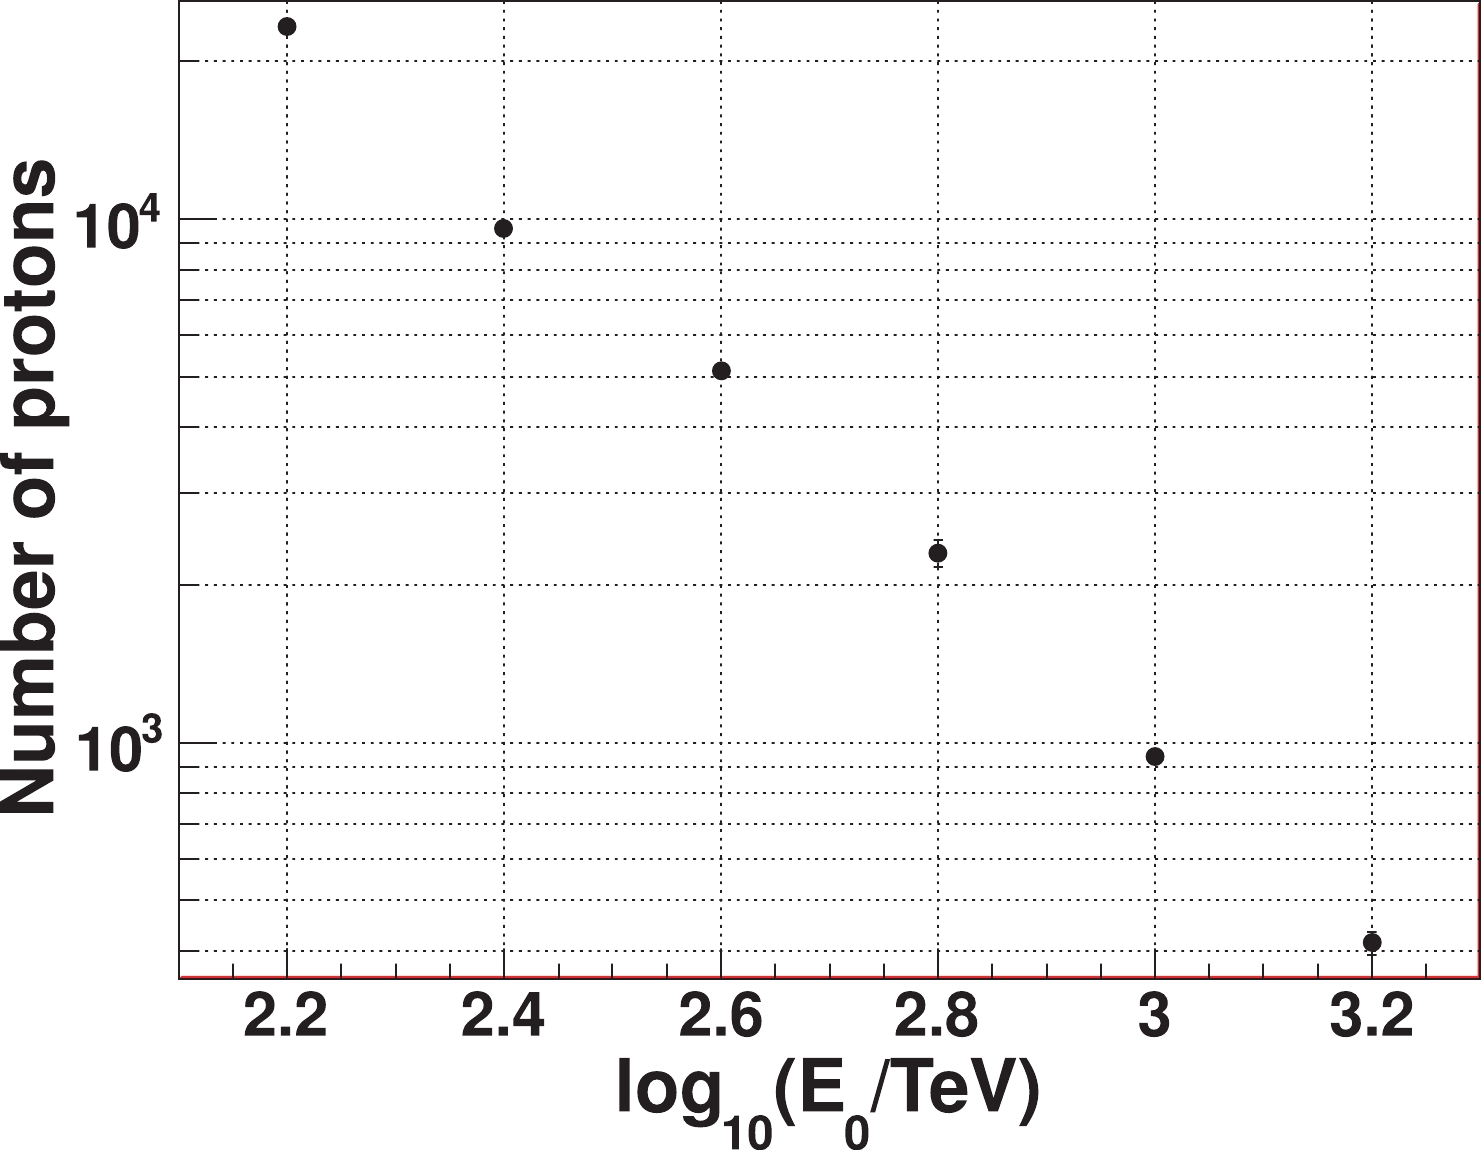
Figure 38. (color online) The number of proton-like events in each energy bin measured per year after the composition selection. The Hörandel model is assumed in the simulation.
-
The selection of showers generated by the light components, i.e. protons plus Helium nuclei (He), can be obtained from the same
$ p_{\max} - p_\mu $ map in Fig. 34.The cuts
$ p_{\max}\geq -1.3 $ and$ p_{\mu}\leq -1.7 $ result in a selected sample of p+He showers with a purity of 96% assuming the Hörandel composition models [193]. The aperture gradually increases to 4500 m2 sr at 100 TeV and remains nearly constant at higher energies (see Fig. 39).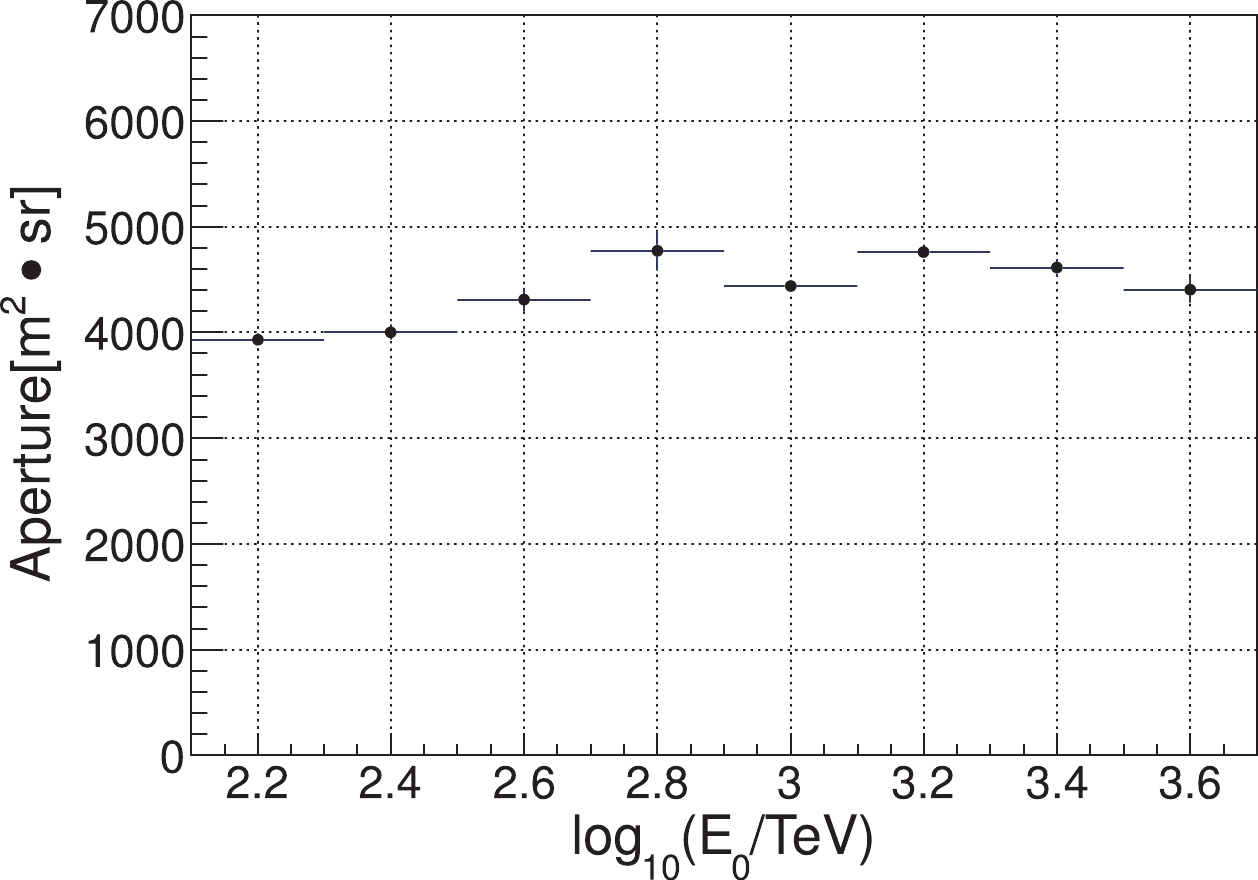
Figure 39. (color online) The aperture for p+He selected events as a function of the primary energy
$E_0$ .In the selected sample, the contamination from the heavy nuclei depends on the composition. Assuming the Hörandel composition [193], the contamination of heavy species is found to be less than 5% at energies ranging from 100 TeV to 3 PeV, as shown in Fig. 40.
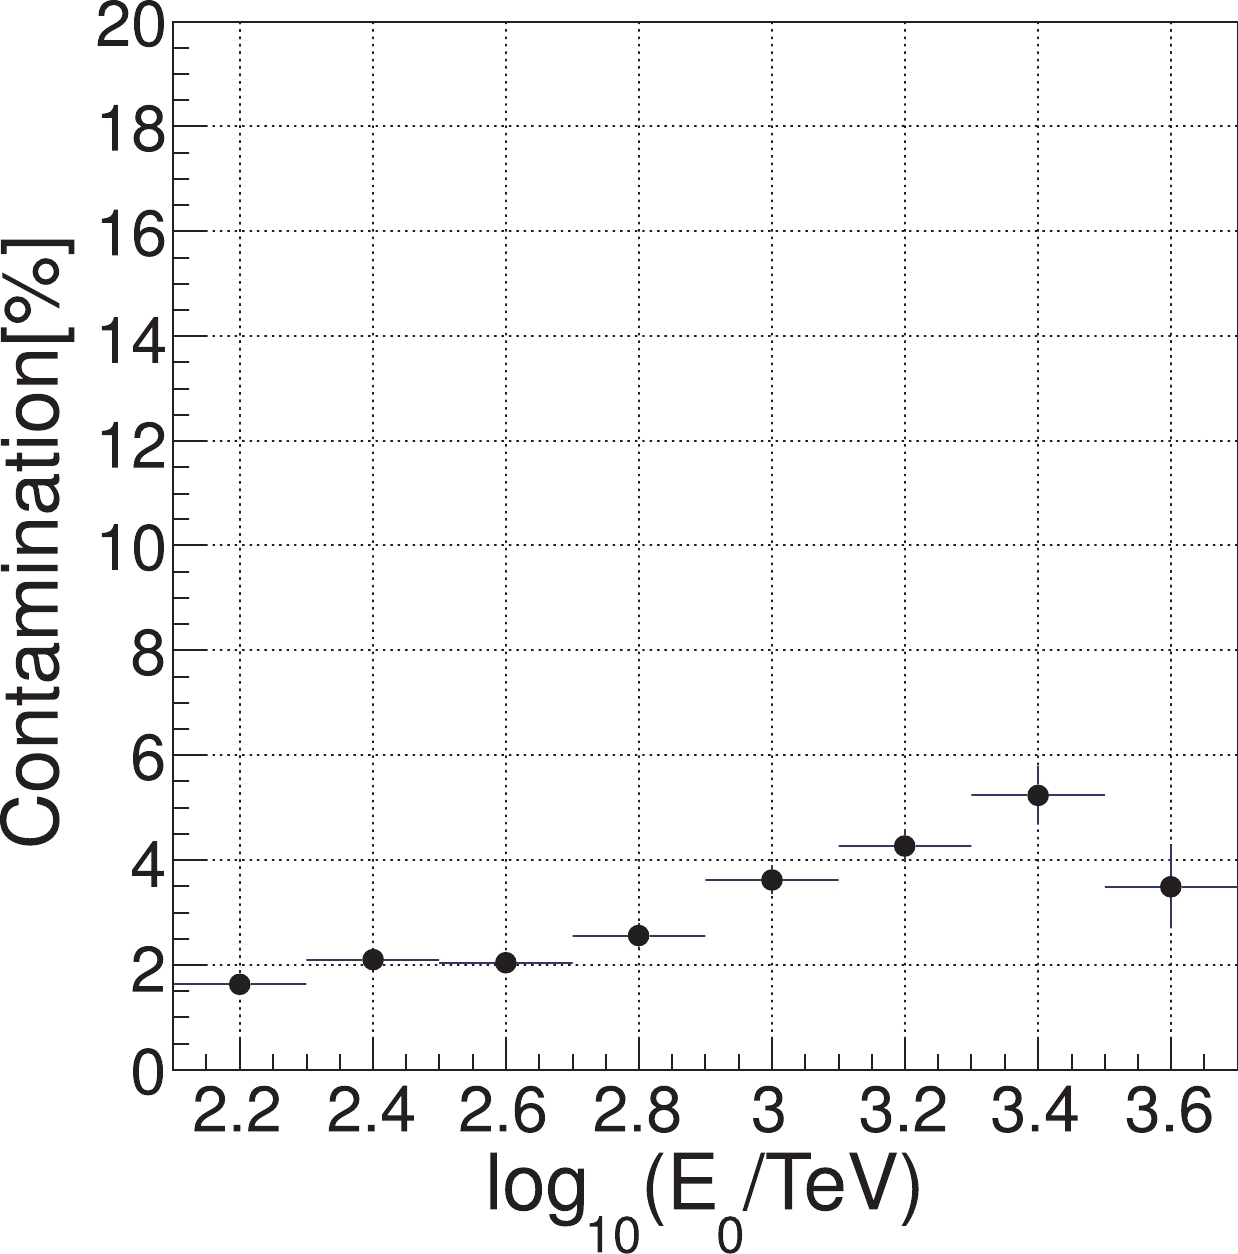
Figure 40. (color online) The fraction of heavy nuclei that contaminate the proton+He sample as a function of the primary energy
$E_0$ . The Horandel composition model is assumed.After the composition selection, p+He like events from 100 TeV to 10 PeV are selected. The total exposure time of 1
$ \times10^6 $ seconds per year (3.2% duty cycle) is assumed. The number of events in each energy bin is shown in Fig. 41. About 3000/year p+He like events around 1 PeV can be measured after the composition selection.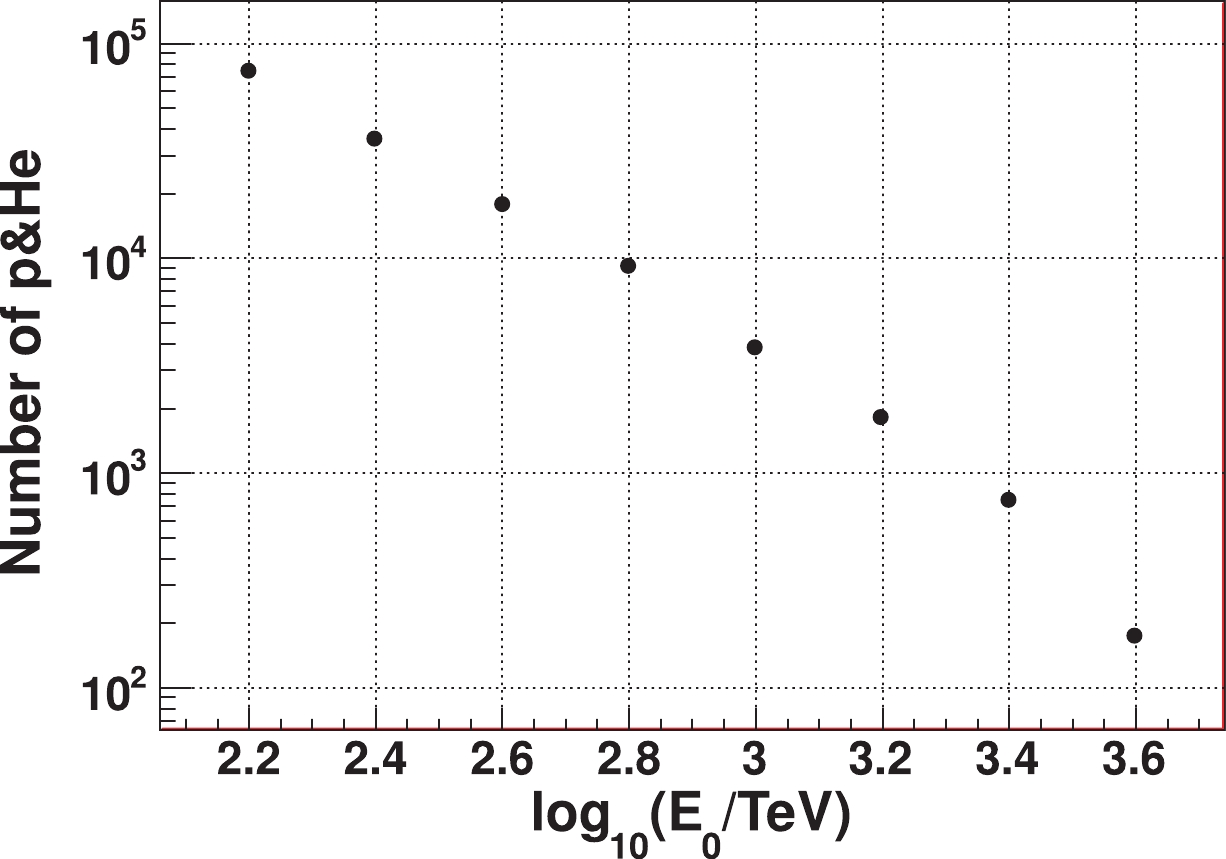
Figure 41. (color online) The number of (p+He)-like events measured per year in each energy bin after the composition selection. The Horandel composition model is assumed.
-
Measuring the knees of the energy spectrum of the single components would imply a significant improvement in understanding the origin and propagation of the galactic cosmic rays. This is of particular importance in the energy range above 10 PeV where, according to some proposed models, a second galactic component is expected in addition to cosmic rays from SNRs, for instance re-accelerated particles at a galactic wind termination shock or cosmic rays from Wolf-Rayet stars exploding in the wind of the massive progenitor [87]. In the most accepted interpretation of the KASCADE and KASCADE-Grande data, the so-called second knee at 80 PeV is attributed to the bending of the iron component, assuming that the knee of the all-particle spectrum at 3 PeV is due to the decrease of the proton flux. On the other hand, high altitude experiments as Tibet As and ARGO-YBJ find the bending of the light component below 1 PeV, thus implying the knee of the iron component being at an energy below 80 PeV for both the plausible assumptions of a bending rigidity or mass A dependent.
An example of the LHAASO capability of imaging high energy iron induced showers is displayed in Fig. 30, where the imprint of a 20 PeV iron nucleus event is simulated.
One of the peculiar aspects of the LHAASO experiment is that the atmospheric depth of the experimental site (4410 m.a.s.l.) is close to the maximum development of
$ 10^{16}-10^{17} $ eV air showers, with the electron size almost independent of the masses of the primary cosmic rays. On the contrary, the low energy muon number$ N_\mu $ as mentioned before, depends on the mass of the primary particle. Accordingly, the ratio$ N_\mu/N_e $ between the total number of low energy muons and the shower size is expected to be a mass sensitive parameter as shown in Fig. 32. The large electron and muon arrays of LHAASO may reconstruct these sizes with excellent resolution. A shower of 10 PeV typically generates more than 5000 hits in the ED array and about 50-100 hits in MD. The angular resolution is about 0.3° and the core location is measured with a resolution ≤ 2 meters. In the reconstruction of the muon lateral distribution, the information from the muon detectors close to the core is not taken into account to avoid the punch-through effect due to high energy electrons near the shower core. The ratio of the reduced muon number$ N_{\mu} $ to the shower size$ N_{e} $ ,$ C_{\mu} $ =$ N_{\mu}/N_{e} $ , can be exploited to selected heavy nuclei induced showers. The distribution of$ 1/C_{\mu} $ is displayed in Fig. 42 for all mass groups.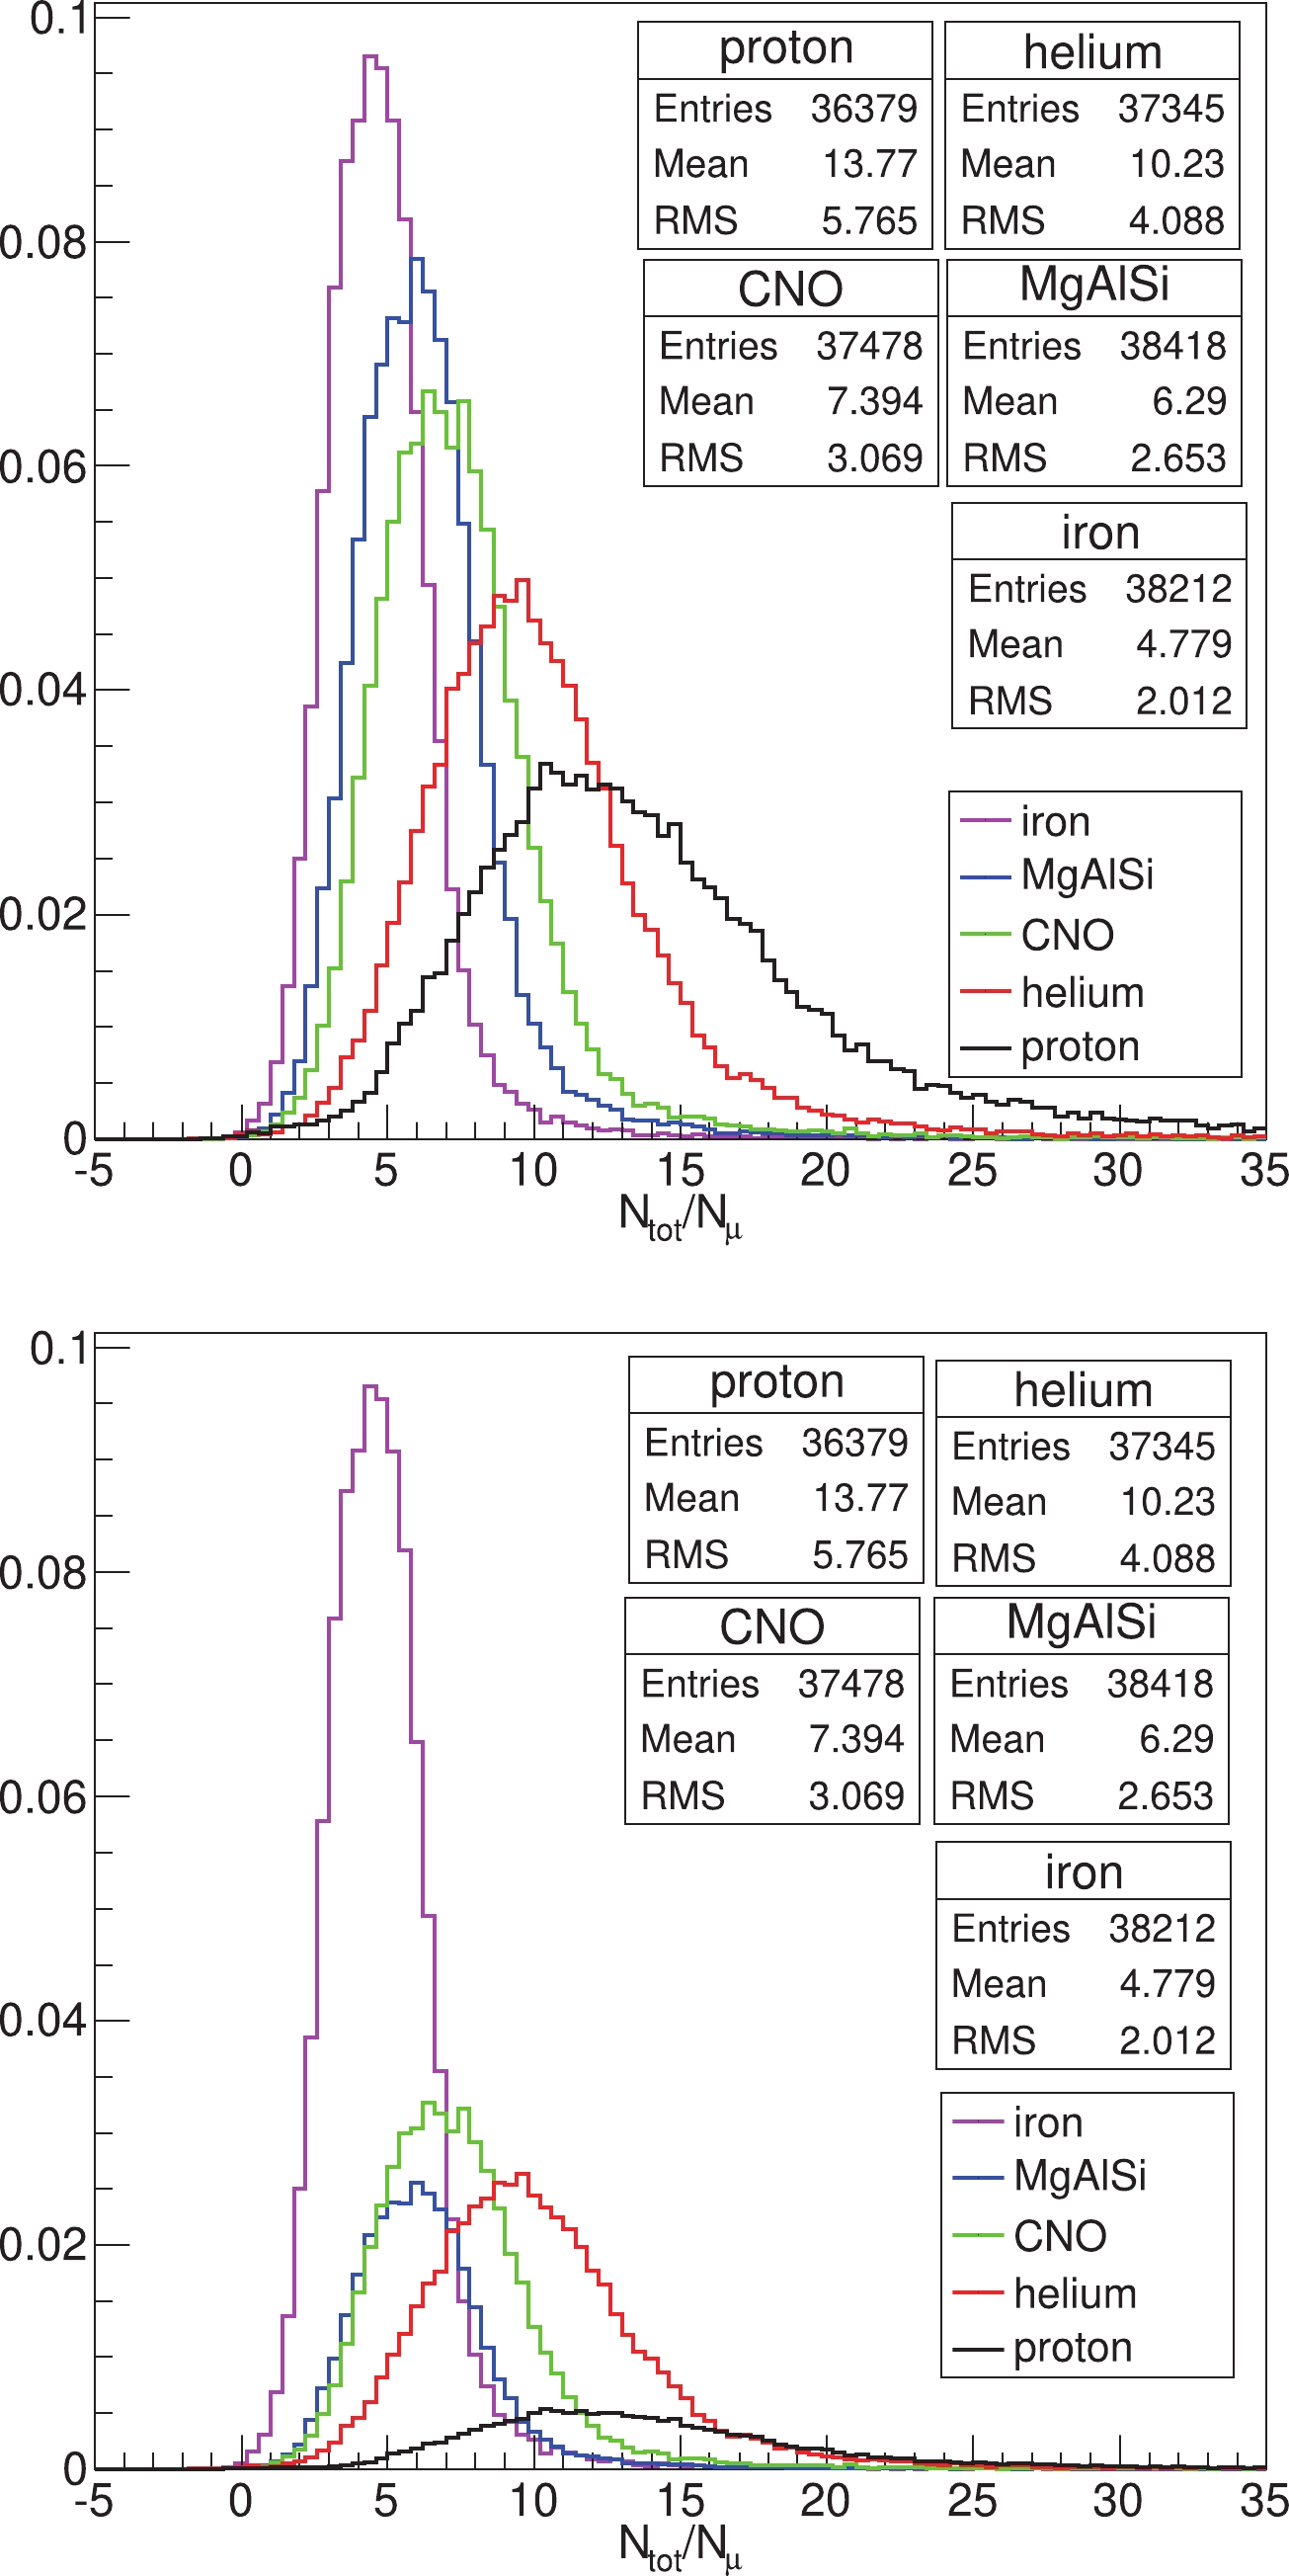
Figure 42. (color online) Upper: Distributions of the inverted muon content
$1/C_\mu$ for 5 cosmic-ray groups, i.e. proton, helium, CNO, MgAlSi, Iron (left). Lower: assuming the composition of the Horandel model [193].The plot in lower panel of Fig. 42 shows that, assuming a realistic composition, the parameter
$ 1/C_\mu $ may be used to discriminate iron-induced events keeping at a low fraction the contamination from other nuclei. More efficient selection can be achieved by combining this parameter with the measurement of the shape of the Cherenkov images provided by the Cherenkov telescopes. Showers from heavy nuclei develop higher and faster (and with less shower to shower fluctuations) than shower initiated by lighter nuclei of the same energy. In the framework of the superposition model we have$ X{{_{\rm max}},A} = X{_{{\rm max}},p} $ -$ \lambda_r\ln( A) $ , where A is the atomic mass and$ \lambda_r $ is the radiation length in air ($ \simeq \;37$ g/cm2). All detailed simulations and hadronic models share this result predicting that iron showers have a smaller average$ X_{\max} $ and less fluctuations on$ X_{\max} $ than proton ones.When the arrival direction of the shower and the impact parameter
$ R_{p} $ are known, simple geometry can be used to reconstruct the amount of light received from each altitude of the shower, light which is proportional to the number of electrons.The angular offset (
$ \delta\theta $ ) of the centroid of the Cherenkov image to the arrival direction of the shower is related to$ X_{\max} $ , though$ R_{\rm{p}} $ dependent due to the elongation of the geometry. The distributions of angular offset after$ R_{\rm{p}} $ correction for the five mass groups are displayed in Fig. 43 with the assumption of primaries evenly distributed or distributed according to the Horandel model.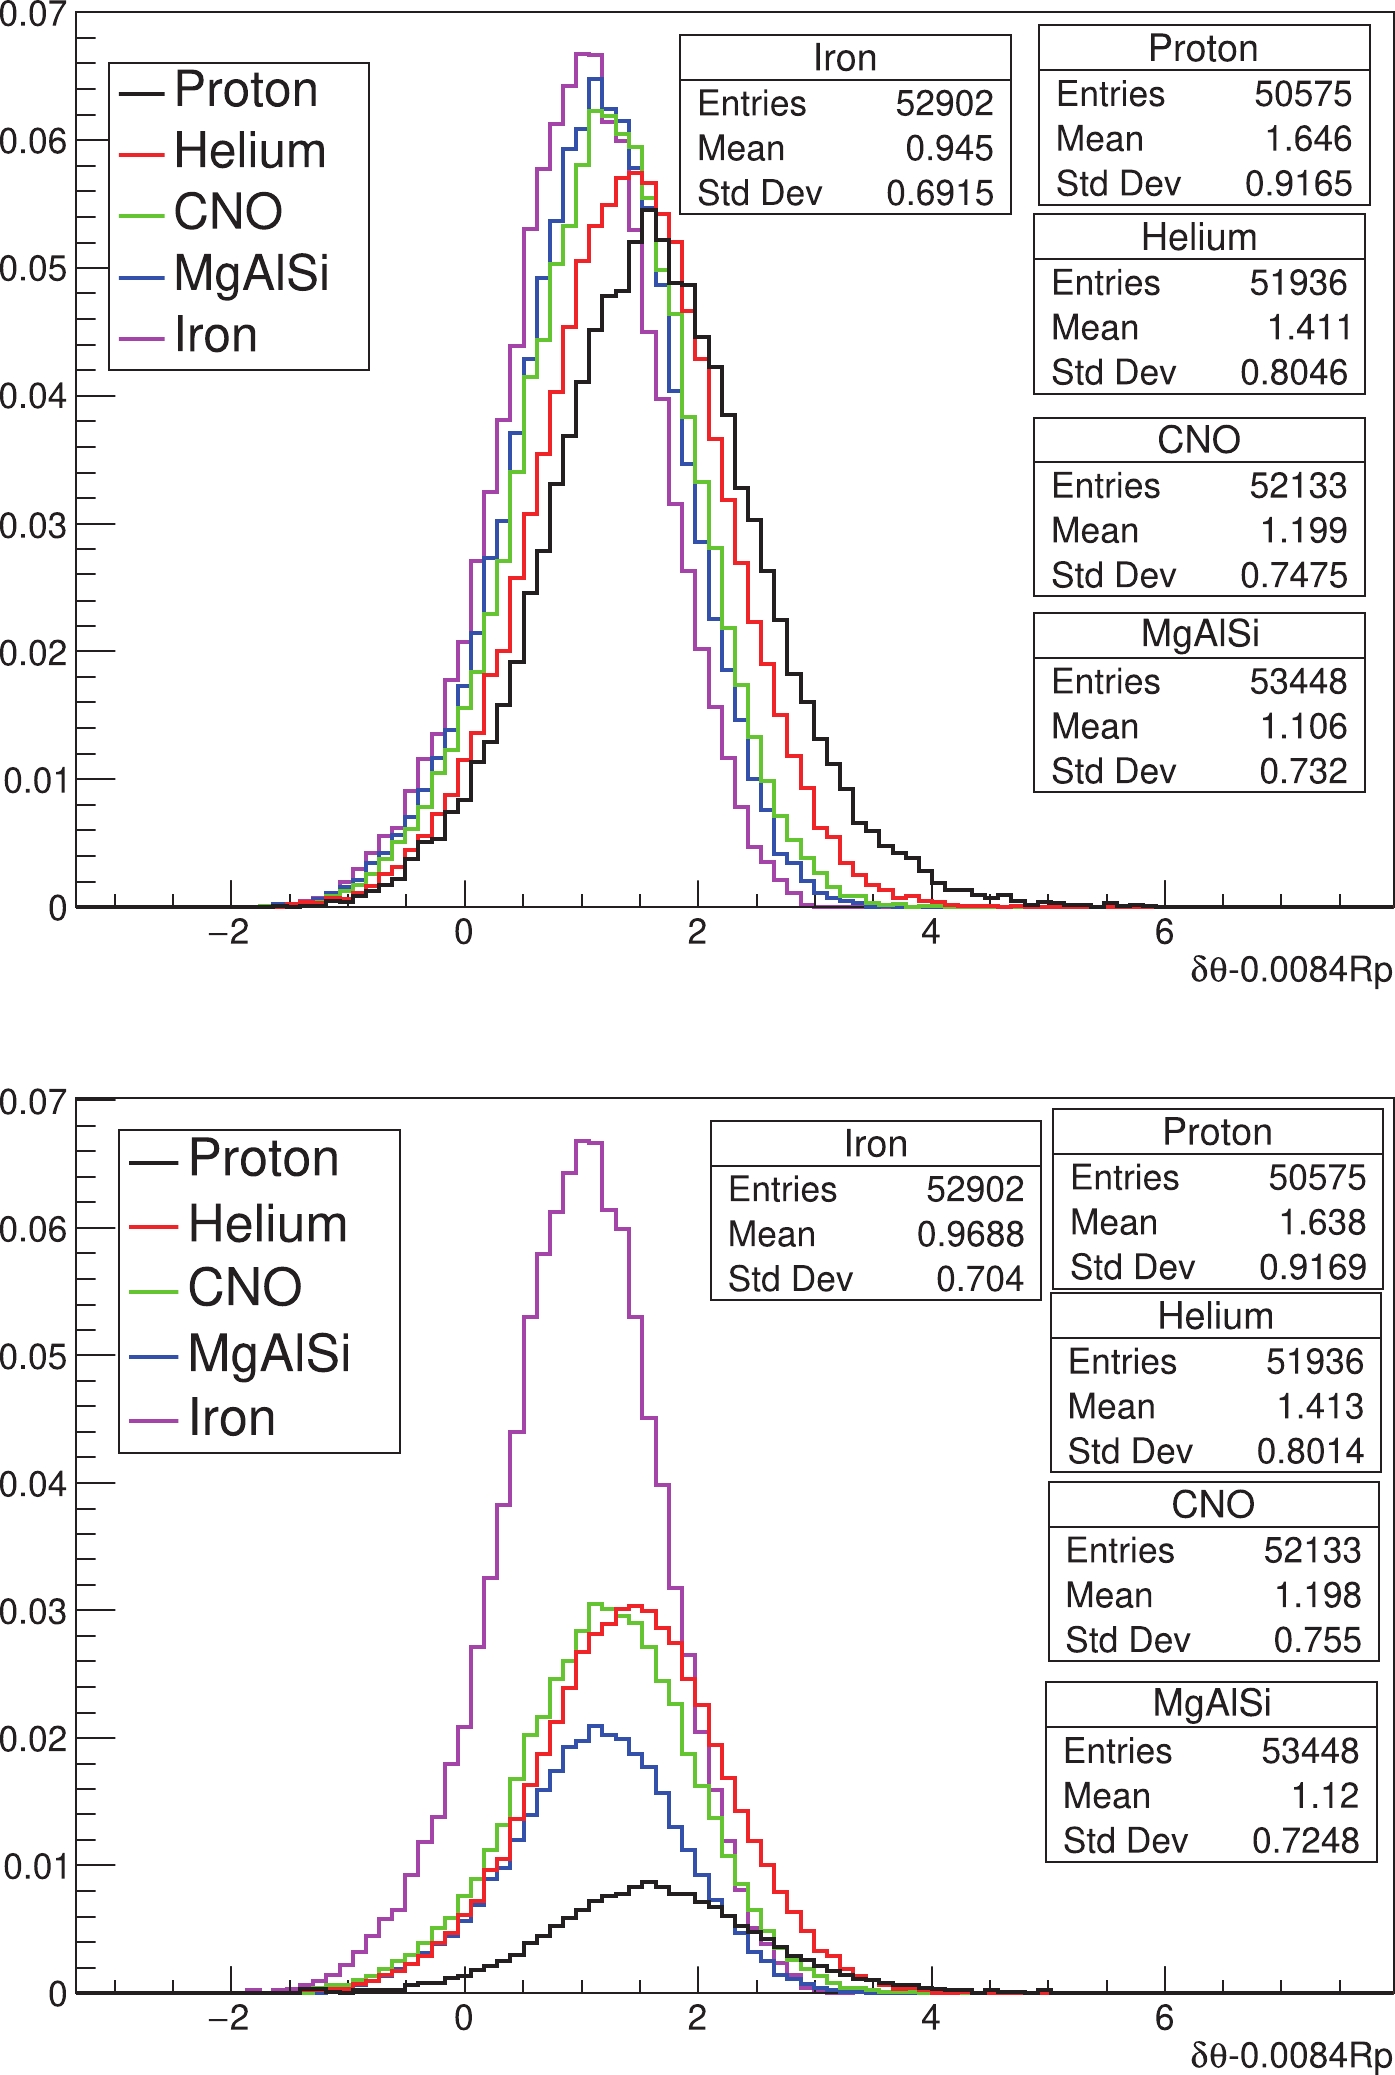
Figure 43. (color online) (upper) Distributions of angular offset with
$R_{\rm{p}}$ correction for 5 cosmic-ray groups, i.e. proton, helium, CNO, MgAlSi, Iron (left). (lower) Assuming the composition of the Horandel model [193]. -
The cuts
$ 1/C_\mu< 6$ and$ \delta\theta-0.0084R_{\rm{p}}< $ 1.8° result in a selected sample of iron showers with a purity of 70% at 10 PeV and 85% at 100 PeV. The effective aperture, defined as the geometrical aperture times the selection efficiency, is about 3.4 ×$ 10^{5} $ m2 sr, allowing a collection of about 16000 /year iron showers above 10 PeV assuming the Horandel composition model. The shower energy is measured by both detectors KM2A and WFCTA with an expected resolution of about 20 % over a wide energy range (see Sec. II.C.1).Given a sample of a single cosmic ray element with a purity of 70% or better, the energy reconstruction of the shower is rather straightforward by using the total number of Cherenkov photons in the shower image. This minimizes the uncertainty due to the unknown composition. The total number of photons has been proved to be a good energy estimator because the resolution function is symmetric Gaussian with the bias less the 5%. This is a good feature of the Cherenkov technique in the power-law-like spectrum measurement with minimized distortion. The other good feature of the technique is that the energy resolution is almost a constant better than 20% over a wide energy range. This is very important in finding the structures of the spectrum if there are, such as the knee. Every part of the spectrum is equally measured with consistent resolution. Both the resolution and the reconstruction bias as functions of the shower energy are shown in Fig. 44. With the reconstructed energy of selected showers, the expected spectrum of iron showers is shown in Fig. 45 by solid red squares [201]. The flux in the last bin near 100 PeV corresponds to about 164 events/year. The knee, if it is there, will be discovered with high significance in one year operation of the hybrid observation using LHAASO instruments.

Figure 44. (color online) The energy resolution of 30 PeV pure iron showers using the total numbers of Cherenkov photons in shower images well contained in the telescope FOV (upper). Resolution and bias as a function of the shower energy in the 10-100 PeV energy range (lower).
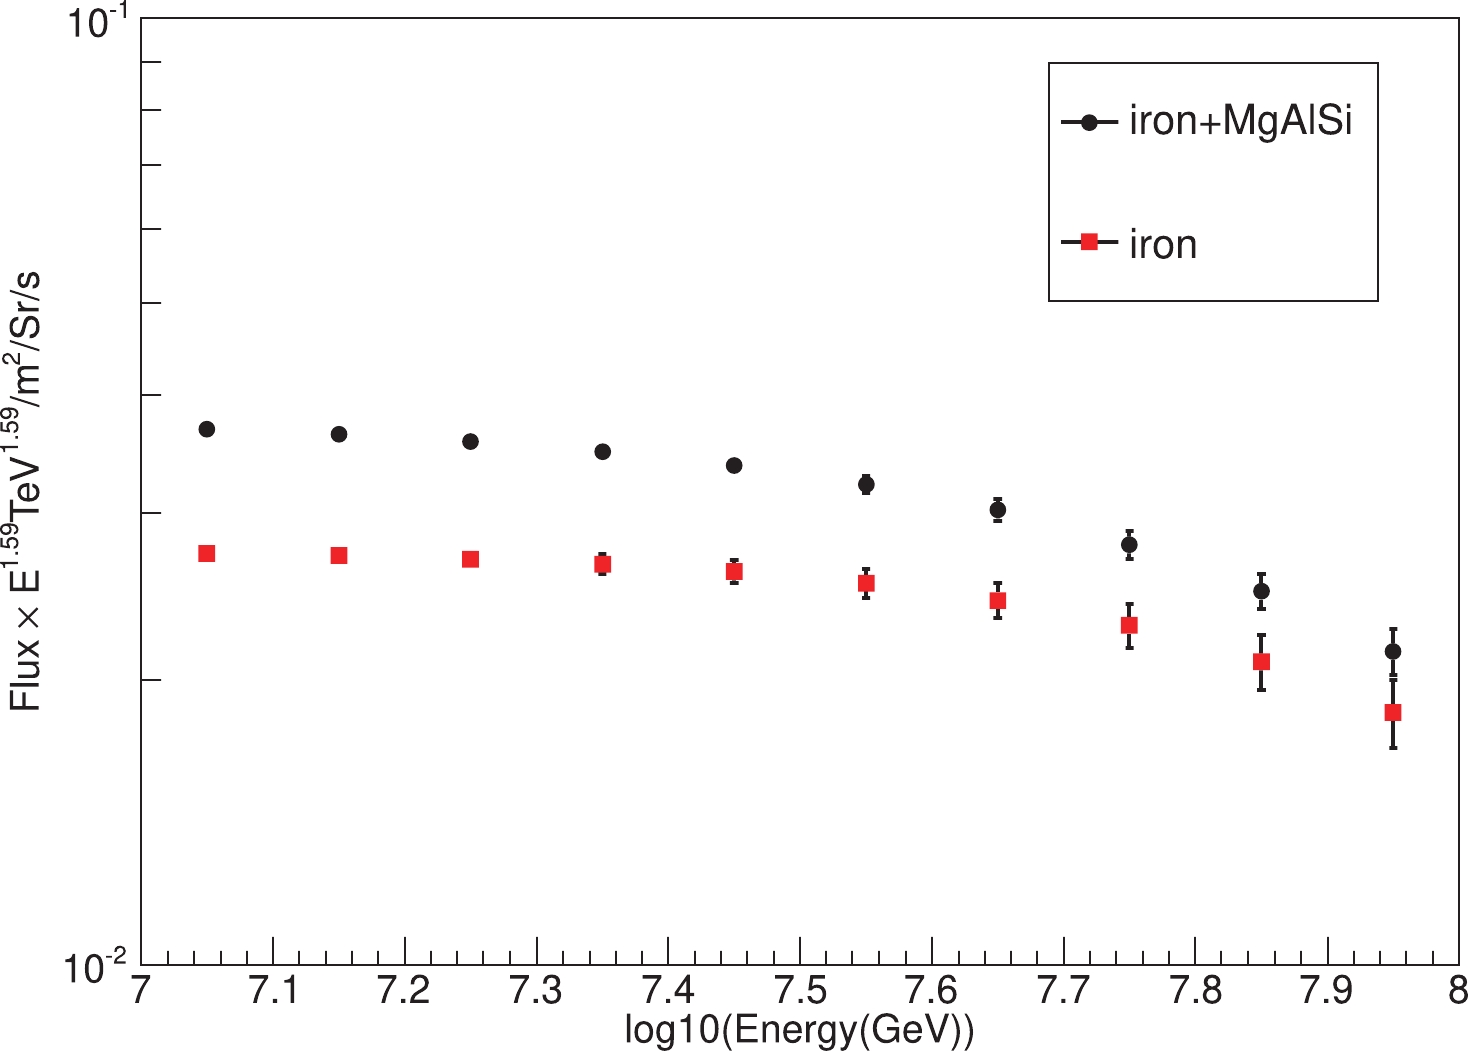
Figure 45. (color online) The expected spectra of pure irons and of the mixed heavy nuclei group over the energy range from 10 to 100 PeV in one year of data taking. The Horandel model is assumed. The iron knee-like feature expected below 100 PeV should be readily observed.
-
Assuming that the iron spectrum above 10 PeV has a constant index below its knee, it is possible to observe the bending of the spectrum of mixed irons and Mg, Al, Si nuclei, if we can separate the combined event group out of all events. It turns out an easier job with a purity better than 70% and even 90% around 100 PeV. The gain is that the effective aperture increases, and reaches to
$ 4.2\times 10^5 $ m2sr due to relaxing the cut on the angular offset measured by the Cherenkov telescopes. The total number per year of selected showers is about 26000 above 10 PeV and 200 events in the last bin near 100 PeV. In fact, the difference between the two types of showers is not very significant. The down side is the energy resolution becoming slightly worse due to the mixing of composition. From 18% for pure iron showers, the resolution worsens to 20% for the mixed heavy samples. The expected spectrum of the mixed sample is plotted in Fig. 45 by solid black circles. The Horandel composition model is assumed. -
The LHAASO capability to measure the spectra of the heavy components beyond 10 PeV as well as the spectra of the proton and Helium nuclei at PeV energies (Secs. II.D, II.E) is a powerful tool to ascertain the evolution of the cosmic-ray spectra and clarify the phenomena associated to their detailed structures. This will greatly enhance our knowledge of the mechanisms governing production and propagation of galactic cosmic rays.
-
When arriving at Earth, high energy cosmic rays in-teract with the air nuclei producing extensive air showers (EAS). They consist of a core of high energy hadrons that continuously feed the electromagnetic part of the shower, mainly with photons from neutral pion, kaon and eta particle decays. Nucleons and other high energy hadrons contribute to the hadronic cascade. High energy hadrons, which constitute the EAS skeleton, may carry important information for multi-parameter correlation studies, since some hadronic observables, primarily the hadron number/electron number correlation, depend on the nature of the particle inducing the shower [202, 203]. Thus, the detection of high energy hadrons, designed to improve the discrimination power in these analysis, is highly advisable. A way to deal with this problem avoid-ing the use of huge and expensive HCALs was brought out in [203-205]. In these papers the detection of thermal neutrons generated by EAS hadrons is proposed.
Indeed, due to the tight correlation between the air showers hadrons and the thermal neutrons, this tech-nique can be envisaged as a simple way to estimate the number of high energy hadrons in EAS.
It is well known that hadrons interacting with ambi-ent matter (air, building, ground, etc.) produce evapora-tion neutrons due to nuclei disintegration. The neutrons have no charge and lose energy only by scattering. If the medium is a good moderator, i.e., the absorption cross section is much less than the scattering cross section, the neutrons lose energy via scattering down to the thermal ones (moderation process) and then live in the matter until capture. Evaporation neutrons need about 0.5 ms to thermalize in rock (concrete). Neutrons are generated abundantly, up to 2 orders of magnitude more than parent hadrons. The mean number of evaporation neutrons <n> produced by hadrons in a 120 cm layer of surrounding soil (about 3 hadron interaction lengths) and/or construction materials can be estimated using the empirical relationship
$ <n> {\approx} \; 36 \times E^{0.56}_{\rm{h}}, $

(9) where Eh is the hadron energy in GeV [206]. A large fraction of the evaporation neutrons thermalize, so that recording thermal neutrons can be exploited to reconstruct the hadron content in the shower. This approach looks very promising for measurements carried out at high altitude. Indeed, since the hadron content in EAS increases with the altitude, an abundant production of thermal neutrons can be predicted for experiments at 4 (or more) km a.s.l., about a factor 10 higher than that at sea level [206]. These considerations suggested the development of a simple and cheap thermal neutron detector, to be deployed over a large area, as 'hadron counter' in EAS experiments at mountain level. This idea led to the development of the EN-detector, made of a mixture of the well-known inorganic scintillator ZnS(Ag) with 6LiF, capable of recording both thermal neutrons and charged particles [204, 207].
Thermal neutrons are detected via the capture reac-tion (940 barns)
$^{\rm{6}}{\rm{Li + }}n{ \to ^{\rm{3}}}{\rm{H + }}\alpha {\rm{ + 4}}{\rm{.78}}\;{\rm{MeV}}, $

(10) producing a light yield in the scintillator of about 160,000 photons per neutron capture.
However the light output is different for different types of particles. Charged particles produce weak and fast signals comparing with the high amplitude, slow and delayed signals from thermal neutron capture. The first big and fast peak is generated by the large amount of charged particles in the shower front while the smaller delayed signals are due to the thermal neutron capture. Thus these peculiar features make this detector well suit-able for operation in the framework of EAS experiments. The amplitude of the fast signal can be used to measure the charged particle density while the delayed signals recorded in a time gate of 10 ms give the number of captured thermal neutrons.
All details concerning construction, operating princi-ples and performance are described in Chapter 1 , Sect. 1.6. In order to check the performance of this detector at a high altitude site, a small array composed of four EN-detectors (PRISMA-YBJ) has been installed inside the hall hosting the ARGO-YBJ experiment at the Yangbajing Cosmic Ray Observatory (Tibet, China, 4300 m a.s.l., 606 g/cm2). The two arrays operated together, and coincident events have been analyzed to gather information on the PRISMA-YBJ performance [208].
The results of the combined operation ARGO-YBJ/PRISMA confirmed the excellent linearity of the EN-detector whose fast output is found proportional to the number of shower particles measured by ARGO-YBJ. Thermal neutrons are found distributed around the shower core with a very narrow lateral distribution (Fig. 46) and their total number is linearly correlated with the truncated shower size (particles within 10 m from the shower axis) measured by ARGO-YBJ. The three
$N_{\rho 10} $ selections characterize the cosmic ray energy range from 0.5 PeV to 2 PeV. Both features are consistent with the ones characterizing the EAS high energy hadrons. In-deed, electrons and hadrons are closely related to each other, many experiments proving that the number of hadrons Nh in a shower is almost proportional to the shower size Ne, that is Nh =$kN^{\alpha}_e $ with$\alpha $ varying between 0.9 and 1.0 [209]. The analysis of more than two thousands EAS events confirmed that the EN-detectors worked properly at high altitude in combination with an array of particle detectors.
Figure 46. Lateral distributions of thermal neutrons detected at Yangbajing (4100 m a.s.l.) fitted by the double exponential function. r(m) is the distance from the shower core, ρn(m−2) is the neutron density. (upper) lg(Nρ10) < 4.8; (middle) 4.8 < lg(Nρ10) < 5.4; (lower) lg(Nρ10) > 5.4, where Nρ10 is the truncated size [208], see text. (Reprinted with permission from Elsevier)
To overcome the problem of 6Li procurement, a novel type of ZnS(Ag) scintillator alloyed with B2O3, with the 10B isotope about 20%, has been developed to build up the ENDA array (see Chapter 1, Sect. IV.B).
Up to now, ENDA has totally 66 detectors (ENDA-64 and the other two as backup), ready for deploying inside LHAASO to make a hybrid detection of cosmic ray spectrum from 100 TeV to 50 PeV. ENDA will be extended up to 400 detectors with an array area of 104 m2 deployed inside LHAASO to provide additional in-formation for the study of energy spectrum and mass composition of cosmic rays up to 300 PeV. The expected capability to address the mass of the primary cosmic rays is presented in Chapter 1, Sect. IV.C.
-
Here we discuss the opportunity to perform radio-detection of extensive air showers (EAS) in combination with LHAASO measurements. In Sec. II.H.1 we present a brief status of EAS radio-detection. We then study in Sec. II.H.2 the possible benefit of radio measurements for LHAASO and finally (Sec. II.H.3) evaluate how the LHAASO detector could be instrumental in the perspective of the foreseen Giant Radio Array for Neutrino Detection [210].
-
Creation and acceleration of charges during the development of EAS induced by high energy cosmic rays naturally generates electromagnetic radiations. The dominant effect is the so-called geomagnetic effect [211], corresponding to the drift in opposite directions of positive and negative charges from the shower because of the Lorentz force associated with the Earth magnetic field Bgeo. The resulting charge current produces brief flashes (≤50 ns) of coherent radio emission in the ~10-200 MHz frequency range, linearly polarized along the Bgeo×v direction.
Radio emission by EAS was experimentally observed as soon as 1966 [212], but it was not before the new millennium that extensive experimental efforts were carried out in order to establish the radio technique as a valid tool for the study of high energy cosmic rays.
● CODALEMA and LOPES were the two pioneering experiments in the early 2000, with radio arrays composed of few tens antennas deployed over areas ≤ 1 km2, and triggers provided by ground arrays (the KASKADE-GRANDE experiment in the case of LOPES).
● LOFAR is a radio telescope deployed over several countries in Europe. Among other science goals, LOFAR aims at detecting cosmic rays with the central part of the telescope, composed of ~2400 antennas clustered on an area of ~10 km2. This high density of antennas makes LOFAR the perfect tool to study features of the radio emission created by extensive air showers. Air-shower measurements are conducted based on a trigger received from an array of scintillators (LORA). LOFAR comprises two types of antennas, recording radio emission in low-frequency band from 10 to 90 MHz and also in the high-frequency band (110-190 MHz) [213].
● The members of these three collaborations later joined efforts with others to develop the Auger Engineering Radio Array (AERA), with the explicit goal to test if radio-antenna arrays could eventually replace the standard technics (ground arrays or fluorescence detectors) for future UHECRs detectors. This was motivated by the fact that radio antennas were suspected to be cheaper, easily deployable and would require minimal maintenance and would thus be potentially well suited to the giant detector surfaces required for the detection of UHECRs. AERA is an array of 150 radio antennas working in the 30-80 MHz frequency range and deployed over ~17 km2 with array stepsize between 150 and 350 m. AERA is located in a region with a higher density of water-Cerenkov detectors (on a 750 m grid) and within the field of view of the HEAT fluorescence telescope, allowing for the calibration of the radio signal using super-hybrid air-shower measurements, i.e., recording simultaneously the fluorescence light, the particles at the ground and the radio emission from extensive air showers [213].
● Tunka-Rex is the radio extension of the Tunka observatory for cosmic-ray air showers. Its main detector, Tunka-133, is an array of non-imaging photomultipliers detecting the Cherenkov light emitted by the air-showers in the atmosphere in the energy range of 1016 to 1018 eV. Tunka-Rex is composed of 25 antennas deployed over 1 km2 [214].
● TREND [215] (Tianshan Radio Experiment for Neutrino Detection) is a setup composed of 50 self-triggered antennas running in the 30-100 MHz frequency range deployed over 1.5 km2 on the site of the 21 CMA radio-interferometer in the Tianshan mountains, Xinjiang Autonomous Province, China. Compared to the above-mentioned projects, all triggered by other types of detectors, TREND specifically focuses on autonomous detection and identification of EAS with radio signals only.
A decade of efforts by these various experiments brought some significant results :
● As the geomagnetic effect is the dominant contribution to the radio signal of air showers, its strength strongly depends on its direction of origin, and more precisely on the geomagnetic angle (v, Bgeo). For air showers developing in a direction perpendicular to the geomagnetic field, energies down to few 1016 eV could be detected by dense arrays like CODALEMA or LOFAR [216]. An efficiency larger than 80% is reached by CODALEMA for energies above 1017 eV [217]. Detection at low energies is limited by the sky background noise, due in particular to Galactic emission, which significantly affects the signal-to-noise ratio. It should be noted however that, to our knowledge, no specific signal treatment was ever applied to identify low amplitude radio pulses in the data. As both noise (from measurements) and air-shower induced radio waveforms (from simulations) can be determined, a dedicated filtering treatment might allow to dig out EAS-induced radio signals from noise for primary energies down to 1016 eV.
● LOPES, LOFAR and AERA were able, thanks to their ~ns timing resolution, to reconstruct the direction of origin of the incoming cosmic particle from the radio data with a precision of a fraction of a degree typically [218], using a conical parameterization of the shower front [219].
● As the strength of the electromagnetic field is directly related to the number of particles in the shower (coherent radio emission), it is possible to estimate the energy of the primary cosmic particle from the radio signal in a rather straightforward way. A 17% precision was achieved by AERA [220] and 20% by Tunka [214] (see Fig. 47).

Figure 47. (color online) (upper) Radio-energy estimator Sradio as a function of the cosmic-ray energy measured with the Auger surface detector. Green filled circles denote air showers with at least five stations with signal. Open circles denote events with less than five stations with signal and use the surface detector core position. A 17% energy resolution could be achieved for events with 5+ stations triggered. Taken from [220]. (lower) Correlation of the shower energy reconstructed with Tunka-Rex radio and Tunka-133 air-Cherenkov measurement. Taken from [214].
● The radio signal pattern at ground depends on the longitudinal development of the shower, and in particular on the position of its maximum of development
$ X_{\max} $ , as can be seen from Fig. 48. It is therefore possible in principle to perform a measurement of$ X_{\max} $ and hence determine the nature of the primary from the radio data. Various technics were used: LOPES used the information on the shape of the radio wavefront (with a smaller curvature radius for showers developing deeper in the atmosphere) to achieve a 140 g/cm2 resolution on$ X_{\max} $ , while simulation indicate that precision as good as 30 g/cm2 may be achieved for denser and/or more extended arrays deployed in quieter radio environment [218]. Tunka-Rex estimated$ X_{\max} $ with a ~40 g/cm2 accuracy by measuring the slope of the lateral intensity profile of radio footprint at ground (steeper for showers developing deeper in the atmosphere) [214]. LOFAR took advantage of it high-density array to reach a 17 g/cm2 using a similar technique [221]. AERA developed very recently a method based on the measured frequency spectrum (flatter for showers developing higher in the atmosphere), allowing in principle to measure$ X_{\max} $ from a single antenna only, and reaching a ~20 g/cm2 resolution for a subset of AERA events [222].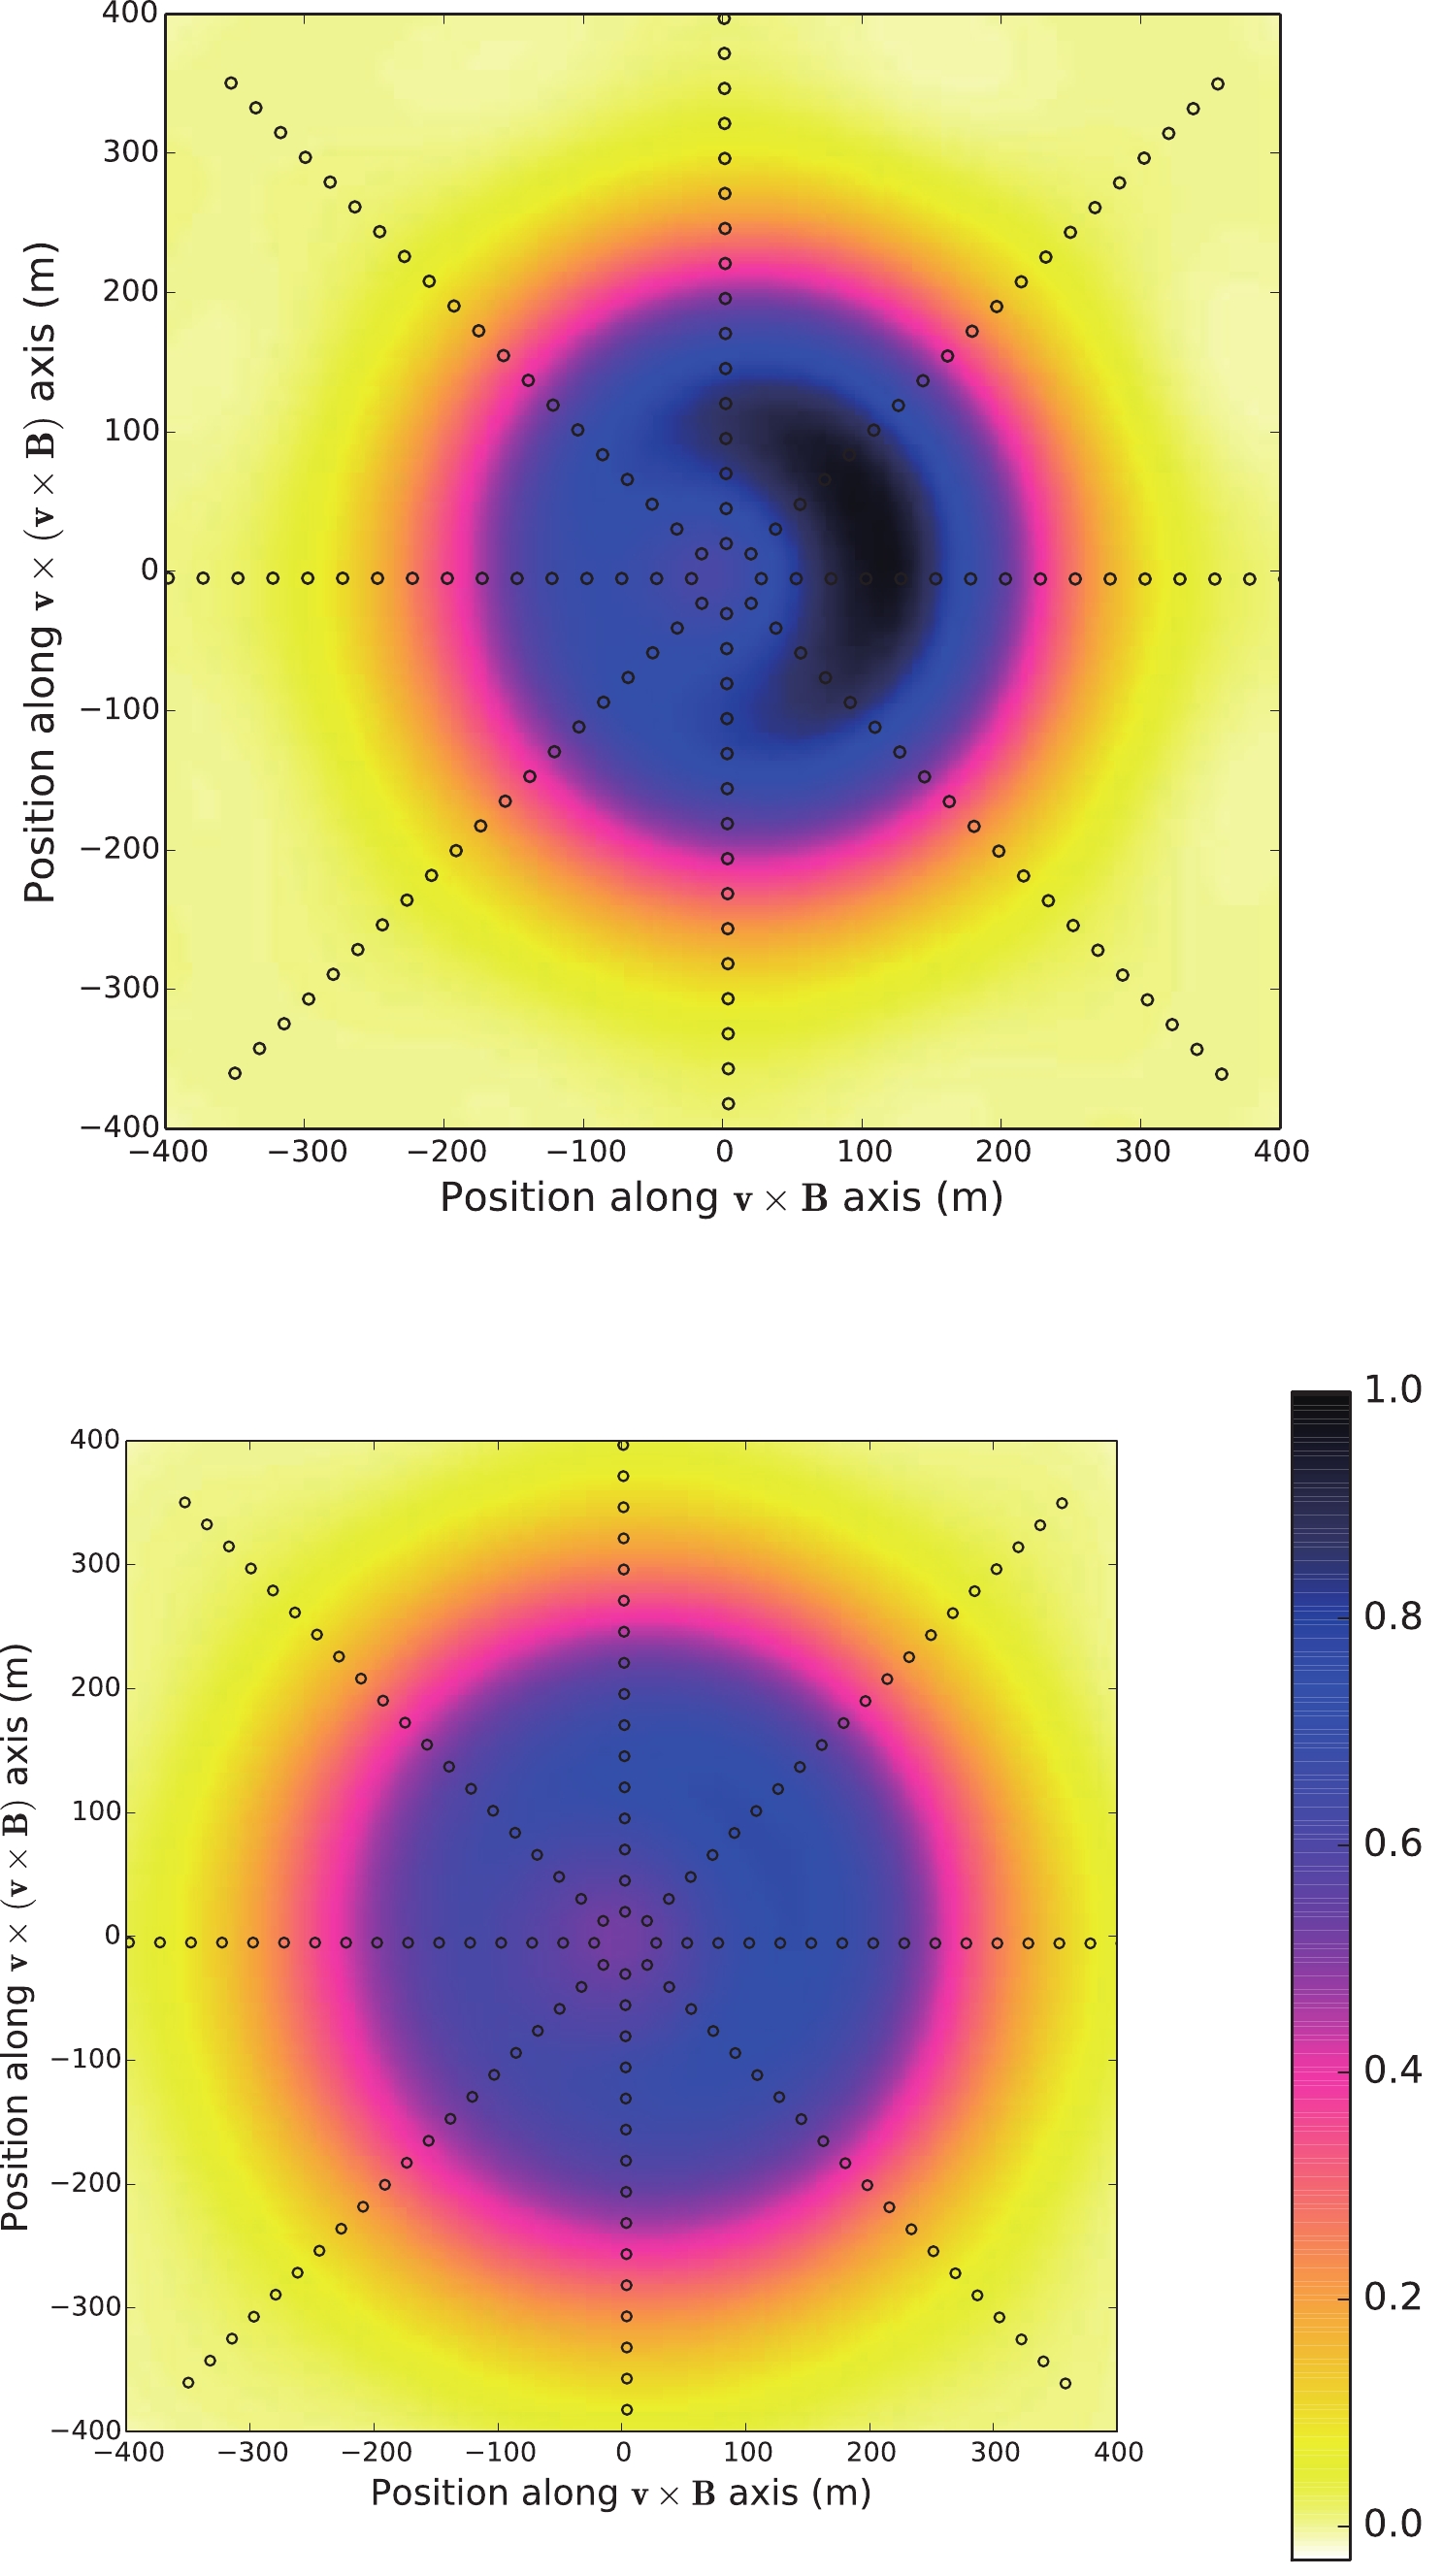
Figure 48. (color online) Radio profiles in arbitrary units for a proton shower with
$X_{\max}$ = 794 g/cm2 (upper) and an iron shower with$X_{\max}$ = 573 g/cm2 (lower). Both showers have an energy of 2.3 1017 eV and a zenith angle of 49 degrees. Taken from [221].● The TREND experiment focused on the detection and identification of air showers based on their radio signals only. To achieve this result, TREND developed a DAQ system allowing for a ~200 Hz trigger rate for each antenna and performed an offline identification of air shower signals based on their specific characteristics, following an algorithm detailed in [223]. TREND could select 465 EAS candidates for 317 live days of data. According to simulations, the distribution of the direction of arrival of these events follows rather well that expected for EAS with energies of 1017 eV for zenith angles
$ \theta\leq $ 70° (see Fig. 49). This result, still to be refined, indicates that it is possible to trigger and identify EAS with a self triggered radio array, with a limited contamination by background events. However TREND detection efficiency was estimated to be around 10% only because of the background rejection cuts applied. Other EAS selection procedures may have to be found to improve the EAS detection efficiency.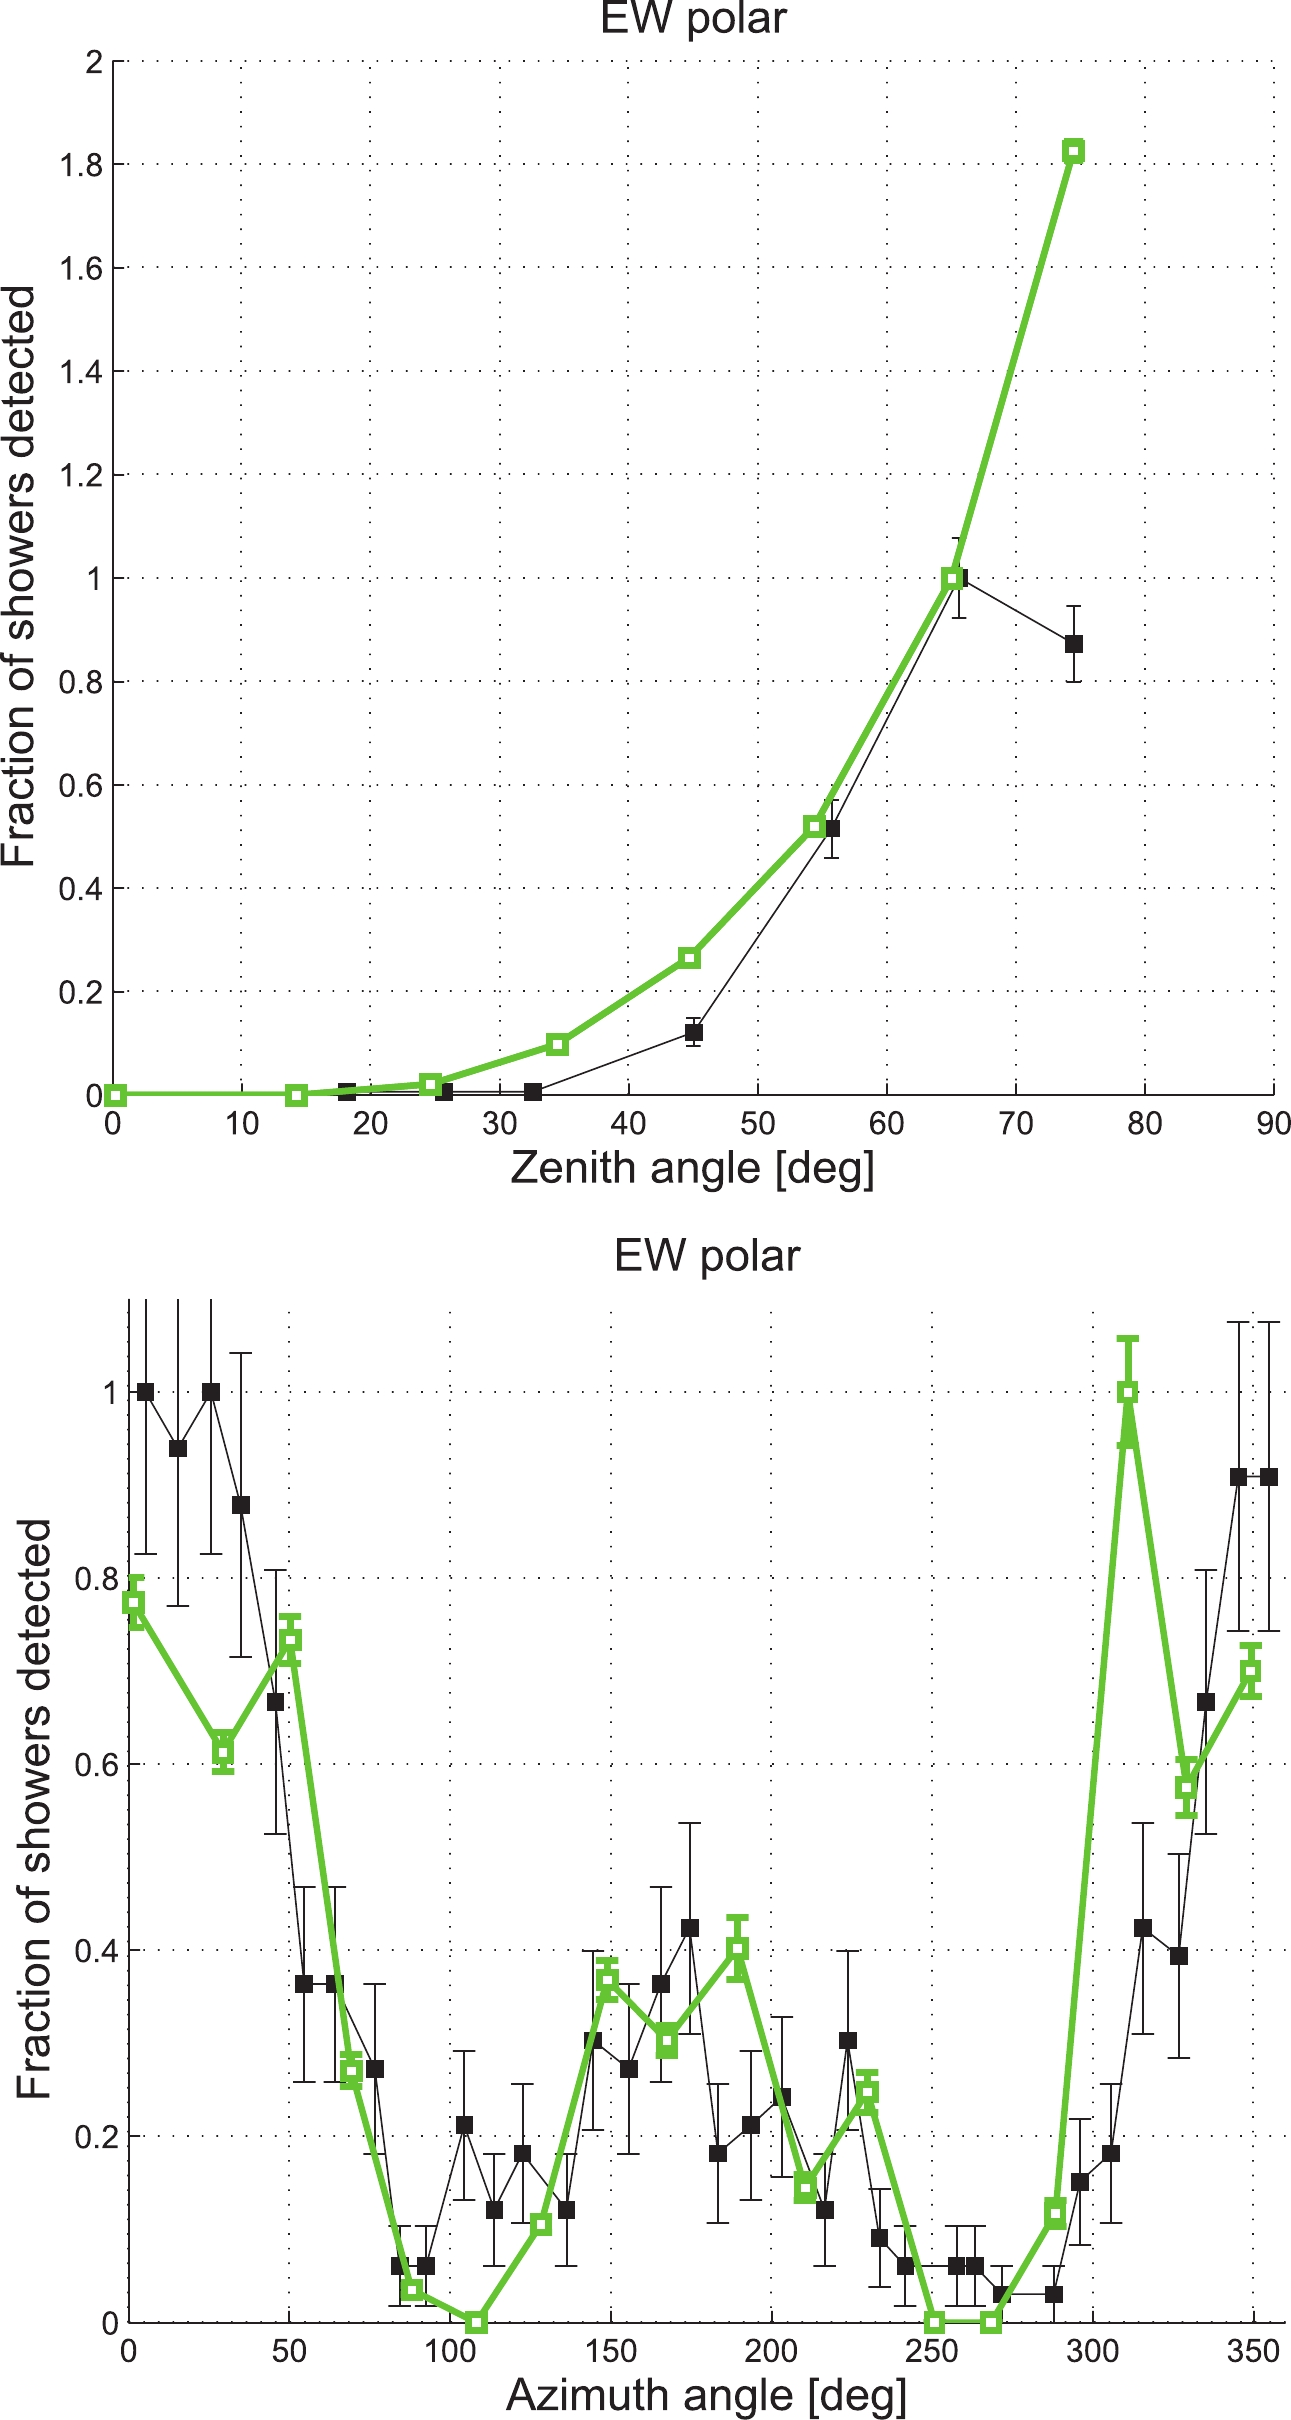
Figure 49. (color online) Distribution of reconstructed zenith (upper) and azimuth (lower) angles for the 465 EAS radio candidates selected in the 317 live days of TREND data (black squares). Also shown are the expected distributions for air showers initiated by protons with E = 1017 eV (green empty squares).
The experimental developments above detailed allowed a better understanding of EAS radio emission, thus feeding the various simulation codes [224-226] developed and refined in that period of time, which now fit very well the experimental data. These codes in turn constitute a very valuable tool to further develop the air-shower radio detection technique.
If nice results were achieved by EAS radio detection, some limitations were reached as well. We may stress in particular the fact that the radio emission is very much beamed around the shower axis, with an abrupt exponential drop when moving away from the shower core (signal typically divided by 10 between 100 and 200 m from the shower core for a vertical shower). This feature does not significantly depend on the energy, which implies that arrays of very high density (detector spacing ~50 m) would be necessary to perform EAS radio-detection and reconstruction. This is not realistic for UHECRs detection, which requires huge detection areas. This statement however has to be mitigated by the observation that the EAS radio footprint at ground is much larger for inclined showers [227], as the zone of main electromagnetic emission (mostly around
$ X_{\max} $ ) is in that case much more distant from ground, and also because the projection of the radio emission cone on a flat ground is, by construction, more elongated for inclined trajectories. Giant radio arrays might therefore be able to perform a competitive study of UHECRs by selected inclined trajectories. This is presently being studied in the framework of the GRAND project [210].Another major issue for EAS radio-detection is the high rate of background events. Even in remote areas like the TREND site, background radio sources (trains, planes, cars, but even more frequently HV lines and electric transformers) generate event rates that surpass the EAS flux by orders of magnitudes [223]. The DAQ system of a radio array has to take into account this constraint in order to perform autonomous triggering successfully. GRANDproto should allow to determine the EAS detection efficiency and background rejection potential achievable for an autonomous radio array. GRANDproto [228] is an hybrid setup composed of 35 radio-antennas with a DAQ guaranteeing a 0% dead time for an individual antenna trigger rate up to 5 kHz, running in parallel to a cosmic ray detection array of 21 scintillators. EAS radio-candidates will be selected based on the events polarization information measured by the triggered antennas, while the scintillator array will be used as a cross-check to the EAS nature of the selected radio candidates, thus allowing a quantitative determination of the background rejection potential of the array. GRANDproto will be fully deployed in summer 2016.
-
Here we only give some hints on the potential added value of EAS radio measurements for LHAASO, in the light of the status presented in Sec. II.H.1. We should stress however that a rigorous response to this issue would require a dedicated study based on detailed simulations taking into account the specifics of LHAASO (altitude, magnetic field at the detector location, electromagnetic background,...) in order to determine what goals and performances would be actually achievable.
In the light of LOPES, Tunka or AERA results for example, it seems realistic to think that a radio array deployed at the LHAASO location could provide an independent measurement of cosmic ray parameters (energy and
$ X_{\max} $ in particular) with good precision, provided the electromagnetic background level is low enough at the LHAASO site, and that other detectors (PMTs in particular) are well shielded. There is no reason to think that performances similar to present arrays (energy resolution of 15%-20%,$ X_{\rm max} $ resolution in the range of 20 to 40 g/cm2) should not be achievable. An external trigger could be provided by LHAASO detectors to circumvent the challenges of radio autonomous trigger mentioned in the previous section. We shall stress however that the threshold for radio is presently ~1017 eV for the energy measurement, and even higher for$ X_{\max} $ . It is possible that a very dense array (~50 m detector spacing), and a dedicated signal treatment to improve signal-to-noise ratio could lower this threshold, but this is hard to assess a priori. We suggest that a radio array may be interesting as a complement to the high energy end of the KM2A array measurements ($ X_{\max} $ ), or as a complement to WFCTA in order to better constrain the shower geometry through the measurement of the shower core position. -
GRAND [210] is a proposal to build a giant radio array (total area of 200000 km2) primarily aiming at detecting cosmic neutrinos. The project is still at a very early stage, and many issues have to be studied and solved before the project comes to reality. Preliminary sensitivity studies are however extremely promising, with an expected sensitivity guaranteeing -even for the weakest expected fluxes [229]- the detection of the so-called cosmogenic neutrinos produced by the interaction of UHECRs with CMB photons during their cosmic journey [230, 231].
Among the many steps to be completed before GRAND comes to life, an important one will consist in deploying a ~1000 km2 engineering array (GRAND-EA) composed of ~1000 antennas in order to validate the technological choices defined for GRAND. This array will obviously be too small to perform a neutrino search, but cosmic rays should be detected above
$ 10^{18} $ eV. Their reconstructed properties (energy spectrum, directions of arrival, nature of the primaries) will enable us to validate this stage, if found to be compatible with the expectations. Even if the two detectors areas differ a lot, it may be interesting to consider in more details a deployment of GRAND-EA around the LHAASO experimental site. An independent detection by the 2 setups of a statistically significant number of cosmic ray events would indeed be very valuable for the evaluation of GRAND-EA performances. Given the present status of the GRAND proposal, GRAND-EA could not be deployed before 3 or 4 years.
Chapter 4 Cosmic-Ray Physics
- Received Date: 2021-12-02
- Available Online: 2022-03-15
Abstract: In the first part of this Chapter the present state of knowledge from the observations of cosmic rays between 1013 and 1020 eV is summarized. This is not intended to be a complete review, but rather a broad overview of the relevant processes involving cosmic rays, including the astrophysical environments in which they take place. This overview mainly concerns experimental results and phenomenological aspects of their interpretation, therefore experiments’ description is not given but references to the vast bibliography are provided in the text. Some attempt is made to address the most popular explanations offered by theoretical models. The second part is devoted to the description of the LHAASO performance and of its capability to provide a response to several open questions, still unanswered, concerning cosmic rays above 1013 eV, highlighting which major steps forward in this field could be taken from LHAASO observations.


 DownLoad: