


 Abstract
 HTML
HTML Reference
 Related
 PDF
PDF


-

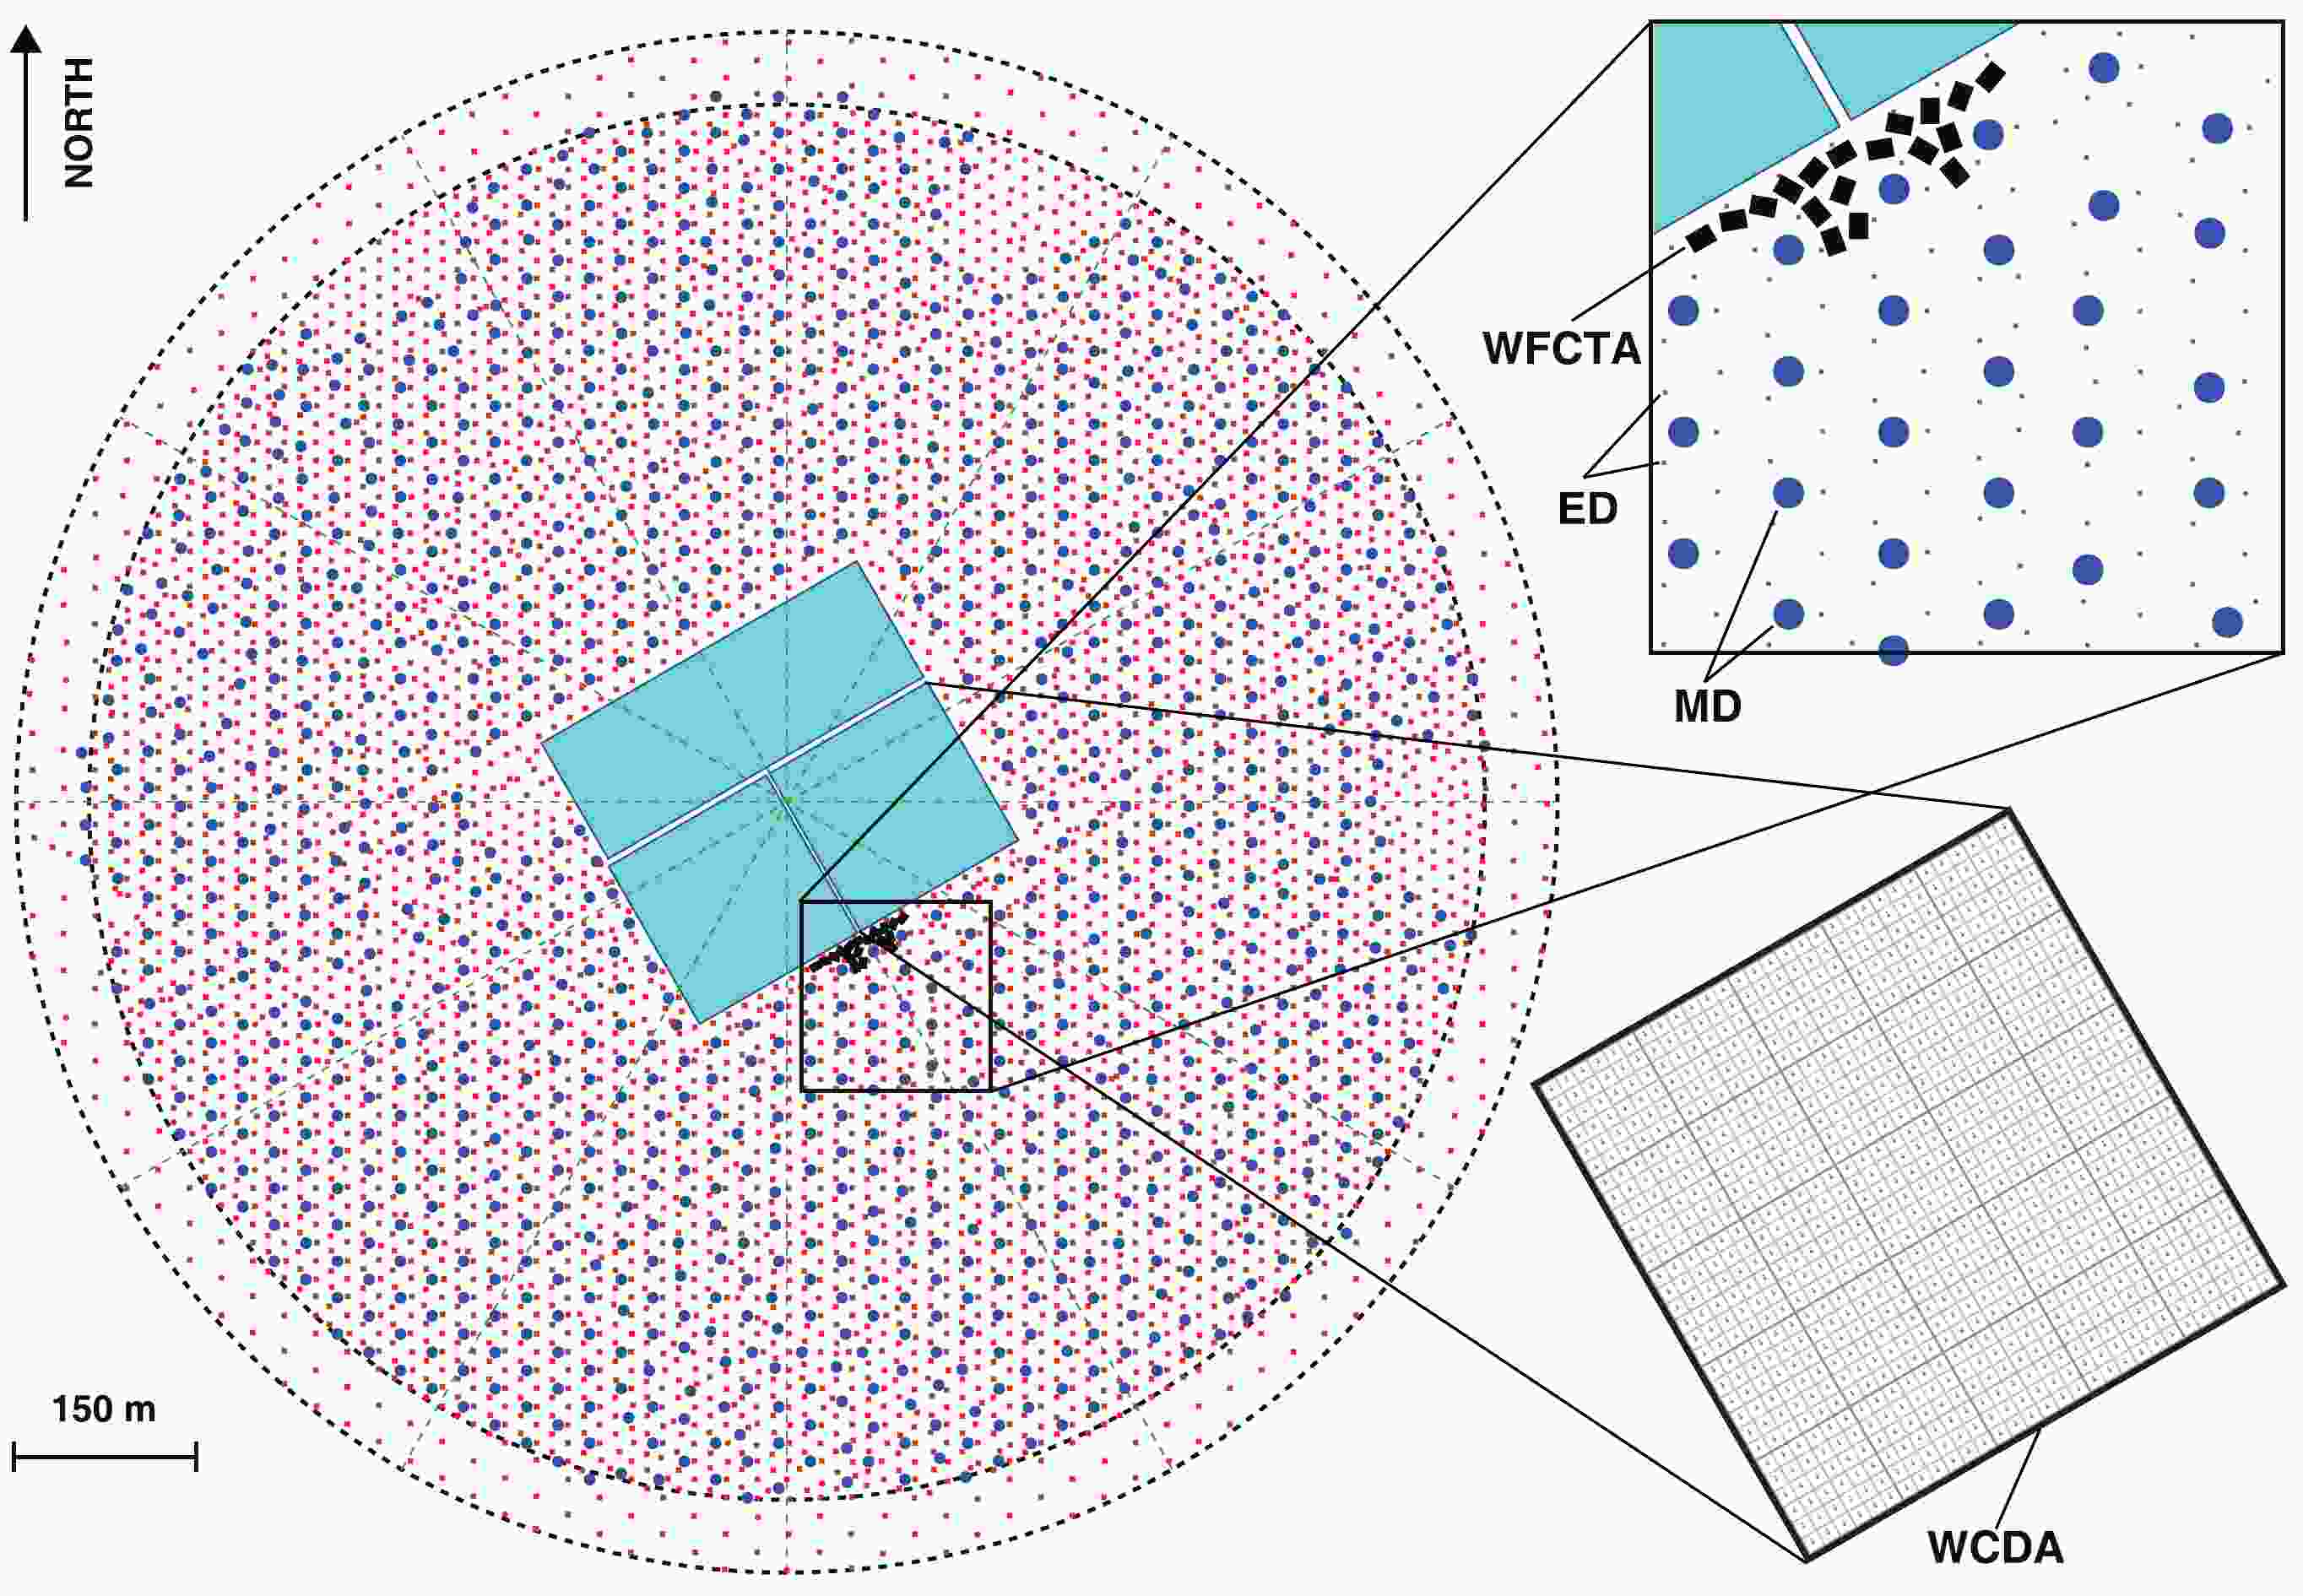
Figure 1. (color online) Layout of LHAASO.
The KM2A focuses on discovering galactic cosmic ray sources by searching for galactic gamma ray sources above 30 TeV in the northern sky and measuring primary cosmic rays in the energy range from 10 TeV to 100 PeV. The observation of a gamma-ray source with spectrum extending above 100 TeV represents an unambiguous identification of the ‘PeVatrons’, the sources of cosmic rays for energies up to the knee region of the cosmic ray spectrum.
The Crab Nebula, one of the most luminous sources of very high energy (VHE) gamma rays, is considered as a reference for detector design. The gamma ray spectrum of the Crab Nebula can be expressed as follows:
$ \frac{{\rm d}N_{\gamma}}{{\rm d}E} = 3.0\times10^{-11}E^{-2.59}{\rm cm}^{-2}{\rm s}^{-1}{\rm TeV}^{-1} \, . $

(1) Above 100 TeV, the flux of the Crab-like source is 0.45 gamma rays per km2 per hour. Considering the location of LHAASO, the effective observation on the Crab-like source, i.e., the source with same position and same spectral shape with Crab Nebula, is 6.5 hours per day. One square kilometer array will detect about 1000 gamma rays above 100 TeV from the Crab-like source and then 10 gamma rays from a source with a flux of 1% of the Crab-like source in one year.
Therefore to have reasonable effective area for this fluxes, it is necessary to instrument a geometrical area of about 1 km2 to measure extensive air showers (EAS) generated by cosmic rays in atmosphere. In order to achieve threshold energy of 30 TeV and angular resolution of few tenths of degree, the area has to be equipped with electromagnetic detectors of about 1 m2 arranged on a triangle grid with spacing of 15 m. At the same time, above 50 TeV, it is essential to have a background-free sample of gamma rays, i.e. not contaminated by the cosmic nuclei. This will be achieved in LHAASO, by a precise measurement of the muon component of the shower, which will be extremely effective in suppressing the background. An array on muon detectors (MD), each having a surface area of 36 m2, is also deployed on the same areas arranged on a triangle grid of 30 m spacing [1], to form together with the ED array, the KM2A. For gamma ray detection, KM2A has following performance: effective area can reach 0.8 km2 at 30 TeV, angular resolution is
$ 0.4^{\circ} $ at 30 TeV and$ 0.2^{\circ} $ at 1 PeV, core position resolution is 7 m at 30 TeV and 2 m at 1 PeV, and energy resolution is 28% at 30 TeV (Fig. 2). KM2A will reach a sensitivity of about 1% of a Crab-like source for energy of 100 TeV in one year of observation [1, 2].
Figure 2. (color online) Effective area (upper left), Angular resolution (upper right), Core position resolution (lower left) and Energy resolution (lower right) of KM2A varies with primary energy [1].
-
The ED array is uniformly distributed over 1.3 km2. It is divided into two parts: the central array consisting of 4911 EDs with 15 m spacing in a circle area with radius of 575 m, and the guarding ring array consisting of 305 EDs with 30 m spacing surrounding the central one with outer radius of 635 m. The whole array will work for more than 20 years with good stability under severe environmental condition, with large temperature variation (±25°C annually), low atmospheric pressure (0.6 atm) and high humidity [3]. In addition, In order to ensure that the statistical error and dynamic range meet the design requirements, EDs should have a uniformity within 10%. The signal attenuation is required to be less than 20% in 10 years due to detector aging. The main performance of ED are listed in Table 1.
Item Value Sensitive area 1 m2 Secondary electromagnetic particles measured ${\mu}^{\pm}, {\rm{e^{\pm}}}, \gamma$ 

Dynamic range 1-104 particles/m2 Particles counting resolution 25% @ single particle,
5% @ 104 particles.Time resolution < 2 ns Total detection efficiency for charged particles > 95% Counting rate at nominal working gain and threshold < 2 kHz Table 1. The main characteristic and performance parameters of ED.
-
A detection sensitive unit of ED (Fig. 3) consists of a plastic scintillator tile (BC408), 12 wavelength shifting (WLS) fibers (BCF92SC, single cladding), a layer of tyvek wrapper (1082D) and black cloth [4]. The tile has high detection efficiency for charged particles, quick response time and good stability. The tile size is
$ \rm{100\; cm \times 25\; cm \times 1\; cm} $ (length × width × thickness) (Fig. 3). Twelve fibers with length of 2.7 m and diameter of 1.5 mm are routed in 24 grooves on the tile. The groove section is shaped like a reverse Ω with depth of 1.5 mm and diameter of 1.7 mm. Each fiber passes in the tile twice through two grooves. The separation between fibers is 4.16 cm. Each tile is wrapped with a layer of Tyvek to improve photon collection efficiency. The tile assembly is covered with black cloth to avoid external and inter-tile optical crosstalk.
Figure 3. (color online) Photos of ED. Left: One tile of scintillator. Right: A detection sensitive unit.
One ED is composed of four detection sensitive units, a photomultiplier tube (PMT) (XP3960, 9 linear focused dynode stages, 1.5 inch end window), an electronics system, a power supply system and a shell (Fig. 4). Four detection sensitive units are installed into the steel shell symmetrically to cover the 1 m2 detection area [4] (Fig. 5). All ends of 96 fibers are bunched together to be polished and coupled directly to the PMT photocathode. In order to increase detection efficiency for secondary γ and absorb charged particles with low energy to improve the angular resolution, a 5 mm thick lead layer is placed on the surface of each ED to convert γ into electron-positron pairs.

Figure 4. (color online) ED Detector details. The PMT used (left), The readout electronics (middle) and Power supply system (right).
Figure 5. (color online) Photo of an assembled ED sensitive unit.
To build the ED array, more than 5,000 PMTs, 20,000 plastic scintillators and about 720 km WLS fibers are used. To ensure homogeneous response of detectors, for each component a batch test system has been built. Test results of scintillators and fibers show that the light output uniformity between scintillators is below 5% and light attenuation length of fibers is 3 m with 10% differences. The assembled detectors are all tested and qualified before they are sent to the LHAASO site for installation (Fig. 6).
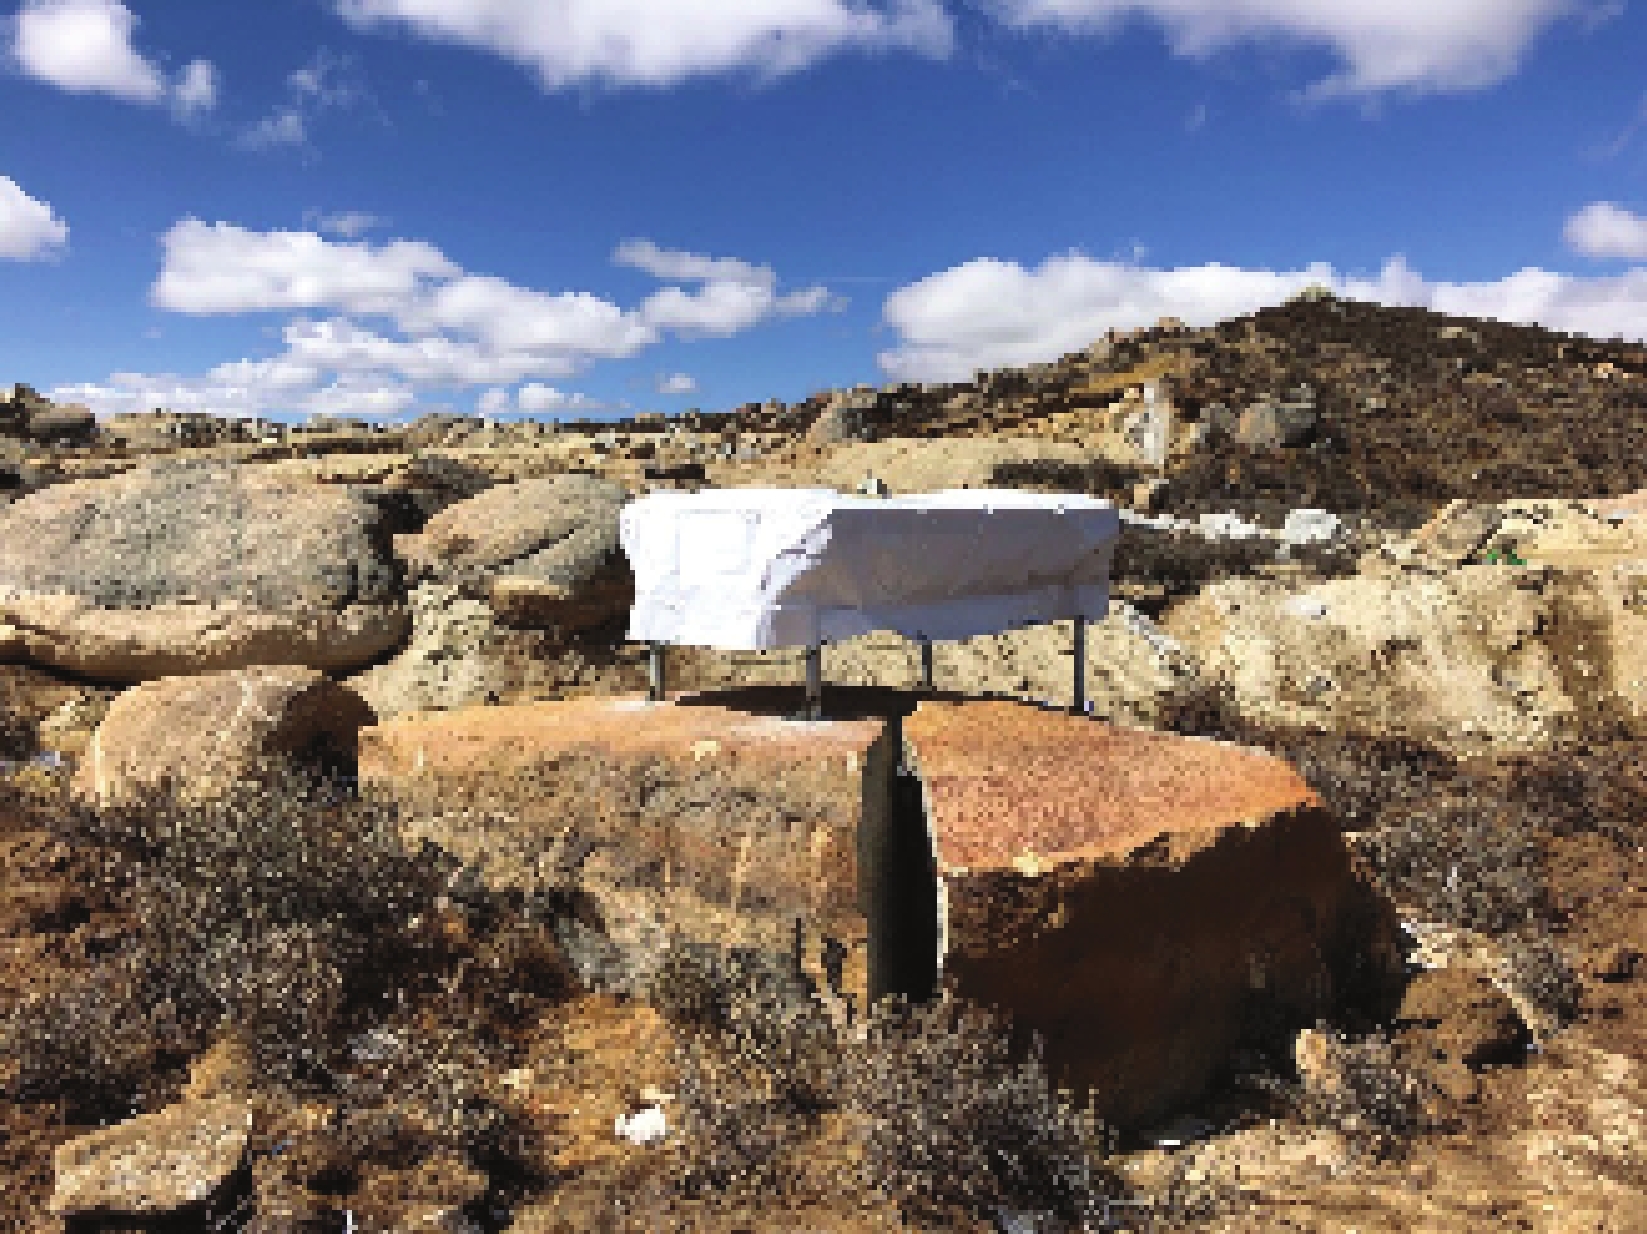
Figure 6. (color online) Photo of an installed ED.
To achieve the large dynamic range required (4 orders of magnitude), an optimal design of the voltage divider with anode and the 6th dynode readout has been developed [5]. Ratio of anode current to dynode current is around 110. The temperature coefficient is less than 0.2%/°C. PMT is wrapped in a magnetic shielding film of permalloy to reduce the influence of geomagnetic field.
The ED electronics system adopts a trigger-less, independent, front-end digitization scheme (see Fig. 7) where each detector has a local front-end electronics (FEE) for signal digitalization and data transmission to the Data Acquisition (DAQ) system. Data contains arrival time information of hits, accurate charge information, slow control, register feedback, etc. Anode charge measurement ranges from 0.64 pC to 256 pC, and for dynode ranges from 0.32 pC to 128 pC. Charge accuracy is 3% for 1 particle and 1% for 104 particles, and time accuracy is 0.5 ns. Stable operation are guaranteed for temperature ranging from −35°C to 55 °C. With help of the White Rabbit clock system, the FEEs of the different EDs are synchronized among them with a precision of 500 ps. The ED FEEs also allow to measure charge with high precision on the full scale array. The PMT and FEE are powered by the same power supply, but the high voltage of PMT can be adjusted independently. Together with detection units, electronic system and power supply system, a temperature and humidity monitoring system is also installed inside the detector shell [4].
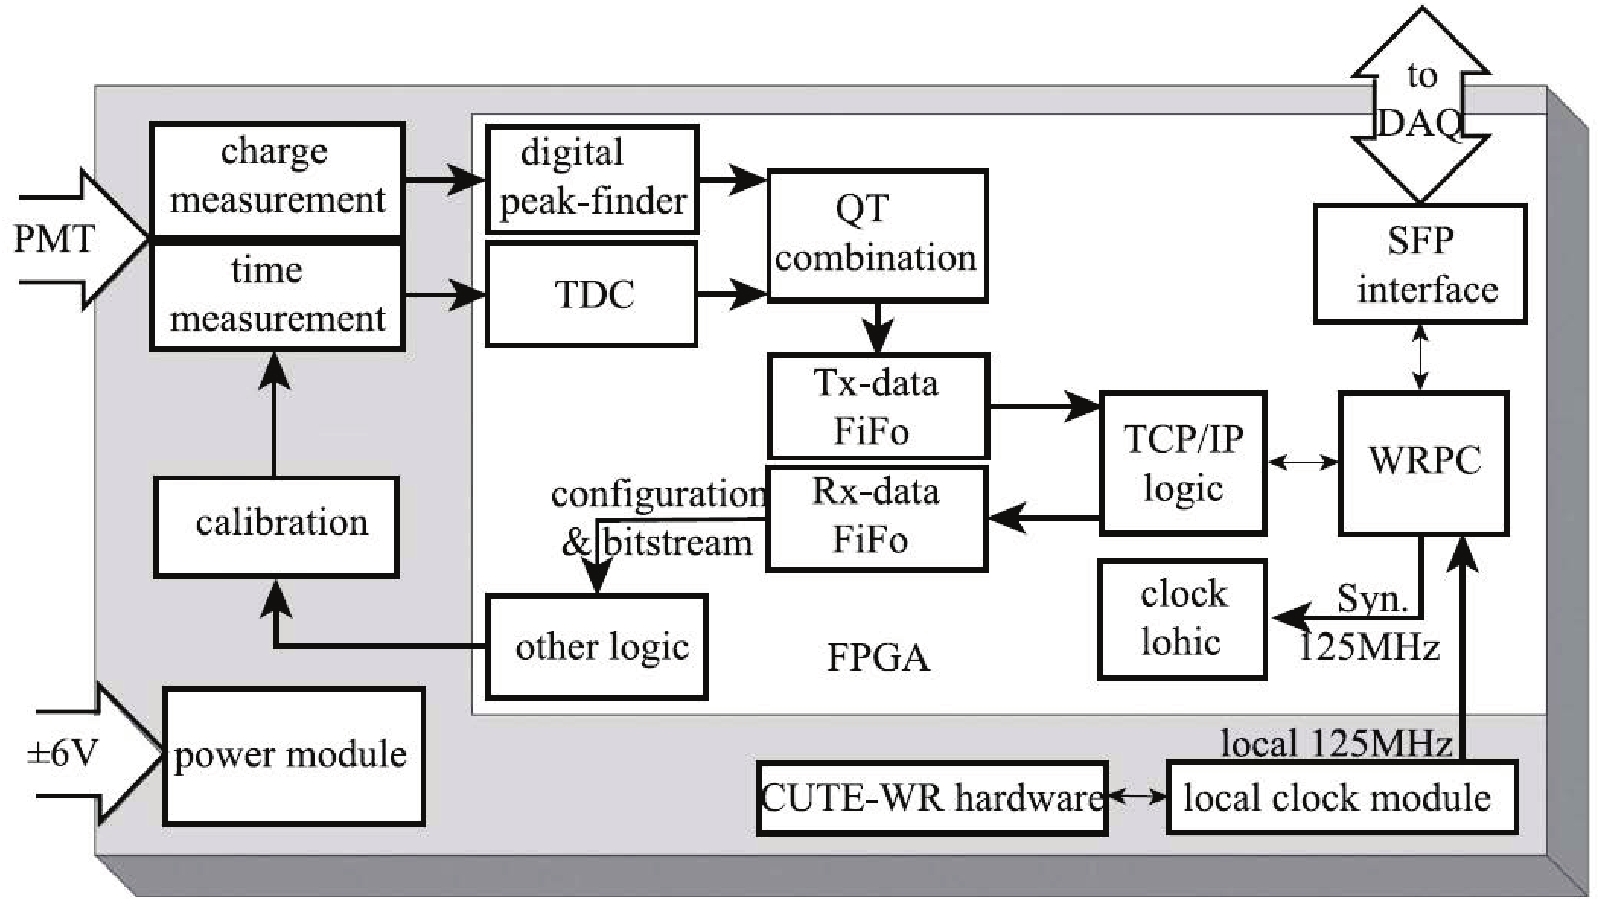
Figure 7. Block diagram of electronics system of ED [6].
-
In order to test the overall performance of ED, Shandong University sets up an ED batch test system (Fig. 8). A telescope system made of scintillator layers is used as a trigger to measure the time of arrival of nearly vertical single cosmic muons. The triggered muon tracks are reconstructed with a gas detector. The reconstructed cosmic-muons allow to scan the ED surface and measure its performance with pixel size of 5 cm × 5 cm [7]. The performance test results of one batch of EDs are listed in Table 2.

Figure 8. (color online) Photo of the ED batch test system.
Detector performance Requirement Batch test results p.e.s (no Lead plate) > 20 20.6 ± 1.8 Single muon spectral resolution < 25% (12.7 ± 1.7) % Time resolution < 2 ns 1.62 ± 0.06 ns Detection efficiency > 95% (97.8±0.4) Table 2. Performance test results of the unit ED.
Single particle charge spectrum is acquired and fitted with the convolution of Landau with a Gaussian function [4] (Fig. 9). Photo-electrons (p.e.s) are proportional to the charge measured, which is extracted from the peak. Uniformity of Single particle peak of one ED is shown in Fig. 10. For the time resolution measurement, hit times of ED are compared with the one of the telescope trigger system. The width of distribution of difference between them includes time resolutions of ED and the telescope. Time resolution of the telescope is known and therefore the ED time resolution can be extracted (see Fig. 11). The detection efficiency is measured by the telescope system with muons triggering (Fig. 12). Counting rate refers to the signal rate that exceeds threshold of electronics, which is mainly contributed by the minimum ionization particle (M.I.P.) signal, dark noise of PMT and background radiation. Counting rate is measured below 1 kHz in a laboratory at low altitude. At the LHAASO site, including background and signal, the average counting rate of more than two thousand EDs is (1.7 ± 0.3) kHz.
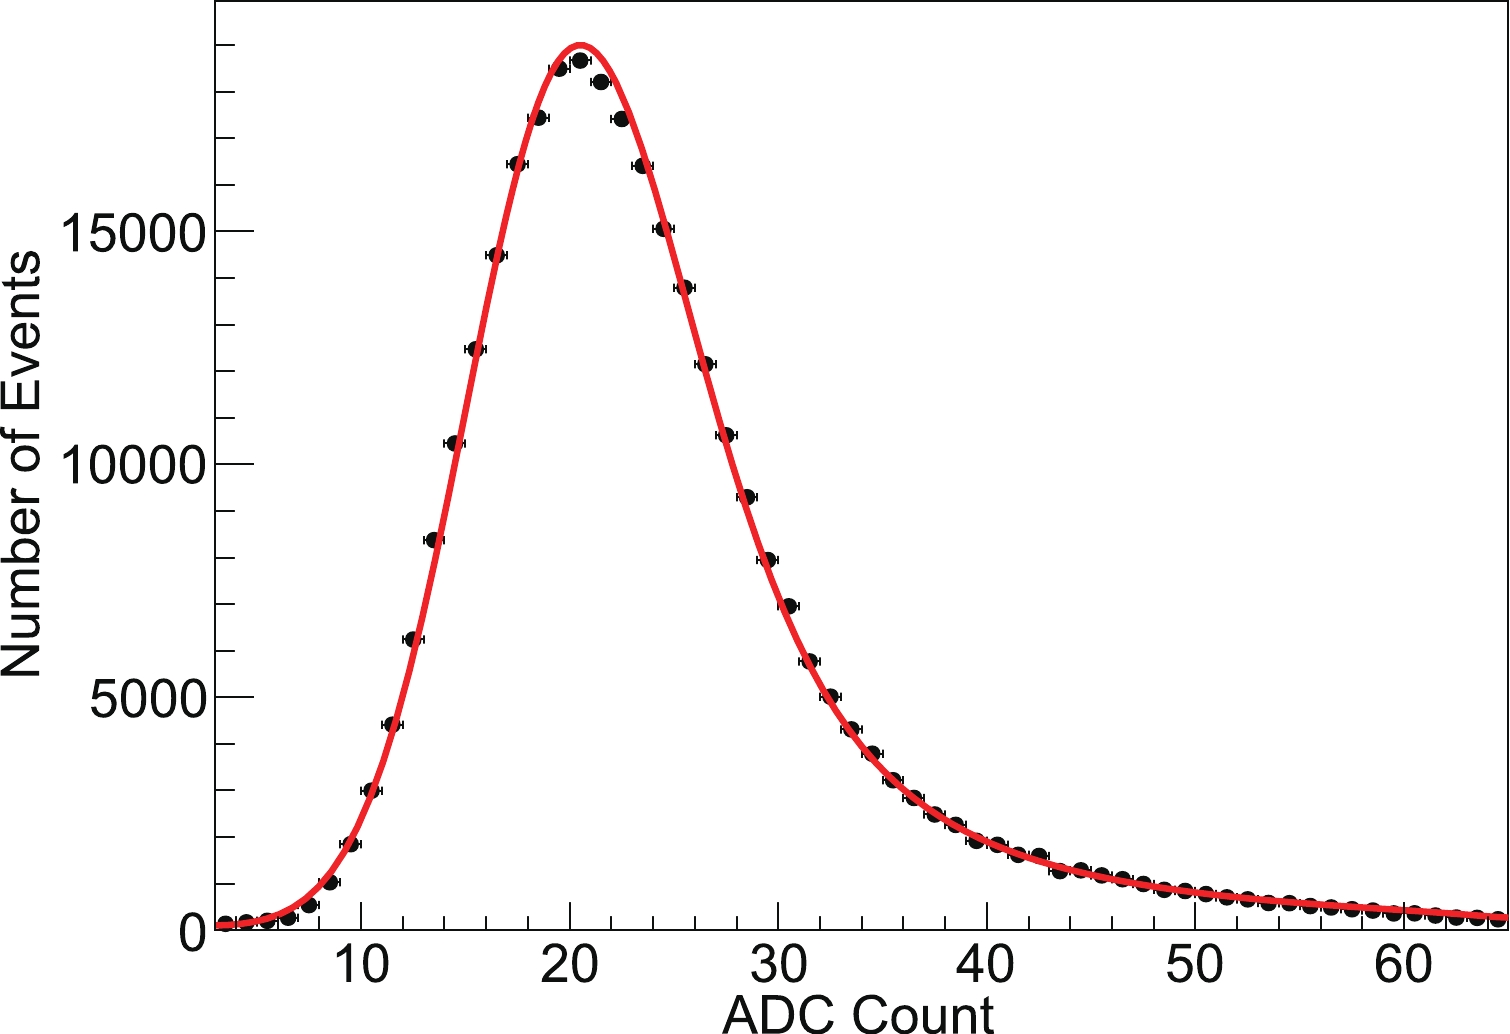
Figure 9. (color online) Single particle charge spectrum (black dots) of one ED fitted with the convolution of Landau with Gaussian function (red line) [8].

Figure 10. (color online) Scanning result of Single particle peak of one ED [8].
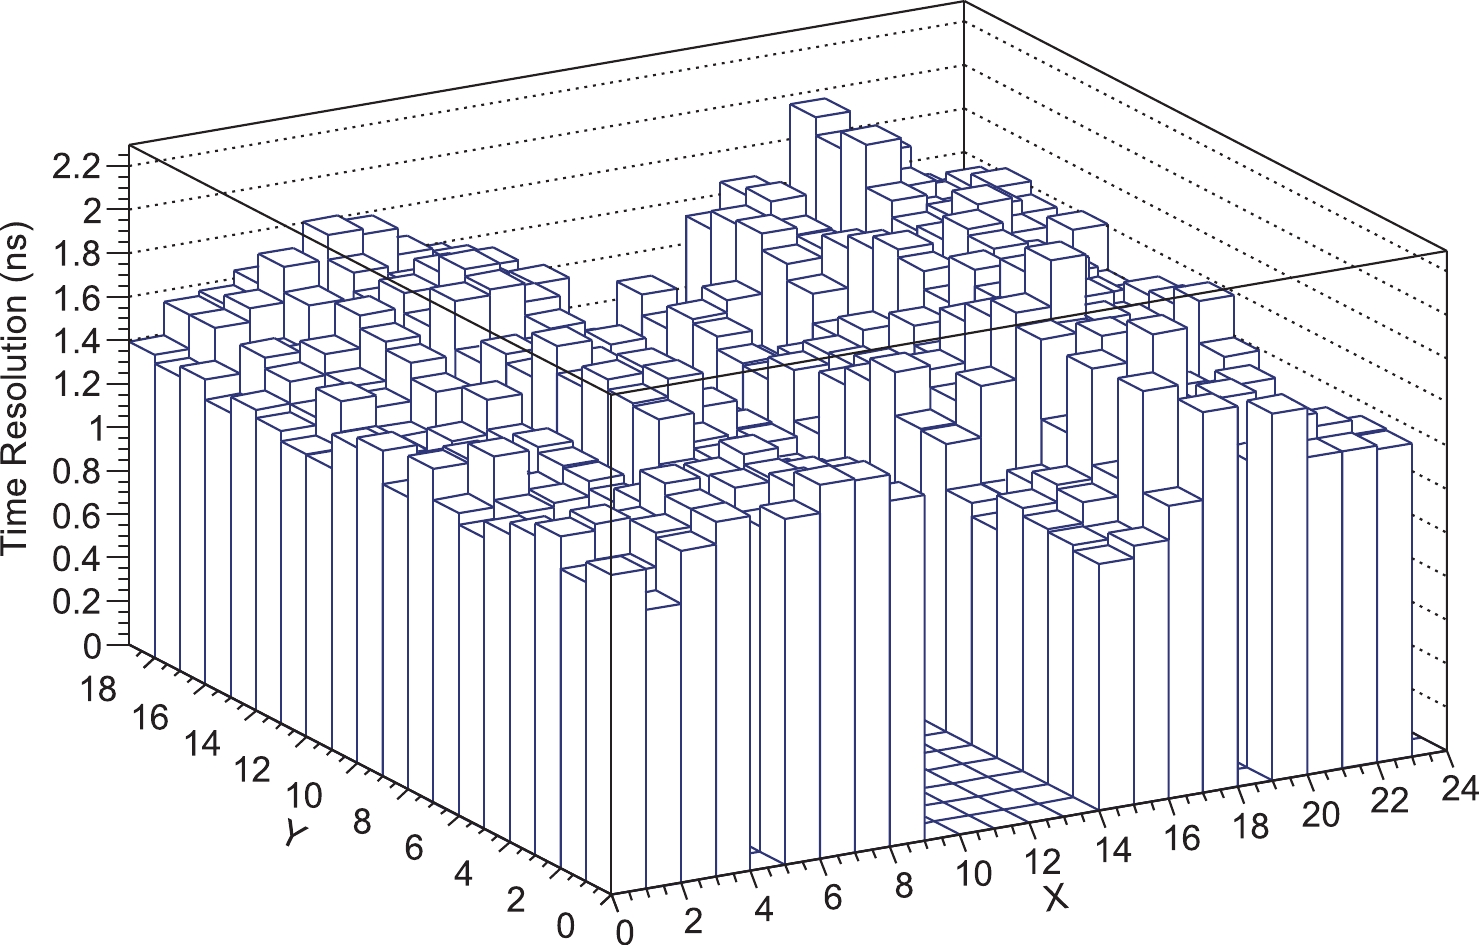
Figure 11. (color online) Scanning result of time resolution of one ED [8].
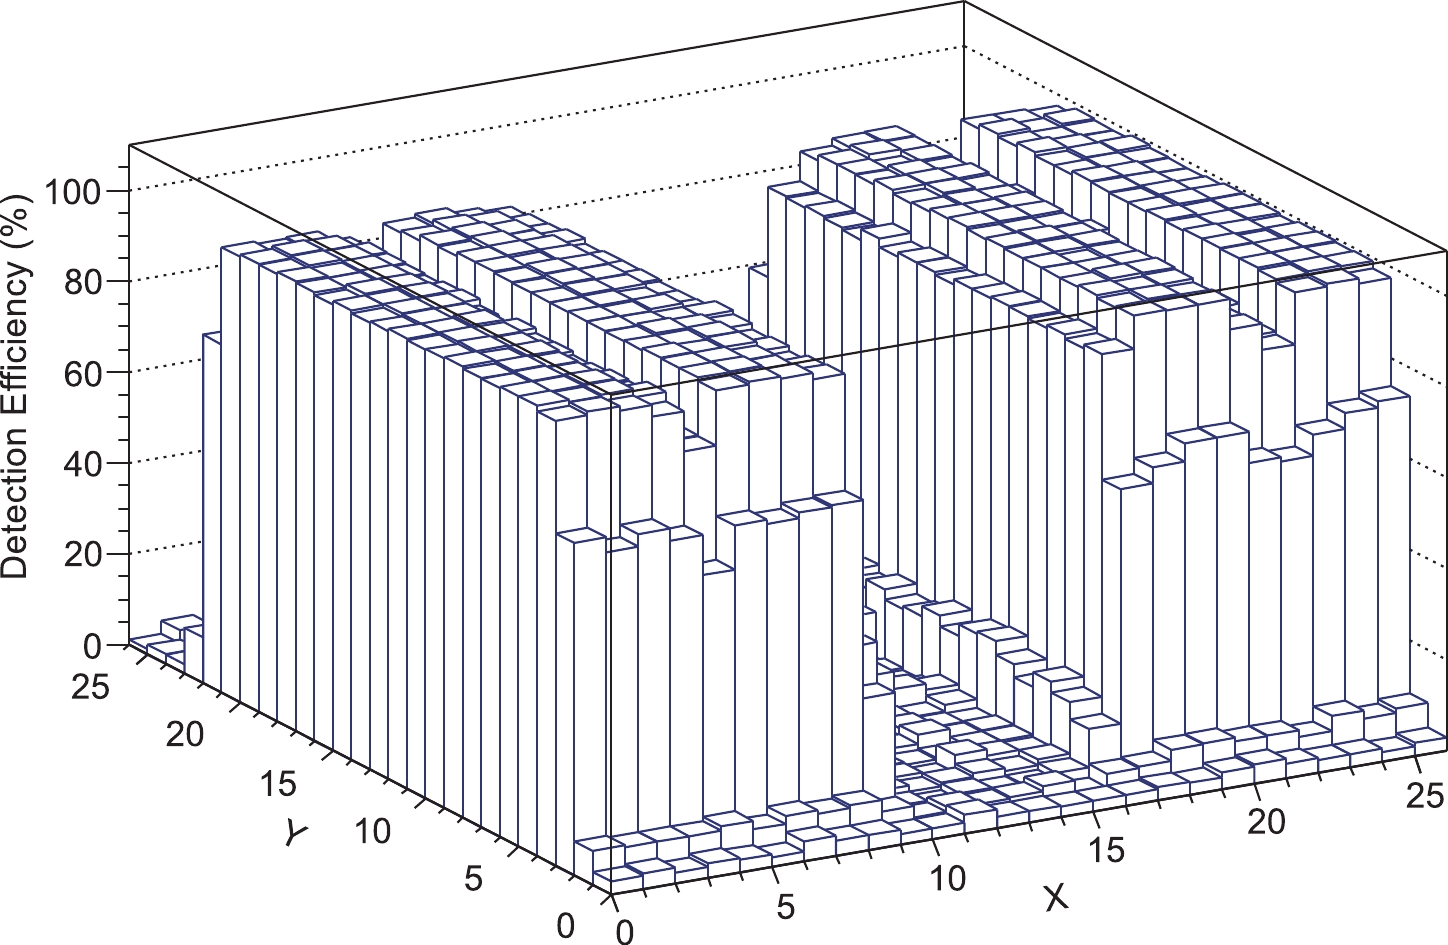
Figure 12. (color online) Scanning result of detection efficiency of one ED [8].
-
In August 2021, all 5216 EDs have been installed and science operation started (Fig. 13). Performance of the full array meets the design requirements. All timestamps are accurately synchronized to within 1 ns [9]. Anode and dynode output charge distributions are consistent with expectation and the overlapping of anode and dynode current reading allow to scan the full dynamic range (Fig. 14). All EDs run stably (Fig. 15) and trigger rate of the array stays constant over time (Fig. 16). Secondary-particle fronts of EAS are reconstructed and detected smoothly (see Fig. 17), and also the high significance of moon shadow is obtained (Fig. 18).

Figure 13. (color online) The layout of the full EDs.
Figure 14. (color online) ED output charge distribution of anode (blue line), which is saturated at 4095, and dynode (green line). (Provided by Hong-Kui Lv.)
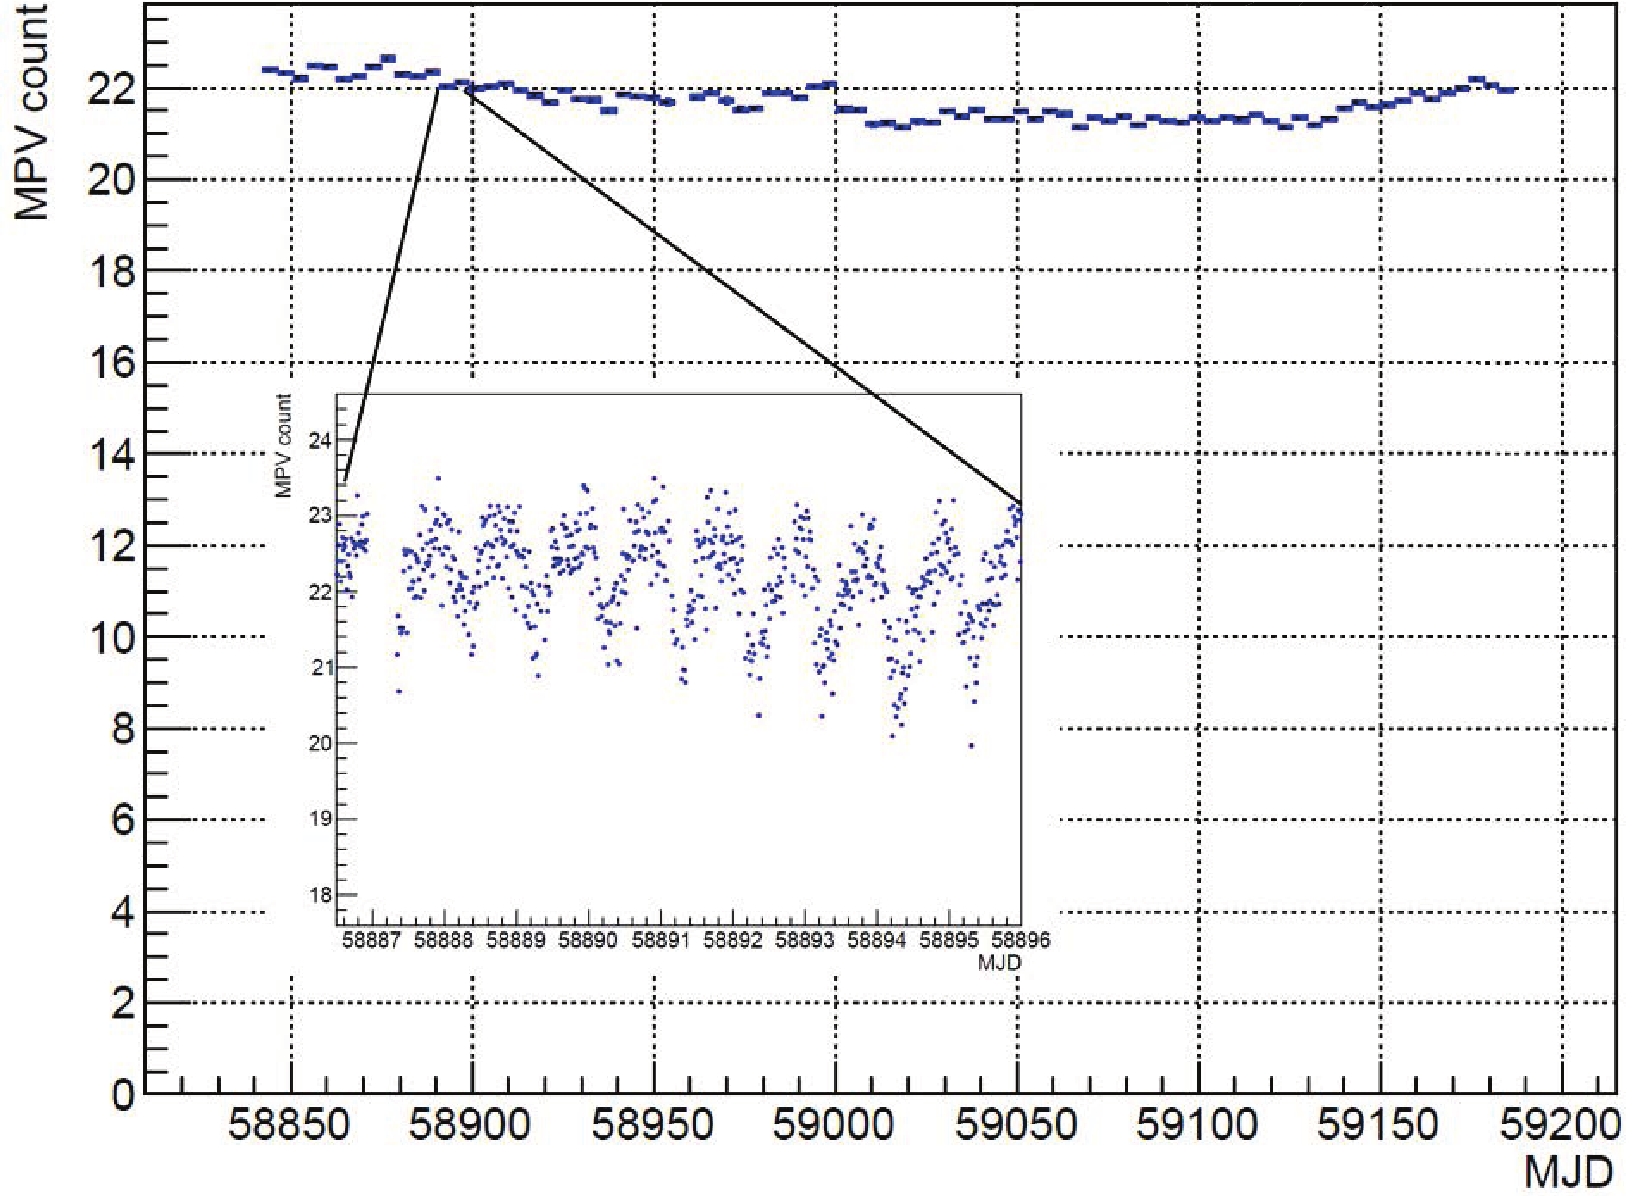
Figure 15. (color online) Long term stability of maximum probability value (MPV) of anode output charge distributions of one ED as examples (after temperature compensation).
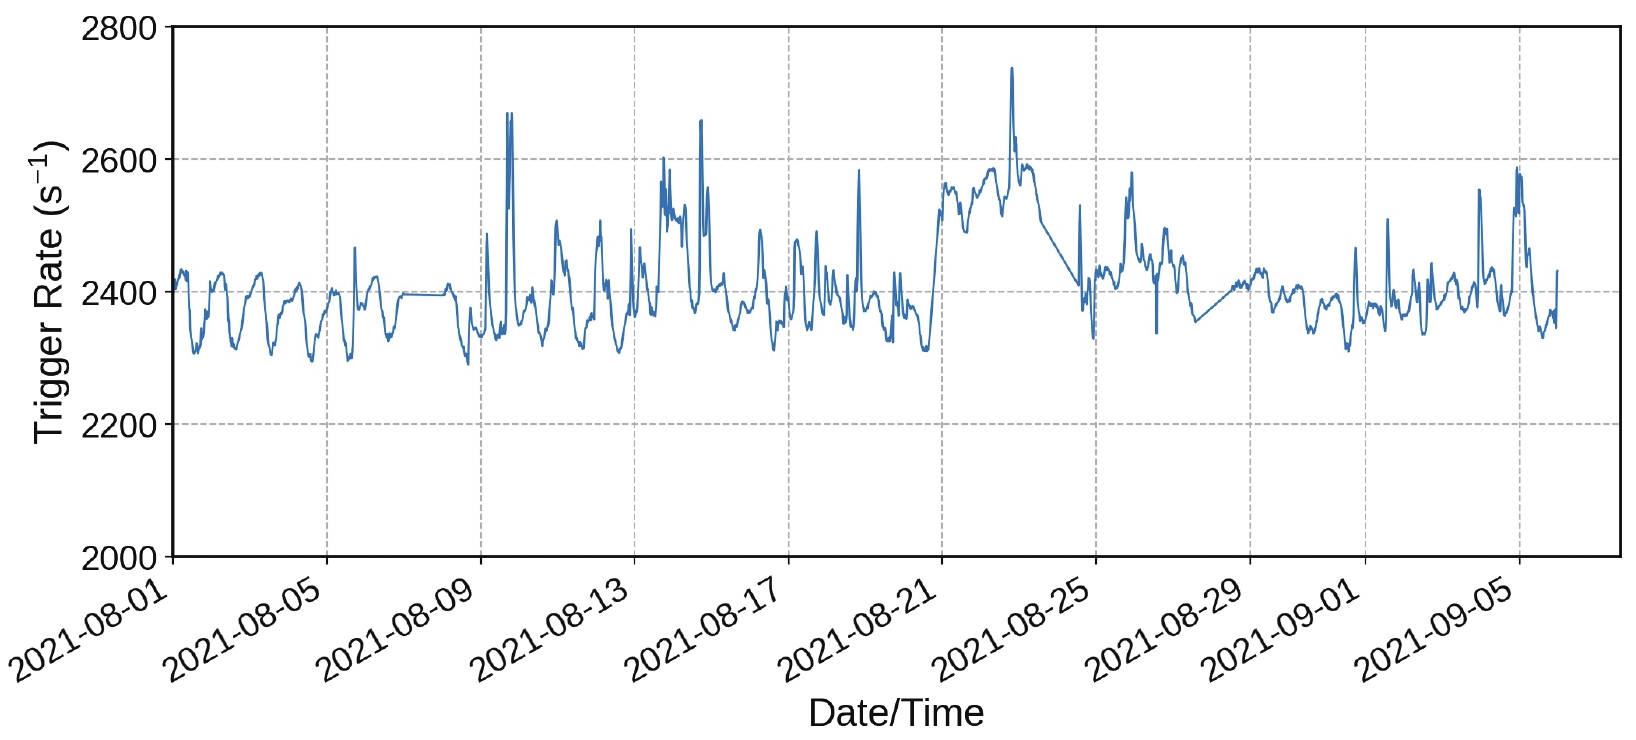
Figure 16. (color online) Trigger rate variation of the ED array. (Provided by Xiao-Peng Zhang.)
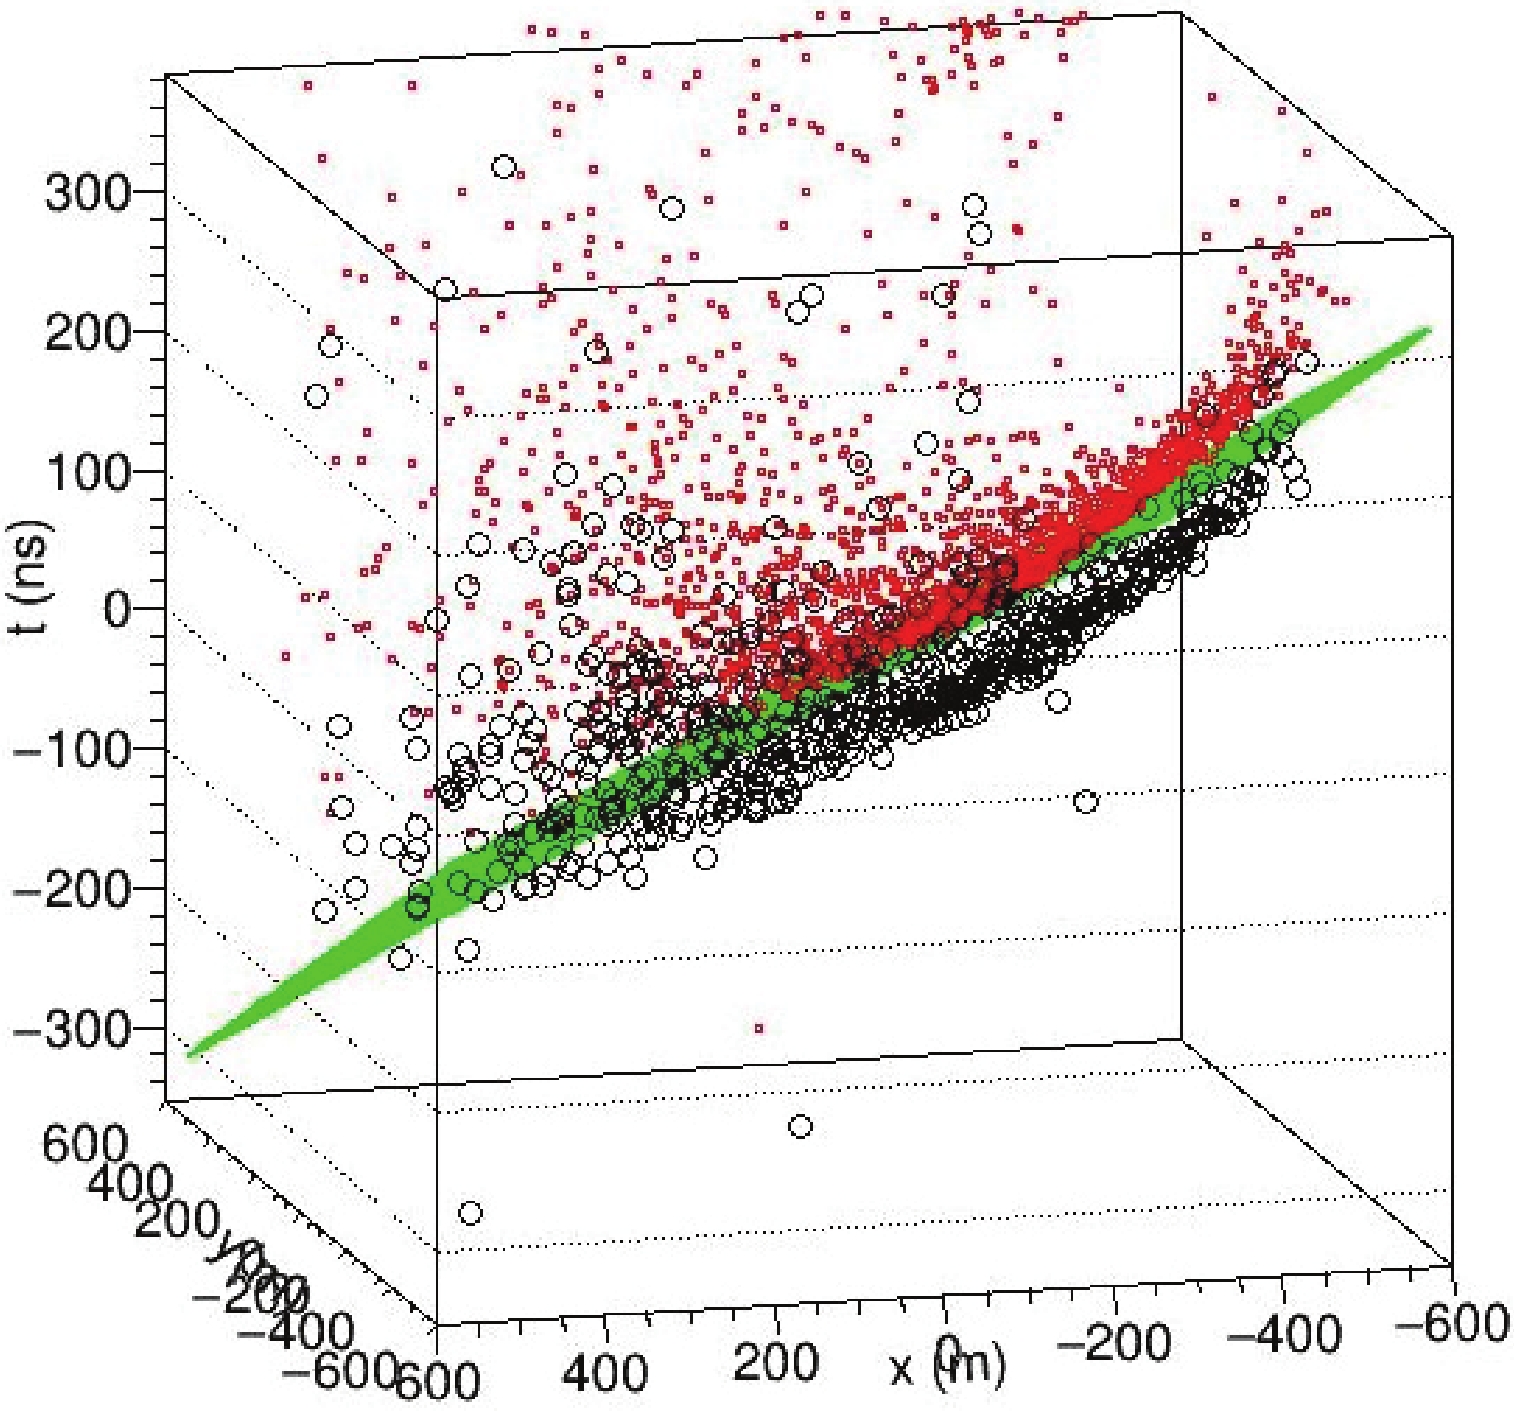
Figure 17. (color online) Scattering plot of Secondary particles of an EAS detected by the ED array. The green plane is EAS front plane. The red squares are the fired ED. The black circles are the fired MD. The second front is caused by MD's dead time. (Provided by Jia Liu.)

Figure 18. (color online) Moon shadow of 26 days by using the ED array. ΔRa is difference between right ascension of moon shadow and one of the real moon direction, and ΔDec is difference between declination of moon shadow and one of the real moon direction.
-
The MD array is composed of 1188 water Cherenkov tanks deployed in a grid with a spacing of 30 m (Fig. 19).
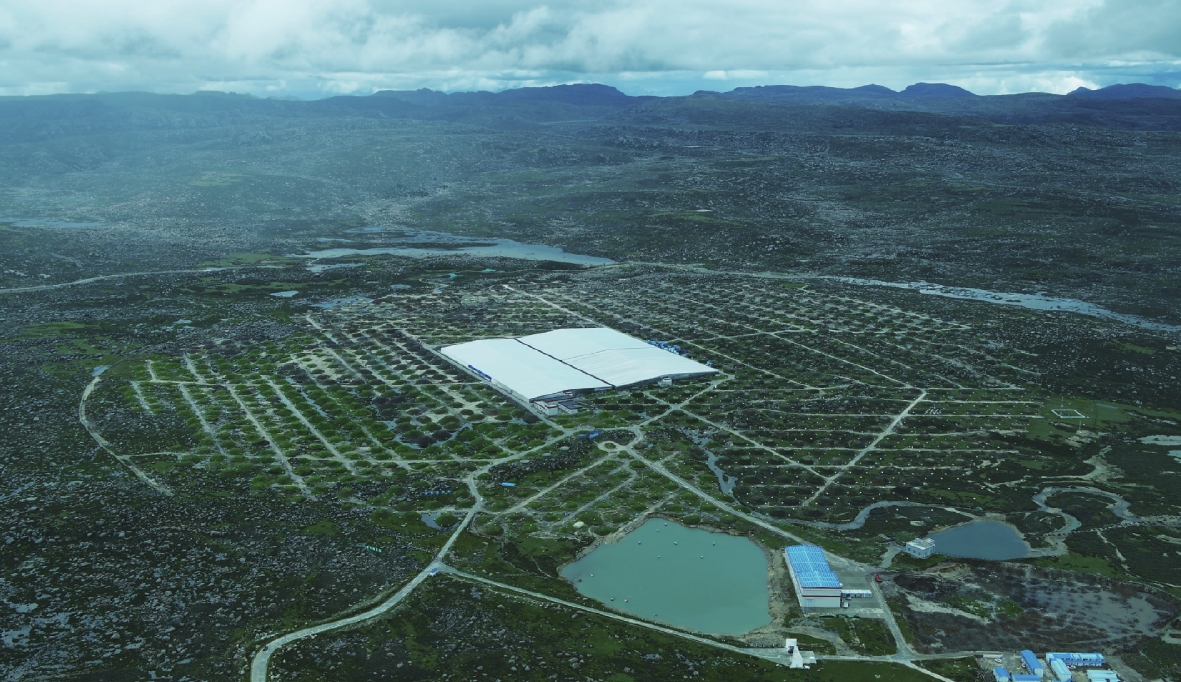
Figure 19. (color online) Photo of LHAASO in August 2021. WCDA is the building at the center. The soil bumps are MDs. The white or green small boxes are EDs. The blue boxes beside WCDA are WFCTs.
-
To achieve the main physical purposes, MD should meet the requirements shown in Table 3.
Item Value Area 36 m2 Water depth 1.2 m Overburden 2.5 m Water transparency (att. len.) ≥ 30 m (400 nm) Liner reflection coefficient ≥ 95% Dynamic range 1-104 muons Resolution 25% at 1 muon; < 5% at 104 muons Time resolution ≤ 10 ns Aging (≤20%) ≥ 10 year Table 3. Requirements of MD.
MD area is optimized to 36 m2 by balancing the total area and spacing of MDs [1]. To accurately measure the number of muons detected, the MD should have good detection efficiency (~95%) and signal charge resolution (~25%, defined as the sigma/mean of gaussian fitting of the signal charge distribution) of single muons. Purity of number of muons detected in cosmic ray EAS should be 95%. With total area of > 40000 m2, total background muon rate of MDs could be > 107 Hz, which corresponds to 1 muon in 100 ns. Time resolution is designed as ~ 10 ns because MDs do not participate in triggering and reconstruction of EAS. The lower boundary of MD’s dynamic range is set to be single muon signals, while the upper boundary, 104 muons, corresponds to number of muons near EAS cores of the highest energy (100 PeV) cosmic rays to be detected. Finally, long-term stability is also very important since LHAASO will operate for more than 10 years, in which signal attenuation should be less than 20%.
Soil is the cheapest material to shield EAS electromagnetic components and reduce the so-called punch-through effect. EAS electromagnetic components generate sub-showers in the shielding soil, and the products (mainly gamma rays, e+ and e–) have a certain probability to penetrate the soil and to be misidentified as muon. The water Cherenkov detector acts as a calorimeter by measuring the total number of Cherenkov photons yielded by a particle in water, which is approximately proportional to the total deposited energy of particle in water. If the total punch-through energy of EAS electromagnetic components is smaller than the total deposited energy of muons in water, shielding soil can provide further rejection power to EAS electromagnetic components. A thicker the overburden soil results in lower the punch-through effect and higher muon threshold energy. The energy distribution of muons generated by cosmic ray background (Fig. 20) shows that most of muons have energies ~ 1 GeV, thus the overburden soil can be as thick as 2.5 m. On the other hand, if the underneath water Cherenkov detector is deep enough, punch-through electromagnetic components deposit all energy in the water, while energetic muons pass through water with deposited energy proportional to the water depth. The specifications of the design are listed in Table 4.
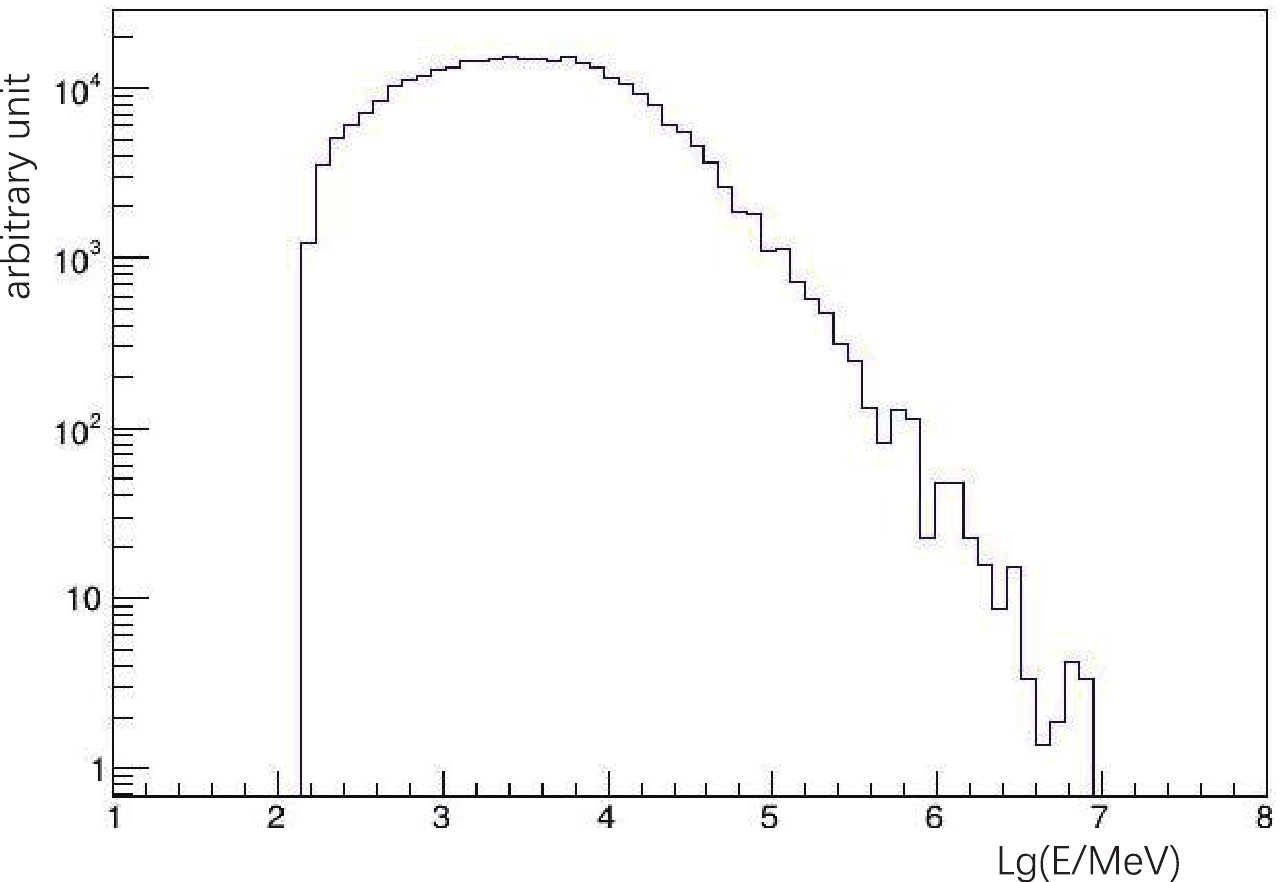
Figure 20. (color online) Energy (E) distribution of muons generated by cosmic ray background along trajectory of the Crab Nebula. (Provided by Ying-Ying Guo.)
Item Value Dynamic range 1-104 muons Resolution 12% at 1 muon; < 5% at 104 muons Time resolution 4 ns Single Channel hit rate 10 kHz Threshold 0.25 muon (Adjustable) Operating temperature −30° to 40° Table 4. Design specifications of the MD electronic board.
A MD consists of concrete tank, thermal layer, water liner, pure water and PMT [10] (Fig. 21). Each cylindrical concrete tank contains a water liner with diameter of 6.8 m and height of 1.2 m to enclose pure water. An eight-inch PMT sits at top center of the liner and looks downwards through a highly transparent window into the water. The liner provides a sealed container for 44 tons of ultra-pure water at least for 10 years, protecting the water from contamination and inhibits bacteriological activities, as well as a high reflectivity inner surface for the Cherenkov photons. An apparatus is developed to measure the attenuation length of water or any other liquid directly [11].

Figure 21. (color online) Schematic of MD [10]. It mainly consist of three parts: probing medium, structural support and shielding layer.
The liner is mechanically supported by the concrete tank and surrounded by the thermal layer. Composition of the liner is (Fig. 22): the inner layer is a complex film of two sheets of DuPont Tyvek 1082D and a sheet of PE in the outer, which has an excellent diffuse reflectivity of Cherenkov light; one middle layer is two independent sheets of LDPE (Low-Density Polyethylene), which seals ultra-pure water; the other middle layer is two independent sheets of EVOH (Ethylene vinyl alcohol copolymer), which is an excellent oxygen barrier; the outer layer is PE woven cloth, which protects the whole inner layers. Liners are manufactured in a food-grade production workshop in order to keep it clean. Each complete liner is tested by high sensitivity SF6 tracer gas leak checking [12].
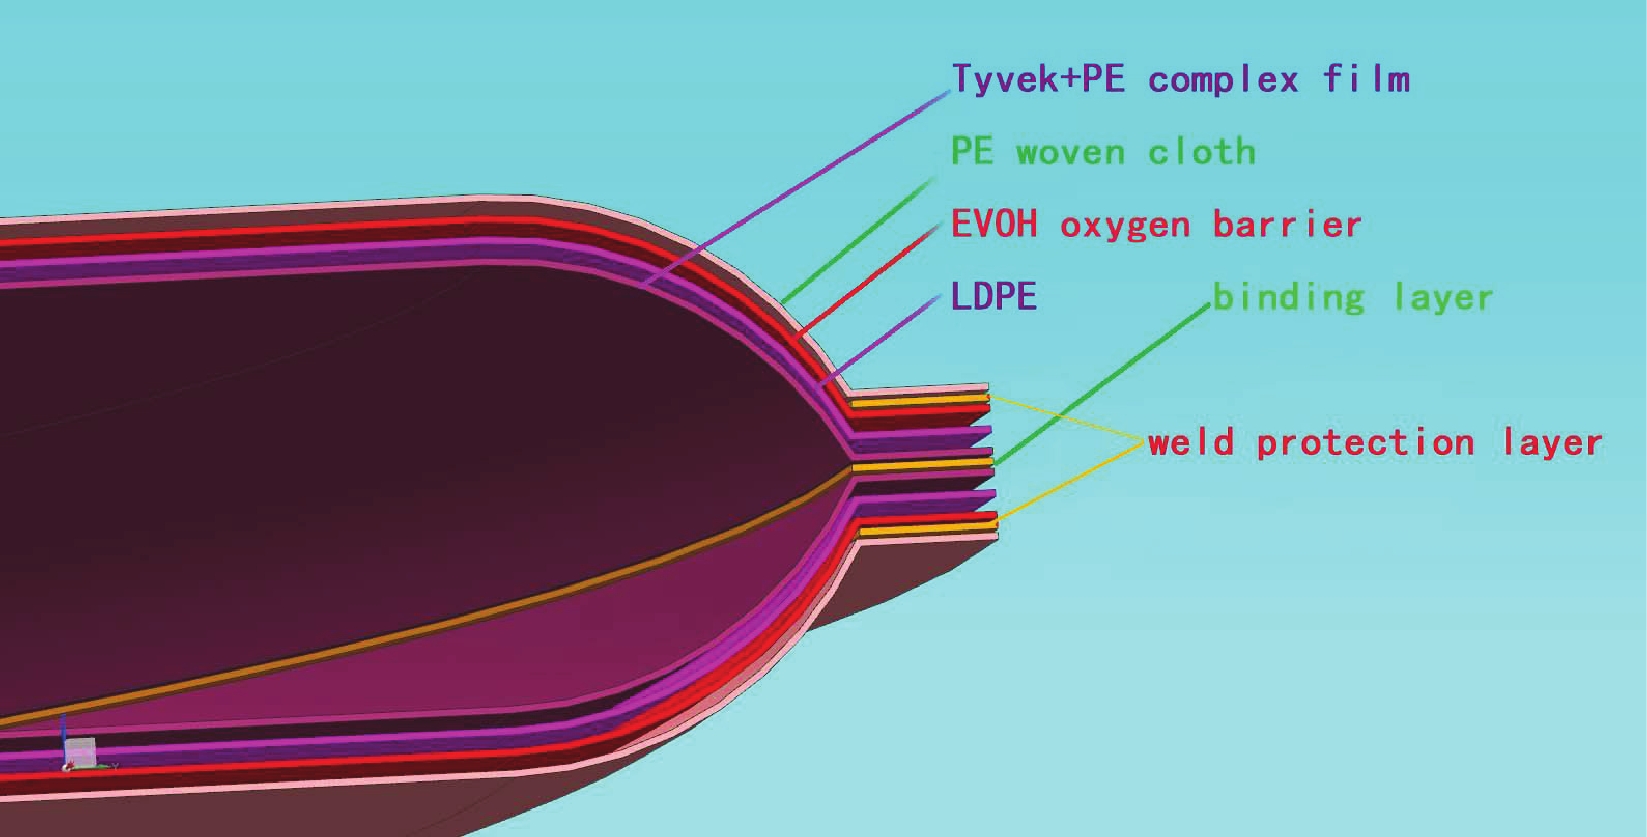
Figure 22. (color online) Composition of the water liner.
On the top center of the liner are two valves and PET dome window fitted for the installation of the PMT. The dome is custom-formed to match the PMT front face. The PMT is optically coupled to the dome window using an optical coupling compound (RTV6136A(B)), which eventually ensures a highly transparency for the Cherenkov photons.
The MD electronics board is designed as shown in Fig. 23. Main functions of the electronics system include: 1) To measure the charge from signals from the anode and the dynode of the PMT; 2) To measure the arrival time of the muon signal; 3) To record the waveform of the muon signals periodically.

Figure 23. Design block diagram of the MD electronic board. (Provided by Jin-Fan Chang.)
The signal is triggered when the amplitude of the signal is over the threshold. The time stamp is generated for this triggered event. The signals from the anode and the dynode of PMT are then digitized with two independent flash analog-to-digital-converters (FADCs). By using the recorded waveforms, charges and other parameters are calculated. All data is finally assembled and packaged into a TCP packet and is transmitted to the host computer through the White Rabbit network.
-
The average single muon waveform of MD is shown in Fig. 24. When a high energy muon passes through the water, it will generate a large number of photons, and these photons will be gradually absorbed by water and reflected by inner layer of the liner, then a part of the photons will reach the PMT by one reflection or several reflections to form a signal. The trailing edge of the wave can be fitted with an exponential function, in which decay time is determined by water absorption length of ultra-pure water and reflectivity of the liner [13]. A new method using muon decay events to calibrate and monitor MDs has been established in an earlier study [14]. Fig. 25 is single muon spectrum of one MD which shows that one a vertical and through muon typically generates about 70 photoelectrons in the detector.
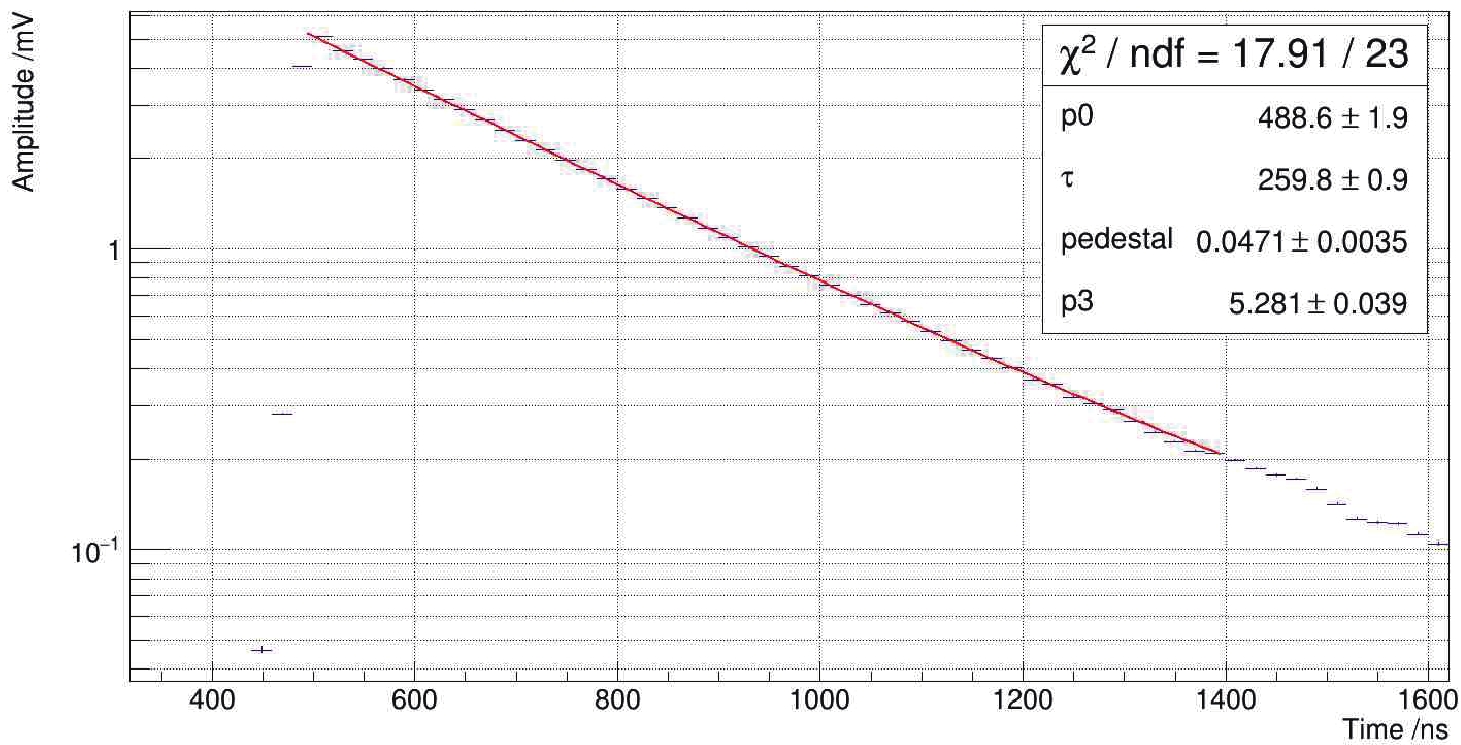
Figure 24. (color online) One average single muon waveform. The trailing edge is fitted with an exponential function.
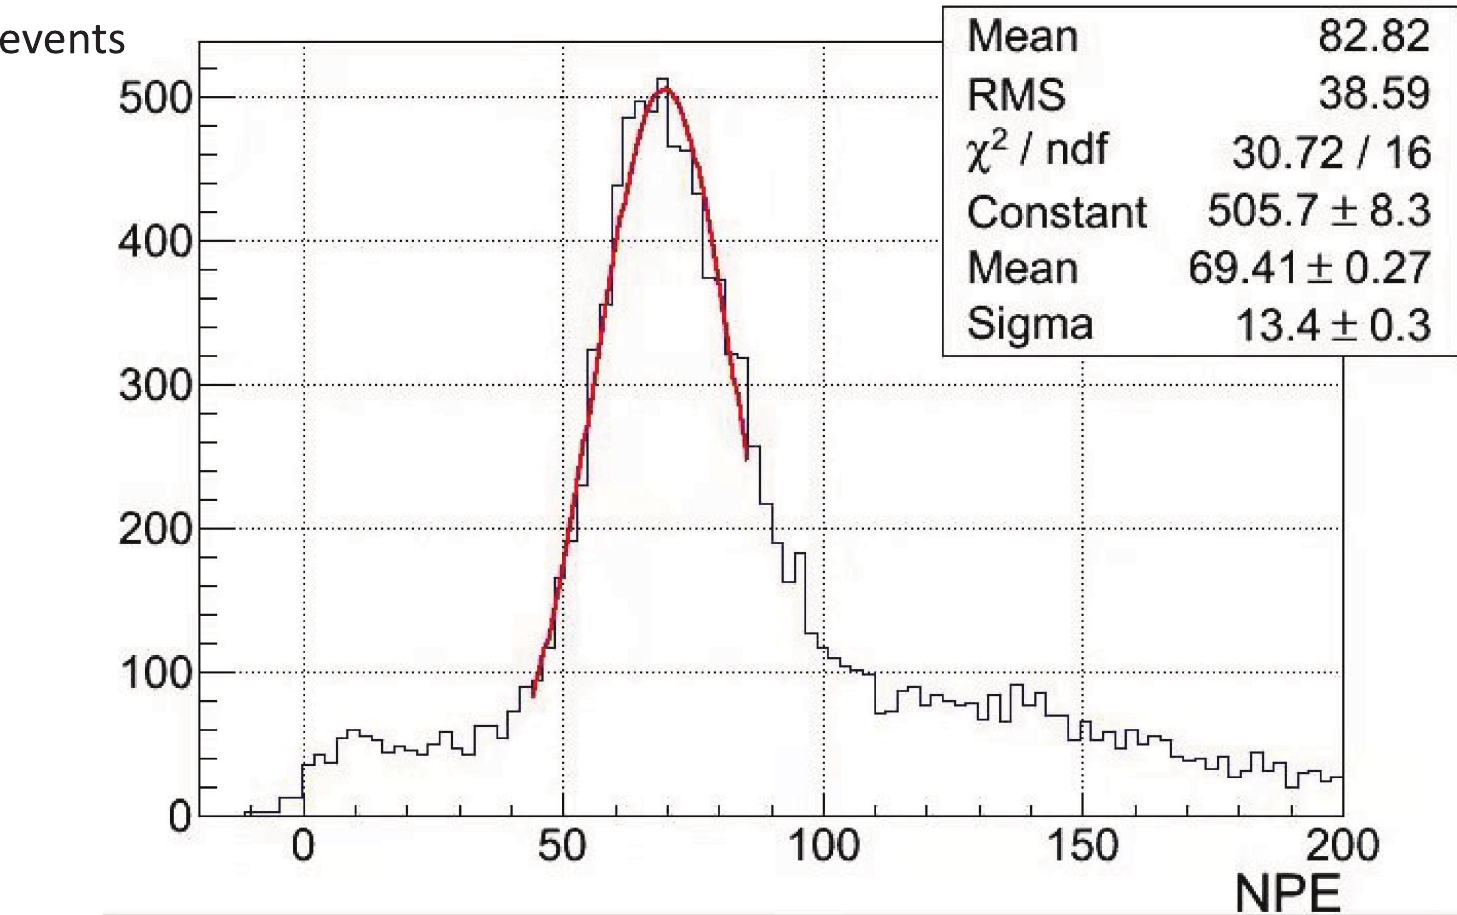
Figure 25. (color online) Single muon spectrum of one detector with gaussian fitting (red line).
The results of one LHAASO-KM2A prototype array, which is about 1% of the full one, presenting a combined measurement of EAS muons and electromagnetic particles, indicates that the muon content can be studied for EAS with energies from tens of TeV to tens of PeV. The results are compatible with the prediction of Monte Carlo simulations and no obvious excess is observed when taking into account that the mass composition increases above 1 PeV. The results also support a transition from light to heavy elements for cosmic rays in the 'knee' region [15].
-
WCDA is a survey instrument sensitive to gamma rays with energies between 100 GeV - 30 TeV. In the energy region of TeV it can attain the world best survey sensitivity of < 0.1 flux intensity of Crab nebula. Besides observation of Galactic gamma ray sources, WCDA has the discover potential and is sensitive in monitoring extragalactic variant sources, e.g., GRBs, AGNs. WCDA will give an observation with high significance for studying the origin and acceleration of cosmic rays, multi-waveband radiation mechanisms of GRBs, AGNs, EBL, intergalactic magnetic field, galactic evolution, etc. Meanwhile, the WCDA has an advantage for observing extended sources. The important requirements of WCDA including effective area, energy resolution, angular resolution and Q factor varying with energy is shown in Fig. 26.
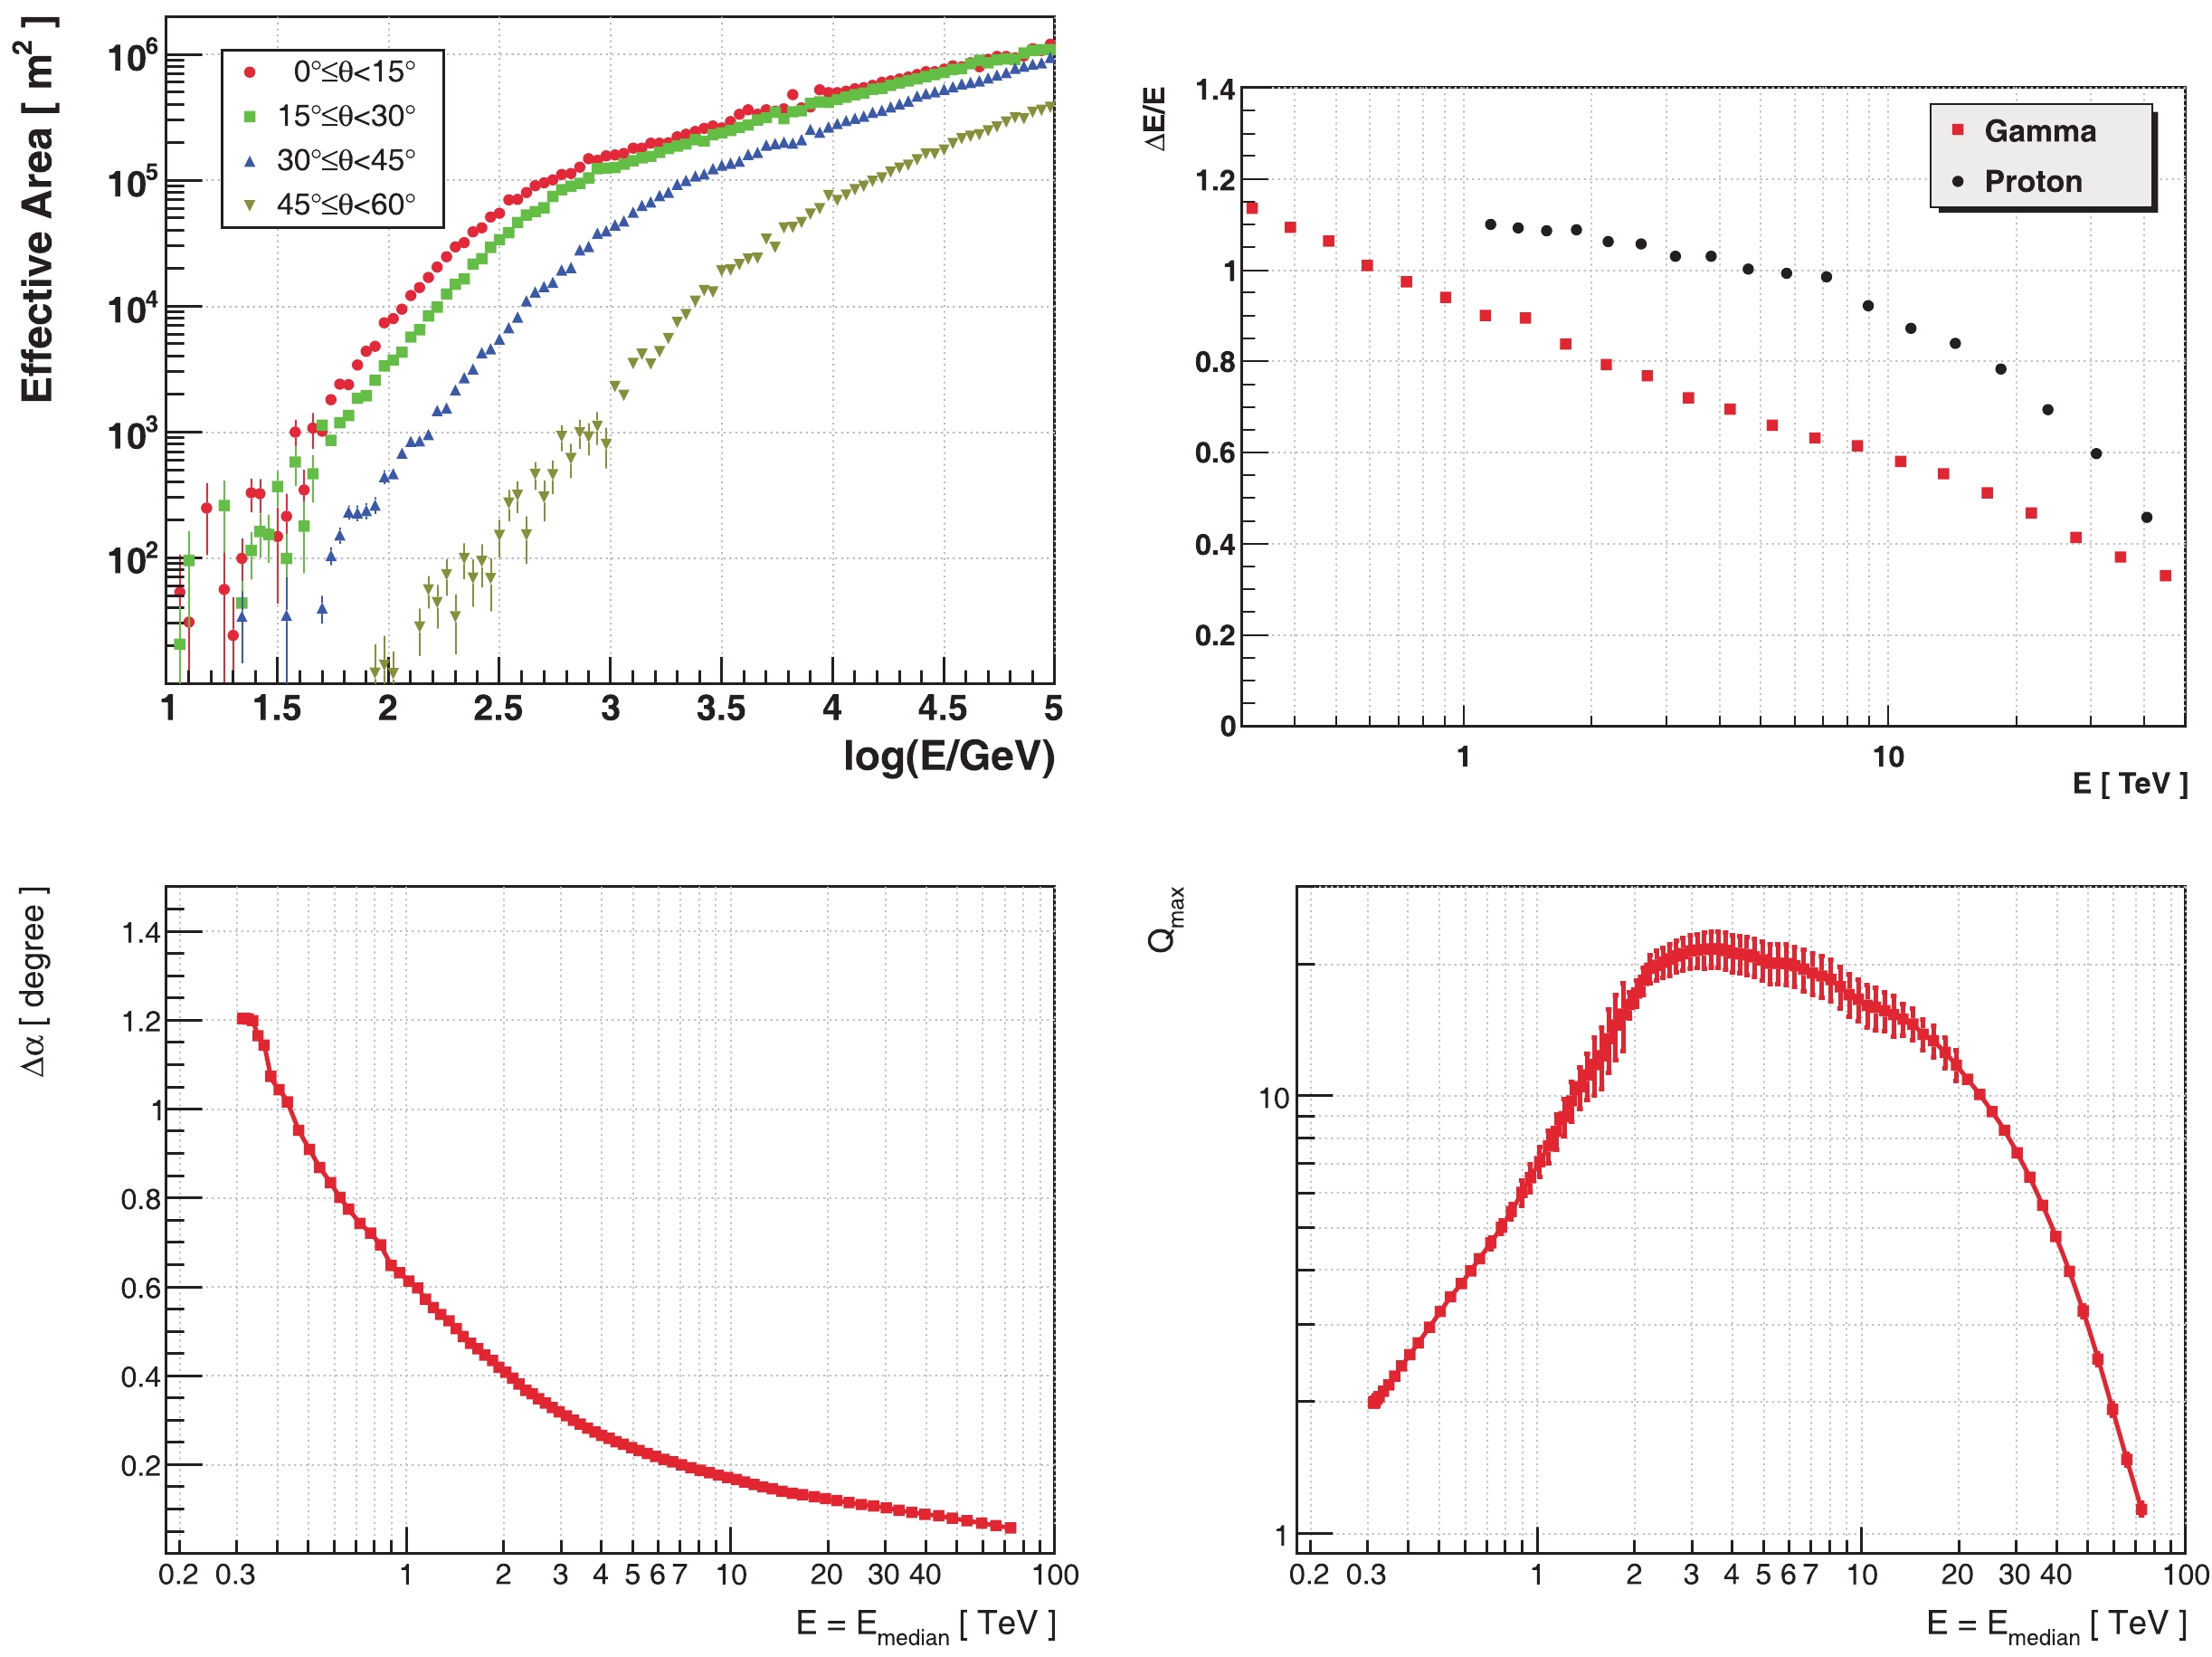
Figure 26. (color online) Effective area (upper left), energy resolution (upper right), angular resolution (lower left) and Q factor (lower right) of WCDA varies with primary energy.
WCDA covering an area of
$78,000\;\rm m^2$ , is compose of 3,120 water Cherenkov detectors (WCDs), divided into 3 separate arrays (Fig. 27). Each array is a single water pool with water depth of 4.4 m. Two pools with effective area of 150 m × 150 m contain 900 WCDs individually. The third pool with area of 300 m × 110 m contains 1,320 WCDs.
Figure 27. (color online) Layout of WCDA.
WCD has a 5 m × 5 m area separated by black plastic curtains with area of 3.3 m × 4.7 m vertically hung in water to absorb scattered light (Fig. 28). Side walls and bottom of the pools are lined with 2 mm thickness HDPE film to keep water from leaking outside. To guarantee an attenuation length of longer than 15 m for the near-ultra-violet light, a water purification and recirculation system is operated. The water recirculation system is composed of two fine filters (5 μm and 1 μm), an ultra-fine filter (0.2 μm), and UV lamps (254 nm and 185 nm) (Fig. 29). It uses a micro-filtration system to remove fine granulation material in water, while using UV185 to degrade Total Organic Carbon (TOC) and using UV254 to kill bacteria in water. Finally, the 0.2 μm filter is used to remove the bacterial carcass, thereby effectively ensuring the cleanness of water. Water purified by this system can reach transparency (attenuation length) above 15 m for light of around 400 nm wavelength. And flow of recirculation system is about one volume/month.
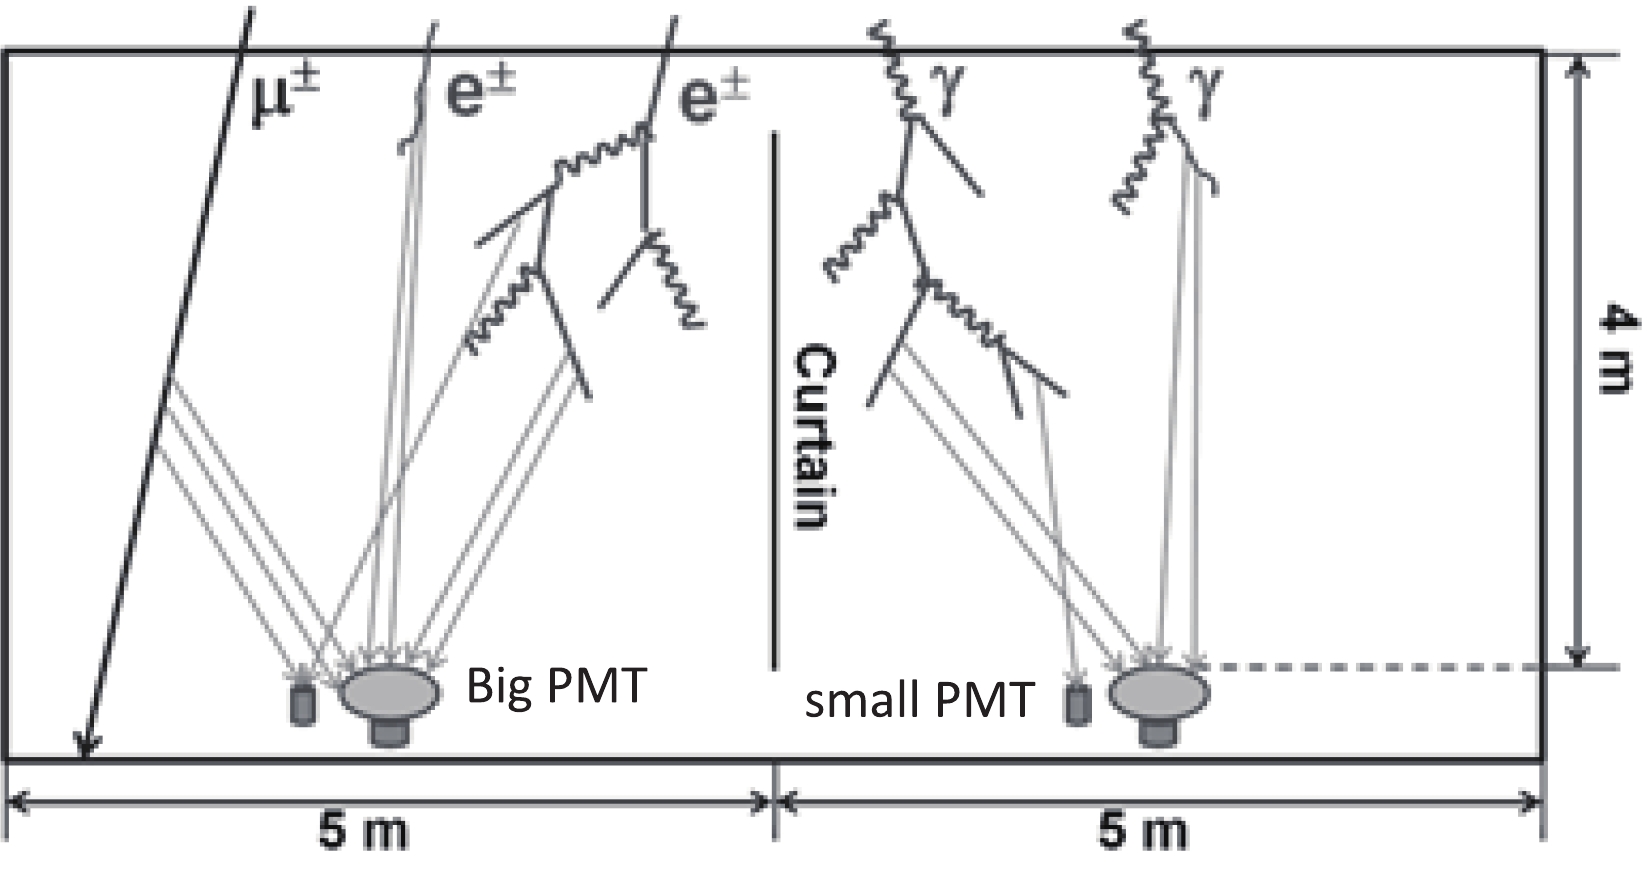
Figure 28. Sketch map of WCD.

Figure 29. (color online) Schematics of water recirculation system of WCDA.
The first pool has 900 WCDs (Fig. 30). Each WCD is equipped by an 8-inch PMT for timing and pulse height in low range and a 1.5-inch PMT for pulse height in high range at the center of WCD and 4 m beneath water surface [16]. The pool measures EAS directions with angular resolution better than
$ 0.2^{\circ} $ at 10 TeV and$ 1.0^{\circ} $ at 600 GeV. This is based on time resolution of 0.5 ns of Front-End Electronics (FEE) connected to the large PMTs, watching upwards for direct Cherenkov light only. Dynamic range of WCD is enlarged very much by using the small PMT. This configuration enables measurement of detailed particle density distribution in EAS cores without significant saturation even for energetic EAS up to 10 PeV, and reaches core location resolution better than 3 m over a wide energy range. This is designed for identification of cosmic ray composition and measurement of energy spectrum.
Figure 30. (color online) Photos of WCDs installed in the first pool (left) and the second pool (right).
At low energies, EAS is small so that total number of particles may be fully contained in the pools, and the secondary particles generate faint Cherenkov signals in WCDs even near EAS cores. In order to enhance gamma ray detection sensitivity, enlarging the sensitive photocathode of the PMT is considered as one effective way to catch the faint signals. LHAASO's upgrading design is to replace the 8-inch PMTs by 20-inch PMTs in the other two pools with total area of 55,500 m2 (Fig. 30 and Fig. 31). The customized design of the 20-inch PMTs using multi-channel-plate (MCP) instead of the traditional dynodes enables good uniformity between PMTs as well as Transit Time Spreads (TTS) less than 7 ns and Cathode Transit Time Distribution (CTTD) less than 2 ns. The photocathode is a factor of 6.25 larger than the 8-inch one so that dynamic range is also shrunk by the same factor. In order to compensate loss of energy dynamic range, a 3-inch PMT is installed beside this large PMT in WCD, read out only pulse height by a simplified version of FEE covering 3 orders of amplitudes in number of photoelectrons. Table 5 shows some basic specifications of WCDA, and Fig. 32 is the general schematic of electronics system.
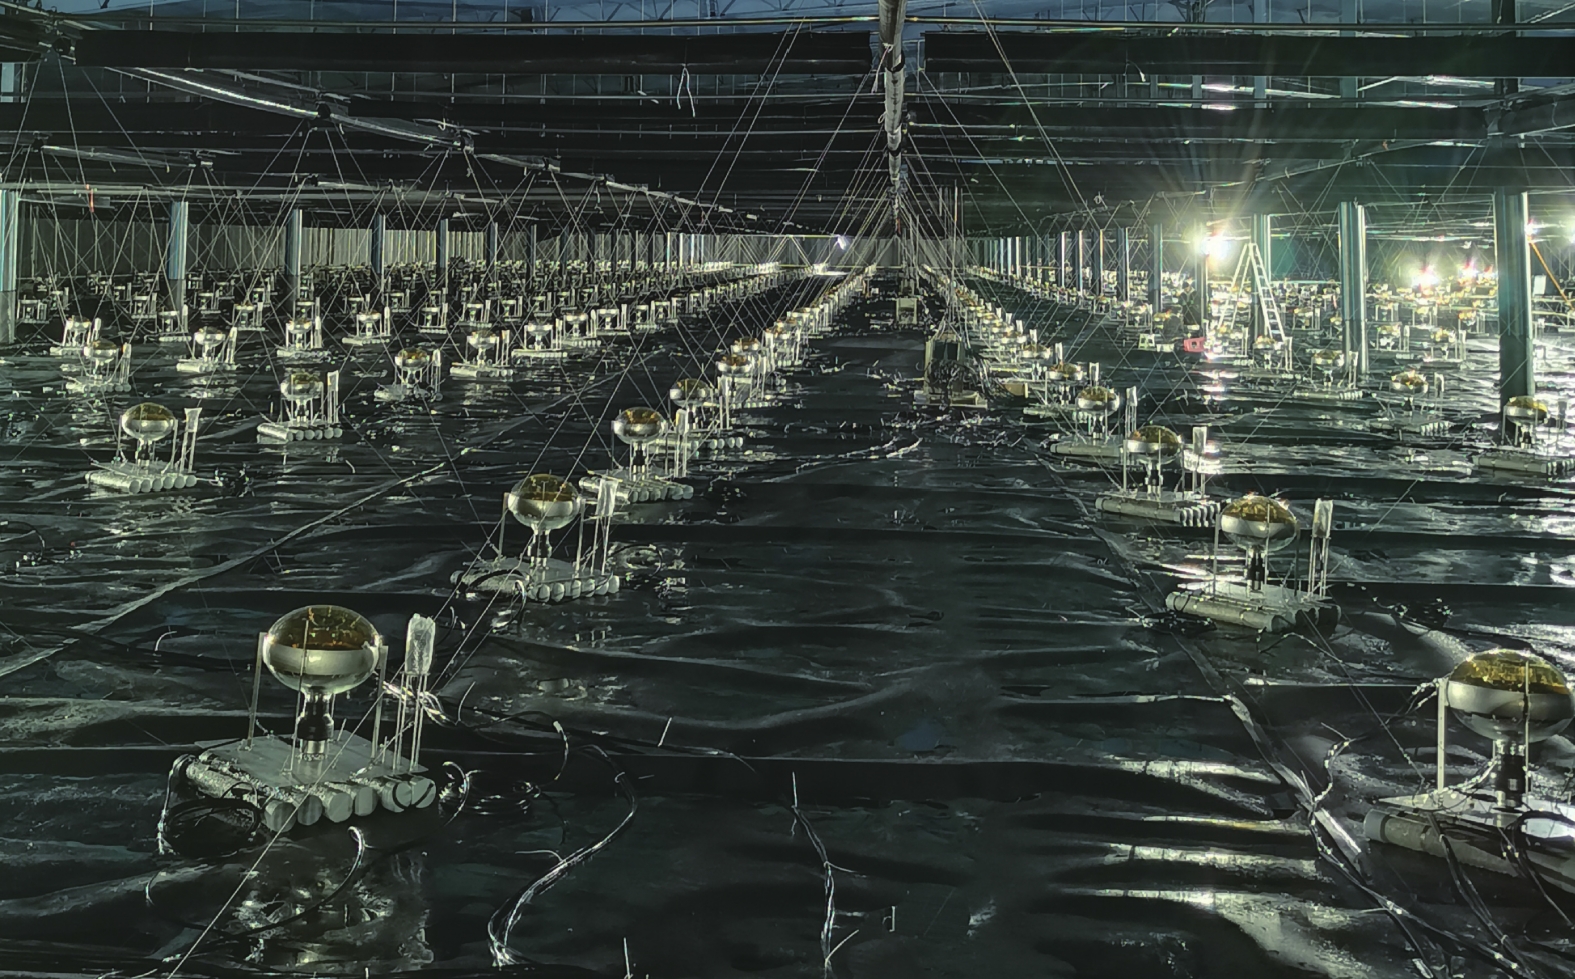
Figure 31. (color online) Photo inside one hall of WCDA without water and curtains.
Items Value Total area 7.8×10⁴ m2 Total cells 3.12×10³ Cell area 25 m2 Effective water depth 4 m Water transparency >15 m (400 nm) Precision of time measurement 0.5 ns Time resolution < 2 ns Accuracy of charge calibration < 2% Accuracy of time calibration < 0.2 ns Charge resolution(Large PMTs) 50% at 1 p.e.
8-in PMT: 5 % at 4×10³ p.e.s
20-in PMT: 3 % at 1.8×10³ p.e.sDynamic range 1 - 4×10³ (8"), 20 - 2×10⁴ (1.5"),
1 - 1.8×10³ (20"), 1 - 3×10³ (3") PEsAngular resolution < 0.40 (at 2 TeV) Table 5. Specifications of WCDA.
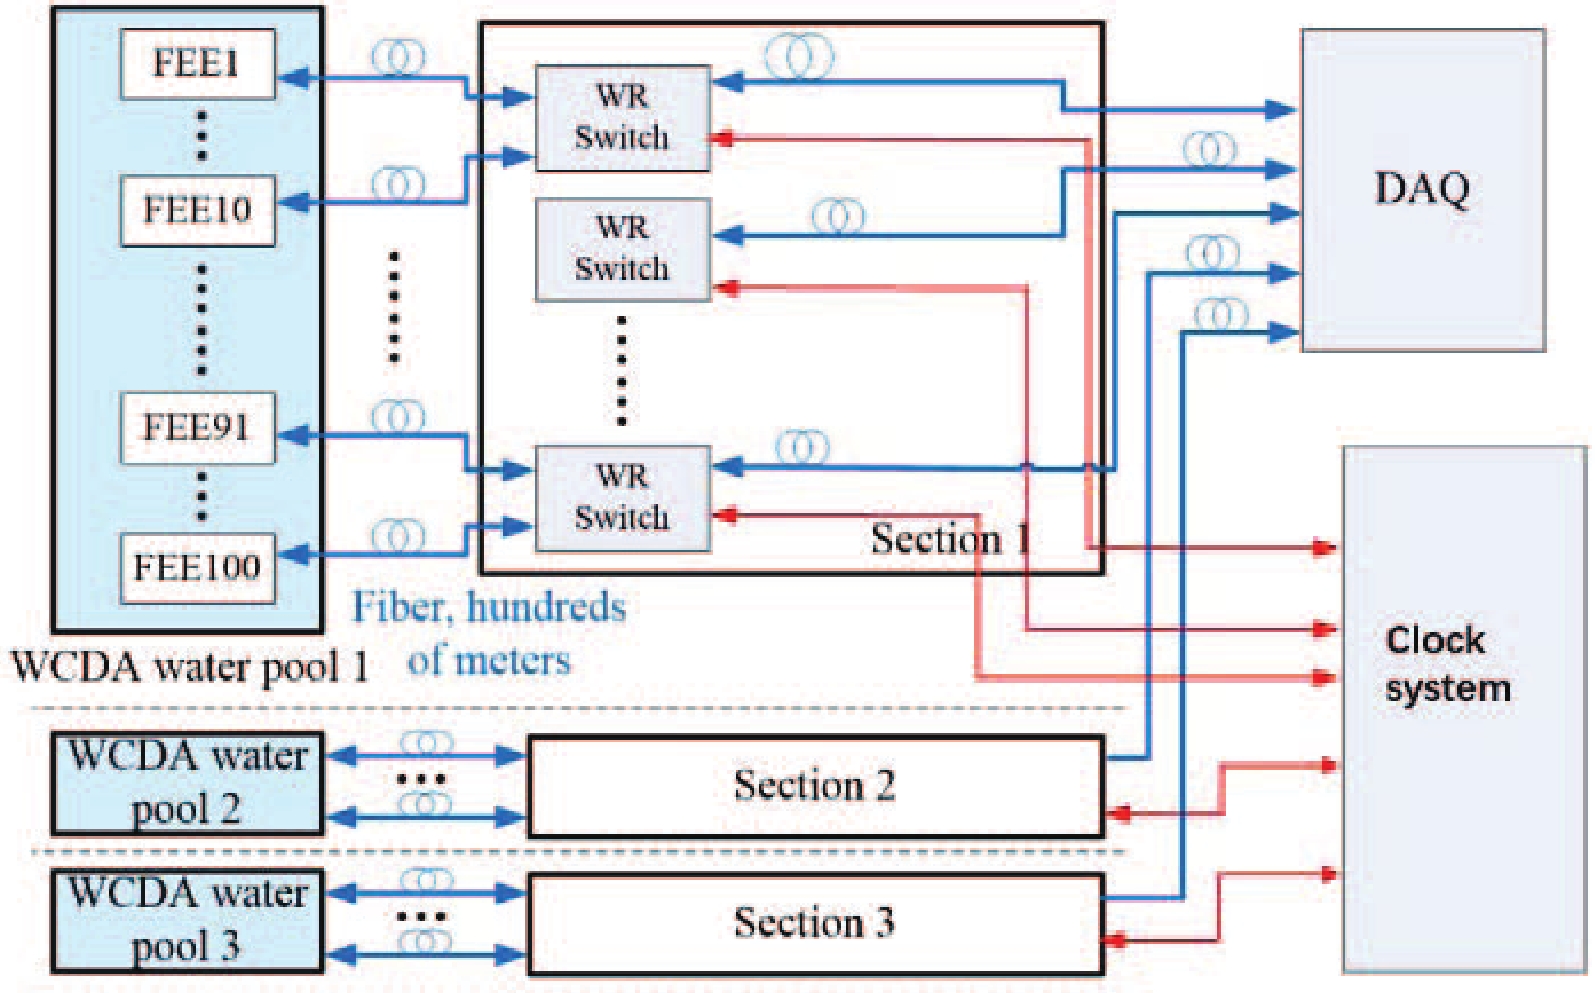
Figure 32. (color online) Schematic of WCDA electronics system. (Provided by Lei Zhao.)
By using small PMTs, cosmic ray events above 30 TeV are mainly measured, and the event rate is only a few hertz. Therefore, the requirement of time measurement for readout electronics is not high as long as it can meet requirements of cosmic ray composition separation. Moreover, dynamic range meets the requirement of 200,000 (3,000) photoelectrons in the 1st (2nd/3rd) pool, and the target requirements of the readout electronics system are as following Table 6.
Design Requirements the 1st pool the 2nd/3rd pool Time measurement resolution < 20 ns < 20 ns Dynamic range of time measurement 2 µs 2 µs Dynamic range of charge measurement 20 ~ 2×10⁴ p.e.s 1 ~ 3×10³ p.e.s Accuracy of charge measurement 10 % at 50 p.e.s,
< 5 % at > 500 p.e.s30 % at single p.e.,
< 5 % at > 10 p.e.sChannel Number 900 2.22×10³ Table 6. Specifications of WCDA small Size PMT Readout.
During operation of WCDA, time calibration and charge calibration will be proceeded respectively. The time calibration is realized by an optical fiber system [17,18]. On the upper side of every large PMT, two optical fibers with approximately 40 m in length are installed (Fig. 33). All the fibers in a cluster, which contains 6×6 cells, are bundled together, illuminated by a uniform light source consisting of an array of LEDs. These LEDs are powered by the same circuit which can guarantee a fast rise-time (<10 ns) of the LED light pulse output. For every cluster, beside one set of fibers are used for the intra-cluster calibration, another set of fiber are shared by neighboring clusters for cross calibration. With a proper selection and design of the fibers, LEDs, the drivers, and the cross-calibration method, all the PMTs in the pool can achieve a precision < 0.2 ns for the time offset measurement.

Figure 33. (color online) Schematic of optical fibers layout of time calibration of WCDA.
Charge of the large PMT signals is calibrated in two ranges: the single photoelectron spectrum of the counting rate and the signal of nearly vertical muons hitting the PMT photocathode [19,20]. For the former, owing to the high single rate of PMT in water, it is possible to fit charge distribution, which is peaked at the single photoelectron position, so that gain of each PMT is obtained. For the latter, thanks to the enhancement of number of photoelectrons from muons hitting on the photocathode, the peak position of these signals can be distinctly revealed after several hours running. This method can calibrate PMT charge in precision of 2%, involving all the effects, such as quantum efficiency, geometrical effect, collection efficiency, and electronics systm. Besides, the single particle peak in the charge distribution is used to monitor and measure attenuation length of water with a precision of 6% [21].
-
With the advantage of high altitude, LHAASO possesses multiple instruments capable of measuring the complete and 3D observations on the longitudinal and transverse developments of EAS, and enhances greatly accuracy in energy determination and power in identifying the cosmic ray component. The total p.e.s measured by WFCTA can be used to measure the cosmic-ray energy. The shape of the EAS Cherenkov image is observed by WFCTA, including the ratio between the major and minor image axes and the angular distance from the image centroid to the arrival direction of the shower, are closely related to the position when the EAS is developed longitudinally to the maximum. Energy at the core region recorded by WCDA contains the hadron information in the early development of EAS. Muon component recorded by MD reflects the hadron information in EAS. WFCTA is an array of Cherenkov telescopes, a movable design idea is adopted, different array configurations are used for the different observation stages to realize the accurate measurement of component energy spectrum of 1013 - 1018 eV, and the energy scale transfer from the direct space measurement to the extremely high energies [22]. In total, three stages are employed by the WFCTA to perform the component and energy spectrum measurement of cosmic rays.
In the first observation stage, WFCTA aims to observe the primary energy range from 10 TeV to 300 TeV, one Cherenkov telescope will point at the zenith angle of
$ 0^{\circ} $ .In the second observation stage, WFCTA aims to observe the primary energy range from 50 TeV to 10 PeV, 6 Cherenkov telescopes will point at the zenith angle of
$ 30^{\circ} $ and each telescope points at different azimuth angles, in order to cover the sky with zenith angle from$ 22^{\circ} $ to$ 38^{\circ} $ and azimuth angle from$ 0^{\circ} $ to$ 156^{\circ} $ .In the third observation stage, WFCTA aims to observe the primary energy range from 1 PeV to 100 PeV. To make sure that the position of shower maximum is far from the observation surface, the main axis of 18 Cherenkov telescopes will point at
$ 45^{\circ} $ in zenith angle. Cherenkov telescopes will point at different azimuth angles in order to cover$ 0^{\circ} $ to$ 360^{\circ} $ in azimuth. -
WFCTA is composed of 18 wide field Cherenkov telescopes (WFCTs). Each WFCT (Fig. 34) consists of an array of 32 × 32 Silicon photomultipliers (SiPMs), a 5 m2 spherical aluminized mirror, a portable and adjustable container, power supply system and slow control system. It has a field of view (FOV) of
$ 16^{\circ} \times 16^{\circ} $ with a pixel size of approximately$ 0.5^{\circ} \times 0.5^{\circ} $ . Mirrors are mounted at the back of the container. The SiPM camera is located at the focal plane which is 2870 mm away from the center of the mirror. Power supply system and slow control system are also installed inside the container with size of 4.2 m × 2.5 m × 2.6 m. The container is mounted on a truck frame with a pitching rotation system that allows the container to be lifted up-and-down manually, from 0° to 90° with a step of 0.1°. The mirror is made of 20 hexagon-shaped segments with side length of 297.1 mm and 5 half hexagon-shaped segments. The radius of each segment curvature is 5800 mm with a tolerance of 10 mm. The reflectivity of the mirror is ≥ 82% for wavelength from 300 nm to 900 nm.
Figure 34. (color online) Left panel: A photo of the telescope. Right top panel: Photos of the SiPM camera. Right bottom panel: mirror.
The SiPM camera consists of 64 sub-clusters. Each sub-cluster (Fig. 35) is composed by 4 × 4 SiPMs, each SiPM coupled with a light funnel (Winston cone), a pre-amplifier board, a voltage and temperature compensation loop board, two analogue boards, a digital board and a power regulator board. The SiPM used is a square Hamamatsu S14466 with photosensitive area of 15 mm × 15 mm. Each SiPM has 360,000 Geiger-Avalanche Photo Diode (APD) cells with size 25 μm [23]. The optical spot size is about 25.8 mm×25.8 mm. A light funnel is used to funnel the photons of the optical spot on the SiPM. Each funnel has an entrance area of 25.8 mm × 25.8 mm (including the funnel walls thickness) and an exit area of 15 mm × 15 mm to match the SiPM area (Fig. 35). SiPM signals are amplified by the pre-amplifier, and then are split into two channels, high gain and low gain, to get a good linearity over a wide dynamic range, to cover the corresponding 3.5 decades in the charge measurement. Finally, the signals are digitized by 50-MHz, 12 bits flash analog-to-digital-converters (FADCs) in the digital boards (DBs) and are collected by FPGAs to do further processing: single channel trigger, event trigger, signals transmission and storage, etc. (Fig. 36). A temperature sensor is mounted on the back of each SiPM chip. The sensor is needed by the voltage and temperature compensation loop used to stabilize the SiPM gain against temperature variations. An optical filter window that allows light between 300 nm and 550 nm passing through with a transmission of 92% is mounted in the front of the SiPM-based camera. The window improves the signal to noise ratio of the camera because the sky background light wavelength is dominated by wavelength ≥ 550 nm where SiPMs are still sensitive enough. The power consumption of each camera is about 720 W. The camera is cooled by an internal self-circulating air-cooling system.

Figure 35. (color online) Left panel: A photo of one sub-cluster. Right Panel: A half light funnel (Winston cone) and an SiPM.
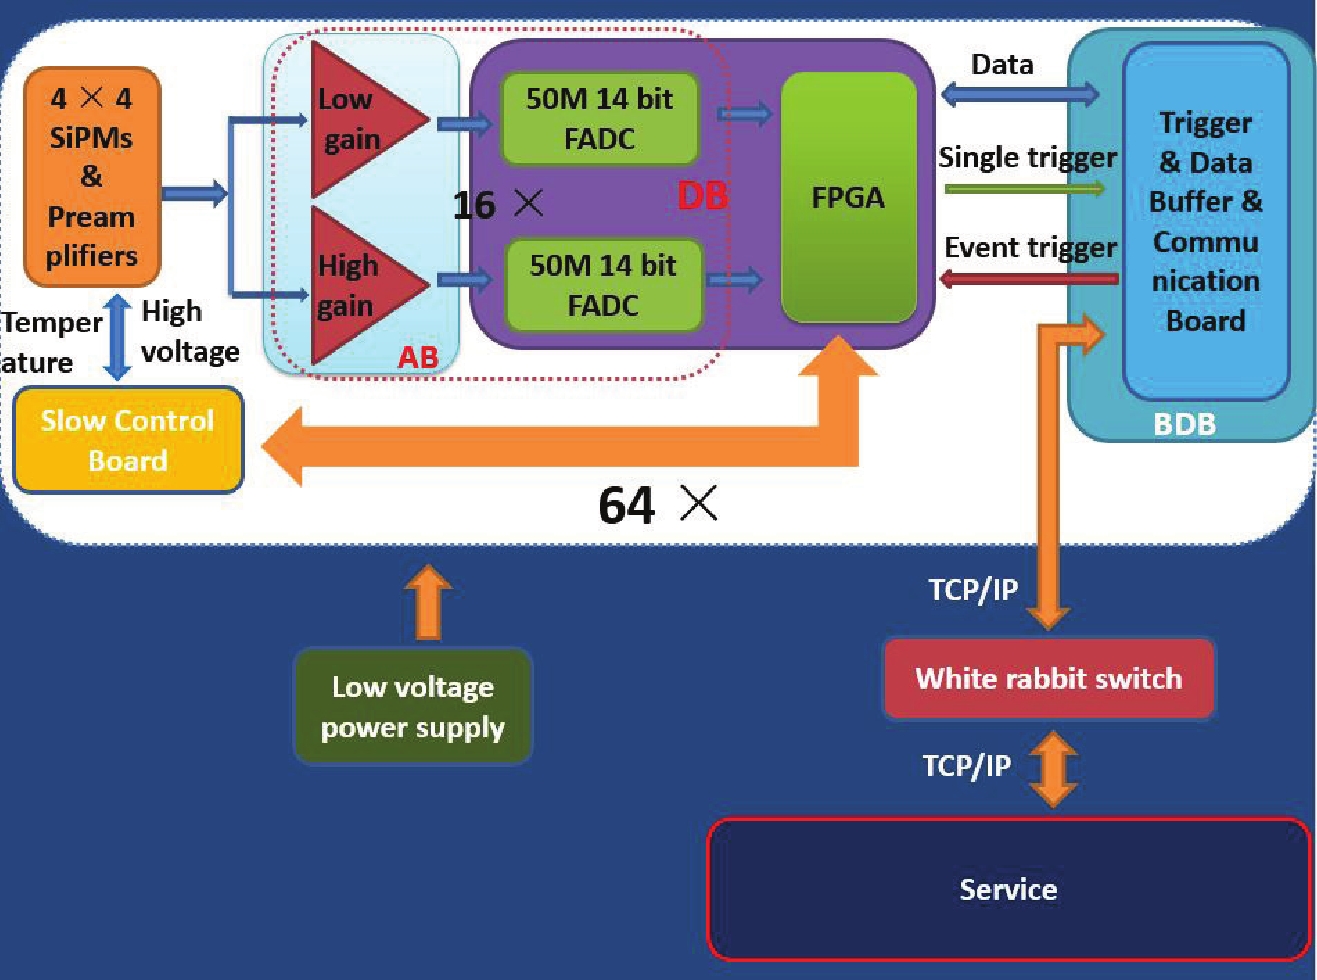
Figure 36. (color online) The architecture of SiPM camera readout electronics.
-
The telescopes were installed at the southwest corner of the first pool of WCDA and can undergo night observations with and without moonlight, even ran through the entire night with full moon. One coincidence event between the telescope and WCDA is shown in Fig. 37 (Fig. 38).
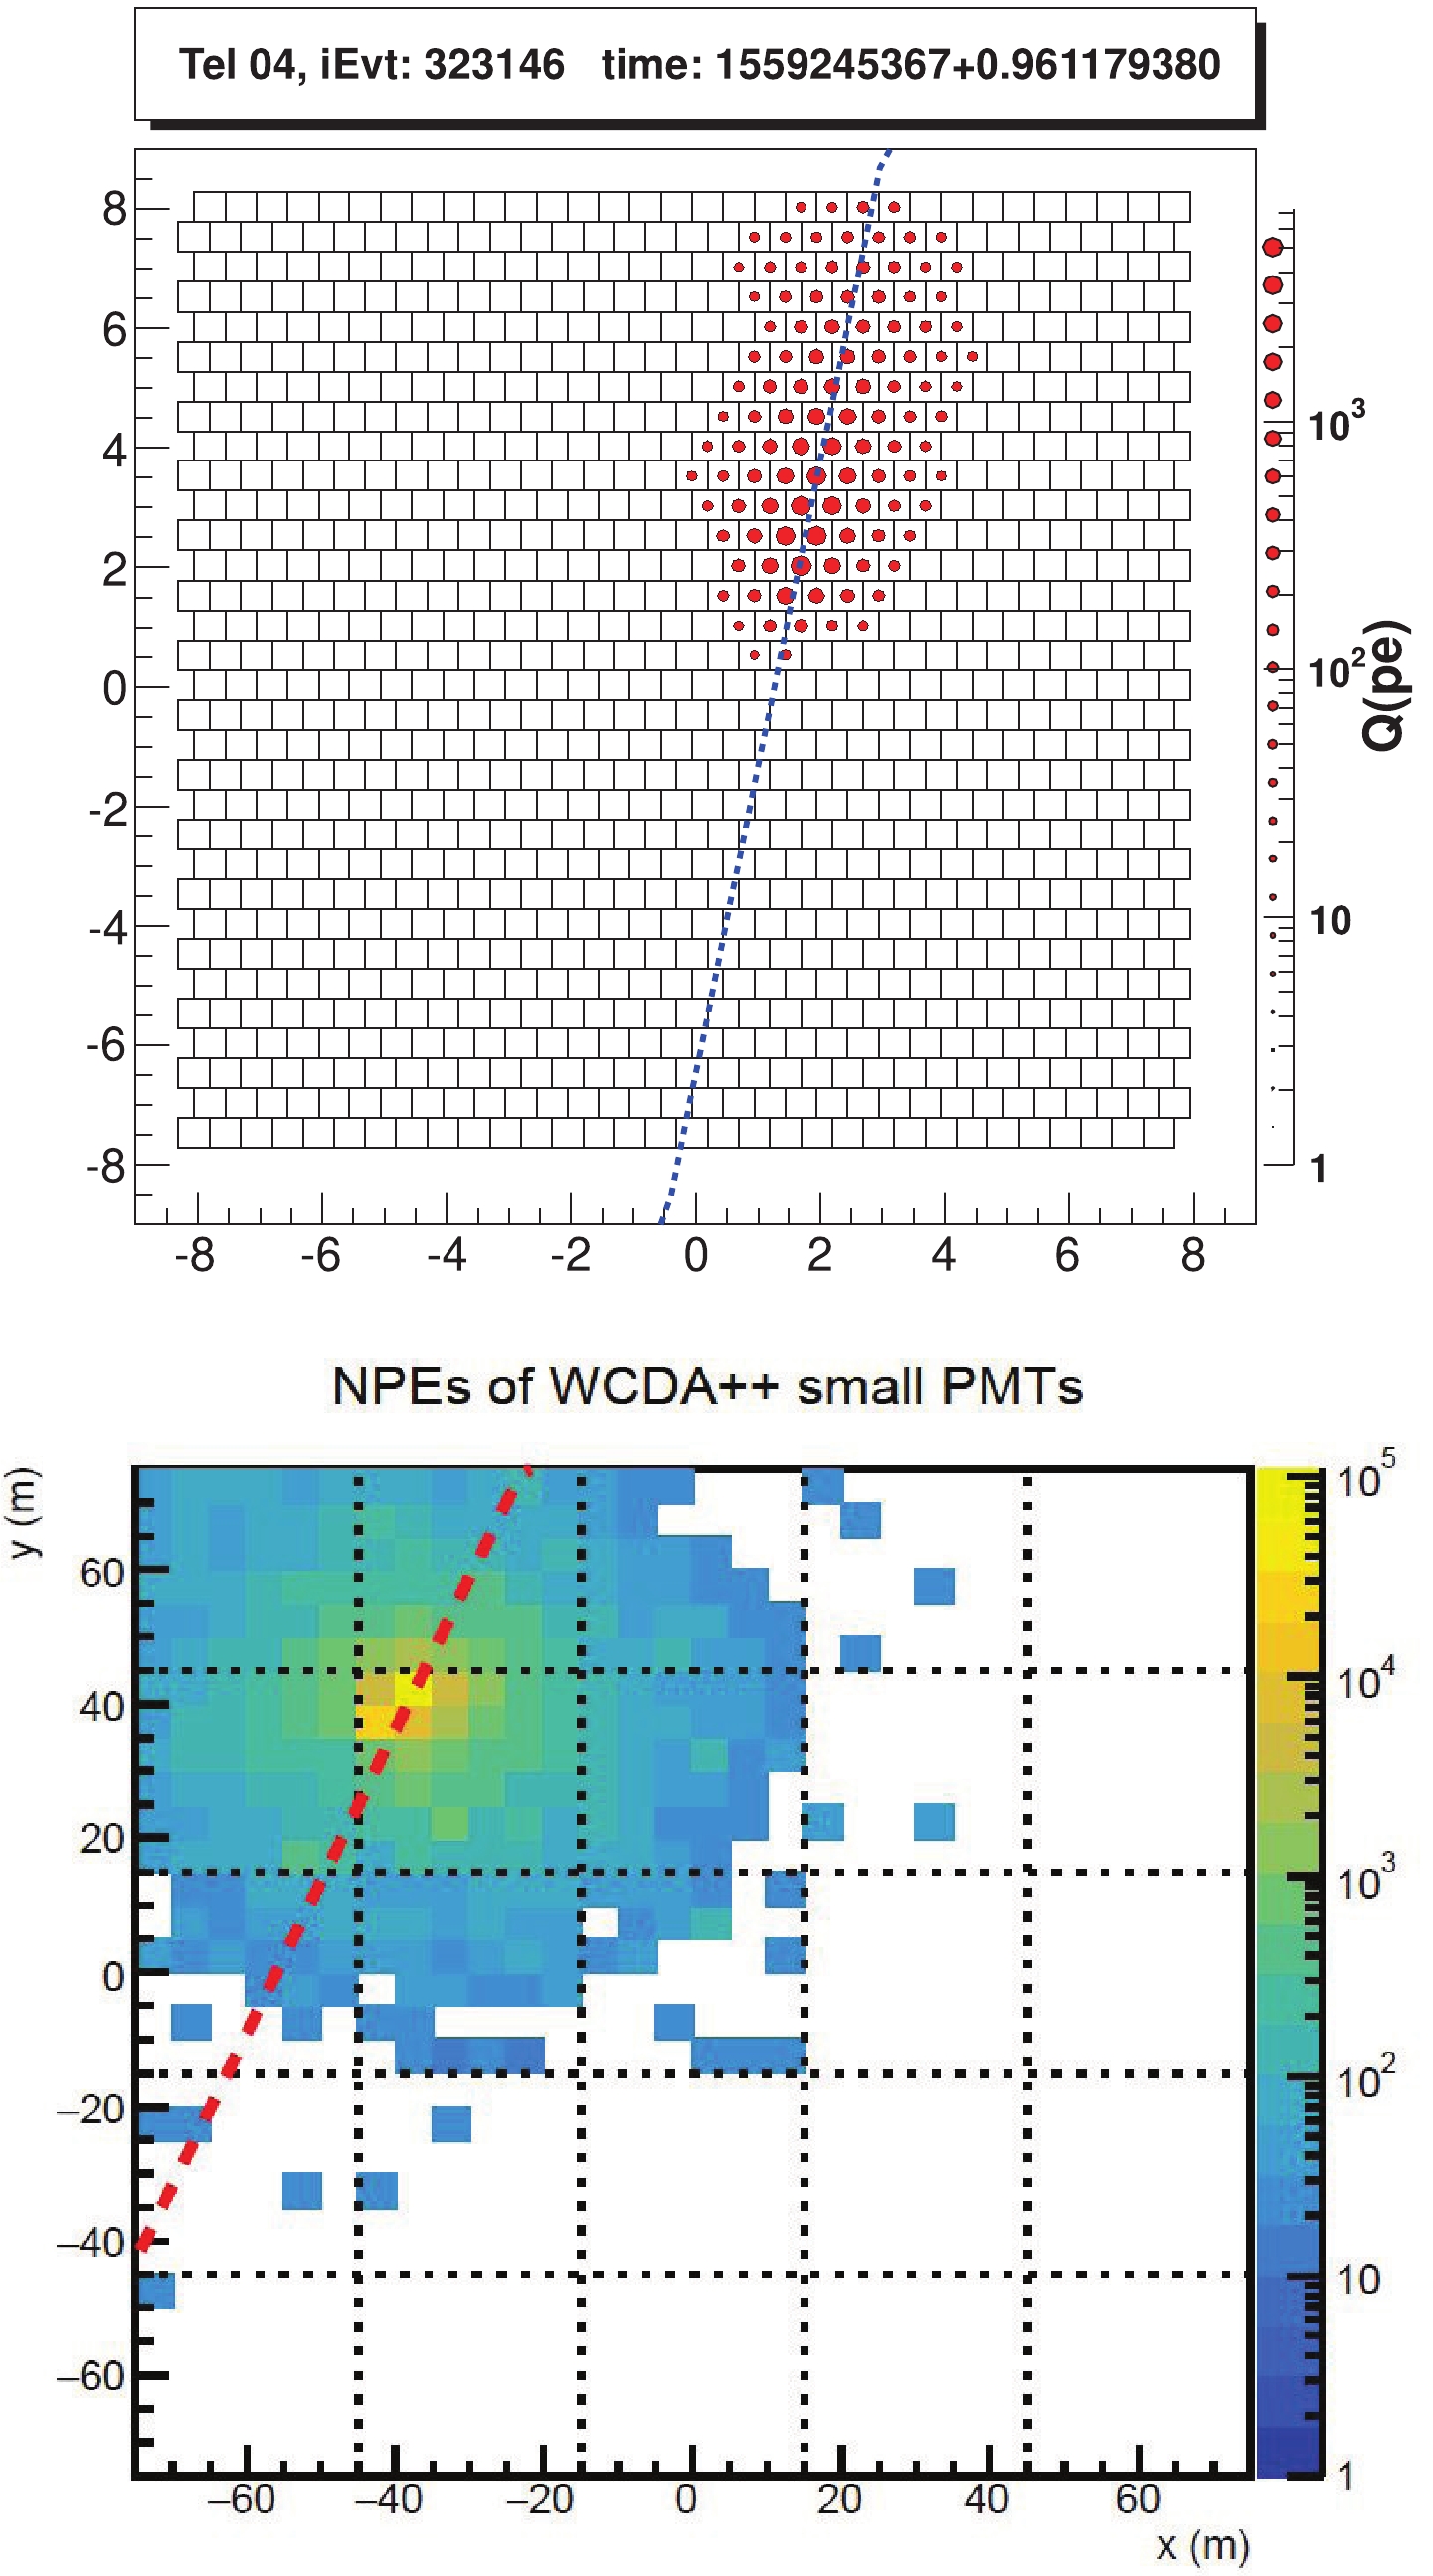
Figure 37. (color online) A coincidence event of two telescoopes and the WCDA first pool. Upper panel: a Cherenkov event of the first Cherenkov telescope. Lower panel: an event of the WCDA first pool using the 1.5-inchs PMT. The dotted lines in (a) and (b) are the shower detector plane reconstructed by the Cherenkov telescope. (Provided by Zhi-Yong You.)

Figure 38. (color online) Bird view of WFCTA.
To monitor the gain of the SiPM camera, six UV-LEDs are mounted at the center of the mirror. The LED driver and six LEDs are installed inside a container that maintains a constant temperature with a self-adjustable heater to be 30.7 °C±0.1°C. The instability of LEDs is less than 0.5% at different temperature [24]. A diffuser is put in front of the LED to make the LED light uniform. One of LEDs is turned on every night. All LEDs are calibrated by the absolute calibration device once a year.
Two 750 W blowers are used for the SiPM camera cooling. The temperature distribution of the SiPM camera is shown in Fig. 39. The difference between the highest and lowest temperatures is about 11 °C±0.2°C. The temperature distribution on the camera is within the adjustable range of bias voltage and temperature compensation loops. The ambient temperature began to drop, and the temperature of SiPM also decreased at night. The ambient temperature rises, and the temperature of SiPM rises as well during daytime. The temperature difference at night is about 10°C. High voltage and temperature compensation loops can keep the SiPM gain stable at different temperature environments.
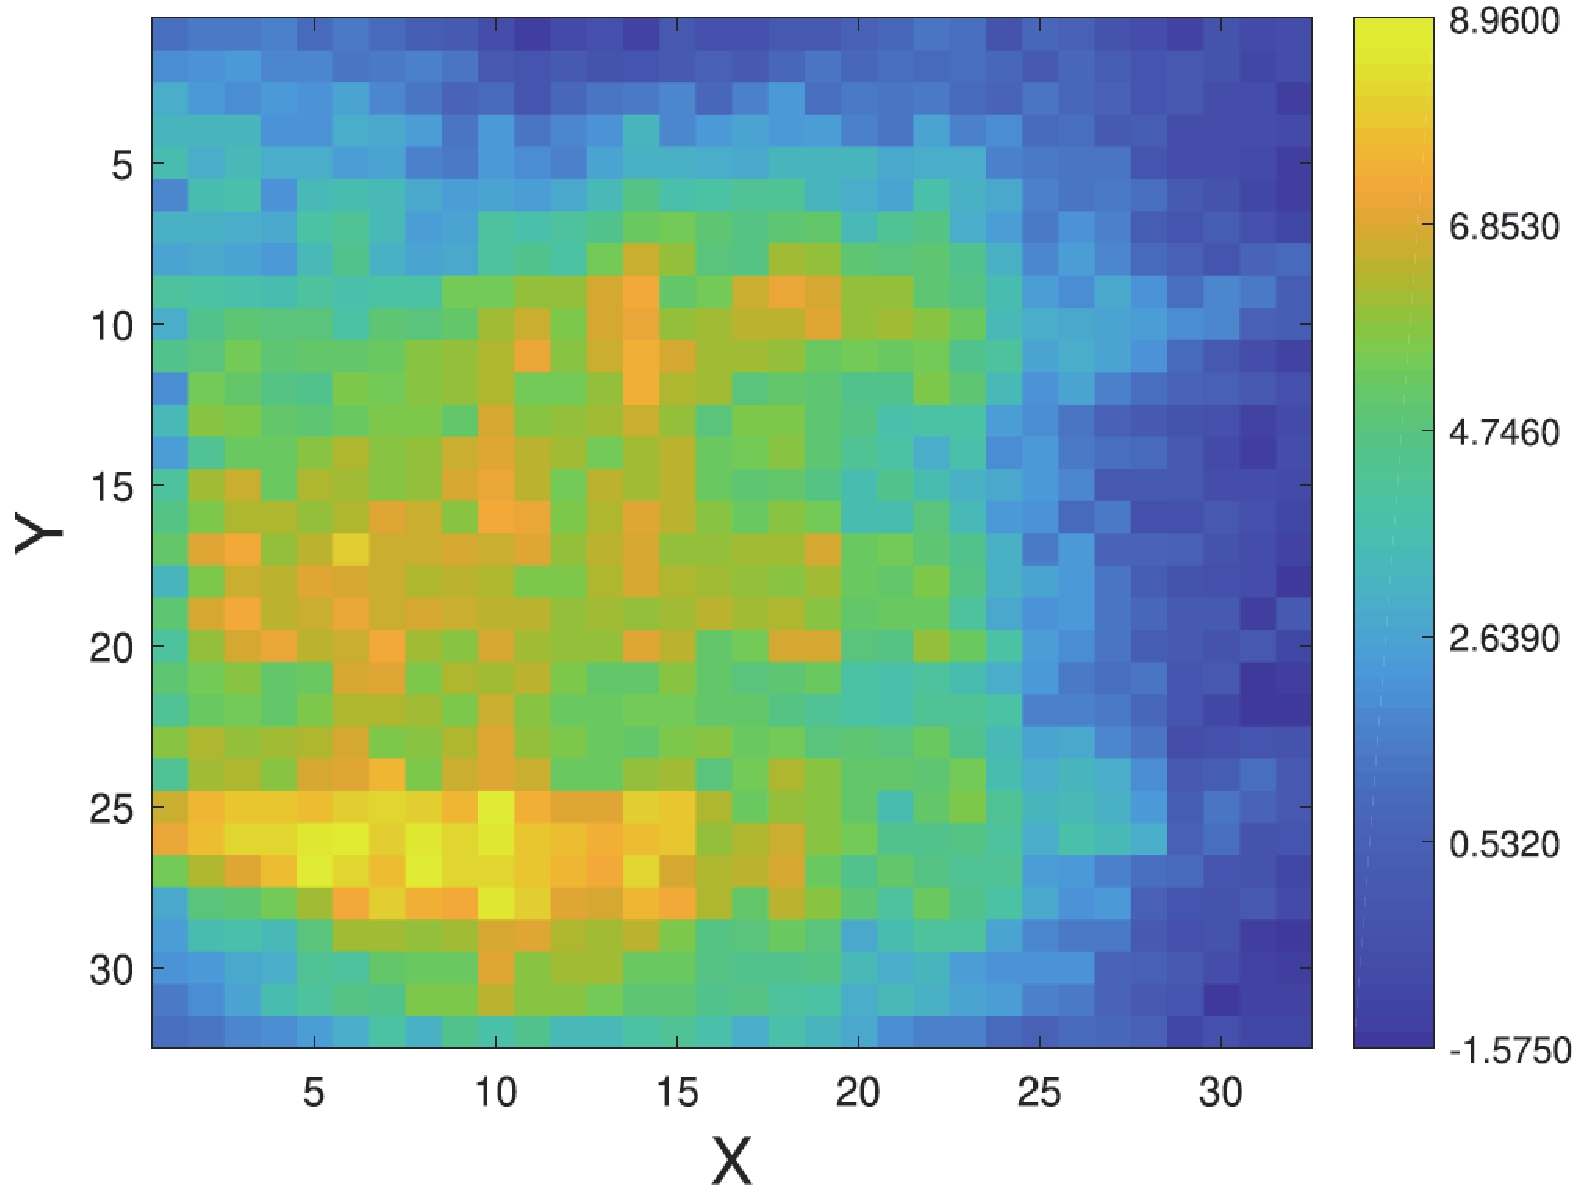
Figure 39. (color online) Two-dimensional temperature distribution of the SiPM camera is shown. The temperature of SiPMs near the air inlet is lower than that of SiPMs near the air outlet. (Provided by Ming-Jie Yang.)
The gain of SiPM camera is stable in moonless nights. A resistor of 250 Ω is put between the input hight voltage and SiPM cathode to protect the SiPM from damage under the strong light condition. The night sky background light induces a DC current in the SiPM, which induces a voltage drop on the bias resistor. Accordingly, the supply voltage, and then the gain, of the SiPM varies with the intensity of the sky background light. On April 19, 2019, the Cherenkov telescope was operated with the full moon. The space angle between one pixel (pixel 6) of the SiPM camera and the moon as a function of time is shown in Fig. 40. The baseline of SiPM is modulated by moonlight, the smaller the angle between SiPM and the moon, the higher the baseline. The gain of SiPM is linearly related to the intensity of moonlight on SiPM. The variation of SiPM gain is about 4% during the full moon night. Baseline monitoring values can be used to correct the SiPM gain reduction due to moonlight in off-line analysis. After correction, the SiPM gain is constant during the whole moon night (Fig. 41).

Figure 40. The space angle between one pixel (pixel 6) of the SiPM camera and the moon as a function of time. (Provided by Li-Qiao Yin.)
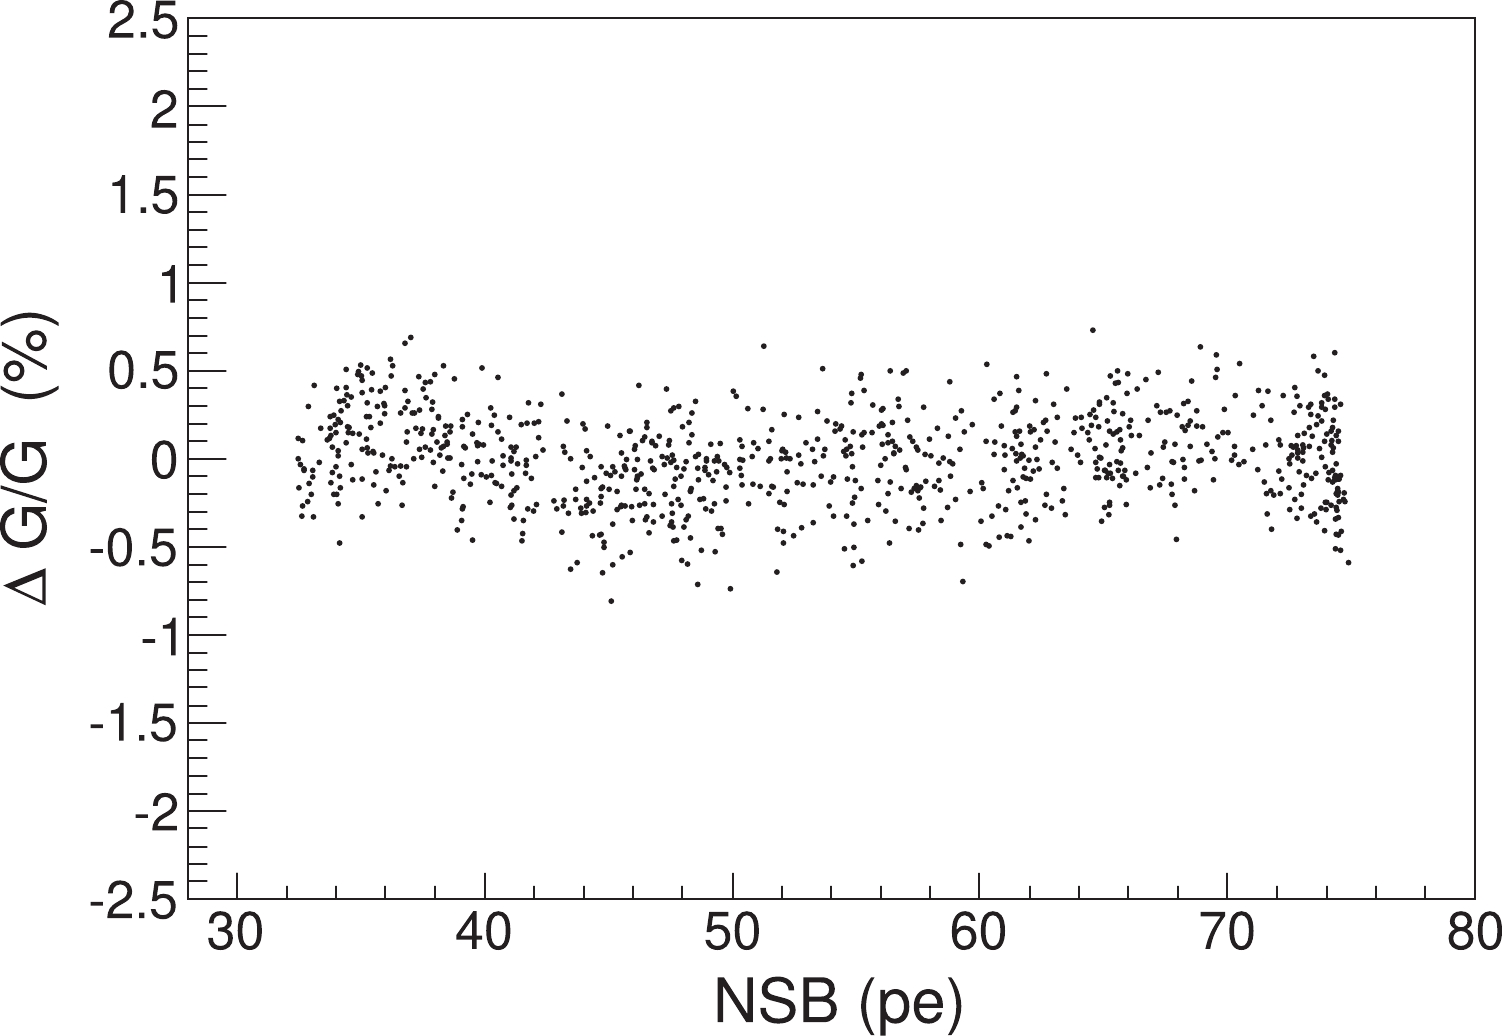
Figure 41. After correction, the gain of the pixel as a function of the night sky background (NSB) in the full moon night. (Provided by Li-Qiao Yin.)
Fourteen telescopes are successfully run at LHAASO site. More than 500 million events coincident with the WCDA first pool have been collected. The SiPM-based Cherenkov telescope has been shown to operate steadily on a full-moon night and achieve a longer duty cycle than a PMT-based Cherenkov telescope. More detailed performance studies are underway, to validate the telescopes against the design requirements. Eighteen telescopes (full WFCTA array) will be operated at LHAASO site in May 2021.
-
When arriving at Earth, high energy cosmic rays interact with the air nuclei thus inducing EAS. They consist of a core of high energy hadrons that continuously feed the electromagnetic part of the shower through fast decays of neutral pions, kaons and etas. Nucleons and other high energy hadrons contribute to the hadronic cascade. High energy hadrons, which constitute the EAS skeleton as G.T. Zatsepin called it, carry important information for multi-parameter correlation studies. For example, hadronic observables, primarily the hadron number/electron number correlation, depend on the nature of the particle inducing the shower [25-27]. Thus, the detection of high energy hadrons, addressed to improve the discrimination power in these analysis, is highly advisable. A way to deal with this problem avoiding the usage of huge and expensive HCALs was brought out in [26]. In these papers the detection of thermal neutrons generated by EAS hadrons is proposed. It is well known that hadrons interacting with ambient matter (air, building, ground, etc.) produce evaporation neutrons due to nuclei disintegration. The neutrons have no charge and lose energy only by scattering. If the medium is a good moderator, i.e., the absorption cross section is much less than the scattering cross section, the neutrons lose energy via scattering down to the thermal ones (moderation process) and then live in the matter until capture. Evaporation neutrons need about 0.5 ms to be thermalized in rock (concrete). Neutrons are generated abundantly, up to 2 orders of magnitude more than parent hadrons [28]. A large fraction of the evaporation neutrons thermalize, so that recording thermal neutrons can be exploited to reconstruct the hadron content in the shower [25]. This approach looks very promising for measurements carried out at high altitude. Indeed, since the hadron content in EAS increases with approaching shower maximum, an abundant production of thermal neutrons can be predicted for experiments at 4 km a.s.l., about a factor 10 higher than that at sea level for showers in the PeV energy region [28]. These considerations suggested the development of a simple and cheap thermal neutron detector, to be deployed over a large area, as ’hadron counter’ in EAS experiments at mountain level. This idea led to the development of the EN-detector, based on a mixture of the well-known inorganic scintillator ZnS(Ag) with 6LiF, capable of recording both thermal neutrons and relativistic charged particles [29,30]
-
Of the isotopes used as neutron capture material we used 6Li and 10B. The reactions of neutron capture are:
$\begin{array}{l} {{n}} + {^{\rm{6}}}{\rm{Li}}{ \to ^{\rm{3}}}{\rm{H}} + {^{\rm{4}}}{\rm{He + 4}}{\rm{.79}}\;{\rm{MeV}}\;\left({{\rm{940}}\;{\rm{barns}}} \right)\\ {{n}} + {^{{\rm{10}}}}{\rm{B}}{ \to ^{\rm{7}}}{\rm{L}}{{\rm{i}}^{\rm{*}}} + {^{\rm{4}}}{\rm{He}}\\ \quad \quad \quad { \to ^{\rm{7}}}{\rm{Li }} + {^{\rm{4}}}{\rm{He + 2}}{\rm{.3}}\;{\rm{MeV}}\;\left({{\rm{93}}\;{\text{% }}} \right)\\ \quad \quad \quad { \to ^{\rm{7}}}{\rm{Li }} + {^{\rm{4}}}{\rm{He + 2}}{\rm{.8}}\;{\rm{MeV}}\;\left({{\rm{7{\text{%}} }}} \right)\;\left({{\rm{3980}}\;{\rm{barns}}} \right){\rm{.}} \end{array} $

6Li releases the highest energy during the reaction, but it is a rare material of nuclear fission so that its purchase is strongly limited by government and the price is quite high. Although capturing neutron with lower released energy than 6Li, 10B has larger cross section. Moreover, natural Boron contains 19% of 10B versus only 7% of 6Li in natural Lithium. This and large crossection allowed us to make a natural boron compound comparable in neutron capture efficiency with lithium ones enriched with 6Li up to 90%.
A novel type of ZnS(Ag) scintillator alloyed with B2O3 (65% and 35% respectively) with the 10B isotope about 19% is developed and produced by Luminofor company (Russia) in collaboration with INR. Powder of ZnS(Ag) and B2O3 alloy is deposited in optical silicon rubber. The effective thickness of the scintillator layer is 50 mg/cm2.
The design of a typical EN-detector is shown in Fig. 42. The scintillator of 0.35 m2 area is mounted inside a black cylindrical polyethylene (PE) 200-l tank which is used as the detector housing. The scintillator is placed at the tank bottom to a distance of 35 cm from the photomultiplier (PMT) photocathode. A 4"-PMT (Beijing Hamamatsu CR-165) is mounted on the tank lid. A light reflecting cone made of foiled PE foam of 5-mm thickness is used to improve the light collection. As a result, ~ 60 photoelectrons per neutron capture are collected. The efficiency for thermal neutron detection in our scintillator was found experimentally by neutron absorption in the scintillator layer to be about 20%. The peculiar characteristics of the EN-detector output, that are weak and fast signals from charged particles compared to high amplitude, slow and delayed signals from thermal neutron capture, make it well suitable for its use in the framework of EAS experiments. Due to the thin layer of the scintillator, charged particles deposit on average only 60 keV against 2.3 or 2.7 MeV deposited during the neutron capture. A very high
$ \alpha/e {\approx} 1 $ , that is the ratio of the light produced by α particles to the light produced by electrons of the same energy, is the main scintillator feature. This feature allows to collect enough light using only one PMT viewing 0.35 m2 scintillator layer. The charge collection time of a signal due to a neutron capture is several μs, while the characteristic time of the fast emission induced by charged particles is about 40 ns. Note that all signals are integrated with a time of 1 μs and then digitized with a FADC whose resolution is equal to 1 V / 1024 ch = 1 mV/ch. As an example, we show in Fig. 43 the pulses recorded in a high energy EAS event. The first big peak is generated by the large amount of charged particles of the shower front while the smaller delayed signals are generated by thermal neutrons. Thus, the pulse height of the first signal can be used to measure the charged particle density while the delayed signals measured in a time gate of 20 ms give the number of captured thermal neutrons. EN-detectors are also capable to continuously measure natural neutron flux variations connected with weather condition, seasonal effect, solar activity and earthquakes, etc. For this purpose the detector has additional output with 20 μs time of light collection that allows us to more effectively separate neutron pulses.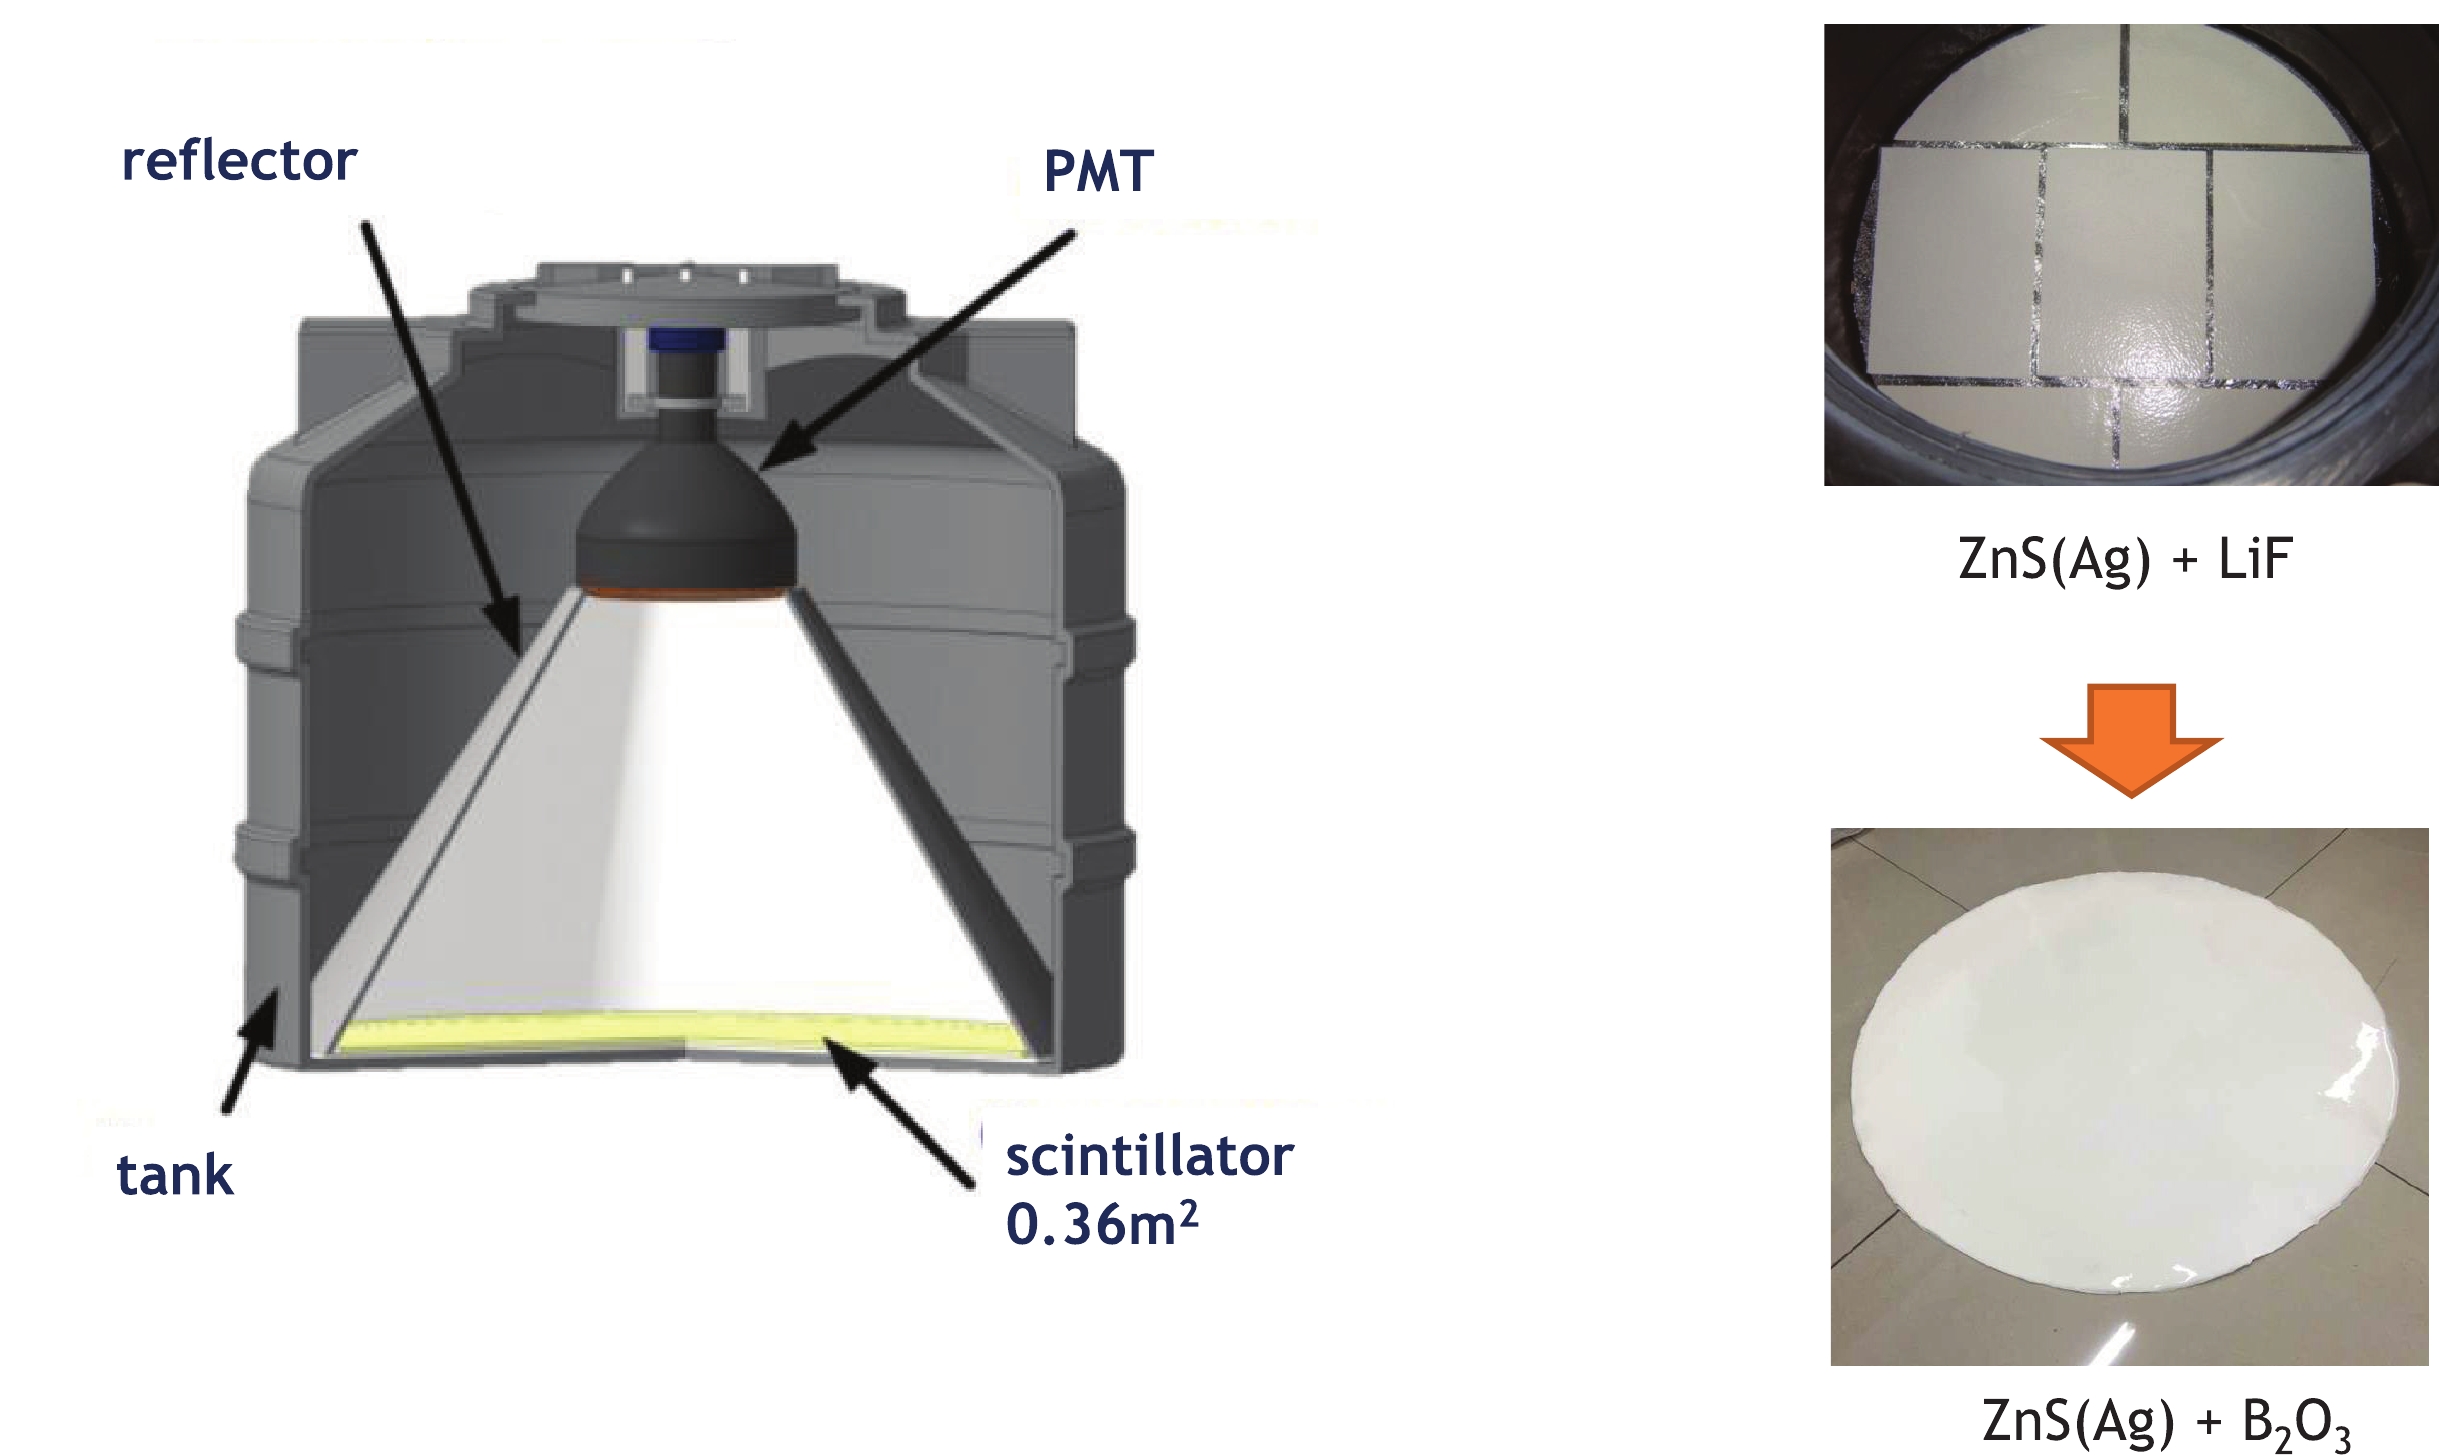
Figure 42. (color online) Left: Scheme of the EN-detector. Right top: Photo of the ZnS(Ag)+LiF scintillator used in PRISMA-YBJ. Right bottom: Photo of the ZnS(Ag)+B2O3 scintillator used in LHAASO-ENDA.
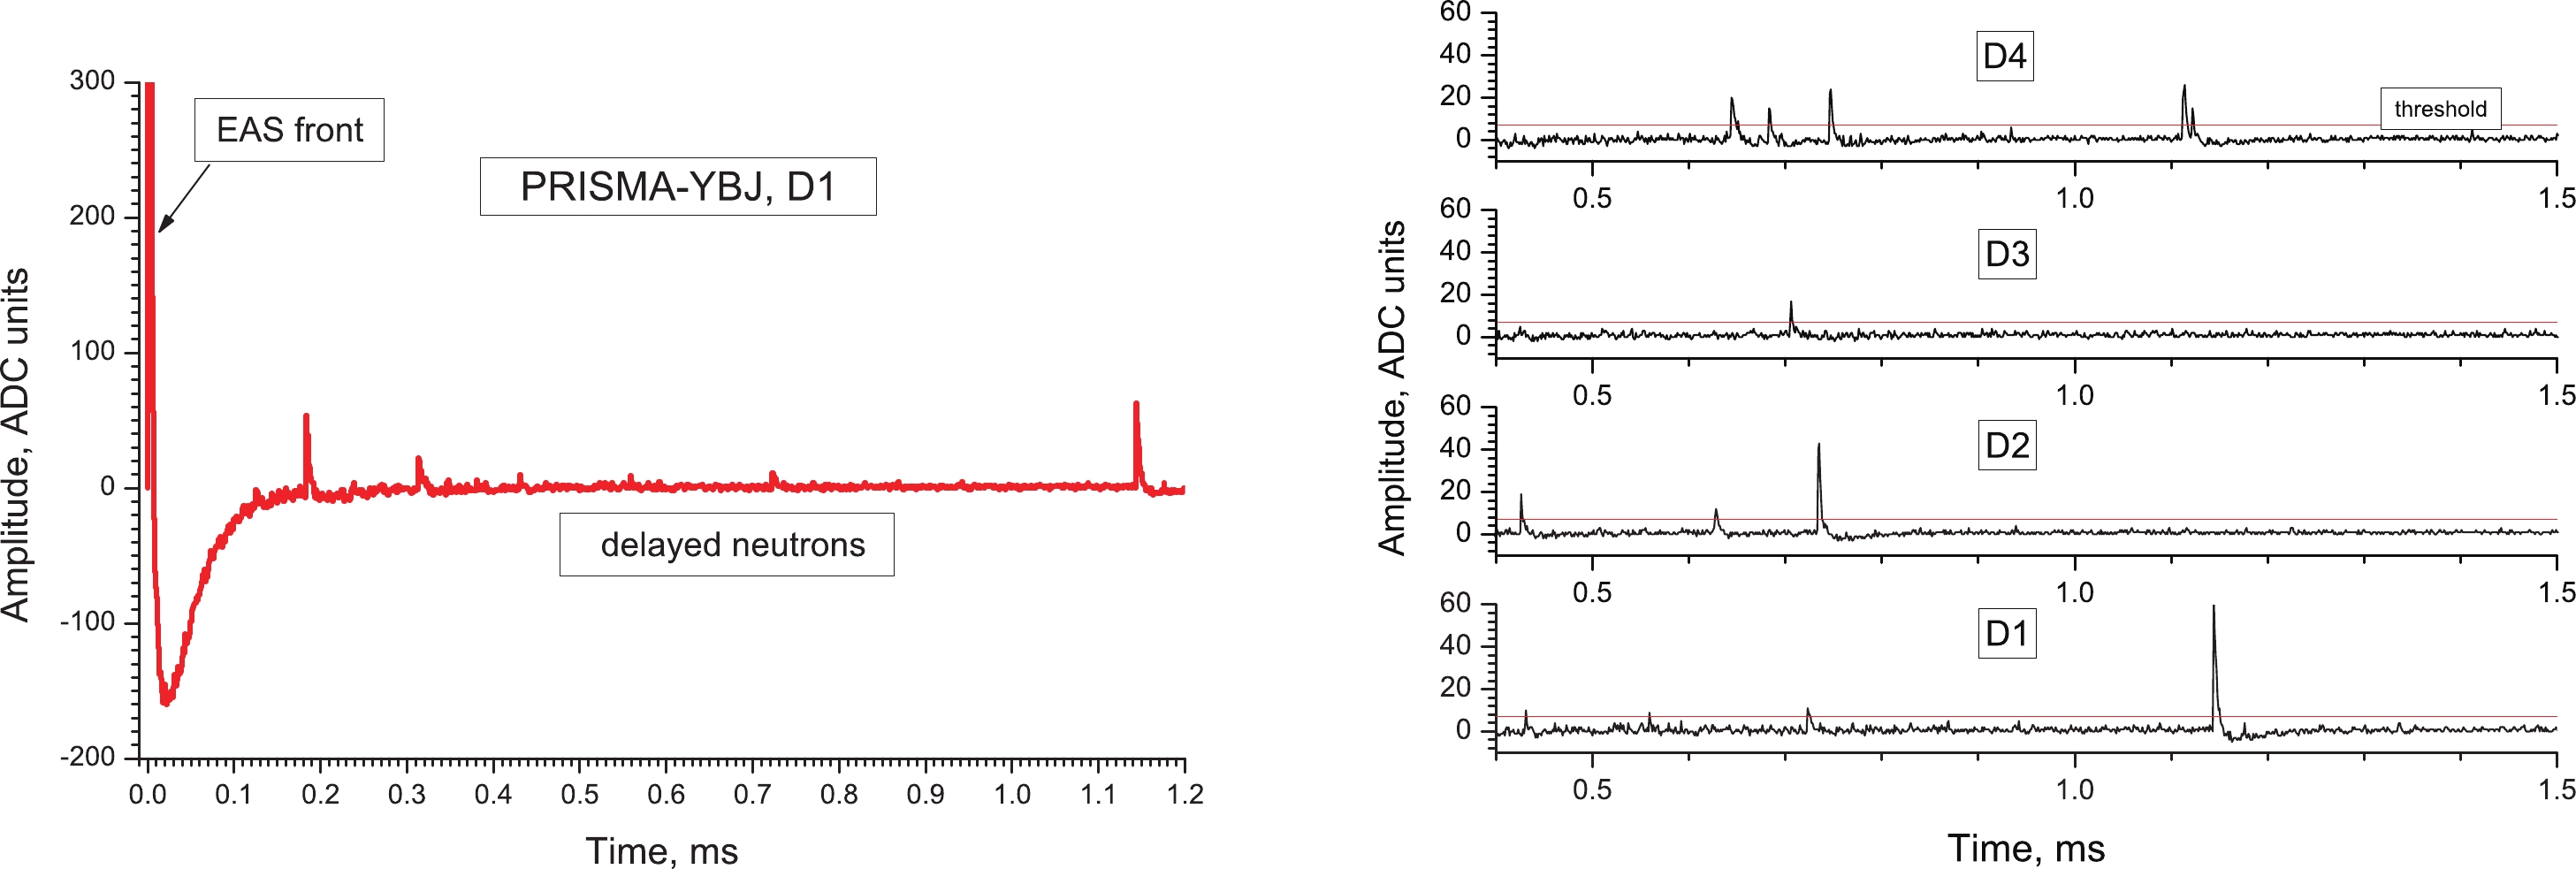
Figure 43. (color online) The shape of the signal from the neutron detector at PRISMA-YBJ.Left: the pulse from 0 to 1.2 ms. The large peak in the first bin is generated by the EAS electrons. Right: the pulses from 0.5 to 1.5 ms. The small delayed peaks following the first peak are generated by thermal neutrons having very wide temporal distribution due to low velocity.
Front-end electronics (FEE) of each cluster consists of PMT voltage dividers, DIU (Discriminator-Integrator Unit: charge sensitive preamlifier, discriminator and integrator) and IU (Integrator Unit: charge sensitive preamplifier and integrator), 16-channel programmable high voltage (HV) power supply and low voltage (LV) power supply. DIU, IU and HV power supply are shown on Fig. 44.
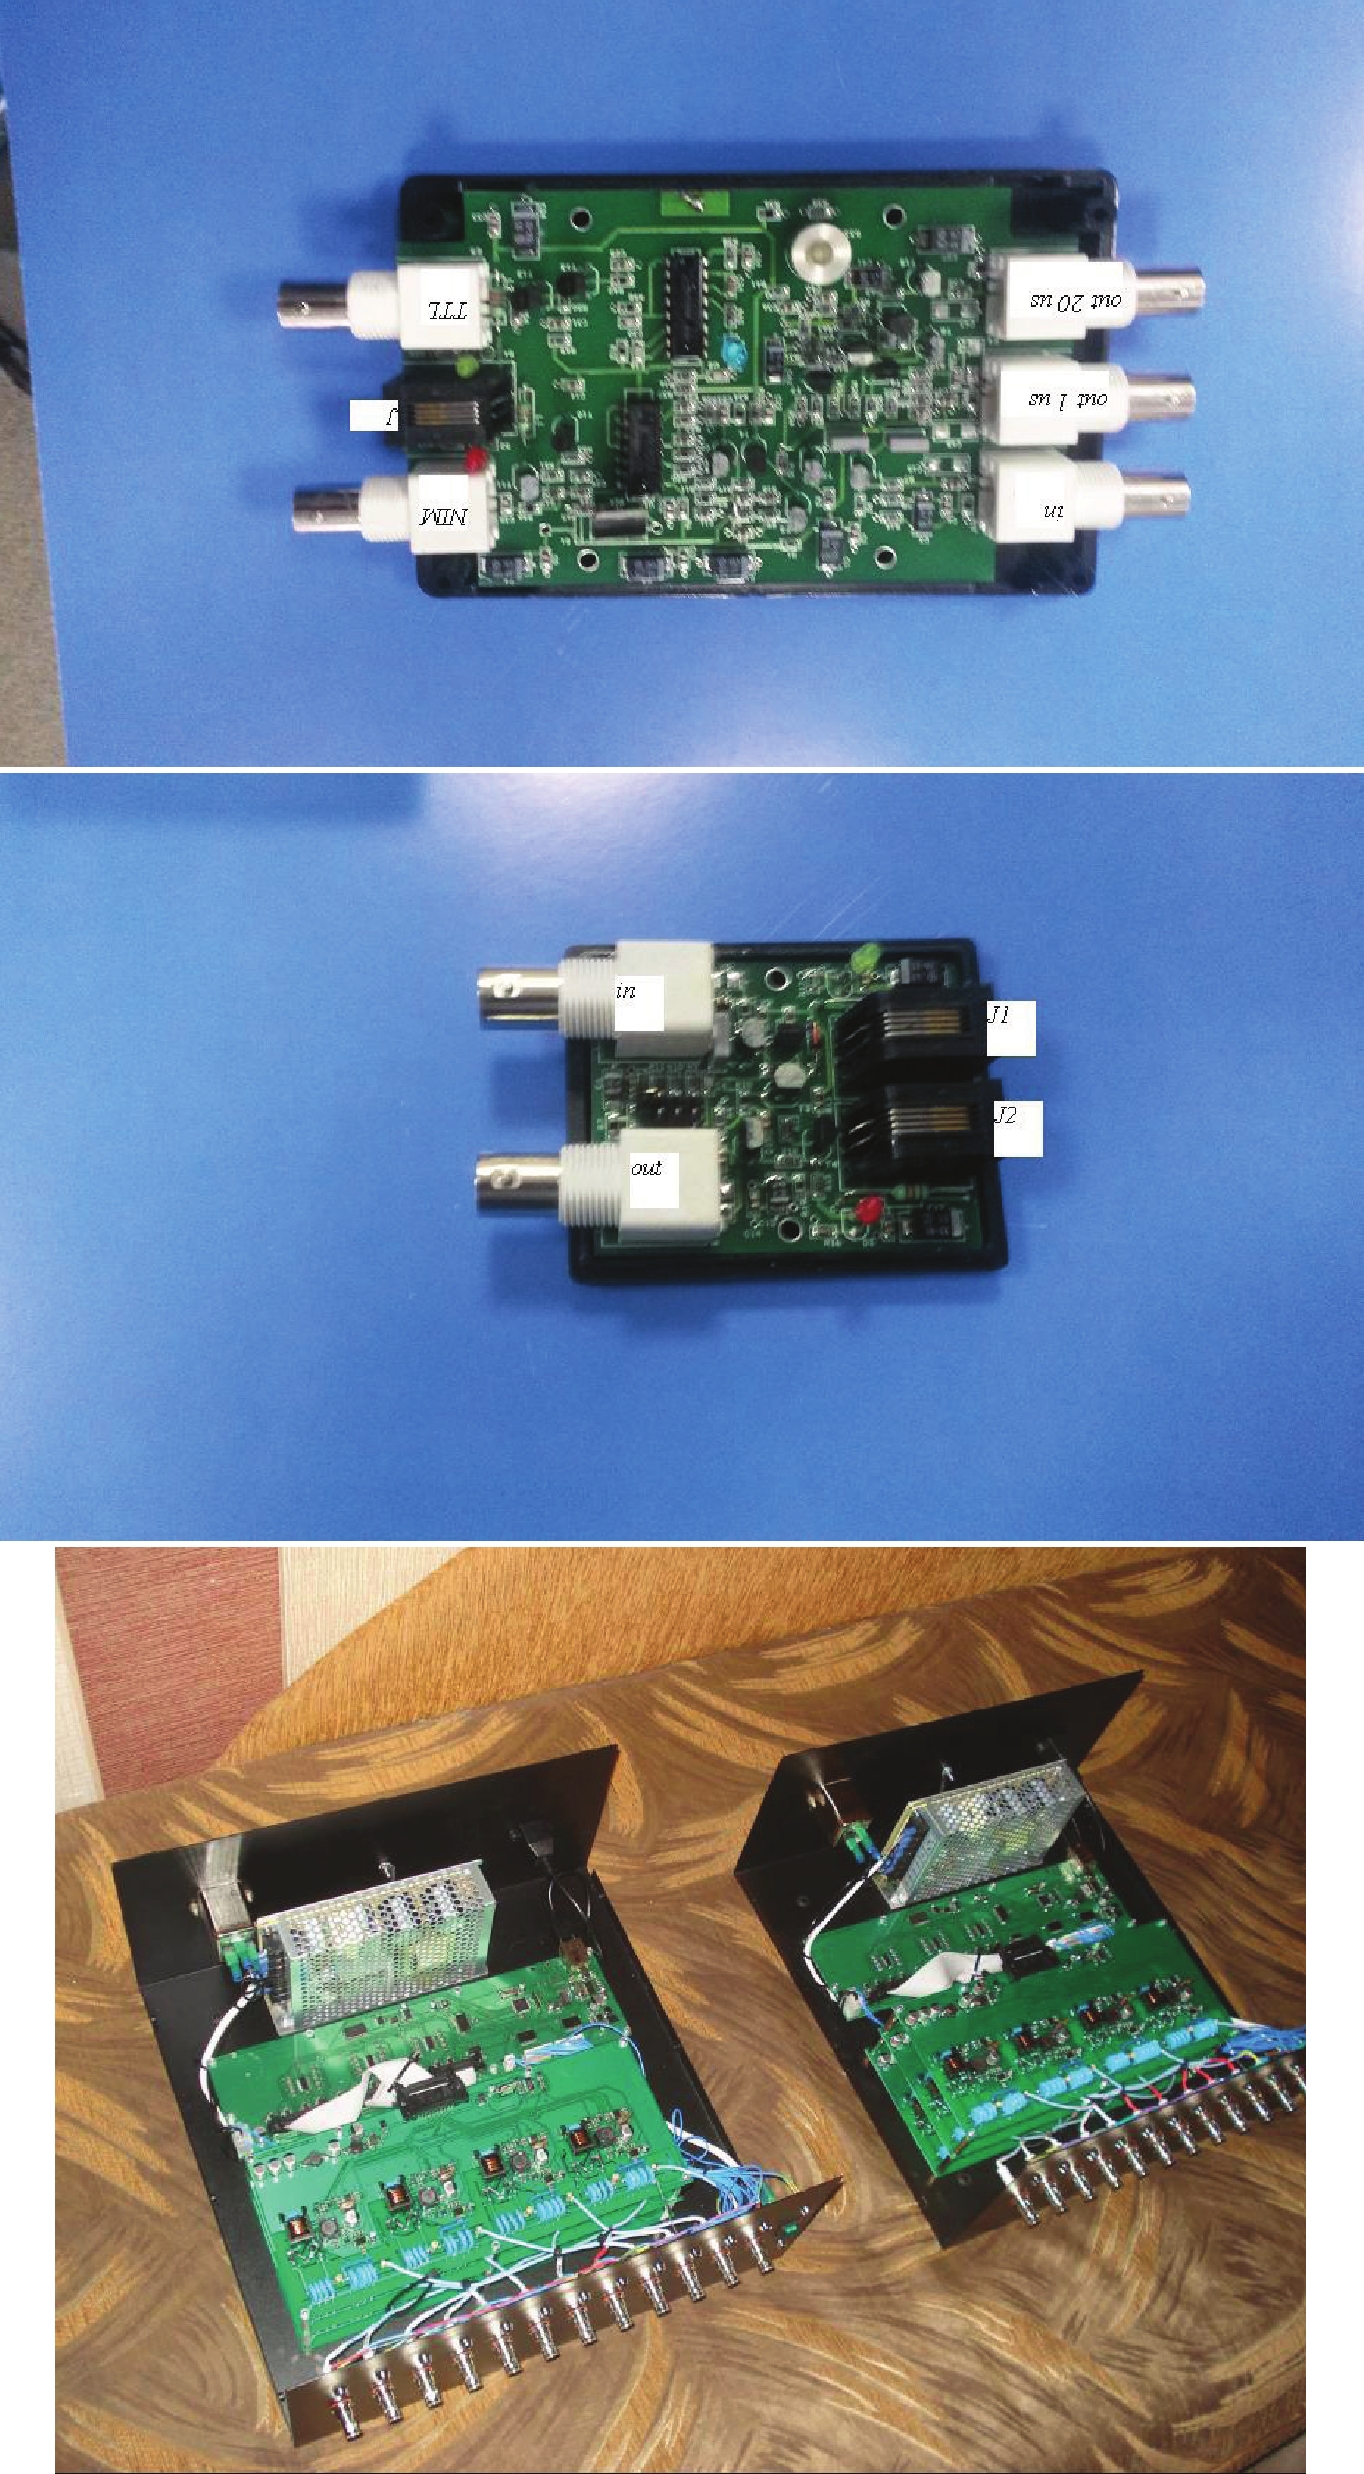
Figure 44. (color online) Front-end electronics. Upper panel: DIU, Middle panel: IU, Lower panel: HV power supply.
Voltage dividers have 3 signal readouts from: the 8th and the 5th dynodes and anode. 8th dynode is used for energy deposit measurements, a coincidence selection and counting number of secondary neutrons. the 5th dynode is needed to expand the dynamic range. The 5th dynode pulse will be used in the case of high energy event and big energy deposit in detector when the 8th dynode is saturated and the 5th one is not. The anode's current readout is used only for tests and calibrations. Our working HV range for CR-165 is 700 - 900 V.
DIU and IU are similar to one used in prototypes [31-33]. DIU and IU are supplied by LV -12 and +12 V. DIU has 1 input and 4 outputs. Signal from the 8th dynode comes to the input. Then one readout provides amplified pulse integrated with time of t = 1 µs, the second one gives amplified pulse integrated with time of t = 22 µs. The last two outputs are NIM and TTL pulses in the case of input signal is above the discriminator threshold. 1 µs integrated pulse is used for EAS measurements and 22 µs integrated pulse is used for monitoring of neutron background variations. NIM and TTL pulses were used in prototypes and aren't used in ENDA. IU has one input for 5th dynode's signal and one output with 1 µs time integration. Both devices (DIU and IU) have a linear dynamic range up to 3 V.
HV power supply (produced by Mantigora, Russia) is a stable 16-channel programmable device connected to PC through ethernet. Each channel's range is 400 - 2000 V. LV power supply (produced by Dahua, China) has 2 channels providing +12 and -12 V around ground level for DIU and IU.
Data acquisition system (DAQ) of each cluster consists of 32-channel FADC connected to a PC via optical cable. FADC produced by the Sichuan University digitizes each pulse above the threshold. Each digitized pulse has 102 points: 37 points of 20 ns step and 65 points of 1 µs step. Also each pulse has a time tag with 20 ns resolution. The software checks if there is a coincidence of at least 2 detectors in a time gate of 1 µs and if so it counts pulses after that in a time gate of 20 ms analyzing time tags. The first 16 channels of FADC are used for the 8th dynodes and other 16 for the 5th dynodes.
EN-detectors are calibrated with neutron pulse height spectrum. Example of calibration spectra of different detectors with the neutron source Cf-252 are shown on Fig. 45.

Figure 45. (color online) Neutron pulse height spectra. Different colors are of different detectors.
ZnS(Ag) is not transparent to its own light and because of that neutron pulse height spectrum is exponential:
$ \frac{{\rm d}N}{{\rm d}A} = C \cdot \exp\left(-\frac{A}{A_0}\right). $

In this case the parameter
$ A_0 = <A> $ and is proportional to detector gain. EN-detectors are calibrated to set$ A_0 \approx $ 9 mV. In this instance we have signal from 1 MIP (Minimum Ionizing Particle) equal to ≈ 0.7 mV. Also the number of photoelectrons is ≈ 7 p.e./mV. In addition, the difference between integrals of neutron pulse height spectra (i.e. neutron counting rate) is < 10 %. -
A prototype array of 32 EN-detectors (PRISMA-32) and P-INR of 16 EN-detectors are now running in Moscow [31,33]. In order to check the performance of this detector at a high altitude site, a small array composed of four EN-detectors (PRISMA-YBJ) has been installed inside the hall hosting the ARGO-YBJ experiment at the Yangbajing Cosmic Ray Observatory (Tibet, China, 4300 m a.s.l., 606 g/cm2). The two arrays (PRISMA-YBJ and ARGO-YBJ) operated together, and coincident events have been analyzed to gather information on the PRISMA-YBJ performance [32]. In order to check the performance of the new type of EN-detectors at a high altitude site, in February 2017 we built an array of 16 EN-detectors based on boron compound scintillator (ENDA-16-YBJ) at Tibet University (TU) in Lhasa, Tibet, China (3700 m a.s.l.), and then moved it to YBJ at the end of 2018 [34, 35]. Up to now, ENDA has totally 66 detectors (ENDA-64 and the other two as backup), ready for deploying inside LHAASO to make a hybrid detection of cosmic ray spectrum above 100 TeV (Fig. 46 left).

Figure 46. (color online) Configuration of ENDA-64 (left) and ENDA-400 (right).
ENDA-64 array performance was studied with simulations using GEANT4.10 and CORSIKA7.56 codes. ENDA energy thresholds providing EAS recording efficiency above 90% are ≈ 350 TeV and ≈ 1 PeV for primary protons and iron nuclei respectively. Energy thresholds are shown in Fig. 47. Simulated age parameter distributions for primary protons and iron are presented in Fig. 48.

Figure 47. (color online) ENDA EAS recording efficiency for different primaries.
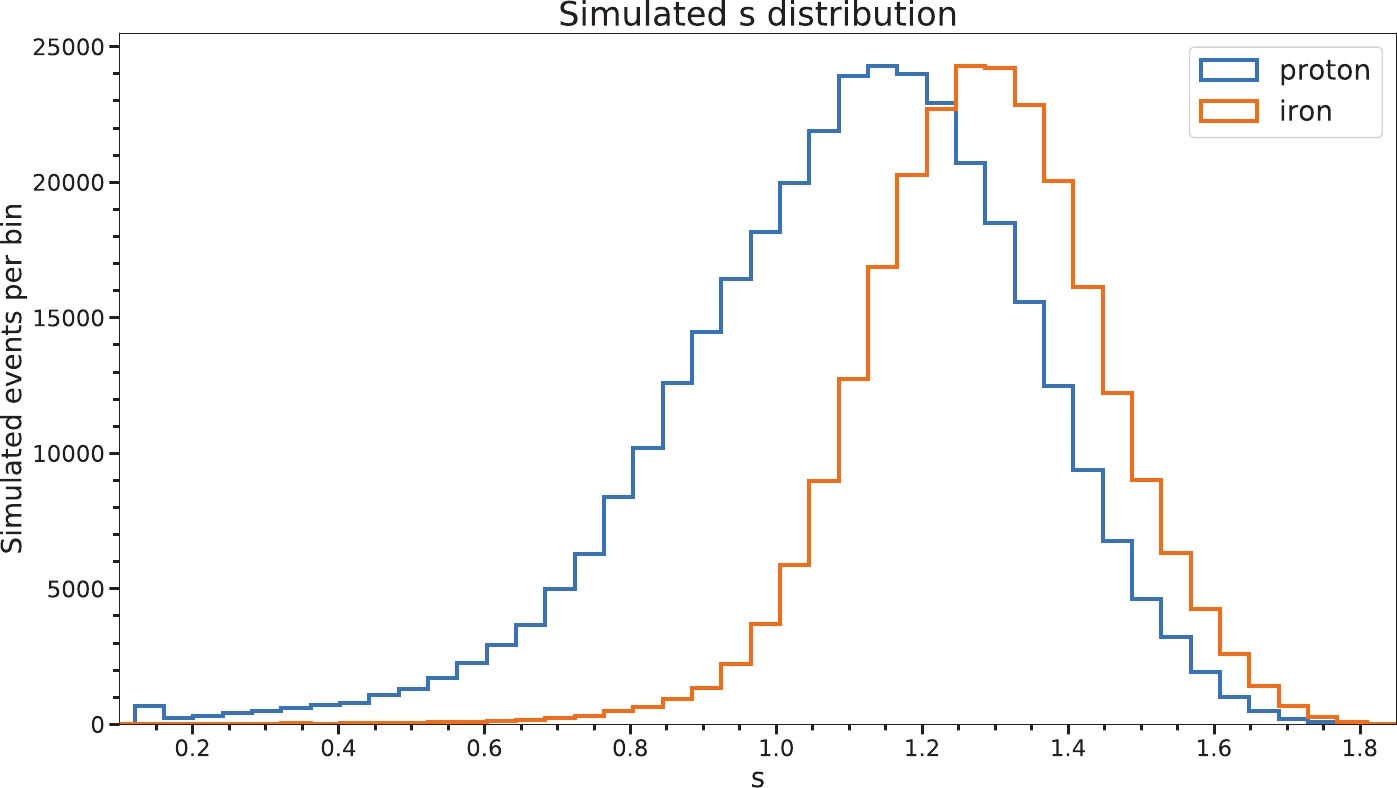
Figure 48. (color online) Simulated age parameter distribution for primary protons and iron nuclei.
Primary energy resolution was calculated for protons with fixed energies of
$ 10^{15} $ and$ 10^{16} $ eV and is ≈ 30% and ≈ 15% respectively and shown in Fig. 49. For energy reconstruction the multi-variable analysis including electron and neutron components was used. Some of these parameters are measured (number of neutrons and electrons), some of them are reconstructed (age parameter, shower size, zenith angle). The analysis technique based on neutron and electron component measurement is described in [36]. Also the distribution of the number of recorded neutrons is presented in Fig. 50.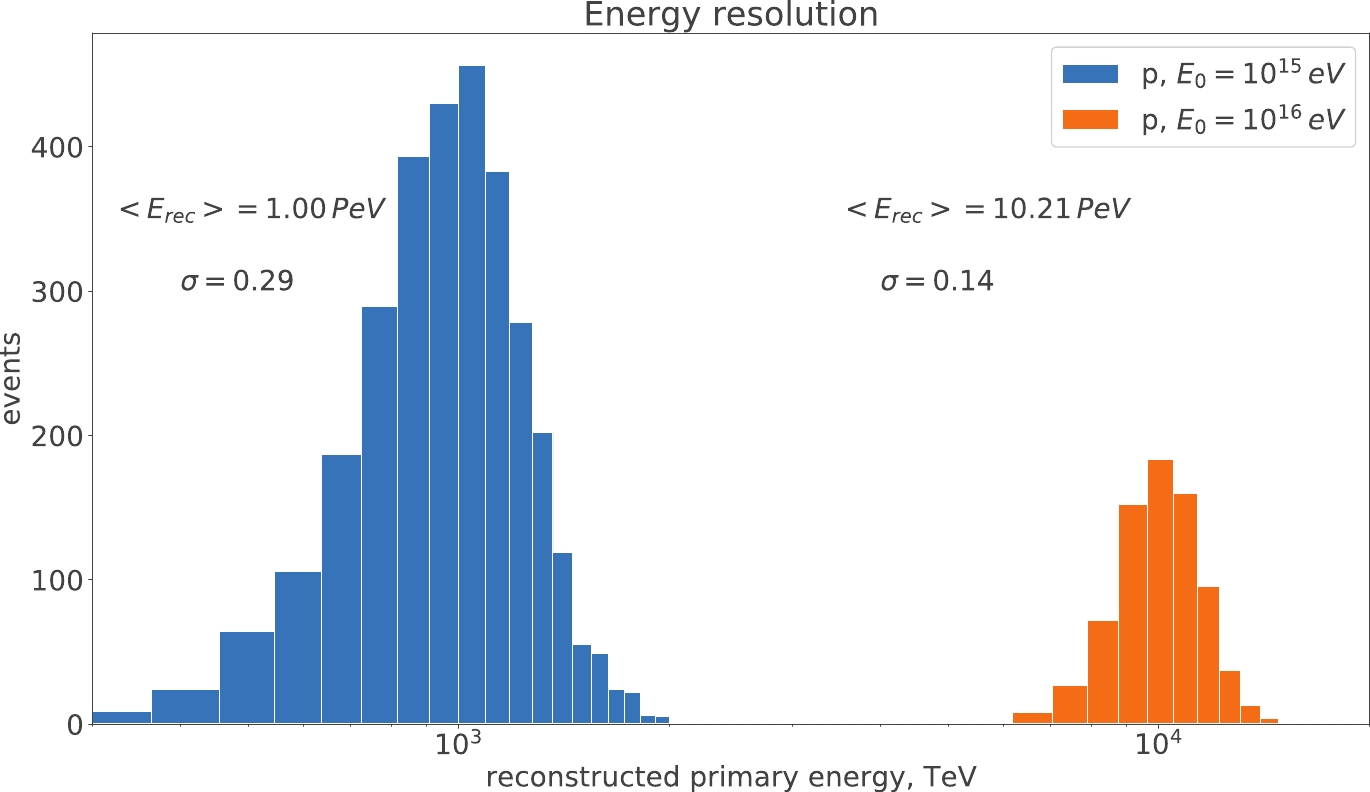
Figure 49. (color online) Simulated primary energy resolution for primary protons with fixed energies of 1015 and 1016 eV.
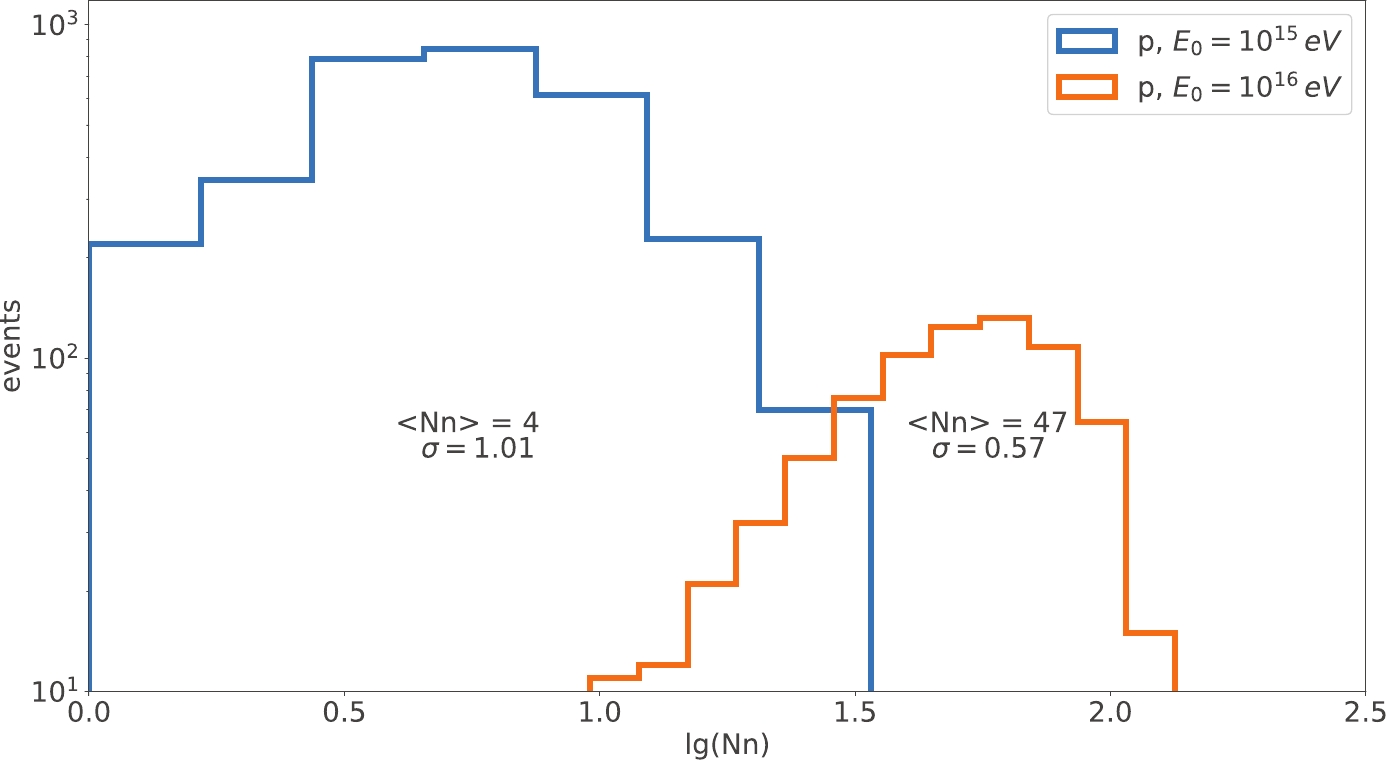
Figure 50. (color online) Simulated neutron number distribution for primary protons with fixed energies of 1015 and 1016 eV).
The core location error is less than 3 m for energies above 1 PeV. The angular resolution of ENDA-64 is about 4 degrees. Also the primary mass reconstruction capabilities of the array were studied by simulations. Using the method described in [35] the primary masses were reconstructed for protons, nitrogen and iron nuclei with energies above 1 PeV and the results are shown in Fig. 51.
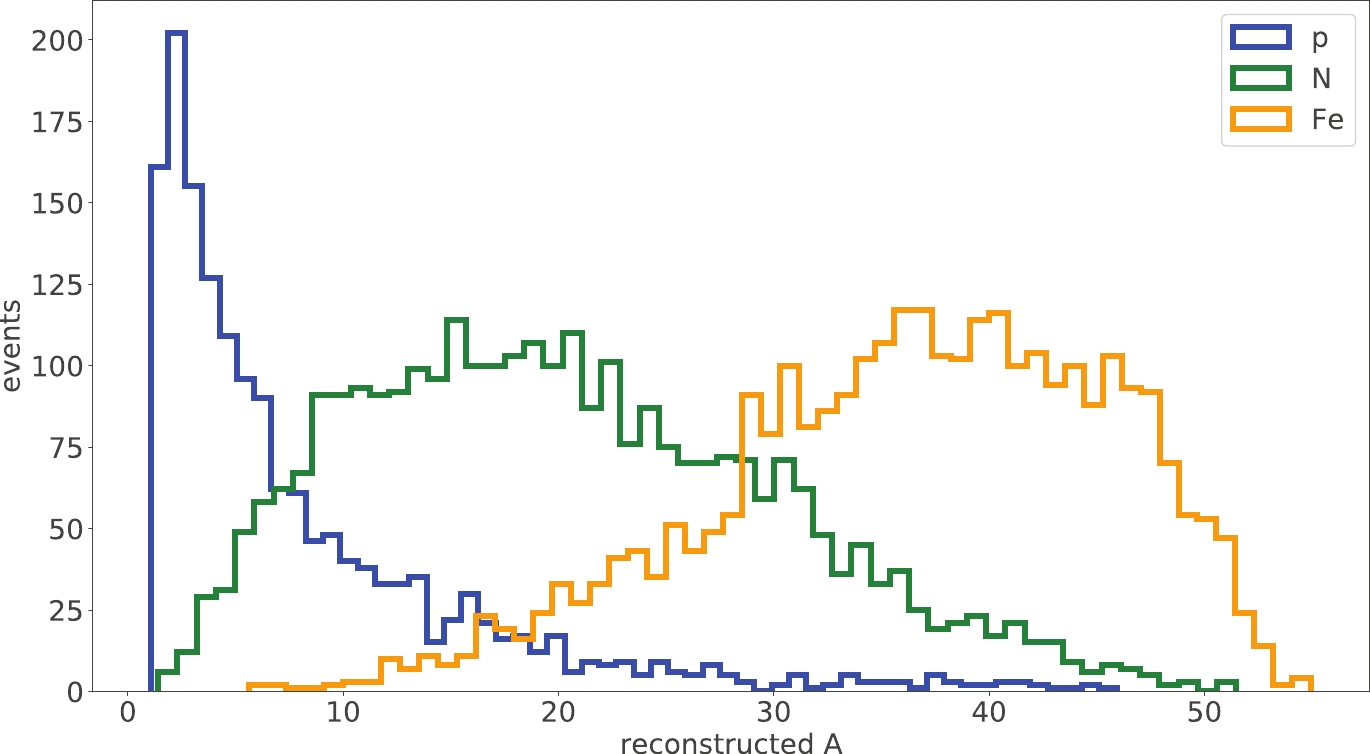
Figure 51. (color online) Distribution of reconstructed masses for primary protons, nitrogen and iron nuclei with energies above 1 PeV.
After achieving good results, ENDA will be extended up to 400 detectors with array area of 10000 m2 (Fig. 46 right) to study energy spectrum and mass composition at the energy region of 1017 eV in conjunction with LHAASO.
-
In LHAASO, cosmic ray arrival direction is reconstructed using the secondary particles in the air shower front by measuring their arrival time difference among KM2A. To guarantee the angular resolution of reconstruction, a 500 ps RMS overall synchronization precision must be achieved among the thousands of wildly spread detectors.
Due to the large quantity of detector nodes, a combined timing and data link could be more cost effective than the conventional solution of using dedicated clock link and data link, which also greatly simplifies the cable deployments.
Since the most part of the timing network is installed and worked in the unmanned field at very high altitude with simple mechanical housing, strong requirements are also raised for covering wide temperature range, reliability, easy of replacement and prevention from dust.
-
WR (White Rabbit) is a technology originally proposed by CERN and GSI and developed by tens of institutes and universities from all over the world. It aims to provide sub nano-second synchronization accuracy and pico-seconds precision over few thousands nodes in the distance of up to 20 km distance. It is compatible with Ethernet standard 1000Base-Lx with additional enhancements which include:
● Sync-E: With the CDR (clock and data recover) circuit that widely used on high-speed serial communication links, the carrier frequency is transferred between the master and slave that a common frequency can be syntonized among the whole network.
● IEEE 1588 (also known as PTPv2) that can synchronize the time-counter between the master and slave by exchanging IP packets that contain their local time-counter values. The initial offset and the link delay caused by the physical link can be measured and corrected.
● DDMTD (Digital Dual Mixer Time Difference) that measures the phase difference of two frequencies and then improves the time counter values of the PTP from cycle ticks which is normally 8 nano-seconds to sub pico-second. With the PTP protocol, the time difference from master to slave are measured and calculated to pico-seconds precision, the integer cycle tick are easily corrected by adjusting the slave's local count value and the fractional part are further compensated by tuning the phase of a VCXO (voltage controlled oscillator) output.
To avoid the bi-directional delay asymmetry caused by physical link length difference, WR uses single fiber with wave multiplex for upstream and downstream. For certain types of fiber, the speed difference of two wavelengths can be calibrated.
WR has the advantage of using one single fiber for both Ethernet data transmission up to 1Gbps and sub-ns synchronization, that makes it an ideal solution for LHAASO timing system. The scalability, long distance features are also of importance.
-
The LHAASO timing system will be running in a very wide temperature range and in particular large day-night temperature variation that could lead to the electronics delay variation and deteriorate the synchronization. The temperature effect is much more obvious and important for cosmic detection experiment such as LHAASO than the originally proposed WR deployment location inside the underground tunnels such as CERN and GSI.
The temperature effect of WR links comes from two parts: the fixed delay from the electronics component and PCB traces on WR nodes and the asymmetric factor defined by the speed difference of the two optical wavelengths. The influence of temperature to WR synchronization are tested with the setup shown below in Fig. 52.
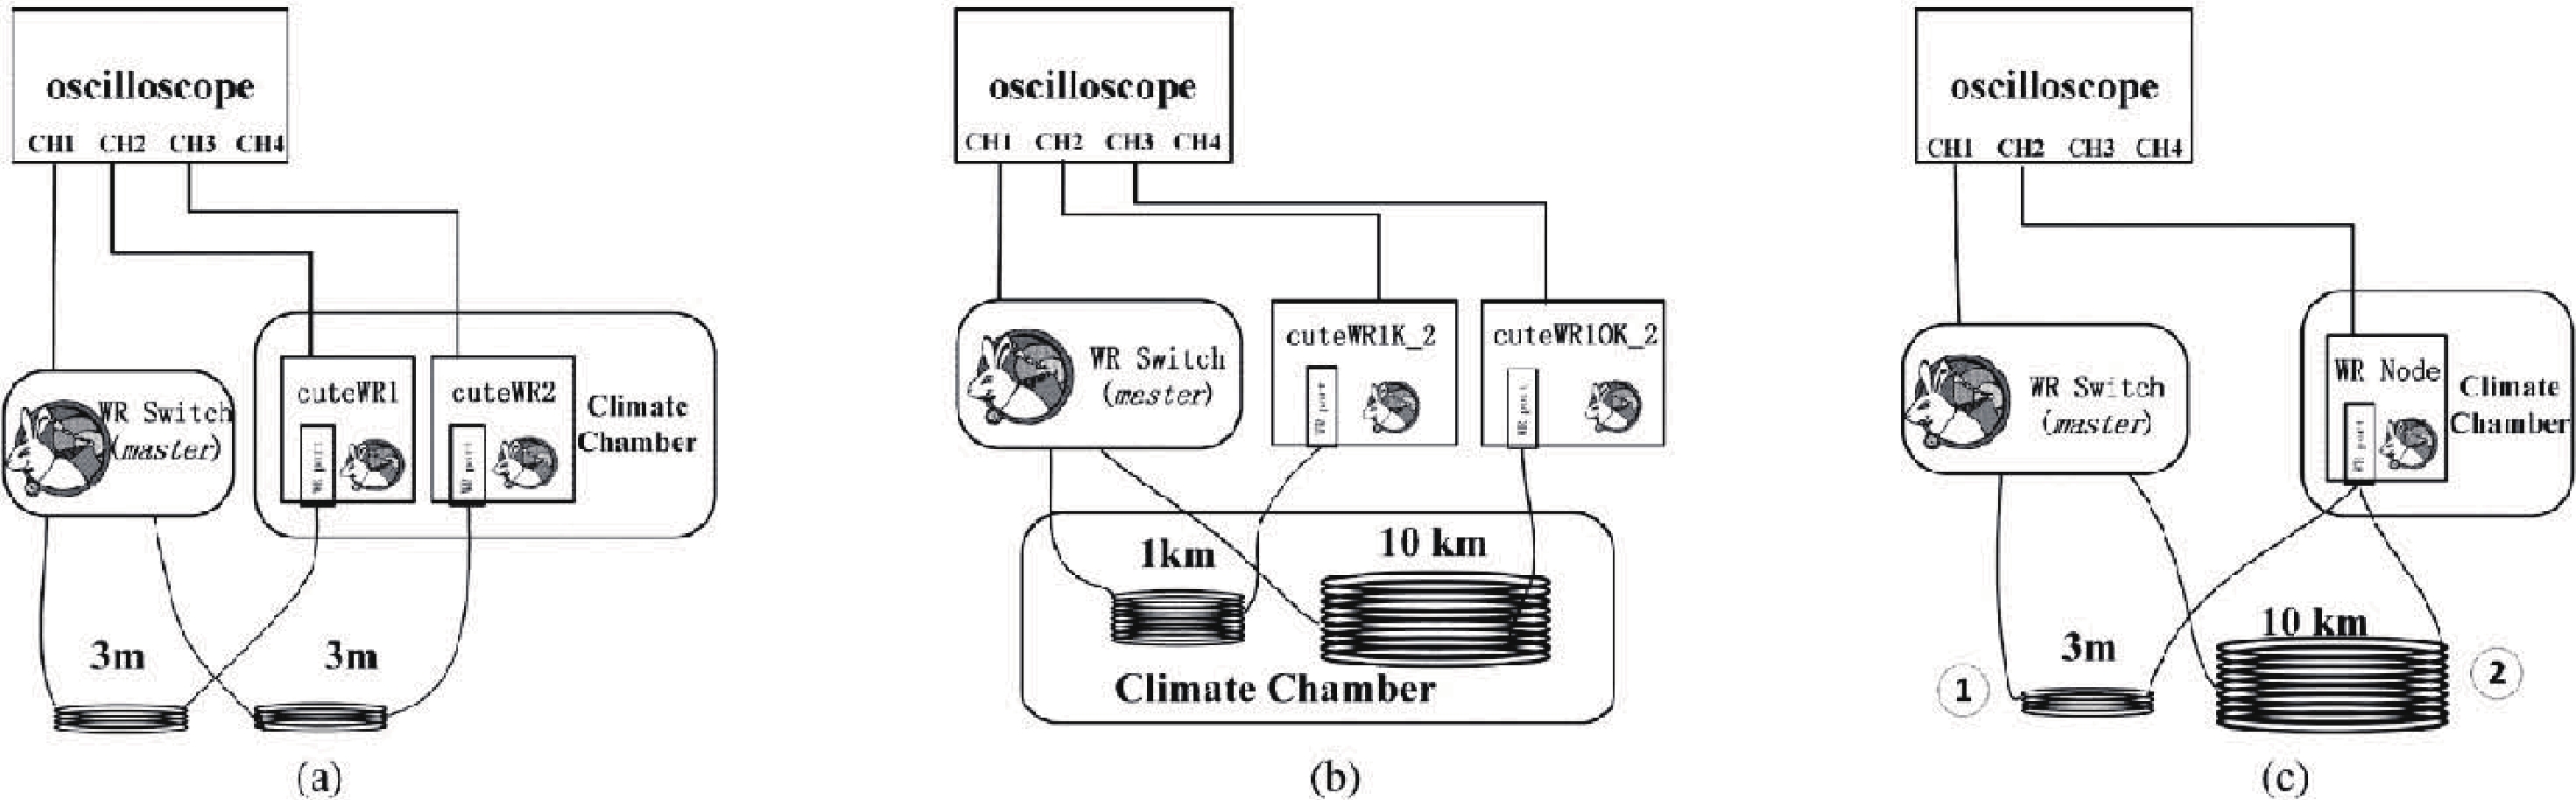
Figure 52. Temperature test of WR devices and links.
WR nodes and fiber boundle are placed in climate chamber while the synchronization performance are monitored by oscilloscope. Test setups (a), (b) and (c) are designed to measure the temperature effect of fixed delay for WR node, the fiber asymmetric factor and the SFP modules respectively.
The results in Fig. 53. show that
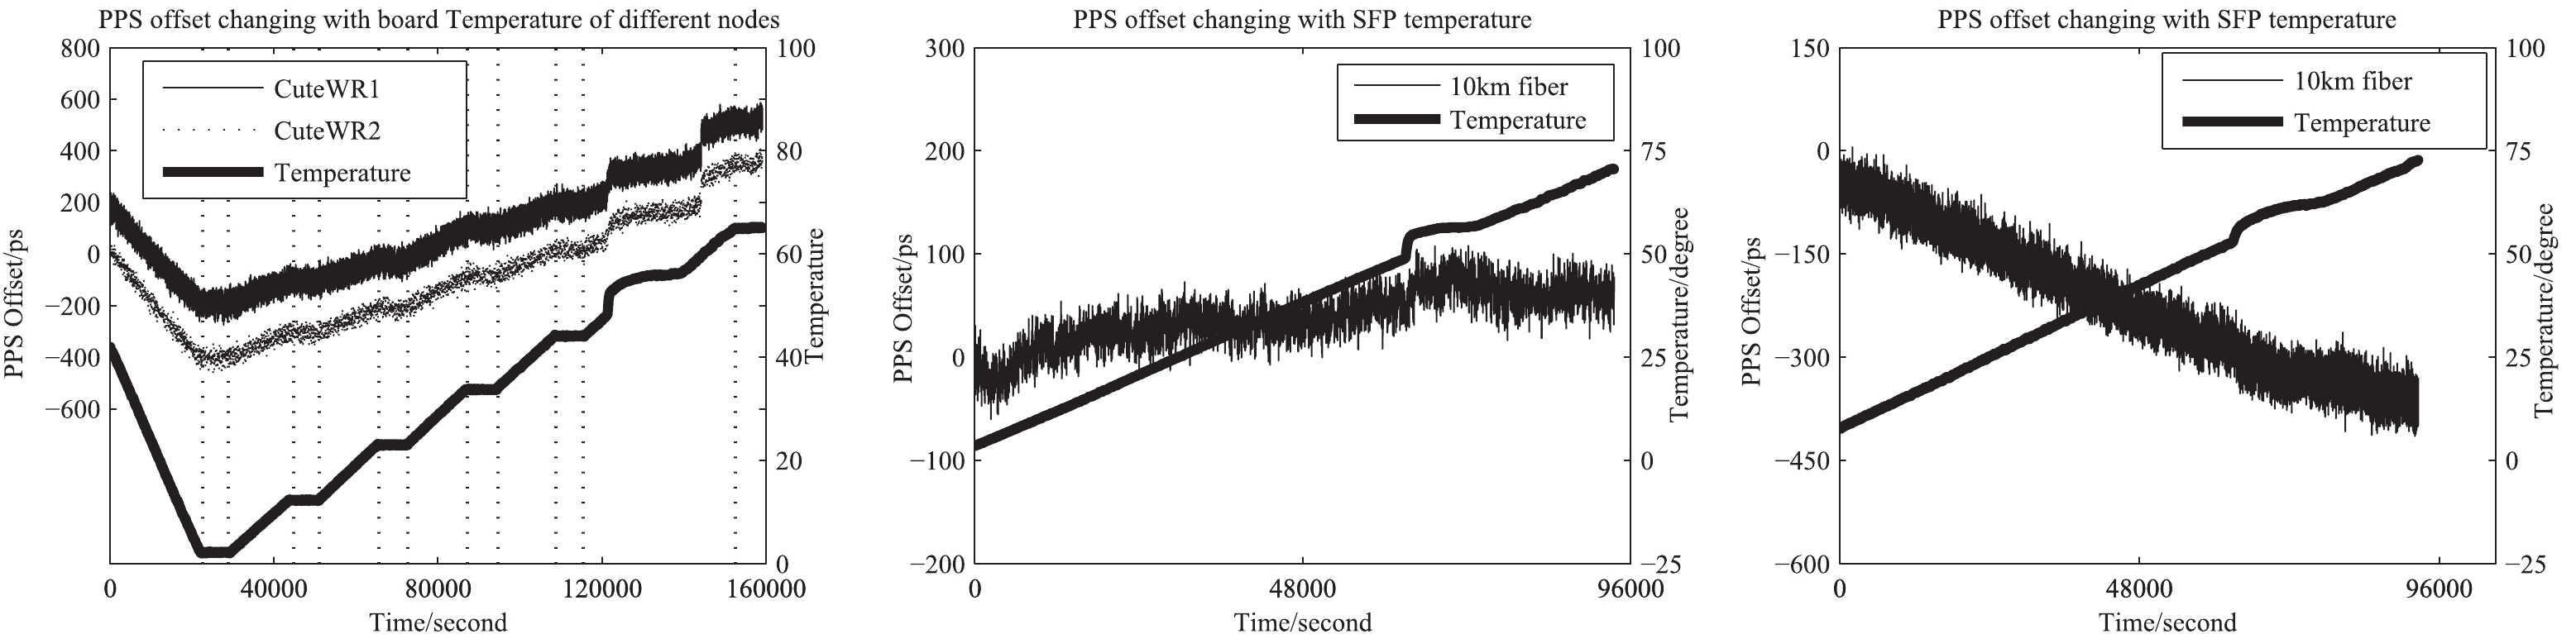
Figure 53. Results of WR Temperature test [37].
a) the node has an obvious temperature effect which is quite linear and can be easily corrected once the temperature is measured;
b) the optical fiber is observed to have a slight dependence of temperature. It is caused by the variation of asymmetric factor that is noticeable only if the fiber is as long as tens of kilometers.
c) the optical wavelength spectrum of the laser used inside the SFP modules shifts slightly with temperature, which is also only noticeable for long fibers.
Since the longest fiber length used in LHAASO is about 500 meters, the contribution from factor b) and c) are negligible. A simple linear temperature correction model is built and applied to the deployed system. The synchronization precision is improved from 700 ps to 120 ps even if the ambient temperature varied over a big range of 65 °C.
-
WR network consists of WR switches and WR nodes. In LHAASO experiment the WR node circuit and functionality is integrated inside the detector electronics.
The WR switch (WRS) is the key component of WR network, that has 18 WR ports to support cascade topology. In the cascaded network, thousands of WR devices can be linked. The WR switch is developed by the WR collaboration and produced by commercial companies. LHAASO will need about 550 WRS, most of them will be installed in electronics huts that are distributed over a field of 1.3 km2 without insulation.
The standard WRS type has few flaws that prevent it from direct deployment in LHAASO:
1) the heat dissipation relies heavily on the two fans on the back panel. The dusty environment of LHAASO reduces the lifetime of fans to only a few months. Without fan, the temperature of key components, especially the FPGA kernel, will increase dramatically and may exceed its allowed range and permanent damage may happen.
2) the management port of the switch is RJ45 form that requires a copper Ethernet cable. Since LHAASO needs 550 WRS distributed in a square kilometer range, a dedicated Ethernet cable network with different level of Ethernet repeater/switch to extend the cable connection distance is very expensive and complicated.
3) the panel connectors are not suitable for dusty environment.
A special type of WRS has been developed for LHAASO which overcomes or improves the standard type accordingly, as shown in Fig. 54.
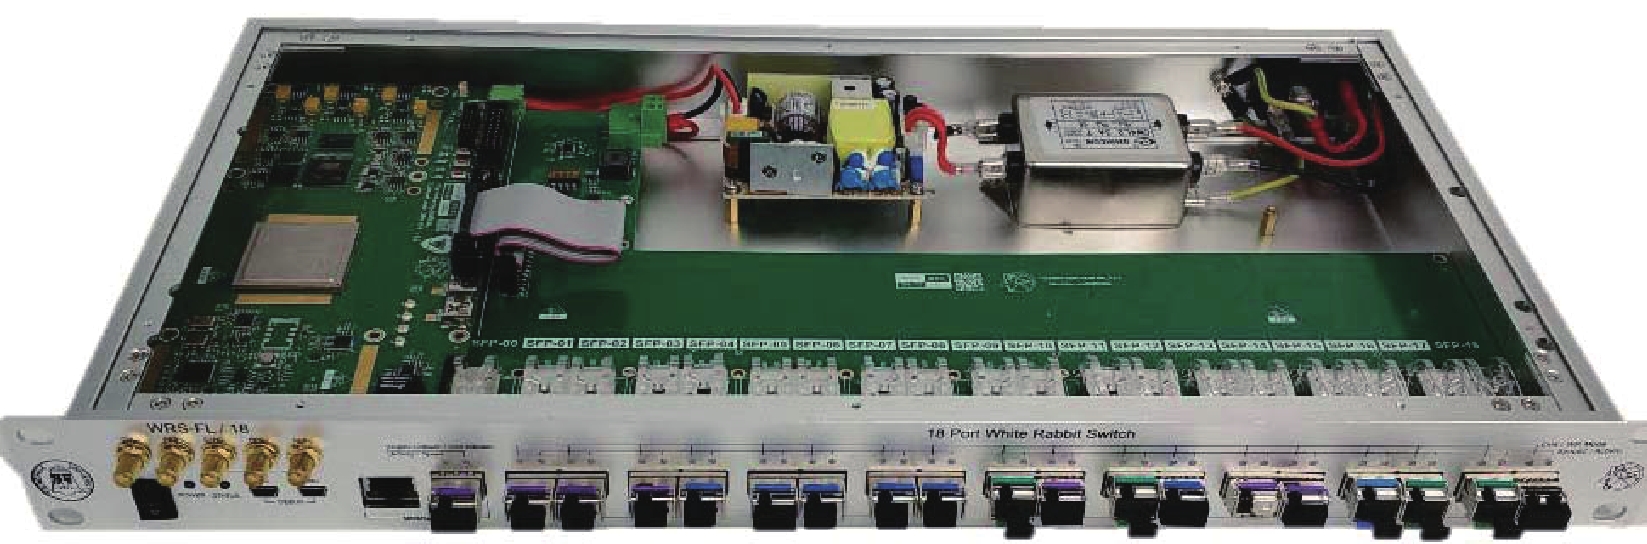
Figure 54. (color online) Fan-less WR switch.
The heat dissipation has been greatly improved: with a CNC customized heat sink that covers the whole PCB attached to the mechanical upper cover via a Thermal conductive rubber gasket, the heat generated from the components are conducted to the heat sink and then to the mechanical box.
A special USB-to-Ethernet converter is used to provide another optical management port besides the existing RJ45 one, thus a single multi-core optical cable can be used for each switch with one dedicated fiber for WR link and one dedicated fiber for WRS management.
Besides, all the electronics components are replaced with industrial grade for wider temp. range, the front panel connectors are replaced with dusty proven types.
The mechanical and installation structure and internal wiring are also optimized, a mass production and QA procedure has been established.
-
About 550 Level-3 PDC (power distribution cabinet) are widely located in the experiment field. Each PDC provides 220V AC power cable and optical fiber to maximum 15 KM2A detector units. One WRS is installed inside each L3 PDC, an optical cable with 4 fibers links the PDC to 1#PDR (power distribution room) where all those 550 WRS are further gathered and managed. To arrange the large amount of ingress optical cables, a dedicated ODF (optical distribution frame) rack provides optical inter-connect patch panels that separate the external optical cable and internal fibers. The devices in the 1#PDR includes 38 L2 and L1 WRS, GPS, Rubidum, WRS management switches, management server and few auxiliary switches, which are organized in 5 racks. The inter-connections among those racks are shown in Fig. 55.

Figure 55. (color online) Connections among the racks in 1#PDR.
The WRS installed in the L3 PDC and the racks in the 1#PDR are shown respectively in Fig. 56.

Figure 56. (color online) WRS installation in 1#PDR.
-
The data acquisition system (DAQ) resides between electronics system and off-line analysis system. It is mainly a software system running on computing nodes, responsible for data collection from electronics, software trigger, and event storage. KM2A and WCDA do not have event trigger at the on-line electronics level, and by Front-End Electronics(FEE) signals are digitalized and packed as "hit packet" sent to DAQ. Each telescope of WFCTA has a hardware trigger built in each camera so that data are packed as event sent to DAQ. All Electronics systems communicate with DAQ through a fiber network. Part of the network also used to synchronize all far end nodes attached to the detectors by running White Rabbit Protocol over the entire network.
-
In LHAASO the readout electronics and the DAQ system are connected by a standard Gigabit Ethernet system based on White Rabbit switches, communicating with TCP/IP protocol. The Ethernet system can buffer more than 10 seconds of data. The DAQ system is required to collect all these data from readout electronics, perform software trigger and store events to disks. The data readout rate of LHAASO is 5 GB/s, and the data storage rate is 300 MB/s.
The hardware architecture of DAQ system is shown in Fig. 57. DAQ switches are deployed to the power distribution room located at the center of KM2A array and near WCDA. The Ethernet system connects to these DAQ switches through 1 Gbps electrical link. 10 Gbps fibre optical links are deployed between all DAQ switches.
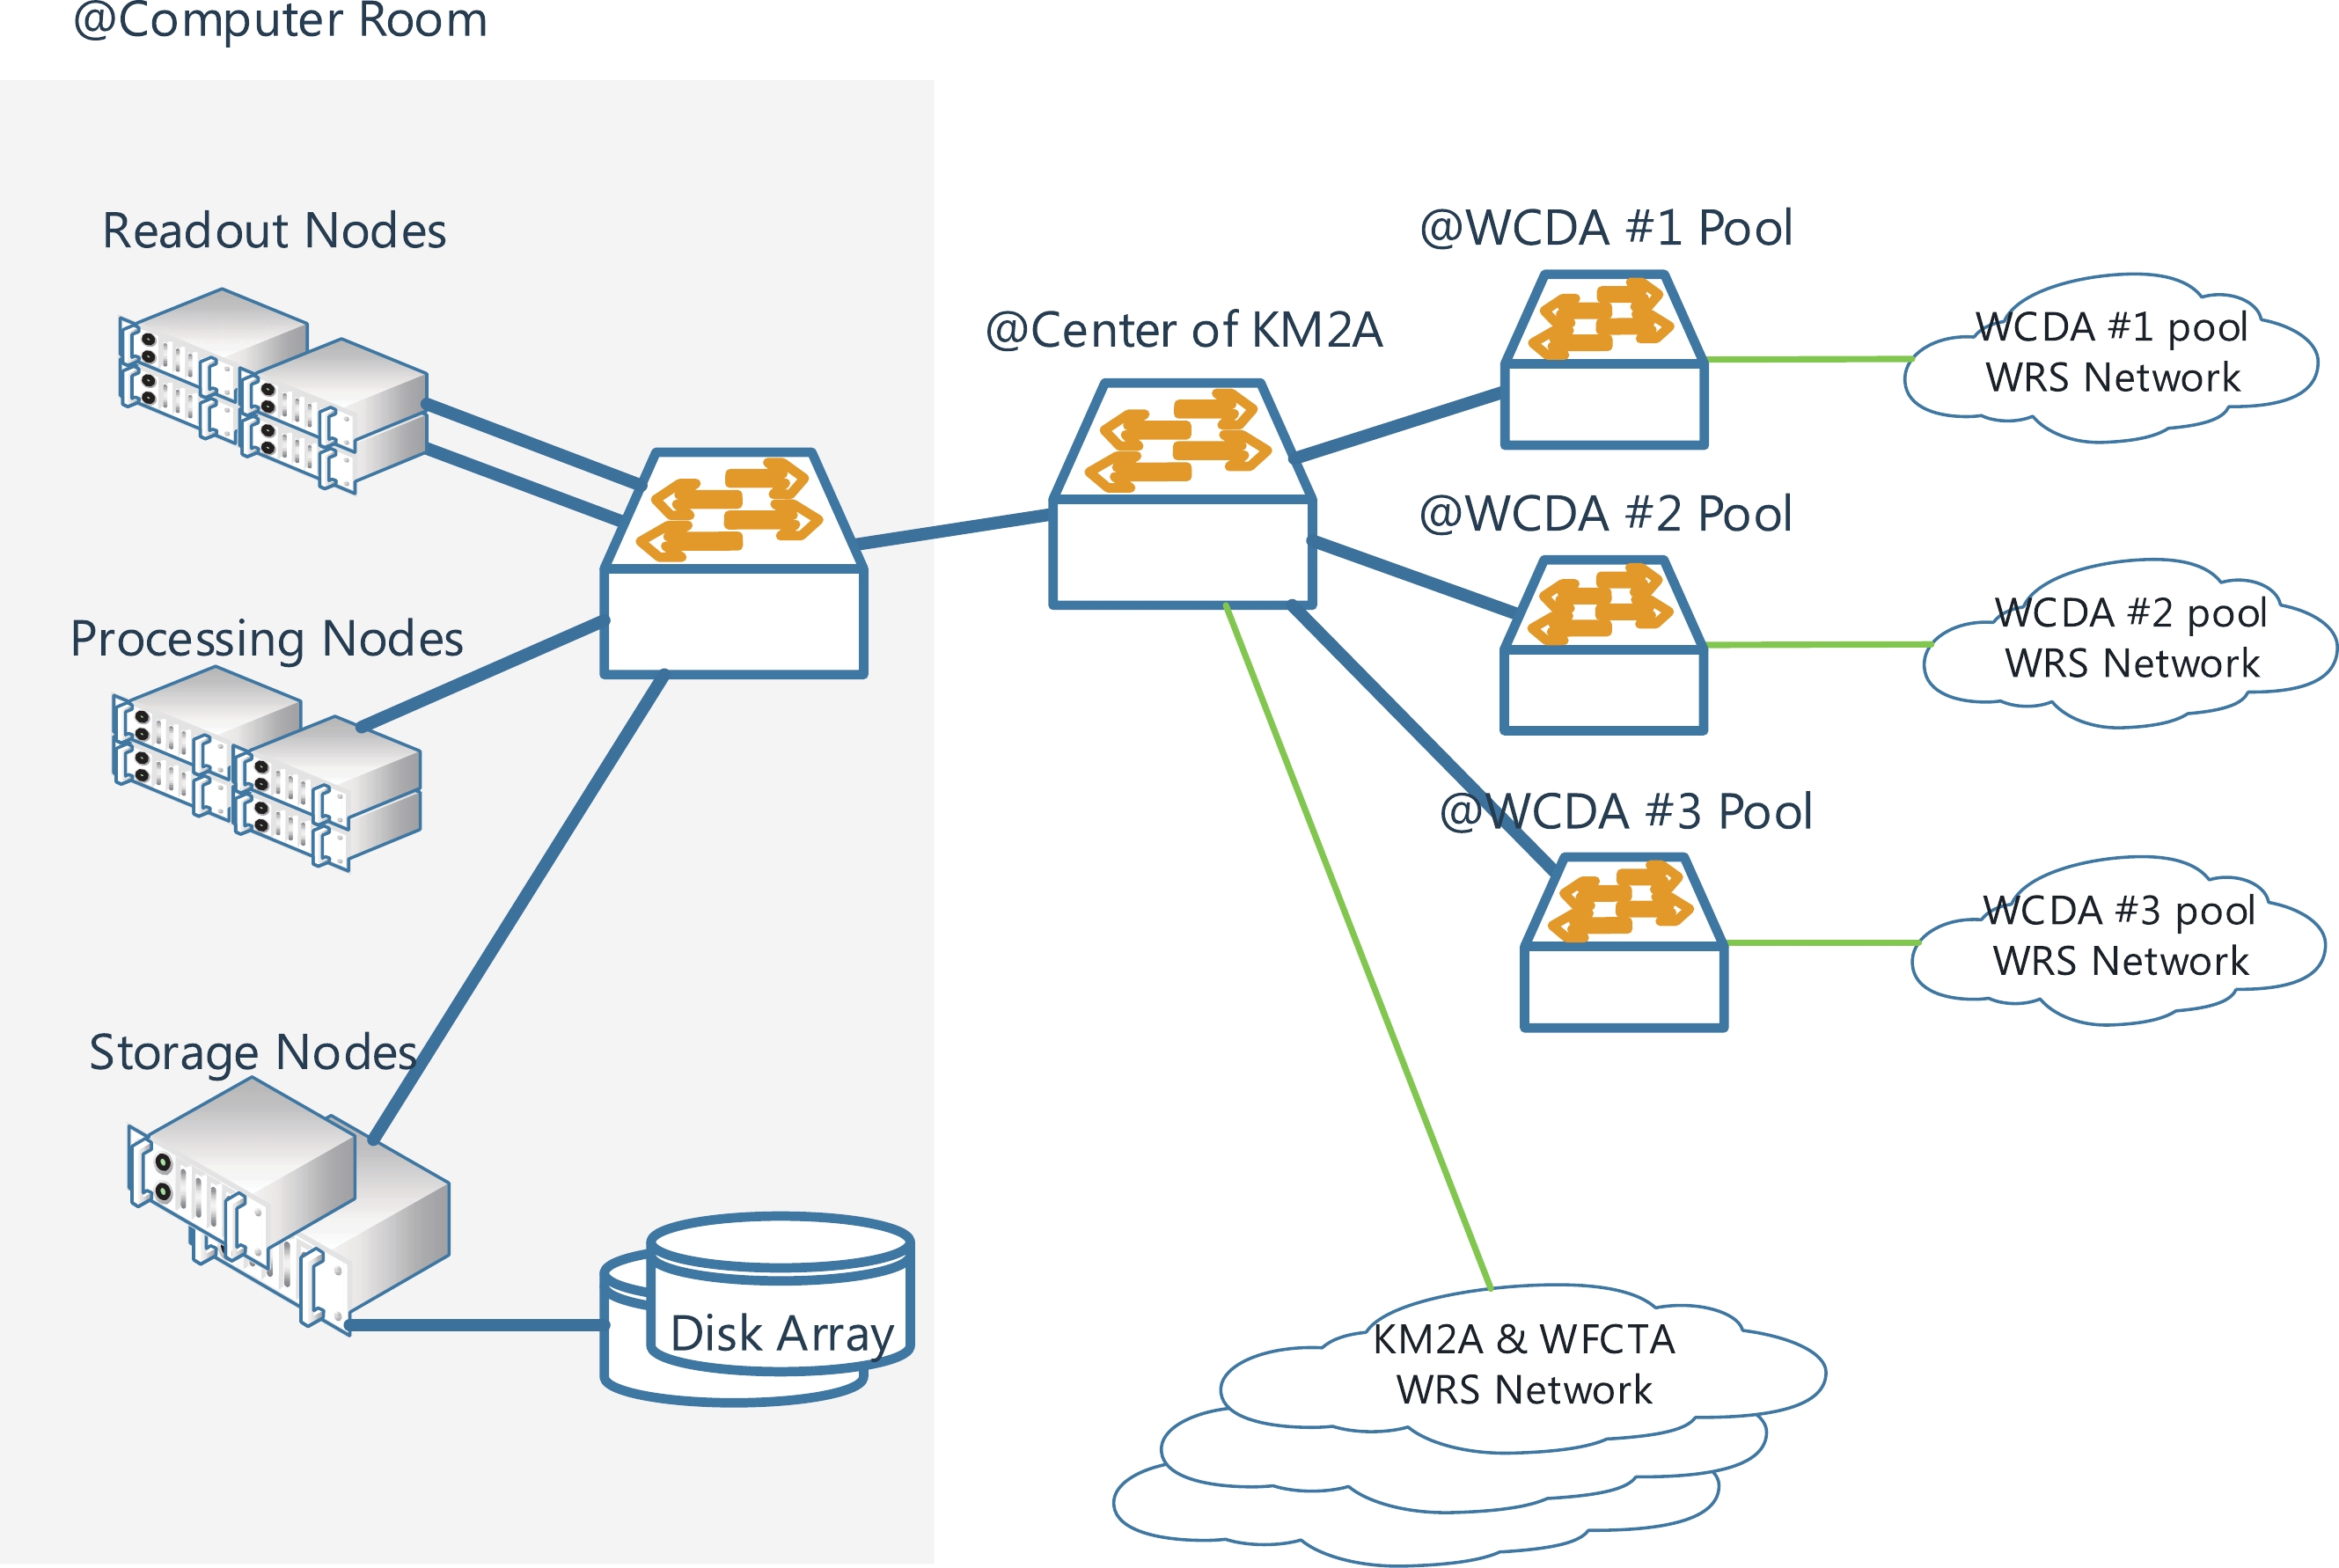
Figure 57. (color online) DAQ system hardware.
Readout nodes are used to collect and buffer data from electronics. CPUs on both readout and compute nodes can be assigned to perform online processing tasks including software trigger. More than 1760 CPU cores will be assigned for the purpose of online data processing.
Disk arrays are used for online storage. The capacity of online storage system will be 200 TB, that can buffer event data for more than a week before transferring to Beijing.
The DAQ software of LHAASO can be divided into two layers as shown in Fig. 58: online framework and data flow applications. The online framework is concerned with the common functions of a distributed DAQ software such as run control, process management and information sharing. The data flow applications are responsible for all the processing of physics data, receiving and transporting the data to storage.
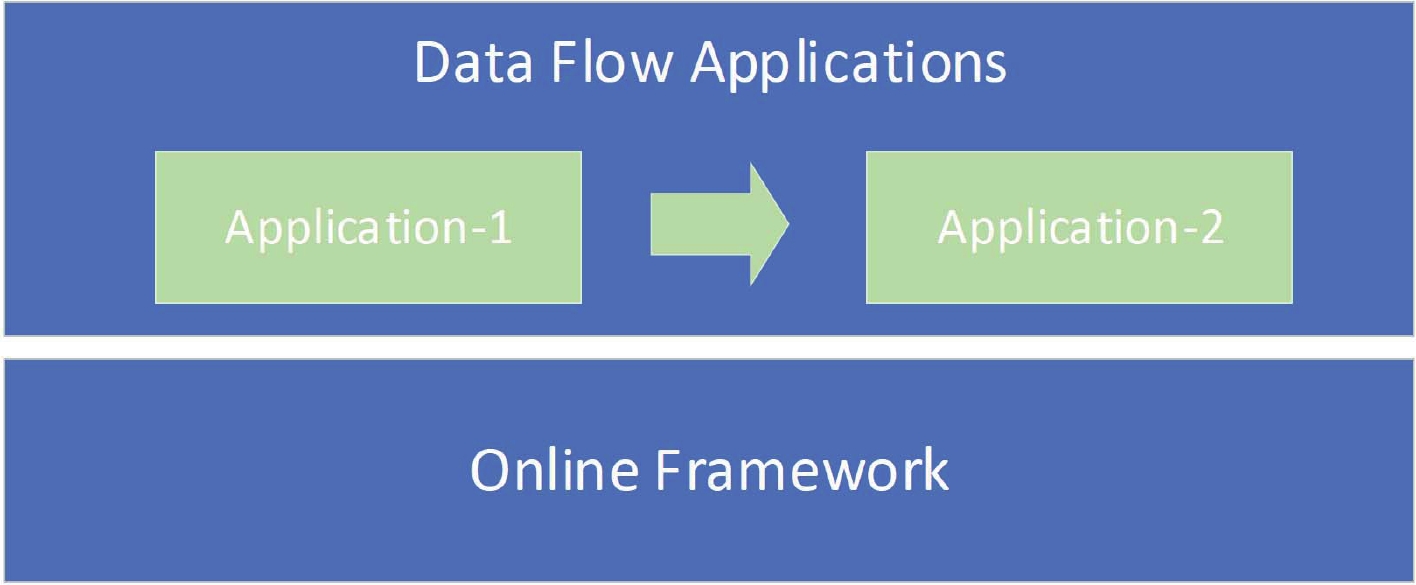
Figure 58. (color online) Architecture of DAQ software.
● Online Framework
The online framework consists of services, interfaces and some scripts. The services (written in Python) running in the background is responsible for starting and stopping the data flow application processes, supervising status of applications and synchronizing some of the run parameters to a persistent database. The interfaces (written in C++) are compiled as libraries providing common functions such as information publishing and subscribing, configuration files accessing and so on.
Design of the online framework is mainly based on Redis, which is an in-memory database and can also be used as a message broker. Current status and parameters of DAQ system are all stored in Redis.
● Data Flow Applications
A message passing interface is implemented based on ZeroMQ library, used for the transmission of both control messages and data fragments between data flow applications. Based on the online framework and message passing interface, mainly five kinds of data flow applications are implemented, shown in Fig. 59.

Figure 59. (color online) Data flow applications of DAQ software.
With the global timing system, every data fragment from electronics is tagged by a time stamp with the precision of less than one nanosecond. To implement software trigger, data from all electronics of some detector array within a specific period of time need to be packed together as a data fragment, which is called a Full Timed Fragment (FTF). The FTF is fed as input for the trigger algorithm.
A readout application receives the stream of data from the electronics and packs them as Subsystem Timed Fragments (STFs). Then, under the coordination of the Data Flow Manager (DFM) application, each Builder can collect all STFs of readout applications and form a FTF. FTFs are transferred to Processors, where software trigger algorithm is performed. The DFM application is responsible for the load balance of Processors. After trigger, events are transferred to Event Store (ES) application for storage.
-
Design of the trigger system aims to remove amount of background and select real events which meet requirements of scientific motivations of LHAASO. All arrays of LHAASO have the following common characteristics:
● One detector transforms light signal into electronic pulse signal via photosensitive device (PMT or SiPM) so that type of signal is unitary and convenient to process.
● Each detector has level 0 (L0) trigger, that is, if the signal of one PMT is greater than a threshold, a hit is generated.
● By use of the clock synchronization network with the White Rabbit protocol, each detector or cluster records arrival time of one hit or one event with hardware trigger level 1 (L1) and transfers data by use of fibers.
The LHAASO trigger framework is presented in Fig. 60. LHAASO events are recorded in three modes: trigger mode (TM), low multiplicity mode (LM) and single particle mode (SM). About TM, KM2A and WCDA take method of "triggerless" front end digitization, that is, the electronics system does not include common hardware trigger system, but each front end electronics (FEE) generates L0 with independent threshold and uses the clock synchronization network to record L0 time. Charge and time information of hits is packed and transferred to the data acquisition system where the higher level triggers (L1 and L2) are performed and finally the selected events are stored into the data files. WFCTA and ENDA are separated into clusters and each cluster has arrival time of L1 recorded by the clock synchronization network. At the data acquisition system, L2 are performed and finally the selected events are stored into the data files. The modes are described in detail as follows:
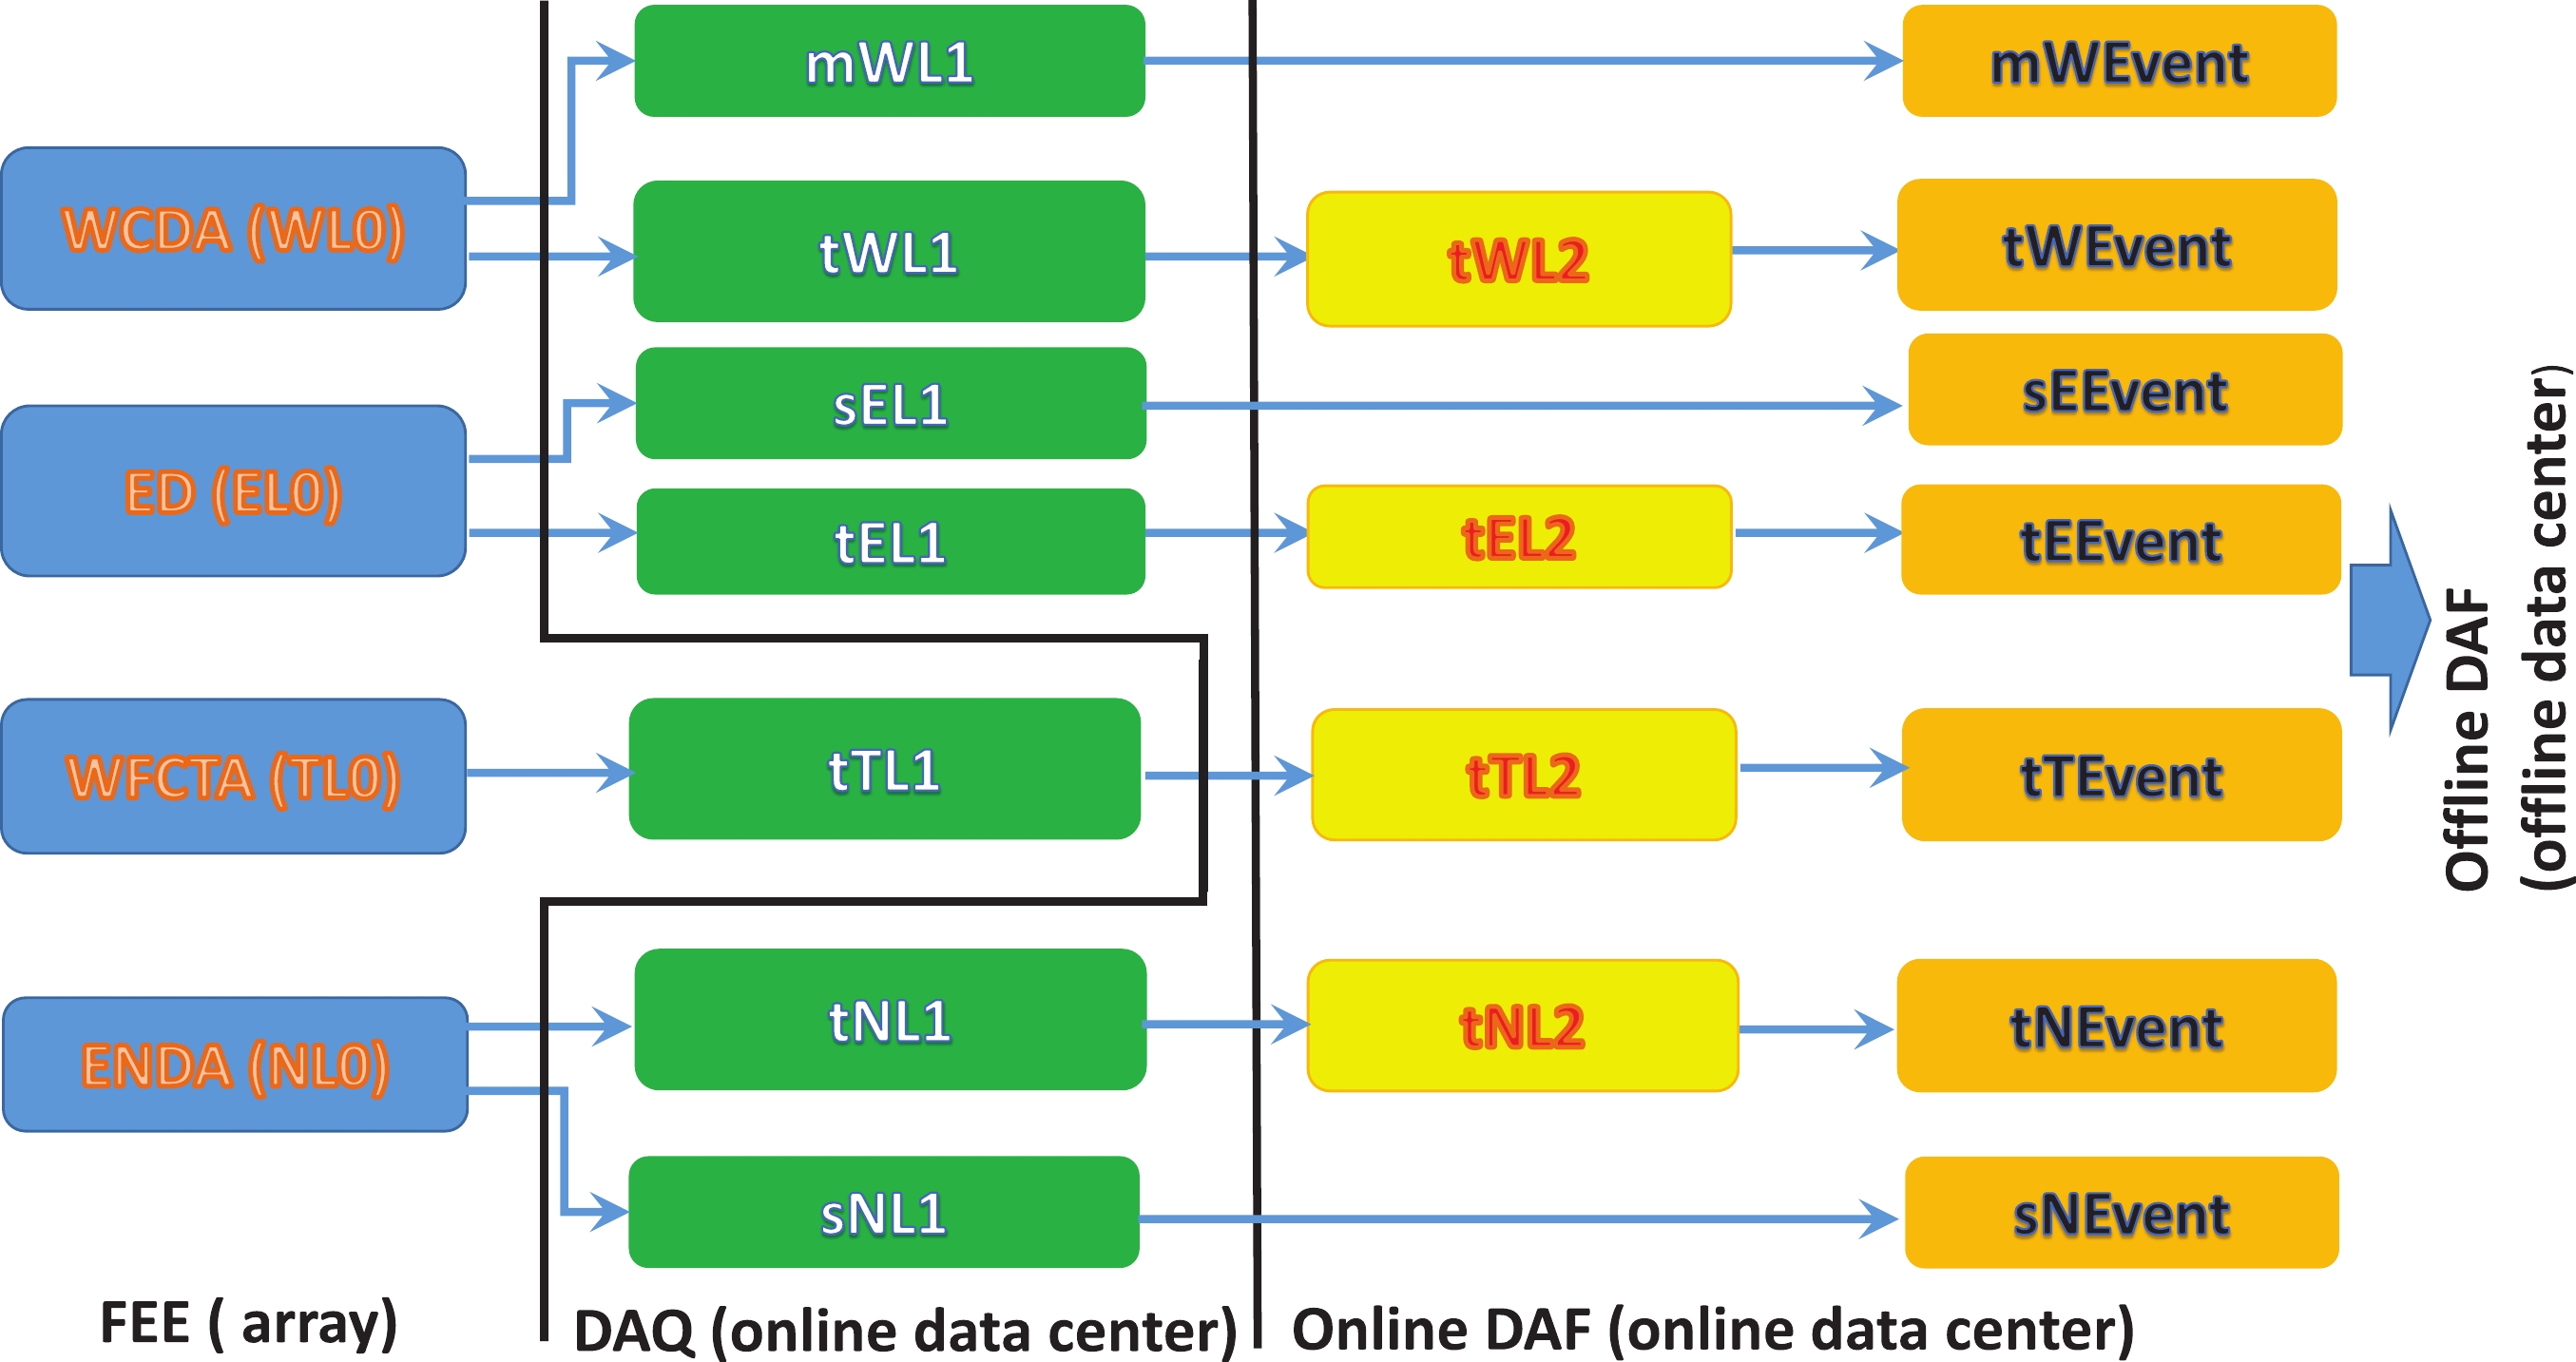
Figure 60. (color online) LHAASO trigger framework.
1. WCDA-TM [38]:
WL0: PMT outputs a steady signal with a normalized amplitude lasting for 250 ns.
tWL1: All the PMT signals in every trigger cluster are counted and summed in the falling edge of a pipeline clock of 25 ns. In any trigger cluster number of fired detectors
$ \ge 11 $ in a time window of 2,000 ns around the trigger time are stored into the event.tWL2: Pre-reconstruction method with fast searching algorithm are performed to remove noise. Once the trigger formed, all hits of WCDA++ and KM2A in a coincidence time window are collected together with the trigger time and the event so called "tWEvent" is recorded into the data file.
2. WCDA-LM:
mWL1: Using GRB alert from the Gamma-ray Coordinates Network (GCN) system as a trigger, WCDA makes a follow-up searching for the GRB signals. When a GCN alert arrives, the DAQ system should collect all raw data of WCDA electronics around the alerting time point. The time window of this GRB data is about one to two hours and can be configured. Using the GRB location as their arrival direction, shower events are reconstructed. The method can be used to reduce noise for low multiplicity events to improve significance of the GRB signals. Corresponding event rate as "mWEvent" is recorded into the data file.
3. KM2A-TM [39]:
EL0: Signal of one PMT generates a single channel trigger if it is greater than threshold.
tEL1: In trigger time window 300 ns, any
$ \ge 6 $ ED are fired. The hits in sampling time window 10 μs are recorded.tEL2: A narrowed time window and space window in the vicinity of the shower front are taken into account to reduce background.
Once the trigger formed, all hits of MD, WCDA and WCDA++ are collected and the event so called "tEEvent" is recorded into the data file.
4. KM2A-SM:
sEL1: each ED records count rate for thunderstorm study. Event rate as "sEEvent" is recorded into the data file.
5. WFCTA-TM [40]:
TL0: Signal of one SiPM generates a single channel trigger if it is greater than threshold. It is calculated in FPGA on DBs using signal-to-noise ratio (SNR) algorithm.
tTL1: The telescope trigger in BDB is generated as pattern is recognized. The single channel trigger A pattern recognition technique is used in the second level trigger. Round patterns (e.g., one pixel surrounded by others) are for Cherenkov events and line patterns (e.g., a straight line formed by 4 aligned pixels) are for the fluorescence.
tTL2: The event trigger in the entire array of telescopes are selected. One of the telescopes can trigger the neighbor telescopes. The adjacent telescopes trigger each other through off-line matching which raises the threshold slightly higher.
Once the trigger formed, all hits of WCDA, WCDA++, KM2A and ENDA are selected and the event so called "tTEvent" is recorded into the data file.
6. ENDA-TM [34]:
NL0: Signal of one PMT generates a single channel trigger if it is greater than threshold.
tNL1: Any 1 out of 16 detectors in one cluster starts FADCs.
tNL2: Three flags for event classification:
(1) M1, in a trigger time window of 1 μs, if at least 2 detectors generating the first level trigger;
(2) M2, if the delivered total charge corresponds to more than 250 particles;
(3) M3, if the total number of recorded neutrons is higher than or equal to 3.
During offline data analysis, the coincident events with the other detectors are searched for and the event so called "tNEvent" is recorded into the data file.
7. ENDA-SM:
sNL1: each detector records neutrons count rate and charged particle count rate per 1 minute as "sNEvent".
In brief, the different trigger modes include different contributions from the arrays, and collect different measurement variables from the arrays (Table 7). It leads that the different trigger modes have very different event rates and data rates (Table 8). Consequently, one physical motivation may be correlated with several event types, or one event type may contribute to several physical motivations (Fig. 61). Moreover, the trigger modes on the basis of software control in DAQ are so flexible that, if any new physical motivation is proposed, the present trigger modes can be adjusted conveniently, and even a new trigger mode can be supplemented into the online software.
WC-DA WCD-A++ ED MD WFC-TA EN-DA mWL1 × tWL2 × ○ ○ ○ sEL1 × tEL2 ○ ○ × ○ tTL2 ○ ○ ○ ○ × ○ tNL2 ○ ○ ○ ○ ○ × sNL1 × Table 7. LHAASO trigger table. Cross: the detectors take the trigger and the hits of the detectors are read out. Circle: Only the hits of the detectors are read out under the trigger.
count rate of one detector (kHz) data rate after trigger (MB/s) WCDA 63 430 (L1) 50 (L2) KM2A 1.5 10 (L1) WFCTA < 0.2 15 (L1) ENDA ~1 × 10⁻³ < 1(L1) Table 8. LHAASO trigger event rate and data rate.
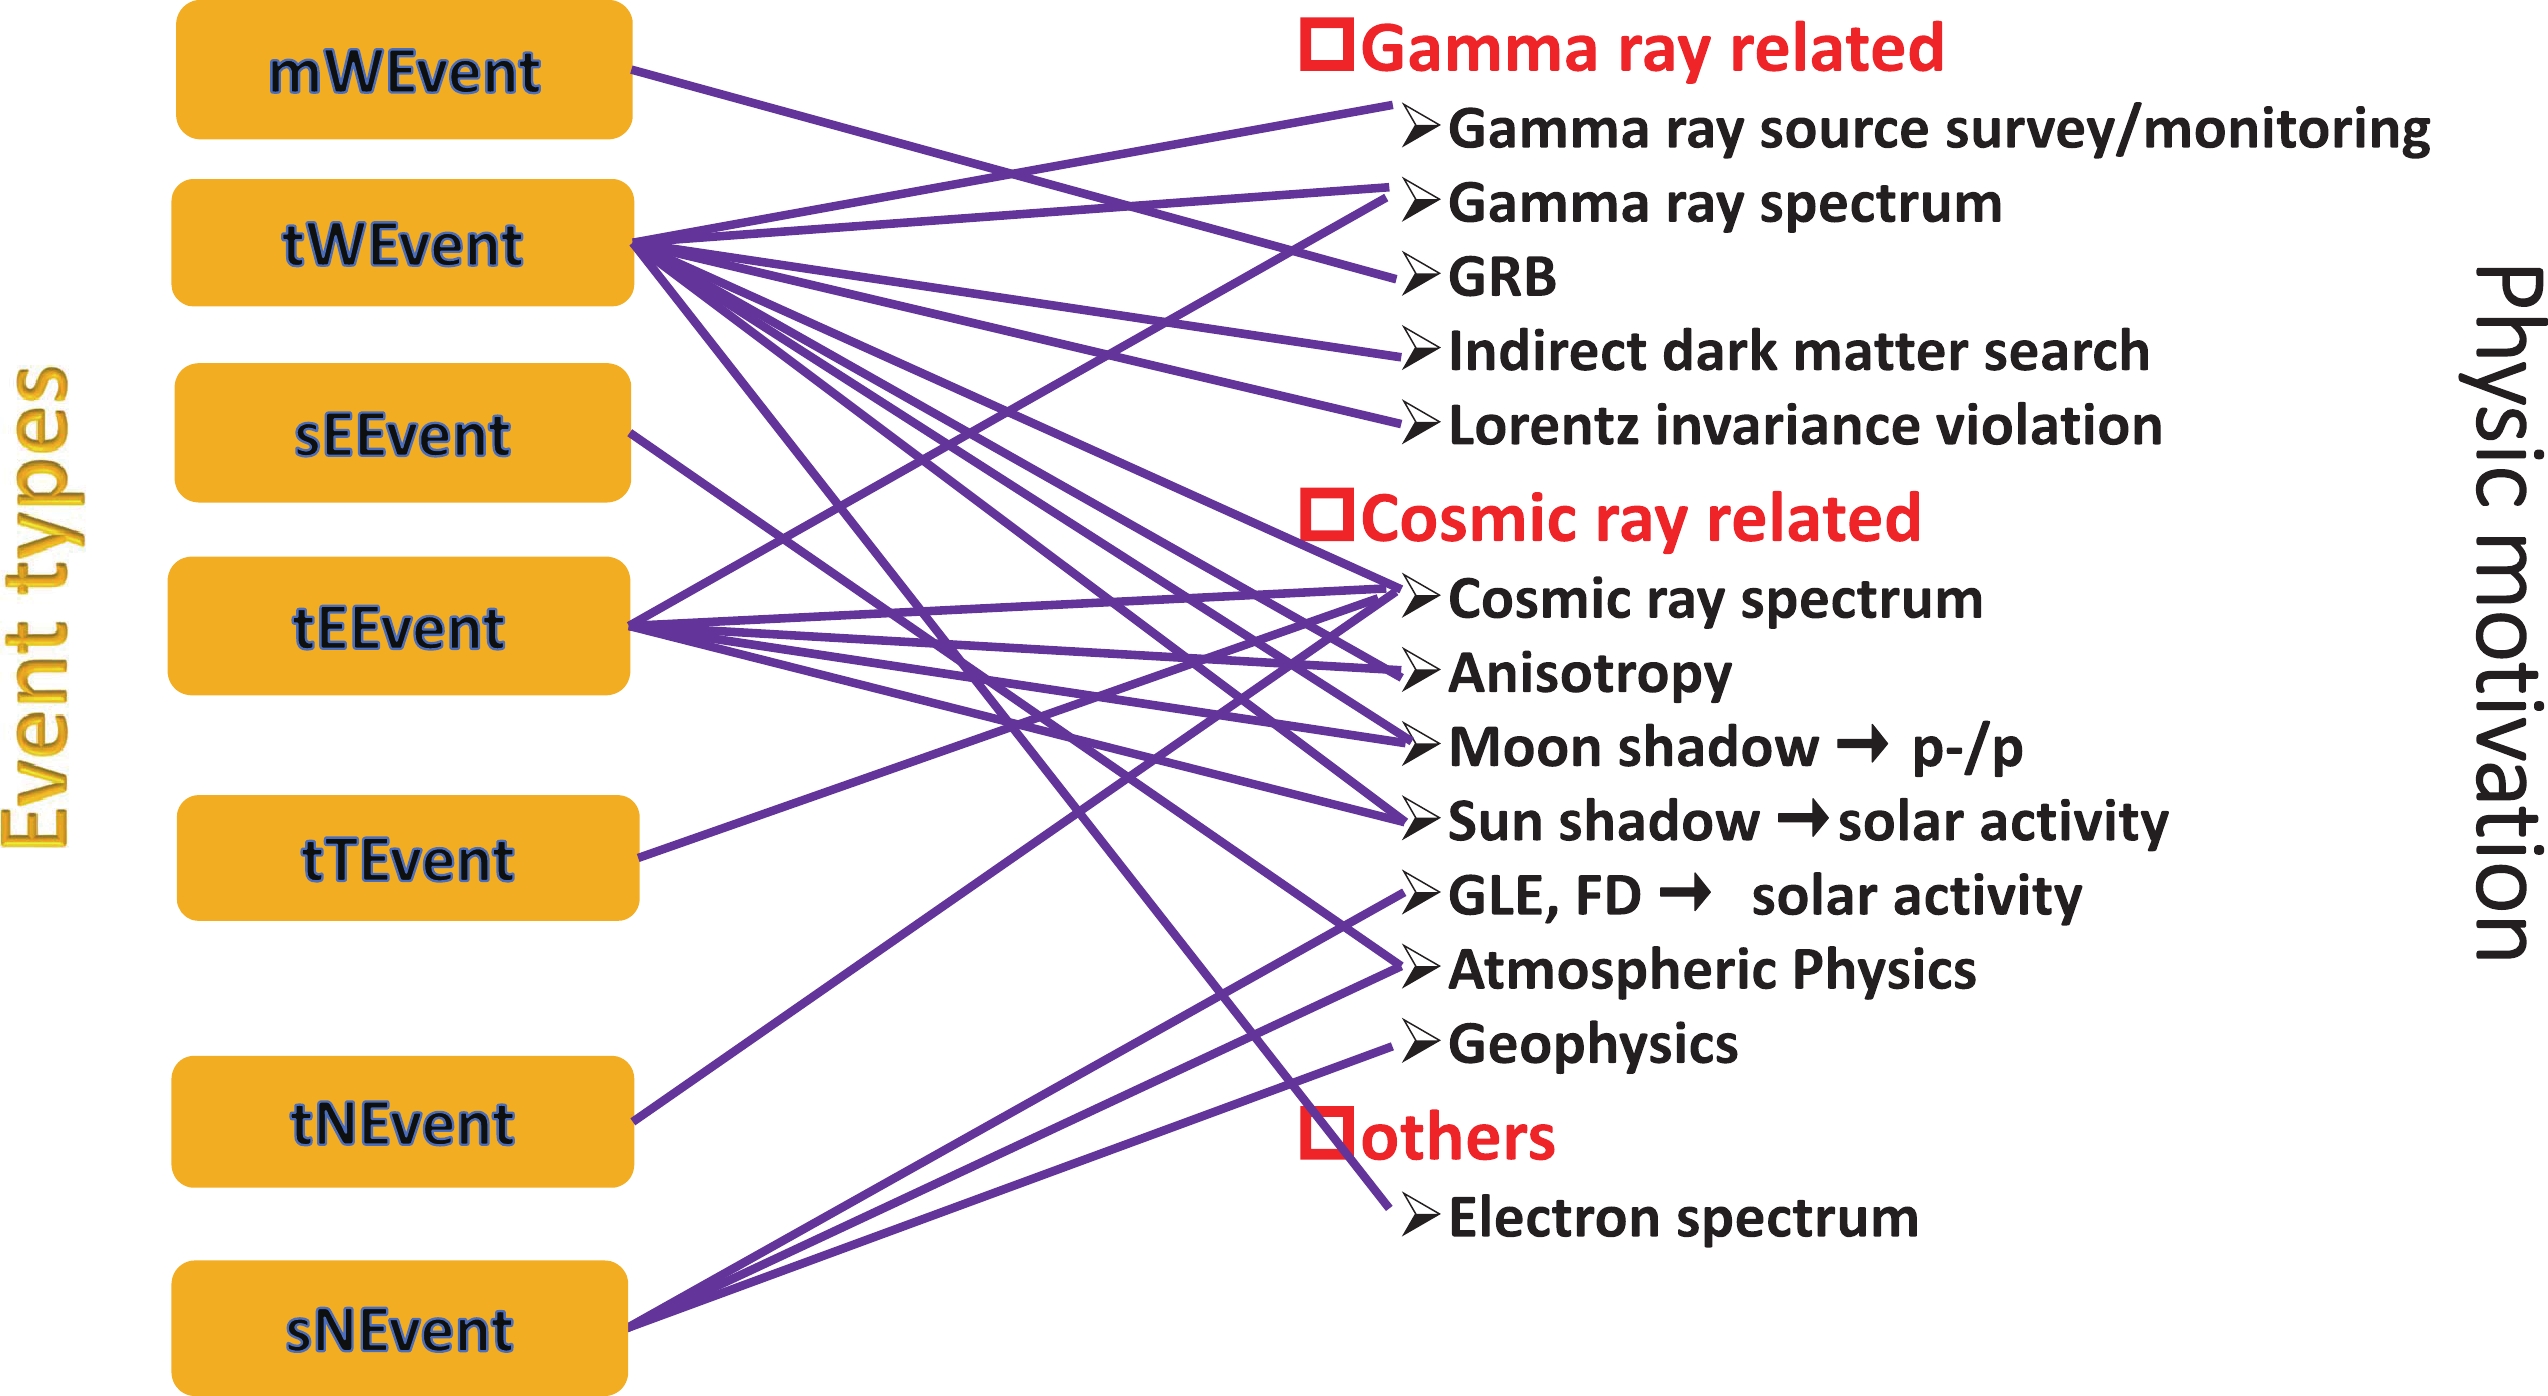
Figure 61. (color online) LHAASO event types and physical motivation.
-
LHAASO Offline Data Processing Software Framework (LodeStar) is developed for the LHAASO offline data processing, including Monte Carlo (MC) data production, experimental data processing as well as physics analysis.The typical data processing is to loop over all events with some calculations applied on the event data. The usual procedure for one event during event looping can be divided into three steps: read in an event, process the event, and write out the results. LodeStar consists of an underlying framework and experiment specific applications such as event generator, detector simulation, electronics simulation, calibration, reconstruction and physics analysis tools.
The framework plays very important roles for the performance and functionalities of LodeStar. It provides most of the common functionalities for the offline data processing, such as data management, data processing controlling, data input/output, common services and tools, as well as friendly user interfaces. The framework also builds the unified software environments and computing platform for the developers, and defines the standard interfaces between different applications. Therefore many developers can synchronously develop their data processing applications. All applications developed with standard interfaces can be smoothly plugged into the framework.
-
The architecture of LodeStar is shown in Fig. 62. LodeStar consists of three projects: External Interface (EI), SNiPER [41] and Offline.
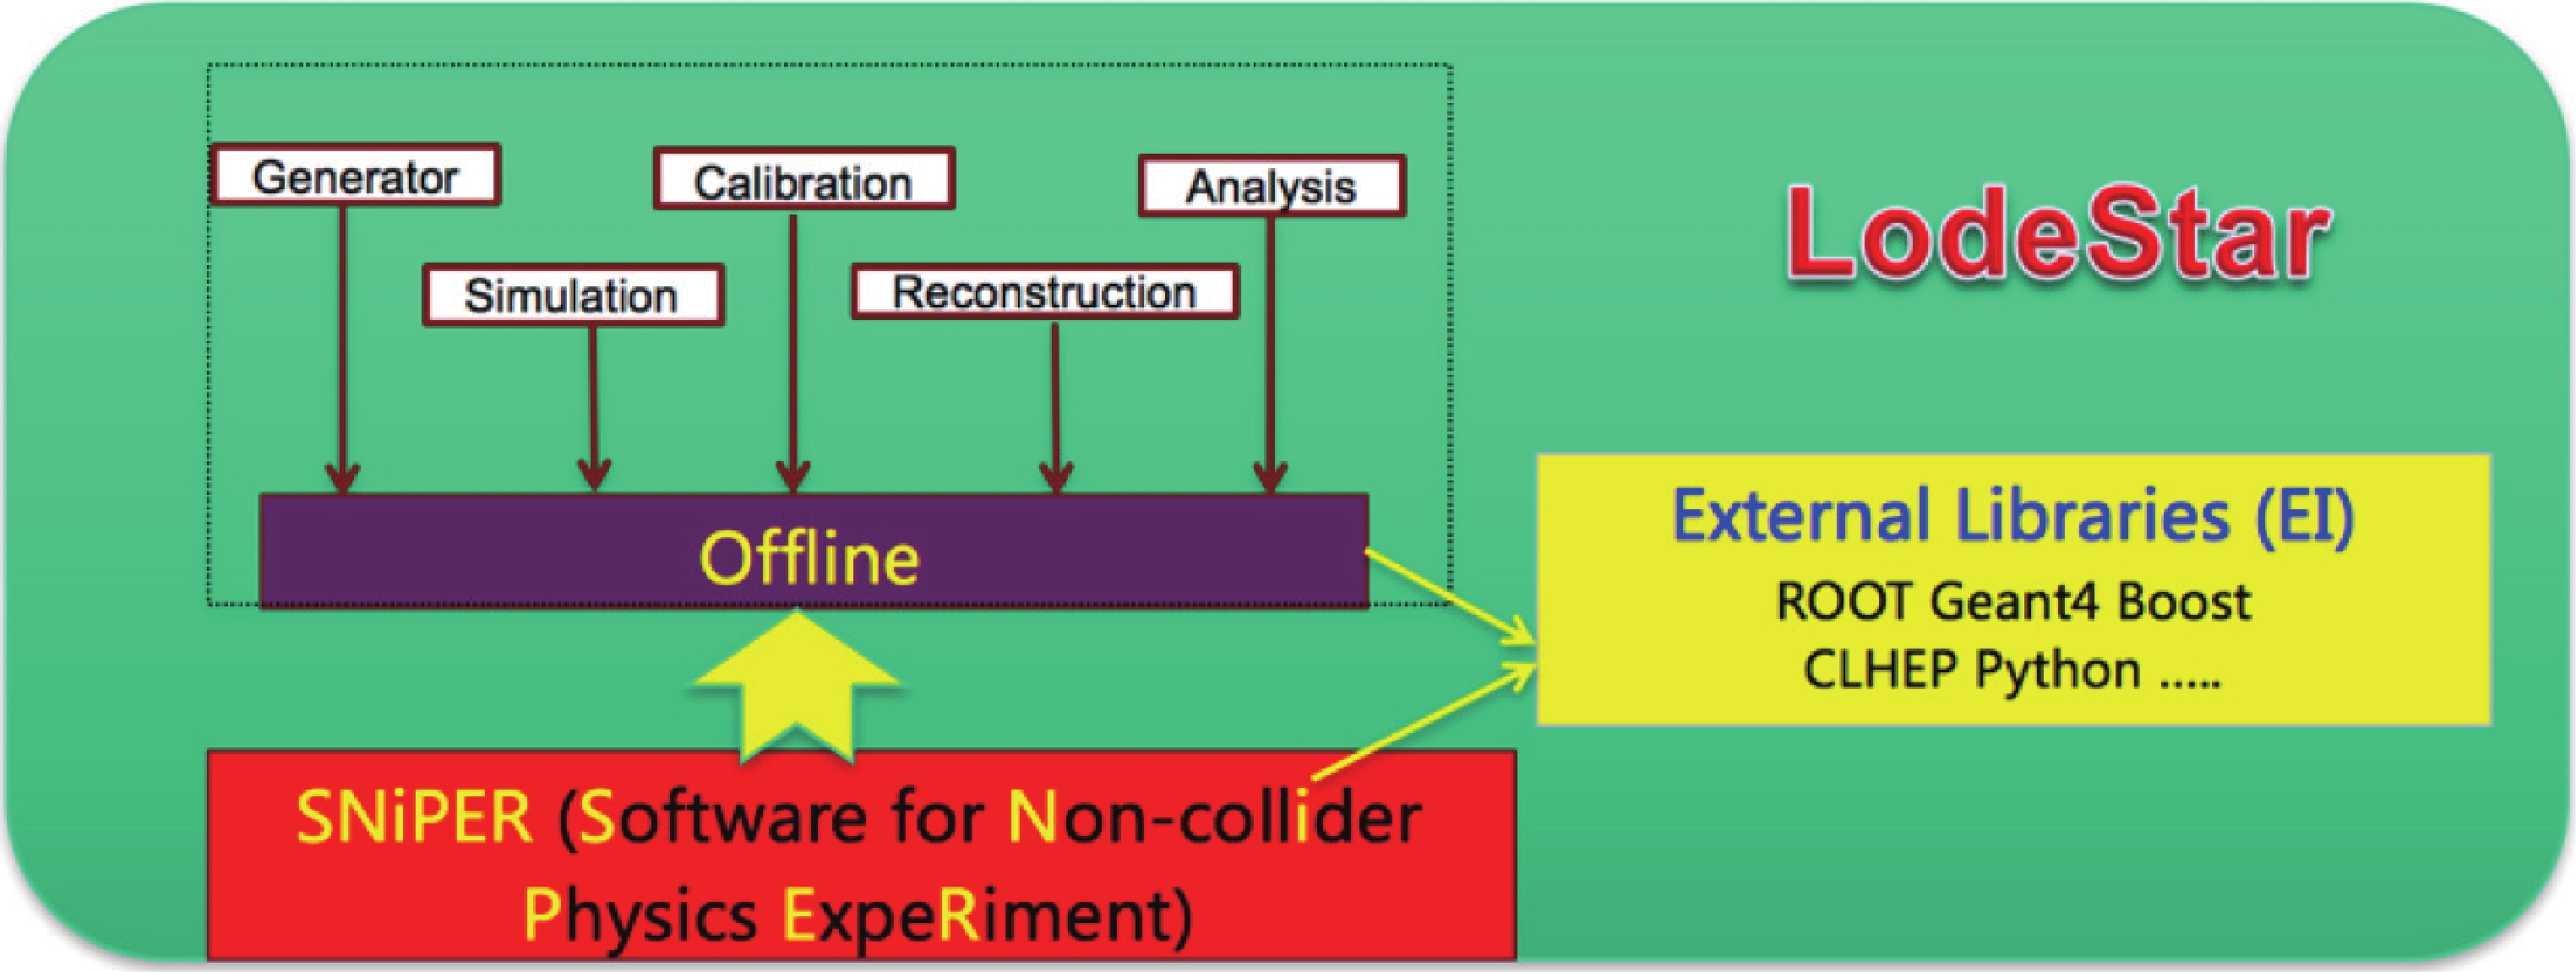
Figure 62. (color online) The architecture of the LHAASO Offline Software System.
● EI
The EI project is to build the interfaces for external libraries, such as Corsika, Geant4, ROOT, Python, etc. Therefore SNiPER and Offline can easily use external libraries via the interfaces defined in the EI project.
● SNiPER
SNiPER (Software for Non-collider Physics ExpeRiment) is the underlying framework of LodeStar to provide the common functionalities, including data processing controlling, event data management, standard interfaces for different components and applications, and some common services. It is designed for non-collider physics experiments from scratch following the Object-Oriented technology, and developed with bi-language, C++ and Python. So far, It has been successfully used by the JUNO (Jiangmen Undergound Neutrino Observatory) as the foundation to develop its whole offline software system.
● Offline
Based on the interfaces and functionalities provided by SNiPER, the Offline project is developed according to LHAASO specific requirements. It contains two types of packages: one is to define the event data for different data processing stages, the other is for event data processing including data input/output, detector description, detector response simulation, digitization, calibration, reconstruction and physics analysis.
-
From the users point of view, the key components of LodeStar are described as below.
● Algorithm
Algorithm is a basic unit for data processing and provides the interfaces for users and developers to develop their new specific algorithms which can be dynamically loaded and executed by LodeStar. Detector simulation, calibration and reconstruction are all implemented as Algorithms.
● Service
Service provides a specific functionality needed during event data processing. For example, users can write data into ROOT files via the RootWriter service, or access the database via the DatabaseSvc, or access to the detector geometry via the GeometrySvc. Services can be invoked by users' Algorithms or the framework.
● Tool
Tool is similar with Service, also a dynamically load-able element, but it belongs to an specific Algorithm and helps the Algorithm to organize the code more flexibly.
● Task
Task is a lightweight application manager, as shown in Fig. 63. It is a controller for the event looping and the entrance of a job. Task manages Algorithms, Services, and sub-tasks and controls the execution of all Algorithms belonging to it according the order of the Algorithms when they are created.
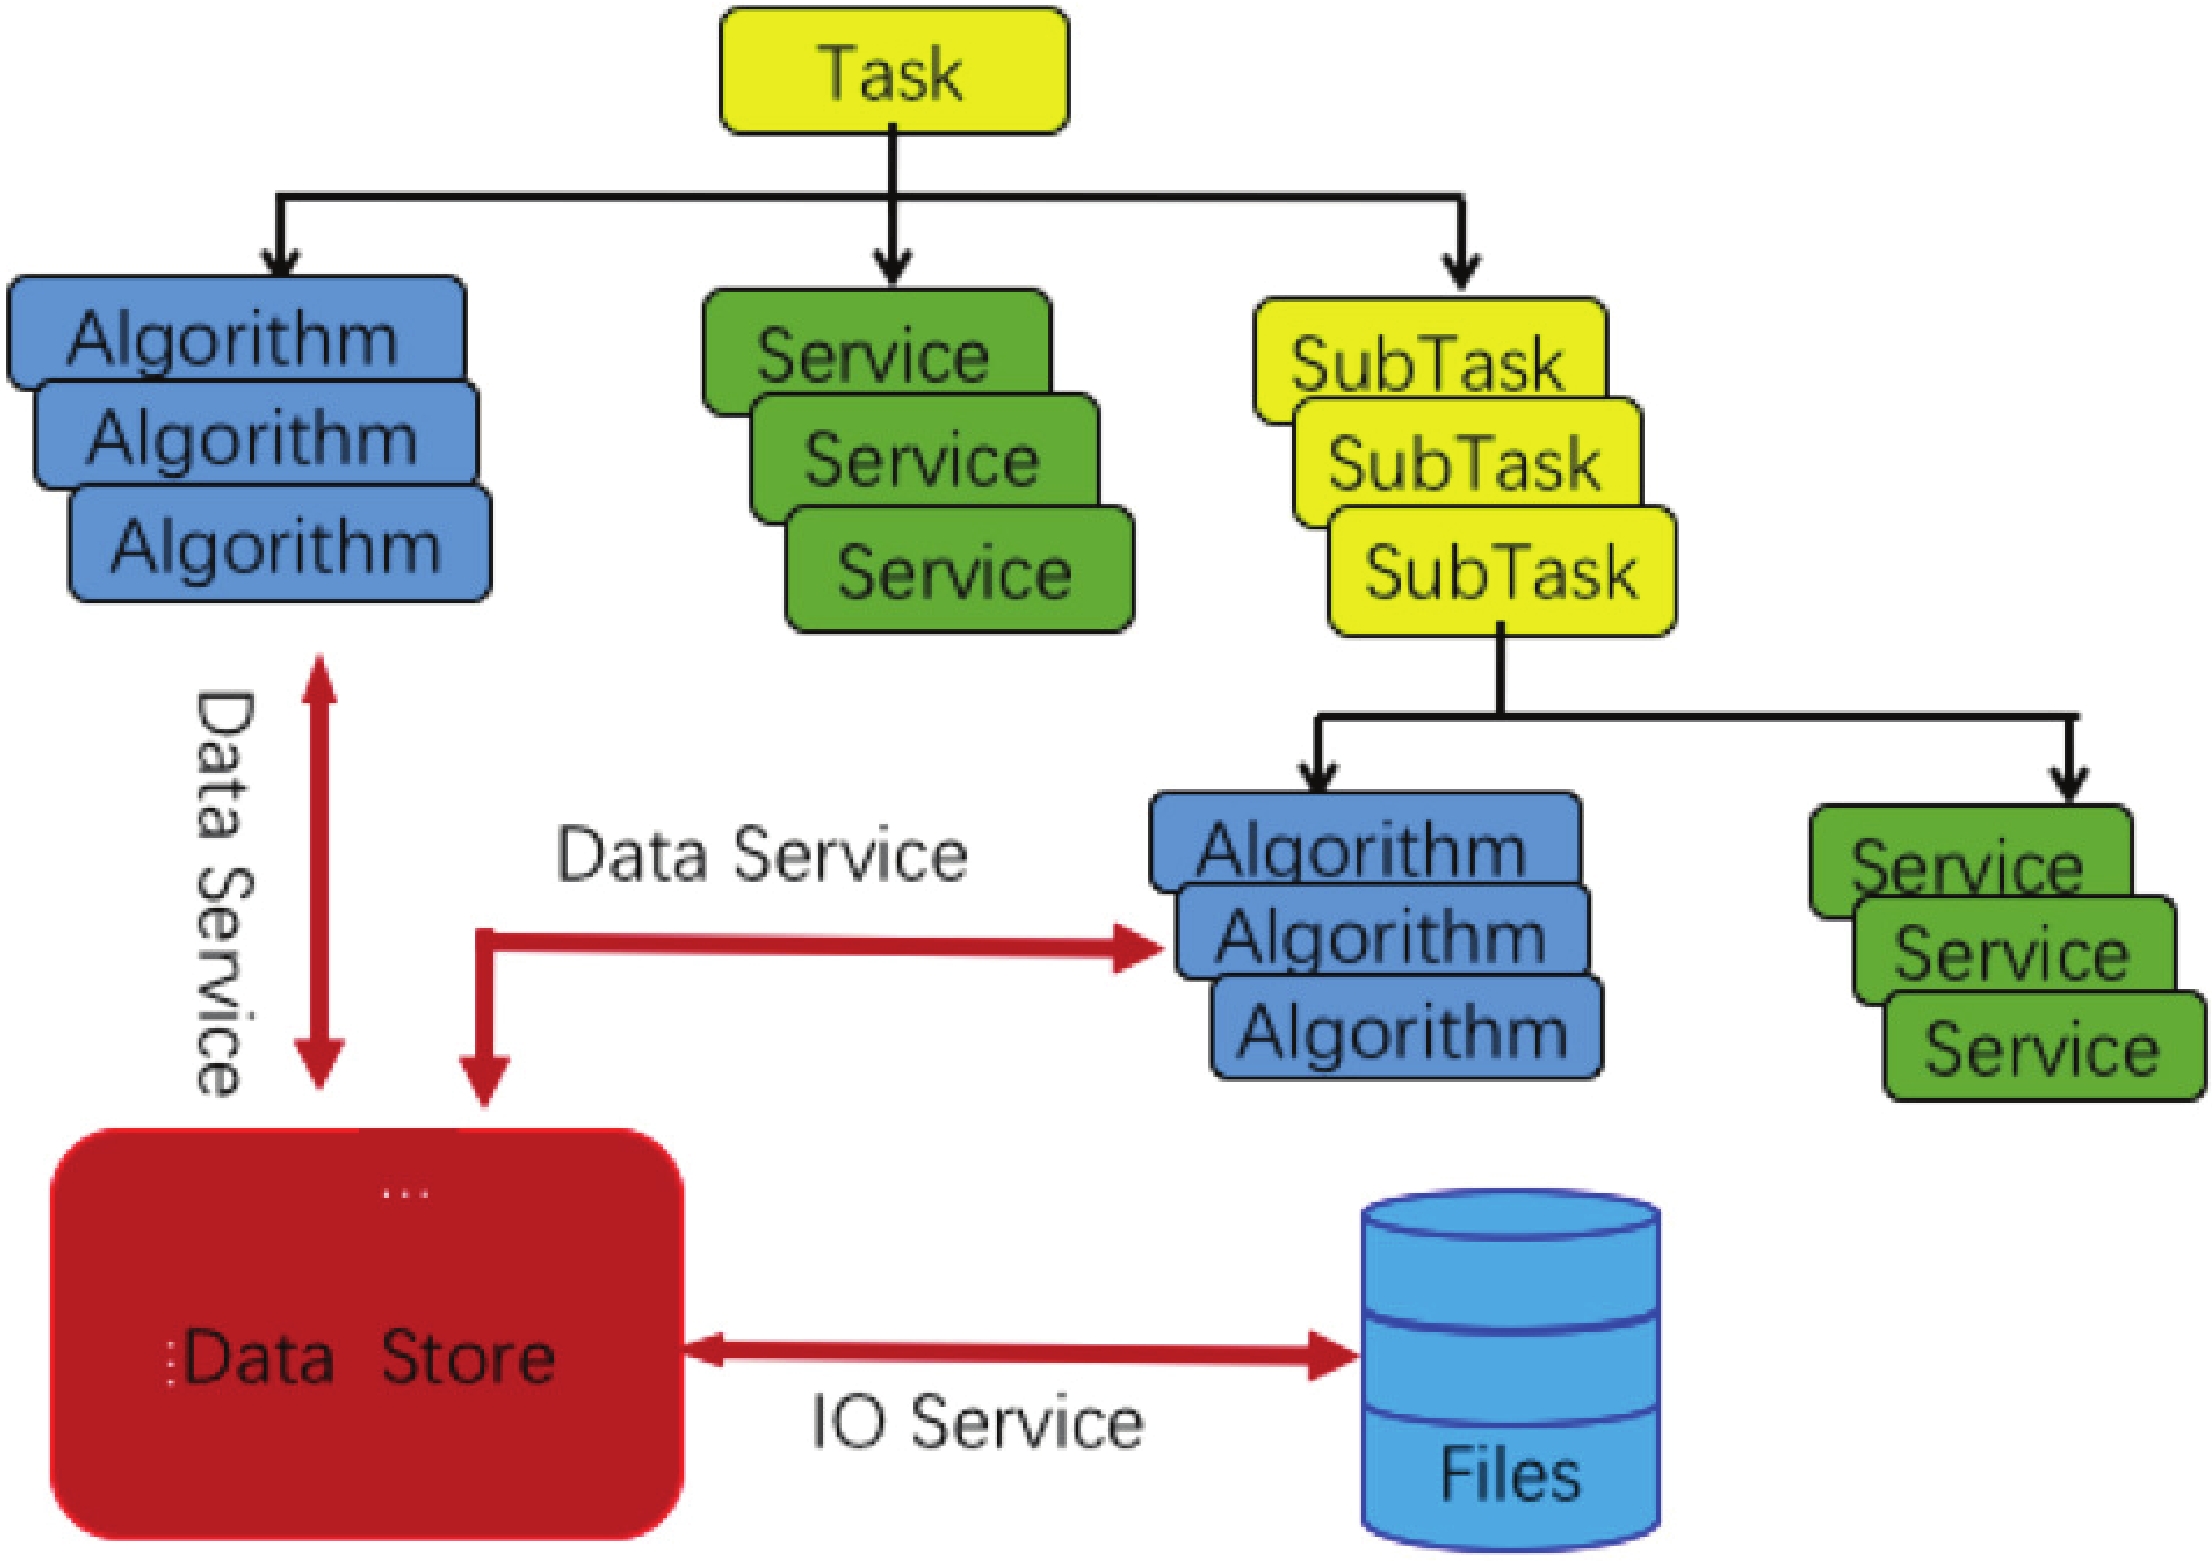
Figure 63. (color online) Main Components of LodeStar.
● Event Data Model
Event data model (EDM) defines the event information at the different data processing stages and build the correlations between them. LHAASO EDM classes are implemented based on the ROOT TObject. Fig. 64 shows the schema of the LHAASO EDM. At each data processing stage, the event data consists of two parts: HeaderObject and EventObject. The HeaderObject only contains some "tag" information in order to speed up event selection, the EventObject holds all information of this event. SmartRef is deployed to build the relationship between HeaderObject and EventObject and provides the data lazy-loading functions.
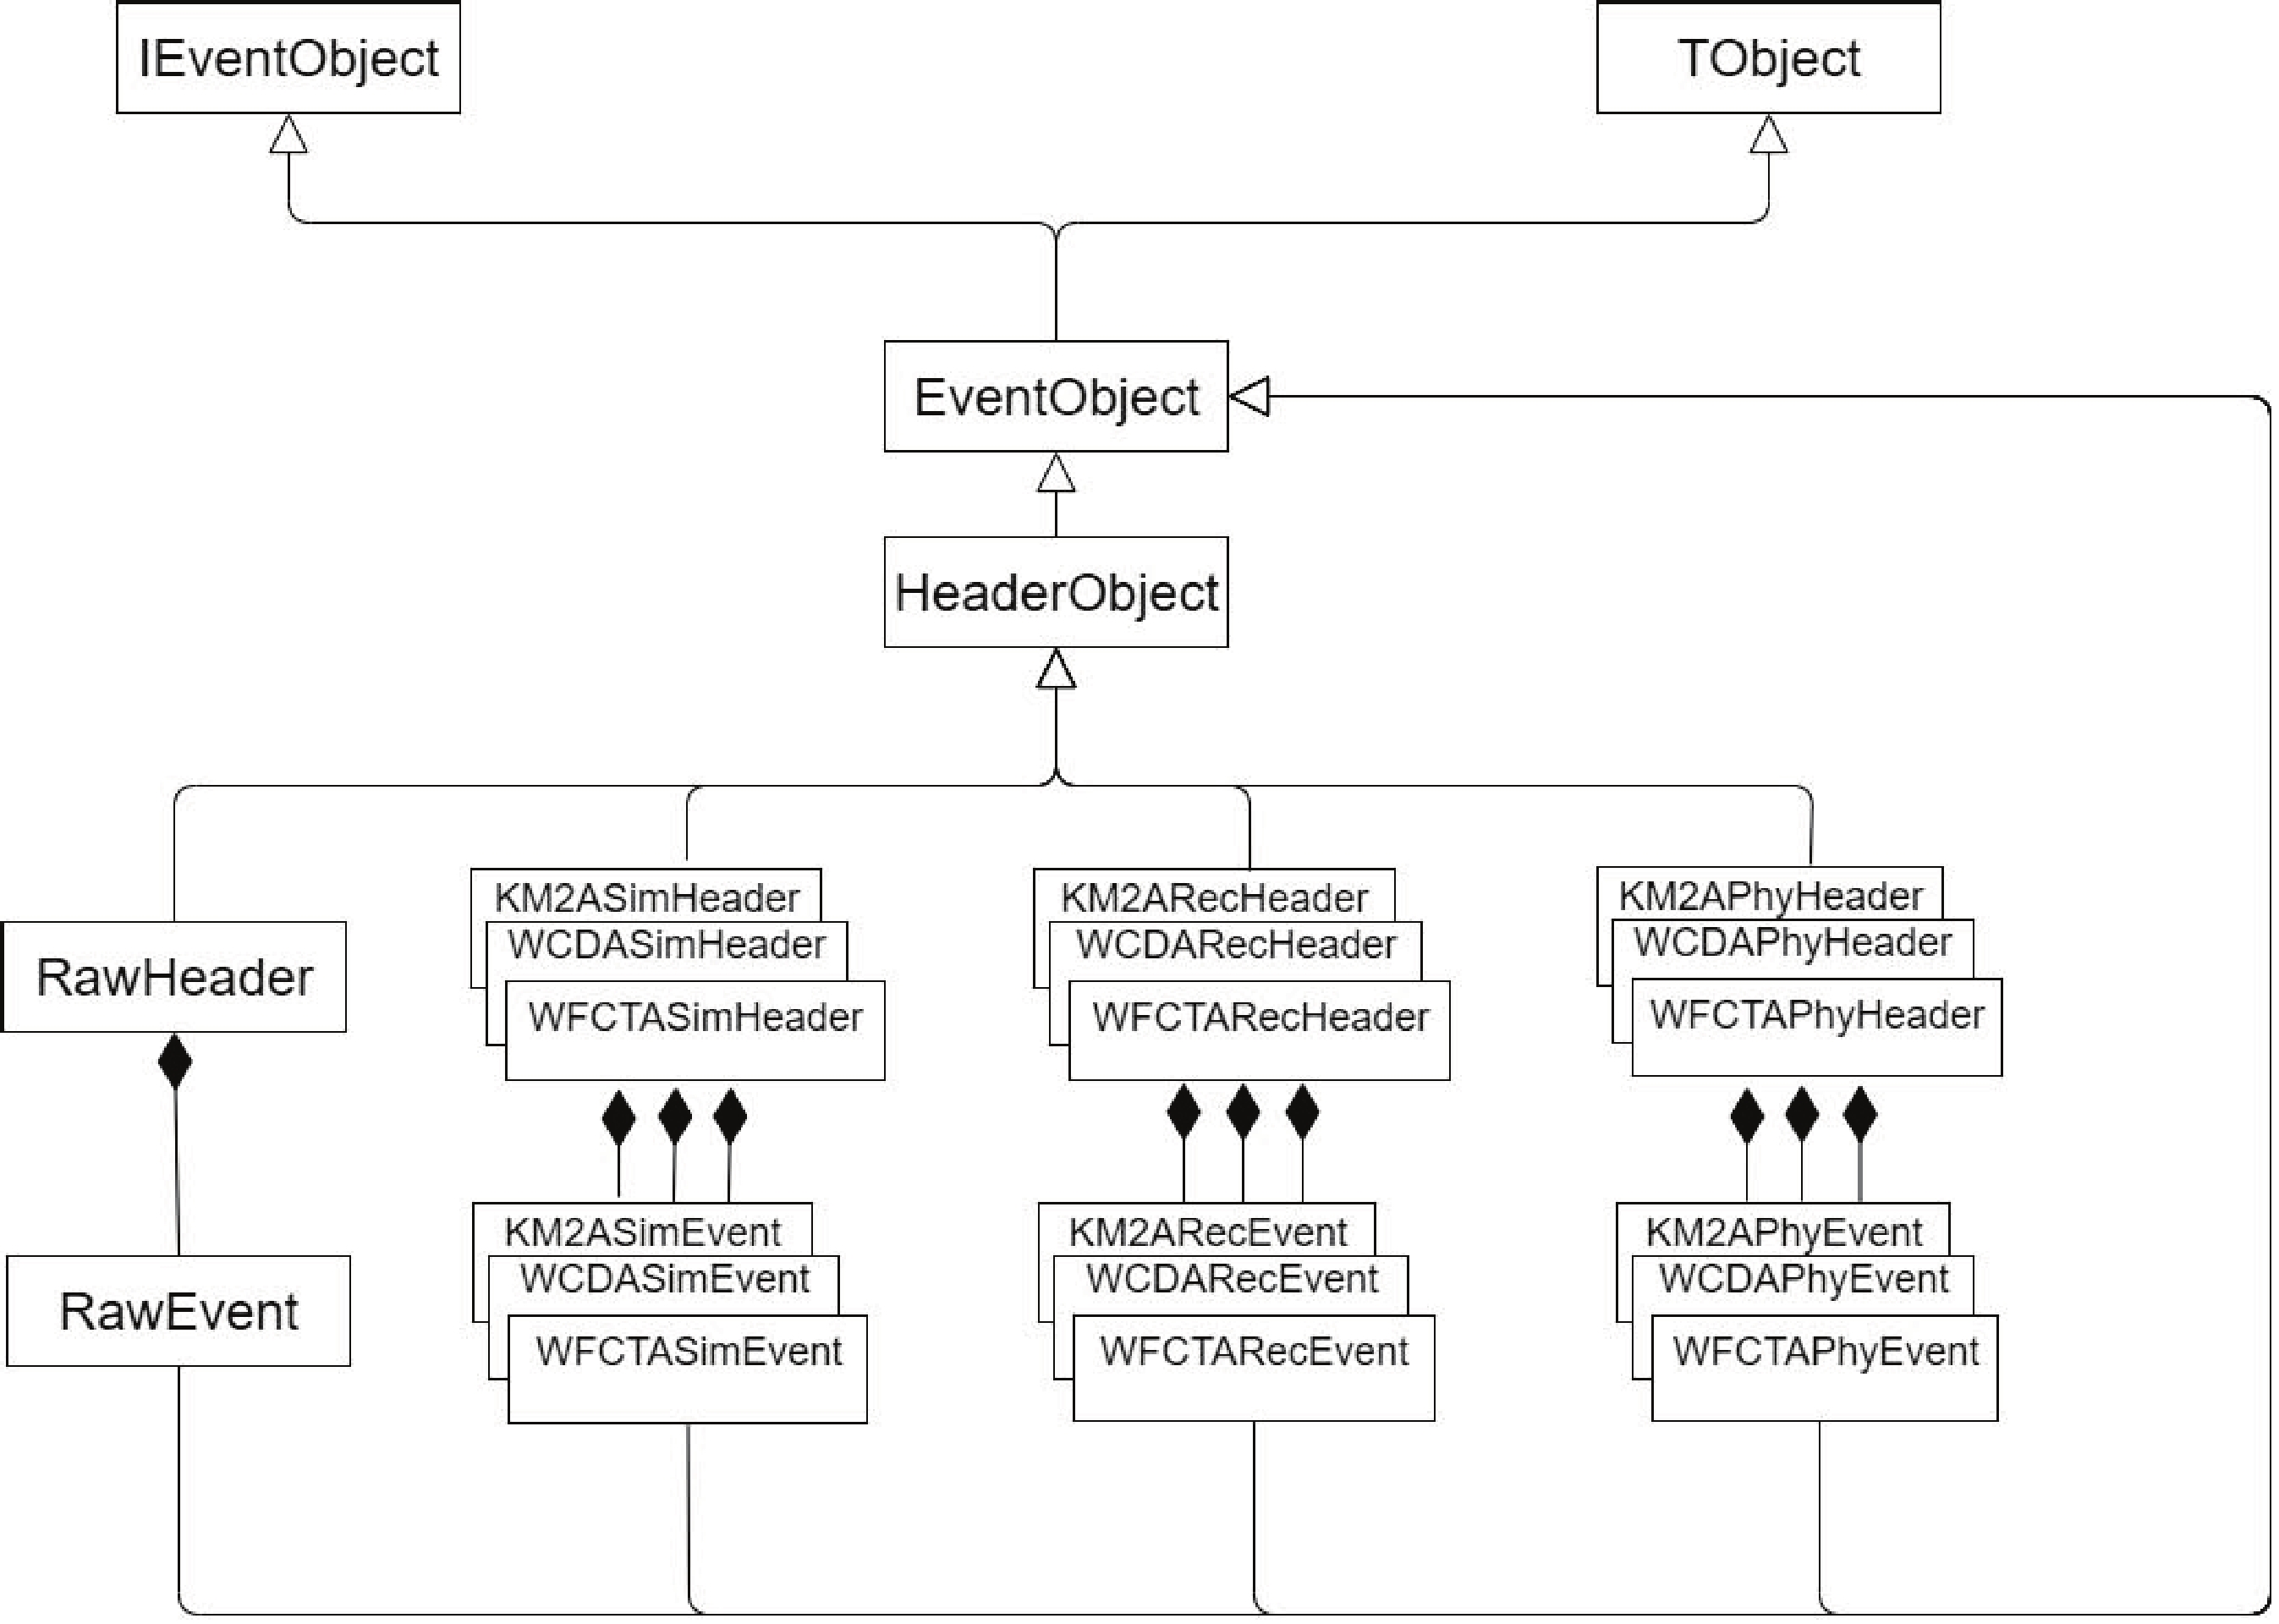
Figure 64. Schema of LHAASO Event Data Model.
● Data Store
Data Store is the place in memory holding the current event data in order to be easily accessed during the event processing. The event data in different processing stages for different sub-detectors can exist at the same time in the Data Store, and each type of data has one unique path. Users can use the unique path to retrieve the event information and put the new event data back to the Data Store. All the event data in the Data Store can be read/written from/to data files by the data input/output service.
● Detector Simulation
LodeStar manages detector simulation with a Task as illustrated in Fig. 65. A dedicated Algorithm, DetSimAlg, is developed for simulation of all sub-detectors (including KM2A and WCDA). A dedicated service, G4Svc, provides the way to launch Geant4 within LodeStar, and a user-end service, DetSimFactory, is developed to set up and organize all the Geant4 related classes. User-end Tools, classified as AnalysisElement are provided for defining the user actions and the physics list for Geant4.
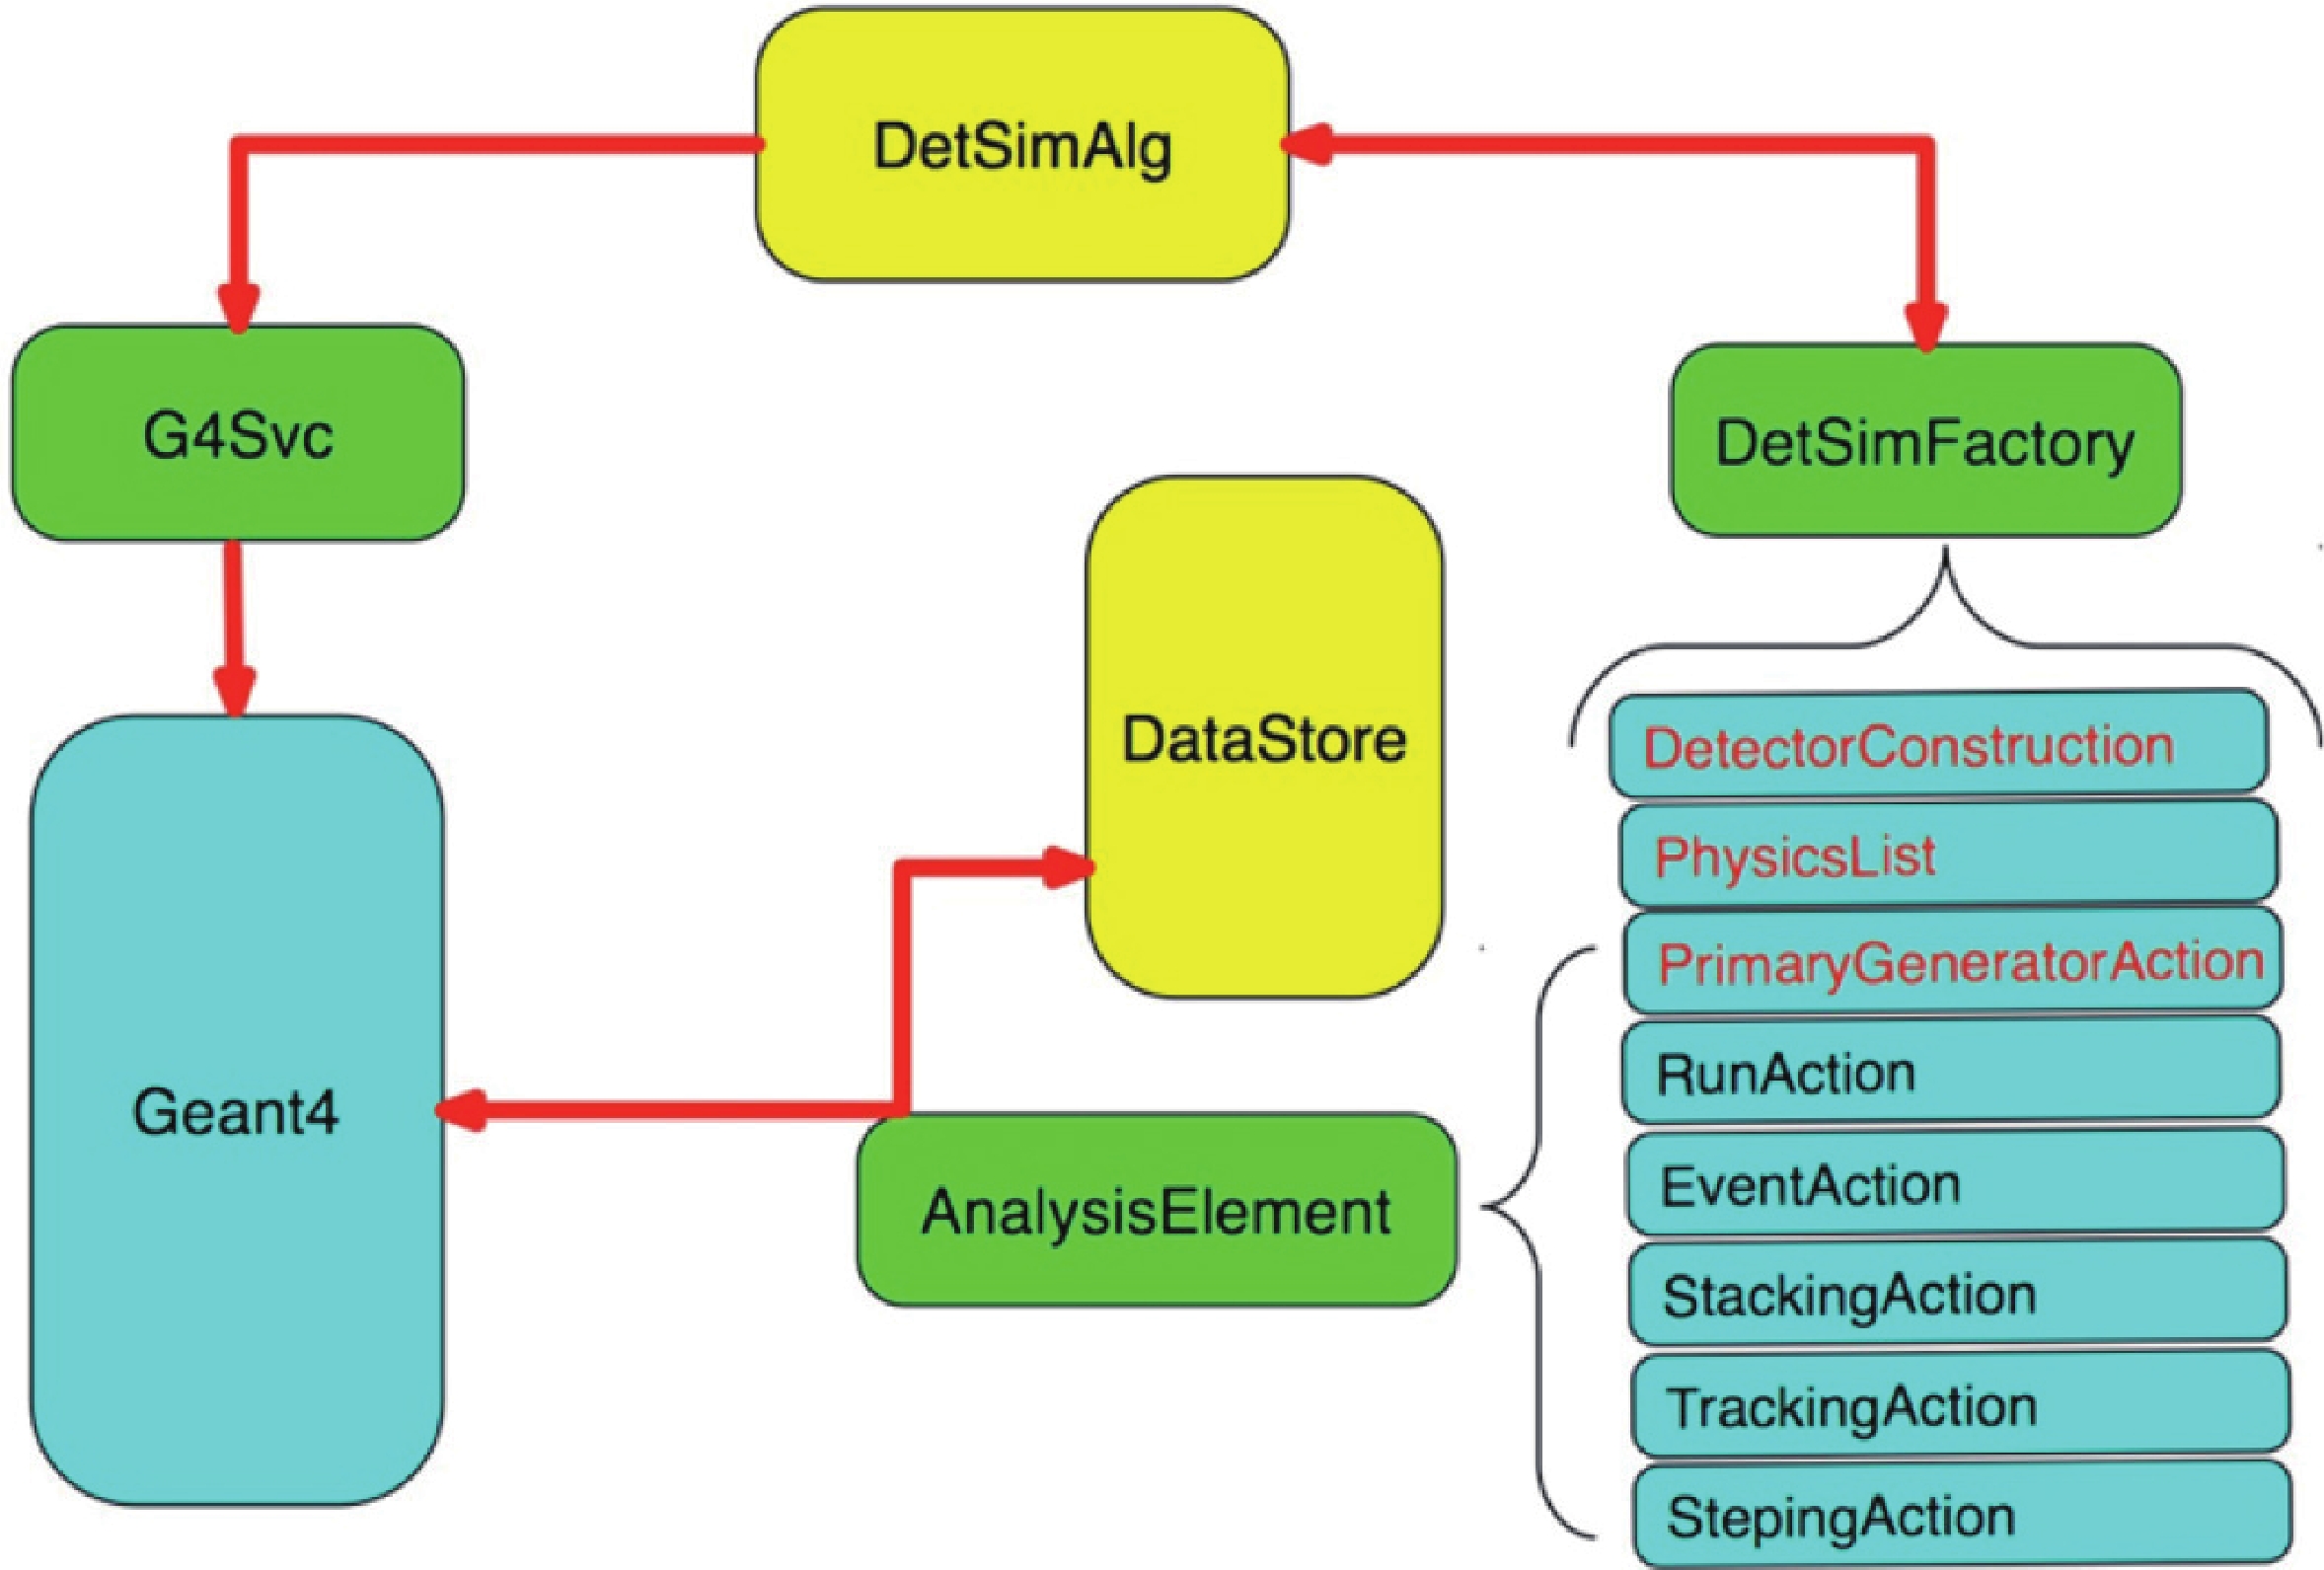
Figure 65. (color online) Detector simulation system.
● Property
Property is a configurable variable. Users can customize its value in the job configuration to avoid hardcoding. All Algorithms, Services, Tools and Tasks can have their own Properties by declaring a variable as a Property in their constructors. Then all these Properties can be configured in the job configuration python file.
-
Now LodeStar switches from the development to the optimization. LodeStar's most important functionalities have been implemented as described above, and it is being released one or two versions every year. The detector simulations including KM2A, WCDA and WFCTA, have been integrated into LodeStar. The physics analysis framework has been also built up based on the LodeStar in order to speed up the whole LHAASO data processing.
-
The data analysis facility for LHAASO is designed to build a integrated platform including a large-scale data storage and computing system to support the running of analysis software and finally provides physicists with a uniform experiment data analysis environment. The relation between LHAASO data analysis facility and other subsystems of LHAASO is shown in Fig. 66.
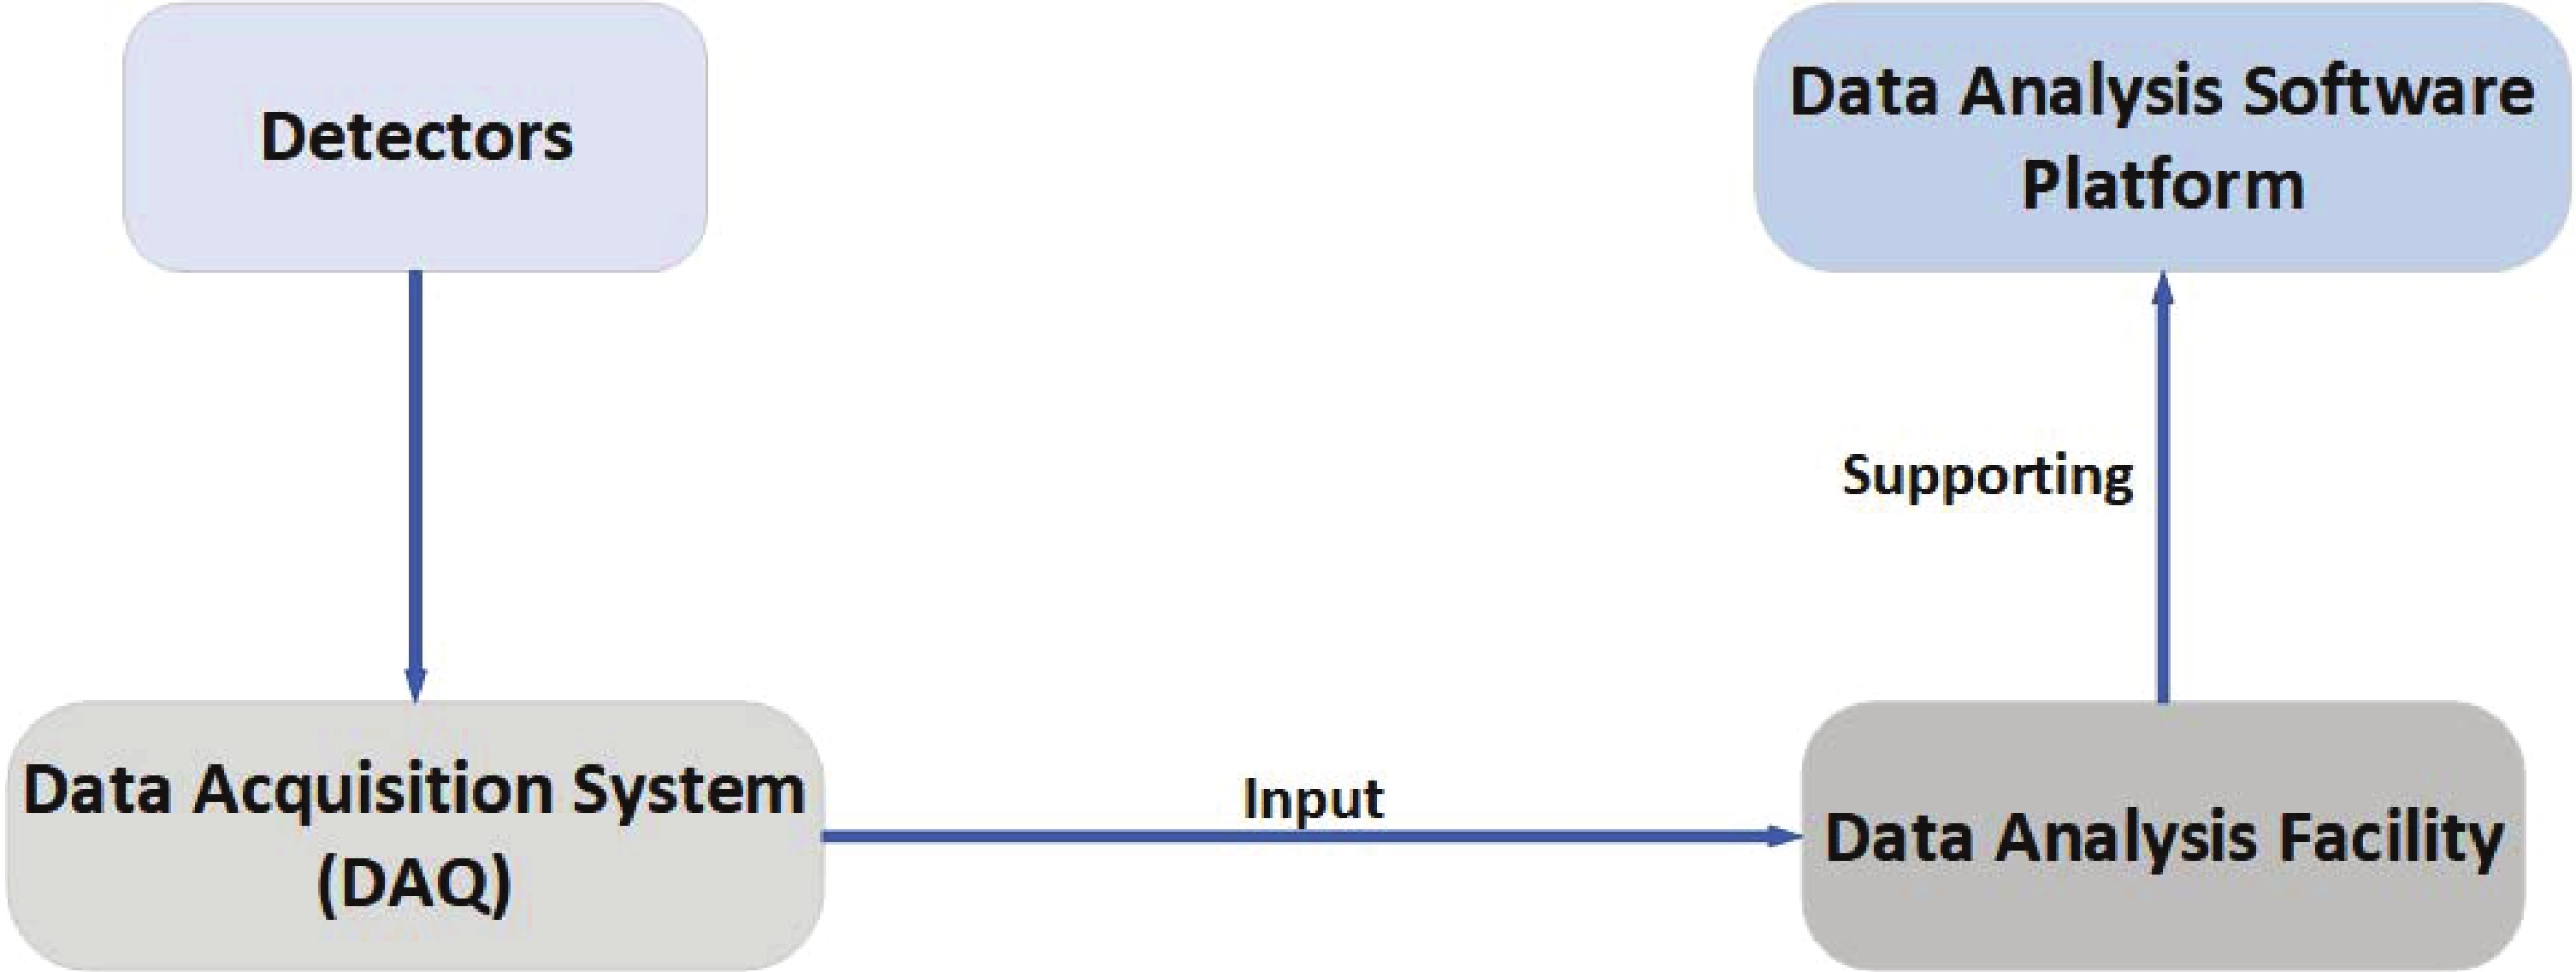
Figure 66. (color online) The architecture of LHAASO data analysis facility.
The data analysis facility provides fundamental computing and network services, such as high performance computing (HPC), massive data storage, high-speed transmission network, distributed data sharing and analysis system to support detector monitoring, data transmission, storage, decoding, calibration, reconstruction and analysis. The facility is composed of a small on-site data center (DC) at Daocheng, a large data center at Beijing, high-speed fiber network from Daocheng to Beijing, remote operation center (ROC) and IT Service platform and so forth.
The small on-site DC is designed to pre-process and compress data of WCDA from DAQ, and keep the processed data about one month, as well as equipped with a HPC cluster, a massive disk storage system (EOS), a job scheduling system (HTCondor), a WAN data transfer system (Spade) and a synthetic monitoring tool. Meanwhile the large DC at Beijing is designed for data storage and analysis, supporting physical simulation, data reconstruction, physics analysis and long-term data preservation, equipped with a large HPC cluster, a disk storage system, a large tape library system, a data backup system and so on.
LHAASO produces about 9 PB raw data annually, which is stored and processed on the data analysis facility. The components and current status of the data analysis facility are as follows:
● One large tape library equipped with 20 LTO7/LTO8 drivers and more than 25 PB tapes.
● One advanced tape storage system with the ability to manage 200PB tape capacity.
● One distributed disk storage system with the capacity of 25 PB and aggregate performance of several tens of GB per second.
● One high throughput computing system with more than fifteen thousand modern CPU cores deployed in Daocheng and Beijing data centers.
● a dedicated network link between LHAASO observatory and Beijing data center with the bandwidth over 2.4 Gps.
The data analysis facility consists of many subsystems, such as the front-end login system, the massive storage system, the tape library and the computing cluster, as shown in Fig. 67. We will discuss some subsystems in the following.
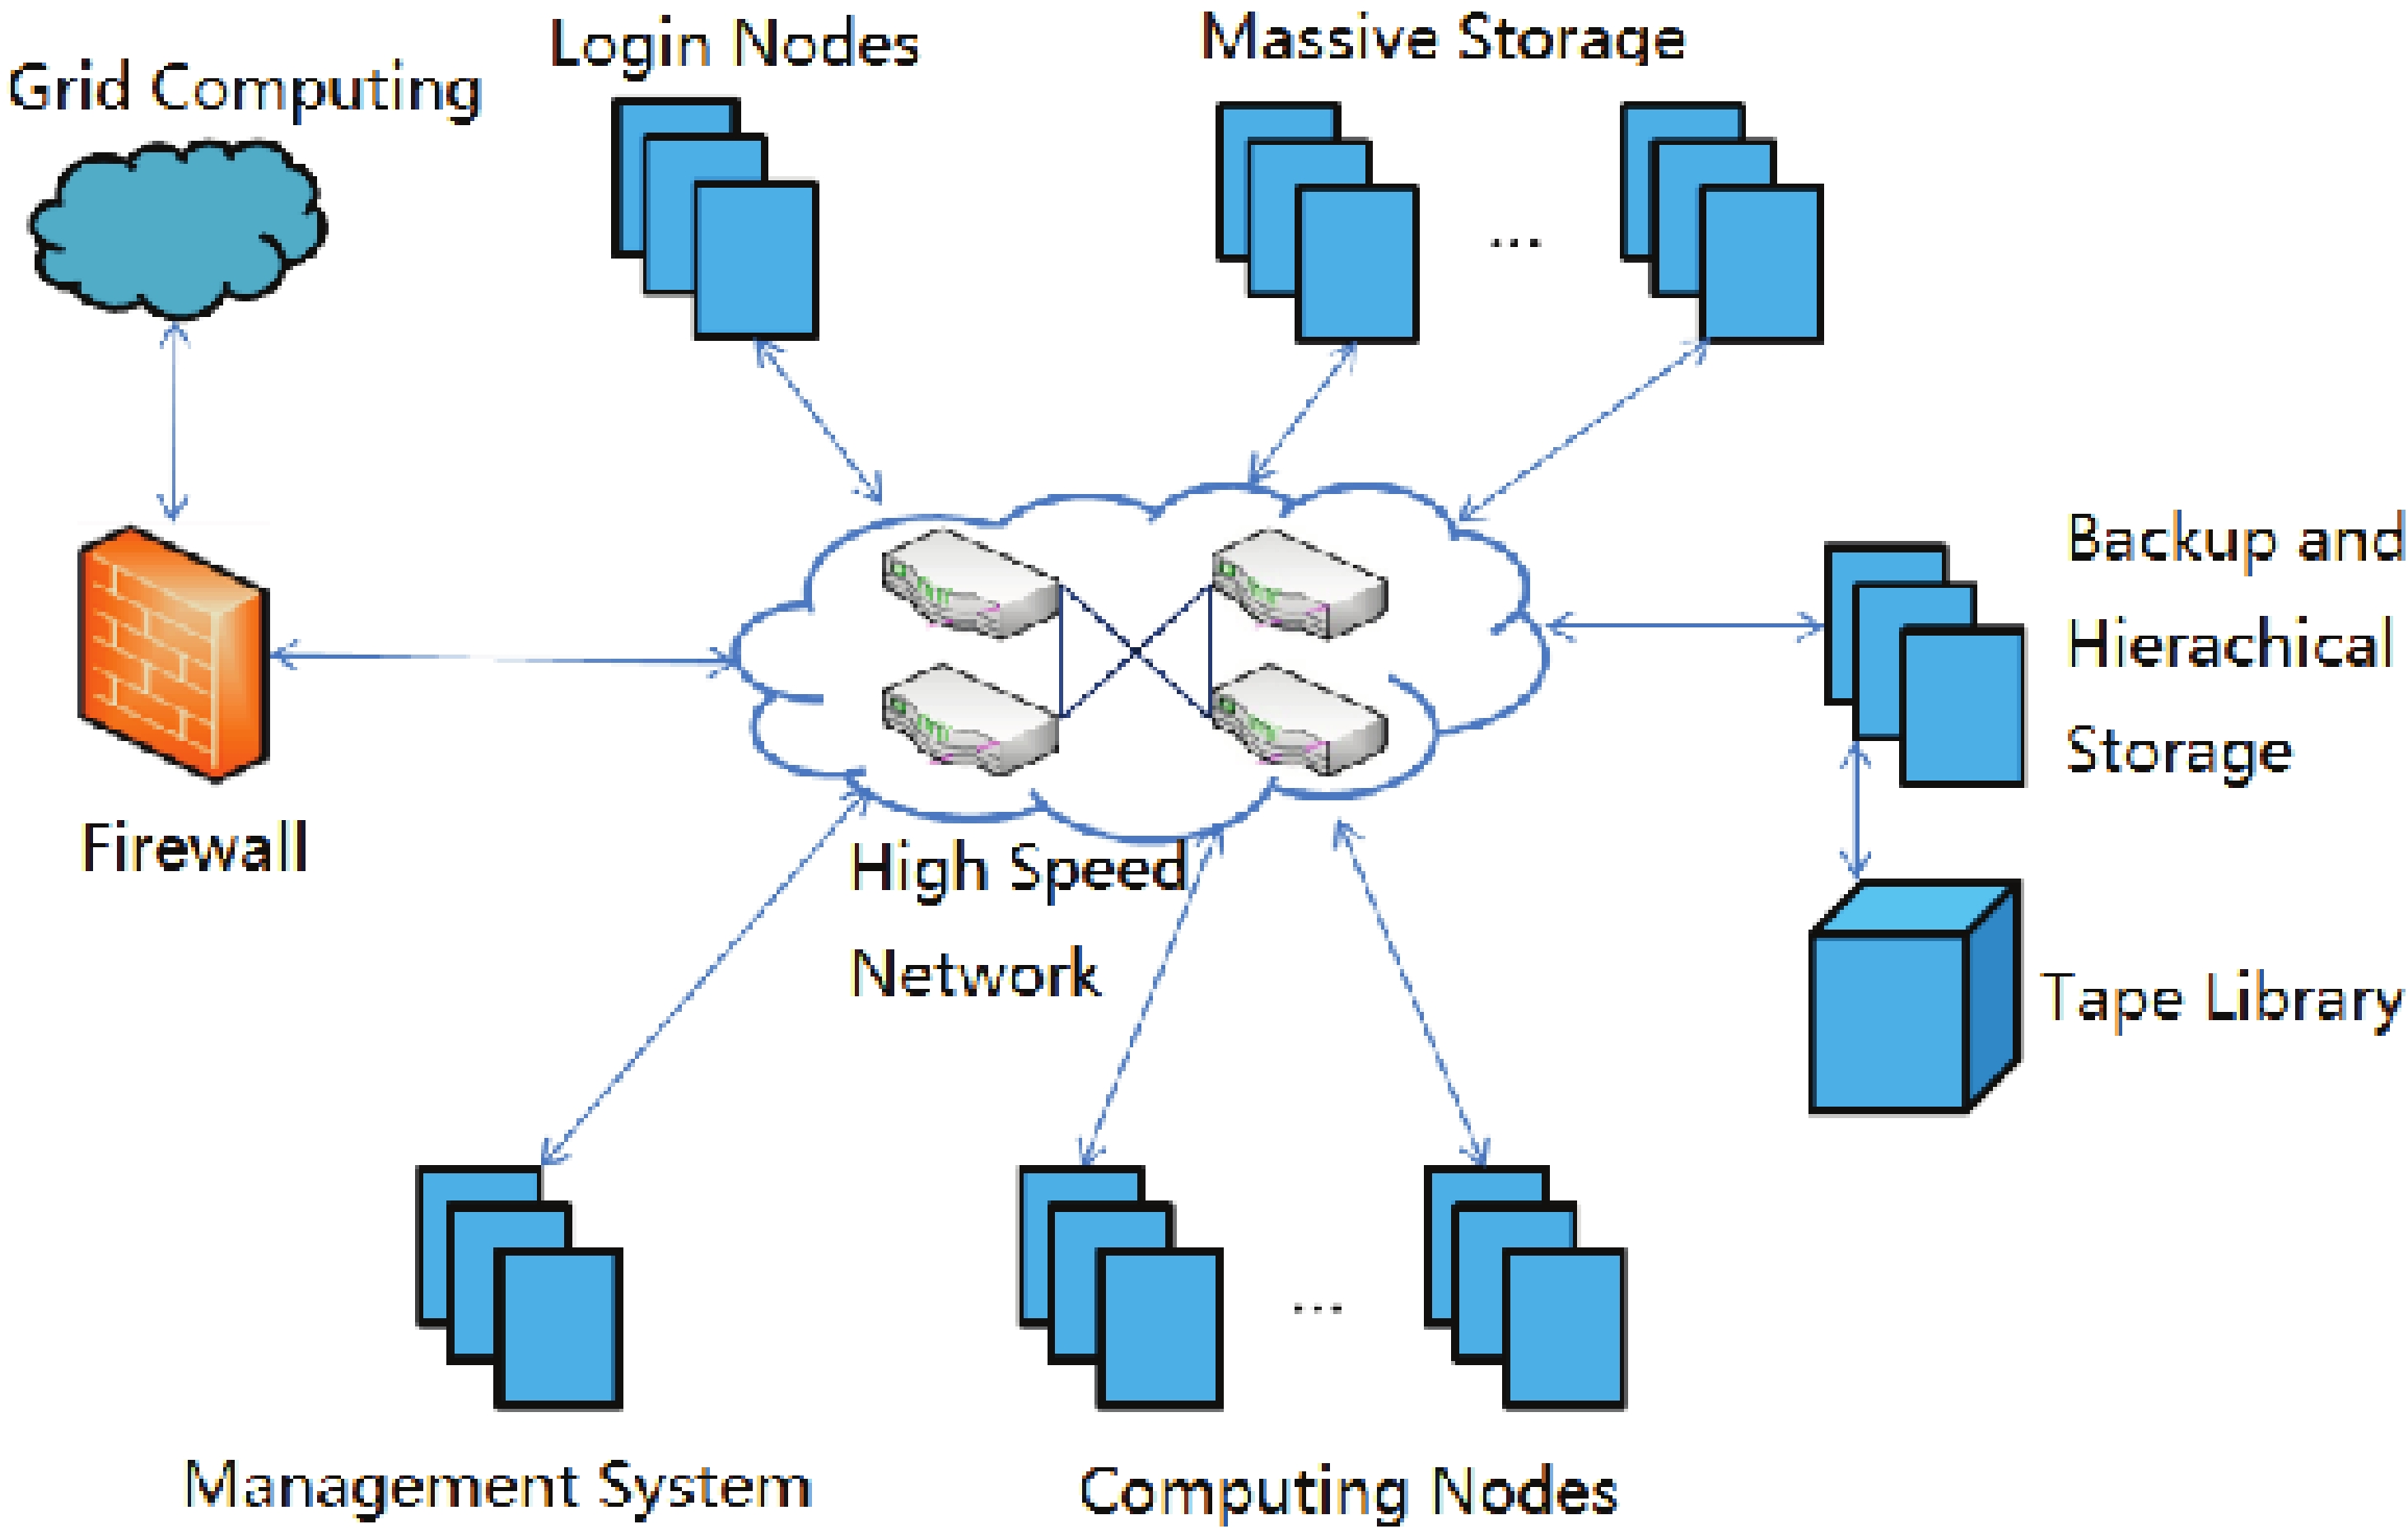
Figure 67. (color online) The LHAASO data analysis facility.
-
The front-end login system provides access services to users directly, such as login service, HPC service, web service and massive storage service. It has a single entry point, connecting a dynamical scalable and load-balanced cluster based on DNS load-balancing, which ensure users log into the cluster and do further work from wherever they are.
-
There are a large number of domestic and foreign users in the LHAASO collaboration, and unified management for user information, authentication and management for users' HOME directories are necessary. For LHAASO, AFS filesystem is used for user directory management, and unified authentication combined with Kerberos. AFS is a open-source distributed filesystem, supporting many kinds of OS, and is highly secure via combination of authentication database and ACL.
-
Computing cluster is widely used in high energy physics data analysis facility, and IHEP also adopt the technology. There are two computing clusters for LHAASO, a small one at Daocheng with about 5,000 CPU Cores for preliminary pre- processing and compressing data from DAQ, and a large one with up to 10,000 CPU Cores for offline data analysis for LHAASO, such as data simulation, reconstruction and analysis.
The job sc792 heduling system integrates CPU resources on a large mount of computing nodes, and manage jobs submitted by different users according to some scheduling policies. Common job scheduling system include PBS, HTCondor, LSF, SGE, etc.. HTCondor is an open source scheduling systems, supporting High Throughput Computing (HTC) especially, with the ability of job controlling and scheduling, resource monitoring and management, and is widely used in high energy physics filed. One home-made job scheduling tool - hepjob is developed based on HTCondor to simplify the procedure of job submission, and has come into service in both computing clusters for LHAASO and other experiments.
-
In consideration of the difficulties of routine maintenance for the on-site data center at Daocheng Haizi Mount, we adopt the virtualization technology based on Openstack and Kubernetes to build the computing cluster at Daocheng. The virtual computing platform includes the virtual computing cluster, login cluster and management services. All login nodes and management servers are providing services in the format of containers, and the container cluster is managed by Kubernetes, and the system availability is highly increased by taking full advantage of the container's load-balancing and fault-tolerant mechanism.
The virtual computing cluster includes management and scheduling of virtual computing resources, automatic management for virtual machines, and well-defined interfaces for cluster scaling. HTCondor is used as the job scheduling system as well as for the physical cluster.
-
Generally, computing and data storage systems are separated in high energy physics, and the same with LHAASO. There are many kinds of distributed filesystem such as Lustre, EOS which we deploy as the storage filesystem 812 for LHAASO. EOS is a distributed filesystem developed by CERN, which is widely used for many experiments at CERN, such as CMS, ATLAS, ALICE, LHCb, and stores more than 3 billions of files with the capacity larger than 300 PB. Ths EOS system can meet the requirements for data storage and management for LHAASO very well. EOS consists of management service (MGM), message queue (MQ) and file storage service (FST). In general, the EOS is connected to the computing cluster via high-speed fiber network, the computing nodes on which EOS is mounted on via FUSE/FUSEX, and the analysis programs can access files on EOS as if on native filesystem, or just access files via xrootd directly.
Currently two EOS instances are deployed for LHAASO, one in the on-site DC at Daocheng to support data quick pre-processing, compressing and storage, while another one in the large DC at Beijing to provide storage service for data reconstruction, simulation and analysis. The small EOS at Daocheng currently store 57 millions of files with the capacity of 4.5 PB, and the large one at Beijing has a capacity of about 20 PB and stores up to 210 millions of files so far. Both will be expanded continuously in the future.
-
LHAASO will produce about 9 PB/year raw data as mentioned above, and massive storage techniques are necessary to store data and ensure data safety. The tertiary storage model - "tape - disk - memory" is a universally adopted storage policy, especially for HEP. Castor is a hierarchical storage management system, developed by CERN, designed for file transmission between disk system and tape library, and has been put into service at IHEP for BESIII, YBJ, and DYB as well as LHAASO experiment.
The Castor system meets the requirements of data backup and retrieval for LHAASO because of the scalable architeture and we have deployed one Castor instance for LHAASO. Currently there are 20 LTO7 tape drives and more than 4200 LTO7 tapes with a capacity up to 25 PB. Data from Daocheng is firstly stored into the large EOS instance at Beijing, and then be migrated to the tape library for data security. User can easily retrieve files from tape library using some commands provided by Castor, while individual file backup to the tape library is restricted. And a new tape library system - CTA developed by CERN will replace Castor in the near future. CTA is modernly designed and cooperates with EOS tightly.
-
Experiment data on the on-site DC at Daocheng is needed to be transferred to the large DC at Beijing, requiring high-speed network, stable transmission system and network security and safety. The network between on-site data center and IHEP is rented from telecom carriers with bandwidth up to 2.4 Gbps, quite enough for stable transmission of experiment data from Daocheng to Beijing, remote monitoring, and on-site working, etc. Massive data is transferred from Daocheng to Beijing and stored in EOS system then permanently into tape storage system, which requires a stable and effcient transmission system and the Spade transfer system is adopted for this task. The Spade system is widely used for data transmission, like DYB and JUNO, and has been adopted to transfer experiment data for LHAASO since 2018.
-
LHAASO has two sites in Daocheng, Sichuan province, China (see Fig. 68). One is in Mt. Haizi and the other is in the downtown of Daocheng. The distance between these two sites is about 50 km. The site in Mt. Haizi at 4410 m a.s.l. is the observatory where all detectors are installed in arrays. The total area of the observatory is about 1.35 km2. The observatory is about 10 km away from the Daocheng airport. The other site in the Daocheng downtown is the living base at 3750 m a.s.l. The total area of the living base is about 13,000 m2.

Figure 68. (color online) The two sites of LHAASO (marked on the map from https://map.baidu.com).
-
1) The living base
The total area of buildings is about 7000 m2 distributed in 5 buildings in the living base (see Fig. 69). The four-floor building is the dormitory. There are 31 rooms with a capacity of 50 beds in the dormitory. All rooms are equipped with permanent heating system. The heat source is the hot spring water provided by a local company. To allow the guests good sleep in the night at the altitude of 3750 m a.s.l., extra oxygen is supplied in the rooms by a centralized oxygen generator in the living base. The equivalent altitude in the rooms could be reduced down to 2700 m a.s.l. according to the concentration of oxygen in the air. There are fifteen offices, a computer room and one exhibition room on the second floor of two other buildings in the living base. Meeting room, eight labs, kitchen, dining room, gym, utility houses and warehouses are all distributed in the first floor of all buildings.

Figure 69. (color online) The living base of LHAASO (2019).
2) The observatory
The bird view of the observatory is in Fig. 70. The area where the observatory is located was wild field before LHAASO started. By connecting to the 35 kV national power grid 30 km away, a dedicated transformer station nearby the observatory has been built. The capacity of the 35 kV transformer is 4000 kVA. Two 10 kV power cables are run from the transformer station to the two power distributing stations where the electric voltage will be further transformed to 380 V and 220 V. The No. 1 power distributing station is located beside the WCDA pools which are located at the central area of the observatory. It mainly powers the WCDA, WFCTA and most ED and MD. The No. 2 power distributing station is located in the assembling hall and provides electric power to the whole assembling hall, including the computer center, the water pumping station, ED and MD detectors nearby.

Figure 70. (color online) The bird view of LHAASO observatory in 2019. Assembling hall, pumping station, 35KV transformer station and WCDA pools are marked.
In the LHAASO project, the WCDA needs about 400 thousand tons of pure water to fill all three pools up and the MD needs about 50 thousand tons of ultrapure water to fill up all the 1171 tanks. The original water is pumped from a small lake which is connected the nature river about 300 m away. The capacity of the lake is about 15 thousand tons of original water. The water will be simply filtered by a filter bag to reduce dust in the pumping station before being pumped to the water purification factories. The water flux of 500 ton/hour, 160 ton/hour and 40 ton/hour can be supplied according to the requirement at different phases. The water pipe between the pumping station and the purification factories is about 1000 m long. The pipe is buried 1.7 m deep under the surface for prevention from freezing in winters. The record frozen depth of the local soil is about 1.7 m.
The total length of roads in the observatory is 21.9 km including 5.9 km paved. The width of all roads is 4 m. The roads look like a web on the ground which are designed to reach every MD detector in the array.
The assembling hall is a one-floor building with the size of 80 m × 24 m. The area reserved for the WFCTA telescope assembling is about 600 m2 with a high roof of 15 m. The roof of the rest part of the building is 8.5 m high. The No.2 power distributing station and the computing center are located in the hall as well with their own roof at 5.5 m.
The No.1 power distributing station is a single building of 390 m2 with the UPS power supplier of 600 kVA and a dedicated room reserved for the central timing and White Rabbit switches together.
The water purification system is distributed in two factories for the ultrapure water (428 m2) and pure water (372 m2), respectively (see Fig. 71). They are located near the center of the array around the northwest corner of No.3 WCDA pool. The highest output of the pure water is 180 tons/hour and it can be adjusted to about 40 tons/hour in the running phase if needed. The characters of pure water are TOC (Total Organic Carbon) < 0.2 ppm, turbidity < 0.1 NTU (Nephelometric Turbidity Unit), number of particles (diameter > 1 μm) < 100 /ml. The highest output of the ultrapure water is 20 tons/hour. The characters of ultrapure water are dissolved oxygen < 10 ppb, resistivity ≥ 18 MΩcm (25 °C), the rest characters meet the EW-I standards in " GB/T 11446.1-2013 semiconductor grade water ".
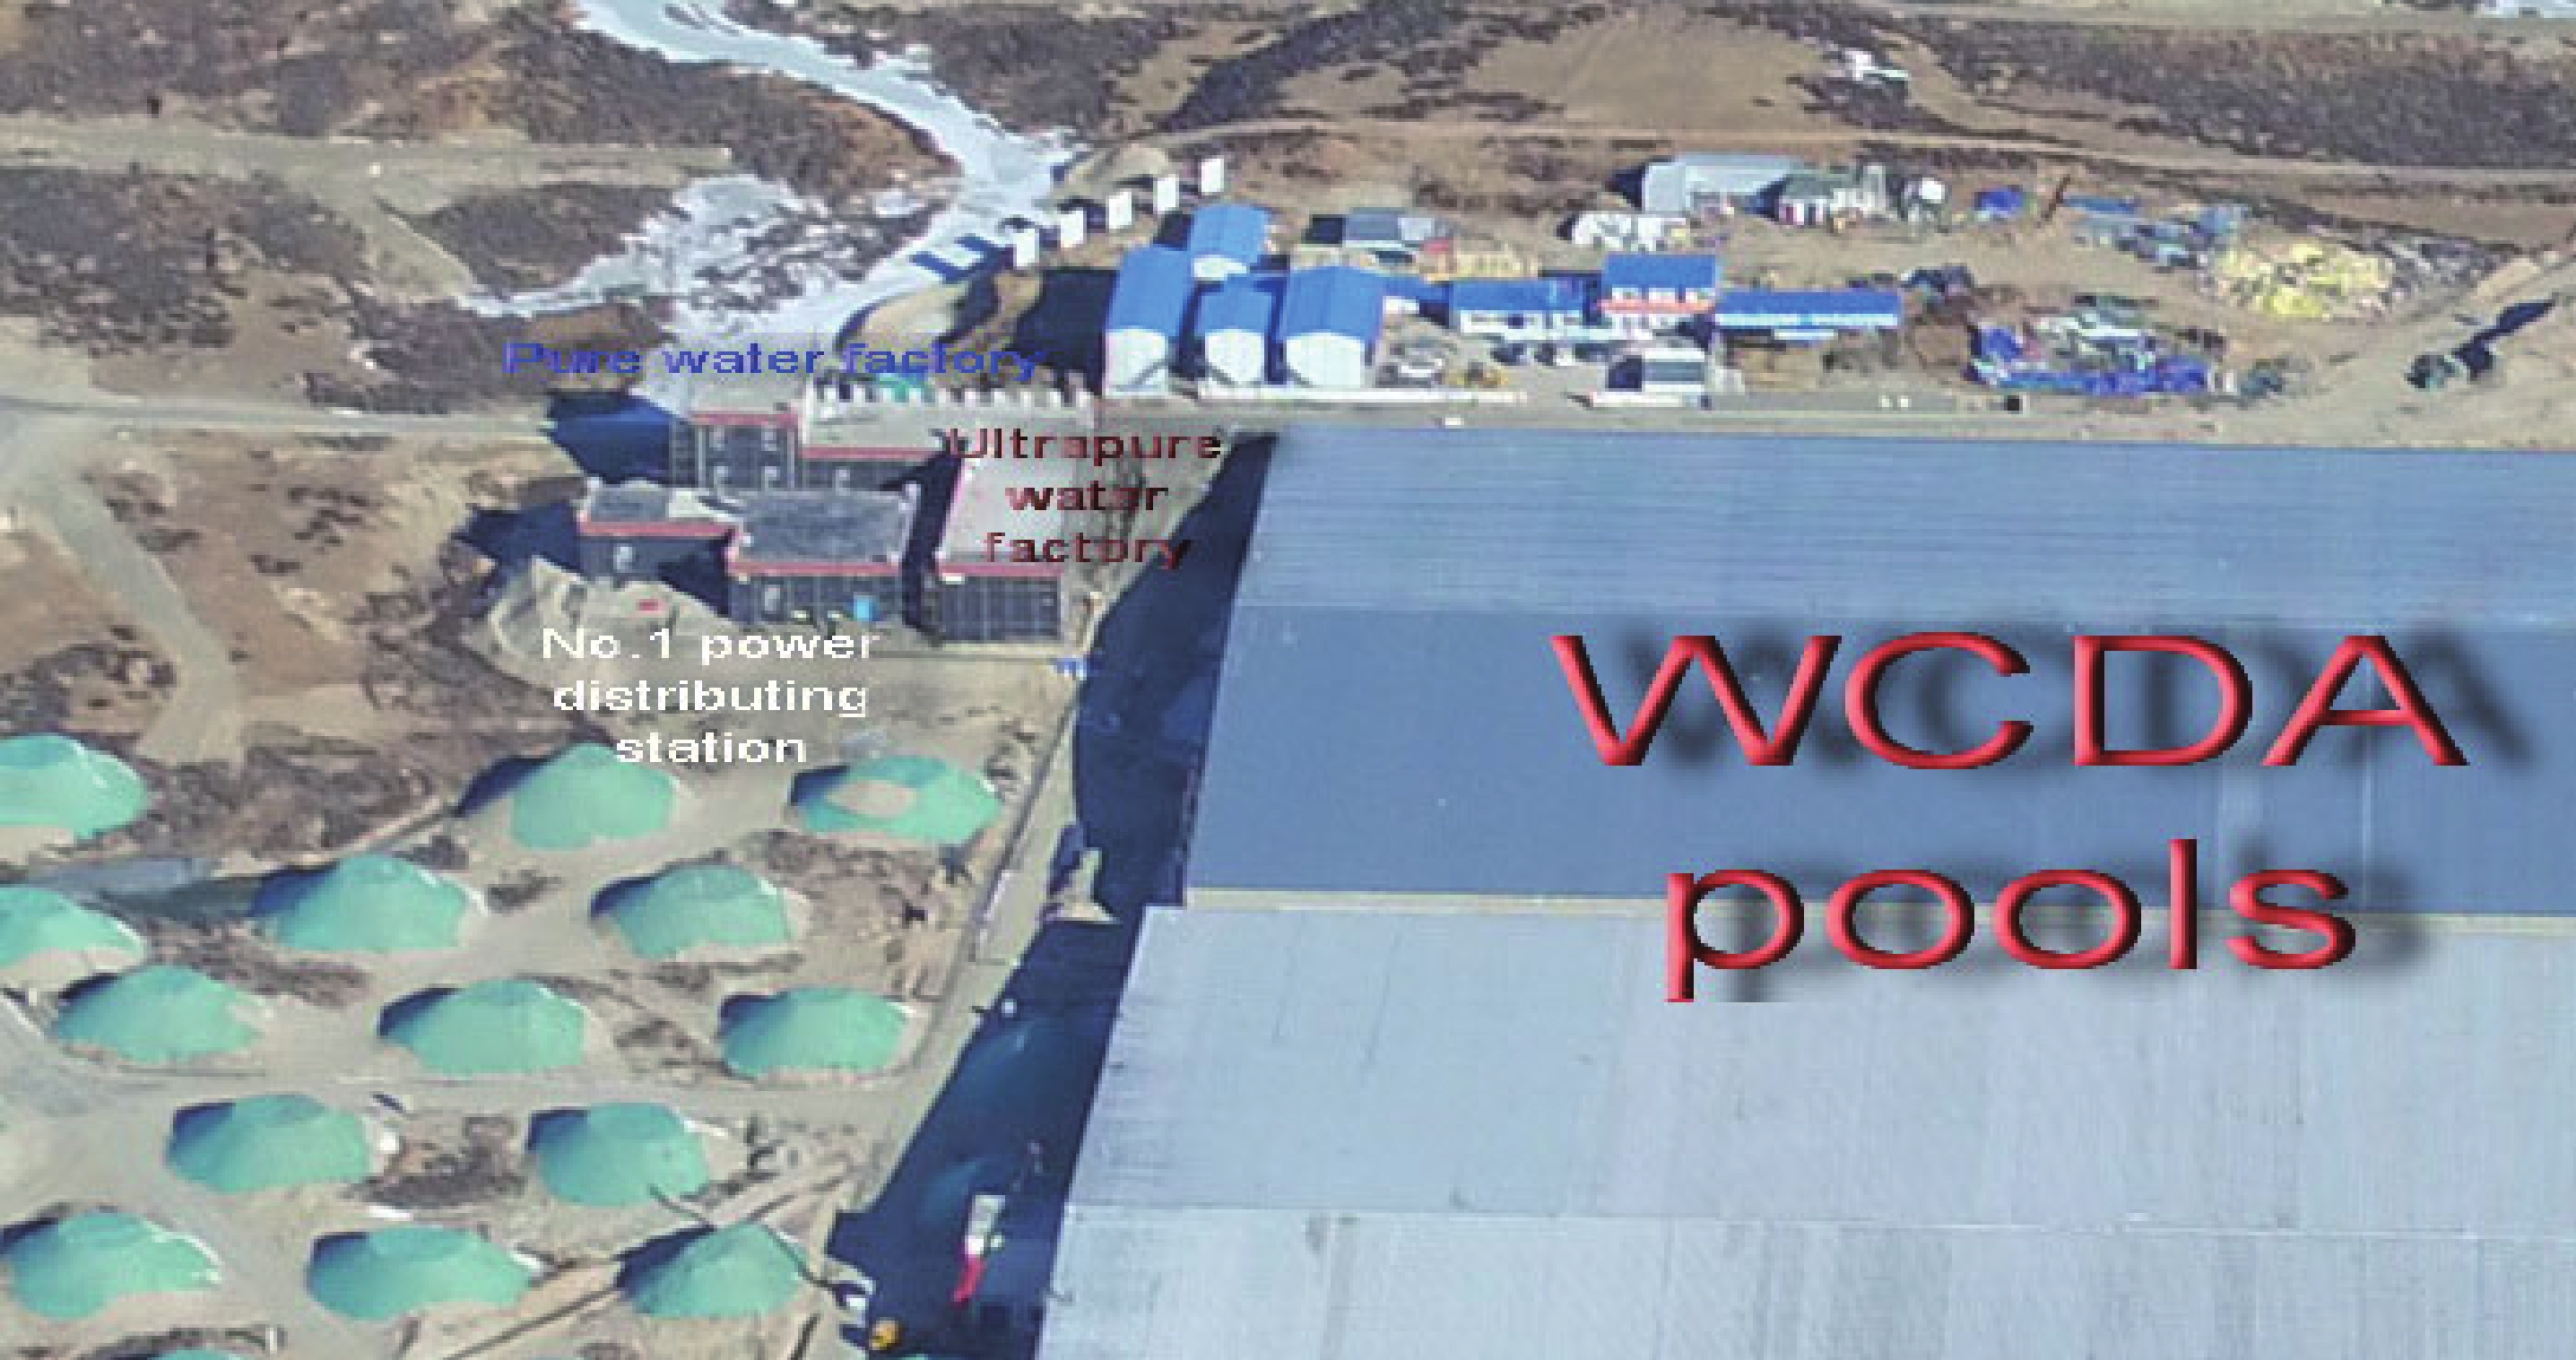
Figure 71. (color online) The water factories and No.1 power distributing station of LHAASO observatory (2019).
Four sets of water recycling and filtering systems are installed outside the WCDA pools at the same level as the bottom of the WCDA pools. Water naturally flowing out from the WCDA pools are pumped back after filtered and sterilized with UV light through the walls of the pools. Pool 1 and 2 have one for each respectively, while pool 3 has two of them located at both ends of the pool which is 300 m long.
Four control rooms are arranged on the second floor of those buildings. Central timing, clock distributing WR switches, data collecting network, high voltage power suppliers and water transparency monitoring system are hosted in the control room. The solo entrance of each pool with a door way equipped with air blowers is also located in the control room.
The WCDA pools are located at the center of the site. There are 3 pools. The pool 1 and 2 are both 150 m × 150 m. Pool 3 is 300 m × 110 m. The two smaller pools are at south-east and the bigger one is at north-west. The gap between the pool 1 and 2 is 2 m and they are 5 m apart from pool 3. Height of concrete walls of the pools is 5 m for holding the water in the pools. They all are covered by double layered roofs of steel sheets. The insulation layer which was made of polystyrene between the steel sheets is 120 mm thick. To prevent from oxidization of the steel roof and thus the pollution of water in the pool, all the inner surfaces of steel roof, structures and walls are completely painted with polyuria. The pillars have HDPE pipes covering their lower parts in water and the top ends of the pipes have been well sealed off. The bottom and the inner walls of the pools are fully covered by HDPE film with the thickness of 2 mm to prevent from water leakage. The HDPE film is conjoined with the pipes by soldering. Two layers of GCL (Geosynthetic Clay Liner) are put underneath the HDPE film at the bottom to protect the film from any possible damage due to the roughness of the ground inside the pools. They have a function of stopping further enlargement of any leakage once it happened after the water is filled up. The water leakage rate is designed to be less than 0.01% of the total capacity of each pool per day. To avoid freezing inside the pools, the walls of pools are insulated with polystyrene foam 110 mm thick. The foam is installed all the way from the top of walls down to the base 2.5 m under the ground. It has been observed during the winter starting from Nov. 2019 that the water temperature inside the pool drops 0.02 degree per day.
Chapter 1 LHAASO Instruments and Detector technology
- Received Date: 2021-12-02
- Available Online: 2022-03-15
Abstract: The Large High Altitude Air Shower Observatory (LHAASO) (


 DownLoad: