-
The top-quark was discovered in 1995 by the CDF and D0 Collaborations [1, 2]. The large mass of the top-quark and its large Yukawa coupling to the Higgs boson play a crucial role in testing the electroweak symmetry breaking mechanism and for searching for new physics beyond the SM. Owing to its large mass, the top-quark has a short lifetime, decaying well before hadronization occurs. The spin of the top-quark is transferred directly to its decay products, providing a unique platform for studying its primary QCD interactions. Thus, the determination of the value of the top-quark mass to a high precision is of great interest.
The top-quark mass is also a primary input parameter of the SM. For example,
● The stability of the quantum vacuum derived from the shape of the Higgs potential is very sensitive to the top-quark mass; thus, a precise value of the top-quark mass is required to predict the evolution of vacuum stability accurately [3, 4].
● The couplings of the top-quark to other particles are fixed through the gauge structure in the SM. The top-quark mass is related to the W-boson mass and Higgs-boson mass through radiative and loop corrections. Thus, a precise determination of these three masses provides an important test of the internal consistency of the SM.
Currently, the top-quark mass is inferred in two basic ways. The first approach employs kinematic observables sensitive to the top-quark mass; e.g., one can determine the top-quark mass from the kinematic reconstruction of the decay products of the top-quark. Such top-quark mass measurements are referred to as “MC mass” (
$ m_t^{\rm{MC}} $ ); the most precise determinations of the top-quark mass have been obtained in this approach. Recently, the CMS and ATLAS collaborations at the LHC have established the value,$ m_t^{\rm{MC}} = 172.26\pm0.61 $ GeV [5]. However, these direct kinematical determinations are not linked to the QCD Lagrangian top-quark mass in the specific renormalization scheme employed in theoretical predictions.An alternative approach employs the mass dependence of the cross-section calculated at next-to-next-to-leading order (NNLO) perturbative QCD (pQCD). The top-quark mass can be determined by comparing the measured cross-section with the fixed-order theoretical predictions. This method allows for the extractions of the top-quark mass in theoretically well-defined mass schemes, and the extracted mass can then be identified with the top-quark pole mass (
$ m_t^{\rm{pole}} $ ). Theoretical arguments suggest that the difference between MC mass$ m_t^{\rm{MC}} $ and pole mass$ m_t^{\rm{pole}} $ is approximately 1 GeV [6-8]. Notably, quarks are confined inside hadrons and have not been observed as physical particles. The notion of a quark mass relies on a theoretical definition. The pole mass is the renormalized quark mass in the on-shell (OS) scheme for the renormalization of the QCD Lagrangian.Significant efforts have been devoted to determining the pole mass,
$ m_t^{\rm{pole}} $ by comparing measurements with the predicted$ t\bar{t} $ production cross-section (see e.g., [9-16]). The Particle Data Group (PDG) currently provides the world average of the top-quark pole mass [17]:$ m_t^{\rm{pole}} = 172.4\pm0.7\; {\rm{GeV}}. $

(1) To provide maximal constraints on the top-quark pole mass, a key objective is to obtain a highly precise theoretical prediction for the top-quark pair production cross-section. The QCD prediction depends in detail on the choice of the renormalization scale,
$ \mu_r $ , controlling the QCD running coupling$ \alpha_s(Q^2). $ It has been conventional to either estimate the renormalization scale to represent the characteristic momentum flow Q of the pQCD process or to minimize the large logarithmic corrections in the pQCD series. For example, the renormalization scale can be chosen as the top-quark mass$ m_{t} $ to eliminate large logarithmic terms, such as$ \ln(\mu_r/m_{t}) $ ; the uncertainty from theory is then estimated by varying the estimated renormalization scale over an arbitrary range, e.g.,$ \mu_r\in[m_{t}/2, 2m_{t}] $ . This uncertainty in determining the renormalization scale is the main source of the uncertainty of the predicted top-quark pair production cross-section and thus the extracted top-quark pole mass.An essential principle of renormalization group invariance (RGI) is that a physical observable cannot depend on theoretical conventions, such as the choice of the renormalization scheme or the renormalization scale. The conventional procedure of estimating the renormalization scale introduces an inherent scheme-and-scale dependence for the pQCD predictions; thus, it violates the fundamental principle of RGI. Moreover, the perturbative series based on an estimated scale is in general factorially divergent at large orders, behaving as
$ \alpha_s^n \beta_0^n n! $ –the “renormalon” problem [18] where$ \beta_n $ determines the logarithmic evolution of$ \alpha_s $ . Furthermore, the theoretical error estimated by simply varying$ \mu_r $ over an arbitrary range is an unreliable and arbitrary estimate, as it only partly reflects the unknown and factorially divergent perturbative contributions from the nonconformal terms, and it has no sensitivity to the conformal contributions. The conventional procedure of estimating the renormalization scale is also inconsistent with the well-known Gell-Mann-Low procedure [19], which determines the renormalization scale rigorously and unambiguously in quantum electrodynamics (QED).The principle of maximum conformality (PMC) [20-24] provides a systematic way to eliminate the renormalization scheme and renormalization scale uncertainties in non-Abelian pQCD predictions. The PMC is the underlying principle for the well-known Brodsky-Lepage-Mackenzie approach [25], generalizing the BLM procedure to all orders in
$ \alpha_s $ . The PMC scales are determined at each order in pQCD by simply absorbing all the$ \beta $ terms that govern the behavior of the running coupling in the renormalization group equation (RGE). After applying PMC scale-setting, the resulting pQCD series matches the corresponding conformal series with$ \beta = 0 $ . As the divergent$ n! $ renormalon terms do not appear, the convergence of the pQCD series is greatly improved. As the PMC predictions do not depend on an arbitrary choice of the renormalization scheme, the PMC scale-setting satisfies all the principles of RGI [26-28]. The application of the PMC for QCD reduces to the Gell-Mann-Low scale setting for QED in the Abelian limit ($ N_C \to 0 $ at fixed$ C_F $ ) where the running coupling sums all the vacuum polarization insertions. After applying the PMC, there is some residual scale dependence due to the uncalculated higher-order perturbative terms; however, unlike conventional renormalization scale-setting, this source of theoretical error is highly suppressed [28].The PMC has been successfully applied to several high-energy processes. We have shown that a comprehensive, self-consistent pQCD explanation of both the top-quark pair production cross-section and the top-quark pair forward-backward asymmetry measured at the Tevatron and LHC can be obtained by applying the PMC [29-33]. Due to the elimination of the renormalization scale ambiguity, the PMC predictions have much less uncertainties compared with the conventional predictions. We have previously obtained precise values for the top-quark pole mass:
$ m^{\rm{pole}}_t = 173.7\pm1.5 $ GeV and$ 174.2\pm1.7 $ GeV from measurements at the LHC with$ \sqrt{s} = 7 $ and$ 8 $ TeV, respectively [34]. Highly precise top-quark pair production cross-sections have now been measured at the LHC at$ \sqrt{S} = 13 $ TeV (see e.g., [10, 12, 13, 35-40]). The precision of some experimental measurements is even higher than that of theoretical predictions. Thus, it is of interest to reanalyze the top-quark pair production cross-section and to provide an improved prediction by using the PMC. The top-quark pole mass can then be determined via a detailed comparison of the production cross-section with the experimental measurement given by the LHC with$ \sqrt{S} = 13 $ TeV. Thus, the PMC analysis provides an important high-precision test of the consistency of pQCD and the SM at$ \sqrt{S} = 13 $ TeV with the LHC measurements at lower CM energies.The remaining sections of this paper are organized as follows. In Sec. II, we calculate the top-quark pair production cross-section by applying the PMC and compare our PMC predictions with the experimental measurement; we discuss uncalculated higher-order contributions for the top-quark pair production cross-section. The resulting precise determination of the top-quark pole mass from the measured
$ t\bar{t} $ production cross-section at$ \sqrt{S} = 13 $ TeV is presented in Sec. III and compared with determinations at lower CM energies. Section IV presents the summary of the paper. -
According to the QCD factorization for inclusive processes at leading twist, the cross-section for the top-quark pair production
$ p p \to t \bar t X $ can be expressed as the cross-section for the hard scattering parton-parton subprocess weighted by the parton distribution functions (PDFs) of the partons participating in the scattering processes; i.e.,$ \sigma_{H_1 H_2 \to {t\bar{t} X}} = \sum\limits_{i,j} \int\limits_{4m_{t}^2}^{S}\, {\rm d}s \,\, {\cal{L}}_{ij}(s, S, \mu_f) \hat \sigma_{ij}(s,\alpha_s(\mu_r),\mu_r,\mu_f), $

(2) where the parton luminosities
$ {\cal{L}}_{ij} $ ,$ {\cal{L}}_{ij}(s, S, \mu_f) = {1\over S} \int\limits_s^S {{\rm d}\hat{s}\over \hat{s}} f_{i/H_1}\left(x_1,\mu_f\right) f_{j/H_2}\left(x_2,\mu_f\right). $

The parameters
$ \mu_f $ and$ \mu_r $ are the factorization and renormalization scales, respectively, S denotes the hadronic center-of-mass energy squared, and$ s = x_1 x_2 S $ is the subprocess center-of-mass energy squared, where$ x_1 = {\hat{s} / S} $ and$ x_2 = {s / \hat{s}} $ . The PDFs$ f_{i/H_{\alpha}}(x_\alpha,\mu_f) $ ($ \alpha = 1 $ or$ 2 $ ) are the universal functions that describe the probability of finding a parton of type i with light-front momentum fraction between$ x_\alpha $ and$ x_{\alpha} +dx_{\alpha} $ in the proton$ H_{\alpha} $ .The partonic subprocess cross-section
$ \hat{\sigma}_{ij} $ can be computed order-by-order as a series expansion in powers of$ \alpha_s(\mu_r) $ . The QCD radiative corrections up to next-to-next-to-leading order (NNLO) have been calculated in Refs. [41-45]. The pQCD coefficients at the NNLO can also be obtained by using the HATHOR program [46] and the Top++ program [47].A detailed PMC analysis for the top-quark pair production cross-section up to the NNLO level has been given in Refs. [29, 30], and is therefore not repeated in this paper. In this study, we calculated the top-quark pair production cross-section at the LHC with
$ \sqrt{S} = 13 $ TeV following a similar procedure. For brevity, we will use$ m_t $ to represent$ m_t^{\rm{pole}} $ hereafter. To perform the numerical calculation, we initially take the top-quark pole mass as$ m_t = 173.3 $ GeV [48], and utilize the CT14 parton distribution functions [49]. The running coupling is evaluated in the$ \overline{\rm{MS}} $ scheme from$ \alpha_s(M_Z) = 0.118 $ .After applying the PMC, the PMC scales are determined by absorbing all the
$ \beta $ terms that govern the behavior of the running coupling in the RGE. The renormalization scale uncertainty is eliminated. The determination of factorization scale is a separate issue and its dependence exists even for conformal theories. However, the factorization scale uncertainty can be suppressed for the top-quark pair production after using the PMC to obtain the corresponding conformal series with$ \beta = 0 $ [32]. The factorization scale dependence can be resolved by matching the perturbative prediction with the nonperturbative bound-state dynamics [50]. At present, we adopt the usual convention of choosing the factorization scale$ \mu_f = m_t $ .If one applies conventional scale setting, the total top-quark pair production cross-section is
$ \sigma_{t\overline{t}}|_{\rm{Conv.}} = 777.7^{+14.6}_{-30.8} $ pb, where its uncertainty is estimated by varying the scale$ \mu_r\in[m_t/2, 2m_t] $ . The estimated renormalization scale uncertainty for the total top-quark pair production cross-section is relatively small, due to accidental cancelations among the contributing terms at different orders. The renormalization scale uncertainty is rather large for each perturbative term. Thus, fixing the renormalization scale as$ m_t $ appears to provide a reasonable prediction for the total top-quark pair production cross-section; however, one cannot identify the QCD correction at each perturbative order. For example, the scale uncertainty of next-to-leading order (NLO) QCD correction terms for the$ (q\overline{q}) $ -channel, which provides the dominant component of the top-quark pair asymmetry, reaches 138% by varying the scale$ \mu_r\in[m_t/2, 2m_t] $ [33]. Simply fixing the renormalization scale at$ \mu_r = m_t $ also leads to a small top-quark pair asymmetry, well below the data.In fact, the magnitude of uncalculated higher-order pQCD corrections for the top-quark pair production cross-section is usually estimated by varying the renormalization scale in the range of
$ \mu_r\in[m_t/2,2m_t] $ . This ad hoc method only provides a rough estimate of the uncalculated nonconformal$ \beta $ terms at higher orders; however, it has no sensitivity to the conformal contributions at the same order. This is because the conformal contributions have no dependence on the renormalization scale. There are some typical examples to illustrate the unreliability of error estimates using this conventional method, for example, the hadroproduction of the Higgs boson via gluon-gluon fusion at the NNLO level [51, 52] and the event shape observables in electron-positron collisions [53], especially for two classic event shapes, the thrust and the C-parameter [54]. The top-quark pair production cross-section at the LO level also illustrates the unreliability of the conventional error estimates, which is shown in the following text.More explicitly, the pQCD corrections for the top-quark pair production cross-section up to the nth-order level can be expanded in the powers of the coupling constant,
$ \sigma_{t\overline{t}}|_n = \sum^{n} \limits_{i = {1}} {\cal{C}}_i\; a_s^{i+1}(\mu_r) , $

(3) where
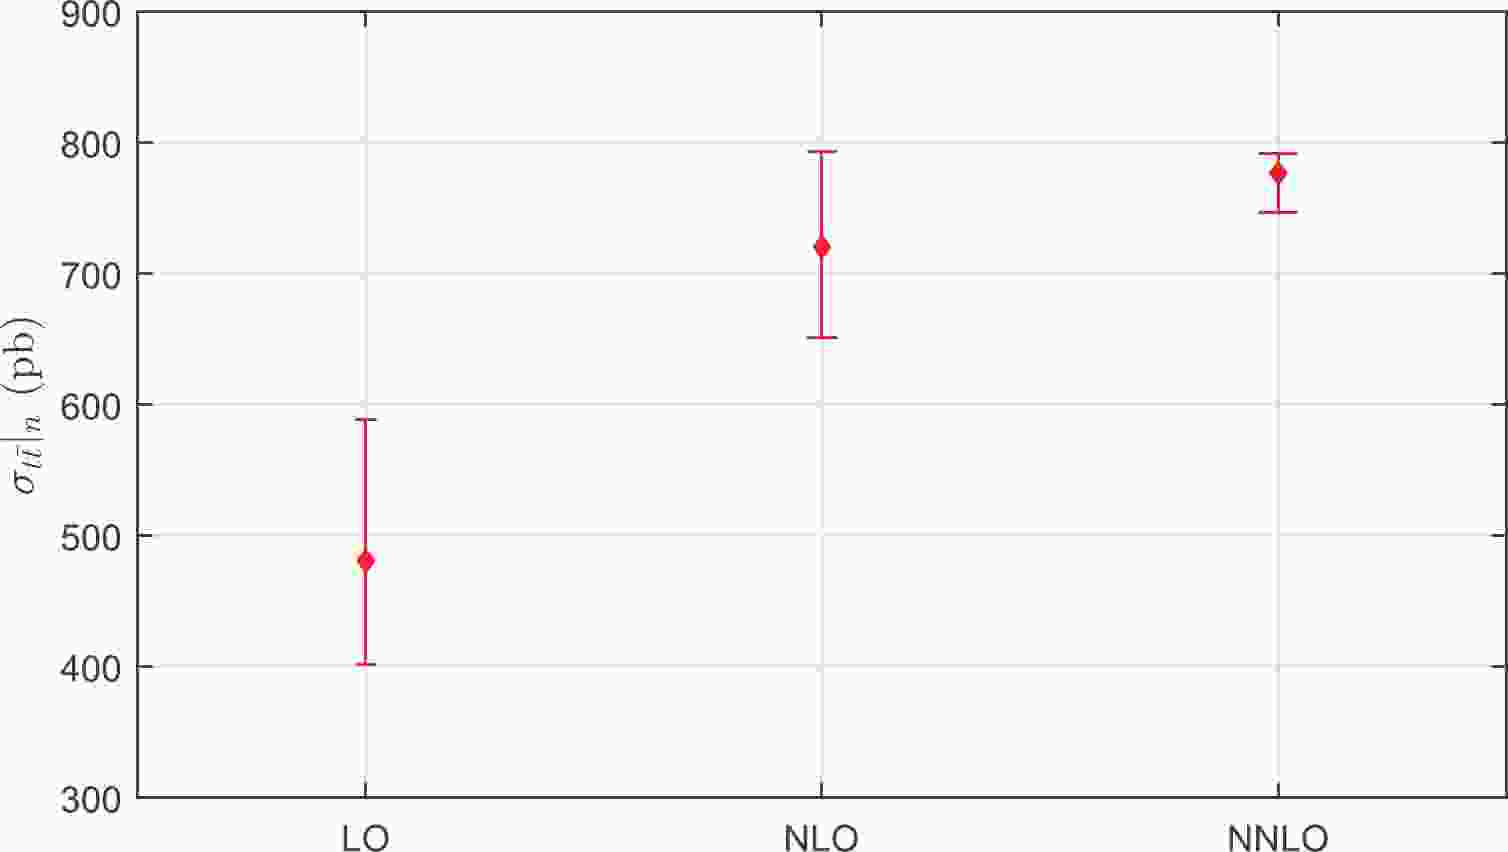
$ {\cal{C}}_i $ is the ith-order QCD correction coefficient, and$ n = 1,2,3 $ correspond to the QCD corrections at the LO, NLO, and NNLO levels, respectively. The conventional estimates of uncalculated higher-order pQCD corrections obtained by varying$ \mu_r\in[m_t/2,2m_t] $ are presented in Fig. 1. We can observe from Fig. 1 that the true NNLO cross-section$ \sigma_{t\overline{t}}|_{\rm{NNLO}} $ , together with its error bar, is within the predicted NNLO values from the NLO calculation. However, the true NLO cross-section$ \sigma_{t\overline{t}}|_{\rm{NLO}} $ , together with its error bar, is outside the predicted NLO values from the LO calculation. This is also presented by independently varying the renormalization scale and the factorization scale in Ref. [55]. Thus, the conventional way of estimating the magnitude of uncalculated higher-order contributions by varying$ \mu_r\in[m_t/2,2m_t] $ is invalid for the top-quark pair production at the LO level.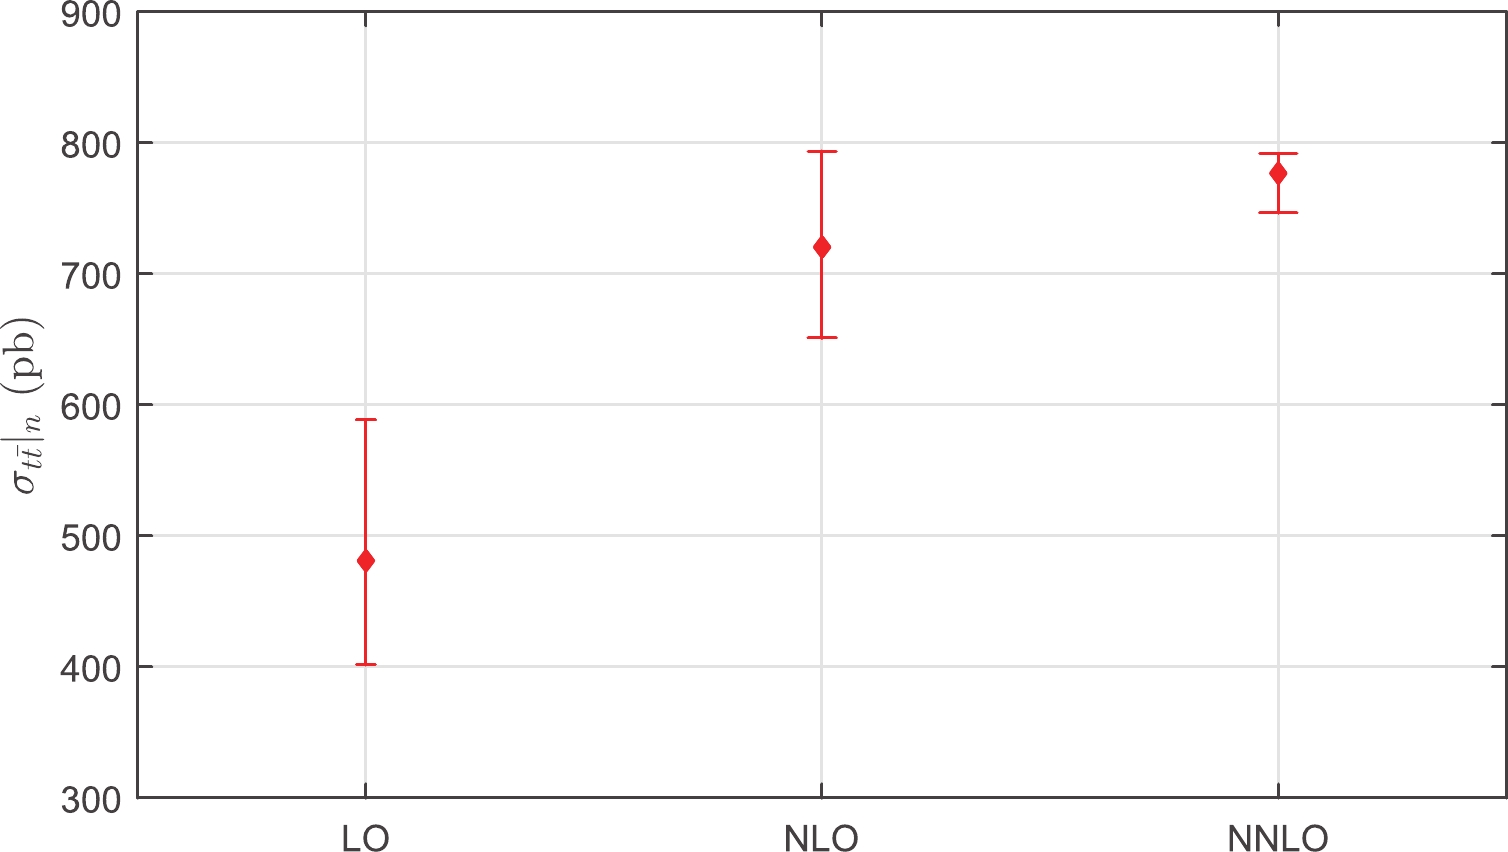
Figure 1. (color online) Conventional estimates of uncalculated higher-order pQCD corrections, which are obtained by varying
$ \mu_r\in[m_t/2,2m_t] $ in all known lower-order terms. Here,$ n = 1,2,3 $ correspond to the QCD corrections at the LO, NLO, and NNLO levels, respectively.After using the PMC scale setting, the situation is different. The PMC scales are determined unambiguously, and they are independent of the choice of the initial scale. The resulting PMC series matches the conformal series with
$ \beta = 0 $ , and a slight change of the PMC scales will break the conformal invariance and thus may lead to large effects [30, 56]. Thus, we cannot simply vary the PMC scales to estimate the magnitude of uncalculated higher-order pQCD corrections, and the conventional way of varying the scales is not applicable to PMC predictions. Notably, an estimate of uncalculated higher-order contributions can be characterized by the convergence of the perturbative QCD series and the magnitude of the last-known higher-order term. We adopted a more conservative method for estimating the uncalculated higher-order terms for PMC predictions [27]. The PMC error estimate is defined to match the value of the contribution from the last-known higher-order term. This error estimate is natural for the PMC scale setting, because after the PMC, the main uncertainty is from the last term at this order with its unfixed PMC scale. As the renormalization scale uncertainty is rather large for each perturbative term, this approach for the error estimate cannot be applied to conventional scale setting.More explicitly, after applying the PMC, the top-quark pair production cross-section (3) changes to
$ \sigma_{t\overline{t}}|_n = \sum^{n} \limits_{i = {1}} {\tilde{\cal{C}}}_i\; a_s^{i+1}(Q^{\rm{PMC}}_i) , $

(4) where
$ {\tilde{\cal{C}}}_i $ and$ Q^{\rm{PMC}}_i $ are the ith-order conformal coefficient and PMC scale, respectively. The PMC estimate of uncalculated higher-order contributions for an ith-order calculation is$ \pm|{\tilde{\cal{C}}}_i\; a_s^{i+1}(Q^{\rm{PMC}}_i)|_{\rm{MAX}} $ , where both$ {\tilde{\cal{C}}}_i $ and$ a_s^{i+1}(Q^{\rm{PMC}}_i) $ are calculated by varying the scale$ \mu_r\in[m_t/2,2m_t] $ and the symbol “MAX” stands for the maximum value of$ |{\tilde{\cal{C}}}_i\; a_s^{i+1}(Q^{\rm{PMC}}_i)| $ within this region.The PMC estimates of uncalculated higher-order pQCD corrections for the top-quark pair production cross-section are presented in Fig. 2. In contrast to the conventional way of varying the scale in the range of
$ \mu_r\in[m_t/2,2m_t] $ , Fig. 2 shows that the higher-order cross-sections, together with their error bars, using the PMC are consistently within the predicted cross-sections defined from the lower-order calculations. Moreover, the predicted uncalculated higher-order contributions quickly approach stability. In fact, the prediction of PMC calculations that the magnitudes of higher-order PMC predictions are well within the error bars predicted from the known lower-order has been demonstrated in several high-energy processes, for example, the Higgs decay to b-quark pair$ \Gamma({\rm{Higgs}}\rightarrow b\bar{b}) $ [27] and two gluon$ \Gamma({\rm{Higgs}}\rightarrow gg) $ [57] processes, the ratio for electron-positron annihilation into hadrons$ R(e^{+}e^{-}) $ [27], and the Z boson decay to hadrons$ \Gamma(Z\rightarrow \rm{hadron}) $ process [58].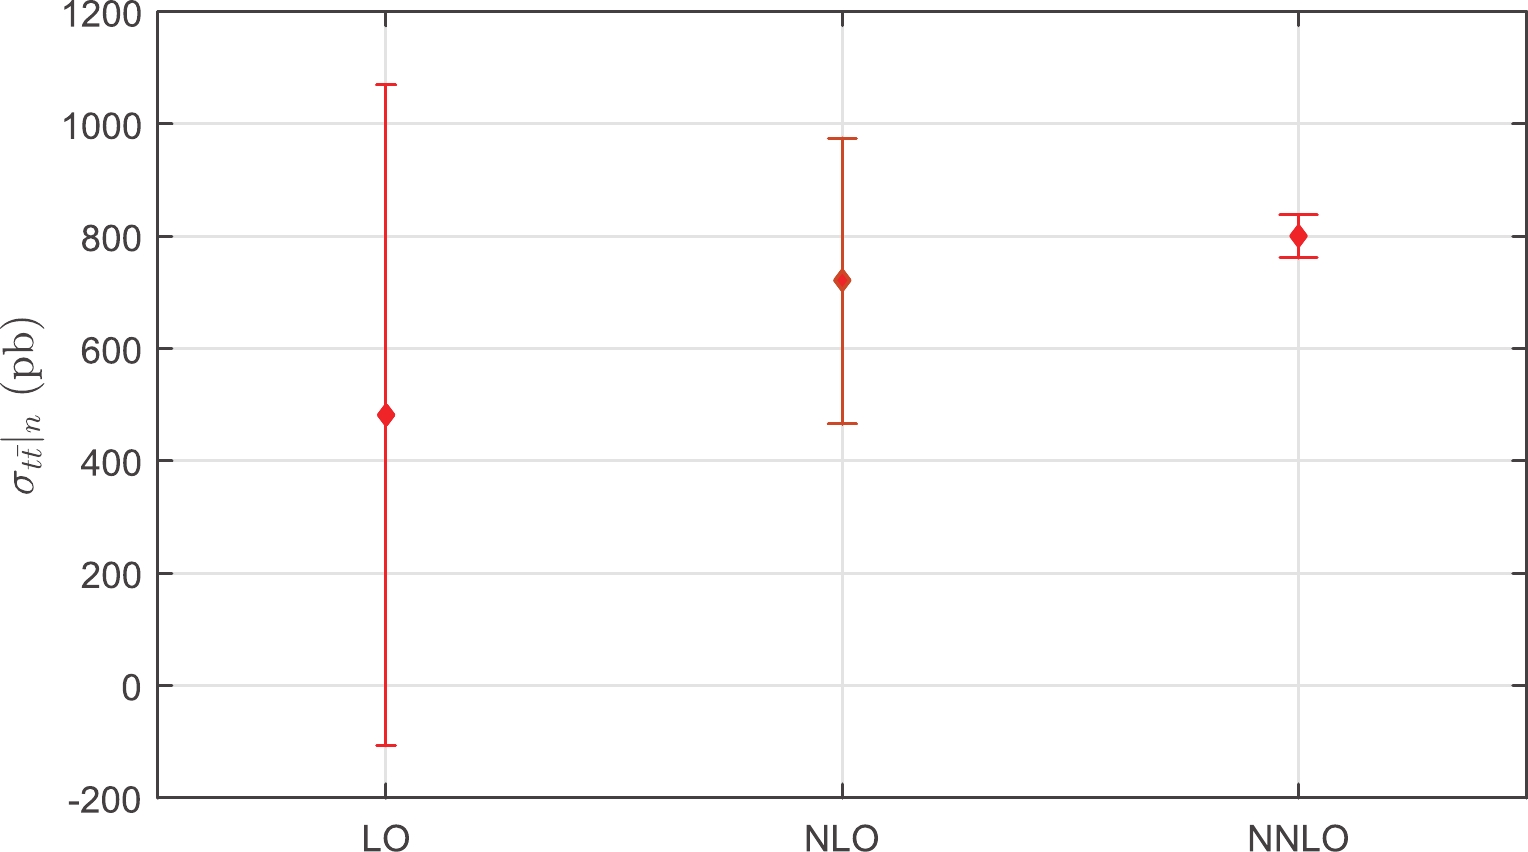
Figure 2. (color online) PMC estimates of uncalculated higher-order pQCD corrections, which are taken as
$ \pm|{\tilde{\cal{C}}}_i\; a_s^{i+1}(Q^{\rm{PMC}}_i)|_{\rm{MAX}} $ , where the symbol “MAX” stands for the maximum value of$ |{\tilde{\cal{C}}}_i\; a_s^{i+1}(Q^{\rm{PMC}}_i)| $ within the region$ \mu_r\in[m_t/2,2m_t] $ . Here$ n = 1,2,3 $ correspond to the QCD corrections at the LO, NLO, and NNLO levels, respectively.When one applies PMC scale-setting, the renormalization scales at each order are determined by absorbing the
$ \beta $ terms that govern the behavior of the QCD running coupling via the RGE. The resulting total top-quark pair production cross-section is$ \sigma_{t\overline{t}}|_{\rm{PMC}} = 807.8 $ pb for a wide range of the initial choice of scale$ \mu_r $ . The scale errors for both the total production cross-section and the individual cross-sections at each perturbative order are simultaneously eliminated. Some residual scale dependence will remain owing to uncalculated higher-order perturbative terms beyond the NNLO. Unlike the conventional renormalization scale dependence, this scale dependence is negligibly small.We present a comparison of the PMC prediction with the LHC measurements [10, 12, 13, 35-40] of the top-quark pair production cross-section at
$ \sqrt{S} = 13 $ TeV in Fig. 3. The theoretical error band is estimated by using the CT14 error PDF sets [49] with the range of$\alpha_s(M_Z)\in $ $ [0.117, 0.119]$ , as in Ref. [11], and the uncertainty of 1.5% from the LHC beam energy [36]. Figure 3 shows that the PMC prediction for the total top-quark pair production cross-section for$ \sqrt{S} = 13 $ TeV agrees well with all the corresponding LHC measurements.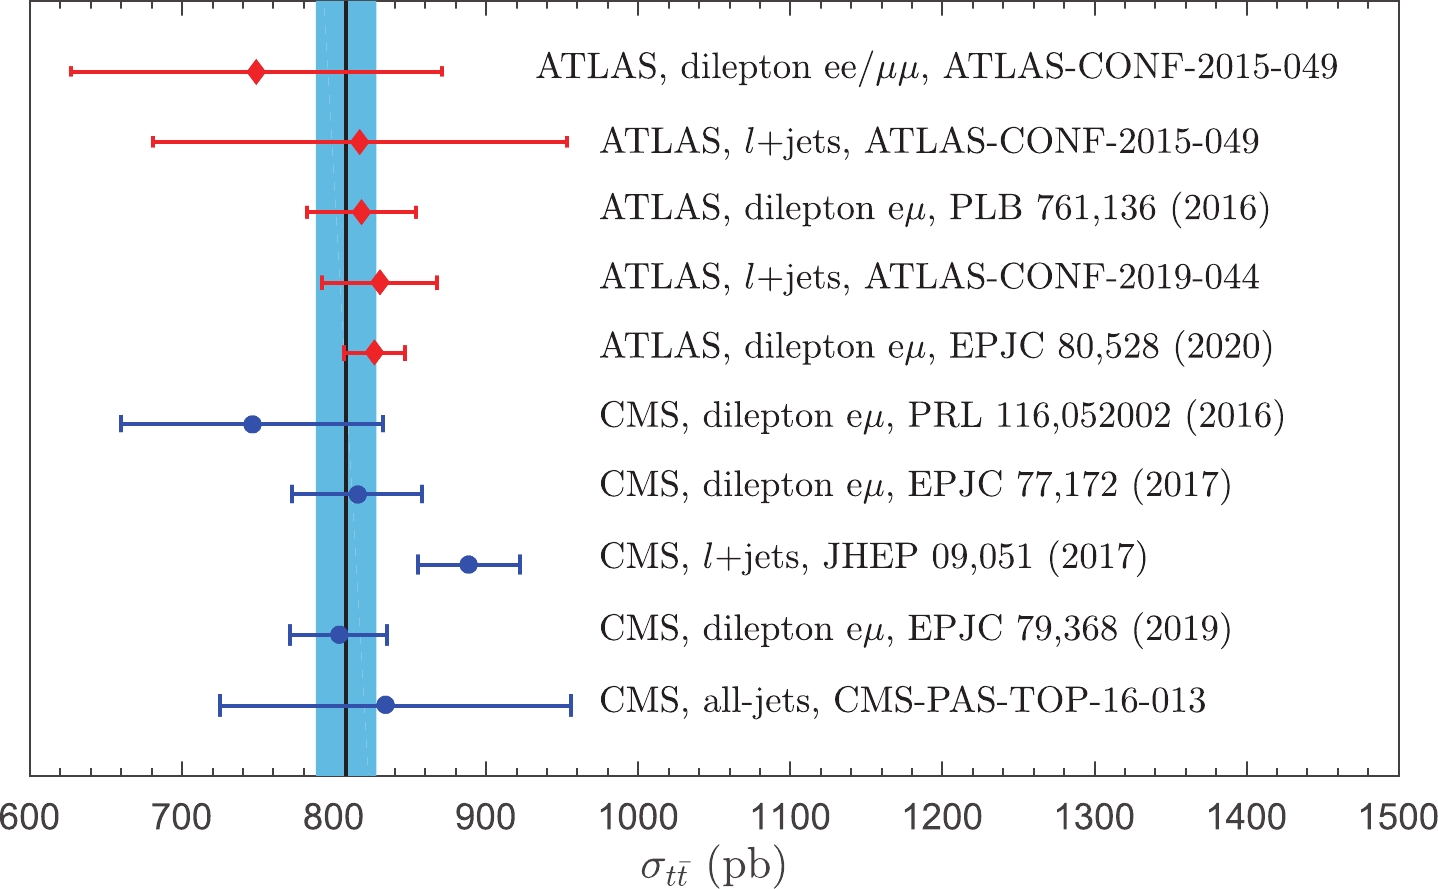
Figure 3. (color online) Comparison of the PMC prediction with the LHC measurements [10, 12, 13, 35-40] for the top-quark pair production cross-section at
$ \sqrt{S} = 13 $ TeV, where the theoretical error band is estimated by using the CT14 error PDF sets [49] with the range of$ \alpha_s(M_Z)\in [0.117, 0.119] $ and the uncertainty of 1.5% from the LHC beam energy [36].As the experimental uncertainties correlated between the two center-of-mass energies cancel out for the ratio of total cross-sections, more precise results are obtained in comparison with the individual measurements. We calculate the cross-section ratios by the PMC and obtain
$ R_{13/7} = 4.61\pm0.15 $ and$ R_{13/8} = 3.24\pm0.10 $ , which are presented in Table 1. The predicted cross-section ratios show excellent agreement with the latest ATLAS measurement [10].Measured cross-section ratio [10] PMC prediction $ R_{13/7} $ 

$ 4.54\pm0.08\pm0.10\pm0.12 $ 

$ 4.61\pm0.15 $ 

$ R_{13/8} $ 

$ 3.42\pm0.03\pm0.07\pm0.10 $ 

$ 3.24\pm0.10 $ 

Table 1. Predicted cross-section ratios
$ R_{13/7} = \sigma^{13\;{\rm{TeV}}}_{t\bar{t}}/ $ $ \sigma^{7\;{\rm{TeV}}}_{t\bar{t}} $ and$ R_{13/8} = \sigma^{13\;{\rm{TeV}}}_{t\bar{t}}/\sigma^{8\;{\rm{TeV}}}_{t\bar{t}} $ . The measured cross-section ratios are taken from Ref. [10] as a comparison. -
The top-quark pole mass can be extracted from the comparison of the pQCD prediction of the top-quark pair production cross-section with the corresponding measurements. As the precise theoretical prediction for the top-quark pair production cross-section is obtained by using the PMC, we can provide maximal constraints on the top-quark pole mass.
We first parametrize the dependence of the
$ t\bar{t} $ production cross-section on the top-quark pole mass using the following form [59]:$ \begin{aligned}[b] \sigma_{t\bar{t}}(m_t) =& \left(\frac{172.5}{m_t/{\rm{GeV}}}\right)^4\left(c_0+c_1\left(\dfrac{m_t}{\rm{GeV}}-172.5\right) \right. \\ &\left.+c_2\left(\dfrac{m_t}{\rm{GeV}}-172.5\right)^2+c_3\left(\dfrac{m_t}{\rm{GeV}}-172.5\right)^3\right), \end{aligned} $

(5) where the masses are given in units of GeV, and the coefficients
$ c_{0,1,2,3} $ are determined from the PMC predictions for the top-quark pair cross-section over a wide range of$ m_t $ [34]. The renormalization scale uncertainty for the$ t\bar{t} $ production cross-sections is eliminated using the PMC, and thus has less uncertainty compared with the conventional predictions.To extract a reliable top-quark pole mass, we define a likelihood function [60]
$ f(m_t) = \int^{+\infty}_{-\infty} f_{\rm{th}}(\sigma|m_t)\cdot f_{\rm{exp}}(\sigma|m_t){\rm d}\sigma, $

(6) where the functions
$ f_{\rm{th}}(\sigma|m_t) $ and$ f_{\rm{exp}}(\sigma|m_t) $ are normalized Gaussian distributions for the predicted and measured$ t\bar{t} $ production cross-sections, respectively. These two functions can be written as$ f_{\rm{th}}(\sigma|m_t) = \frac{1}{\sqrt{2\pi}\Delta \sigma_{\rm{th}}(m_t)} \exp \left[-\frac{\left(\sigma-\sigma_{\rm{th}}(m_t)\right)^2} {2\left(\Delta\sigma_{\rm{th}}(m_t)\right)^2}\right], $

(7) $ f_{\rm{exp}}(\sigma|m_t) = \frac{1}{\sqrt{2\pi}\Delta \sigma_{\rm{exp}}(m_t)} \exp{ \left[-\frac{\left(\sigma-\sigma_{\rm{exp}}(m_t)\right)^2} {2\left(\Delta\sigma_{\rm{exp}}(m_t)\right)^2}\right]}. $

(8) Here,
$ \sigma_{\rm{th}}(m_t) $ and$ \sigma_{\rm{exp}}(m_t) $ represent the predicted and measured$ t\bar{t} $ production cross-sections, respectively, and the corresponding uncertainties are represented by$ \Delta \sigma_{\rm{th}}(m_t) $ and$ \Delta \sigma_{\rm{exp}}(m_t) $ . The central value of the top-quark pole mass is extracted from the maximum of the likelihood function in Eq. (6), and the corresponding error ranges are obtained from 68% of the area around the maximum of the likelihood function.We present the top-quark pair production cross-sections at
$ \sqrt{S} = 13 $ TeV as a function of the top-quark pole mass$ m_t $ in Fig. 4, where the thinner shaded band represents the predicted$ t\bar{t} $ production cross-section$ \sigma_{\rm{th}}(m_t) $ and the corresponding uncertainty$ \Delta \sigma_{\rm{th}}(m_t) $ ; the thicker shaded band represents the current most precise experimental measurement cross-section$ \sigma_{\rm{exp}}(m_t) $ and the corresponding uncertainty$ \Delta \sigma_{\rm{exp}}(m_t) $ [10]. The dashed, dotted, and dash-dot lines are experimental measurements$ \sigma_{\rm{exp}}(m_t) $ for the dilepton channel [36, 39] and the lepton + jets channel [37], respectively. The upper and lower lines are the corresponding uncertainties. To extract a reliable top-quark pole mass, the uncertainty$ \Delta \sigma_{\rm{th}}(m_t) $ should include all the theoretical errors, such as$ \alpha_s $ , PDFs, and renormalization and factorization scales. After using the PMC, the renormalization scale uncertainty is eliminated and the factorization scale uncertainty can be suppressed for the top-quark pair production. The$ \alpha_s $ + PDF uncertainty is estimated by using the CT14 error PDF sets with the range of$ \alpha_s(M_Z)\in [0.117, 0.119] $ , as in Ref. [11]. Additionally, the uncertainty of 1.5% from the LHC beam energy is assigned to the predicted cross-section [36].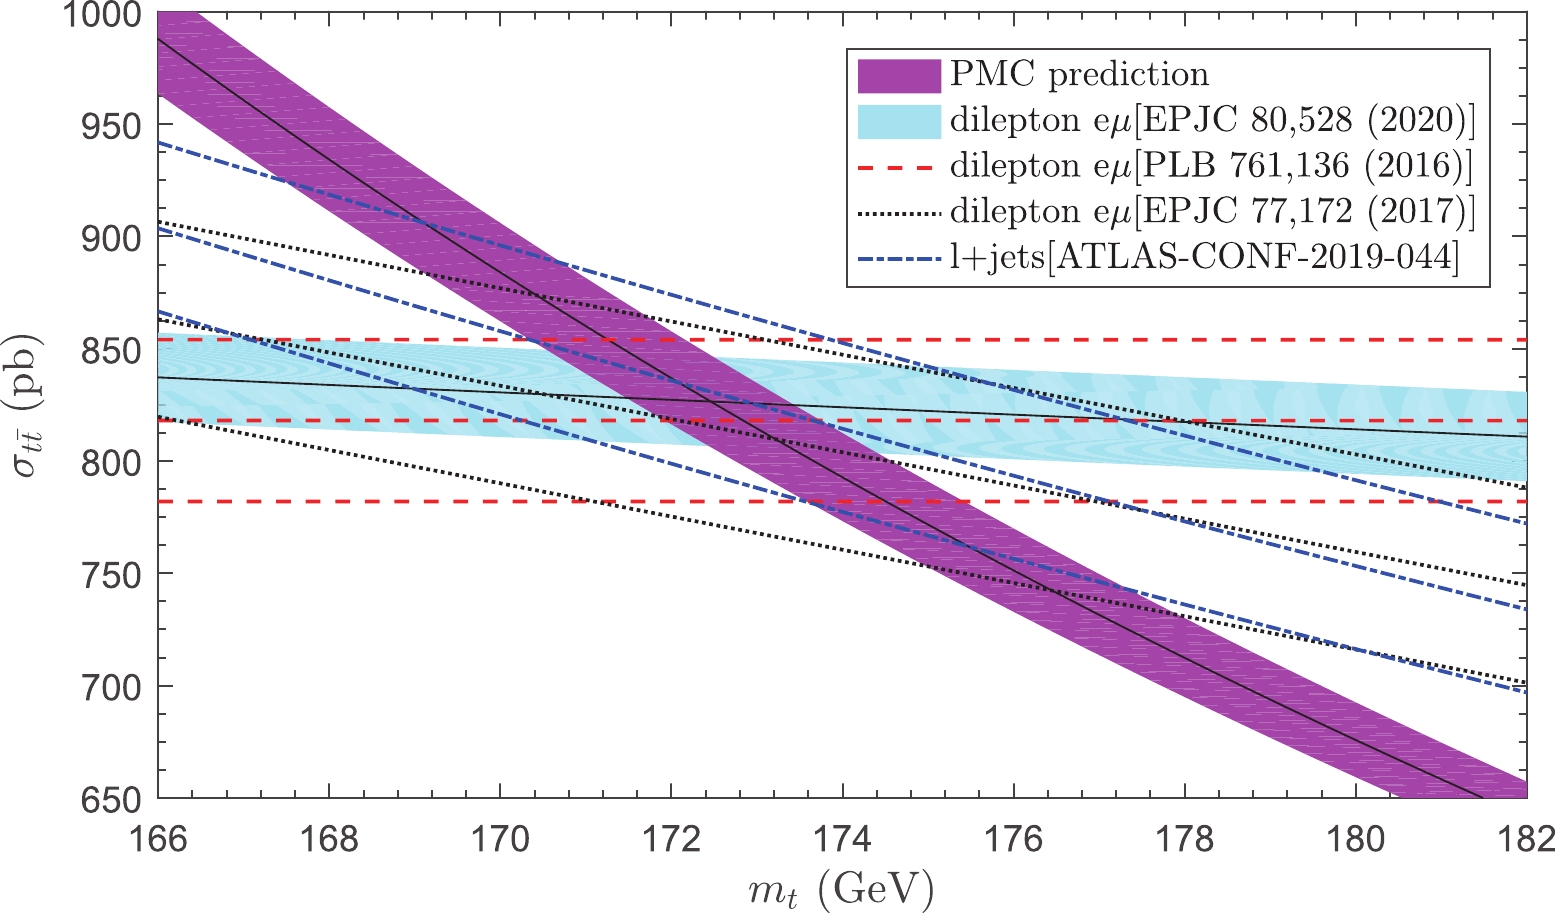
Figure 4. (color online) Top-quark pair production cross-sections at
$ \sqrt{S} = 13 $ TeV as a function of the top-quark pole mass$ m_t $ , where the thinner shaded band represents the predicted$ t\bar{t} $ production cross-section$ \sigma_{\rm{th}}(m_t) $ with the corresponding uncertainty$ \Delta \sigma_{\rm{th}}(m_t) $ , which is estimated by using the CT14 error PDF sets with the range of$ \alpha_s(M_Z)\in [0.117, 0.119] $ and the uncertainty of 1.5% from the LHC beam energy; the thicker shaded band represents the current most precise experimental measurement cross-section$ \sigma_{\rm{exp}}(m_t) $ and the corresponding uncertainty$ \Delta \sigma_{\rm{exp}}(m_t) $ [10]. The dashed, dotted, and dash-dot lines are experimental measurements for the dilepton channel [36, 39] and the lepton + jets channel [37], respectively. The upper and lower lines are the corresponding uncertainties.Note that the mass parameter used to characterize the dependence of the measured cross-section on the top-quark mass is the MC mass rather than the pole mass. However, as the mass dependence of the measured cross-sections is very small, as shown by Fig. 4, and the MC and pole masses differ by approximately 1 GeV [6-8], this approximation causes negligible bias for the determination of the top-quark pole mass. Thus, the intersection of the theoretical and experimental curves shown in Fig. 4 provides an unambiguous extraction of the top-quark pole masses.
By using the experimental measurements for the dilepton channel [10, 36, 39] and the lepton + jets channel [37] as the input for
$ f_{\rm{exp}}(\sigma|m_t) $ , and then evaluating the likelihood function (6), the resulting top-quark pole masses are presented in Table 2. As observed, the top-quark pole masses obtained from different channels show good consistency. As the measurements for the dilepton channel in Refs. [10, 36] are more precise and have less dependence on the top-quark mass compared with the measurements in Refs. [37, 39], the precision of the top-quark pole masses obtained from the dilepton channel [10, 36] is improved.For the dilepton channel in Ref. [10], the measured
$ t\bar{t} $ production cross-section is$\sigma_{t\bar{t}} = (826.4\pm3.6\pm11.5\pm 15.7\pm $ $ 1.9$ ) pb, with a relative uncertainty of 2.4%. This cross-section is the most precise result measured so far. By using this measurement as the input for$ f_{\rm{exp}}(\sigma|m_t) $ , we present the corresponding likelihood function in Fig. 5, where the area between the two vertical dashed lines represents 68% of the area around the maximum of$ f(m_t) $ . By evaluating the likelihood function, a reliable top-quark pole mass is extracted to be
Figure 5. Likelihood function
$f(m_t)$ defined in Eq. (6) for$\sqrt{S}=$ 13 TeV, where the area between the two vertical dashed lines represents 68% of the area around the maximum of$f(m_t)$ .$ m_t = 172.5\pm1.4 \; {\rm{GeV}} $

(9) at the LHC for
$ \sqrt{S} = 13 $ TeV. The relation between the pole mass and the$ \overline{\rm{MS}} $ mass is currently known up to the four-loop level [61, 62]. By converting the top-quark pole mass to the$ \overline{\rm{MS}} $ definition, we obtain$ m_t^{\overline{\rm{MS}}}(m_t) = 162.0\pm1.3 \; {\rm{GeV}} $

(10) for
$ \mu_r = m_t $ . By directly applying the PMC to calculate the$ \overline{\rm{MS}} $ mass for the results given in Refs. [61, 62], a precise top-quark$ \overline{\rm{MS}} $ mass is also obtained [63].As the experimental uncertainty at the LHC Run II stage with
$ \sqrt{S} = 13 $ TeV is lower than the experimental uncertainty at the LHC Run I stage with$ \sqrt{S} = 7 $ and$ 8 $ TeV, the precision of the determined top-quark pole mass for$ \sqrt{S} = 13 $ TeV is significantly improved compared with the previous analysis for$ \sqrt{S} = 7 $ and$ 8 $ TeV at the LHC and$ \sqrt{S} = 1.96 $ TeV at the Tevatron [34]. We present the top-quark pole mass determined by the PMC versus the CM energy$ \sqrt{S} $ in Fig. 6, where the PMC results at lower CM energies are taken from Ref. [34]. A self-consistent determination of the top-quark pole mass can be obtained using the PMC at different CM energies.
Figure 6. (color online) Top-quark pole mass determined by the PMC versus the CM energy
$\sqrt{S}$ , where the PMC results at lower CM energies are taken from Ref. [34].The top-quark pole mass is also extracted by comparing the same measured cross-section [10] with the theoretical prediction calculated from conventional scale setting; however, the scale uncertainty is one of the main error sources for the extracted top-quark pole mass. In contrast, as the PMC method eliminates the renormalization scale uncertainty, the determined top-quark pole mass is not plagued by any uncertainty from the choice of the scale
$ \mu_r $ , and thus, the precision of the determined top-quark pole mass is improved compared with the result obtained from conventional scale setting [10].The determined top-quark pole mass using the PMC for
$ \sqrt{S} = 13 $ TeV can be cross-checked using other determinations with different techniques by comparing the predicted$ t\bar{t} $ cross-sections with the corresponding experimental measurements, including the typical pole masses$ m_t = 172.9^{+2.5}_{-2.6} $ GeV from ATLAS [9] with the$ 7 $ and$ 8 $ TeV data,$ m_t = 173.8^{+1.7}_{-1.8} $ GeV from CMS [11] with the$ 7 $ and$ 8 $ TeV data,$ m_t = 173.1^{+2.0}_{-2.1} $ GeV from ATLAS [10] with the$ 13 $ TeV data, and$ m_t = 169.9^{+1.9}_{-2.1} $ GeV from CMS [13] with the$ 13 $ TeV data. In addition to the inclusive$ t\bar{t} $ cross-sections, the top-quark pole masses are extracted from the$ t\bar{t} $ +1 jet distribution, yielding$ m_t = 173.7^{+2.3}_{-2.1} $ GeV from ATLAS [64] with the$ 7 $ TeV data,$ m_t = 171.1^{+1.2}_{-1.0} $ GeV from ATLAS [65] with the$ 8 $ TeV data, and$ m_t = 169.9^{+4.5}_{-3.7} $ GeV from CMS [66] with the$ 8 $ TeV data. The top-quark pole masses are also extracted from the differential distributions, yielding$ m_t = 173.2\pm1.6 $ GeV [67] and$ m_t = 170.9\pm0.8 $ GeV [68]. More explicitly, we present a summary of the top-quark pole masses in Fig. 7. The top-quark pole mass,$ m_t = 172.4\pm0.7 $ GeV [17], from the PDG is presented as the shaded band for reference. Figure 7 shows that the top-quark pole masses obtained from the PMC and the collider measurements at different energies and different techniques show good consistency.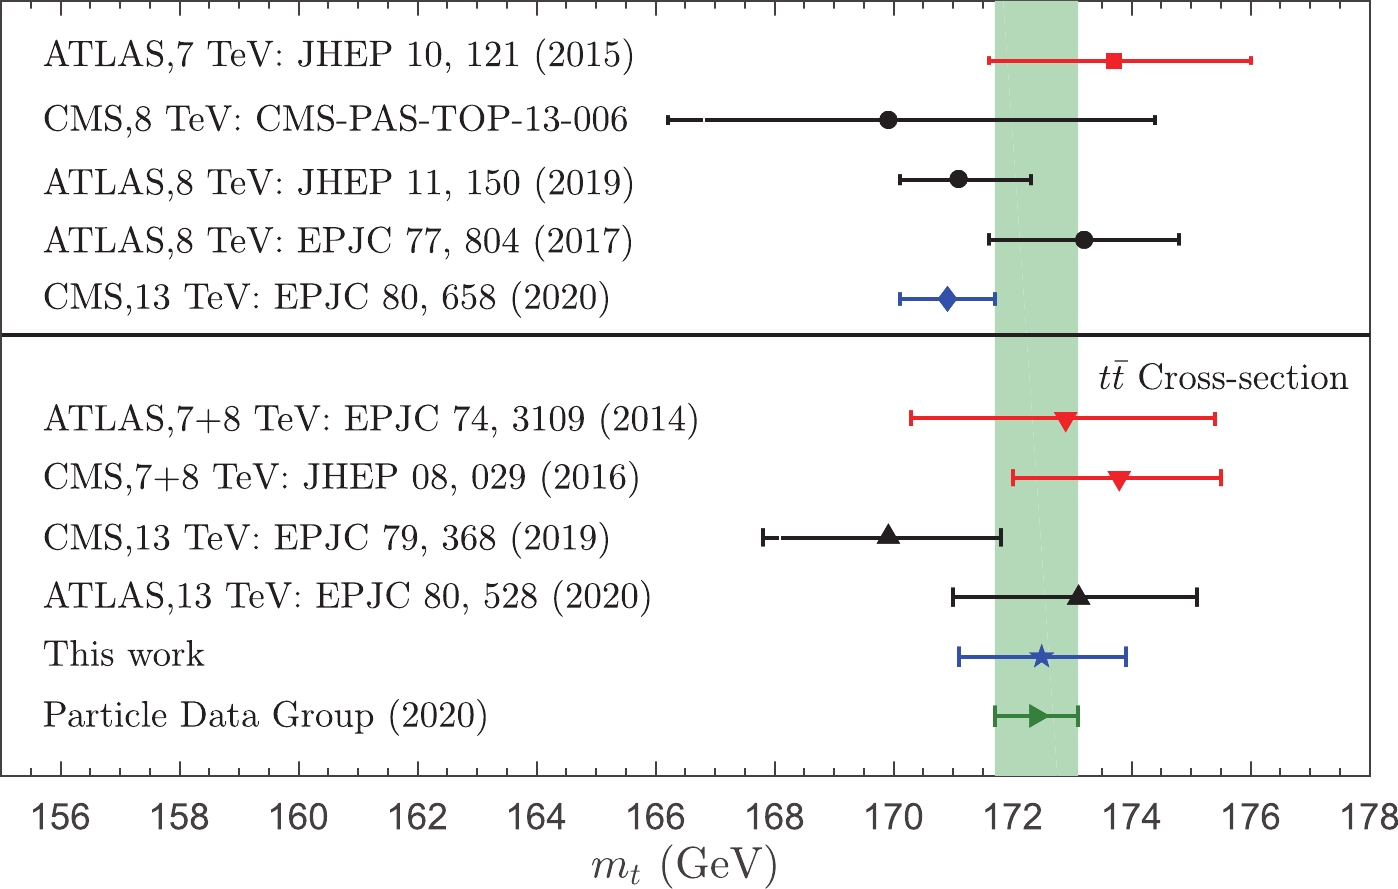
Figure 7. (color online) Summary of the top-quark pole masses, where our PMC prediction and previous determinations [9-11, 13, 64-68] from collider measurements at different energies and different techniques are presented. The top-quark pole mass,
$ m_t = 172.4\pm0.7 $ GeV, from the PDG [17] is presented as the shaded band for reference. -
Fixed-order pQCD predictions based on conventional scale setting are plagued by the renormalization scale
$ \mu_r $ uncertainty. In contrast, the PMC provides a rigorous unambiguous method for setting the renormalization scale. The resulting PMC predictions are independent of the choice of the initial renormalization scale and the choice of renormalization scheme. The predictions using the PMC satisfy the principles of RGI. The PMC is applicable to a wide variety of perturbatively calculable processes. The residual renormalization scale dependence due to uncalculated high-order terms is negligible because of the absence of the renormalon divergence and the convergent pQCD series. Thus, the PMC greatly improves the precision of tests of the SM.The conventional way of estimating the magnitude of uncalculated higher-order contributions by varying
$ \mu_r\in[m_t/2,2m_t] $ is invalid for the top-quark pair production at the LO level. After applying the PMC, a comprehensive, self-consistent pQCD explanation for the$ t\bar{t} $ production cross-sections measured at the LHC collaborations is obtained. The prediction of PMC calculations that the magnitudes of higher-order PMC predictions are well within the error bars predicted from the known lower-order has been demonstrated for the top-quark pair production. As the theoretical uncertainty is greatly reduced using the PMC, a reliable determination of the top-quark pole mass,$ m_t = 172.5\pm1.4 $ GeV, is obtained by comparing the predicted PMC$ t\bar{t} $ cross-section with the latest measurement for$ \sqrt{S} = 13 $ TeV. Our determination of the top-quark pole mass is consistent with the previous determinations obtained at lower LHC energies and different techniques, providing a new and important test of the SM. Compared to previous determinations, our determination using the PMC corresponds with the current world average from the PDG, providing complementary information.
Reanalysis of the top-quark pair hadroproduction and a precise determination of the top-quark pole mass at the LHC
- Received Date: 2021-06-07
- Available Online: 2021-11-15
Abstract: In this study, we calculate the


 Abstract
 HTML
HTML Reference
 Related
 PDF
PDF




 DownLoad: