


 Abstract
 HTML
HTML Reference
 Related
 PDF
PDF


-
Accurate and reliable cross sections of nuclear reactions around the neutron energy of 14 MeV on rhenium isotopes are crucial for the design of fusion reactors because rhenium is a critical potential structural component of such a type of reactor [1, 2]. To date, few laboratories (from two to nine) have reported experimental cross-section data of (n,2n), (n,α), and (n,p) reactions on rhenium isotopes around the neutron energy of 14 MeV. These data can be found in the experimental nuclear reaction data (EXFOR) library [3]. There are large discrepancies in these experimental data that may be due to the different equipment and data processing methods used, interferences of γ rays with the same or close energies, neglect of the effect of the excited state on the ground state that should have been deducted, etc. For example, experimental cross-section data of the 185Re(n,2n)184mRe reaction around the neutron energy of 14 MeV were obtained by nine laboratories [2, 4-11]. There are remarkable differences in those data. For instance, the maximum difference between them is given by a factor greater than 3. For the 185Re(n,2n)184gRe reaction, experimental cross-section data around the neutron energy of 14 MeV were obtained by eight laboratories [2, 4-8, 11, 12]. These data also differ significantly, with a maximum difference greater than 25%. For the 185Re(n,α)182m1+m2+gTa reaction, experimental cross-section data were only obtained by two laboratories [4, 13]. These data were suspicious (because of the interference of γ rays with close energies in its cross section measurement) although there are no evident differences between them. For the 187Re(n,2n) the 186g,(m)Re reaction (86g,(m)Re represents reaction product 186gRe with isomeric state 186mRe transition contribution), experimental cross-section data around the neutron energy of 14 MeV were obtained by seven laboratories [4, 10-15]. There are notable differences in those data as well, with maximum difference greater than 40%. For the 187Re(n,α)184Ta reaction, experimental cross-section data around the neutron energy of 14 MeV were obtained by five laboratories [4, 8, 12, 13, 16], with large differences and a maximum difference given by a factor greater than 2. For the 187Re(n,p)187W reaction, experimental cross-section data around the neutron energy of 14 MeV were obtained by five laboratories [4, 8, 13, 16, 17], with large differences and a maximum difference greater than 35%. Furthermore, there are differences in the cross-section evaluation values of rhenium isotopes in the neutron energy range from the threshold to 20 MeV given by several major libraries of the International Atomic Energy Agency (IAEA) [18]. Therefore, additional measurements are required concerning the cross sections of the six reactions mentioned above on rhenium isotopes around the neutron energy of 14 MeV. Besides, their excitation curves must be obtained by using the nuclear theoretical model program system Talys-1.9 [19]. In the present study, the cross sections of the 185Re(n,2n)184mRe, 185Re(n,2n)184gRe, 185Re(n,α)182m1+m2+gTa, 187Re(n,2n)186g,(m)Re, 187Re(n,α)184Ta, and 187Re(n,p)187W reactions were measured around the neutron energies of 13.5-14.8 MeV by using the activation technique and using off-line γ-ray spectrometry. The excitation functions of the above reactions in neutron energies ranging from the threshold to 20 MeV were calculated by adopting the nuclear theoretical model program system Talys-1.9 with the relevant parameters properly adjusted. The measured results were analyzed and compared with previous experiments conducted by other researchers and with the evaluated data of BROND-3.1 (Russia, 2016), ENDF/B-VIII.0 (USA, 2018), and JEFF-3.3 (Europe, 2017) [18], as well as with theoretical values based on Talys-1.9.
-
Natural rhenium foils of 3.04-3.12 mm thickness and 99.99% purity were made into round disks with a diameter of 20 mm. Natural niobium foils (1 mm in thickness, 99.99% purity) of the same diameter as the rhenium sample were then fixed at the front and back of each rhenium foil, which was wrapped in a cadmium foil of 1 mm thickness and 99.95% purity to reduce the influence of the 185Re(n,γ) 186g,(m)Re reaction induced by low-energy neutrons on the 187Re(n,2n)186g,(m)Re reaction.
The samples were radiated at the K-400 Neutron Generator at China Academy of Engineering Physics (CAEP) and lasted for 6.5-10 h. Neutrons in the 14 MeV region with a yield ranging from 4×10¹⁰ n/s to 5×10¹⁰ n/s were generated from the T(d,n)4He reaction under a deuteron beam energy of 255 keV and a beam current of 350 µA. The solid tritium–titanium (T-Ti) target applied to the generator was approximately 2.19 mg/cm2 thick. In the process of the radiation of the samples, the neutron flux was detected by an Au-Si surface barrier detector used in 135° accompanying a particle tube to correct small variations of neutron flux. The samples were put at 0°-135° angles relative to the direction of the deuteron beam and with distances from the center of the T-Ti target of approximately 40-50 mm. The neutron energies in the measurements were determined in advance from the cross section ratios of 90Zr(n,2n)89m+gZr to93Nb(n,2n)92mNb reactions [20].
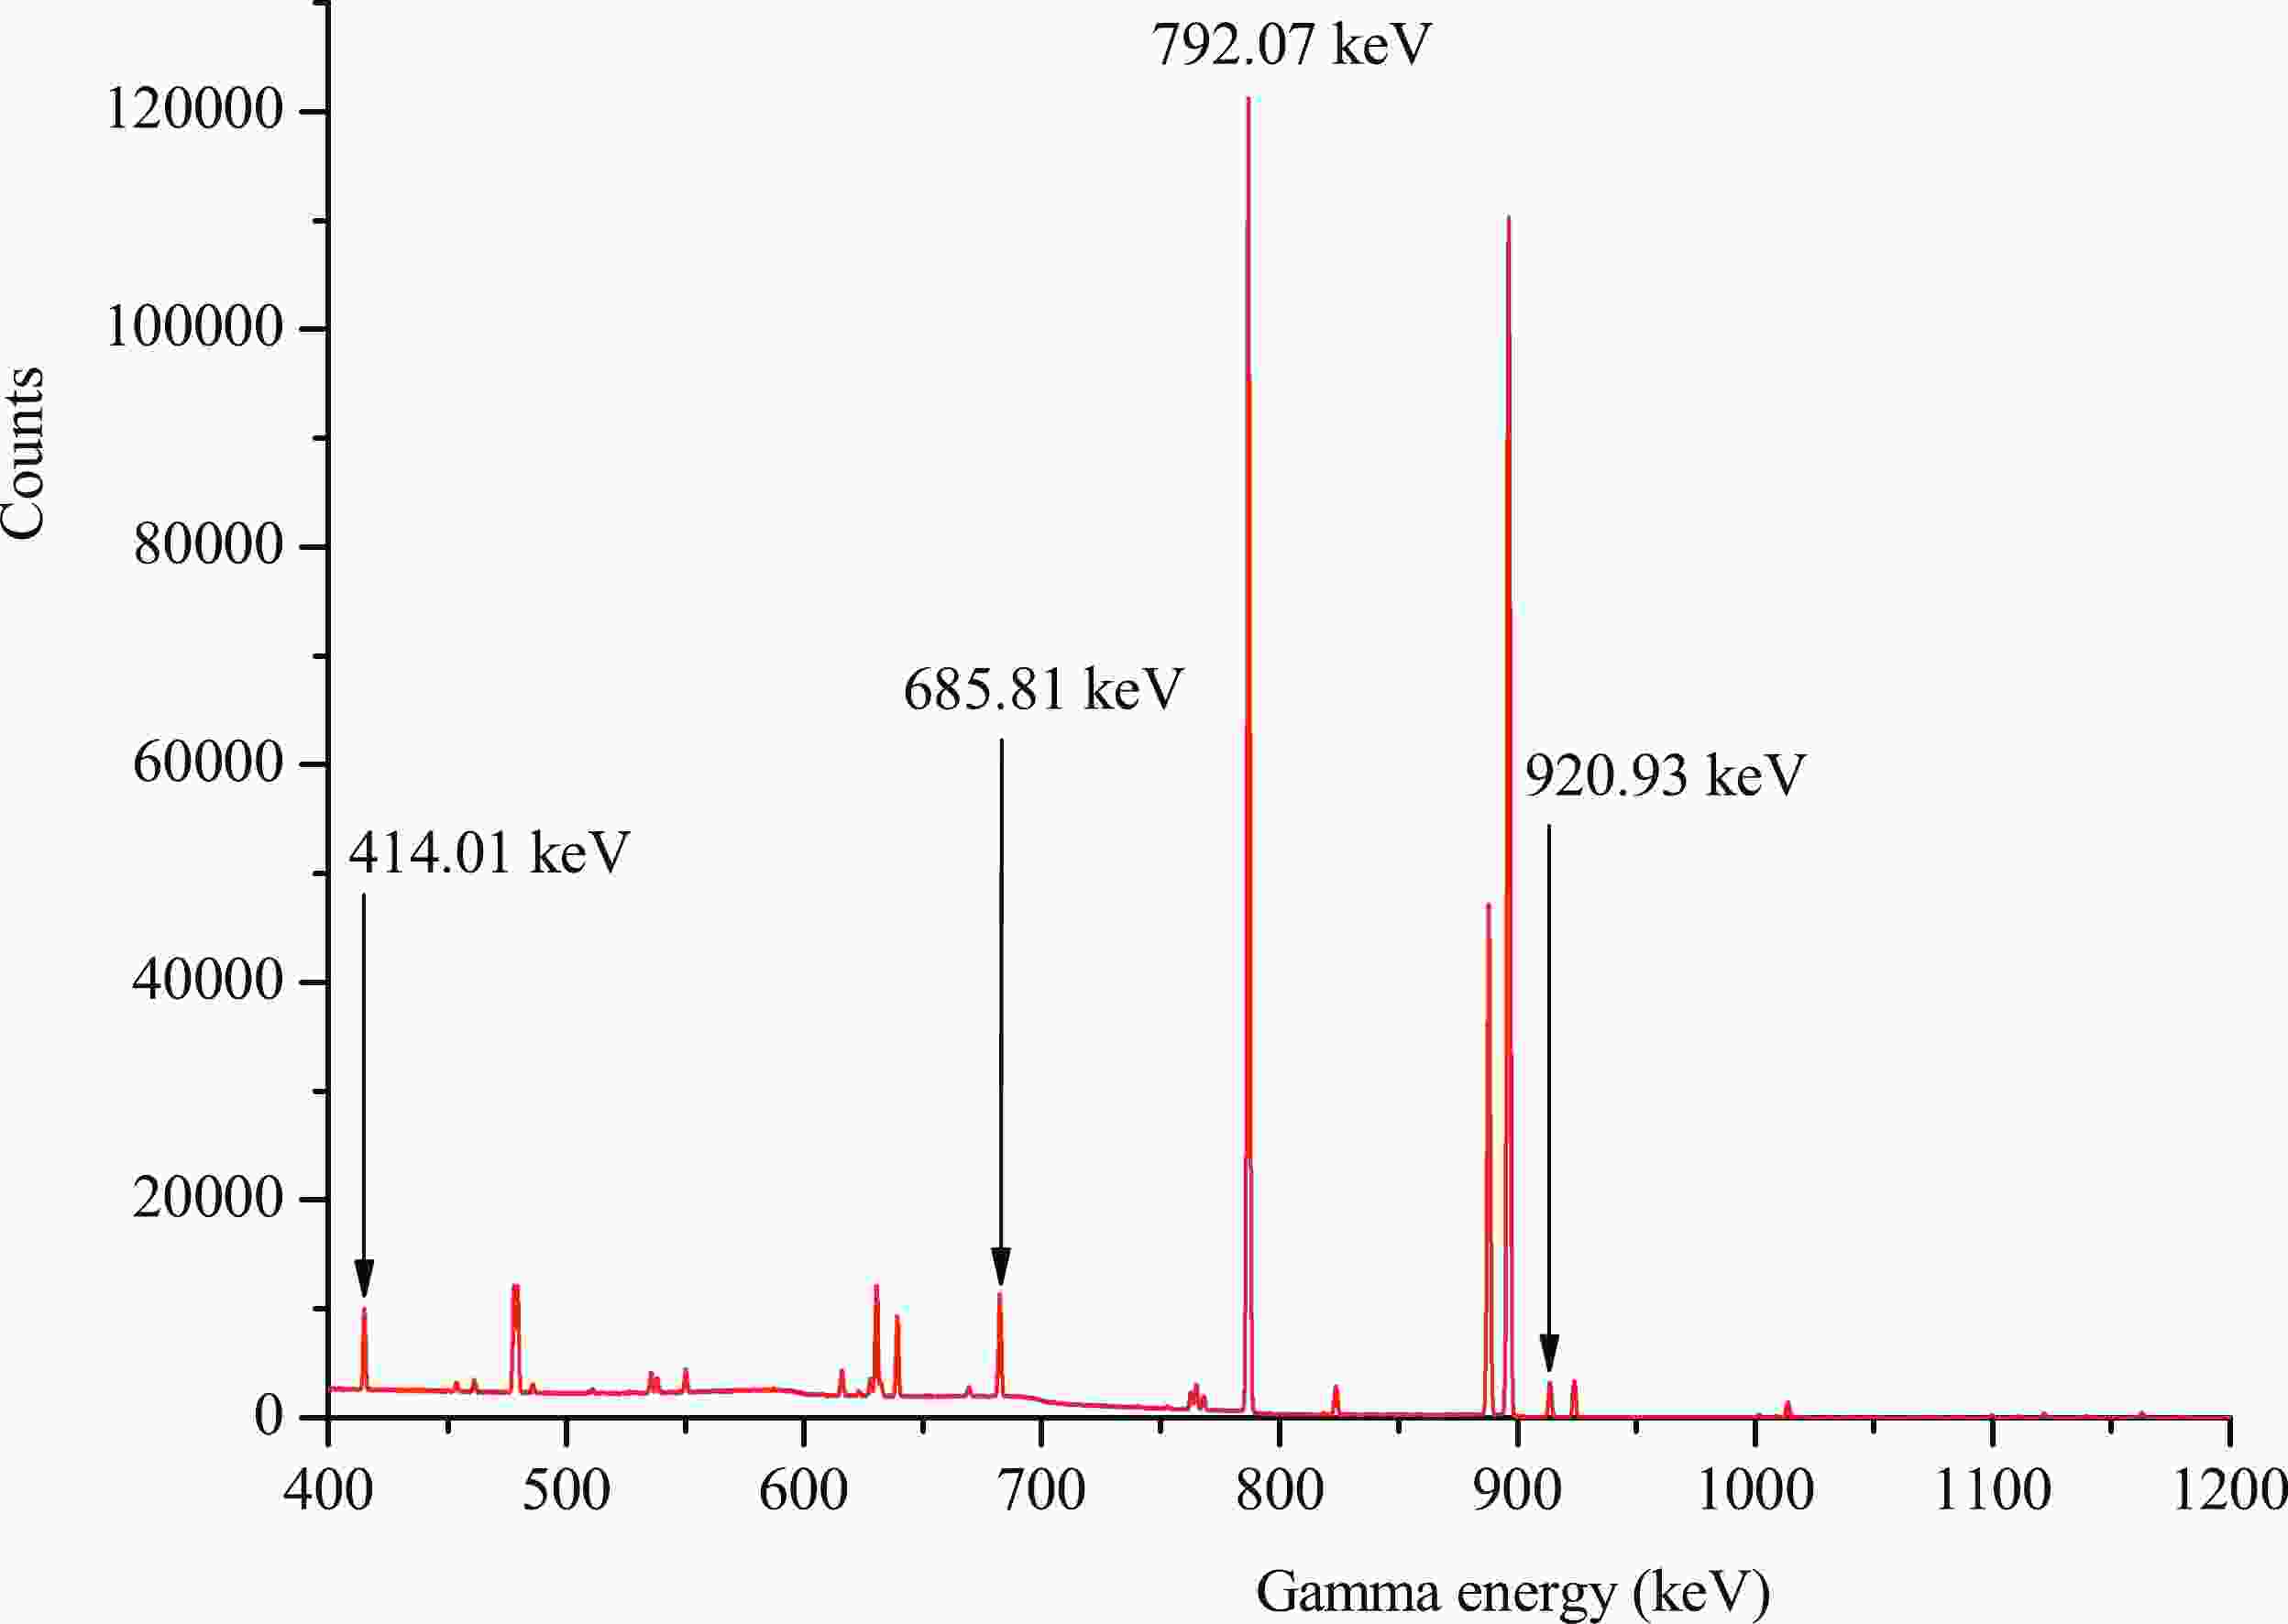
The γ-ray activities of 184mRe, 184gRe, 182m1+m2+gTa, 186gRe, 184Ta, 187W, and 92mNb were determined by a well-calibrated GEM-60P coaxial high-purity germanium ORTEC detector made in USA (its crystal diameter is 70.1 mm and crystal length is 72.3 mm) with a relative efficiency of 68% and an energy resolution of 1.69 keV at 1332 keV. The efficiency of the detector was pre-calibrated using various standard γ sources. Activities of decay γ-rays from the product radionuclides were recorded 90 mm away from the detector’s surface. The cooling time of the irradiated sample was approximately 18 min-136.32 h, and the measuring time was approximately 23 min-20.78 h. Figures 1 and 2 show part of the γ-ray spectrum obtained from the rhenium samples at approximately 6.78 and 125.45 h after the end of irradiation, respectively.
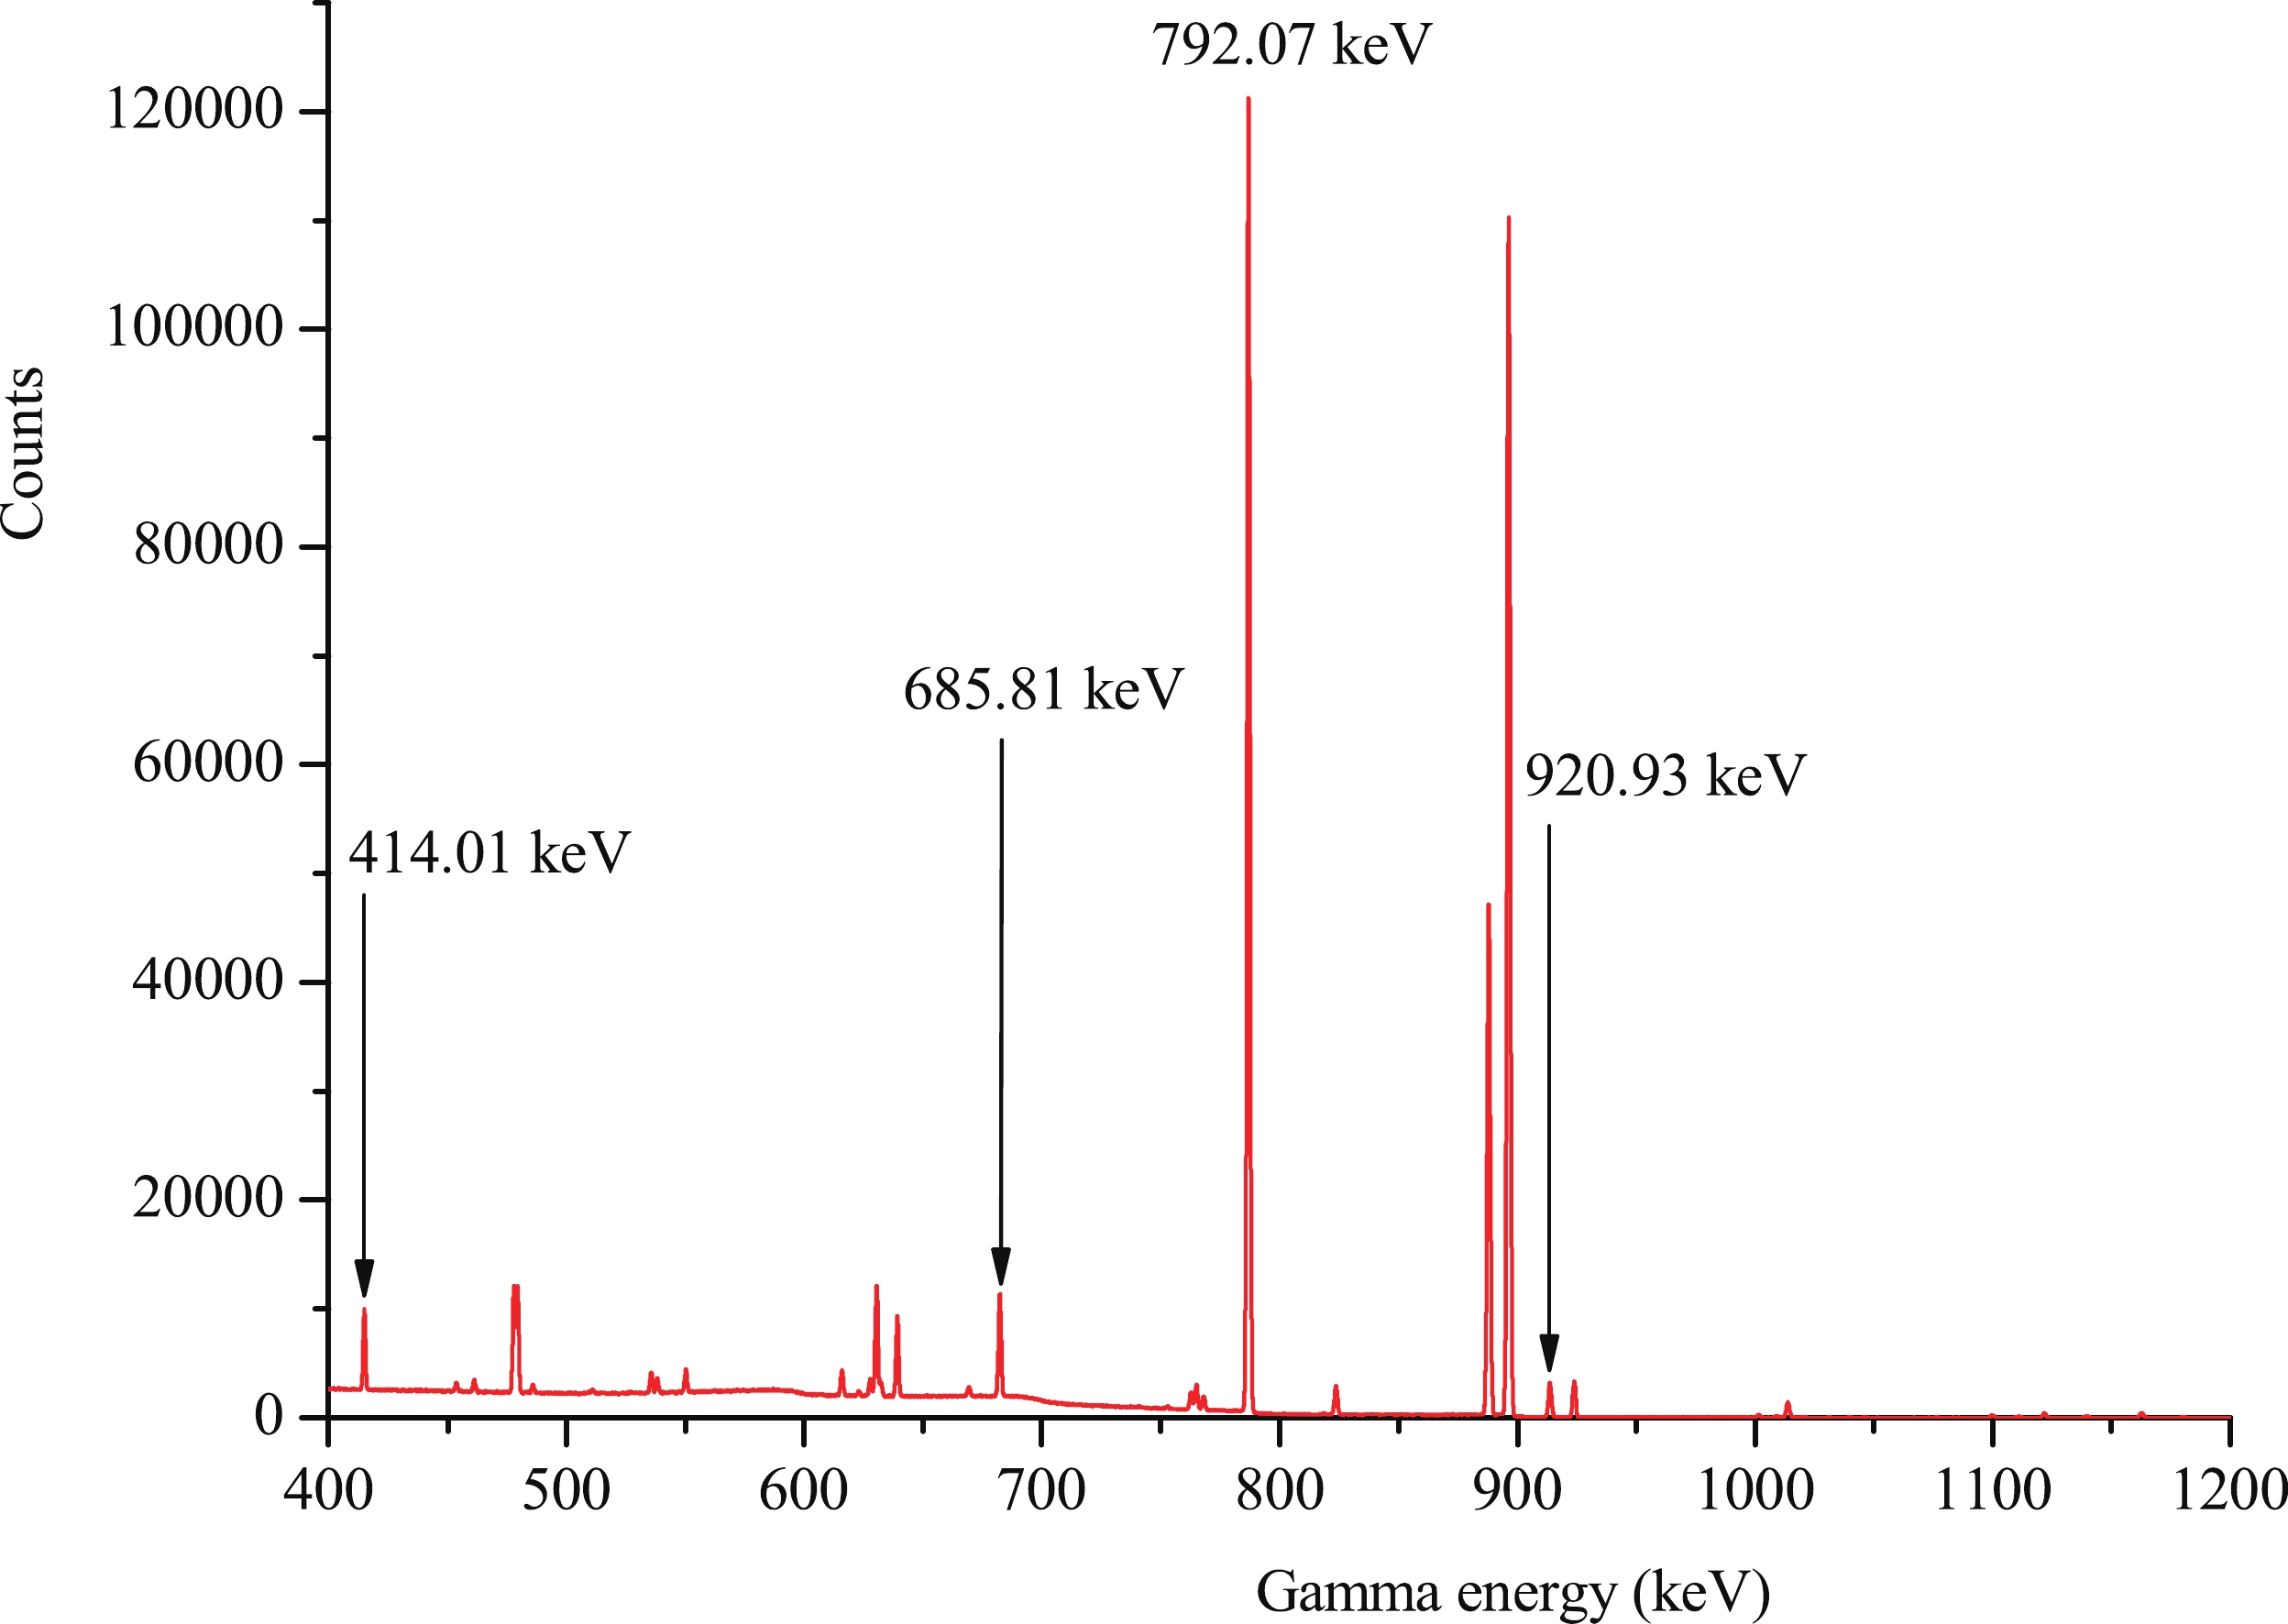
Figure 1. (color online) Part of the γ-ray spectrum of rhenium obtained after 6.78 h of cooling following the end of irradiation; the measurement duration was approximately 3.82 h.
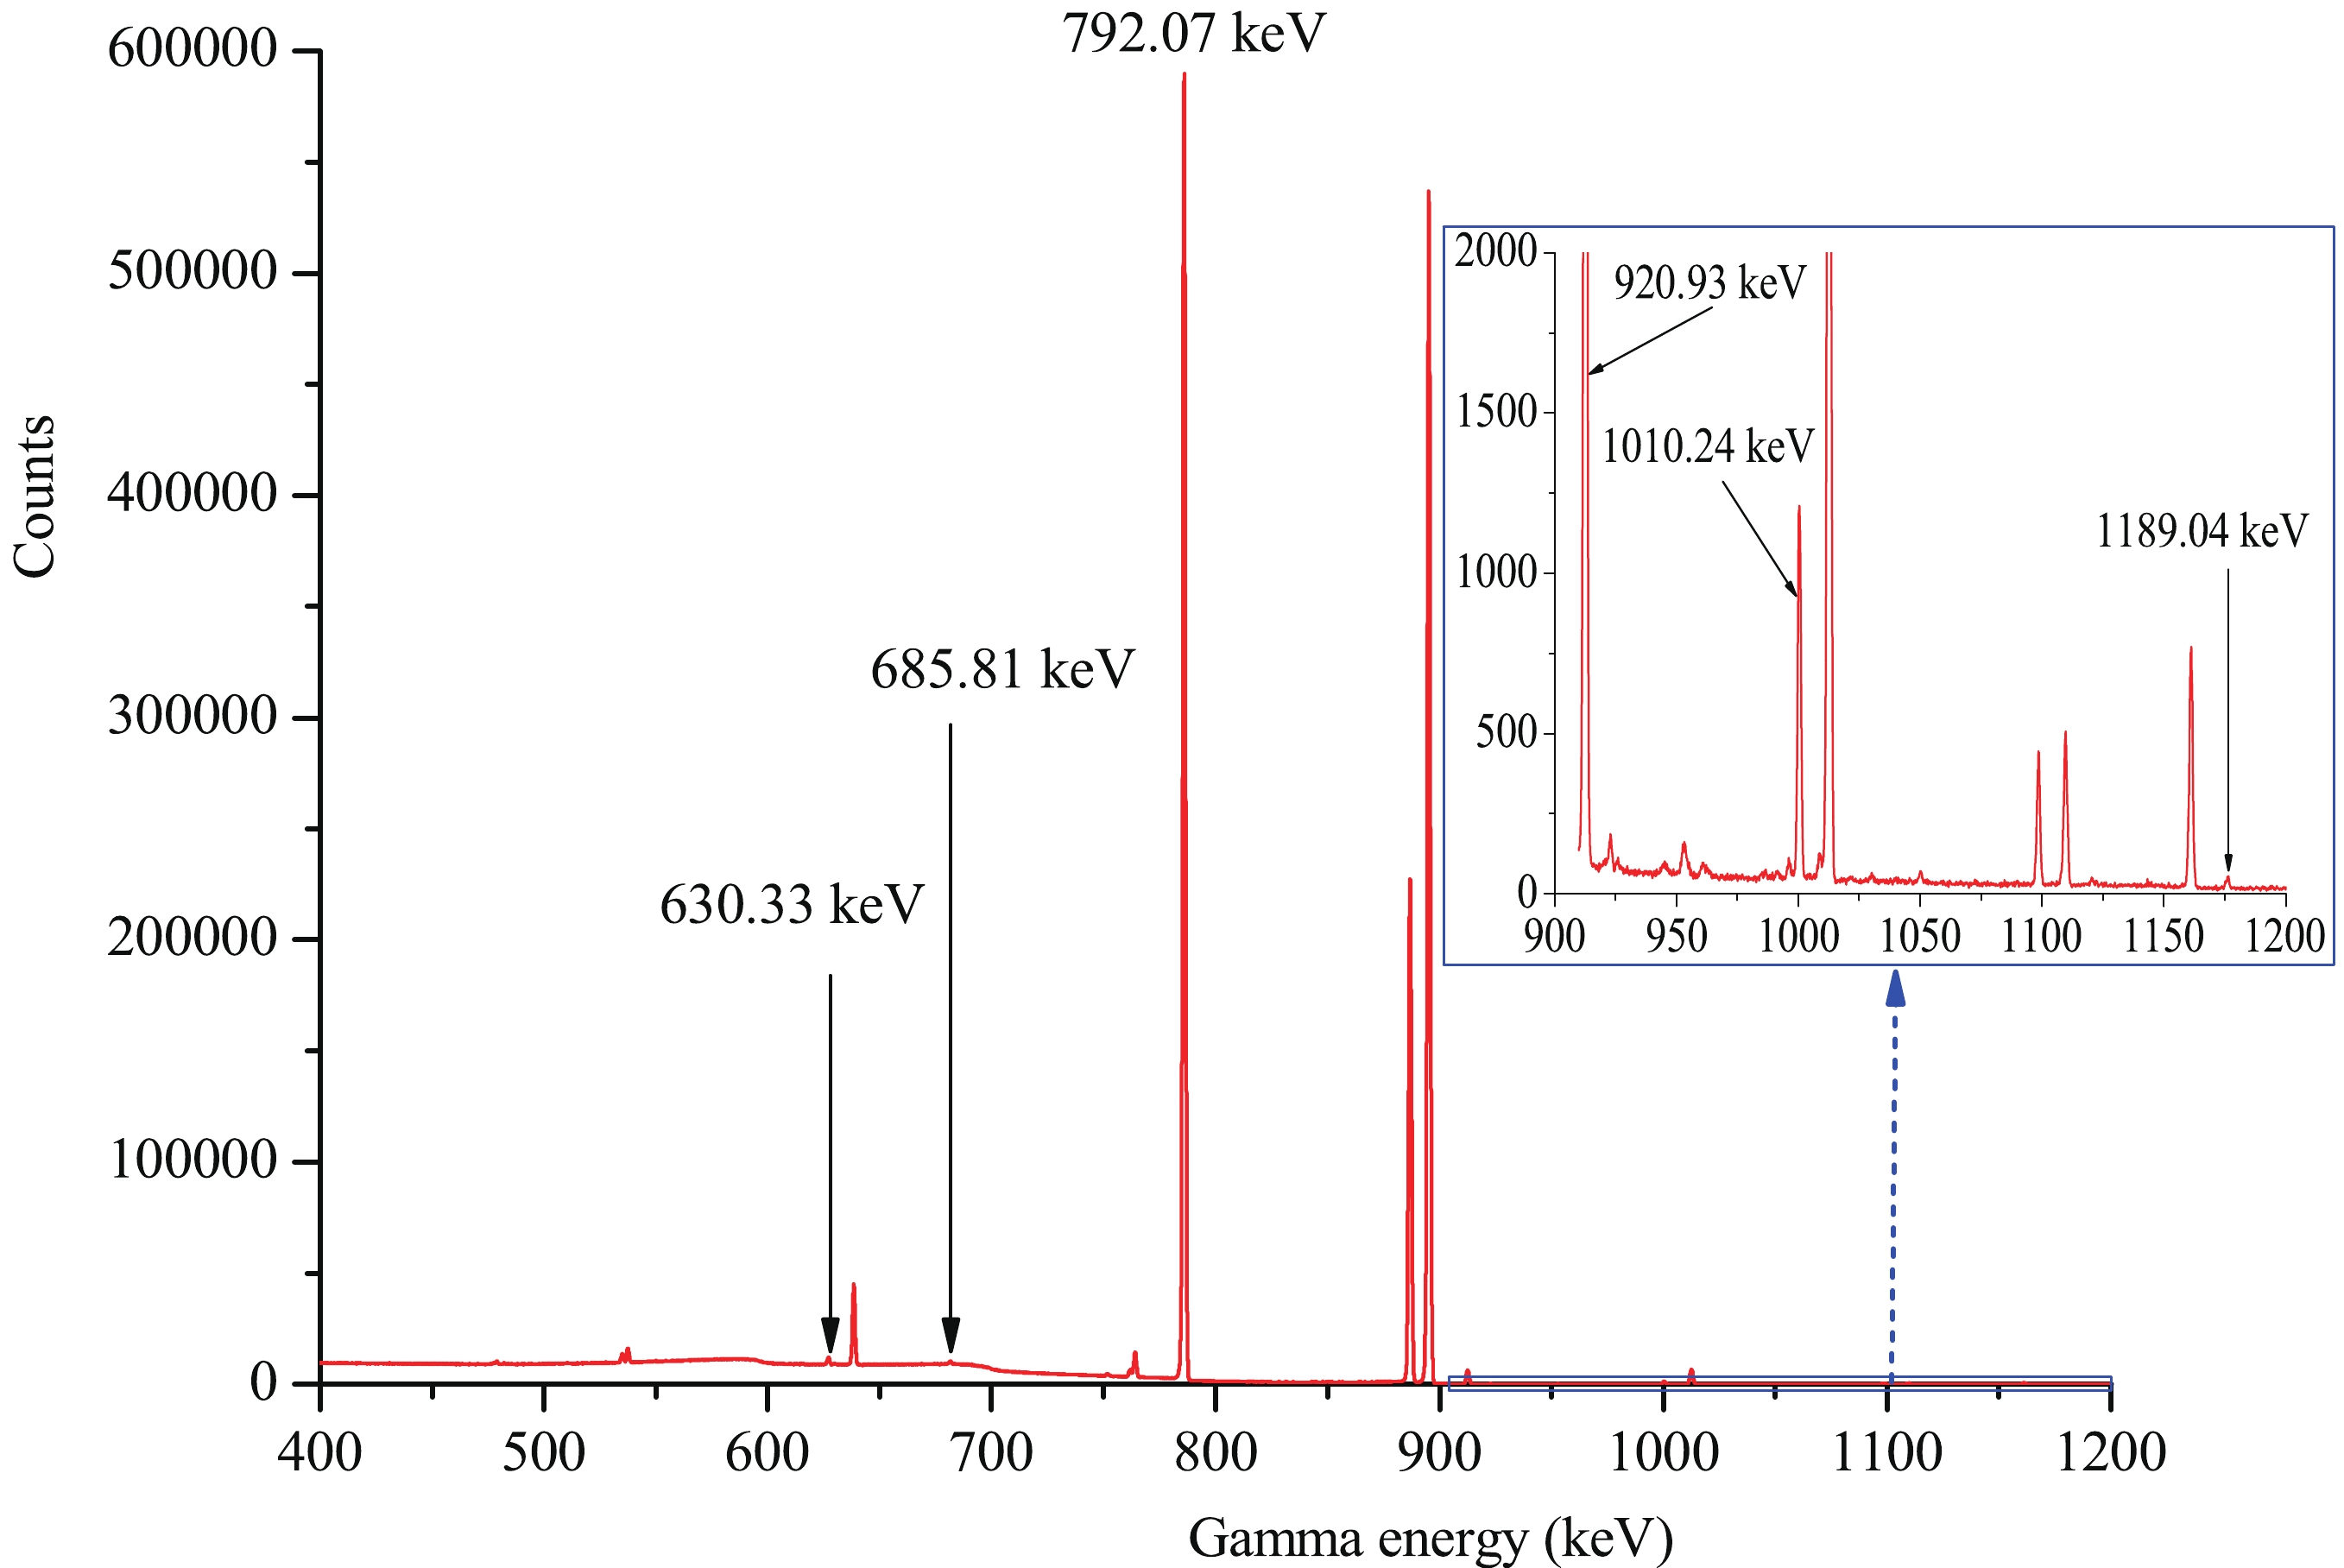
Figure 2. (color online) Part of the γ-ray spectrum of rhenium obtained after 125.45 h of cooling following the end of irradiation; the measurement duration was approximately 20.78 h.
-
The decay characteristics of the radioactive product nuclides and the natural abundance of the target isotopes under investigation are summarized in Table 1 [21]. The natural abundance of 93Nb was taken from Ref. [22].
Reaction Abundance of target isotope (%) Activation products T1/2 Eγ/keV Iγ(%) 185Re(n,2n) 37.40 184mRe 169 d 920.93 8.2 185Re(n,2n) 37.40 184gRe 35.4 d 792.07 37.7 1010.24 0.092 185Re(n,α) 37.40 182m1+m2+gTa 114.74 d 1189.04 16.49 187Re(n,2n) 62.60 186gRe 3.7183 d 630.33 0.0294 187Re(n,α) 62.60 184Ta 8.7 h 414.01 72 187Re (n,p) 62.60 187W 24.0 h 685.81 33.2 93Nb(n,2n) 100 92mNb 10.15 d 934.44 99.15 Table 1. Reactions and associated decay data of activation products.
The measured cross-section values were calculated by the following formula [23, 24]:
${\sigma _x} = \frac{{{{[S\varepsilon {I_\gamma }\eta KMD]}_0}}}{{{{[S\varepsilon {I_\gamma }\eta KMD]}_x}}}\frac{{{{[\lambda AFC]}_x}}}{{{{[\lambda AFC]}_0}}}{\sigma _0}.$

(1) The subscript 0 represents the term corresponding to the monitor reaction, whereas the subscript x corresponds to the measured reaction; ε is the full-energy peak (FEP) efficiency of the measured characteristic γ-ray, Iγ is the γ-ray intensity, η is the abundance of the target nuclide, M is the mass of sample,
$D = {{\rm e}^{ - \lambda {t_1}}} - {{\rm e}^{ - \lambda {t_2}}}$ is the counting collection factor, t1 and t2 are the time intervals from the end of the irradiation to the start and the end of counting, respectively, A is the atomic weight, C is the measured FEP area, λ is the decay constant, and F is the total correction factor of the activity:$F = {F_s} \times {F_c} \times {F_g},$

(2) where Fs, Fc, and Fg are correction factors for the self-absorption of the sample at a given γ-energy, the coincidence sum effect of cascade γ-rays of the investigated nuclide, and the counting geometry, respectively. Fc was calculated by the method reported in Ref. [25]. Fs and Fg were calculated by the following equations:
${F_s} = \frac{{{\mu _{{m}}}{d_m}}}{{1 - {{\rm e}^{ - {\mu _m}{d_m}}}}},$

(3) ${F_g} = \frac{{{{(h + d/2)}^2}}}{{{h^2}}},$

(4) where μm (in cm2/g) is the mass attenuation coefficient at each gamma energy, dm (in g/ cm2) is the area density, d (in mm) is the thickness of the sample, and h (in mm) is the distance from the surface of the sample to the effective detection cross section of the crystal in the HPGe detector.
K is the neutron fluctuation factor:
$ K = \left[ {\sum\limits_i^L {{\Phi _i}} \left( {1 - {{\rm e}^{ - \lambda \Delta {t_i}}}} \right){{\rm e}^{ - \lambda {T_i}}}} \right] \Big/\Phi S, $

(5) where L is the number of time intervals into which the irradiation time is divided, Δti is the duration of the ith time interval, Ti is the time interval from the end of the ith interval to the end of irradiation, Φi is the neutron flux averaged over the sample during Δti, Φ is the neutron flux averaged over the sample during the total irradiation time T, and
$S = 1 - {{\rm e}^{ - \lambda T}}$ is the growth factor of the product nuclide.Cross sections of the 185Re(n,2n)184mRe, 185Re(n,2n) 184gRe, 185Re(n,α)182m1+m2+gTa, 187Re(n,2n)186g,(m)Re, 187Re(n,α)184Ta, and 187Re(n,p)187W reactions were obtained. The cross-section data of the monitor reaction 93Nb(n,2n)92mNb were 457.9± 6.8, 459.8 ± 6.8, 459.8 ± 6.8, and 459.7 ± 5.0 mb at neutron energies of 13.5, 14.1, 14.4, and 14.8 MeV, respectively [26]. The measured cross-section data are presented in Table 2 and charted in Figs. 3-8. Previously obtained experimental cross sections of these nuclear reactions around the neutron energy of 14 MeV are also summarized in Table 2 and charted in Figs. 3-8 for comparison. Likewise, the evaluation cross-section curves of these reactions from BROND-3.1, ENDF/B-VIII.0, JEFF-3.3, and the theoretical calculation curves in the neutron energy range from the threshold to 20 MeV obtained by the computer code system Talys-1.9 are also charted in Figs. 3-8 for comparison.
Reaction This study Literature Values En/MeV σ/mb En/MeV σ/mb Reference 185Re(n,2n)184mRe 13.5±0.2 397±29 14.7 390±18 [2] 14.1±0.2 409±30 14.74 357±33 [4] 14.4±0.2 414±30 13.4 403±16 [5] 14.8±0.2 415±30 13.7 400±16 [5] 14.1 395±16 [5] 14.45 389±16 [5] 14.65 392±16 [5] 14.8 399±16 [5] 14.3 380±50 [6] 14.7 390±70 [6] 14.44 442±21 [7] 14.47 428±21 [7] 13.33 312±26 [8] 13.57 325±26 [8] 13.75 332±27 [8] 13.98 321±26 [8] 14.22 341±28 [8] 14.43 335±28 [8] 14.67 359±30 [8] 14.93 347±29 [8] 13.54 322±48 [9] 13.73 345±52 [9] 14.67 301±45 [9] 14.81 416±62 [9] 14.8 260±100 [10] 14.1 1120±400 [11] 185Re(n,2n)184gRe 13.5±0.2 1800±82a (1753±155b) 14.7 1817±85 [2] 14.1±0.2 1787±83a (1727±154b) 14.74 1488±88 [4] 14.4±0.2 1752±79a (1724±152b) 13.4 1850±74 [5] 14.8±0.2 1699±77a (1677±149b) 13.7 1844±74 [5 14.1 1838±74 [5] 14.45 1832±73 [5] 14.65 1778±71 [5] 14.8 1776±71 [5] 14.3 1670±95 [6] 14.7 1780±120 [6] 14.44 1886±75 [7] 14.47 1886±71 [7] 13.33 1399±73 [8] 13.56 1436±75 [8] Continued on next page Table 2. Summary of the cross sections of Rhenium isotopes around the neutron energy of 14 MeV.
Table 2-continued from previous page Reaction This work Literature Values En/MeV σ/mb En/MeV σ/mb Reference 13.75 1416±74 [8] 13.98 1389±72 [8] 14.22 1414±73 [8] 14.43 1370±72 [8] 14.66 1385±72 [8] 14.93 1420±74 [8] 14.1 1910±600 [11] 14.7 1900±100 [12] 15.3 2170±100 [12] 16.1 1670±90 [12] 16.8 1260±70 [12] 17.3 1240±60 [12] 18.3 900±50 [12] 185Re(n,α)182m1+m2 +gTa 13.5±0.2 0.56±0.05 14.48 1.40±0.50 [4] 14.1±0.2 0.61±0.06 14.7 1.4±0.2 [13] 14.4±0.2 0.65±0.07 14.8±0.2 0.75±0.06 187Re(n,2n)186g,(m)Re 13.5±0.2 1734±75 14.85 1680±99 [4] 14.1±0.2 1661±75 14.8 1490±160 [10] 14.4±0.2 1614±71 14.1 1440±410 [11] 14.8±0.2 1560±68 14.7 1140±60 [12] 15.3 1390±70 [12] 16.1 950±50 [12] 16.8 690±40 [12] 17.3 820±40 [12] 18.3 710±40 [12] 13.5 1857±90 [13] 14.2 1863±90 [13] 14.7 1881±93 [13] 14.1 1966.9±50.3 [14] 14.6 1967.1±44.7 [14] 14.8 1952.0±50.7 [14] 15.0 1903.0±50.3 [14] 14.8 1675±168 [15] 187Re(n,α)184Ta 13.5±0.2 0.34±0.02 13.67 0.316±0.05 [4] 14.1±0.2 0.42±0.02 14.06 0.416±0.05 [4] 14.4±0.2 0.54±0.03 14.46 0.561±0.05 [4] 14.8±0.2 0.63±0.03 14.84 0.609±0.05 [4] 14.47 0.445±0.064 [8] 14.70 0.558±0.097 [8] Continued on next page Table 2-continued from previous page Reaction This work Literature Values En/MeV σ/mb En/MeV σ/mb Reference 14.96 0.63±0.11 [8] 14.8 0.53±0.03 [12] 15.3 0.89±0.05 [12] 16.1 1.07±0.06 [12] 16.8 1.06±0.06 [12] 17.3 0.99±0.05 [12] 18.3 1.52±0.08 [12] 14.7 1.1±0.1 [13] 14.5 0.94±0.14 [16] 187Re(n,p)187W 13.5±0.2 2.05±0.09 13.67 2.75±0.30 [4] 14.1±0.2 2.50±0.11 14.06 3.18±0.30 [4] 14.4±0.2 2.98±0.13 14.46 3.45±0.35 [4] 14.8±0.2 3.27±0.14 14.84 3.94±0.29 [4] 13.34 4.51±0.51 [8] 13.57 4.00±0.71 [8] 13.76 4.40±0.76 [8] 13.99 5.10±0.71 [8] 14.23 4.88±0.79 [8] 14.44 5.33±0.41 [8] 14.68 5.59±0.65 [8] 14.95 6.60±0.75 [8] 13.5 3±0.3 [13] 14.2 4±0.4 [13] 14.7 4.5±0.5 [13] 14.5 3.93±0.39 [16] 14.7 4.7±0.4 [17] aThese are the results based on the 792.07 keV γ-ray of 184gRe.
bThese are the results based on the 1010.24 keV γ-ray of 184gRe.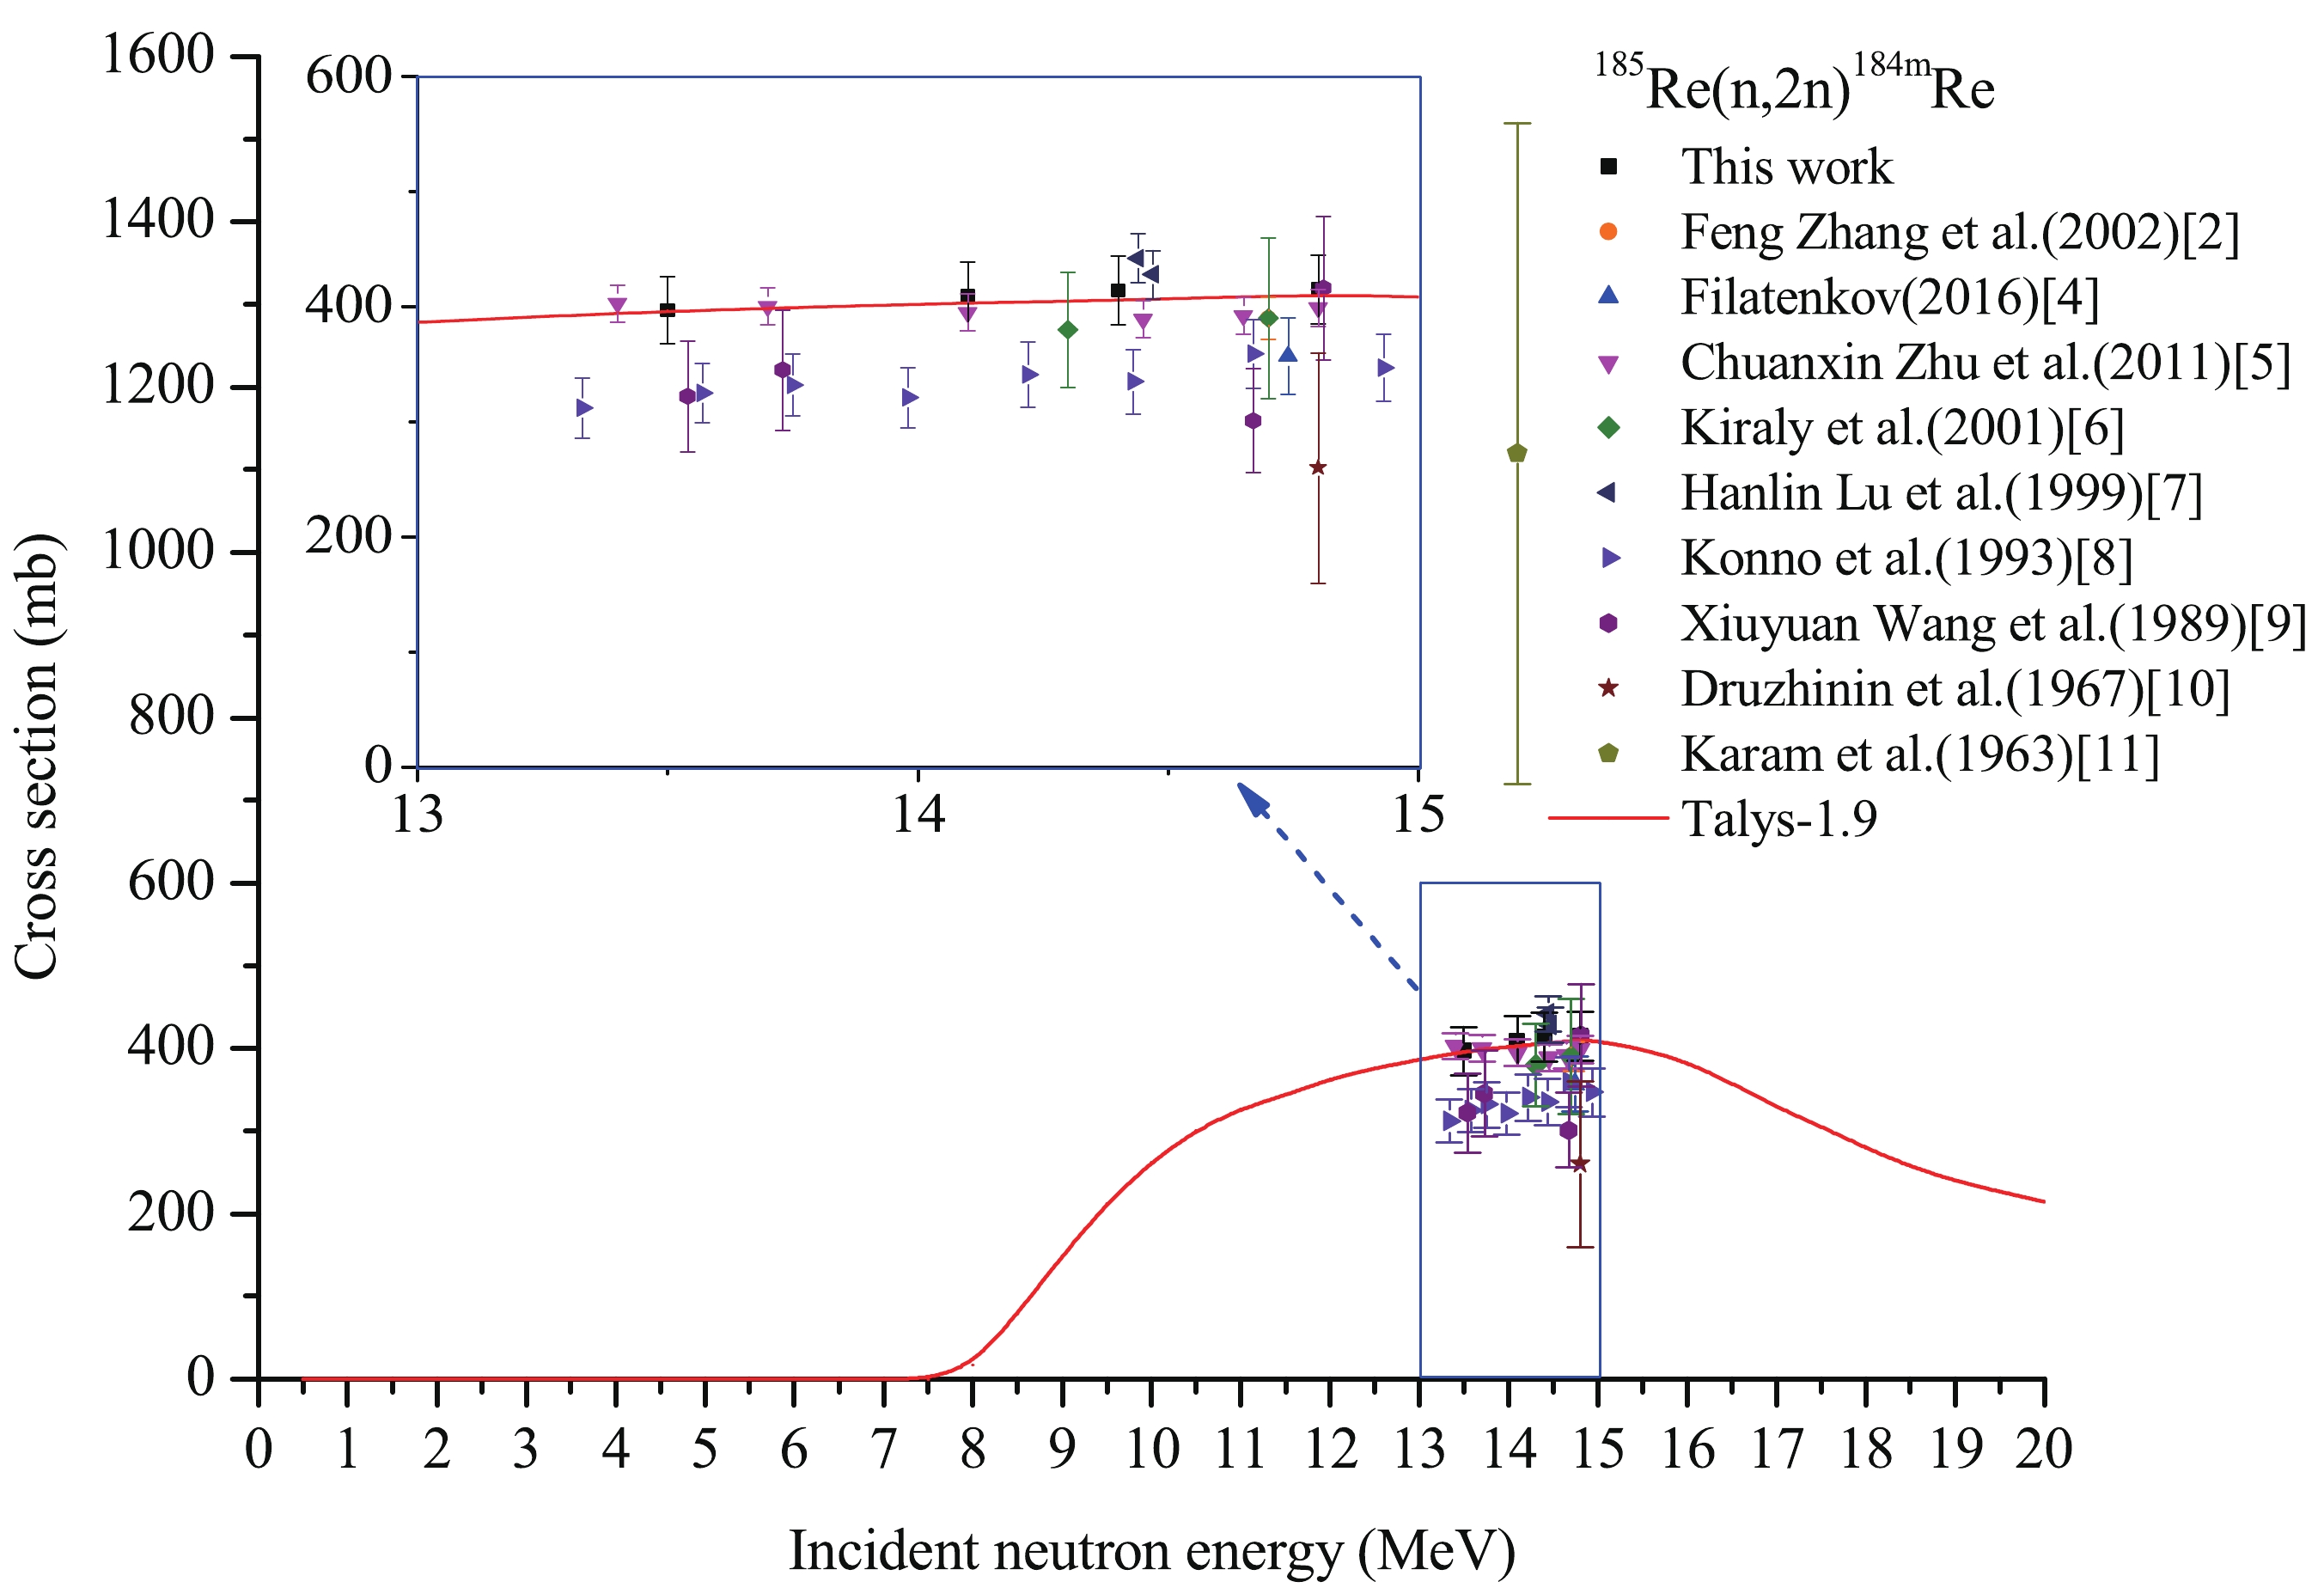
Figure 3. (color online) Cross section of the 185Re(n,2n)184mRe reaction.

Figure 4. (color online) Cross section of the 185Re(n,2n)184gRe reaction.
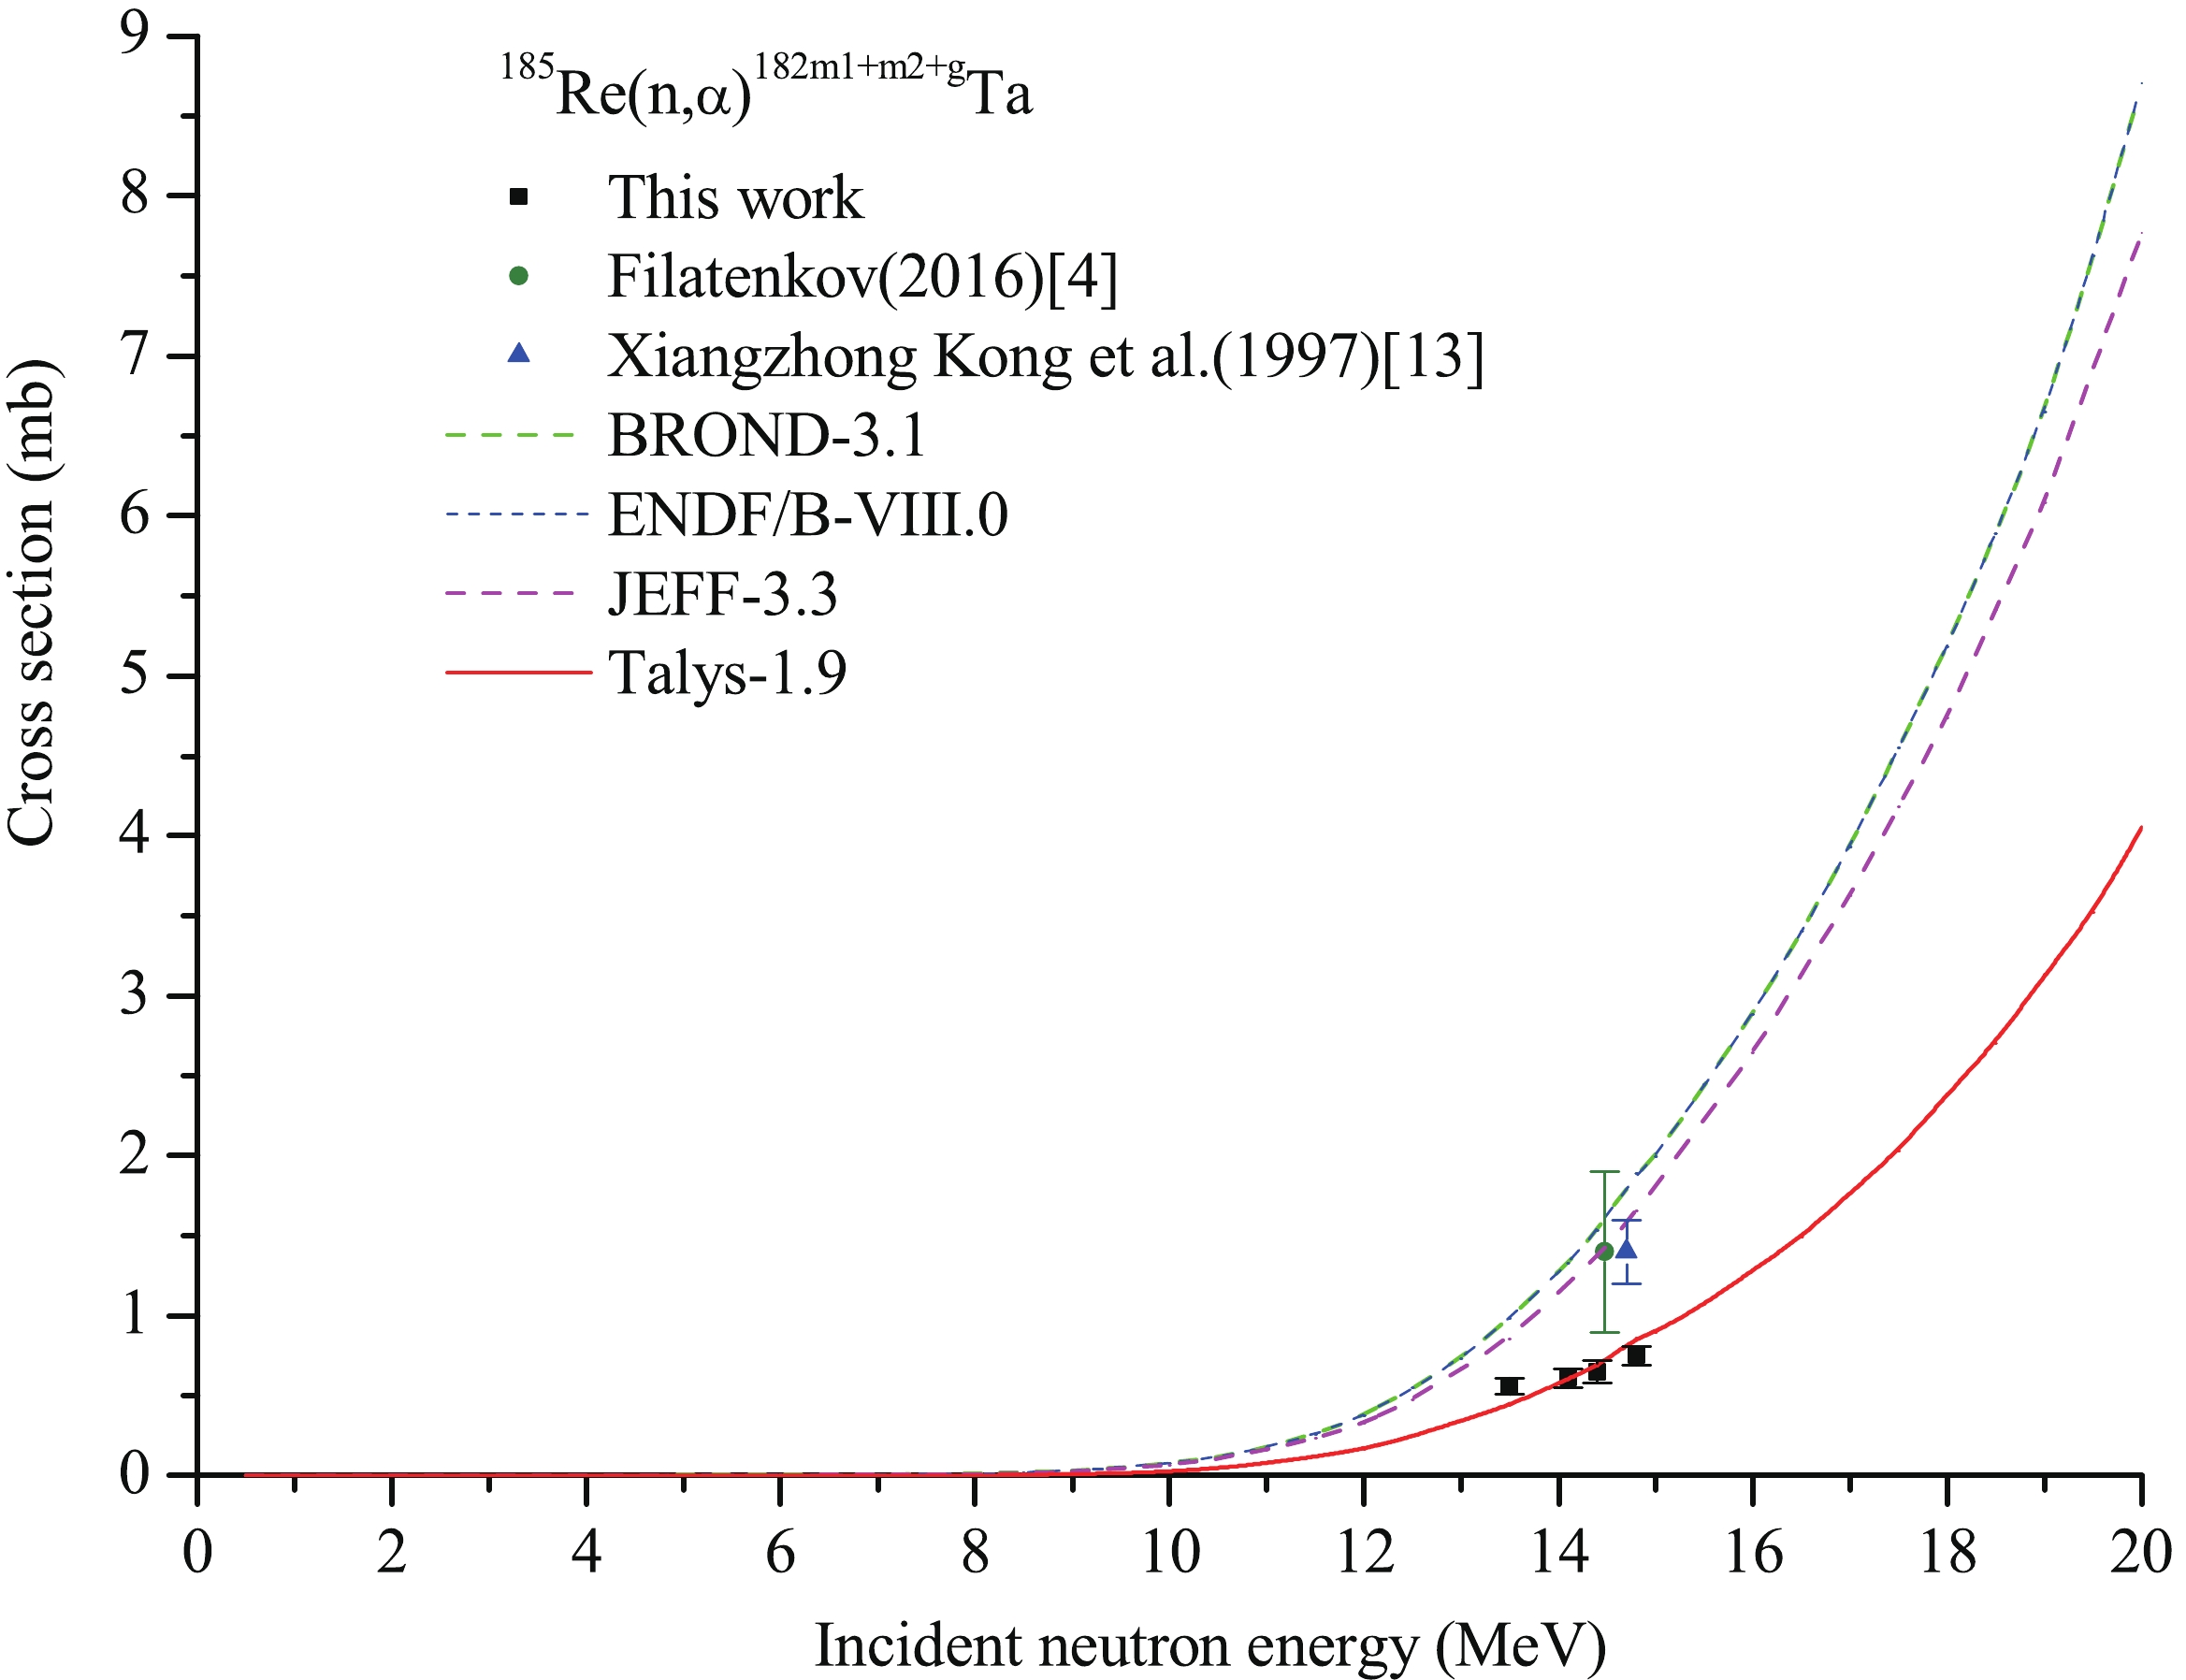
Figure 5. (color online) Cross section of the 185Re(n,α)182m1+m2+gTa reaction.

Figure 6. (color online) Cross section of the 187Re(n,2n)186g,(m)Re reaction.
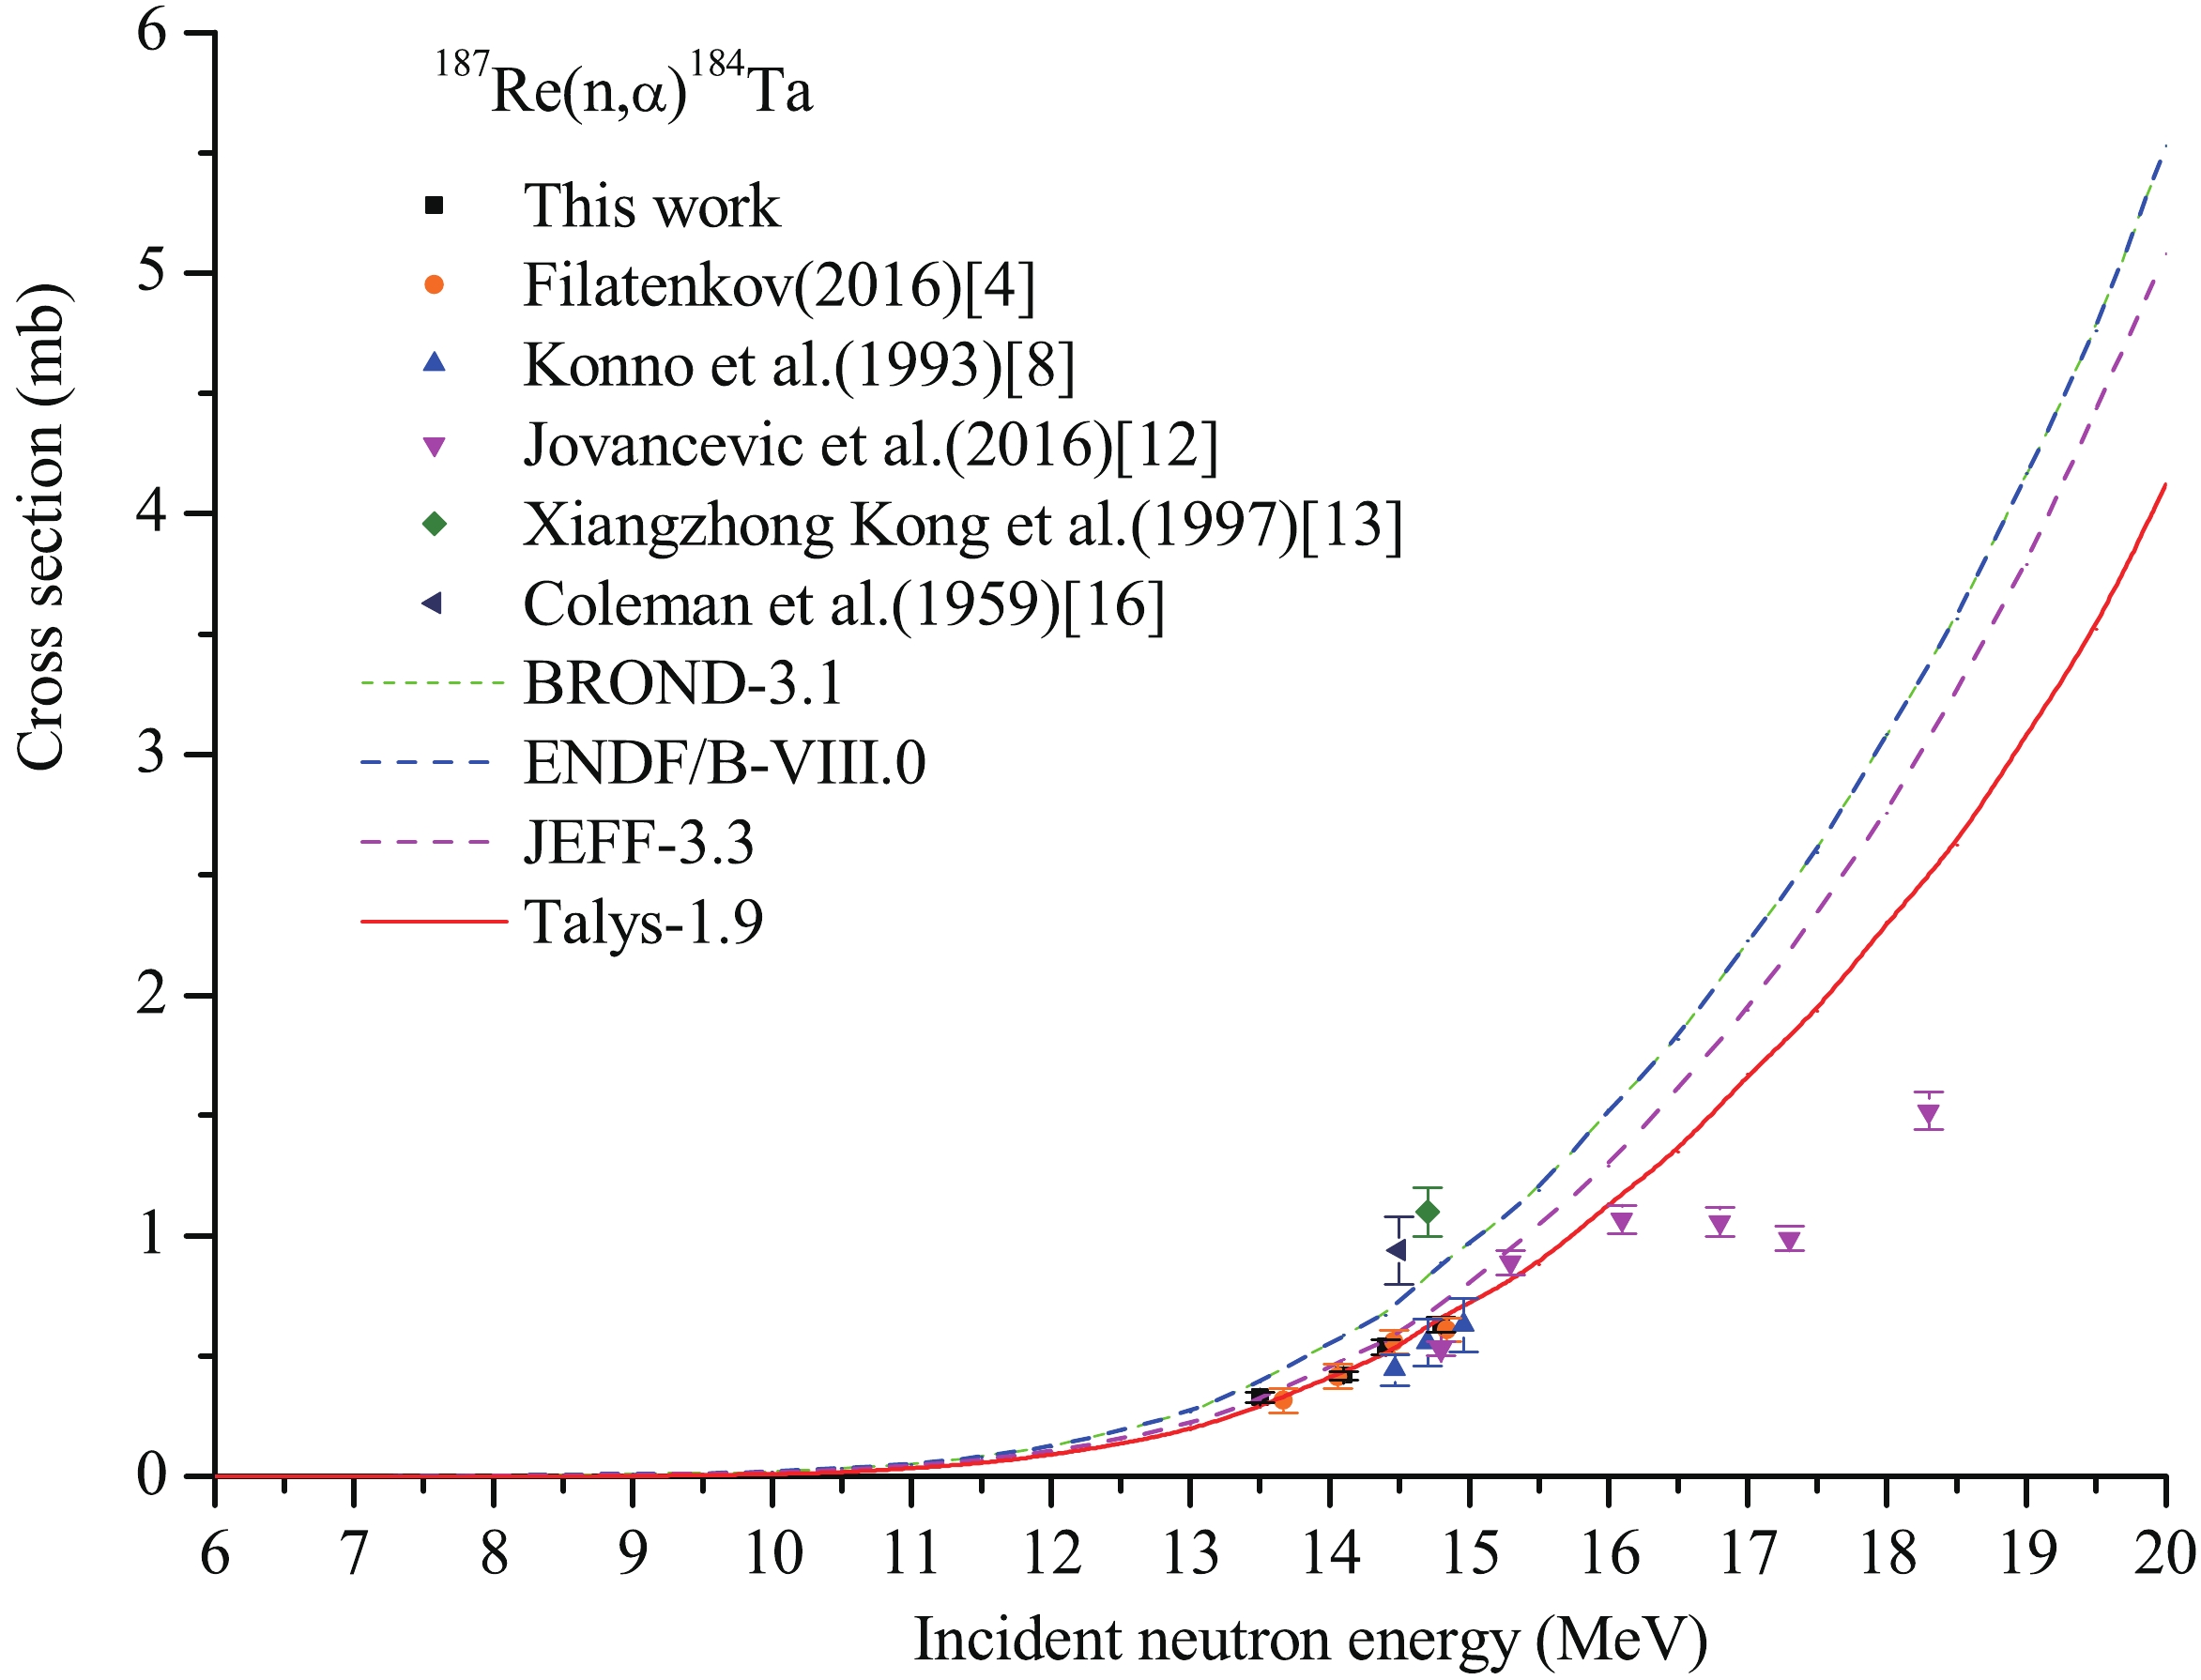
Figure 7. (color online) Cross section of the 187Re(n,α)184Ta reaction.
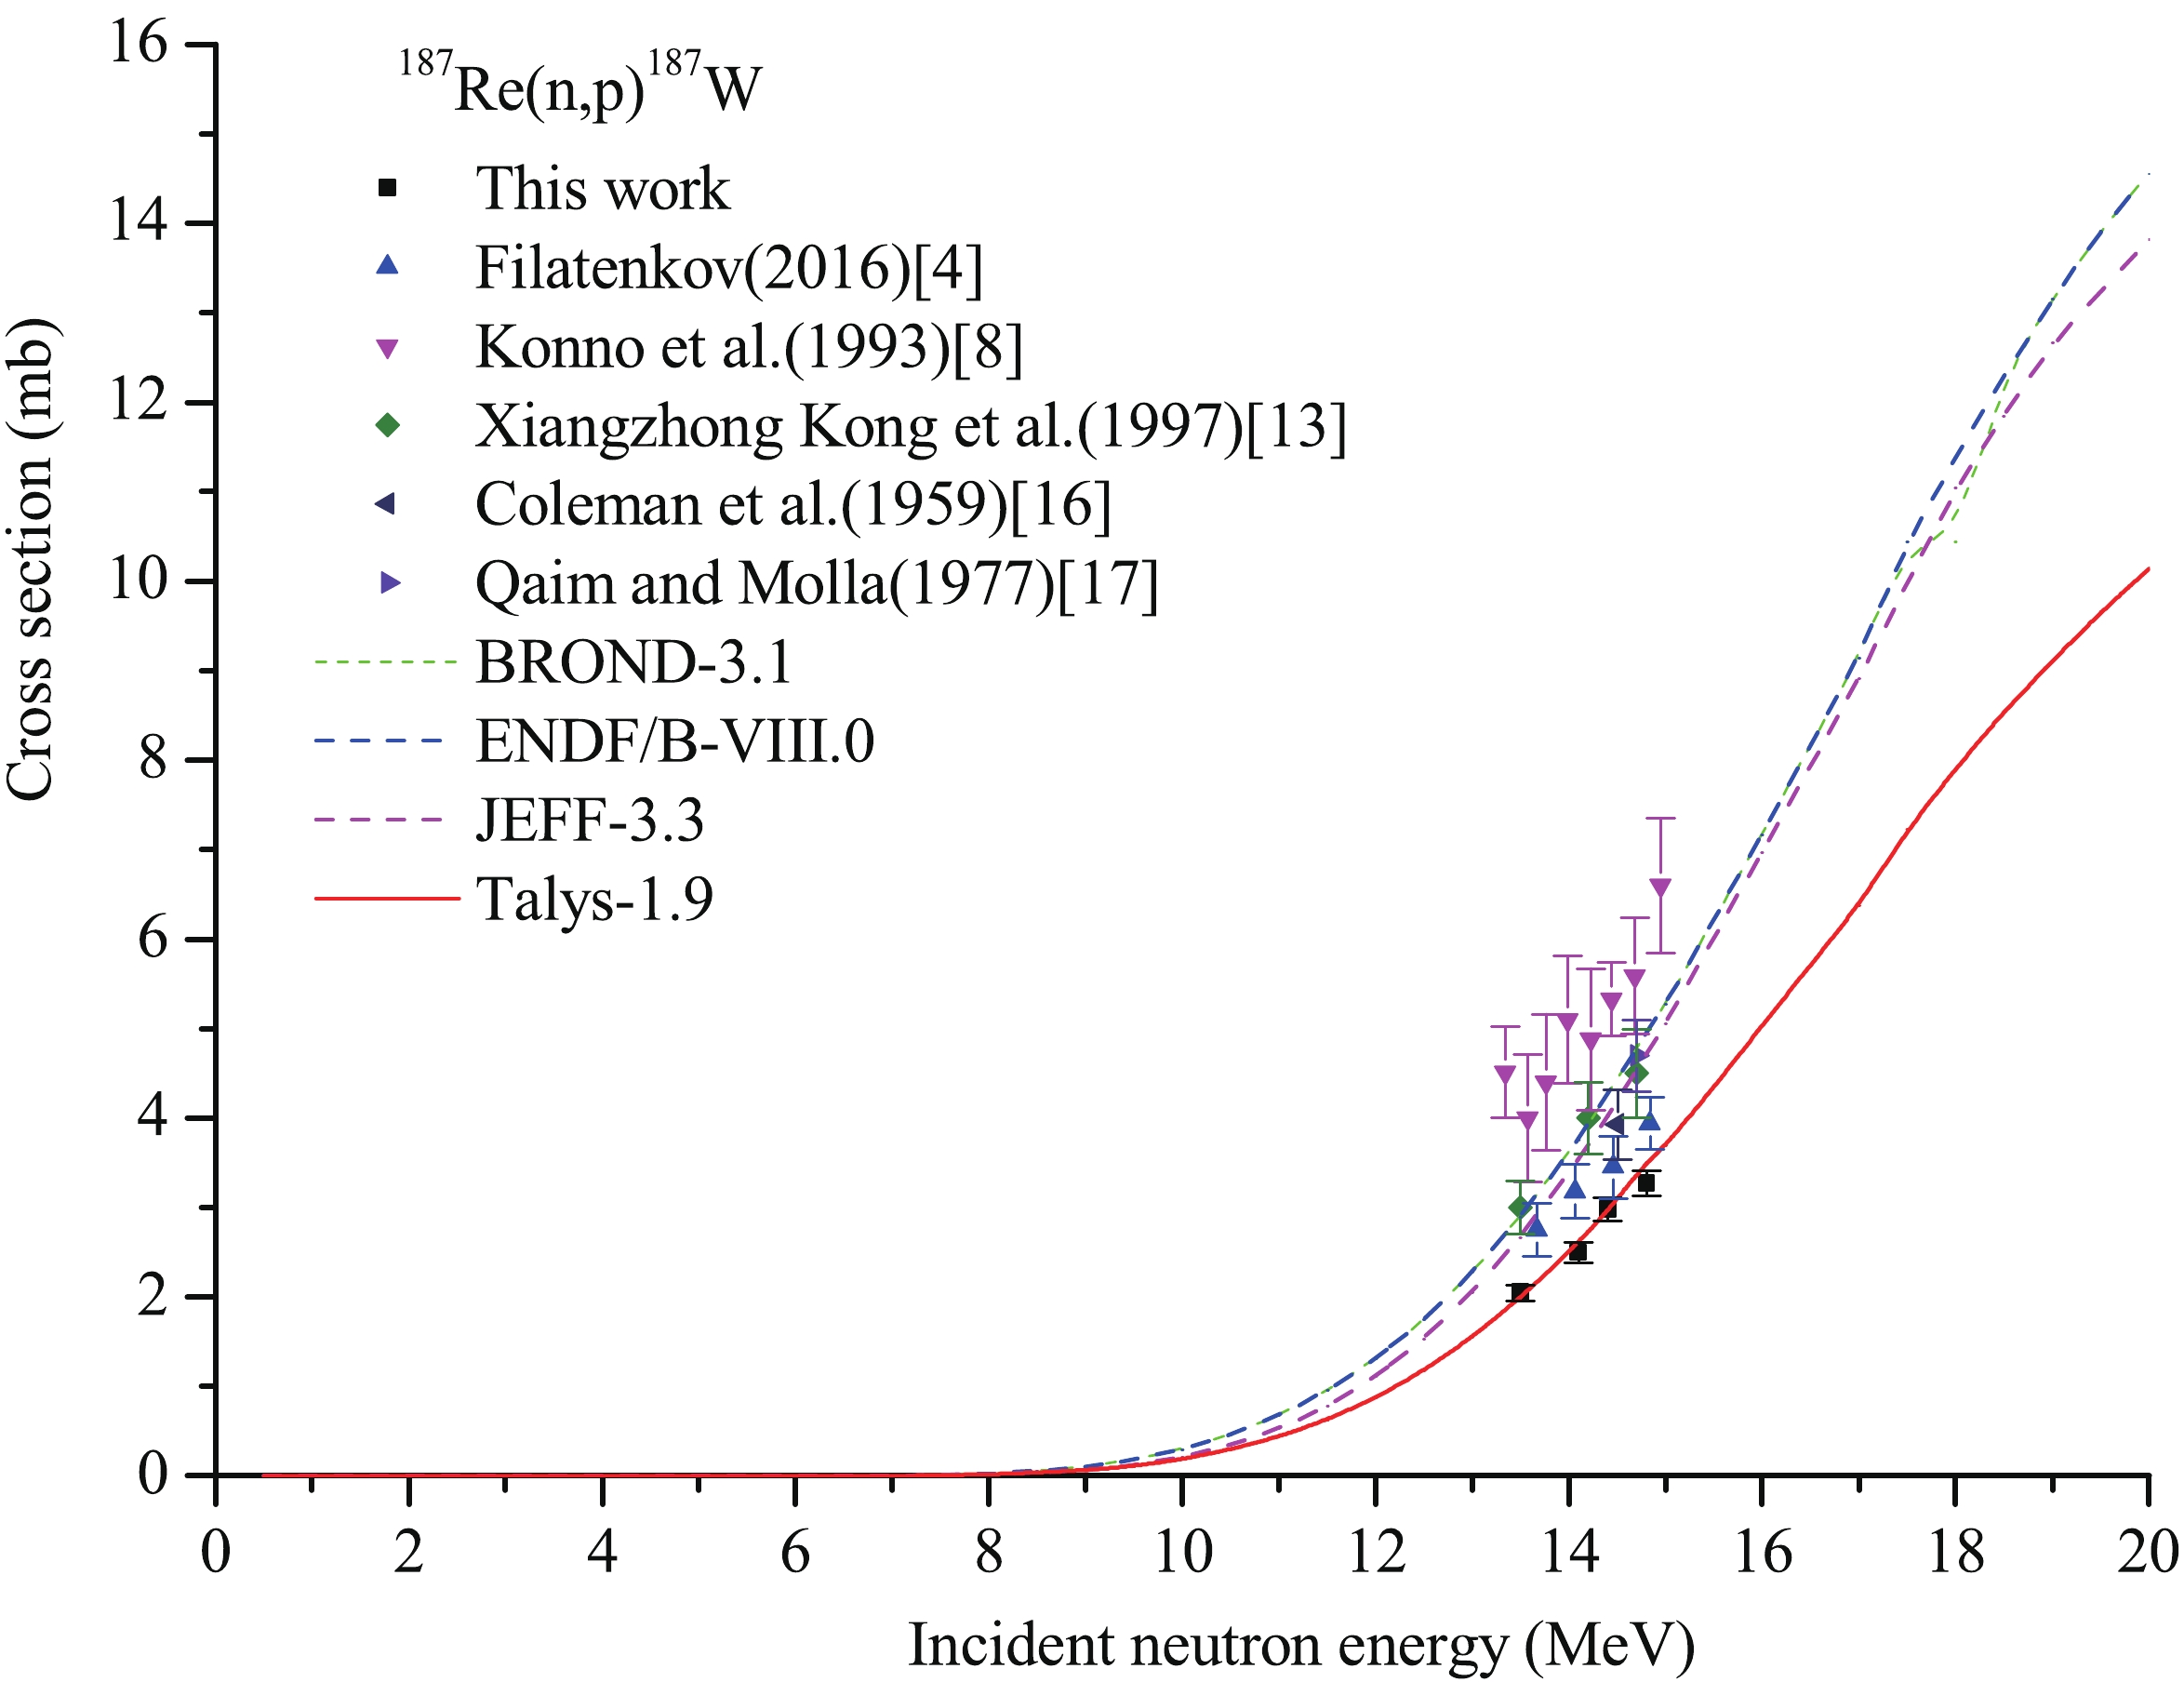
Figure 8. (color online) Cross section of the 187Re(n,p)187W reaction.
To obtain accurate cross-section values of the 185Re(n,2n)184gRe reaction, the effect of the decay of the excited state 184mRe on the ground state 184gRe and the contribution of the 792.07 keV γ-ray (intensity 3.69%) of 184mRe on the 792.07 keV γ-ray (intensity 37.7%) of 184gRe must be deducted. However, the former was not mentioned in Refs. [2, 7] and the latter was not mentioned in Refs. [4, 5]. Our experimental cross-section values of the 185Re(n,2n)184gRe reaction were deduced from Equation (1) and 792.07 keV and 1010.24 keV γ-rays of 184gRe, which are listed in Table 2 (marked with superscripts a and b) and charted in Fig. 4. In the process of calculation, the effect of the excited state 184mRe on the ground state 184gRe was deducted by using the method described in Ref. [27]. Simultaneously, the contribution of the 792.07 keV γ-ray of 184mRe on the 792.07 keV γ-ray of 184gRe was also subtracted by using the method described in Ref. [28].
The theoretical calculations of excitation functions of the 185Re(n,2n)184mRe, 185Re(n,2n)184gRe, 185Re(n,α)182m1+m2+gTa, 187Re(n,2n)186g,(m)Re, 187Re(n,α)184Ta, and 187Re(n,p)187W reactions were performed by using the nuclear theoretical model program system Talys-1.9. Different parameters in Talys-1.9 were adjusted according to our measured data and previous experiments conducted by other researchers for the different nuclear reactions mentioned above. For the 185Re(n,2n)184mRe reaction, the level density parameter at the neutron separation energy was adjusted. For the 185Re(n,2n)184gRe reaction, the optical model potential (OMP) parameter rV, aV, and the model for level densities were adjusted. For the 185Re(n,α)182m1+m2+gTa, 187Re(n,α)184Ta, and 187Re(n,p)187W reactions, the OMP parameter rV was adjusted. For the 187Re(n,2n)186g,(m)Re reaction, the OMP parameter rV and the model for level densities were adjusted.
-
The principal sources of uncertainty and their estimated values in the present study are given in Table 3.
Source of uncertainty Uncertainty (%) γ-ray detection efficiency 2 Standard cross section 1.1-1.5 Counting statistics 0.2-9.7 Weight of samples 0.1 Sample geometry 1.0 Self-absorption of γ ray 1.0 Neutron fluctuation 1.0 Relative γ-ray intensity 0.3-7.6 Half-life 0.02-4.7 Isotopic abundance 0.03-0.05 Total uncertainty 4.03-10.5 Table 3. Principal sources of uncertainty and their estimated values in the cross section measurements.
For the 185Re(n,2n)184mRe reaction, note from Table 2 and Fig. 3 that the theoretical excitation curve based on Talys-1.9 code increases with increasing neutron energy in the incident neutron energy range from the threshold to 15 MeV but decreases with increasing neutron energy in the incident neutron energy range from 15 to 20 MeV. Our experimental cross-section values are consistent, within experimental error, with those of the fitting line of the results of Chuanxin Zhu et al. [5] and the theoretical excitation curve based on Talys-1.9 code at the corresponding energies. The results reported by Kiraly et al. [6] and the value reported by Xiuyuan Wang et al. [9] at the neutron energy of 14.81 MeV, within experimental error, are consistent with those of the fitting line of the results of Chuanxin Zhu et al. [5] and our experimental values at the corresponding energies, and with those of the theoretical excitation curve based on Talys-1.9 code at the corresponding energies. In contrast, the results reported by Konno et al. [8], the values of Xiuyuan Wang et al. [9] at the neutron energies of 13.54, 13.73, and 14.67 MeV, and the value reported by Druzhinin et al. [10] are lower, whereas the cross-section values reported by Hanlin Lu et al. [7] and the results reported by Karam et al. [11] are higher.
For the 185Re(n,2n)184gRe reaction, Table 2 and Fig. 4 show that the results obtained in this study by using the two aforementioned γ-rays of 184gRe are highly consistent, within experimental error; the theoretical excitation curve based on Talys-1.9 code increases with increasing neutron energy in the incident neutron energy range from the threshold to 13 MeV but decreases with increasing neutron energy in the incident neutron energy range from 13 to 20 MeV, thereby matching most of the experimental data well. Our experimental cross-section values are consistent, within experimental error, with those of the fitting line of the results of Chuanxin Zhu et al. [5] and the theoretical excitation curve based on Talys-1.9 code at the corresponding energies. In contrast, the results reported by Hanlin Lu et al. [7] and those of Jovancevic et al. [12] at the neutron energies of 14.7, 15.3, and 16.1 MeV are higher, whereas the results reported by Filatenkov [4] and the cross-section values reported by Konno et al. [8] are lower.
For the 185Re(n,α) 182m1+m2 +gTa reaction, as shown in Table 2 and Fig. 5, three evaluated excitation curves of BROND-3.1, ENDF/B-VIII.0, JEFF-3.3 and the theoretical excitation curve based on Talys-1.9 code increase with neutron energy in the incident neutron energy range from the threshold to 20 MeV, but there are differences between them, except for the curves of BROND-3.1 and ENDF/B-VIII.0 (which are the same). The three evaluated excitation curves pass through the experimental point of Filatenkov [4], and the curve of JEFF-3.3 passes through the experimental points of Filatenkov [4] and Xiangzhong Kong et al. [13]. The theoretical excitation curve passes through our four experimental points. The experimental values reported by Filatenkov [4] and Xiangzhong Kong et al. [13] are higher than those of the fitting line of our experimental values and the theoretical excitation curve obtained by Talys-1.9 at the corresponding energies. A possible reason is that the interactions of γ-rays with the same or close energies should be avoided or deducted but not avoided or deducted, such as the cross-section value of the 185Re(n,α)182m1+m2+gTa reaction was deducted by the 1189.0 and 1221.4 keV γ-rays of 182gTa (half life 114.74 d) in Ref.[4], in the process of calculation. Likewise, the contribution of the 1121.29 keV (intensity 0.0202%) γ-ray of 184gRe (from the 185Re(n,2n)184gRe reaction) on the full-energy peak (FEP) count of the 1221.4 keV γ-ray of 182gTa should be deducted, which was not mentioned in Ref.[4].
For the 187Re(n,2n) 186g,(m)Re reaction, shown in Table 2 and Fig. 6, the trends of the evaluated excitation curves of BROND-3.1, ENDF/B-VIII.0, JEFF-3.3, and the theoretical excitation curve based on Talys-1.9 code decrease with increasing neutron energy around 14 MeV. However, the extent of their reduction is different, except for the curves of BROND-3.1 and ENDF/B-VIII.0 (which are the same). Our experimental cross-section values are consistent, within experimental error, with those of Druzhinin et al. [10], Karam et al. [11], and Khurana and Hans [15] at the same energies, and with those of the theoretical excitation curve based on Talys-1.9 code at the corresponding energies besides the neutron energy of 14.8 MeV. The value reported by Filatenkov [4] is consistent, within experimental error, with that of the fitting line of our experimental cross-section values at the corresponding energy. Note that the cross-section values of Xiangzhong Kong et al. [13] were deduced from Equation (1) and the 137.14 keV γ-ray (intensity 8.5%) of 186gRe (half life 3.777 d), whose latest value is 137.2 keV (intensity 9.47%) of 186gRe (half life 3.7183 d). The cross section values corrected with the latest parameter were 1693, 1698, and 1714 mb at the neutron energies of 13.5, 14.2, and 14.7 MeV, respectively, which are consistent with those of the fitting line of our experimental cross-section values, within experimental error. The results reported by Fan Tieshuan et al. [14] are considerably higher than the other experimental values (including ours) and those of the theoretical excitation curve at the corresponding energies. Compared with the three evaluation curves, the theoretical curve based on Talys-1.9 code is in better agreement with the experimental results.
For the 187Re(n,α)184Ta reaction, shown in Table 2 and Fig. 7, the trends of the three evaluated excitation curves of BROND-3.1, ENDF/B-VIII.0, JEFF-3.3, and the theoretical excitation curve based on Talys-1.9 code increase with increasing neutron energy in the incident neutron energy range from the threshold to 20 MeV, but there are differences between them, except for the curves of BROND-3.1 and ENDF/B-VIII.0 (which are the same). Our experimental cross-section values are consistent, within experimental error, with those of the fitting lines of the results reported by Filatenkov [4] and the corrected cross-section values reported by Konno et al. [8], which were corrected with the latest intensity, 72%, of the 414.01 keV γ-ray of 184Ta instead of 74%, and with those of the theoretical excitation curve based on Talys-1.9 code at the corresponding energies. Comparison with the three evaluation curves shows that the obtained theoretical excitation curve based on Talys-1.9 code can match most of the experimental data. In contrast, the values of Jovancevic et al. [12] at the neutron energies of 16.8, 17.3, and 18.3 MeV are lower, and the values of Xiangzhong Kong et al. [13] and Coleman et al. [16] are higher.
For the 187Re(n,p)187W reaction, shown in Table 2 and Fig. 8, the trends of the three evaluated excitation curves of BROND-3.1, ENDF/B-VIII.0, JEFF-3.3, and the theoretical excitation curve based on Talys-1.9 code increase with increasing neutron energy in the incident neutron energy range from the threshold to 20 MeV, but there are differences between them, except for the curves of BROND-3.1 and ENDF/B-VIII.0 (which are the same). Our experimental cross-section values are consistent, within experimental error, with those of the theoretical excitation curve based on Talys-1.9 code at the corresponding energies. These previous experimental values and those of the three evaluated excitation curves at the corresponding energies are all significantly higher than our experimental cross-section values. The reason may be that the cross-section values of the 187Re(n,p)187W reaction were deduced by the 479.53 keV (intensity 26.6%) γ ray of 187W (half life 24.0 h) in Refs. [4, 8, 13, 17], and in the process of calculation, the contribution of the 478.0 keV (intensity 1.017%) γ ray of 188gRe (from the 187Re (n,γ) 188gRe reaction) on the FEP count of the 479.53 keV γ ray of 187W should be deducted but not deducted; moreover, the data in Ref. [16] were obtained via β-ray counting.
-
Experimental cross-section data of the 185Re(n,2n)184mRe, 185Re(n,2n)184gRe, 185Re(n,α)182m1+m2+gTa, 187Re(n,2n)186g,(m)Re, 187Re(n,α)184Ta, and 187Re(n,p)187W reactions were measured in the neutron energy range of 13.5-14.8 MeV via the activation technique. The excitation functions of the aforementioned six reactions in the neutron energies from the threshold to 20 MeV were calculated by adopting the nuclear theoretical model program system Talys-1.9 with the relevant parameters properly adjusted. The measured cross sections were discussed and compared with previous experiments by other researchers, and with the evaluated data of BROND-3.1, ENDF/B-VIII.0, JEFF-3.3, and the theoretical results based on Talys-1.9 code. In general, our experimental cross-section values are consistent, within experimental error, with those of previous experiments and theoretical excitation curves at the corresponding energies. Comparison with these evaluation curves shows that the theoretical excitation curves based on Talys-1.9 code agree well with the experimental results. The new measured results in the present study would improve the quality of the neutron cross section database and are expected to assist with new evaluations of cross sections on rhenium isotopes in the incident neutron energy range from the threshold to 20 MeV. In addition, the theoretical excitation curves are relevant for the design of fusion reactors and related applications.
-
We thank the personnel of the K-400 Neutron Generator at Institute of Nuclear Physics and Chemistry, China Academy of Engineering Physics, for performing the irradiation work.
Cross section measurements for ${{(n,2n), (n,\alpha)}} $ , and ${{(n,p)}} $ reactions on rhenium isotopes around 14 MeV neutrons and their theoretical calculations of excitation functions
- Received Date: 2021-02-03
- Available Online: 2021-07-15
Abstract: Cross-section data of the 185Re(n,2n)184mRe, 185Re(n,2n)184gRe, 185Re(n,α)182m1+m2+gTa, 187Re(n, 2n)186g,(m)Re, 187Re(n,α)184Ta, and 187Re(n,p)187W reactions were measured at four neutron energies, namely 13.5, 14.1, 14.4, and 14.8 MeV, by means of the activation technique, relative to the reference cross-section values of the 93Nb(n,2n)92mNb reaction. The neutrons were generated from the T(d,n)4He reaction at the K-400 Neutron Generator at China Academy of Engineering Physics. The induced γ activities were measured using a high-resolution γ-ray spectrometer equipped with a coaxial high-purity germanium detector. The excitation functions of the six above-mentioned nuclear reactions at neutron energies from the threshold to 20 MeV were calculated by adopting the nuclear theoretical model program system Talys-1.9 with the relevant parameters properly adjusted. The measured cross sections were analyzed and compared with previous experiments conducted by other researchers, and with the evaluated data of BROND-3.1, ENDF/B-VIII.0, JEFF-3.3, and the theoretical values based on Talys-1.9. The new measured results agree with those of previous experiments and the theoretical excitation curve at the corresponding energies. The theoretical excitation curves based on Talys-1.9 generally match most of experimental data well.


 DownLoad: