


 Abstract
 HTML
HTML Reference
 Related
 PDF
PDF


-
NUBASE2020 is an evaluated nuclear data library that contains the recommended values of the main nuclear physics properties: masses, excitation energies (for excited isomers), half-lives, spins and parities and decay modes, and their intensities, for all known nuclei in their ground and excited, isomeric (T
$ _{1/2} $ $ \ge $ 100 ns) states. It also includes information for yet unobserved nuclides that is based on systematic trends of nuclear properties in neighboring nuclei. The present publication includes updated results for these properties, which were reported in previous versions of this library [1–4]. The recommended data are presented in Table I.The information included in NUBASE2020 represents the fundamental building blocks of the modern nuclear physics, and specifically of the nuclear structure and nuclear astrophysics research. One of the main applications of NUBASE2020 is the “Atomic Mass Evaluation” (AME2020 - the second and third articles included in this issue) where it is imperative to have an unambiguous identification of all states involved in a particular decay, reaction or mass-spectrometry measurement. This is the main reason for coupling the two evaluations together in the present issue. Furthermore, with the advances of modern mass-spectrometry techniques and the availability of intense stable and rare-isotope beams, a large number of short-lived nuclei can be produced in a single experiment and their masses can be measured with a high precision. Thus, NUBASE2020 can be a trusted source of information in future mass measurements, where an unambiguous identification of specific nuclides in complex mass-spectrometry data would be required.
NUBASE2020 also serves nuclear structure research, astrophysics network calculations, and theoretical studies of nuclear properties, where complete, up-to-date and reliable data for all known nuclei are needed. It can be particularly useful in present and future studies of nuclei and their properties at the major nuclear physics facilities around the world, such as FAIR, ISOLDE and SPIRAL2 (Europe), ATLAS and FRIB (USA), HIAF (China), RIBF at RIKEN (Japan), ISAC and ARIEL (Canada), and elsewhere.
Furthermore, the evaluated data included in NUBASE2020 are a valuable source of information for specialists in a number of applied nuclear fields, such as safeguards, nuclear forensics, reactor engineering, waste management, material analysis, medical diagnostics and radiotherapy, and elsewhere, where one needs to access reliable nuclear physics information for any nuclide.
The recommended data included in NUBASE2020 fulfill several user-demanded requirements, namely that they are: a) complete
$ - $ include all measured quantities and their uncertainties, b) up-to-date$ - $ include results from all recent publications, c) credible and reliable$ - $ identify and resolve contradictory results that exist in the scientific literature, as well as in other nuclear physics databases, d) properly referenced$ - $ provide comprehensive bibliographical information for all included properties.In general, NUBASE2020 was updated via three different routes: a) directly from the literature by compiling and evaluating data that were published in primary (nuclear physics journals) and secondary (abstracts, conference proceedings, private communications, theses, arXiv publications and laboratory reports) references; b) by consulting, and when merited by adopting, recommendations made in topical evaluations that include nuclear properties covered by NUBASE (see the text for details); c) by consulting, and when merited by adopting, recommended values from the “Evaluated Nuclear Structure Data File” (ENSDF) database [5].
It is important to note that data presented in ENSDF and in other topical evaluations were carefully examined, and only results that were found to be valid and up-to-date were considered. In general, the content of ENSDF is very large, since it encompasses the complex nuclear structure and decay properties for all nuclei and all excited nuclear states. Maintenance of this library requires an enormous effort and it is not surprising that occasionally some older data are missing or misrepresented, and that some recent data are not included. When such cases were identified, the data were re-evaluated and the corresponding conclusions were added as comments in Table I.
The content of NUBASE2020, together with the adopted policies that were used during the development of this nuclear physics data library, is described below. All experimental data available to the authors by October 30, 2020 were considered.
-
The NUBASE2020 evaluation contains recommended properties for the ground state of 3340 nuclides and for 1938 excited isomeric (T
$ _{1/2} $ $ \ge $ 100 ns) states, derived from all available experimental data. It also includes information for yet unobserved nuclei (218 in their ground state and 45 excited isomers) whose properties were estimated by following the systematic trends in neighboring nuclei (TNN, see section 3.1).For each nuclide and for each state (ground or isomeric), the following properties were compiled and, when necessary, evaluated: mass excess, excitation energy of the excited isomeric state, half-life, spin and parity, decay modes and their intensities, isotopic abundance (for stable nuclides), year of discovery and the corresponding bibliographical information for all experimental values of the above items.
-
In general, the knowledge of atomic masses can provide valuable information on the lifetimes of nuclear states and their decay modes, and in particular on the
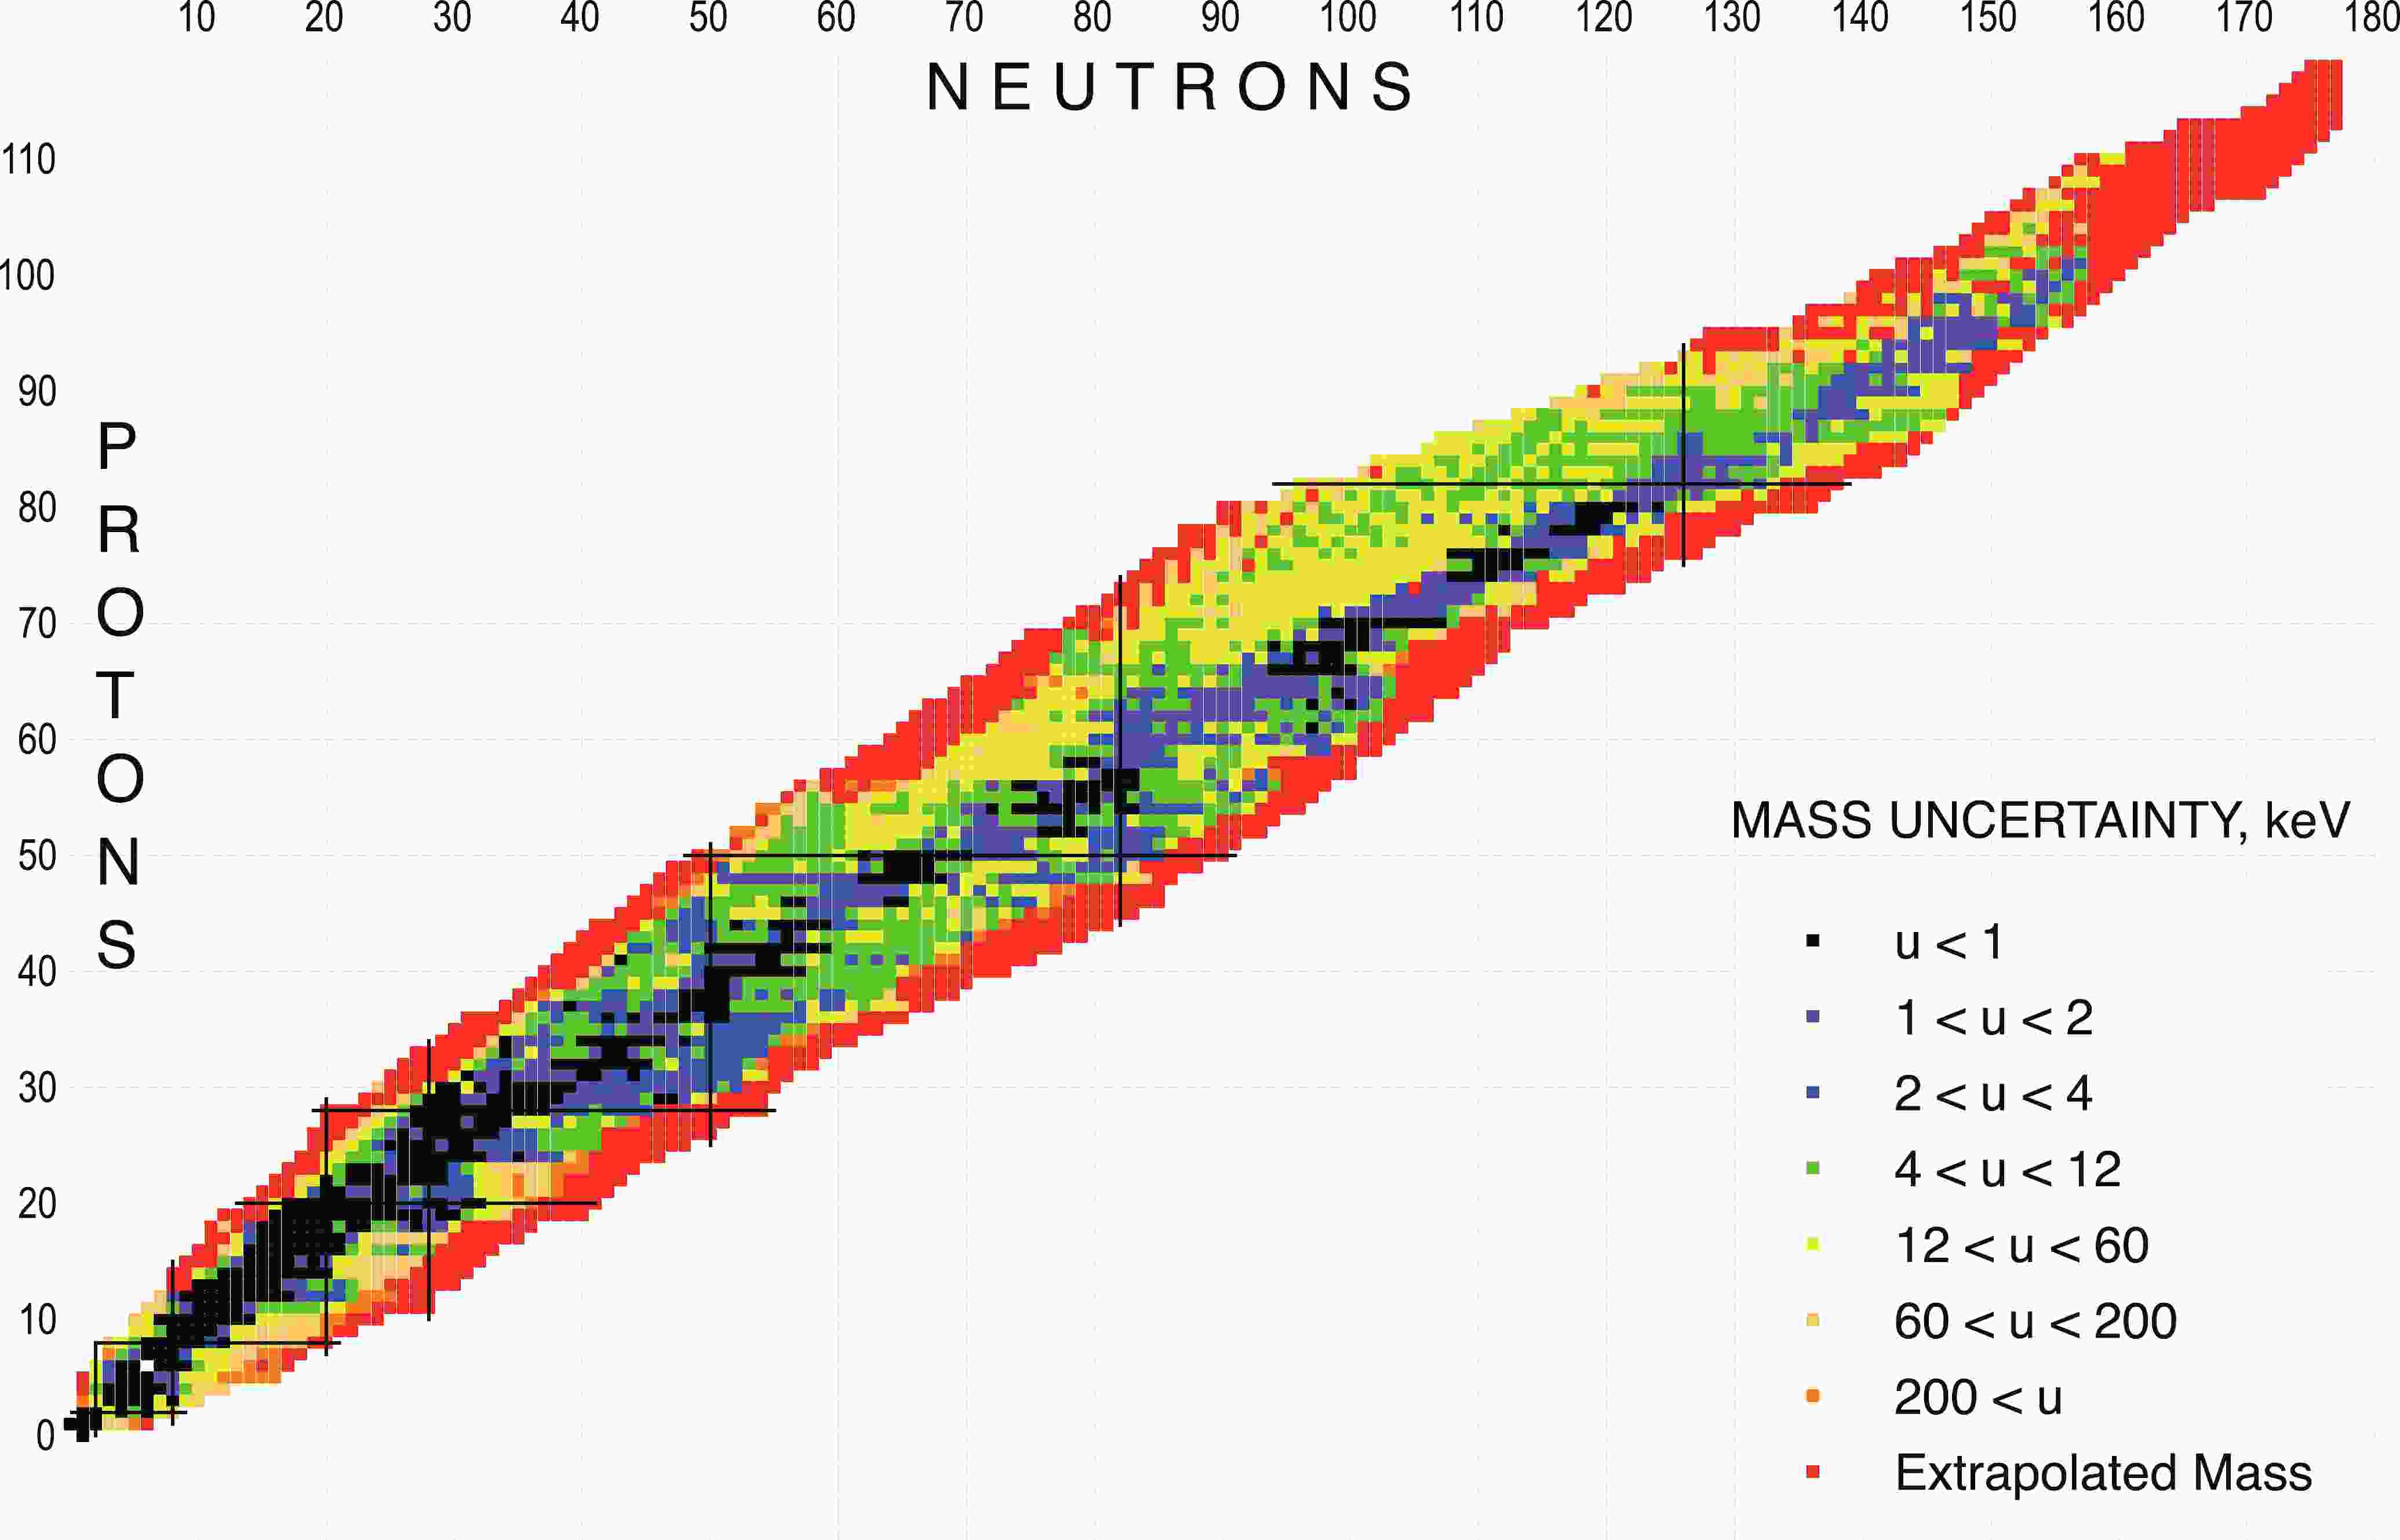
$ \beta $ -delayed particle decay probabilities for nuclei far from the line of stability.The mass-excess values and their uncertainties that are presented in Table I were adopted from the latest edition of the Atomic Mass Evaluation, AME2020, as described in the second and third articles of the present issue. Figure 1 displays the uncertainties of the mass-excess values as a function of N and Z.

Figure 1. Nuclear chart displaying the mass-excess uncertainties for all nuclei in their ground state.
-
Nuclear isomers are excited, intrinsic (single-particle in nature) states with lifetimes ranging from nanoseconds (or even shorter) to years. There are several recent compilations and review articles, where the physics of nuclear isomers was discussed in detail and the reader is referred to Refs. [6, 7] and references therein.
Following the NUBASE2003 publication [2], the present evaluation includes isomeric states with half-lives longer than 100 ns. Although this limit is somewhat arbitrary, the main reason for this choice was to include all short-lived isomers that can be directly produced at the present and future accelerator beam facilities and that can survive the time-of-flight path of the employed recoil mass separator, and as a consequence, their decay properties and/or masses can be directly measured.
Figure 2 shows a compilation of all such known isomers as a function of N and Z.
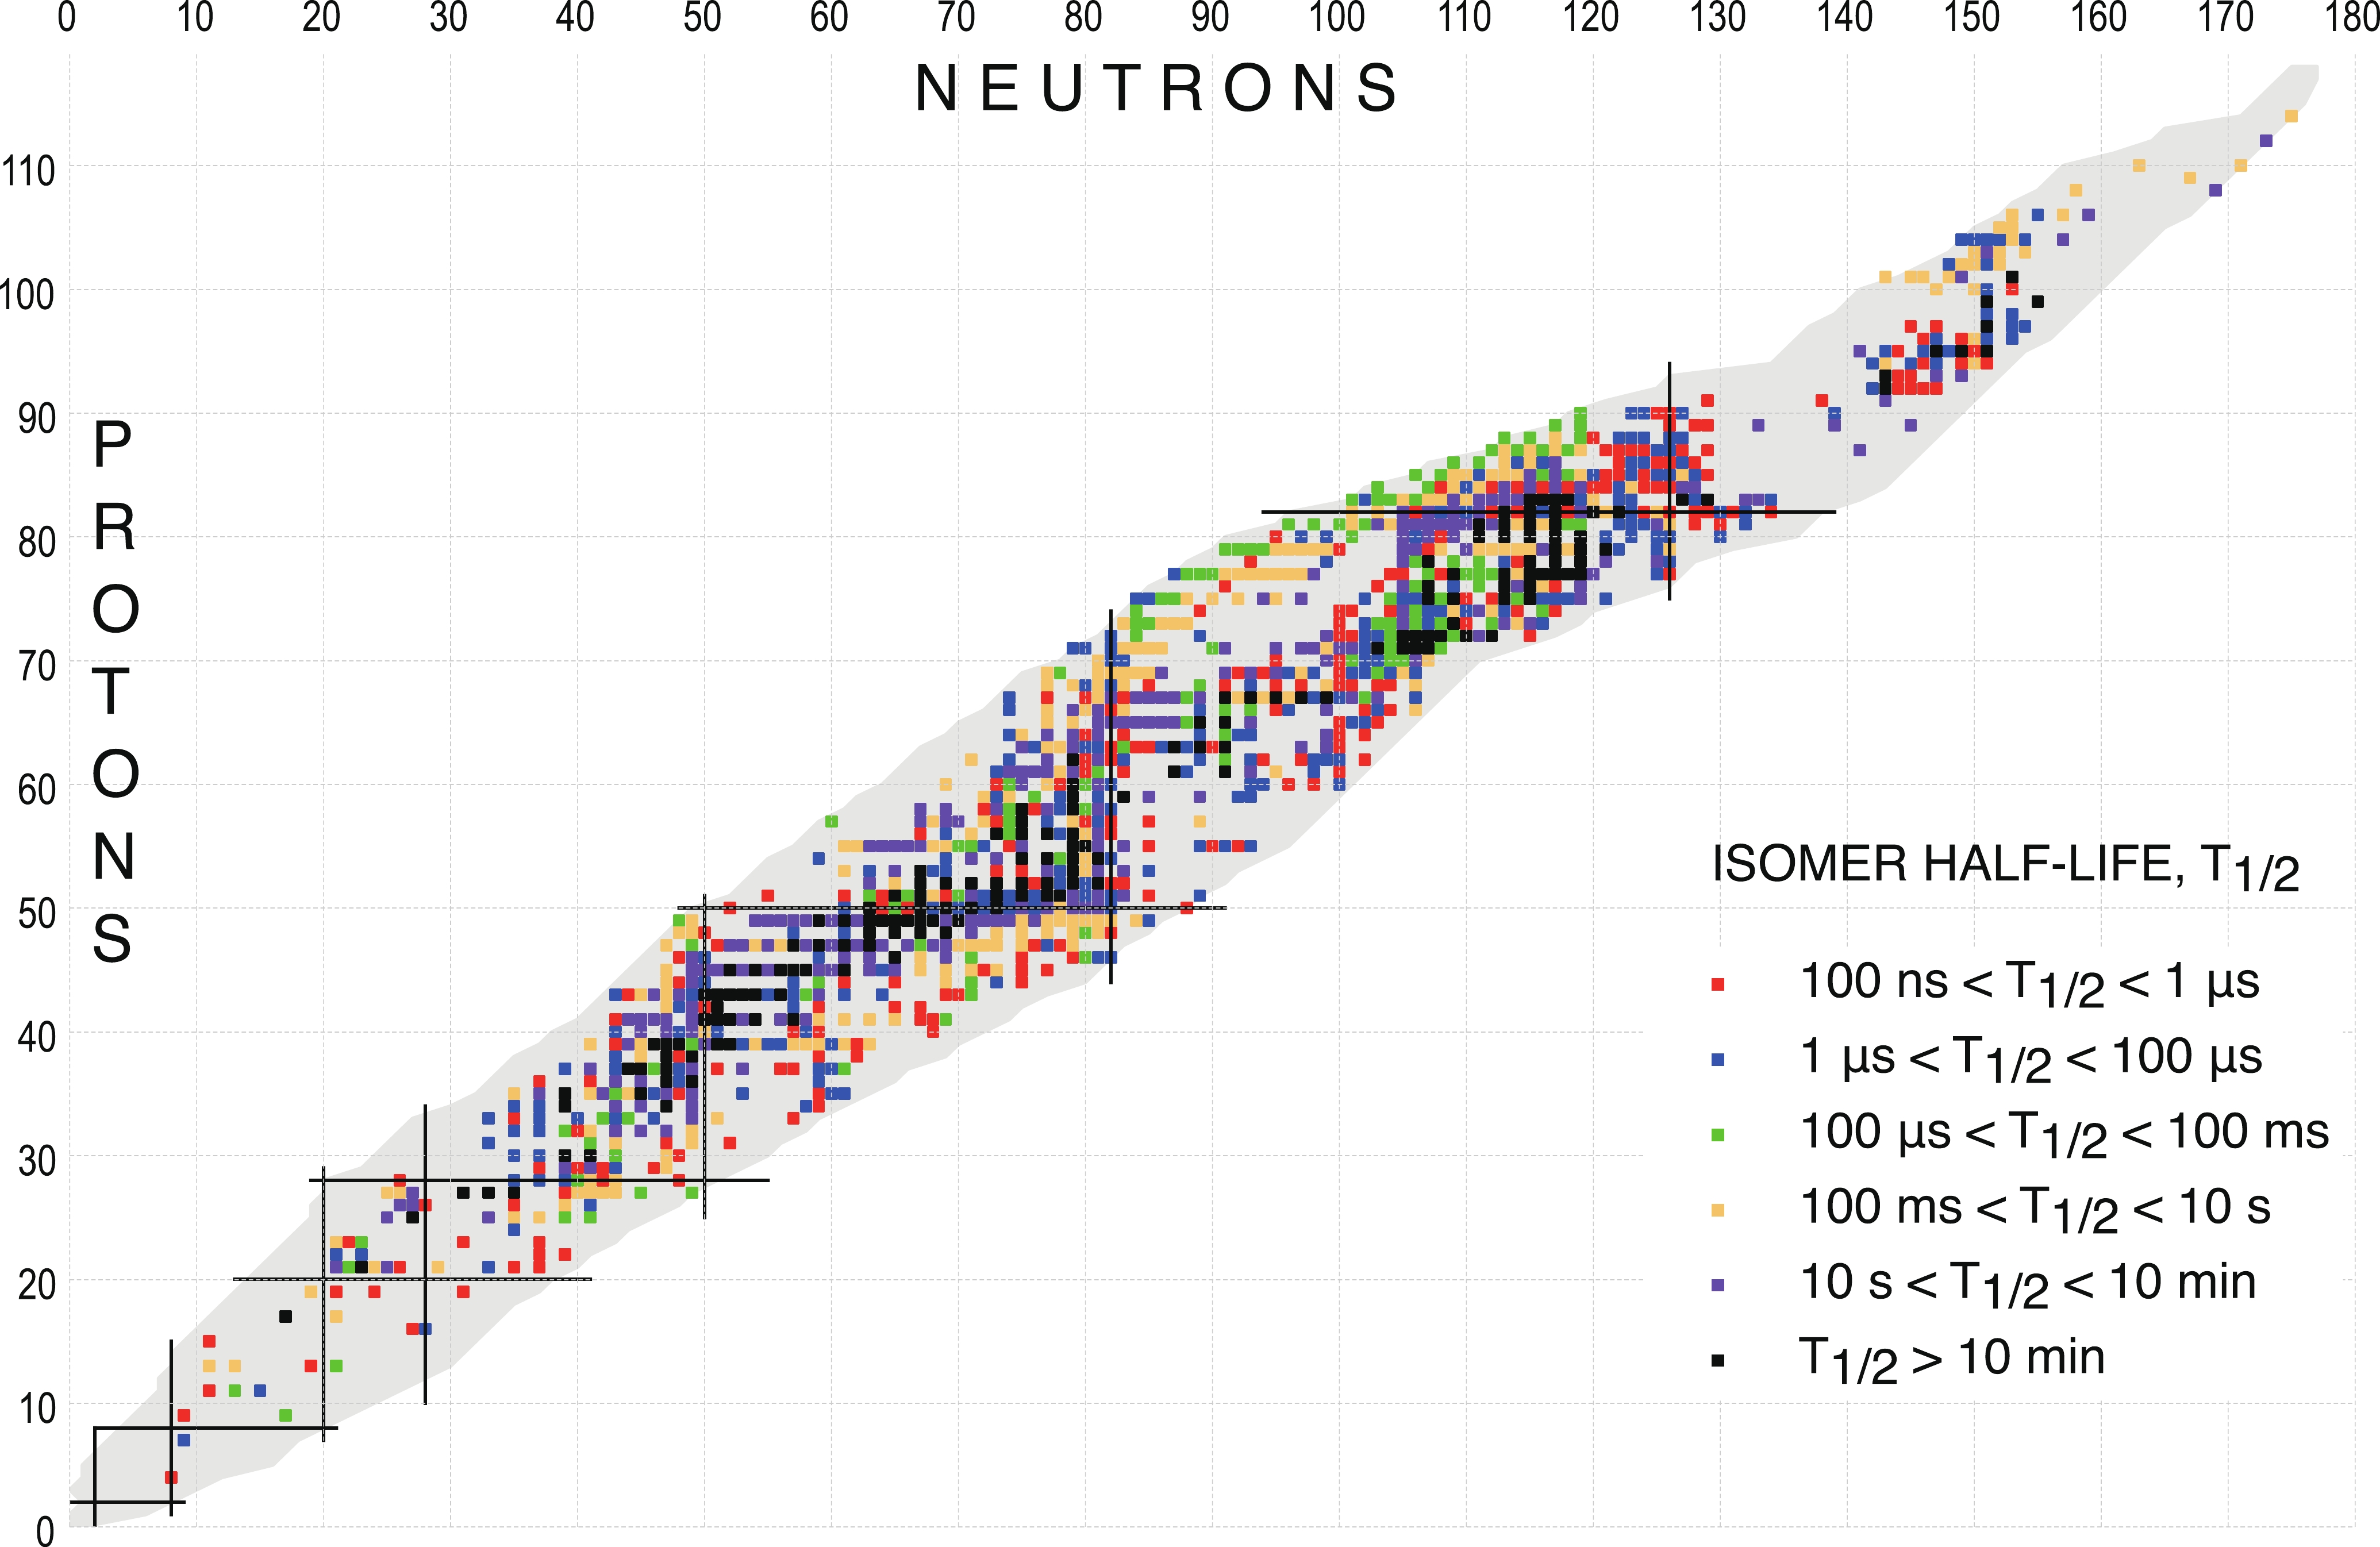
Figure 2. Nuclear chart displaying isomeric states with T
$ _{1/2} $ $ \geq $ 100 ns. For a given isotope where multiple isomers exist, only the longest-lived state is plotted.Isomers are listed in Table I in the order of increasing excitation energy and they are identified by the letters ‘m’, ‘n’, ‘p’, ‘q’, or ‘r’ which are appended to the nuclide name, e.g.
$ ^{90} $ Nb for the ground state,$ ^{90} $ Nb$ ^m $ for the first excited isomer,$ ^{90} $ Nb$ ^n $ ,$ ^{90} $ Nb$ ^p $ ,$ ^{90} $ Nb$ ^q $ , and$ ^{90} $ Nb$ ^r $ for the second, third, fourth and fifth ones, respectively. In four cases, namely$ ^{98} $ Y,$ ^{174} $ Lu,$ ^{179} $ Ta and$ ^{214} $ Ra, a sixth isomer is presented and they were labeled with the letter ‘x’ (see the Explanation of Table I for details).The excitation energy of an isomeric states is determined by different experimental methods, which are generally attributed to the category of either internal or external relations. A typical internal relation involves the
$ \gamma $ -ray energy, or the energies of a cascade of$ \gamma $ rays, associated with the isomer decay. The most-accurate values for the excitation energies of isomers that are deduced by this approach can be determined by a least-squares fit to the energies of all$ \gamma $ rays observed along the decay path of a particular isomer. In cases where internal relations cannot be established, connections to other nuclides (external relations) can be used to deduce the mass difference (excitation energy) between the ground state and isomers, and the excitation energies are taken from AME2020.The method used to establish the external relation for a particular isomer (the origin) is indicated by a two-letter code in Table I, next to the isomer excitation energy (see the Explanation of Table I for details). For internal relations, the origin field is left blank and the numerical values are taken either from ENSDF or from literature updates, where a least-squares fit to the measured
$ \gamma $ -ray energies was performed, whenever possible.There are also cases where the energy difference between the isomer and the ground state can be obtained by both the internal and one, or more, external relations with comparable accuracies. In such cases, the excitation energy of the isomer is taken from AME2020. For example, the mass of
$ ^{178} $ Lu$ ^m $ is determined in AME2020 at 66% from E$ _{x} $ (IT) = 120(3) keV [1993Bu02] and at 34% from$ ^{176} $ Lu(t,p)$ ^{178} $ Lu$ ^m $ = 4482(5) keV [1981Gi01], resulting in an adjusted excitation energy of 123.8(2.6) keV for the isomer.In contrast to ENSDF, where the isomer excitation energies may not be quantified and are often given as floating levels with ‘+X’, ‘+Y’, etc., estimated values are always provided in NUBASE2020, based on theoretical considerations or TNN. In such cases, the reported excitation energies are considered as a non-experimental quantity and the values are flagged with the symbol ‘#’.
When the existence of an isomer is uncertain and it is still under discussion, it is flagged with ‘EU’ (“Existence Uncertain”) in the origin field. A comment is usually added to indicate why the existence of this state is questioned or where this issue is discussed in more detail. Eleven isomers, namely
$ ^{138} $ Pm$ ^{m} $ ,$ ^{142} $ Nd$ ^{m} $ ,$ ^{144} $ Cs$ ^{n} $ ,$ ^{152} $ Pm$ ^{n} $ ,$ ^{156} $ Tm$ ^{m} $ ,$ ^{162} $ Lu$ ^{n} $ ,$ ^{174} $ W$ ^{m} $ ,$ ^{174} $ W$ ^{n} $ ,$ ^{185} $ Bi$ ^{n} $ ,$ ^{190} $ Tl$ ^{n} $ , and$ ^{273} $ Ds$ ^{m} $ are treated in this way in the present evaluation. Nevertheless, the mass excess and excitation energy values are given for all of them, except for$ ^{138} $ Pm$ ^{m} $ ,$ ^{142} $ Nd$ ^{m} $ ,$ ^{144} $ Cs$ ^{n} $ ,$ ^{152} $ Pm$ ^{n} $ ,$ ^{174} $ W$ ^{m} $ ,$ ^{174} $ W$ ^{n} $ , and$ ^{190} $ Tl$ ^{n} $ , where the existence is strongly doubted.When an isomer was initially reported as “discovered”, but later this was proven to be an error, such a case is flagged with ‘RN’ (“Reported Non-existent”) in the origin field. Nine isomers, namely
$ ^{76} $ Cu$ ^{m} $ ,$ ^{84} $ Ga$ ^{m} $ ,$ ^{84} $ As$ ^{m} $ ,$ ^{85} $ Nb$ ^{n} $ ,$ ^{86} $ Nb$ ^{n} $ ,$ ^{117} $ La$ ^{m} $ ,$ ^{181} $ Pb$ ^{m} $ ,$ ^{196} $ Pb$ ^{m} $ , and$ ^{197} $ Bi$ ^{n} $ are treated in this way and no mass excess or excitation energy values are given. Similarly to the ‘EU’ cases, a “non-exist” label is also added. The use of the two flags, ‘EU’ and ‘RN’, was extended to cases where the discovery of a nuclide is questioned (e.g.$ ^{260} $ Fm or$ ^{289} $ Lv or$ ^{293} $ Og). However, an estimate for the ground state mass, derived from Trends from the Mass Surface (TMS), is always given in AME2020 and NUBASE2020.Sometimes, upper and lower limits are known for the excitation energy of the isomeric state. Such cases are treated with uniform probability distribution, as explained in section 3.2. For example, there is solid experimental evidence [1974De47] that the excitation energy of the
$ ^{162} $ Tm$ ^m $ isomer is between the 66.9 keV and 192.0 keV levels and this information is presented (after rounding) in Table I as$ E_x = 130(40) $ keV.When it is not clear which state is the ground state and which one is the isomer, the flag ‘
$ * $ ’ is added in Table I. Similarly, when the uncertainty of the isomer excitation energy,$ \Delta $ $ E_{x} $ , is relatively large compared to$ E_x $ , e.g.$ \Delta $ $ E_{x} $ $ > $ $ E_x/2 $ , the assignment of the level as a ground or isomeric state is also considered to be uncertain and it is flagged with the symbol ‘$ * $ ’, as well.Based on new experimental mass information, the ordering of several ground and excited isomeric states was reversed in the present work, when compared to the recommendations in ENSDF, and such cases are flagged with the symbol ‘&’ in Table I. In a few other instances, evidence was found for a state that is located below the adopted in ENSDF ground state and such results were also flagged with the symbol ‘&’ in Table I. It is worth noting that because of the coupling between NUBASE2020 and AME2020 all changes in the ordering of nuclear levels are firmly established and synchronized.
-
NUBASE2020 contains information for 205 Isobaric Analog States (IAS), which are labeled in Table I with the isospin multiplet value, T. Their excitation energies were determined via either the “internal” or “external” relation. The IAS nuclides are generally marked with the i or j superscripts, except for eight excited isomers,
$ ^{16} $ N$ ^m $ ,$ ^{26} $ Al$ ^m $ ,$ ^{34} $ Cl$ ^m $ ,$ ^{38} $ K$ ^m $ ,$ ^{46} $ V$ ^m $ ,$ ^{50} $ Mn$ ^m $ ,$ ^{54} $ Co$ ^m $ , and$ ^{70} $ Br$ ^m $ . The isospin value is not given for most nuclei in their ground state, since they have T =$ \mid {T_{z}} \mid $ =$ \frac{1}{2} $ $ \mid(N-Z)\mid $ . However, it is included for the ground state of the$ N = Z $ , odd-odd$ ^{34} $ Cl,$ ^{42} $ Sc,$ ^{46} $ V,$ ^{50} $ Mn,$ ^{54} $ Co,$ ^{62} $ Ga,$ ^{66} $ As,$ ^{70} $ Br, and$ ^{74} $ Rb ($ T = 1 $ ) and$ ^{30} $ P,$ ^{38} $ K, and$ ^{58} $ Cu ($ T = 0 $ ) nuclides.Detailed experimental information about IAS was recently compiled in Refs. [8, 9].
-
The lifetime is a fundamental property of a nuclear level. It is related to the total decay width,
$ \Gamma $ , a linear sum of all partial decay widths ($ \gamma $ ray, conversion electrons,$ \alpha $ decay,$ \beta $ decay, fission, etc.), through the uncertainty relationship:$ \Gamma = \frac{\hbar}{\tau} $

(1) where
$ \tau $ = T$ _{1/2} $ /ln(2) is the level mean life and T$ _{1/2} $ is the half-life.Figures 3 displays the ground-state half-life as a function of N and Z for all nuclei included in Table I.

Figure 3. Nuclear chart displaying the ground-state half-lives for all nuclei.
Some light nuclei (A
$ < $ 30) that are located beyond the particle drip-lines are known to exist for a very short time before disintegrating by particle emissions. In such cases only the total level width can be measured and the half-life is deduced by means of equation 1 (in convenient units):$ T_{1/2} \; [{\rm{s}}] \simeq 4.562 \times 10^{-22} / \Gamma\; [{\rm{MeV}}] $

(2) where
$ \Gamma $ is the total width in the center of mass frame. The heaviest nuclide whose half-life is determined by this approach is$ ^{29} $ Cl.The following units are used in NUBASE2020 for a convenient display of half-lives: seconds (s) and its sub-units, minutes (m), hours (h), days (d) and years (y), and its sub-units (see Explanation of Table I for details). While several definitions can be used to convert values between years and days or seconds, such as Julian year, Gregorian year, Sidereal year, Tropical year and others, the conversion via Tropical year is adopted in NUBASE2020:
$ 1\;y {\rm{ = 365}}{\rm{.2422\;d = 31 556 926}}\;{\rm{s}} $

When more than one value is known for the half-life of a particular level, a statistical analysis was performed in accordance with the policies outlined in section 3.2. Experimental half-lives are sometimes given in the literature with most probable lower and upper limits. Such cases are treated with uniform probability distribution, as explained in section 3.2. For example, the half-life of
$ ^{97} $ In$ ^{m} $ is given as 1.2$ \mu $ s$ \leq $ T$ _{1/2} $ $ \leq $ 230$ \mu $ s in Ref. [2018Pa20] and the recommended value in NUBASE2020 is T$ _{1/2} $ = 120(70)$ \mu $ s. Half-lives with asymmetric uncertainties are also frequently reported in the literature. Since it is envisioned that NUBASE2020 will be used by specialists in various application fields, such values are symmetrized prior to performing any statistical analyses, as described in section 3.3.In experiments where rare events were detected, for example in studies of super-heavy nuclei, the half-lives reported in different publications were not directly averaged. Instead, when the information presented in the literature was sufficient, the time information associated with the individual events was combined and analyzed, as prescribed by Schmidt et. al. [1984Sc13]. In recent review articles that deal with properties of super-heavy nuclei [2014Kh04,2016Fo10,2016Ho09,2017Og01] events from several experiments were combined together in order to determine the best values. We have adopted these half-life values, rather than averaging the individual results.
In cases of long-lived nuclides that are of importance to metrology and other applications, all available experimental data were carefully examined, including values published by various metrology laboratories over many years. As a policy, we adopted the latest reported value by a particular laboratory, including the latest results published by Unterweger and Fitzgerald [10], which superseded the earlier assessment made by the same authors [11].
An upper or a lower limit for the half-life value is given in Table I for nuclides identified using a time-of-flight technique. The following policies were implemented: a) for observed nuclides, the lower limit for the half-life is given in the place of the uncertainty field. However, such a value should be used with caution, since it may be far shorter than the actual level half-life. In order to avoid confusion, a somewhat more realistic estimate, derived from TNN and flagged with #, is also given (see for example the data entry for
$ ^{44} $ Si). The same notation is also used for half-life limits of very long-lived (stable) nuclei (see for example the data entry for$ ^{188} $ Os); b) for nuclides that were looked for, but not observed, the upper limit is given in the place of the uncertainty field. For example, upper limits were estimated for a number of unobserved nuclides by F. Pougheon [1993Po.A], based on the time-of-flight information and the production yields expected from TNN (see for example the data entry for$ ^{21} $ Al).In the course of this work it was found that half-lives for double
$ \beta $ -decaying nuclides were not always consistently given in ENSDF. Since the two-neutrino ground-state-to-ground-state transition is the dominant decay mode, only those experimental half-life values, or their upper-limits, are included in NUBASE2020. In a few cases, other partial lifetime data are also compiled and these are given as comments in Table I. No attempt was made to convert the half-life values given by different authors to the same statistical confidence level (CL). The compilations by Barabash [2020Ba.A,2011Ba28] were consulted in covering such decays.For nuclei in their ground or excited isomeric state whose half-lives were not directly measured, values from TNN were estimates and included in Table I, whenever possible. Such cases are flagged with the symbol ‘#’.
-
Spin and parity values are presented with or without parentheses, based on “weak” or “strong” arguments, respectively, as adopted in ENSDF [12], but with one important exception. Since, it is a policy of NUBASE2020 to make a clear distinction between experimental and non-experimental information, parentheses are used only when the so-called “weak” arguments are based on experimental observations. In cases where the assignments are based on theoretical predictions or TNN, the values are presented without parentheses and they are flagged with the symbol ‘#’. This is in contrast to ENSDF, where values determined from theory or systematics are given in parentheses, and as a consequence, it is not possible to distinguish these tentative values from ones determined from experimental data. It should also be noted, that despite well-defined evaluation policies [12], there are a number of inconsistencies in ENSDF regarding the spin and parity assignments. Often, the proposed spins and parities reflect the interpretation of a particular ENSDF evaluator, rather than that of firm policy rules. As a result, assignments to similar states in neighboring nuclei are put in parenthesis by one evaluator, but not by another, although similar experimental information is available.
There is a large amount of recent experimental data on directly measured spins for nuclei far from the line of stability, where the “in-source” (e.g. RILIS at ISOLDE (CERN) and TRILIS at ISAC (TRIUMF)) and “collinear” (e.g. CRIS at ISOLDE (CERN)) laser spectroscopy techniques were deployed. In the present work, we compiled the experimentally measured spins for 1062 states (827 ground states and 235 isomers) and the corresponding values are flagged in Table I with the symbol ‘*’. We have consulted previous compilations by Fuller [13], Otten [1989Ot.A] and McDonald [14], as well as recently measured values in the literature. Figures 4 and 5 show plots of the directly measured spins for the ground and isomeric states, respectively, as a function of N and Z.
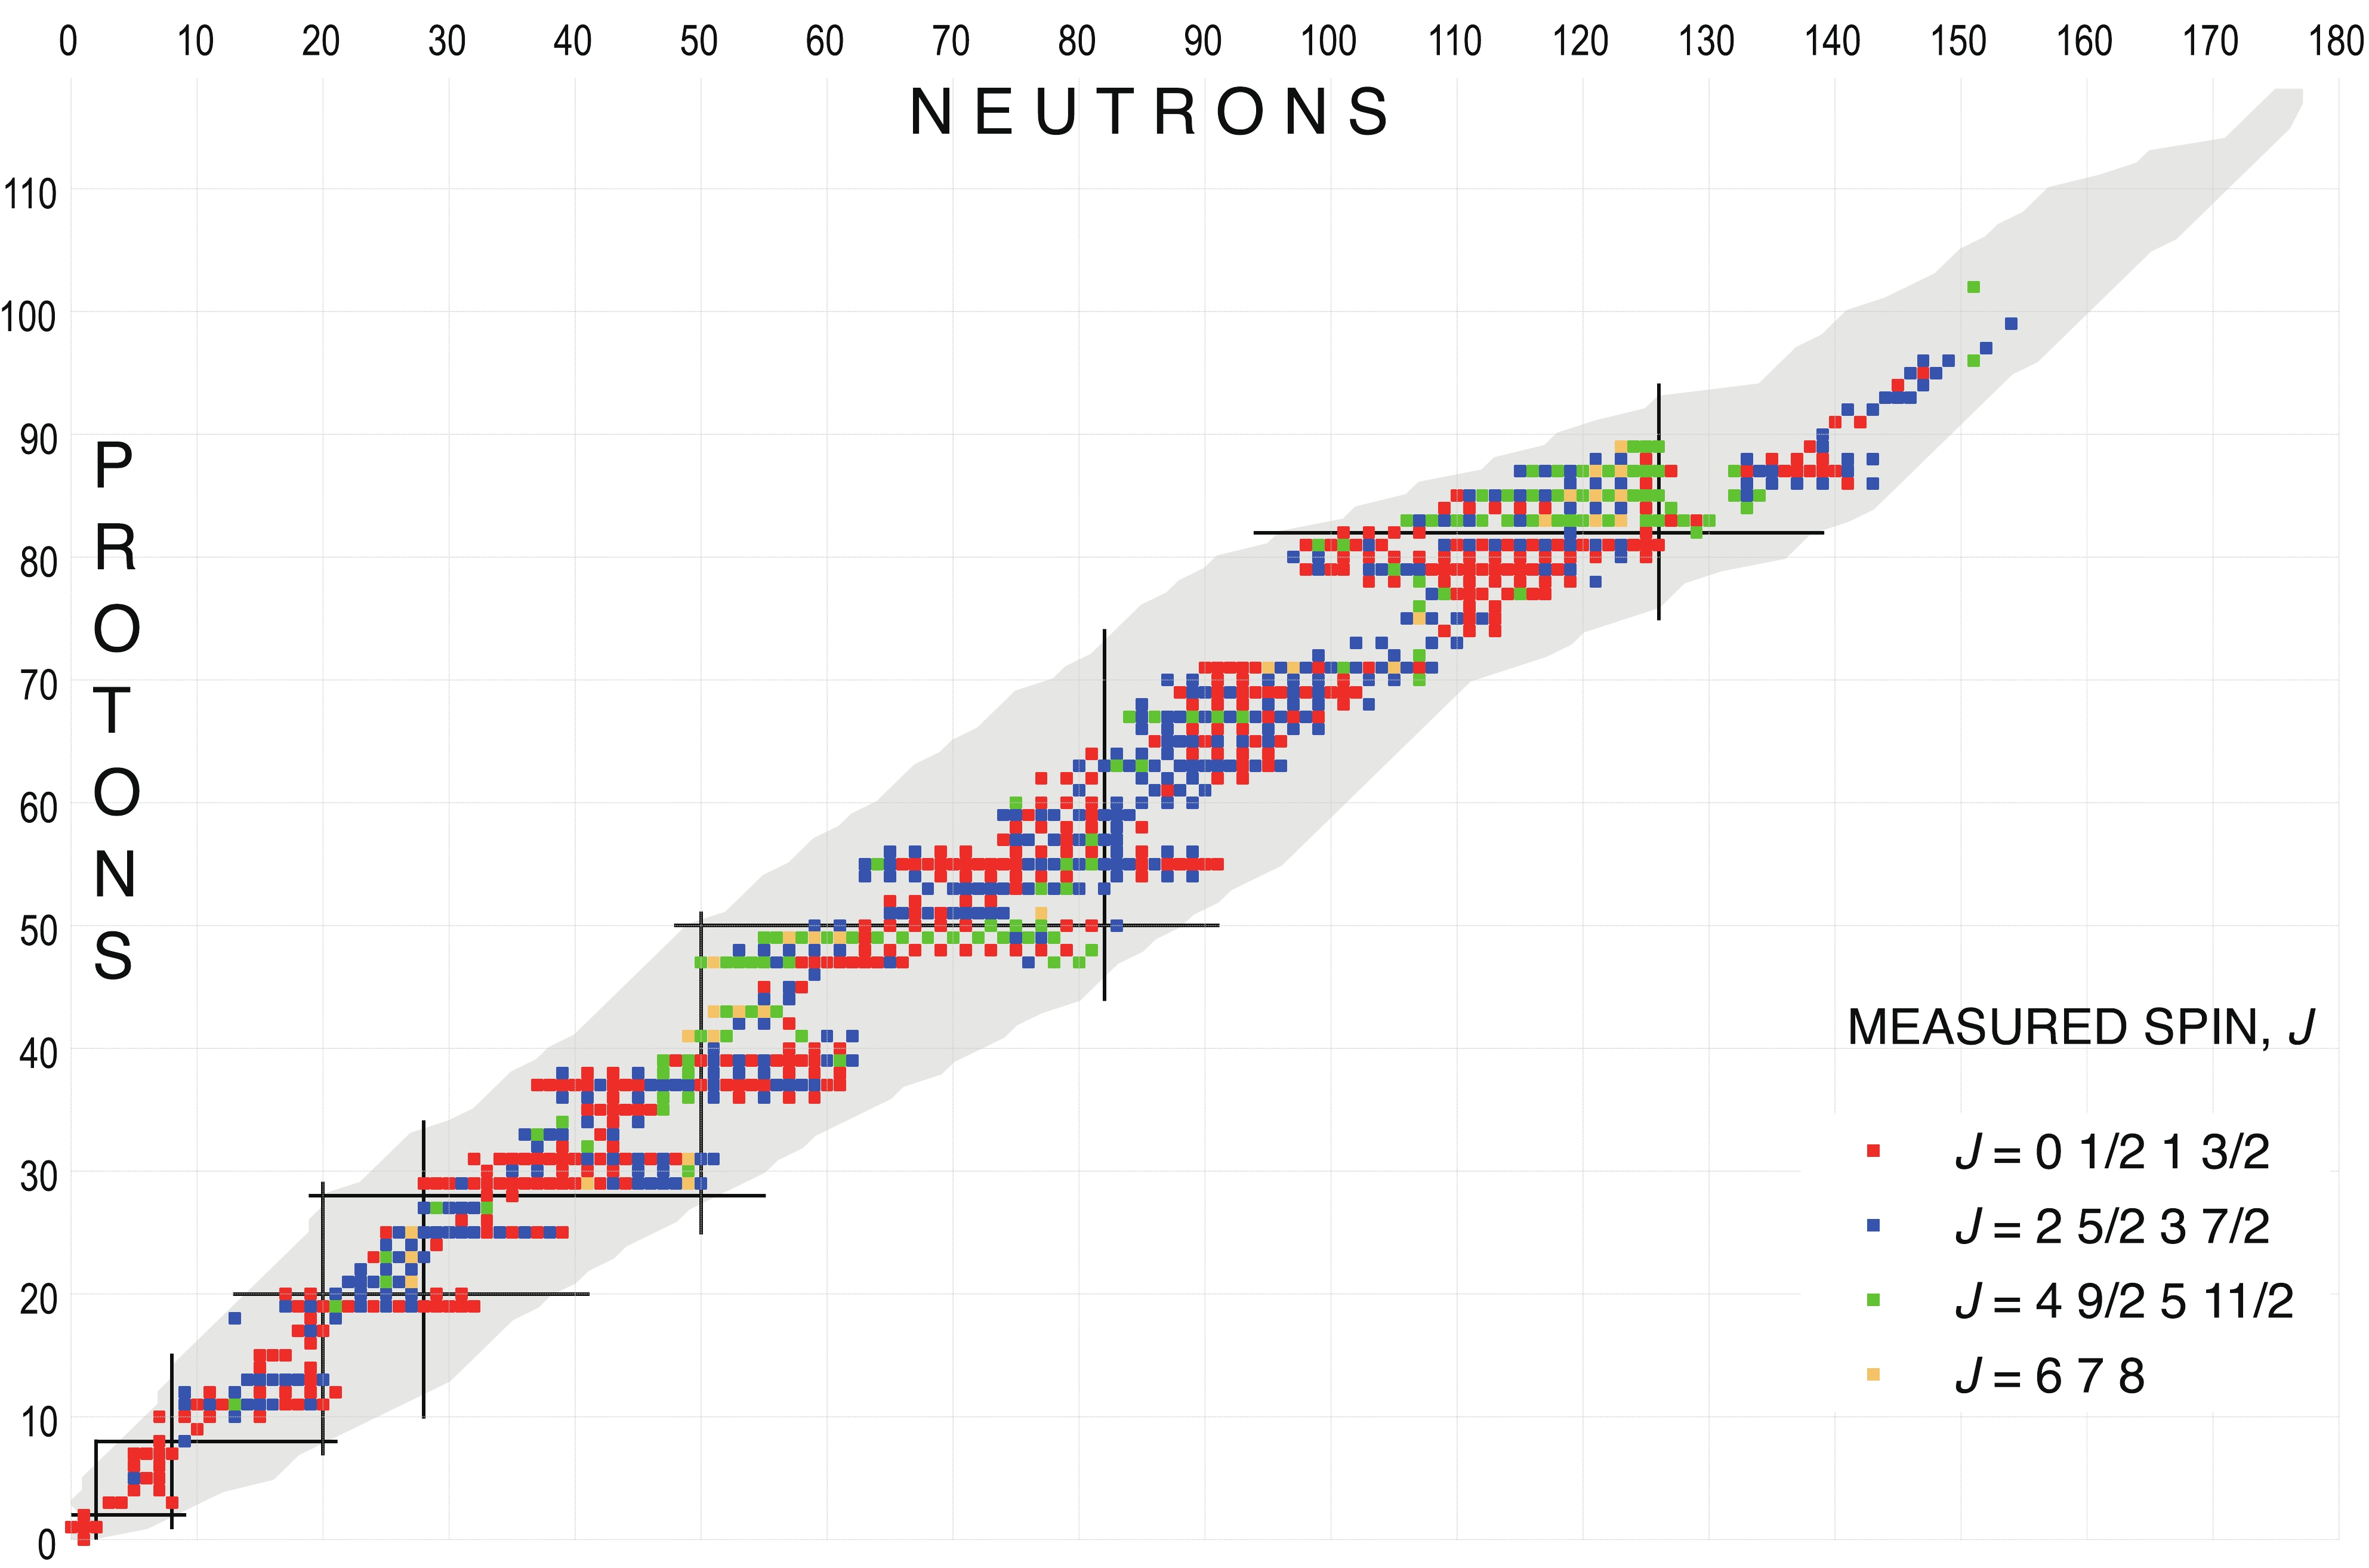
Figure 4. Nuclear chart displaying the measured ground-state spins.
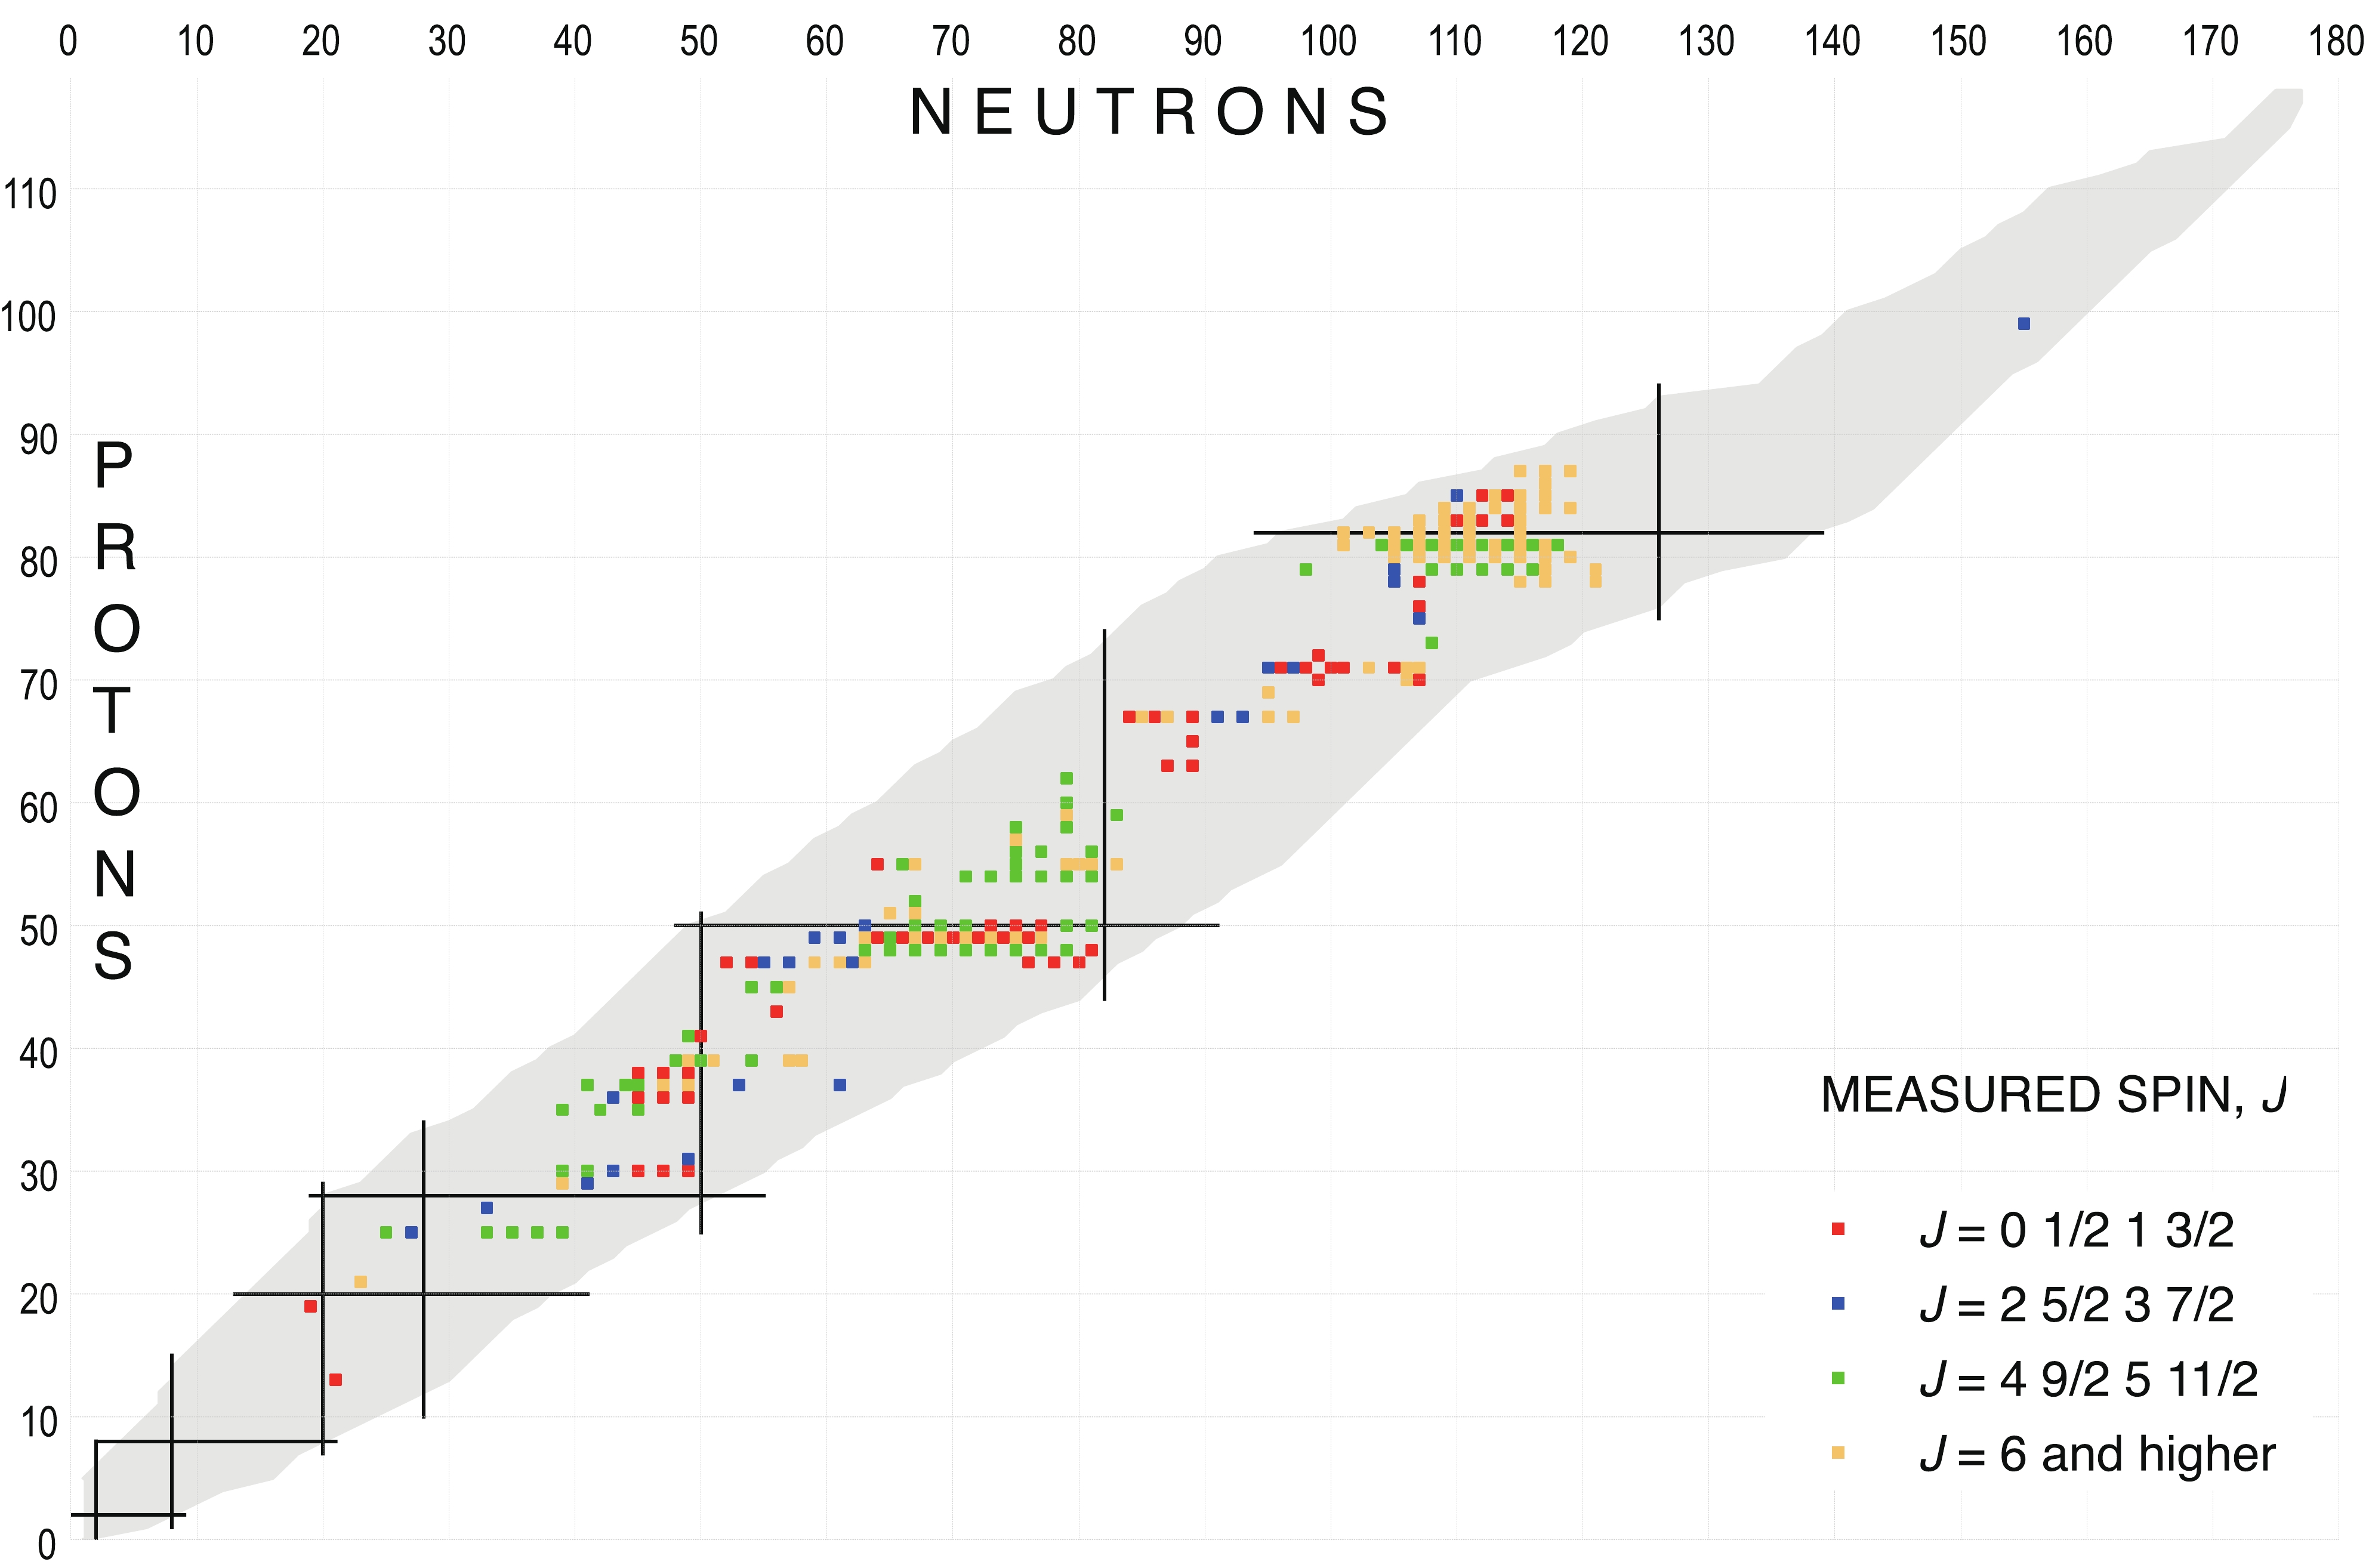
Figure 5. Nuclear chart displaying the measured isomeric-state spins.
The experimental methods that are used for spin determination do not provide direct information about the parity of a given state. However, we have used additional spectroscopy data, such as l value in transfer reactions, hindrance factors in
$ \alpha $ decay, measured magnetic moments, as well as other spectroscopic information, in order to make such assignments in Table I. -
Figure 6 displays the main ground-state decay modes for all nuclei included in Table I.
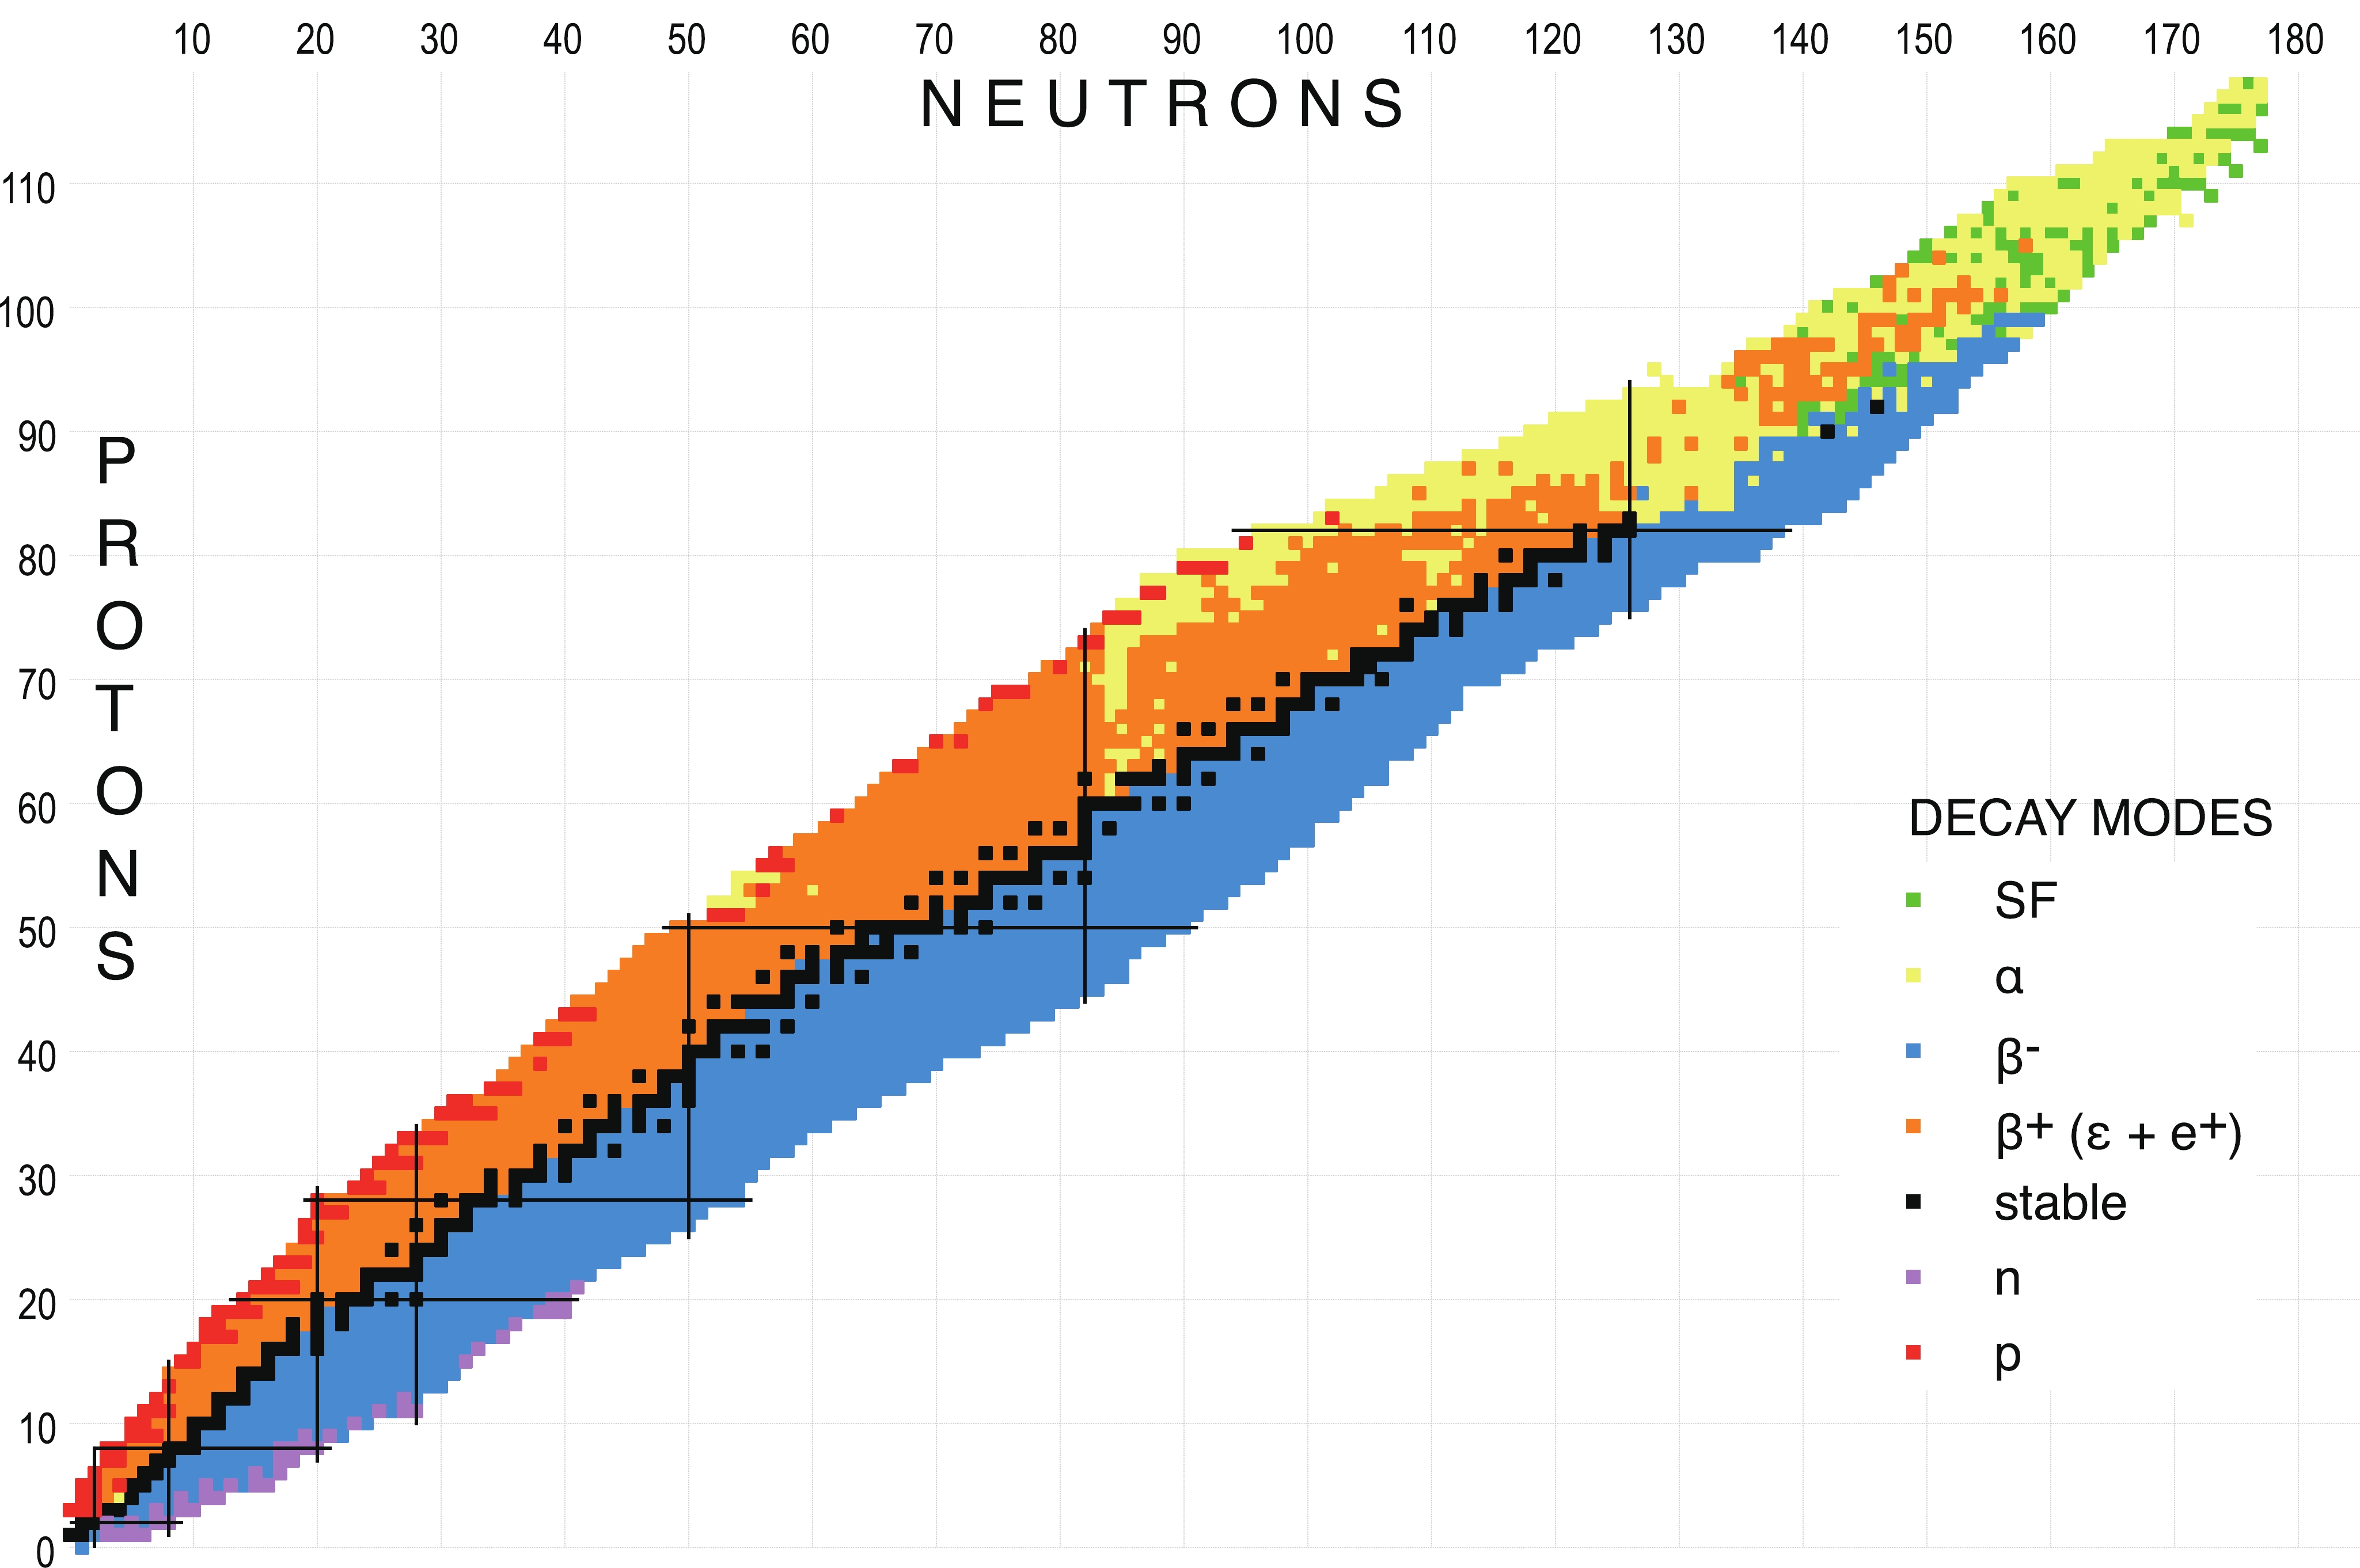
Figure 6. Nuclear chart displaying the main decay mode for nuclei in their ground state.
The most important policy in assembling the information about the decay modes and their intensities was to unambiguously establish whether a particular decay is energetically allowed, but not experimentally observed (represented by a question mark alone ‘?’, e.g. ‘IT?’ or ‘
$ \alpha $ ?’, the question mark refers to the decay mode), and whether the decay is actually observed, but its intensity is not determined (represented by ‘ =?’, e.g. ‘IT =?’ or ‘$ \alpha $ =?’, the question mark refers to the branching intensity).In cases of multiple decay modes, normalization of primary intensities to 100% was made only when the competing decays were experimentally observed. Otherwise, no such corrections were made.
Similarly to previous versions of NUBASE [1–4],
$ \beta^+ $ denotes a decay process that includes both electron capture,$ \varepsilon $ , and positron emission,$ \rm e $ $ ^+ $ , decays, so that one can symbolically write$ \beta^+ = \varepsilon + {\rm e}^+ $ . It should be made clear that this notation is not the same as that used in ENSDF, where the combination of both modes is labeled as$ \varepsilon + \beta^{+} $ . When the available decay energy is below 2m$ _{e} $ $ \simeq $ 1022 keV, only electron capture decay mode is allowed, while above that value the two processes are in competition. In the latter case, the separated intensities are not always experimentally available and they are frequently deduced from model calculations. Following one of the general policies of NUBASE that experimental information is exclusively used whenever possible, only measured values for$ \beta^+ $ ,$ \varepsilon $ and$ {\rm e}^+ $ are included in Table I. By the same token, both electron capture-delayed fission ($ \varepsilon $ SF) and positron-delayed fission ($ e^+ $ SF) are given with the same symbol$ \beta^+ $ SF.For
$ \beta $ -delayed particle decays, intensity relations were carefully considered. By definition, the intensity of a specific$ \beta $ -delayed particle decay is taken as a percentage of the main$ \beta $ -decay mode. For example, if the decay of the (A, Z) nuclide is described as ‘$ \beta^- $ = 100;$ \beta^- $ n = 20’, this means that for 100 decays of the parent, 80 (A, Z+1) and 20 (A–1, Z+1) daughter nuclei are produced and that 100 electrons and 20 delayed neutrons are emitted.This notation also holds for more complex
$ \beta $ -delayed particle emissions. For example, a decay described by ‘$ \beta^- $ = 100;$ \beta^- $ n = 30;$ \beta^- $ 2n = 20;$ \beta^-\alpha $ = 10’ corresponds to the emission of 100 electrons, 70 (30+2$ \times $ 20) delayed-neutrons and 10 delayed-$ \alpha $ particles; and in terms of residual nuclides, to 40 (A, Z+1), 30 (A–1, Z+1), 20 (A–2, Z+1) and 10 (A–4, Z–1), respectively.In general, the number of neutrons emitted per 100
$ \beta^- $ decays,$ P_{\rm n} $ , can be written as:$ {P_{\rm{n}}} = \sum\limits_i i \times \beta _{i{\rm{n}}}^ - ; $

and similar expressions can be written for
$ \beta^- $ -delayed$ \alpha $ and proton emissions. The number of residual daughter nuclides (A, Z+1) populated via$ \beta^{-} $ decay is then:$ {\beta ^ - } - \sum\limits_i {\beta _{i{\rm{n}}}^ - } - \sum\limits_j {\beta _{j\alpha }^ - } - \ldots $

Sometimes, the primary (parent)
$ \beta $ decay can populate several excited states in the daughter nuclide, which can further decay by particle emission. However, in a case where the ground state of the daughter nuclide decays also by the same particle emission, some authors included its decay in the value for the corresponding$ \beta $ -delayed particle intensity. It is a policy of NUBASE2020 to not use such an approach for two main reasons: a) the energies of delayed particles emitted from excited states are generally much higher compared to those emitted from the ground state, thus implying different subsequent processes; b) the characteristic decay times from excited states are related to the parent, whereas decays from the daughter's ground state are connected to the daughter nuclide itself. For example,$ ^9 $ C decays via$ \beta^+ $ emission to the ground state of the proton-unbound$ ^9 $ B nuclide (feeding intensity of 54.1(1.5)% [2001Be51]) and to several excited states that are proton and/or$ \alpha $ unbound. If one takes the$ \beta^+ $ intensities to the excited states in$ ^{9} $ B from Ref. [2000Ge09] and renormalizes them to per 100 decays of the parent, then$ \beta^+ $ p = 7.5(0.6)% and$ \beta^+\alpha $ = 38.4(1.6)% can be determined for$ ^9 $ C. In a slightly different example,$ ^8 $ B decays via$ \beta^+ $ emission only to two excited,$ \alpha $ -unbound states in$ ^8 $ Be, but not to the$ ^8 $ Be ground state. Thus, one may write$ \beta^+ $ = 100% and$ \beta^+\alpha $ = 100%, and therefore, no net population of the$ ^8 $ Be ground state.It should be pointed out that the percentages given in the Table I are related to 100 decays of the parent nuclei, rather than to the primary decay mode fraction. For example, the delayed-fission probability in the decay of
$ ^{228} $ Np is given in the original article as 0.020(9)% [1994Kr13], but this value is relative to the$ \varepsilon $ process, which has an intensity of 60(7)%. Thus, the renormalized delayed-fission intensity is 0.020(9)%$ \times $ 0.60(7) = 0.012(6)% of the total decay intensity.In addition to applying direct updates from the literature, partial evaluations completed by other authors were also considered in the evaluation of delayed particle data. For example, in compiling data for delayed proton- and
$ \alpha $ -branching intensities, the work of Hardy and Hagberg [1989Ha.A], Jonson and Riisager [15], Blank and Borge [16] and Pfützner et al. [17], where the corresponding physics was reviewed, as well as the recent compilation of Batchelder [18], were consulted. Similarly, data on$ \beta $ -delayed neutron emission probabilities that were recommended by a recent IAEA Coordinated Research Project [19] were also consulted. -
Isotopic abundances are given in the decay field of Table I with the symbol
$ IS $ and the values were taken from the most-recent publication of Meija et al. [20]. In several cases the$ IS $ values are listed in Ref. [20] as an interval$ [a,b] $ , but in Table I they are given as$ IS $ =$ (a+b)/2 $ with a variance$ \sigma $ $ ^{2} $ =$ (b-a)^{2}/12 $ (see section 3.2). -
Similarly to the previous version of NUBASE [3, 4], Table I includes information about the year of discovery for each nuclide in its ground or isomeric state. For the former, recommendations by Thoennessen [21] were adopted. Similar criteria were used when assigning the year of discovery for isomeric states.
-
The year of the ENSDF archival file that was consulted during the development of NUBASE2020 is given in Table I. The entry is left blank when information for a particular nuclide was not available in ENSDF.
The bibliographical information used in NUBASE2020 is referenced by means of the “Nuclear Science Reference” (NSR) database [22] keynumber style. However, references quoted in Table I are abbreviated with the first two digits of the year of publication being omitted from the NSR-style keynumbers. They are followed by up to three one-letter codes which specify the added or modified physics quantities (see the Explanation of Table I).
In cases where more than one reference was needed to describe a particular update, they were included as comments in Table I. No references were given for estimated values.
The initials of the former and present evaluators, e.g. GAU (G. AUDI), HWJ (W. HUANG), FGK (F. KONDEV), MMC (M. MACCORMICK), SAR (S. NAIMI) WGM (M. WANG), AHW (A. WAPSTRA), were used as reference keys where it may not be clear that the re-interpretation of data was made by the NUBASE evaluators.
In cases of directly measured spins, references are provided only to papers that were not included in the most-recent compilation of McDonald et al. [14].
The complete reference list is given at the end of this issue (see AME2020, Part II), together with the references used in AME2020.
The recommended data for the basic nuclear physics properties are also made available as an ASCII-formatted file (nubase.mas20) at the dissemination websites of the collaboration [23].
-
In general, NUBASE2020 contains numerical and bibliographical information for all known nuclei for which at least one property is experimentally known. However, it also includes results on yet unobserved nuclides, as well as data on properties (mostly excitation energy for isomers, half-lives and spins and/or parities) that are not yet measured. Such values are estimated from the systematics trends of a particular property in neighboring nuclei by ensuring a continuity in N, in Z, A, and in
$ N-Z $ . This approach allowed to follow the behavior of a particular property as a function of N and Z in a consistent way and it proved beneficial in deducing values for other relevant properties. Similarly to AME2020, where masses estimated from Trends from the Mass Surface (TMS) are flagged with ‘#’, the same symbol is used in NUBASE2020 to indicate non-experimental information inferred from TNN. It should be pointed out, however, that deviations from TNN are expected when nuclear structure effects, such as deformation and/or shape changes, occur. Such data were taken into account to the best knowledge of the present authors. -
It is a policy of NUBASE2020 to use one standard deviation as a representation of uncertainties associated with the recommended values. Unfortunately, authors of research articles do not always clarify the meaning of their reported uncertainties and, under such circumstances, these values are assumed to be one standard deviation. In several instances, uncertainties are not given at all and in such cases they were estimated by the evaluators, considering the limitations of the employed experimental method. When both the statistical and systematic uncertainties were reported in the literature, they were combined in a quadrature by the NUBASE2020 evaluators.
Sometimes lower (l) and upper (u) limits of a particular quantity, q, are reported in the literature, e.g. q
$ \in $ $ [l,u] $ . A policy of NUBASE2020 is that uniform probability distribution is assumed in such cases, which yields a mean value of$ m = (l+u)/2 $ and a standard deviation of$ \sigma $ =$ (u-l)/\sqrt{12} $ $ \simeq $ 0.29$ \times $ $ (u-l) $ .When results from two or more independent measurements were reported in the literature, the corresponding values were weighted by their reported uncertainties and averaged. The weighted average value and its uncertainty are calculated as:
$ \overline{x} \pm \Delta\overline{x} = \sum\limits_{i = 1}^N w_{i}x_{i}/\sum\limits_{i = 1}^N w_{i} \pm \sqrt{1/\sum\limits_{i = 1}^N w_{i}} $

(3) where
$ w_{i} $ =$ 1/\Delta x_{i}^{2} $ and$ x_{i} $ and$ \Delta x_{i} $ are the value and its uncertainty reported in the$ i^{th} $ experiment, and the summation is over all N experiments. For each average value the NORMALIZED CHI,$ \chi_n $ (or ‘consistency factor’ or ‘Birge ratio’), defined as:$ \chi_n = \sqrt { \frac{1}{N-1}\sum\limits_{i = 1}^N w_{i}(x_{i}-\overline{x})^2} $

(4) is also calculated.
It is a policy of NUBASE2020 to use the weighted average result (equation 3) when
$ \chi_n $ is smaller or equal to 2.5. In cases where$ \chi_n $ is larger than 2.5, but less or equal to 4, departure from the statistical result (equation 3) is allowed and the external uncertainty for the average value is adopted:$ \overline{x} \pm \Delta\overline{x} = \sum\limits_{i = 1}^N w_{i}x_{i}/\sum\limits_{i = 1}^N w_{i} \pm \chi_n \times \sqrt{1/\sum\limits_{i = 1}^N w_{i}} $

(5) In rare cases when
$ \chi_n $ is larger than 4, all individual uncertainties are considered to be irrelevant and the arithmetic (unweighted) average is adopted:$ \overline{x} \pm \Delta\overline{x} = \frac{1}{N}\sum\limits_{i = 1}^N x_{i} \pm \sqrt { \frac{1}{N(N-1)}\sum\limits_{i = 1}^N (x_{i}-\overline{x})^2} $

(6) The values used in the statistical analysis of a particular quantity are given as comments in Table I. When contradictory (discrepant) results were identified in the literature, a great deal of attention was focused on establishing the reason for such discrepancies, and consequently, on rejecting (or correcting) the corresponding unreliable data prior to performing the statistical analysis. The reasons for such decisions are given as comments in Table I.
-
Experimental results are sometimes reported in the literature with asymmetric uncertainties, e.g.
$ X_{-b}^{+a} $ , and it is a policy of NUBASE to symmetrize these uncertainties.Similarly to the previous version of NUBASE [1–4], the asymmetric uncertainty is associated with a two-piece normal distribution (sometimes called “split-normal distribution” or “Fechner distribution”),
$ TN(X,a,b) $ , and the symmetrization is achieved by mapping this distribution into a normal (symmetric) distribution,$ N(\mu,\sigma) $ , where$ \mu $ is the mean value and$ \sigma $ is the standard deviation.The probability density function of a two-piece normal distribution is given as:
$ f(x) = \left\{ {\begin{array}{*{20}{l}} {A \times {\rm{exp}}[ - {{(x - X)}^2}/2{a^2}]}&{{\rm{if}}\;{\rm{x}} < {\rm{X}},}\\ {A \times {\rm{exp}}[ - {{(x - X)}^2}/2{b^2}]}&{{\rm{if}}\;{\rm{x}} < {\rm{X}}} \end{array}} \right. $

(7) It has a modal (most probable) value of
$ x = X $ , a standard deviation b for x$ < $ X and a standard deviation a for x$ > $ X (see Figure 7), with$ A = (\sqrt{\pi/2}\times(a+b))^{-1} $ . This distribution is formed by taking the left half of a normal distribution$ N(X,b) $ and the right half of a normal distribution$ N(X,a) $ and scaling them to give a common value of f(x) = A at the mode X (see Figure 7). The mean value and the variance of this distribution can be determined as [24]: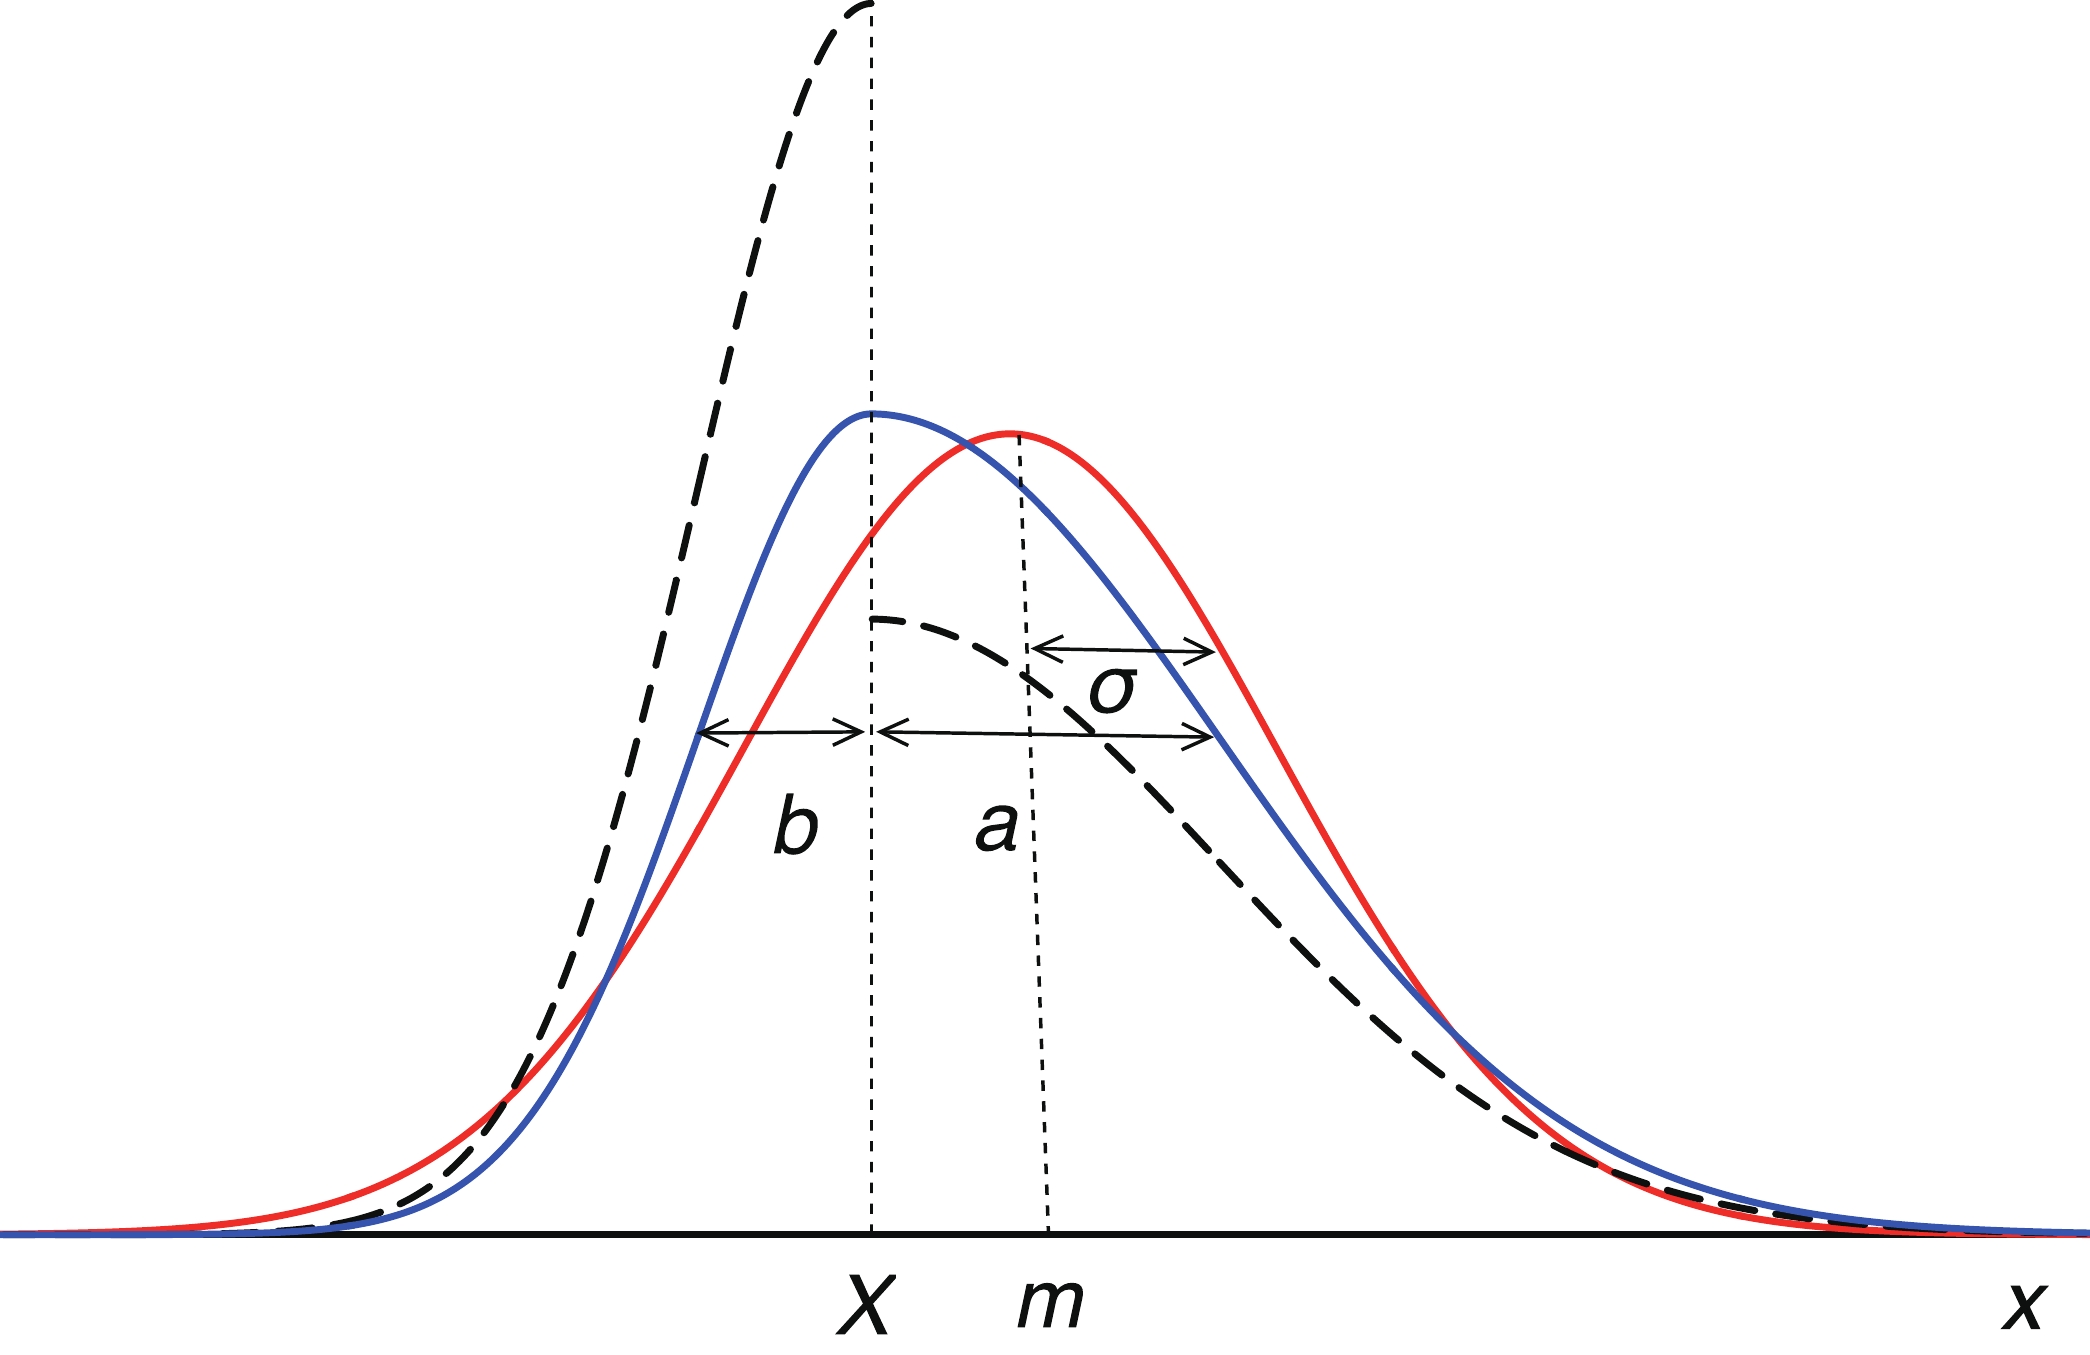
Figure 7. (dashed black) original Normal distributions,
$ N(X,b) $ (left on X) and$ N(X,a) $ (right on X), associated with the measured quantity$ X_{-b}^{+a} $ ; (solid blue) a two-piece normal distribution$ TN(X,a,b) $ ; (solid red) the equivalent Normal (symmetric) distribution,$ N(m,\sigma) $ ; see section 3.3 for details.$ \mu = X + \sqrt{2/\pi}\times(a-b) $

(8) $ \sigma^2 = (1 - 2/\pi)\times(a-b)^2 + a\times b $

(9) The median value m, which divides the distribution into two equal areas is then:
$ m = \left\{ {\begin{array}{*{20}{l}} {X + a\sqrt 2 \times {\rm{er}}{{\rm{f}}^{ - 1}}\left({\frac{{a - b}}{{2a}}} \right)}&{{\rm{if}}\;{\rm{a}} < {\rm{b}},}\\ {X + b\sqrt 2 \times {\rm{er}}{{\rm{f}}^{ - 1}}\left({\frac{{a - b}}{{2b}}} \right)}&{{\rm{if}}\;{\rm{b}} < {\rm{a}}.} \end{array}} \right. $

(10) If one takes
$ {\rm{erf}}^{-1}(z) \simeq \sqrt{\pi}z/2 $ then$ m - X \simeq \sqrt{\pi/8}\times(a-b) \simeq 0.6267\times (a-b) $

(11) In order to allow for a small non-linearity that appears for high values of
$ m-X $ , equation 11 is modified to:$ m \simeq X + 0.64 \times (a-b) $

(12) Following the above approach, the two-piece normal distribution
$ TN(X,a,b) $ is mapped into an equivalent normal (symmetric) distribution N(m,$ \sigma $ ) (see Figure 7) that have a mean value equal to the median value m (equation 12) and variance$ \sigma $ (equation 9). As a consequence,$ X_{-b}^{+a} $ is symmetrized to m$ \pm $ $ \sigma $ and the latter is adopted in NUBASE2020. -
In general, values for properties presented in NUBASE2020 and their uncertainties are rounded off, even if unrounded ones were given in the literature or in ENSDF. However, for some very precise data, as well as for data that were deemed essential for traceability purposes (e.g. isotopic abundances), the precisions quoted in the original publications were retained.
In cases where the two furthest-left significant digits in the uncertainty were larger than a given limit (set to 30 for the mass excess and excitation energy of isomers in order to be consistent with AME, and set to 25 for half-lives and branching ratios, as generally used in ENSDF), the adopted values and corresponding uncertainties were rounded off accordingly.
-
The NUBASE2020 evaluated nuclear data library contains the recommended values for the basic nuclear physics properties for all known nuclei, such as mass excess, excitation energy of the excited isomeric state, half-life, spin and parity, decay modes and their intensities, isotopic abundance (for stable nuclides), year of discovery, as well as the corresponding bibliographical information. It also contains information for yet unobserved nuclei whose properties were estimated by following the systematic trends in neighboring nuclei.
One of the main requirements in the development of NUBASE2020 was to cover the available experimental data as completely as possible and to provide proper references to all experimental results, especially for cases that are not included in ENSDF or in other topical evaluations. Such a traceability would allow any user to promptly review the recommended data and, if necessary, to undertake a re-evaluation.
NUBASE2020 is an integral part of AME2020 and the synchronization of these two libraries allows better homogeneity of all experimental data to be achieved. Furthermore, assignments of isomeric states and determination of their excitation energies were put on a firm basis and the data were improved.
In the future development of NUBASE, it is envisioned to include additional nuclear properties, such as magnetic and quadrupole moments, charge-radii and isotope shifts, cross sections of importance to nuclear astrophysics applications, as well as additional decay properties of relevance to energy and non-energy applications, in order to better serve the broader nuclear physics community.
-
This work was supported by the U.S. Department of Energy, Office of Science, Office of Nuclear Physics, under Contract No. DE-AC02-06CH11357 (ANL) and in part by the National Key Research and Development Program of China (Grant No. 2016YFA0400504) and the Strategic Priority Research Program of Chinese Academy of Sciences (CAS, Grant No. XDB34000000) (IMP). W.J. Huang acknowledges the financial support by the Max-Planck-Society. S. Naimi acknowledges the support of the RIKEN Pioneering Project Funding.
We thank many colleagues who responded to our queries about the experimental data, as well as those who sent us preprints of their work prior publication. We also thank D. Lunney and B. Kay for the careful reading of the manuscript and useful comments.
The NUBASE2020 evaluation of nuclear physics properties
- Received Date: 2021-01-19
- Available Online: 2021-03-15
Abstract: The NUBASE2020 evaluation contains the recommended values of the main nuclear physics properties for all nuclei in their ground and excited, isomeric (T1/2


 DownLoad: