


 Abstract
 HTML
HTML Reference
 Related
 PDF
PDF


-
Although it has been 75 years since the discovery of nuclear fission by Hahn and Strassmann [1], both its theoretical and experimental aspects remain intensively studied [2-10]. Nuclear fission, which entails complicated quantum many-body systems, provides a wealth of nuclear information. Using this information, concepts such as the shell structure, spin, and asymmetry of mass and charge [11-14] have been addressed theoretically and experimentally for low-energy processes, which primarily underlie the termination of interstellar r-processes [14, 15]. To date, however, it remains difficult to identify a theory that provides a clear description of nuclear fission, owing to the complex quantum effects and limitations of experimental technology [5, 16].
Many theoretical models have been proposed for nuclear fission: 1) the multi-dimensional dynamical method [17-23], based on the Langevin framework of nuclear shape dynamics for understanding the fission process; 2) the density functional theory (DFT) [24-29], in which nuclear dynamics is modeled by propagating a collective wave packet on the potential-energy surface; 3) the macroscopic-microscopic model [2, 3, 7, 30-32], which exploits the strongly damped character of nuclear dynamics and models a random walk on the five-dimensional potential-energy surface, utilizing the similarity between the nuclear shape evolution and Brownian motion; 4) and the scission point model [4, 33-37], which assumes statistical equilibrium at the scission point in the fission process, in which the overall energy at the scission point is a function of the neutron number, the proton number, and the quadruple deformation parameter. The quantum many-body nature of the problem makes it challenging to understand fission; nevertheless, thus far, considerable progress has been made [24].
Current theories of fission posit that the multiple observed modes in the fission process correspond to various valleys, from the saddle point to the scission point, on the potential energy surface of the parent nucleus, with different surface landscapes for different nuclei [38-40]. For actinides, there are three main fission modes: 1) the standard I (S1) mode, 2) the standard II (S2) mode, and 3) the superlong (SL) mode. However, experiments have mostly focused on one observable, such as the mass distribution, charge distribution, total kinetic energy, and cross-section of the fission fragments. Moreover, many experimental results have been accumulated [41-43]. In theoretical analysis, however, the single observable description frequently requires integrating other variables within the range of possible values. Therefore, it is insensitive to the local structure of the potential energy surface of the parent nucleus. Different fission paths cannot be distinguished as well. Naturally, the correlation between the different observable characteristics is of considerable significance to the further extraction of fission information.
In 1970, in the neutron-induced fission of
$ ^{232} $ Th experiment, the total kinetic energy (TKE) of symmetric fission was found to be significantly lower than that of asymmetric fission. This was first observed by E. Pfeiffer [44], who indicated that there are two different modes of symmetric fission and asymmetric fission in this reaction. One reasonable explanation is that a complex dependence may exist between the mass and kinetic-energy distributions of fission fragments. It confirms the theoretical work in which the nucleus performs a random walk on the potential energy surface, and provides direct evidence that there are multiple troughs on the potential energy surface. It is also helpful to study the influences of nuclei, such as the magic number nuclei$ ^{132} $ Sn and the odd-even effect, which are of great significance for in-depth studies of nuclear fission dynamics [45].Given the above, little is known about the relationships between the multi-parameters of fission fragments. Therefore, we built a time projection chamber detector based on the gas electron multiplier (GEM) process, for experimental observations. Using this, quantitative multi-parameter measurements of fission fragments become possible [45, 46]; thus, an effective method is offered for understanding the nuclear structure. Meanwhile, a theoretical investigation of each observable characteristic of fission fragments was conducted in the dissertation by one of the co-authors, using a simple two-dimensional scission-point model (TDSPM). Compared with the traditional scission-point model, the simplified TDSPM only considers the ground state deformation of the analyzed nucleus, and tries to select the experimental values when selecting the liquid-drop energy, making the calculation process simpler and ensuring the accuracy of the calculated results.
We focus on investigating the fission-fragment charge, mass, and TKE distributions of light actinides at low excitation energies, using the simplified TDSPM. Based on the concept of the dinuclear system (DNS), the interaction potential energy of two fragments is analyzed by considering the tip-to-tip orientation at the scission point of the fission process. The driving energy and the quasi-fission barrier of the DNS are also described. The remainder of this paper is organized as follows. In Sec. II, we present the theoretical framework of the simplified TDSPM based on the DNS. In Sec. III, the fission-fragment distributions of electromagnetic and neutron-induced nuclear fission processes are described. The calculation results agree well with existing experimental data, including the recent experimental results on the fission yields of the isotone chain
$ ^{233-236,238} $ U,$ ^{239} $ Np,$ ^{239,240} $ Pu, and$ ^{244} $ Cm. Particularly for the charge distribution of plutonium, the calculated results reproduce the experimental data very well. Finally, our conclusions are briefly presented in Sec. IV. -
In a typical fission process, the Coulomb force keeps the system evolving from a quasi-spherical or slightly deformed compound nucleus to two separated fragments that move away from each other [34]. In the present dynamical model, the scission point is a particular point in this evolutionary process at which a compound nucleus breaks into two fragments, and the wave function of any nucleon can spread to each fission fragment. However, each pair of the fission fragments constitutes an independent system, without external energy exchange. In addition, each pair is a local system, with relatively independent properties, such as mass and proton numbers
$ (A_{L,H},Z_{L,H}) $ , so that the DNS concept can be introduced in the process of nuclear fission.The shape of an axial-symmetric nucleus can be expressed in spherical coordinates as
$ { \Re_{{L,H}}(\beta,\theta) = c(\beta_{{L,H}})R_{{0L,0H}}\left[1+\sqrt{\frac{5}{4\pi}}P_{2}({\rm{cos}} \theta_{L,H})\right],} $

(1) where
$ R_{{0L,0H}} = 1.16A_{L,H}^{1/3} $ is the radius of the spherical nucleus;$ c(\beta_{{L,H}}) $ is an essential parameter on the premise of the volume conservation when the deformation parameter$ \beta_{{L,H}} $ is determined; and$ P_{2}({\rm{cos}} \theta_{L,H}) $ is the Legendre polynomial.For two nuclei that are quite close to each other, the interaction potential based on the dynamic deformation can be expressed as the sum of the Coulomb potential
$ V_{\rm C} $ and the nuclear potential$ V_{\rm N} $ ,$ \begin{aligned}[b] V(\beta_L,\theta_L,\beta_H,\theta_H,r) =& V_{\rm N}(\beta_L,\theta_L,\beta_H,\theta_H,r)\\ & +V_{\rm C}(\beta_L,\theta_L,\beta_H,\theta_H,r), \end{aligned} $

(2) where sub L and H represent the two fragments, respectively.
$ \beta_{L,H} = \beta_{L.H}^{g.s.} $ takes the ground state deformation of the nuclei into account.$ \theta_{L,H} $ are the azimuths of the two nuclei relative to the axis of symmetry, and r is the interaction distance between them.For the nuclear potential
$ V_{\rm N} $ , without considering the momentum and spin dependence, Adamian et al. made some phenomenological approximations, and the Skyrme-type density-dependent nucleon-nucleon interaction was adopted as [47]$ \begin{aligned}[b] V_{\rm N}(\beta_L,\theta_L,\beta_H,\theta_H,r) = & C_0\Bigg\{F_{\rm ex}\int\rho_L({{r}})\rho_H({{r-R}}){\rm d}{{r}} \\ & + \frac{F_{\rm in}-F_{\rm ex}}{\rho_0}\Bigg[\int\rho^{2}_L({{r}})\rho_H({{r-R}}){\rm d}{{r}} \\ & + \int\rho_L({{r}})\rho^2_H({{r-R}}){\rm d}{{r}}\Bigg]\Bigg\}, \end{aligned} $

(3) where
$ F_{\rm in,ex} = f_{\rm in,ex}+f^{'}_{\rm in,ex}\frac{N_L-Z_L}{A_L}\frac{N_H-Z_H}{A_H}, $

(4) $ C_0 $ = 300$ {{\rm{MeV}}}\cdot {\rm{fm}}^3 $ ,$ f_{\rm in} $ = 0.09,$ f_{\rm ex} $ = −2.59,$ f^{'}_{\rm in} $ = 0.42,$ f^{'}_{\rm ex} $ = 0.54, and$ \rho_0 $ = 0.16$ {\rm{fm}}^{-3} $ .$ \rho_L $ and$ \rho_H $ are the nuclear density distribution functions that can be expressed in terms of two-parameters of the Woods-Saxon type$ \rho_L({{r}}) = \frac{\rho_0}{1+\exp(({{r}}-\Re_L(\beta_L))/a_{\rho_L})}, $

(5) $ \rho_H({{r}}) = \frac{\rho_0}{1+\exp((|{{r-R}}|-\Re_H(\beta_H))/a_{\rho_H})}, $

(6) where the parameters
$ a_{\rho_{L,H}} $ represent the diffuseness of the two fragments depending on the charge number of the nucleus. Considering the experimental value, we used$ a_{\rho_{L,H}} = 0.58 $ in our calculations.The Coulomb potential
$ V_{\rm C} $ can be expressed using the Wong formula [48],$ \begin{aligned}[b] V_{\rm C}(\beta_L,\theta_L,\beta_H,\theta_H,r) =& \frac{Z_LZ_He^2}{r}+\left(\frac{9}{20\pi}\right)^\tfrac{1}{2}\left(\frac{Z_LZ_He^2}{r^3}\right)^2 \\ & \times \sum\limits_{i = L,H}\Re_i^2\beta_{i}P_2({\rm cos}\theta_i)+\left(\frac{3}{7\pi}\right)^\tfrac{1}{2}\left(\frac{Z_LZ_He^2}{r^3}\right)^2\times \sum\limits_{i = L,H}\Re_i^2[\beta_{i}P_2({\rm cos}\theta_i)]^2. \end{aligned} $

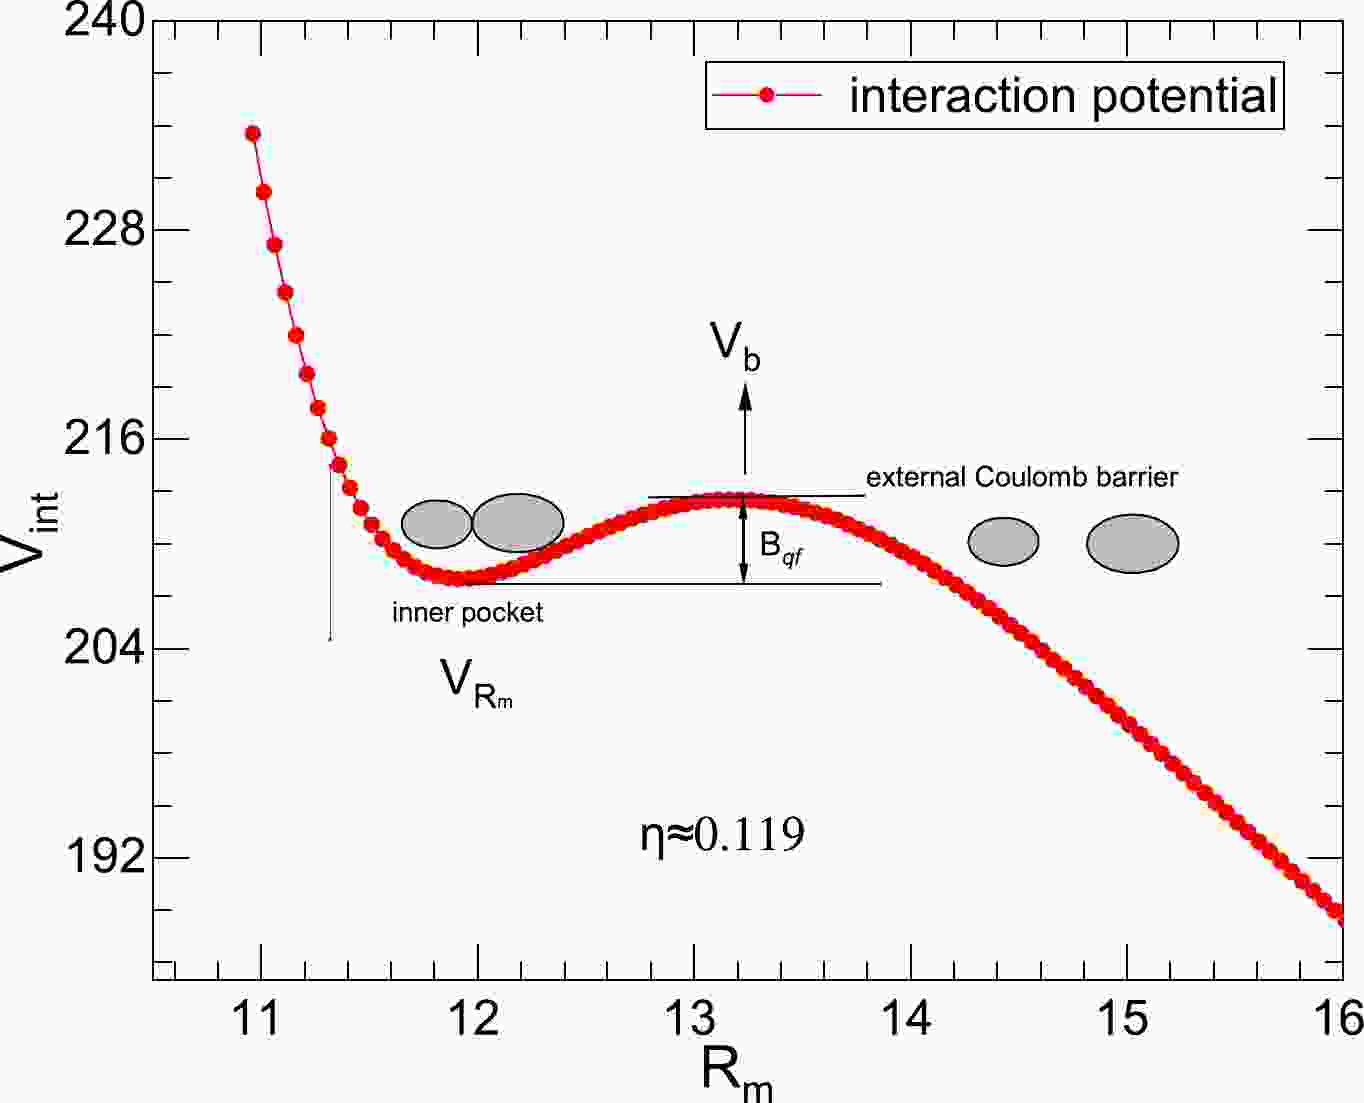
(7) In the DNS framework, owing to the Coulomb repulsion and the attraction of the nuclear force, the interaction potential has an external Coulomb barrier and an internal pocket (corresponding to
$ r = R_b $ and$ r = R_m $ ), which can maintain stability (internal pocket) in the lowest part of the interaction potential barrier. The quasi-fission barrier$ B_{\rm qf}(Z_{L,H},A_{L,H}) $ , obtained as the difference of the interaction potentials between the top of the external Coulomb barrier and the bottom of the inner pocket, prevents the evolutionary process of fission along the r-direction [49].In addition, according to the lowest energy principle, the tip-to-tip orientation is always taken into account in the DNS framework. Compared with other orientations, it exhibits a relatively high internal fusion barrier and a lower external Coulomb barrier evolving along the r-direction, which increases the probability of fission. Therefore, the driving potential of the DNS relative to the parent nucleus can be expressed as
$ \begin{aligned}[b] U(Z_i,A_i,E_i^{*},R_m) = & V(R_m)-U(Z_{CN},A_{CN},E_{CN}^{*})\\ & +U(Z_L,A_L,E_L^{*})+U(Z_H,A_H,E_H^{*}), \end{aligned} $

(8) where
$ i = L,H $ , and$ V(R_m) = V(\beta_L,\theta_L,\beta_H,\theta_H,r = R_m) $ represents the potential energy of the internal pocket in the tip-to-tip orientation. The binding energy$U(Z_i,A_i,E_i^{*}) = $ $ U(Z_i,A_i)+ \delta U_{\rm sh}(Z_i,A_i,E_i^{*}) $ [50], and the shell-correction term$ \delta U_{\rm sh} $ of each fragment are computed as$ {\rm{M}}{\rm{\ddot{o}ller}} $ [50]. Based on the Fermi-gas relation, the dependence of the shell correction on the excitation energy is approximated as follows [4, 51]$ {\delta U_{\rm sh}(Z_i,A_i,E_i^{*}) = \delta U_{\rm sh}(Z_i,A_i,E_i^{*} = 0)\exp(-E^*_i/E_d)}, $

(9) where the damping constant
$E_d \!\!=\!\! 18.5\;{\rm{MeV}}$ , and$E^*_i \!\!=\!\! \dfrac{A_i}{A_L\!+\!A_H}\!\times$ $ E^*(Z_i,A_i) $ is the excitation energy of each fragment, which is distributed according to the fragment mass proportions. Assuming thermal equilibrium at$ r = R_m $ , the excitation energy$ E^*(Z_i,A_i) $ is the difference between the initial excitation energy$ E^*_{CN} $ and the driving energy$ U(Z_i,A_i,E_i^{*},R_m) $ of the fissioning system, that is$ E^*(Z_i,A_i) = E^{*}_{CN}-U(Z_i,A_i,E_i^{*},R_m). $

(10) -
To accurately estimate the information pertaining to fission fragments using the simplified TDSPM, the semiempirical formula for pre-neutron emission fission yields with different charges and mass numbers was obtained [4, 33]. For relative primary yields under different specific conditions, the following expression is used:
$ Y(Z_i,A_i,E^{*}) = N_0\exp{\left[-\frac{U(R_m)+B_{\rm qf}(Z_i,A_i)}{T}\right]}, $

(11) where
$ U(R_m) = U(Z_i,A_i,E_i^{*},R_m)-U(Z_{CN},A_{CN},E_{CN}^{*}) $ ;$ N_0 $ is the normalization factor;$ T = \sqrt{E^*(Z_i,A_i)/a} $ is the temperature of the DNS; and the level density parameter a is estimated with$ A/12 $ . Summing Eq. (11) over$ Z_i $ and$ A_i $ , we obtain the charge and mass distributions of fission fragments:$ Y(A_i,E^{*}) = \sum\limits_{Z_i}Y(Z_i,A_i,E^{*}), $

(12) $ Y(Z_i,E^{*}) = \sum\limits_{A_i}Y(Z_i,A_i,E^{*}). $

(13) As seen in Eq. (11), the quasi-fission barrier
$ B_{\rm qf}(Z_i,A_i) $ plays an essential role in the calculations of fission yields. With decreasing nucleon asymmetry$ \eta = (A_L-A_H)/{A_{CN}} $ and increasing elongation, the quasi-fission barrier$ B_{\rm qf}(Z_i,A_i) $ decreases, and the DNS becomes more unstable and decays.It is appropriate to calculate the TKE of fission fragments within the simplified TDSPM. We assume that all interaction energies transform into the kinetic energy of fission fragments in the fission process. The mean TKE as a function of the mass number
$ A_1 $ and the charge number$ Z_1 $ can be calculated as$ \langle {\rm{TKE}} \rangle (A_i,E^{*}) = \frac{\sum\nolimits_{Z_i} {\rm{TKE}} (Z_i,A_i,E^{*})Y(Z_i,A_i,E^{*})}{\sum\nolimits_{Z_i}Y(Z_i,A_i,E^{*})} $

(14) $ \langle {\rm{TKE}} \rangle (Z_i,E^{*}) = \frac{\sum\nolimits_{A_i} {\rm{TKE}} (Z_i,A_i,E^{*})Y(Z_i,A_i,E^{*})}{\sum\nolimits_{A_i}Y(Z_i,A_i,E^{*})}, $

(15) where
$ \begin{aligned}[b] {\rm{TKE}}(Z_i,A_i,E^{*}) & = V(\beta_L,\theta_L,\beta_H,\theta_H,R_b) \\ &= V(Z_i,A_i,R_m)+B_{qf}(Z_i,A_i). \end{aligned} $

(16) However, experimentally, the TKE of fission fragments is not equal to the potential barrier height [
$ r = R_b $ ]. Within the DNS framework, the TKE of fission fragments is determined by the interaction potential at$ r = R_{sp} $ , and the corresponding position is obtained by [52]$ R_{sp} = \frac{1.4}{1.16}[R_L(\beta_L,\theta_L = 0)+R_H(\beta_H,\theta_H = 0)]+1 {\rm fm}. $

(17) For the TKE, this is done for obtaining more accurate calculation results by determining the location of the scission point, which is correctly predicted in the calculations.
-
To obtain more information on fission fragments and to better understand the configuration
$ (Z_{L,H},A_{L,H}) $ of the DNS, we show the interaction potential energy of$ ^{104}{\rm{Mo}}+^{132}{\rm{Sn}} $ in the reaction of$ {{n}}+^{235}{\rm{U}} $ in Fig. 1. The different configurations$ (Z_{L,H},A_{L,H}) $ of the DNS are formed in the inner pocket of the N-N interaction potential. At the lowest interaction potential, the DNS remains stable for a while. In the figure, we have plotted both the Coulomb barrier ($ V_b $ ) and the quasi-fission barrier$ B_{\rm qf}(Z_{L,H},A_{L,H}) $ . Then, the DNS gradually separates to form two separate fission fragments through the Coulomb barrier.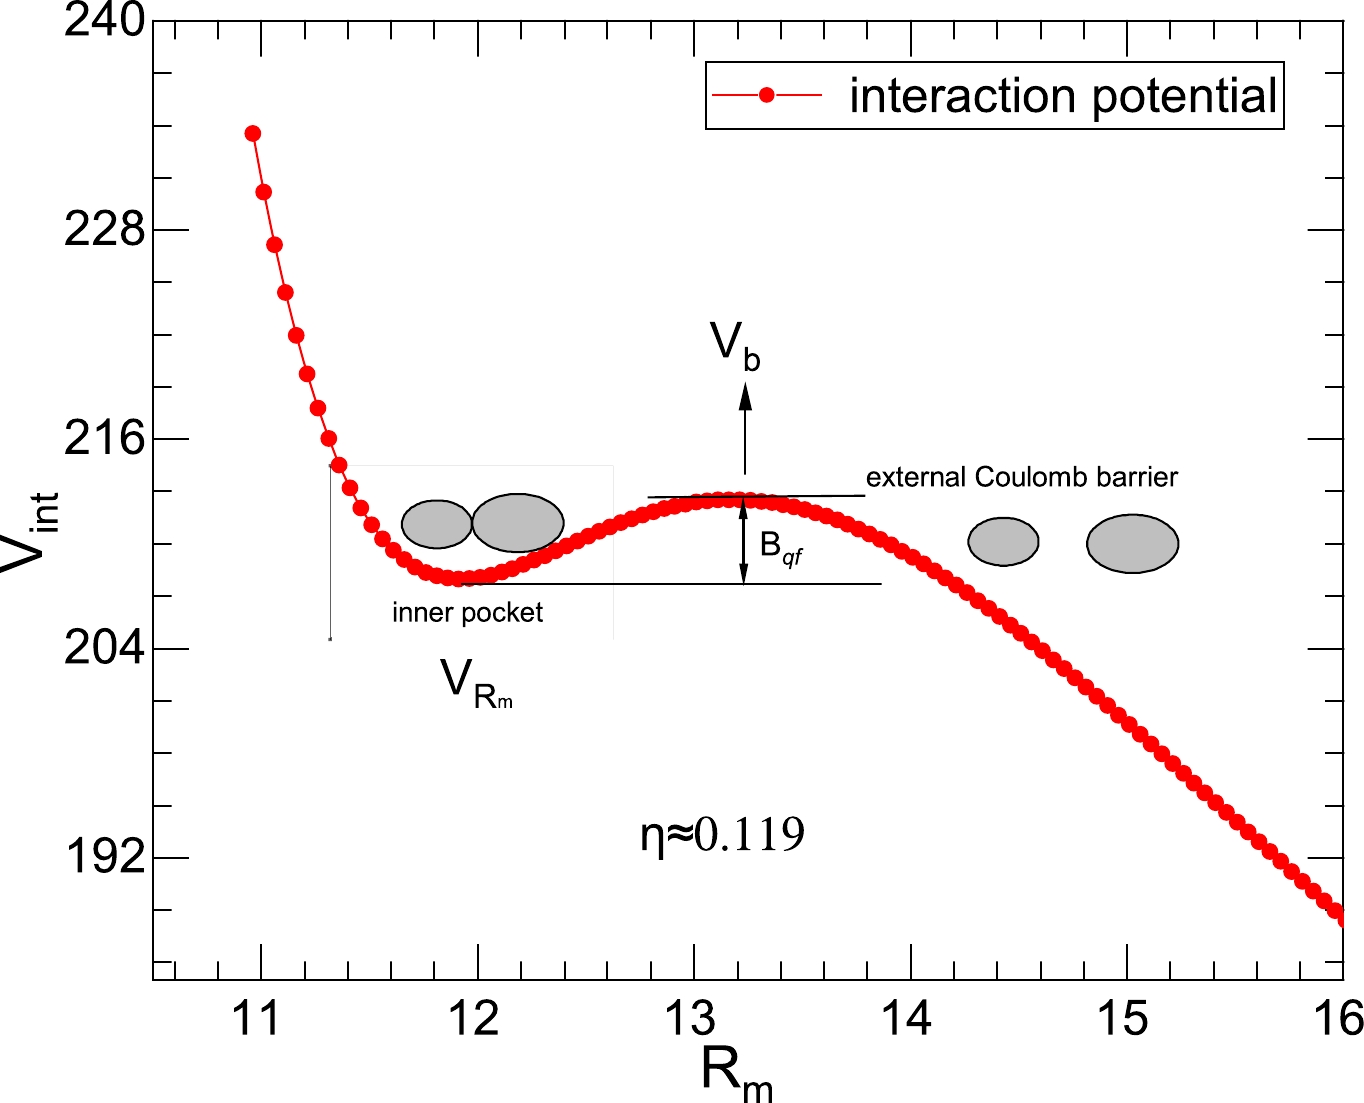
Figure 1. (color online) The interaction potential of the configuration
$ ^{104}{\rm{Mo}}+^{132}{\rm{Sn}}$ (where$ \eta\approx 0.119$ ) in the reaction$ {{n}}+^{235}{\rm{U}}$ , and the tip-tip orientation is considered in the DNS.Similarity, in Fig. 2, we perform the calculation for the reaction
$ {{n}}+^{235}{\rm{U}} $ . The most important part is the reliability of the driving potential in the simplified TDSPM. Under the tip-to-tip orientation at the scission point, the driving potential is a function of mass asymmetry$ \eta $ . At a certain mass asymmetry$ \eta $ , each red point represents the lowest energy configuration along the valleys of all configurations$ (Z_{L,H},A_{L,H}) $ in the DNS; each configuration is a local system in the entire fission system. The driving potential was calculated for the$ \eta = -0.45 $ to 0.45 range, which happens to be the range of mass asymmetry$ \eta $ for the fission products of actinide elements. Moreover, the result is compared to the empirical fission potential result obtained by Sun [53], and is consistent with the driving energy of the DNS.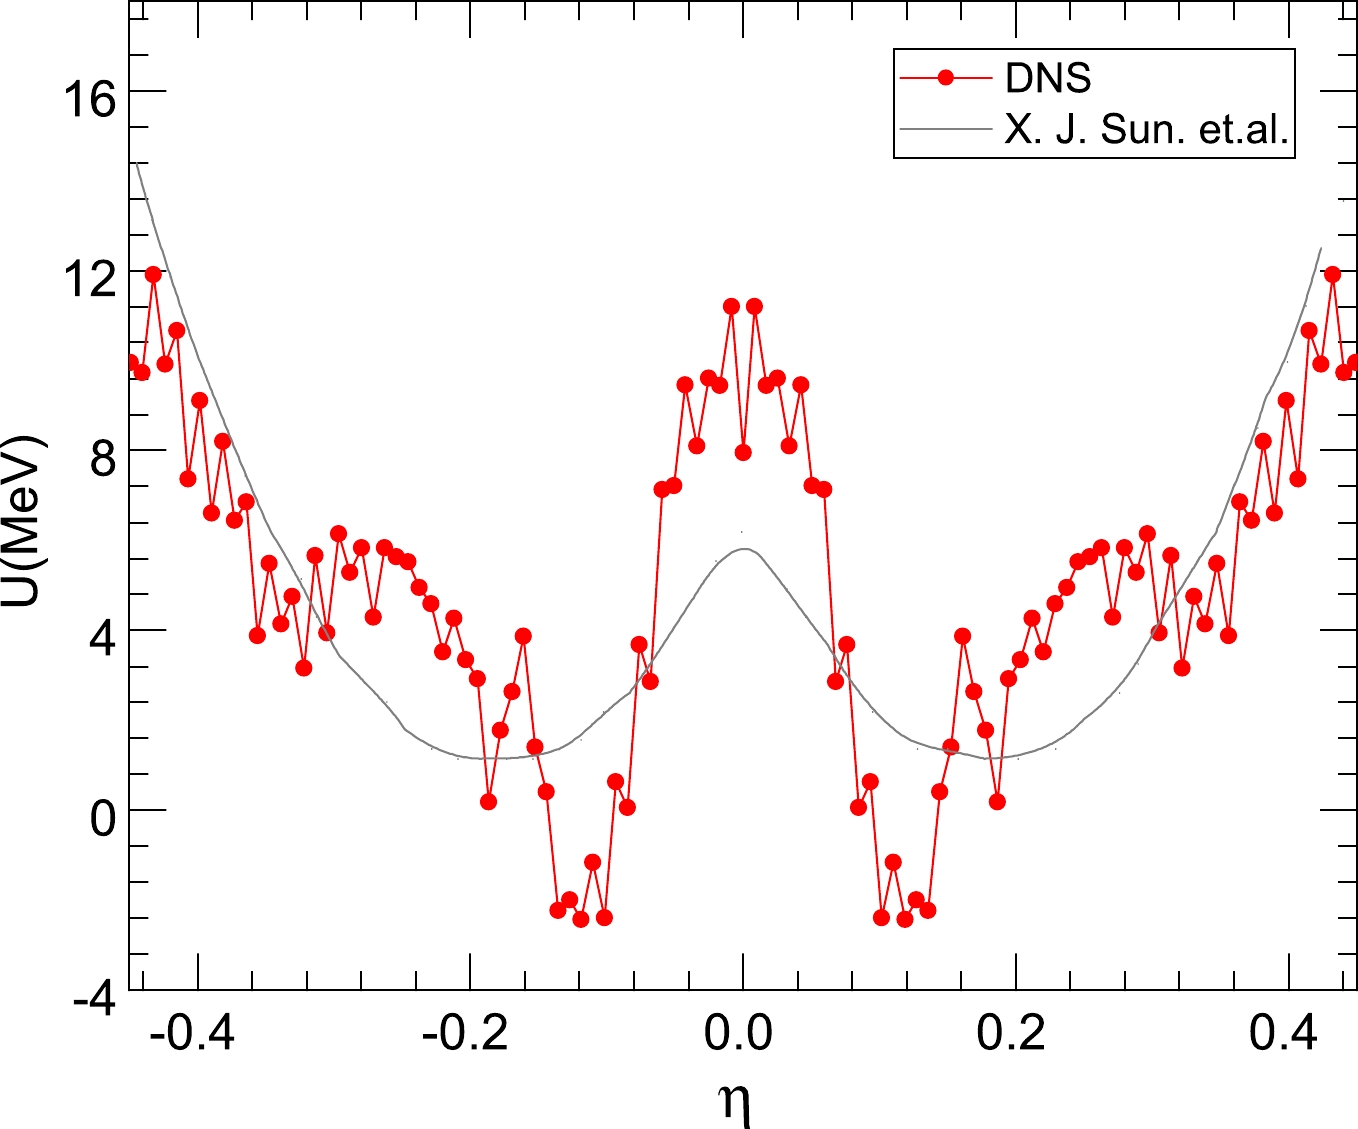
Figure 2. (color online) The driving potential for the reaction
$ {{n}}+^{235}{\rm{U}}$ as a function of mass asymmetry$ \eta$ .In addition, it is noteworthy that the driving energy can respond to the fission yields from different angles. There are two valleys in Fig. 2 that represent the part of the asymmetric fission corresponding to the mass asymmetry
$ \eta = \pm0.12 $ , respectively, and$ \eta $ of the symmetric fission is close to zero. Likewise, the driving energy exhibits a little valley at the mass asymmetry$ \eta \sim0.18 $ (where$ A_H\approx140 $ ) for heavy fission fragments. This indicates that the mass distributions exhibit peaks, at which the probability of observing a specific mass is the highest.Moreover, the driving energy is related to the local excitation energies of independent systems in the simplified TDSPM. The excitation energy is input into the driving energy of the DNS as a parameter of the shell damping effect, which is also taken into consideration. It affects the value of the driving energy
$ U(Z_L,A_L,E_L^{*},R_m) $ and of the quasi-fission barrier$ B_{\rm qf}(Z_i,A_i) $ directly, changing fission yields. That is, the yields of the symmetrical fission component increase, but those of the asymmetric fission component decrease. -
The quantitative description of fission yields has practical value for nuclear energy studies. To accurately estimate the fission yield information, within the framework of the simplified TDSPM based on the ground states of nuclei, we investigated the mass, charge, and kinetic-energy distributions of fission fragments at low excitation energies, considering the tip-to-tip orientation. Moreover, the total yields of fission fragments have been normalized to 200%.
Based on this, Fig. 3 shows the experimental and calculated charge distributions for electromagnetic and neutron-induced fissions. The black circles represent the experimental results. Considering the charge conservation, we assume that no protons are released during the fission process; the results calculated using the simplified TDSPM are shown with red points in Fig. 3. There are some significant discrepancies in Fig. 3(a)-(c) between theoretical results and experimental results. The theoretical peak positions are significantly closer to those for symmetrical fission products. However, the widths are narrower for two peaks, and the magnitudes are larger. This can be attributed to the following: (1) over-simplified description of the binding energy; (2) only the ground state deformation of the nucleus is considered; (3) shell correction is inappropriate. On the other hand, neutron-induced fission
$ {^{239}}{\rm{Pu}} $ is clearly described within the simplified TDSPM, with the calculation results agreeing well with the experimental ones, except for the fine structure at the peak around$ Z_L = 42, \;Z_H = 52 $ . For example, the maximum is 0.213 at$ Z_H = 52 $ for the heavy-charge region, but the experimental maximum is 0.182 at$ Z_H = 54 $ , and it also indicates that there are some differences between the experimental results and theoretical results.
Figure 3. (color online) The charge distributions of fission fragments. (a) The reaction of
${(\gamma,^{234}}{\rm{U}})$ at the incident energy${{{E}}_{\gamma} = 11 \;{\rm{MeV}}}$ . (b-d) The same as (a), but for the neutron-induced fission of$ {^{233}}{\rm{U}}$ ,$ {^{235}}{\rm{U}}$ with the incident energy${{E}_{{n}}}$ of 6.54 MeV and neutron-induced fission$ {^{239}}{\rm{Pu}}$ with${{E}_{{n}}}$ of 6.84 MeV. The experimental data were taken from Refs. [3, 54].At the same time, we compare the results with Möller's theory [blue curve in Fig. 3], whose calculations are much better than the results obtained using the simplified TDSPM in terms of the peak position, peak magnitude, and peak width. However, as shown in Fig. 3, the substantial difference between Möller’s theory and ours is noticeable. Möller’s theory only provides approximately smooth curves for the charge distributions in nuclear fission. The yields of even-Z nuclei calculated using the simplified TDSPM are more significant than those of the neighboring odd-Z nuclei. This shows that the odd-even effect plays an important role in the fission process and adds some oscillations to the smooth parts of charge distributions. Meanwhile, it does not change the smooth parts of the fission distributions appreciably, which is important.
Similarly, in Fig. 4, the mass distributions are predicted for reactions of the electromagnetic-induced fission of
$ {^{234}}{\rm{U}} $ ,$ {^{240}{\rm{Pu}}} $ , and the neutron-induced fission of$ {^{240}{\rm{Pu}}} $ . The calculated results are marked with red points, and the corresponding experimental data are also highlighted with grey points. The calculated mass distributions are consistent with the experimental results.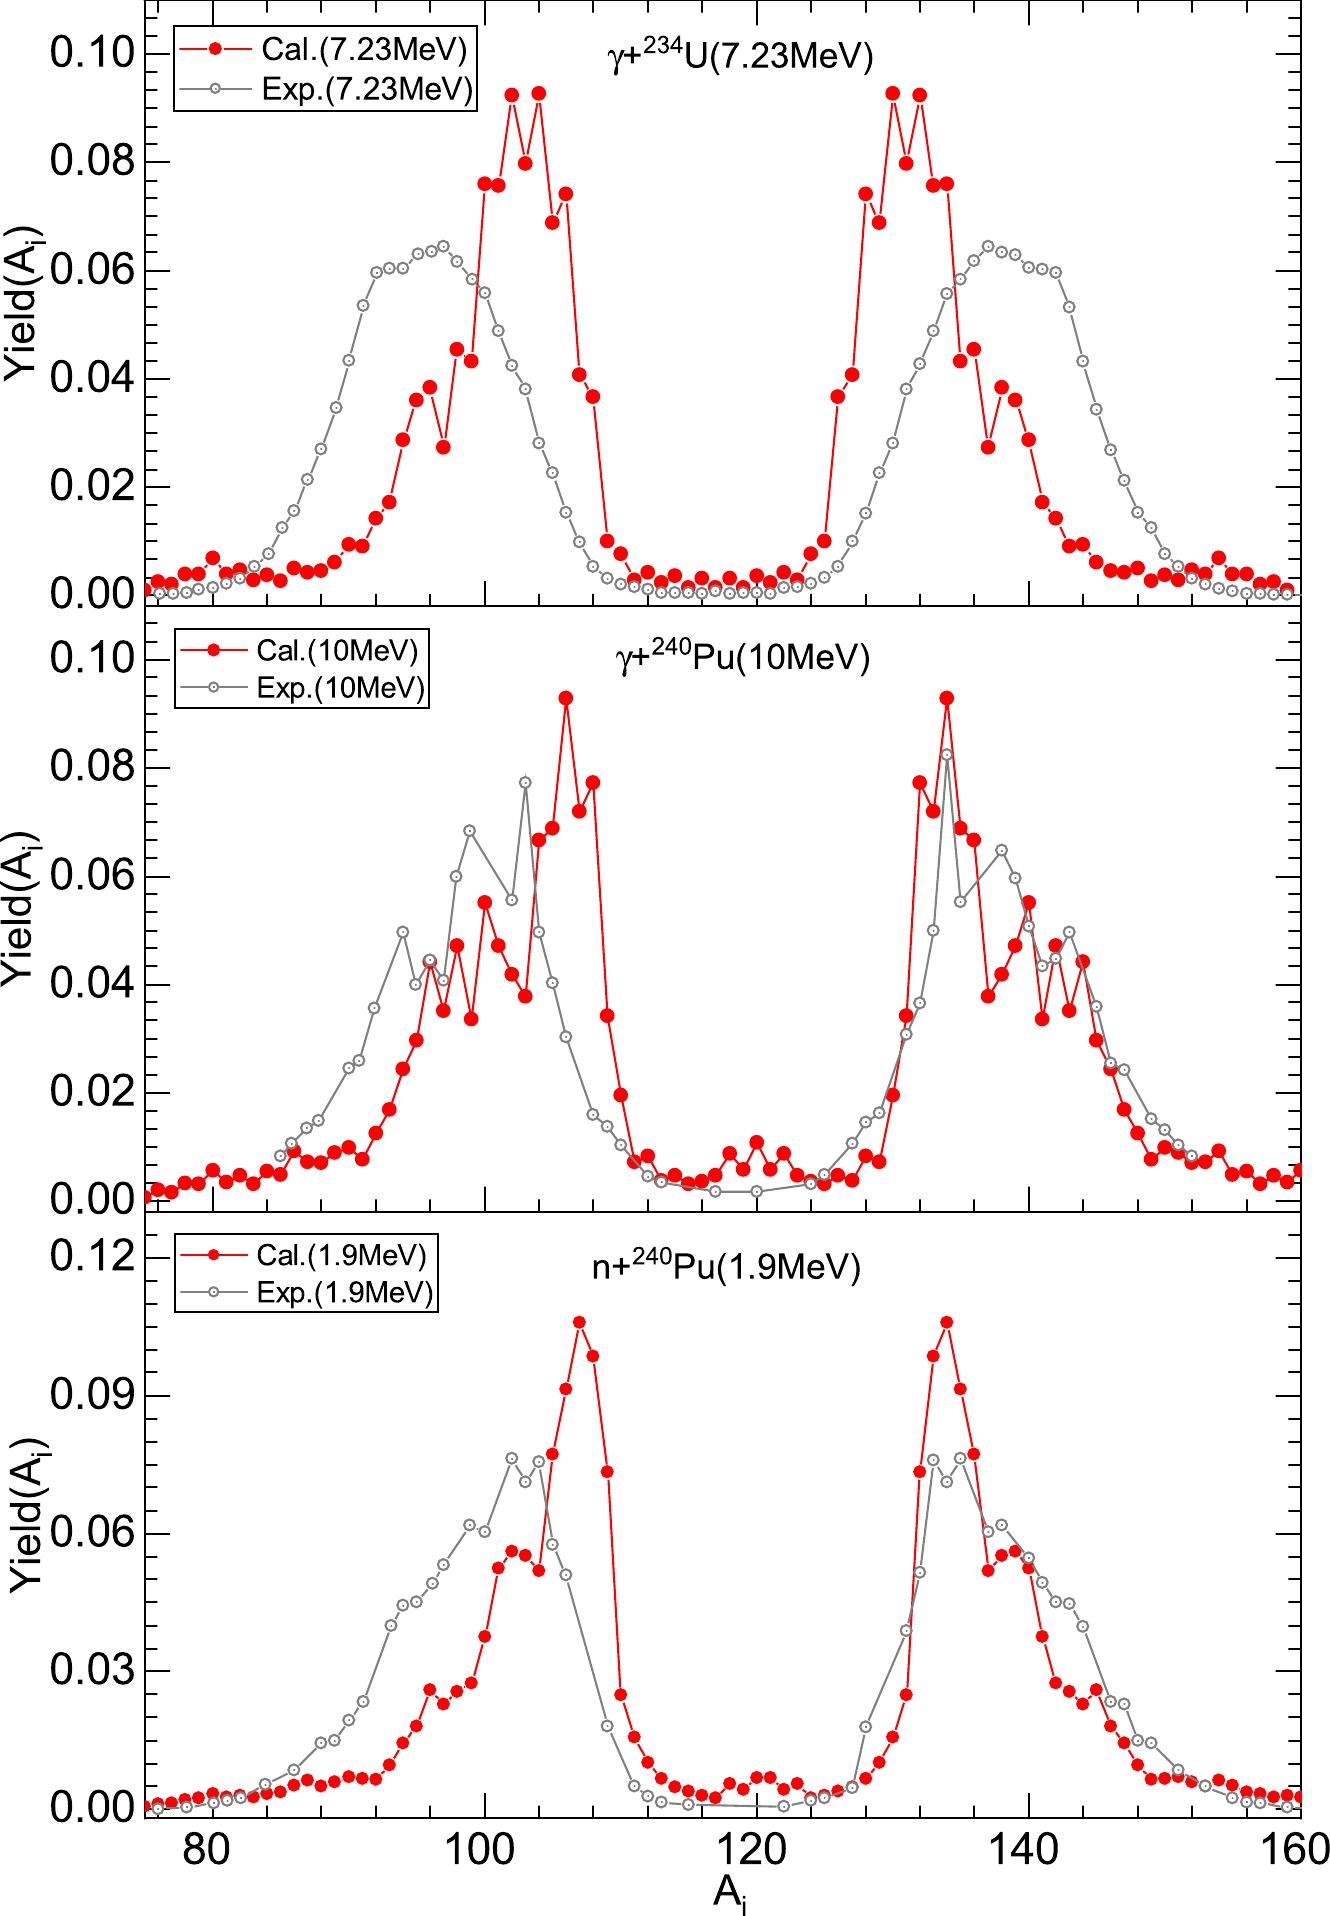
Figure 4. (color online) Comparison of the calculated mass distributions with experimental data. (a) The reaction of the electromagnetic-induced fission of
${^{234}}{\rm{U}}$ at the incident energy$ {{{E}}_{\gamma} = 11 \;{\rm{MeV}}}$ . (b) The same as (a), but for the reaction${^{240}{\rm{Pu}}(\gamma,{\rm{f}})}$ at the incident energy${{{E}}_{\gamma} = 10 \;{\rm{MeV}}}$ . (c) The reaction of the neutron-induced fission of${^{240}}{\rm{Pu}}$ , for the incident energy$ {{{E}}_{{{n}}} = 1.9 \;{\rm{MeV}}}$ . The experimental data were taken from Refs. [55, 56]. -
To study the fission-fragment charge and mass distributions of the isotone chain, we consider some fission systems-
$ ^{238} $ U,$ ^{239} $ Np,$ ^{240} $ Pu, and$ ^{244} $ Cm at low excitation energies, and in Fig. 5 and Fig. 6 the corresponding theoretical and experimental results are presented [57]. We observe an obvious dependence on the excitation energy, for different charge number values. The peak position gradually shifts to the left, while the peak magnitude decreases, for both charge and mass distributions. For example, for charge distributions, the peak position of$ ^{238} $ U and$ ^{239} $ Np is 42 for the excitation energies of 7.4 MeV and 7.5 MeV, respectively, higher than the corresponding experimental values for light fission fragments; however, for the peak position of$ ^{244} $ Cm the opposite conclusion is made. The peak magnitudes for$ ^{238} $ U,$ ^{239} $ Np,$ ^{240} $ Pu, and$ ^{244} $ Cm are approximately 0.310, 0.223, 0194, 0.202, respectively. This occurs because the shell effect on the binding energy decreases sharply with increasing excitation energy for fission-fragment distributions near the peak, which can be inferred from Eq. (9). Near the peak, the driving energy of the DNS increases, and the yields also decrease; for other values, the effect is less dramatic. On the other hand, comparing Figs. 5 (a) and (b), it is clear that the peak magnitude of the charge distribution for$ ^{238} $ U is higher than that for$ ^{239} $ Np, whereas the excitation energies in the two cases are almost equal. This indicates that the charge distribution changes with increasing the CN charge number. In addition, the mass distributions in Fig. 6 lead to the same conclusions as the charge distributions.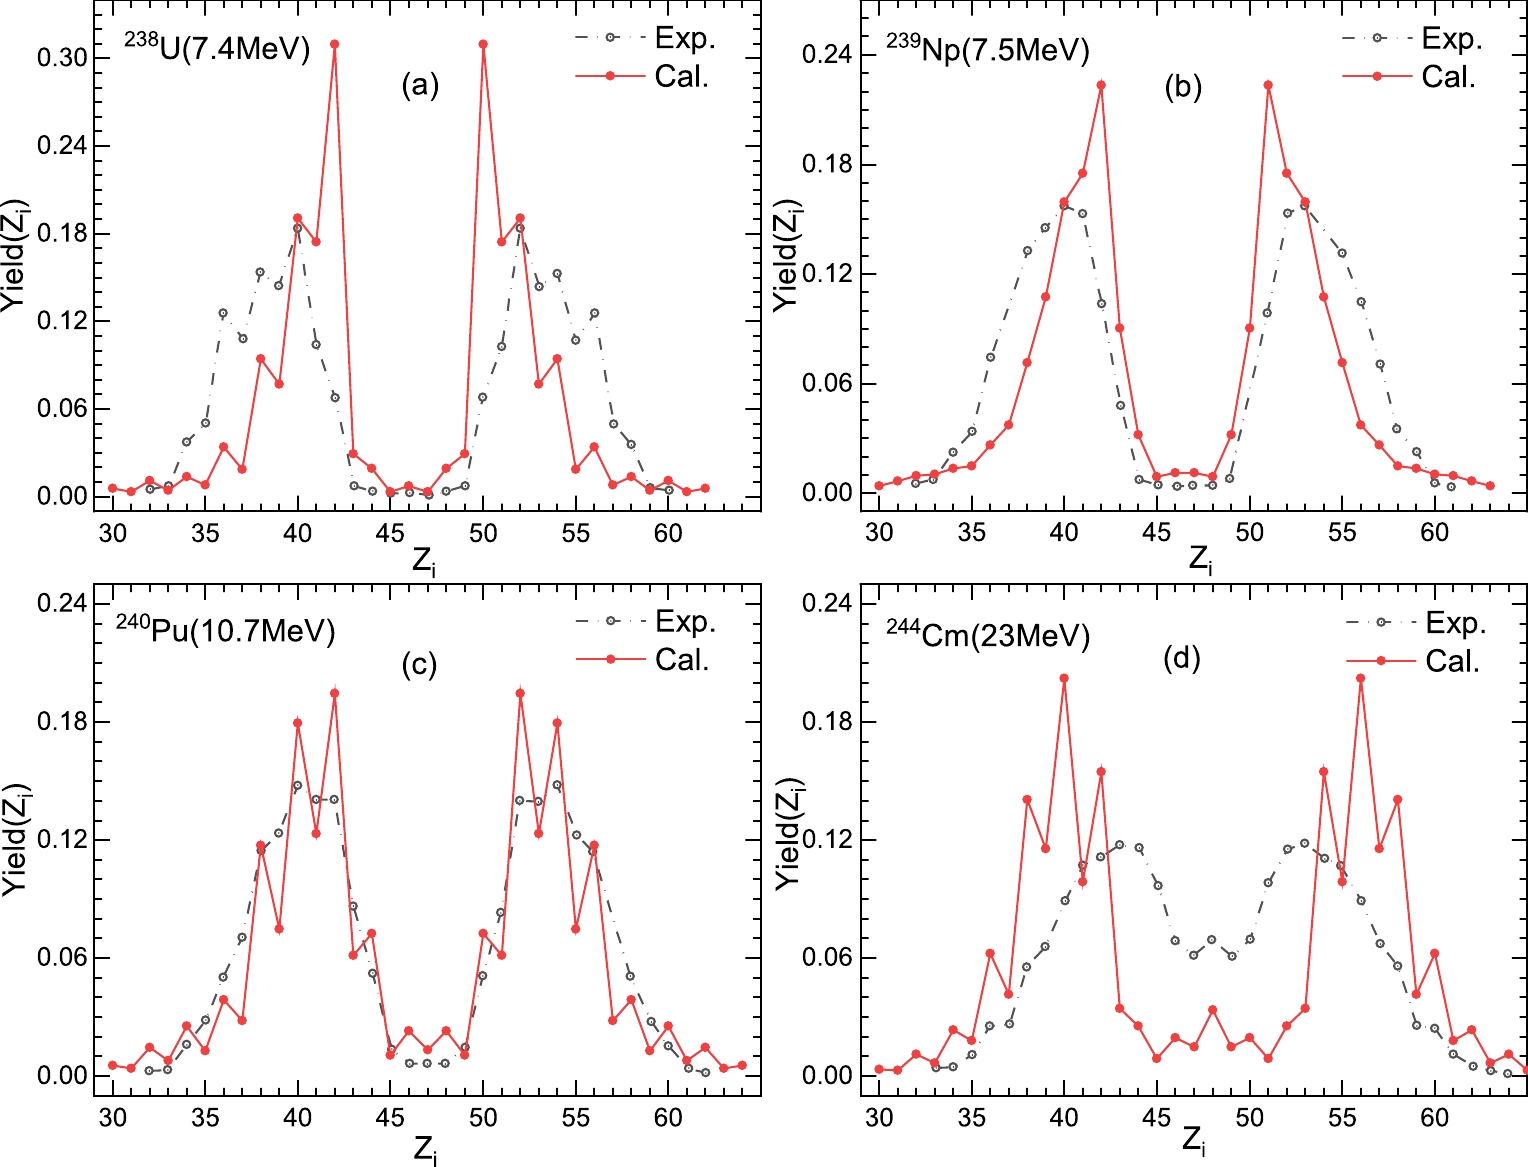
Figure 5. (color online) The calculated charge distributions of isotone chains at low excitation energies, in which the neutron number N is equal to 146, and the fission nuclei are
$^{238}$ U,$^{239}$ Np,$^{240}$ Pu, and$^{244}$ Cm, respectively. The excitation energy$E^*$ is indicated in parentheses. The corresponding experimental results were taken from Ref. [57].
Figure 6. (color onlinr) The same as Fig. 5, but for mass distributions of isotone chains. A simple correction was applied to the corresponding experimental data to account for the neutron evaporation in the fission process.
The difference between the experimental and theoretical results indicates that the shell damping effect is overstated for fission-fragment distributions. However, this comparison reveals a good agreement despite the above statement, which is sufficient for exploring fission-fragment distributions. Moreover, the dependence of the isotone-fission system on the excitation energy
$ E^* $ is evident. As the experimental and theoretical results show, the symmetric fission component increases with increasing excitation energy$ E^* $ . The role of symmetric fission is blurred at the lowest excitation energy, and the asymmetric fission component becomes more prominent. In addition, reaction$ {^{239}}{\rm{Np}} $ can not extract the odd-even effect from Fig. 5 (b) and Fig. 6 (b). As expected, the curve is smooth relative to the other three sets of data, both experimental and theoretical. -
Interestingly, one of the apparent observations from Fig. 3 to Fig. 6 is that for plutonium, the calculated results are consistent with the experimental data, specifically with respect to the charge distribution. This suggests the correctness of the calculation method for neutron-induced and electromagnetic-induced plutonium reactions.
In light of the above, we tested the universality of the simplified TDSPM for describing the fission-fragment distributions of plutonium. Utilizing the excellent agreement of the calculated results with the experimental data, in Fig. 7, we compare the calculated charge and mass distributions with the experimental yields [58-60]; for comparison, we also show the results of other theoretical calculations [61] for the thermal neutron-induced fission of
$ {^{239}}{\rm{Pu}} $ . For the charge distributions in Fig. 7(a), our calculations reproduce the experimental results, both quantitatively and qualitatively. The curve indicates a fluctuating trend. The quality of the description of the odd-even effect is the same as that for Fig. 3. Comparing our calculated results with those obtained using Paşca's theory [blue curve in Fig. 7(a)], the charge distribution of light fission fragments in the latter case is slightly smaller than the experimental one for charge numbers$ 40>Z_L>35 $ . The calculated results are more significant and marginally lower than experimental values in other cases. However, for Paşca's theory, the opposite conclusion is made. Although the asymmetric fission component is observed in both the charge and mass distributions, it shows that the simplified TDSPM overestimates the symmetric fission component, leading to some differences between theoretical and experimental results with respect to the peak magnitude and position in the case of the mass distribution.
Figure 7. (color online) The reaction of thermal neutron-induced fission of 239Pu. (a) Comparison of the charge distribution calculated using the TDSPM with the experimental data [58, 59] and other theoretical calculations [61]. (b) The calculated mass distribution is compared to the experimental data [60].
-
It is instructive to analyze the energy dependence of observable characteristics, for electromagnetic and neutron-induced fission cases. Fig. 8 shows a comparison between the different data sets for the TKE, for different mass distributions, for the fission reaction
$ ^{236} $ U with the excitation energy of 7 MeV. The red circles represent the upper limit values of the TKE,$ Q+E^* $ , and the Q-value was calculated using the mass database [62]. An assumption was made that the charge and mass numbers are conserved near the scission point. The TKE calculation results are shown with black circles, and clearly fall under the AME2003 data.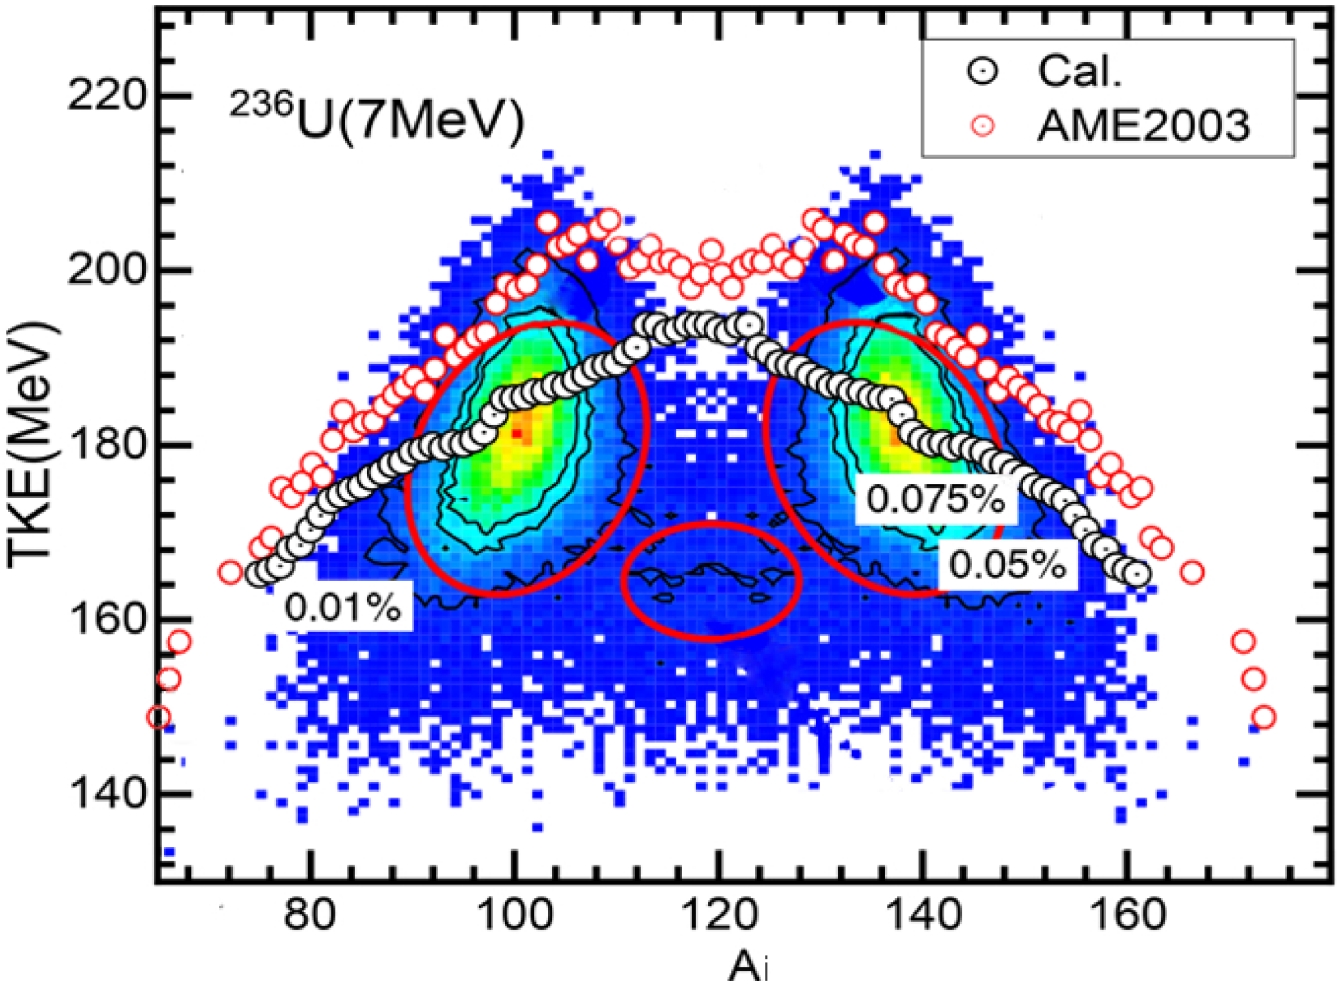
Figure 8. (color online) Mass dependence of the TKE for the reaction of
$ ^{236}$ U with the excitation energy is indicated in parentheses. The corresponding reference data were taken from Ref. [21].To illustrate the relation between the TKE and mass distributions, Fig. 8 compares our calculated TKE results with previously reported theoretical results [21] for the fission reaction
$ ^{236} $ U. The latter result was taken from an extensive body of work, based on the four-dimensional Langevin approach by Ishizuka et al. (color map in Fig. 8) [21]. From Fig. 8, clearly the relation between the TKE and the mass distribution of the fission fragments is well maintained for the asymmetrical fission component, which is consistent with Ishizuka's results regarding the peak position of the mass distribution, for the mass numbers$ A_L = 100 $ and$ A_H = 136 $ .However, for the symmetrical fission component, the calculated results are above the corresponding TKE of fission fragments. This indicates that our theory can not accurately calculate the SL mode. However, for the S1 and S2 modes, as shown by the mass distributions in Fig. 4, Fig. 6, and Fig. 7, there is a small bump near the peaks of the mass distributions (where
$ A_L = 102 $ or$ A_H = 140 $ ), suggesting that it is possible to distinguish between the S1 and S2 modes based on this point. For example, as far as the reaction of$ ^{240} $ Pu with the excitation energy of 10.7 MeV is concerned (Fig. 6 (c)), a wide S2 mode and a narrow S1 mode are notable. In terms of the mass dependence of the TKE as shown in Fig. 8, for the region of heavy fission fragments, the TKE of the S1 mode is larger than that of the S2 mode, with the corresponding inflection point at$ A_H = 140 $ , which is consistent with the previous result [21]. -
The present work is based on the DNS concept, by considering the ground state of a nucleus as an independent variable. Based on this, the driving potential for the evolutionary process of fission along the r-direction was calculated, and it was related to two dynamical variables
$ (A,Z) $ . The fission-fragment distributions for both electromagnetic and neutron-induced fissions$ ^{233-236,238} $ U,$ ^{239} $ Np,$ ^{239,240} $ Pu, and$ ^{244} $ Cm at low excitation energies were systematically investigated, and were found to be consistent with previously published data. This validation analysis also suggested that the asymmetrical fission component based on the S1 and S2 fission modes is supported by appropriate consistency with various experimental data. For the SL mode, however, the calculated results for the TKE of fission fragments were not satisfactorily reproduced. The shell damping effect was also accounted for in the simplified TDSPM. The fission-fragment distributions decreased with increasing excitation energy. Meanwhile, in this work, the charge and mass distributions of the isotone chain were investigated in light of some recent experimental results.The theoretical results were in perfect agreement with experimental data with respect to the peak position, width, and magnitude. Especially for charge distributions, the odd-even effect of nuclei was well explained, with the corresponding distributions exhibiting jagged shapes. For mass distributions, however, the predictive power was slightly weaker. Finally, the energy dependence of mass distributions was also calculated, and the results were compared with those from other works. Based on the DNS, the mass, charge, and kinetic-energy distributions were accurately calculated within the framework of the TDSPM. The theoretical fission yield curves for lighter actinides were found to agree well with experimental data.
-
We are grateful to Prof. J. Q. Li for the valuable discussion.
Multi-parameter global calculations of fission fragments using a simplified two-dimensional scission-point model
- Received Date: 2020-08-24
- Available Online: 2021-02-15
Abstract: Exploiting the concept of the dinuclear system, the interaction potential energy of two fragments that are quite close to each other is analyzed. A semi-classical method is used to calculate fission fragment yields using a simplified two-dimensional scission-point model. By considering the tip-to-tip orientation at the scission point of the fission process, we investigate the mass, charge, and kinetic-energy distributions of the fission fragments, for excitation energies in the 0-20 MeV range. Our results show that the fission fragment distributions are reproduced quite well, including the recent experimental results for the isotone chain [D Ramos et al. Phys. Rev. C 97, 054612 (2018)]. Thus, the simplified model is useful for multi-parameter global measurements of fission products.


 DownLoad: