


 Abstract
 HTML
HTML Reference
 Related
 PDF
PDF


-
With the accumulation of long lived Minor Actinides (
$ {\rm MAs} $ ), such as$ {}^{237} {\rm Np} $ ,$ {}^{241} {\rm Am} $ , and$ {}^{244} {\rm Cm} $ etc., post-processing of spent nuclear fuel has aroused wide attention around the world. Their long half-life and high-level of radioactivity have a strong influence on sustainable development of nuclear power.$ {}^{237} {\rm Np} $ is in particular considered as one of the most important actinides in reprocessing of spent nuclear fuel due to its high yield (0.052%) and long radioactive half-life ($ 2.14\times{10}^{6} $ y) [1, 2].For the development of accelerator driven sub-critical system (
$ {\rm ADS} $ ) [3-5] and fast reactors [6, 7], aiming at power production as well as for transmutation of MAs into short lived nuclides or stable isotopes by fission, the accurate and complete nuclear data is needed. Deuterium-tritium ($ {\rm D-T} $ ) fusion neutron source, which is usually used to produce 14 MeV quasi-monoenergetic neutrons, could contribute to burning of the actinides in fast reactors [8-10], but the relevant nuclear data for 14 MeV neutron-induced fission of$ {}^{237} {\rm Np} $ is limited. Some research of the characteristics of fission products of$ {}^{237} {\rm Np} $ has been reported in literature [11, 12] and in the evaluation databases, such as ENDF/B-VII.I, JENDL-4.0 and GEFY-3.3. However, the data presented is for a few fission nuclides, or just for measured fission yield distributions.The research of fission of actinide nuclei is of great importance for practical applications. The neutron-induced fission reaction is a unique decay process, which can be described by the interplay of macroscopic (collective) and microscopic (single particle) degrees of freedom in a nucleus [13, 14]. The experimental data is increasingly available and theoretical support is urgently needed [15-17]. Using the method of Monte Carlo transport code Geant4 [18], we study in this work the reaction
$ {}^{237} {\rm Np(n,f)} $ with two different physical models: the potential-driving model [19] and the G4ParaFission Model. Important and detailed information, such as the fission yield distributions, kinetic energy distributions, fission neutron spectrum and the total nubar, are compared with the nuclear data tables and experimental data, and the applicability of the potential-driving model is evaluated. Based on the potential-driving model, the$ {}^{237} {\rm Np(n,f)} $ reaction is calculated with Geant4 with reasonable accuracy, which can contribute to evaluating the nuclear databases and guiding the physical design of a transmutation system. -
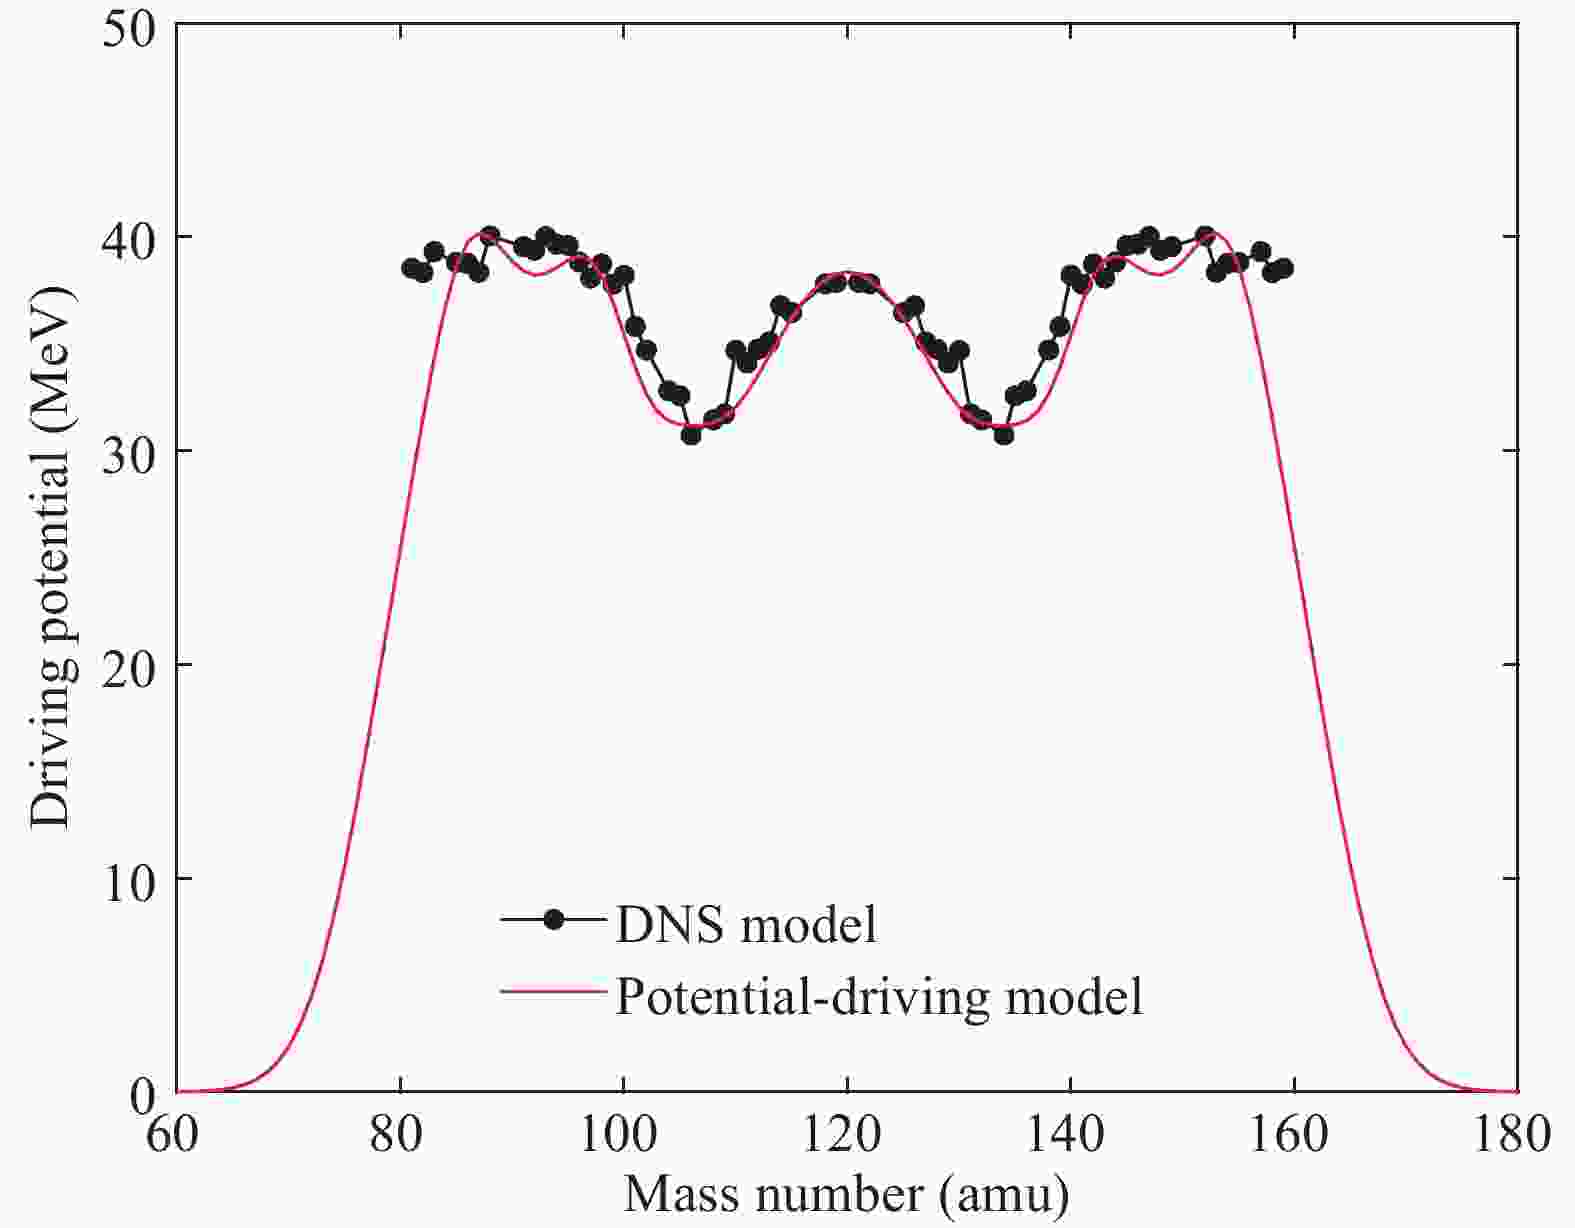
Based on the potential-driving model [19], the driving potential D can be expressed as the sum of symmetric fission potential and asymmetric fission potential [20, 21]
$ \begin{split} D =& U_{\rm sym}(A_{\rm f})+U_{\rm asym}(A_{\rm f})\\ =& D(A_{\rm sym})\cdot\exp\left[-\frac{(A_{\rm f}-A_{\rm sym})^2}{2\delta_{\rm sym}^2}\right] +\sum\limits_{i}\eta_i\cdot\ D(A_{{\rm asym,}{i}})\\ &\times \exp\left[-\frac{(A_{\rm f}-A_{{\rm asym,}{i}})^2}{2\delta_{{\rm asym}{,i}}^2}\right], \end{split} $

(1) where
$ U_{\rm sym}(A_{\rm f}) $ and$ U_{\rm asym}(A_{\rm f}) $ denote the symmetric fission potential and asymmetric fission potential, respectively.$ A_{\rm f} $ is the mass number of the initial fission-fragment.$ A_{\rm sym} $ and$ A_{{\rm asym,}{i}} $ are the peak positions of mass number for the symmetric and asymmetric fission potentials, respectively.$ D(A_{\rm sym}) $ and$ D(A_{{\rm asym,}{i}}) $ are the driving potentials of symmetric and asymmetric fragments, respectively.$ \delta_{\rm sym} $ and$ \delta_{{\rm asym,}{i}} $ denote the widths of symmetric and asymmetric fission mass distribution, respectively. i is the index of different asymmetric fission potentials, and$ \eta_{i} $ defines the relative contribution of each asymmetric fission potential [19].Figure 1 shows the calculated driving potential distribution for the
$ {}^{237} {\rm Np(n,f)} $ reaction. One can see that the calculated results from the potential-driving model agree well with the results from the DNS model [22-24].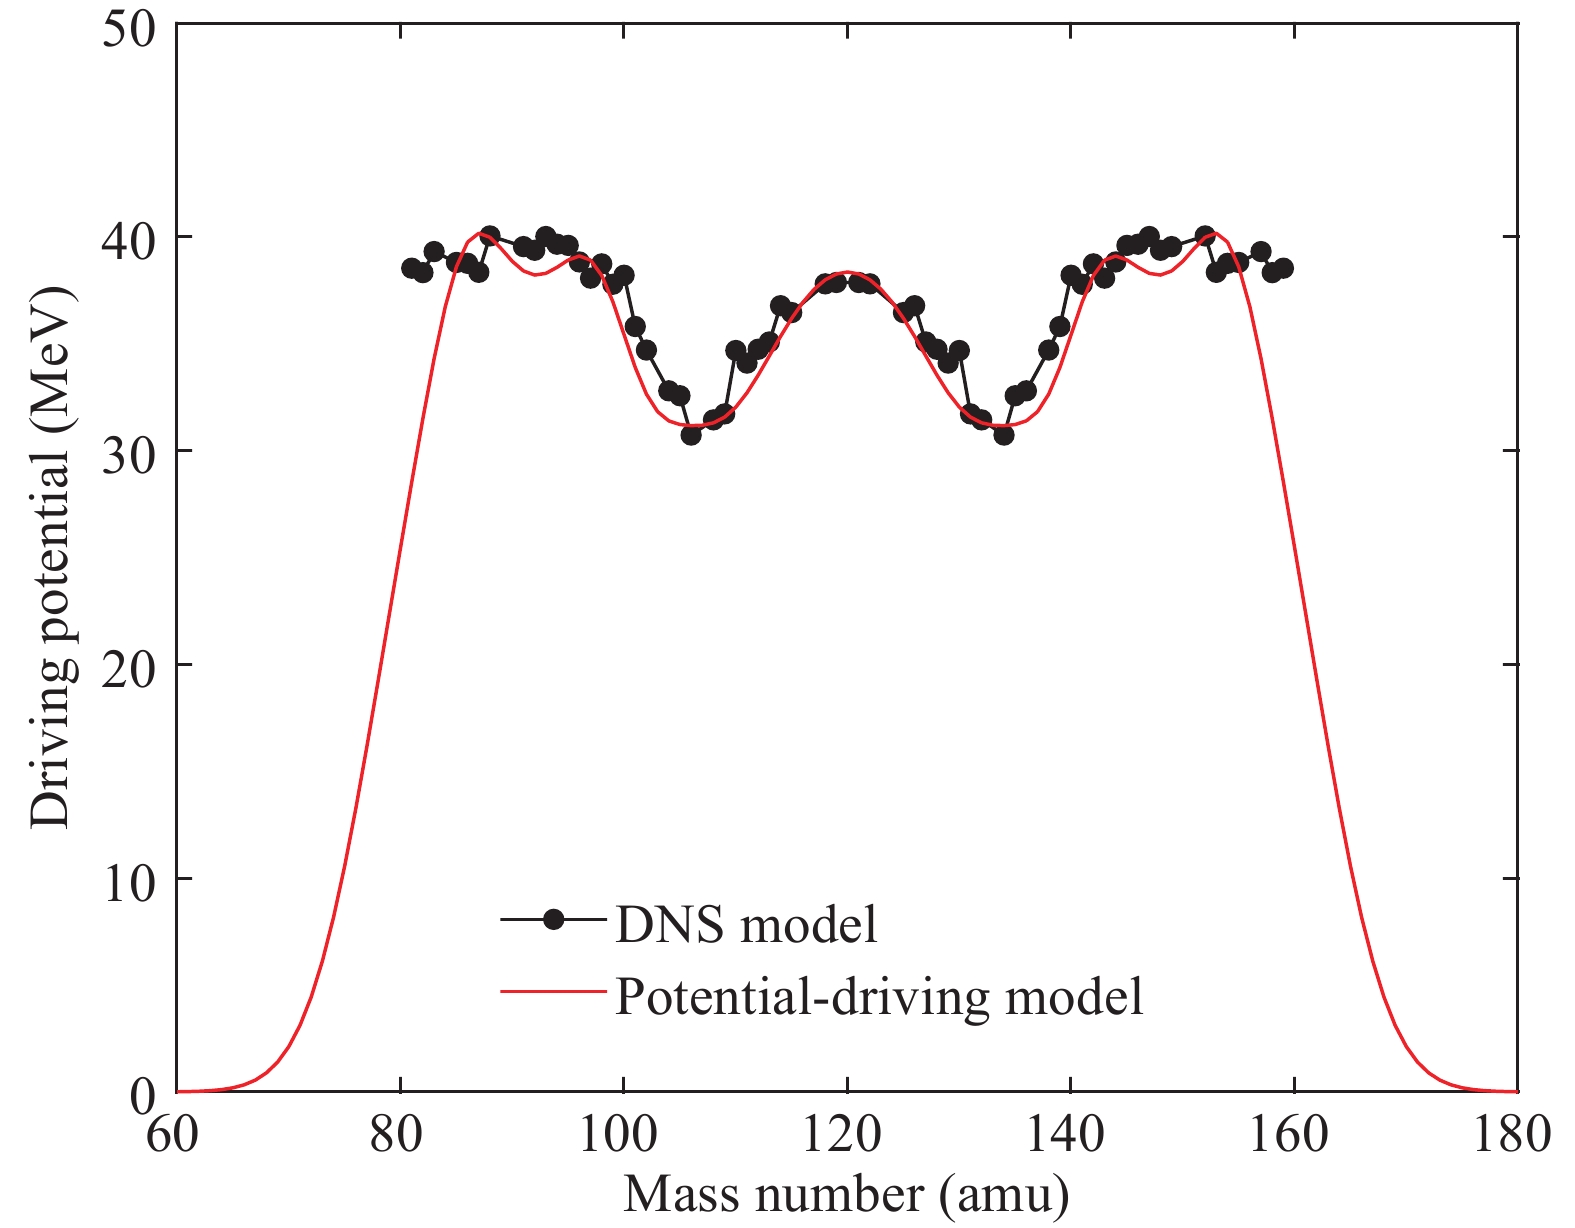
Figure 1. (color online) The driving potential distribution for the
$ {}^{237} {\rm Np(n,f)}$ reaction. The red curve denotes the driving potential distribution calculated by the potential-driving model, and the solid circles denote the driving potential distribution calculated by the DNS model. -
The pre-neutron emission mass distribution, which is significant for understanding the fission process and calculating the fission product yield, has a strong relationship with the driving potential distribution
$ F(A_{\rm f}) = C\times\left[\frac{U_{\rm asym}(A_{\rm f})}{T(A_{\rm CN})}+\omega\cdot\frac{U_{\rm sym}(A_{\rm f})}{T(A_{\rm CN})}\right], $

(2) where C is the normalization constant.
$ U_{\rm asym}(A_{\rm f}) $ and$ U_{\rm sym}(A_{\rm f}) $ are the empirical asymmetric fission potential and the empirical symmetric fission potential, respectively. To determine the parameters of$ U_{\rm asym}(A_{\rm f}) $ and$ U_{\rm sym}(A_{\rm f}) $ , we consider the contributions from the excitation energy, fission width, neutron evaporation width and energy dependence of evaporation neutrons for the reactions$ {\rm (n,x\widetilde{n}f)} $ [19].$ A_{\rm CN} $ is the mass number and$ T(A_{\rm CN}) $ is the temperature of the specific compound nucleus. The weight$ \omega $ is the relative contribution of each driving potential, and it is strongly dependent on the peak-to-valley ratio$ \omega(E_{n},Z,A) = \frac{U^{\rm max}_{\rm asym}}{U^{\rm max}_{\rm sym}}/P_{\rm peak-to-valley}, $

(3) where
$ U^{\rm max}_{\rm asym} $ and$ U^{\rm max}_{\rm sym} $ denote the maximum value of$ U_{\rm asym}(A_{\rm f}) $ and$ U_{\rm sym}(A_{\rm f}) $ , respectively.$ P_{\rm peak-to-valley} $ is the peak-to-valley ratio of the mass distribution, and it can be well described by an exponential function [24-26]. Z and A are the charge number and mass number of the fission nucleus, respectively. In the potential-driving model, all parameters are defined, and the model can be applied to calculate the pre-neutron emission mass distributions for neutron-induced fission of all actinide nuclei with incident neutron energies up to 160 MeV without specific adjustments for individual fissioning systems [19].In order to verify the reliability of the potential-driving model, we have calculated pre-neutron emission mass distributions for the
$ {}^{237} {\rm Np(n,f)} $ ,$ {}^{232} {\rm Th(n,xnf)} $ ,$ {}^{235} {\rm U(n,f)} $ ,$ {}^{238} {\rm U(n,xnf)} $ and$ {}^{239} {\rm Pu(n,f)} $ reactions at different incident energies, as shown in Fig. 2. The calculated results agree well with the experimental data [27-31] for neutron-induced actinide nuclei fission (see Fig. 2), which indicates that the potential-driving model can reproduce the measured results at different incident energies. In particular, taking into account the energy dependence of evaporation neutrons from the reactions$ {\rm (n,x\widetilde{n}f)} $ [32, 33], the potential-driving model can calculate pre-neutron emission mass distributions for the$ {}^{238} {\rm U(n,xnf)} $ reaction with incident neutron energies up to 160 MeV, shown in Fig. 2(g). With increasing incident neutron energy, there are clear changes in the experimental data for pre-neutron emission mass distributions, such as the increase of the valley height and the decrease of the peak height. The potential-driving model also describes this behavior. Given the good agreement with the experimental data, the potential-driving model should predict well the mass distributions for the$ {}^{237} {\rm Np(n,f)} $ reaction at unmeasured energies.
Figure 2. (color online) Pre-neutron emission fission-fragment mass distribution for the
${}^{237} {\rm Np(n,f)}$ ,${}^{232} {\rm Th(n,xnf)}$ ,${}^{235} {\rm U(n,f)}$ ,${}^{238} {\rm U(n,xnf)}$ and${}^{239} {\rm Pu(n,f)}$ reactions at different incident energies. The red curves denote the calculated data from the potential-driving model, and the solid circles denote the experimental data [27–31] at different incident energies. -
Our group has previously simulated neutron-induced fission of actinide nuclei based on the built-in G4ParaFissionModel [34, 35]. In this work, the potential-driving model is implemented in Geant4 as replacement of the G4ParaFissionModel. We also simulate several observables of neutron-induced fission of the
$ {}^{237} {\rm Np} $ nucleus based on the potential-driving model so as to test the applicability of the two different fission models.The G4ParaFissionModel is a typical semi-empirical model. Most parameters are defined by the Gaussian functions, which are adjusted to measured mass yields. Compared with the G4ParaFissionModel, the potential-driving model takes into account the shell-correction terms and the energy dependence of evaporation neutrons for the reactions
$ {\rm (n,x\widetilde{n}f)} $ . The potential-driving model, with well-determined parameters, also includes the empirical asymmetric fission potential and the empirical symmetric fission potential. Empirical asymmetric fission potential and the empirical symmetric potential give the driving potential D and reproduce the pre-neutron emission mass distributions for the$ {}^{237} {\rm Np(n,f)} $ ,$ {}^{232} {\rm Th(n,xnf)} $ ,$ {}^{235} {\rm U(n,f)} $ ,$ {}^{238} {\rm U(n,xnf)} $ and$ {}^{239} {\rm Pu(n,f)} $ reactions without specific adjustments for individual fissioning systems. -
Using the potential-driving model and the G4ParaFissionModel, 14 MeV fast neutron-induced fission of the
$ {}^{237} {\rm Np} $ nucleus is simulated in this work. The calculated independent yield distributions from the$ {}^{237} {\rm Np(n,f)} $ reaction are shown in Fig. 3. Comparison with the experimental data [11, 12] and with the evaluated nuclear data from ENDF/B-VII.1 is also shown. Compared to the G4ParaFissionModel, the independent yields calculated with the potential-driving model agree better with the experimental data and ENDF/B-VII.1. Obviously, in the region$ 110<A<125 $ and$ 47<Z<58 $ , the calculated independent yields from the G4ParaFissionModel have an opposite tendency to the recommended data.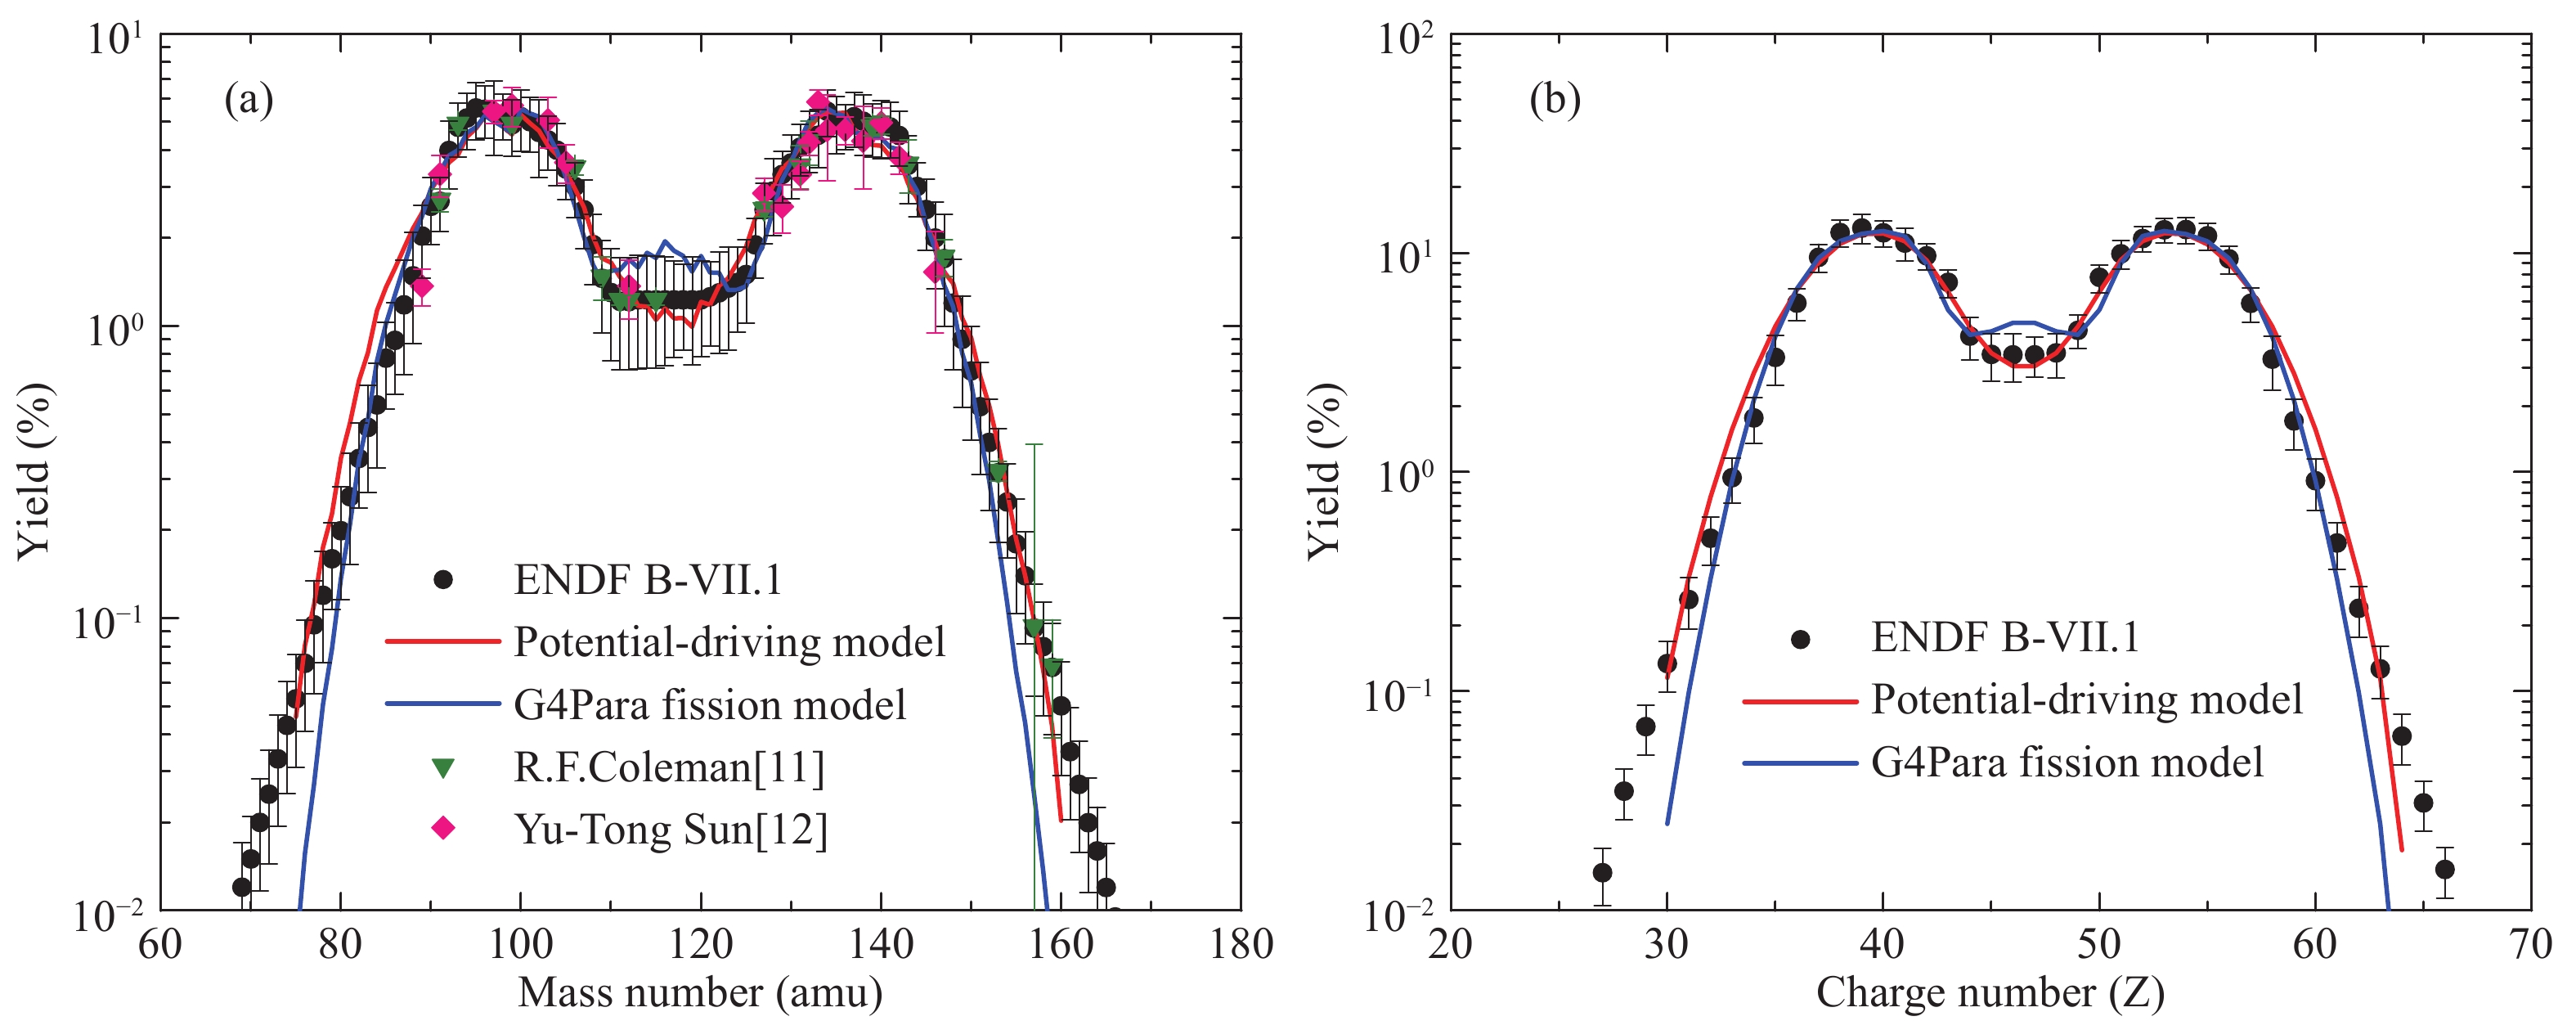
Figure 3. (color online) Comparison between the calculated data and the recommended data. (a) The mass chain yield versus mass number for the independent yield from the
${}^{237} {\rm Np(n,f)}$ reaction. (b) The elemental yield versus charge number for the independent yield from the${}^{237} {\rm Np(n,f)}$ reaction. The red lines denote calculated results from the potential-driving model, the blue lines denote calculated results from G4ParaFissionModel, and the color dots and black dots denote experimental and evaluated data.Figure 4 shows the calculated cumulative yield distributions from the
$ {}^{237} {\rm Np(n,f)} $ reaction, and the evaluated nuclear data from ENDF/B-VII.1. The comparison shows an overall good consistency. The calculated cumulative yields from the potential-driving model have a better relative accuracy than the G4ParaFissionModel. From Fig. 3 and Fig. 4, it can be concluded that the new method proposed in this work to calculate the fission yield distributions with the potential-driving model shows a substantial advance with regard to accuracy.
Figure 4. (color coline) Comparison between the calculated data and the recommended data. (a) The mass chain yield versus mass number for the cumulative yield from the
${}^{237} {\rm Np(n,f)}$ reaction. (b) The elemental yield versus charge number for the cumulative yield from the${}^{237} {\rm Np(n,f)}$ reaction. The red lines denote calculated results from the potential-driving model, the blue lines denote calculated results from G4ParaFissionModel, and the black dots denote evaluated data. -
The fission of a heavy nucleus releases about 200 MeV, and a large part of this energy is released as kinetic energy of the fission-fragments. As one of the most significant physical quantities, it is closely related to the deformation of the fission nucleus and the driving potential at the scission point.
The kinetic energy of the fragments is vital for obtaining the mass distributions in the experiments by means of the double kinetic energy (2-E) method [36-38]. In previous works, the single fragment kinetic energy distributions for fast neutron-induced
$ {}^{235} {\rm U} $ ,$ {}^{238} {\rm U} $ ,$ {}^{237} {\rm Np} $ and$ {}^{239} {\rm Pu} $ fission have been successfully measured [29, 39]. Due to the lack of data at 14 MeV incident energy, and as the only available comparable experimental data are at 4.6 MeV [29], the fission reaction$ {}^{237} {\rm Np(n,f)} $ at 4.6 MeV is first calculated to prove the reliability of the potential-driving model. The calculated two-dimensional distribution of the kinetic energy and mass number of the fission-fragments is shown in Fig. 5(a). The relationship between the average kinetic energy and mass number of the fission-fragments shows that for light fission-fragments the average kinetic energy is almost constant, while there is a large difference for heavy fragments. Neglecting the effects of momentum transfer and neutron emission, the ratio of the kinetic energy of fragments is inverse to the ratio of their mass. Therefore, with increasing mass number, the average kinetic energy roughly follows a downward trend. For the magic nucleus and its complementary nuclei, this downward trend clearly flattens, owing to the shell structure effect.
Figure 5. (color online) (a) Two-dimensional distribution of the kinetic energy and mass number of the fission-fragments calculated with the potential-driving model at 4.6 MeV incident neutron energy. (b) Comparison of the kinetic energy distributions from Monte Carlo calculated data and experimental data. The red line denotes calculated result from the potential-driving model, the blue line denotes calculated result from G4ParaFissionModel and the black dots denote experimental data.
The calculated kinetic energy distributions of single fragments from the two physical models are shown in Fig. 5(b). They both show good agreement with the experimental data [29], which indicates that the potential-driving model can describe well the sharing of the kinetic energy between two complementary fragments in the
$ {}^{237} {\rm Np(n,f)} $ reaction.For
$ E_n = $ 1.3 MeV, 2.0 MeV, 4.6 MeV, 5.5 MeV and 14.0 MeV, the relationship between the average total kinetic energy ($ {\overline{TKE}} $ ) and the heavy fission-fragment mass number is shown in Fig. 6(a). The black curve denotes the results from the potential-driving model. One can see that$ {\overline{TKE}} $ reaches a maximum value at$ A_{H} = 132 $ $ {\rm amu} $ on account of nuclear shell structure effects (N = 82, Z = 50). For the$ {}^{237} {\rm Np(n,f)} $ reaction, the value of$ TKE $ around the symmetric fragment mass is about 10 - 20 MeV lower than the peak value, and with increasing incident neutron energies (excitation energy), this energy difference distinctly becomes smaller. In addition, the relationship between the relative average total kinetic energy ($ {\Delta{{\overline{TKE}}}} $ ) and the heavy fission-fragment mass number is shown in Fig. 6(b). With increasing incident neutron energy,$ \Delta{\overline{TKE}} $ remains the same in the region$ 138<A<155 $ , which indicates that the change of excitation energy has no effect on$ {\overline{TKE}} $ for$ 138<A<155 $ . A similar trend is reported for other actinide nuclei fission reactions [36, 40].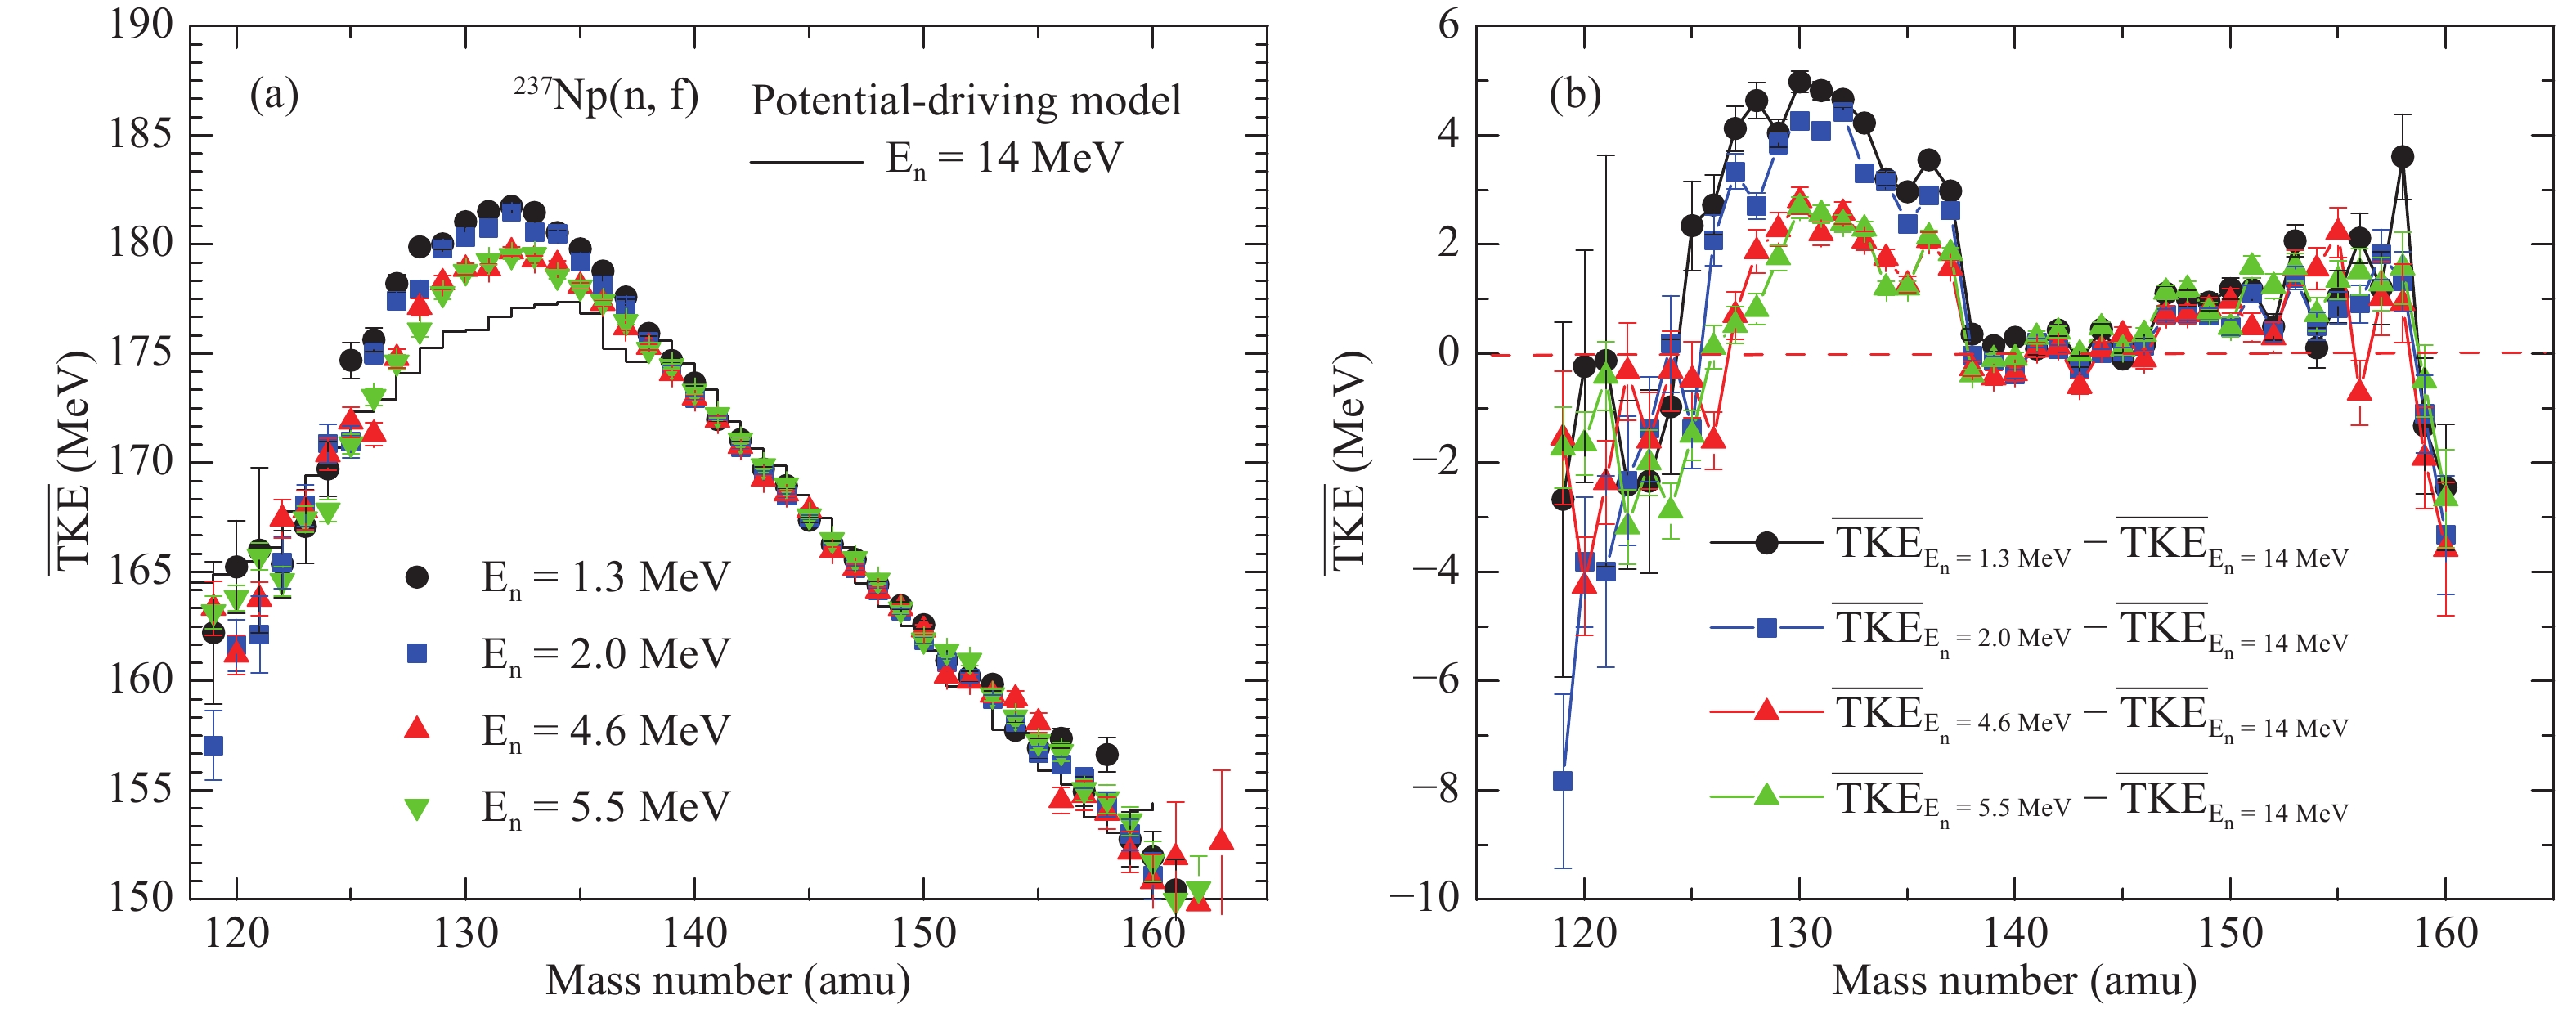
Figure 6. (color online) (a) Relationship between the average total kinetic energy (
${\overline{TKE}}$ ) and the heavy fission-fragment mass number. (b) Relationship between the relative average total kinetic energy ($\Delta{\overline{TKE}}$ ) and the heavy fission-fragment mass number. -
In the process of neutron-induced fission of actinide nuclei, the excitation energy of the compound nucleus becomes higher and the nucleus undergoes de-excitation by emitting neutrons and gamma rays. The fission neutron spectrum and the total nubar for the
$ {}^{237} {\rm Np(n,f)} $ reaction calculated in this work is shown in Fig. 7.
Figure 7. (color online) (a) Fission neutron spectrum from the
$ {}^{237} {\rm Np(n,f)}$ reaction at 14 MeV. (b) The total average neutron multiplicity as function of incident energy, with a comparison between the experimental data and calculated data.The calculated fission neutron spectra for the
$ {}^{237} {\rm Np(n,f)} $ reaction with the two models are in good agreement with the evaluated nuclear data from ENDF/B-VII.1, Fig. 7(a) , and both follow the Maxwell-Boltzmann distribution [41]. According to the weighted average method, the average energy of fission neutrons can be expressed as$ {\overline E} = \frac{{\displaystyle\int_0^\infty {E\cdot N(E){\rm d}E} }}{{\displaystyle\int_0^\infty {N(E){\rm d}E} }}, $

(4) where E denotes the fission neutron energy, and
$ N(E) $ denotes the fission neutron yield.The calculated result from the potential-driving model,
$ {\overline {E}} = 2.095 \;{\rm{MeV}} $ , shows an overall good consistency with the experimental data$ {\overline {E}} = 2.06\pm0.05 \;{\rm{MeV}} $ [42] and$ {\overline {E}} = 2.13\pm0.03 \;{\rm{MeV}} $ [43]. As shown in Fig. 7(b), the calculated results for the total nubar for the$ {}^{237} {\rm Np(n,f)} $ reaction are also in good agreement with the evaluated nuclear data from ENDF/B-VII.1 and experimental data [42, 44]. -
The potential-driving model was used to calculate the driving potential distributions and pre-neutron emission mass distributions for neutron-induced
$ {}^{237} {\rm Np} $ fission. The model can also describe correctly the pre-neutron emission mass distributions as function of incident neutron energy, indicating that the potential-driving model can provide accurate predictions of mass distributions for unmeasured energy regions.The potential-driving model was implemented in Geant4, and was used to calculate the fast neutron-induced fission of
$ {}^{237} {\rm Np} $ . The characteristics of the$ {}^{237} {\rm Np(n,f)} $ reaction, such as fission-fragment yield distributions, kinetic energy distributions, fission neutron spectrum and the total nubar, were calculated. Compared with the built-in G4ParaFissionModel, the results from the potential-driving model are in better agreement with the experimental data and evaluated data. The potential-driving model shows a significant advance with regard to accuracy.Fission-fragment kinetic energy transforms into thermal energy in the stopping process, and the calculated fission-fragment kinetic energy distributions, fission neutron spectrum and the total nubar are important input for reactor engineering design and selection of reactor wall materials. They also serve to guide the physical design of a transmutation system.
The potential-driving model in Geant4 can describe well the process of neutron-induced fission of actinide nuclei. This work will serve for future detailed studies of neutron transmutation physics and engineering design of Accelerator-Driven Systems (ADS).
Monte Carlo simulation of fast neutron-induced fission of 237Np
- Received Date: 2019-01-08
- Accepted Date: 2019-03-08
- Available Online: 2019-06-01
Abstract: The potential-driving model is used to describe the driving potential distribution and to calculate the pre-neutron emission mass distributions for different incident energies in the


 DownLoad: