-
10B, a stable isotope of boron with natural abundance of 19.9%, is a crucial material in nuclear engineering, including radiation protection, neutron detection, reactor control, boron neutron capture therapy (BNCT), etc [1]. For neutron induced nuclear reactions of 10B, the 10B(n, α)7Li reaction is the dominate reaction channel for En < 1.0 MeV. In addition to various applications, the study of this reaction can enhance the understanding of nuclear reaction mechanism for light nuclei [2]. The 10B(n, α)7Li reaction has two main reaction channels, which are the 10B(n, α0)7Li (Q = 2.79 MeV) and 10B(n, α1)7Li* (Q = 2.31 MeV) reactions. Many measurements of the 10B(n, α)7Li reaction have been conducted since 1954 [3]. The cross sections of the 10B(n, α)7Li and 10B(n, α1)7Li* reactions have been recommended as neutron cross section standard in the region from thermal to 1.0 MeV energy [4].
In the MeV region, however, due to the small cross sections and strong interference of background, discrepancies among different measurements and evaluations are apparent [3, 5]. Furthermore, existing measurements of the differential cross sections of the 10B(n, α)7Li reaction, as well as those of the 10B(n, α0)7Li and 10B(n, α1)7Li* reactions, are scarce. Only three measurements of angular distributions and differential cross sections (Sealock [6], Stelts [7] and Hambsch [2]) can be found in EXFOR for En ≤ 1.2 MeV and there is no data in the 1.2 MeV < En < 2.5 MeV region. Taking these factors into consideration, accurate measurements of differential and angle-integrated cross sections for the 10B(n, α)7Li reaction are demanded.
In the present work, a LPDA (Light-charged Particle Detector Array) system, which mainly consisted with a silicon detector array in a vacuum chamber, was built to study the neutron induced charged particle emission reaction at CSNS (China Spallation Neutron Source) Back-n white neutron source [8]. With 15 silicon detectors distributed from 19.2° to 160.8°, the differential and angle-integrated cross sections were obtained for the 10B(n, α)7Li reaction in the 1.0 eV ≤ En < 2.5 MeV region (67 energy points), as well as the two reaction channels, 10B(n, α0) 7Li and 10B(n, α1) 7Li*, in the 1.0 eV ≤ En < 1.0 MeV region (59 energy points). The present results have been analyzed with the resonance reaction mechanism and the level structure of the 11B compound system, and compared with existing measurements and evaluations.
-
The neutrons were produced by double bunched proton beam (1.6 GeV, ~ 20 kW) bombarding a tungsten target at CSNS Back-n white neutron source [9]. The repetition rate of the beam pulse was 25 Hz and the pulse width was ~ 41 ns. The interval between the two proton bunches was 410 ns [10]. The experiment was conducted at Endstation #1, where the length of the flight path was 57.99 m, and the neutron flux was ~ 3.5×10⁶ n/(cm2·s). The beam spot size at Endstation #1 was determined by the apertures of the shutter and Collimator-1 [11]. The diameter of the collimation aperture of the shutter was 50 mm and that for Collimator-1 was also 50 mm in the present work. The full width at half maximum (FWHM) of the neutron beam spot was 54 – 58 mm [12]. The relative neutron intensity could be monitored by the number of protons in the beam and a Li-Si detector array mounted in the beamline. Using the single-bunch operation mode, the neutron energy spectrum was measured by a multi-layer 235U fission chamber at Endstation #2, where the length of flight was 75.76 m [13, 14]. The details of the neutron energy spectrum could be found in Refs. [8] and [14].
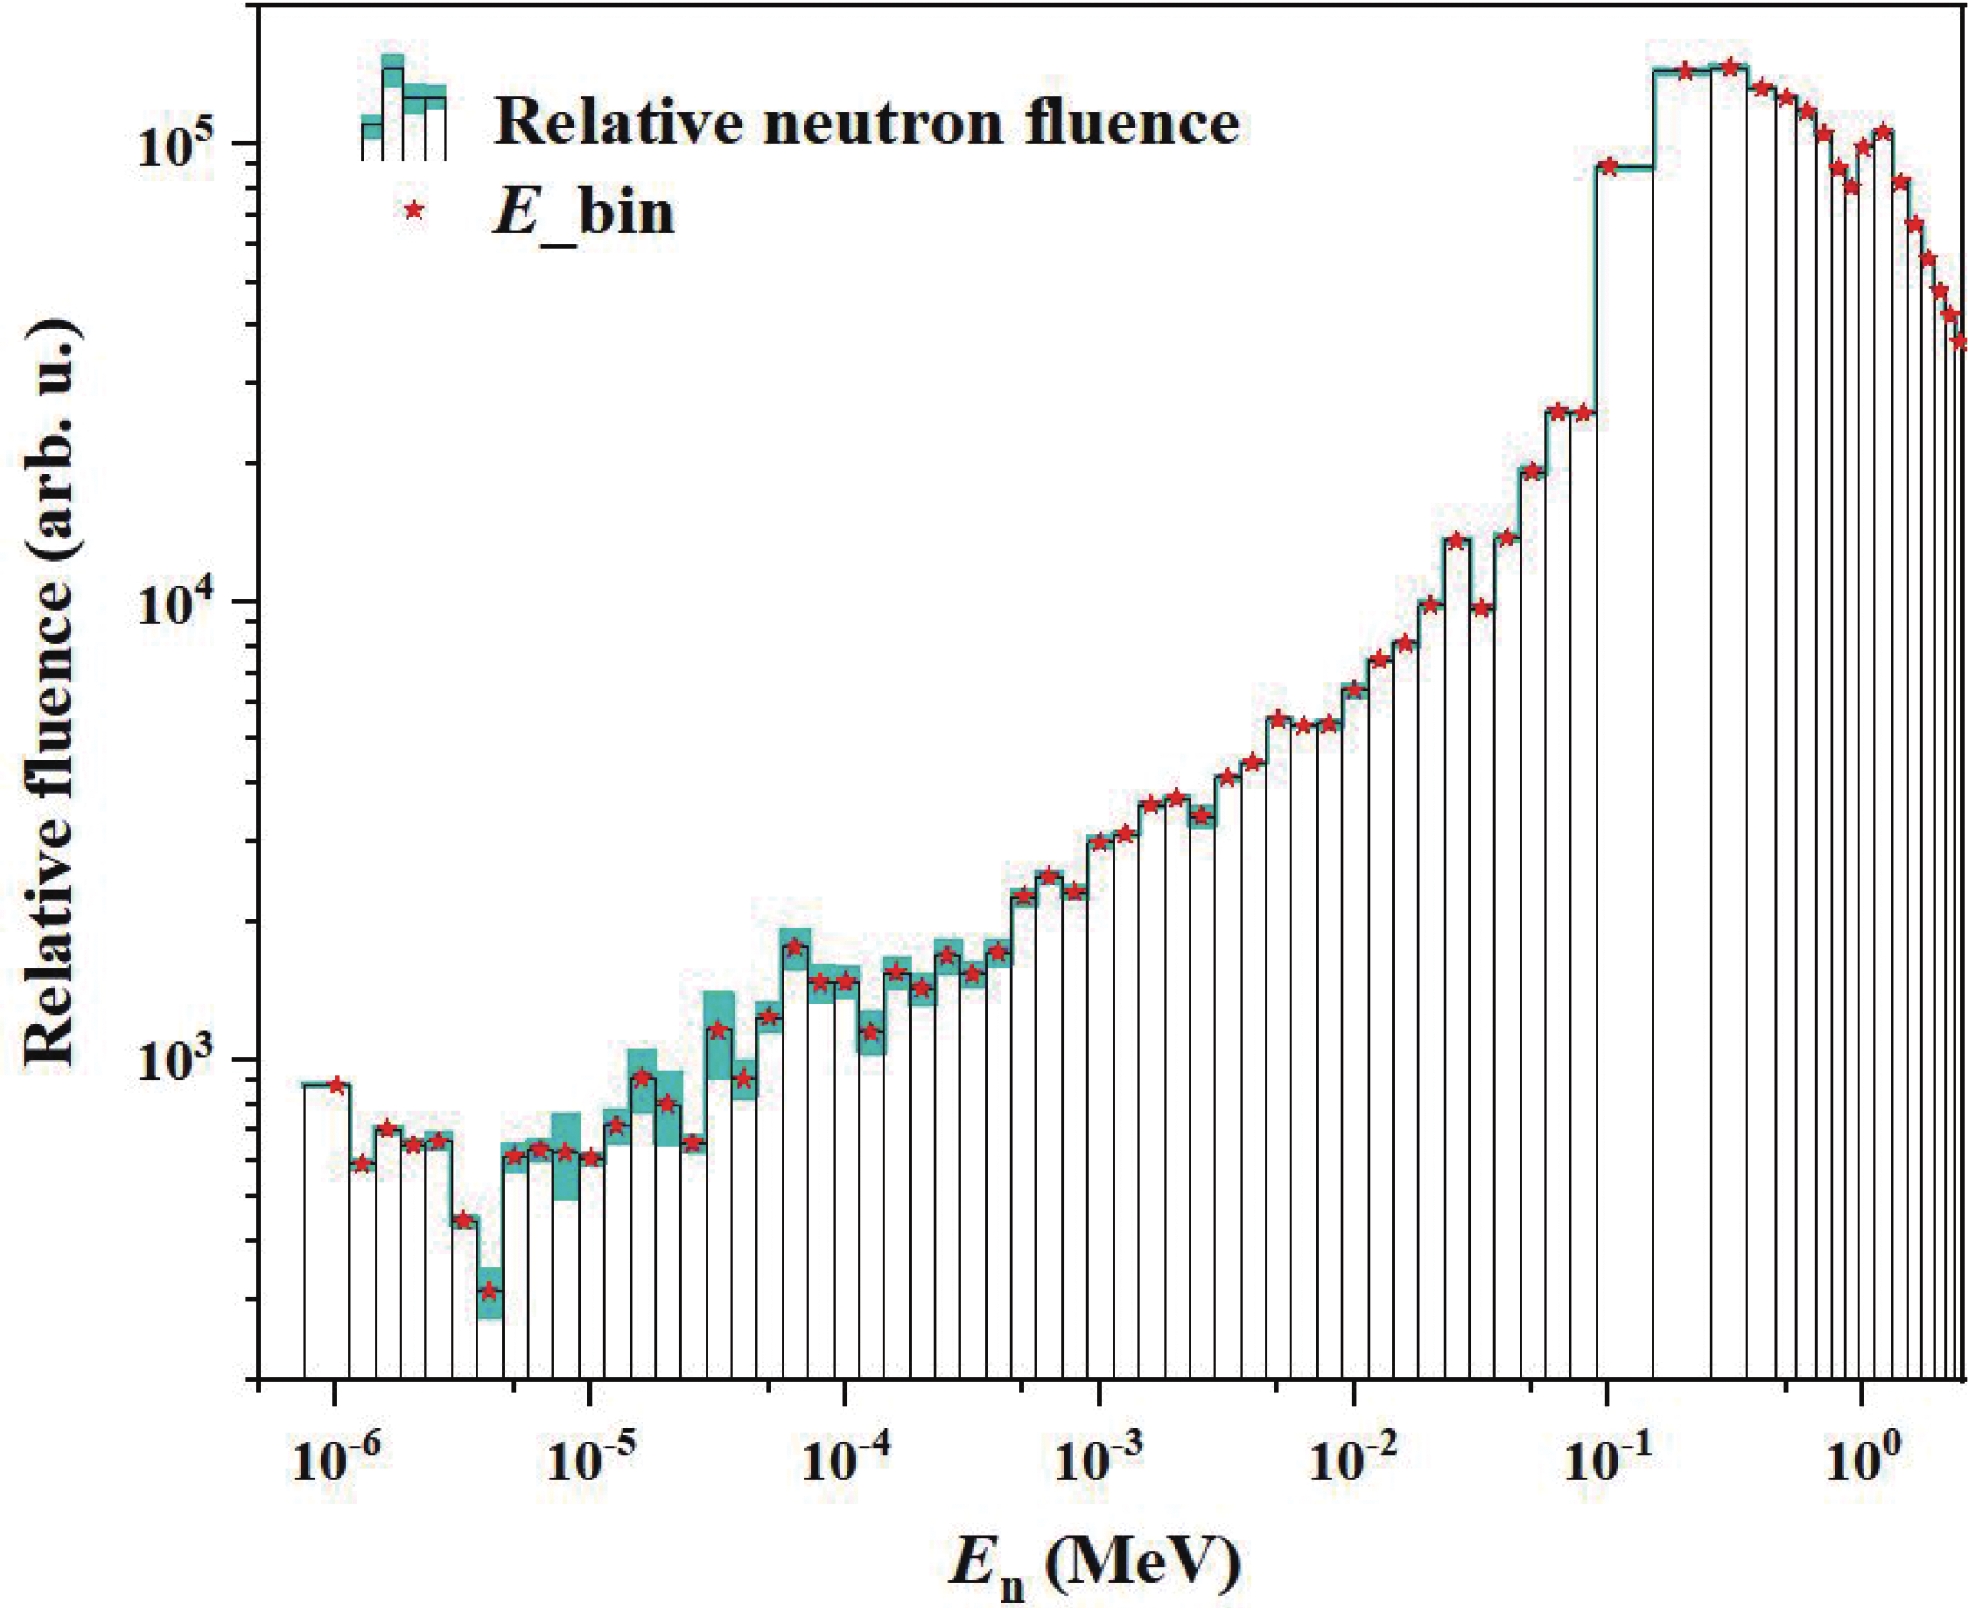
The neutron energy spectrum and the neutron energy bins used in the present work are shown in Fig. 1. The error bar in Fig. 1 represents the uncertainty of relative neutron fluence (
${\varphi _{E\_{\rm{bin}}}}$ ), which is 0.5% - 21.4% (for 49 of the 67 energy points, this uncertainty is less than 5%). Compared with the origin neutron energy spectrum in Ref. [14], the new wider energy bins of the spectrum were defined in the present work. Sixty-seven energy points called E_bin were specified from 1.0 eV to 2.5 MeV, and each E_bin was correlated with a neutron energy bin. The energy points (E_bin) were specified as follows: 49 equally spaced points were defined in the logarithmic coordinate between 1.0 eV and 0.1 MeV, 8 points were defined with equal interval of 0.1 MeV in the linear coordinate between 0.1 MeV and 1.0 MeV. Above 1.0 MeV, the interval was 0.2 MeV up to 2.5 MeV. The neutron energy corresponding to each event was obtained from TOF, then the linearly nearest E_bin was searched, and the event was counted into the corresponding neutron energy bin. -
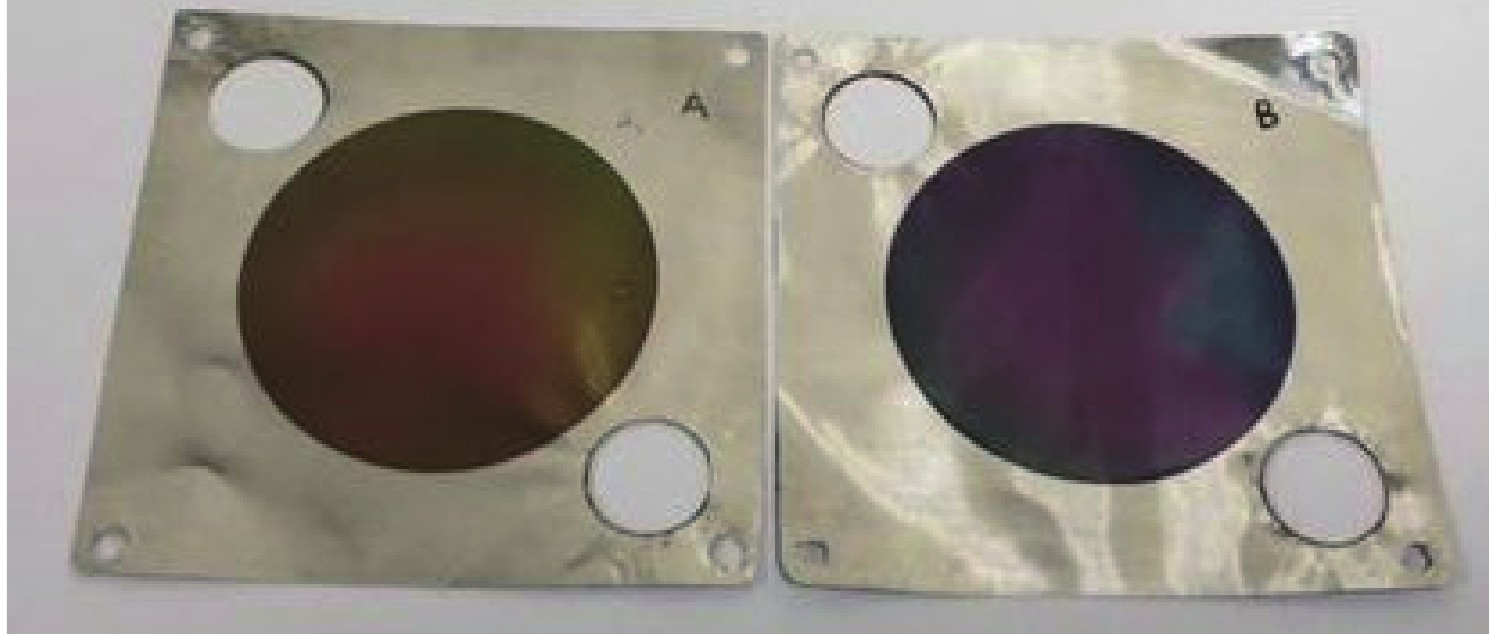
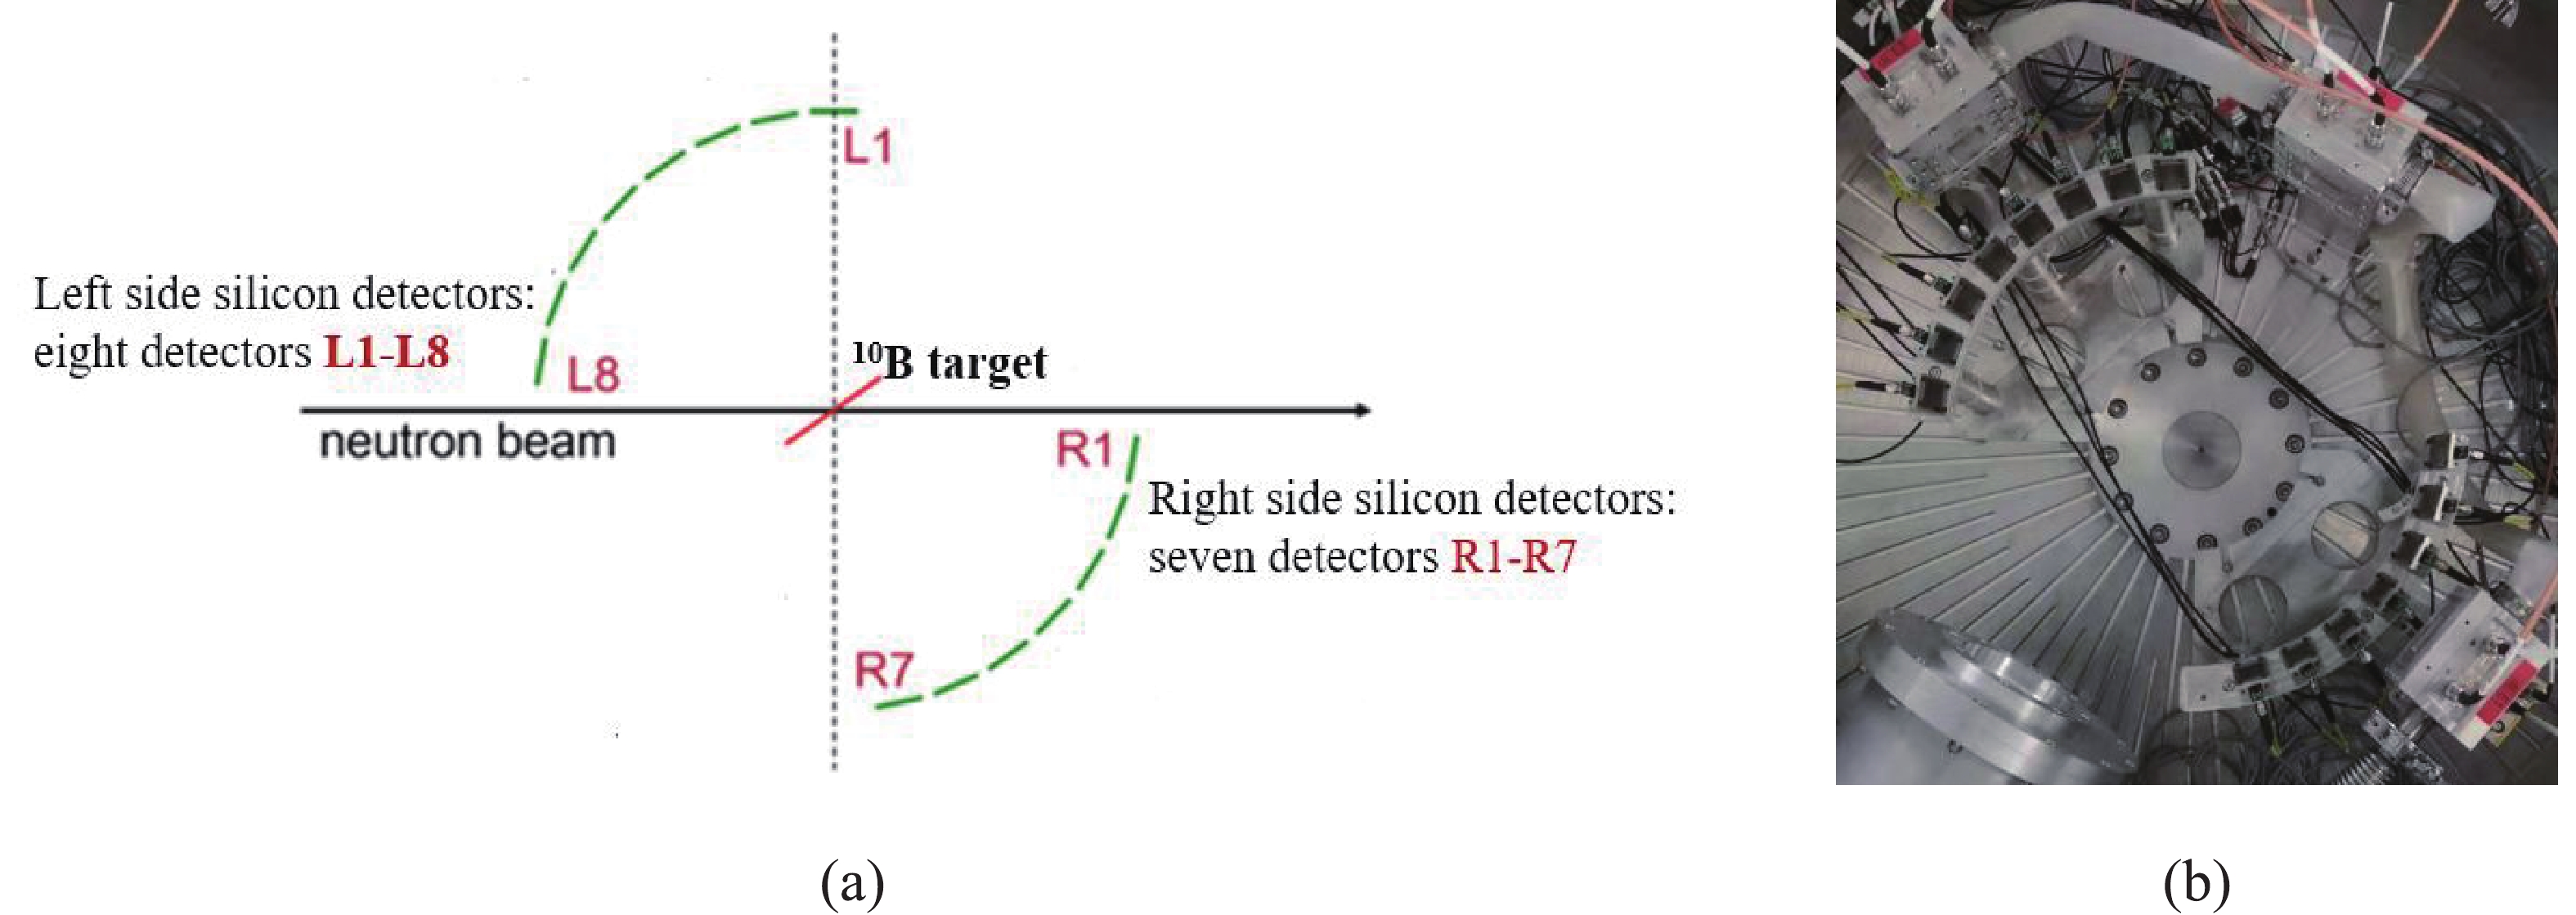
Two enriched (90%) 10B samples were prepared as shown in Fig. 2. Each 10B sample was evaporated on an aluminum sheet 50 μm in thickness. The two samples were 5.0 cm in diameter both, and 82.59 and 85.05 μg/cm2 in thickness, respectively. The two 10B samples were back-to-back mounted at one of the four sample positions of the sample holder as shown in Fig. 3. At other sample positions, two back-to-back 241Am α sources and two aluminum sheets 50 μm each in thickness were mounted. The 241Am α sources were used to calibrate the detectors and the DAQ (Data Acquisition) system, and the aluminum sheets were used for the background measurement. The angle between the normal of the samples and the neutron beam line was 60° as shown in Fig.4 (a) so that the energy loss of α-particles in the samples could be minimized.
-
The charged particles were detected by the LPDA system, which mainly consisted of a silicon detector array and a vacuum chamber as shown in Fig. 4(b). Apart from the silicon detectors, other detectors such as a gridded ionization chamber (GIC) and three ΔE-E detectors were installed and tested. Fifteen rectangular (2.0 cm × 2.5 cm) silicon detectors 500 μm in thickness could cover the emission angle of the particles from 19.2° to 160.8°, and their solid angles were (0.0123 - 0.0125) (±0.3%) sr according to Monte Carlo simulation. The distance between the center of the silicon detector and that of the 10B sample was 20.0 cm. The angle between the normal of the silicon detectors and the horizon was 16° in order to avoid shielding ΔE-E detectors.
-
The DAQ system was designed based on PXIe platform [15]. The sampling rate of the DAQ system was 1 GHz with the resolution of 12 bits. When the signal amplitude exceeded the predefined threshold of the corresponding channel, the full signal waveform with a time window 15 μs would be recorded. In order to obtain the starting time of the signal, the original signal was filtered and differentiated, and the starting time was determined by the position of the one-tenth maximum height of the differentiated signal. The TOF of the neutron could be calculated by
${{\rm TOF}} = {T_{{\rm{event}}}} - {T_0} + \frac{L}{c},$

(1) where
${T_{{\rm{event}}}}$ is the starting time of the event signal,${T_0}$ is the generation moment of the related neutrons determined using the starting time of γ-flash events, L is the length of flight path, c is the velocity of light. The neutron energy distribution due to the double-bunched operation mode will be unfolded as described in Section 3.3. -
In the experiment, the 15 silicon detectors and the DAQ system were firstly calibrated using the 241Am α sources. Then, the events from the 10B samples and the Aluminum backing sheets were measured in turns (~ 16 h for measurement foreground and ~ 8 h measurement for background for each turn). The total beam duration was ~ 357 h.
-
With the recorded signal waveforms and the corresponding TOFs, the En-Amplitude two-dimensional spectrum could be obtained, and the valid area of α events could be determined. Next, the events were counted into the corresponding neutron energy bins as described in Section 2.1, and then the background was subtracted to obtain the net events. After that, the neutron energy distribution caused by the neutron energy bin width and by the double proton bunches, and the spread of the detection angle were unfolded using the iterative method. Next, the relative differential cross sections of the 10B(n, α)7Li reaction were obtained, and then the relative angle-integrated cross sections were calculated via integration. The results were normalized using the standard cross sections of the 10B(n, α)7Li reaction in the 0.3 − 0.5 MeV region. After that, the ratios of the 10B(n, α0)7Li and 10B(n, α1)7Li* reactions was calculated by the unfolded spectrum of net α events, and the differential and angle-integrated cross sections for these two reaction channels were obtained. The process of data analysis is shown in Fig. 5.
-
The measurement data have been sorted into two-dimensional distributions (En-Amplitude) at every detection angle. The amplitude of each event could be obtained from the recorded waveform, and the corresponding En could be calculated from its TOF. An En-Amplitude two-dimensional spectrum is shown in Fig. 6 as an example, in which the areas of α0 and α1 events, as well as the Li and Li* events, and recoil proton events are labeled. From the two-dimensional spectrum, the valid-event-area of α events could be decided. Then, the events in the valid-event-area were projected into their corresponding neutron energy bins which was described in Section 2.1.
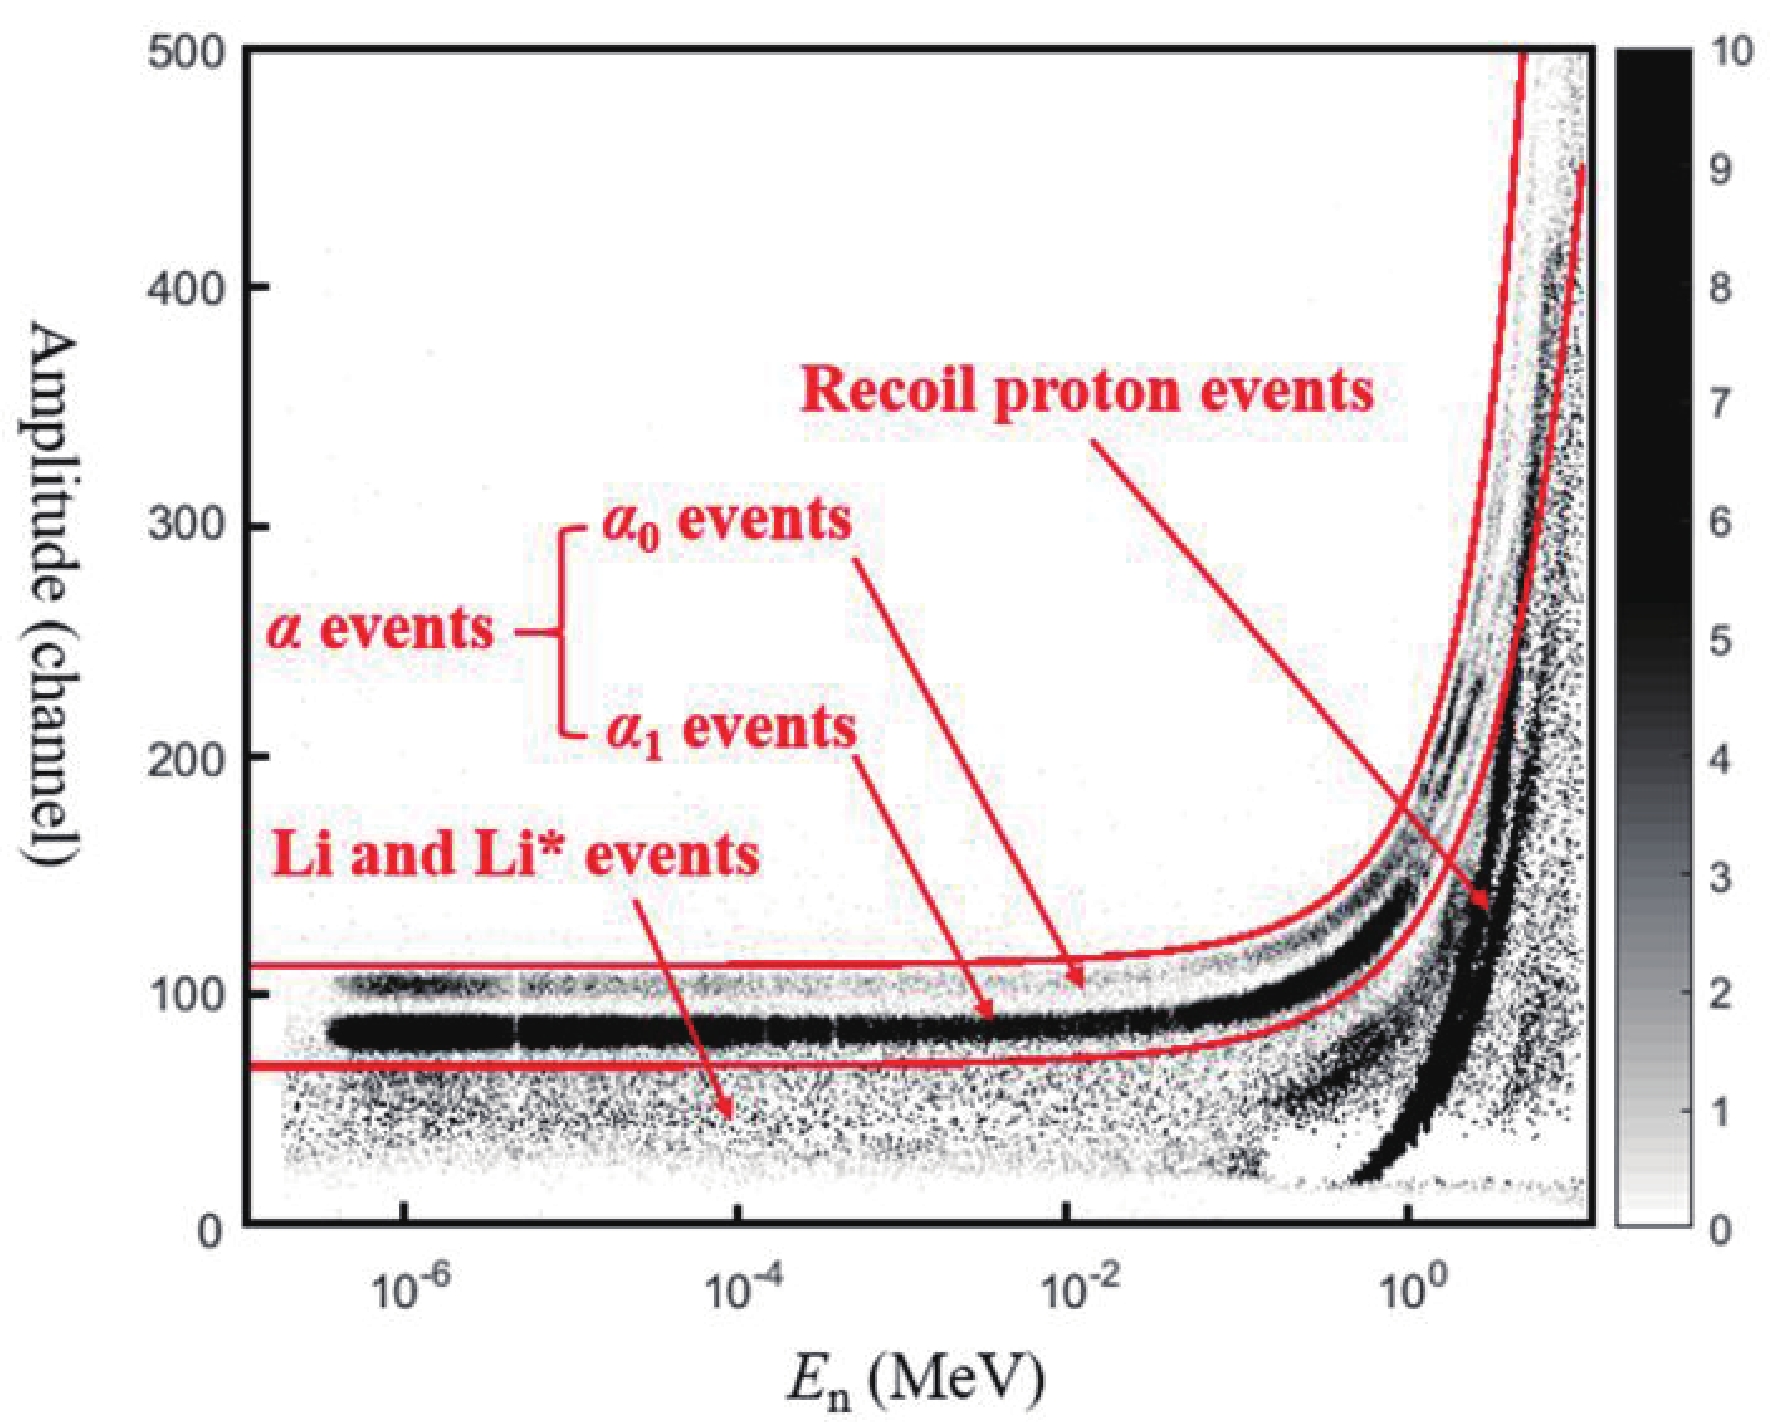
Figure 6. (color online) The En-Amplitude two-dimensional spectrum at the detection angle near 26.9°.
The net events in each energy bin at each detection angle could be obtained after the background subtraction shown in Fig. 7 as an example. The normalization factor was decided by the ratio of the number of the protons in the beam during the foreground measurement over that during the background measurement. Although the background from the sample itself, such as the charge particles from the 11B(n, p) (Q = 0.23 MeV) and 10B(n, t2α) (Q = 0.32 MeV) reactions, could not be subtracted, these interferences can be ignored in En < 1 MeV region because of their fairly small cross sections [2]. In the 1.0 MeV ≤ En < 2.5 MeV region, the valid-event-area could be separated from background area because the charged particles from the background reactions with small Q-values have quite low energies. For En ≥ 2.5 MeV, the energies of the emitted background particles are high enough to interfere with the valid-event-area. Besides, the recoil protons from hydrogen adsorbed in the samples would be another notable source of the background. Therefore only the cross sections of the 10B(n, α)7Li reaction below 2.5 MeV region were obtained in the present measurement.
-
The unfolding is necessary due to the influence of the width of neutron energy bin. Each event was weighted as
${w_{E,\theta }} = \frac{{{\sigma _{{E\_{\rm{bin}}{,\theta }}}}}}{{{\sigma _{{E,\theta }}}}},$

(2) where w is the weight of a single event, E is the energy of the neutron calculated from TOF, θ is the detection angle, E_bin is the linearly nearest neighbor energy point described in Section 2.1, and
$\sigma _{E\_{\rm{bin,}}\theta }^{}$ and${\sigma _{E,\theta }}$ are the 10B(n, α)7Li differential reaction cross sections at the neutron energy of E_bin and E, respectively. The calculations of$\sigma _{E\_{\rm{bin,}}\theta }^{}$ and${\sigma _{E,\theta }}$ will be described in Section 3.6. In the first step of iteration, the weight of every event was set as 1, and the 10B(n, α)7Li reaction cross sections could be calculated. And in all the following steps, the weight of events at every neutron energy bin was calculated by the cross sections obtained from the last step, then the cross sections were recalculated. Through the unfolding, the uncertainty of the neutron energy could be decreased from 4.2% − 50.0% to 0.4% − 17.2%. The uncertainty of the differential cross section introduced from the unfolding of the neutron bin width is 0.1% − 51.1% (for 944 of the 1005$\sigma _{E\_{\rm{bin,}}\theta }^{}$ results, this uncertainty is less than 5%). -
The interval (410 ns) of the double bunched proton beams would lead to fairly big uncertainty of the neutron energy especially in high energy region. For 0.02 MeV ≤ En < 2.5 MeV, the uncertainty of the neutron energy is 1.5% − 17.2% which is not negligible, and the unfolding is thus needed. The details of the unfolding method could be found in Refs. [8] and [16], which will be described briefly here.
At each detection angle, every event was split into two child events and each of them was weighted as
$ \left\{ \begin{array}{l} {w_{{E_{n1}},\theta }} = \displaystyle \frac{{{I_{{E_{n1}}}}\sigma _{{{E_{n1}},\theta }}^{{\rm{last\_itera}}}}}{{{I_{{E_{n1}}}}\sigma _{{{E_{n1}},\theta }}^{{\rm{last\_itera}}} + {I_{{E_{n2}}}}\sigma _{{{E_{n{\rm{2}}}},\theta }}^{{\rm{last\_itera}}}}}\\ {w_{{E_{n2}},\theta }} =\displaystyle \frac{{{I_{{E_{n{\rm{2}}}}}}\sigma _{{{E_{n{\rm{2}}}},\theta }}^{{\rm{last\_itera}}}}}{{{I_{{E_{n1}}}}\sigma _{{{E_{n1}},\theta }}^{{\rm{last\_itera}}} + {I_{{E_{n2}}}}\sigma _{{{E_{n{\rm{2}}}},\theta }}^{{\rm{last\_itera}}}}} \end{array} \right.,$

(3) where the subscripts of
${E_{n{\rm{1}}}}$ and${E_{n{\rm{2}}}}$ are the neutron energies determined by the TOF of the event plus 205 ns and minus 205 ns, respectively.${I_{{E_{n1}}}}$ and${I_{{E_{n1}}}}$ are the unit neutron fluence (i.e. n/ns) (the neutron spectrum is transformed into the number of neutrons per unit time of TOF),$\sigma _{{{E_{n1}},\theta }}^{{\rm{last\_itera}}}$ and$\sigma _{{{E_{n{\rm{2}}}},\theta }}^{{\rm{last\_itera}}}$ are the differential cross sections obtained from the last iteration. Using Eq. (3), the two child events would be counted into related bins, and the new differential cross sections described in Section 3.6 could be obtained. The unfolding could decrease the uncertainty of the neutron energy to 0.4% − 1.5%. However, the unfolding would lead to the uncertainty of the differential cross sections. In the present work, the correction was processed for En ≥ 0.02 MeV and the corresponding uncertainty of$ w_{E\_{\rm{bin,}}\theta} $ introduced from the unfolding of the neutron energy distribution caused by the double-bunched operation mode is 1.2% − 11.9% (for 305 of the 360$\sigma _{E\_{\rm{bin,}}\theta }^{}$ results above 0.02 MeV region, this uncertainty is less than 5%). -
The relative differential cross section
$\sigma _{E\_{\rm{bin,}}\theta }^{\rm re}$ can be obtained using$\sigma _{E\_{\rm{bin,}}\theta }^{\rm re} = \frac{{{W_{E\_{\rm{bin,}}\theta }}}}{{{\varphi _{E\_{\rm{bin}}}}{\Omega _{\theta} }{N_{\rm{B}}}{\varepsilon _{E\_{\rm{bin,}}\theta }}}},$

(4) where
${W_{E\_{\rm{bin,}}\theta }} = \sum\limits_{E \in E\_{\rm{bin}}} {{w_{E\_{\rm{bin,}}\theta }}} $

(5) is the total weight of the net events,
${\varphi _{E\_{\rm{bin}}}}$ is the relative neutron fluence shown in Fig. 1, Ωθ is the detection solid angle of the corresponding silicon detector, NB is the number of the 10B atoms in the sample (the two 10B samples are not the same),${\varepsilon _{E\_{\rm{bin,}}\theta }}$ is the detection efficiency for α-particles (> 97.7 % deduced from the dead time of the DAQ system). Sources of the uncertainty of${W_{E\_{\rm{bin,}}\theta }}$ include the errors of statistics, background subtraction and uncertainty of the valid-event-area determination with the magnitudes of 0.7% − 6.9%, 0.1% − 9.0% and 0.1% − 6.5%, respectively. The uncertainties of Ωθ , and NB are 0.3% and 1.0%, respectively. -
The detection angle of each silicon detector was obtained from the Monte Carlo simulation. In the simulation, the particles were assumed to be emitted isotopically from the random position in the sample and then reached the detector. According to the simulation, the spread of the detection angle for each detector was expected to be 3.8° − 4.0° as shown in Fig. 8, which lead to the uncertainty of the detection angle. The iterative method was used to perform a correction for the spread of the detection angle.
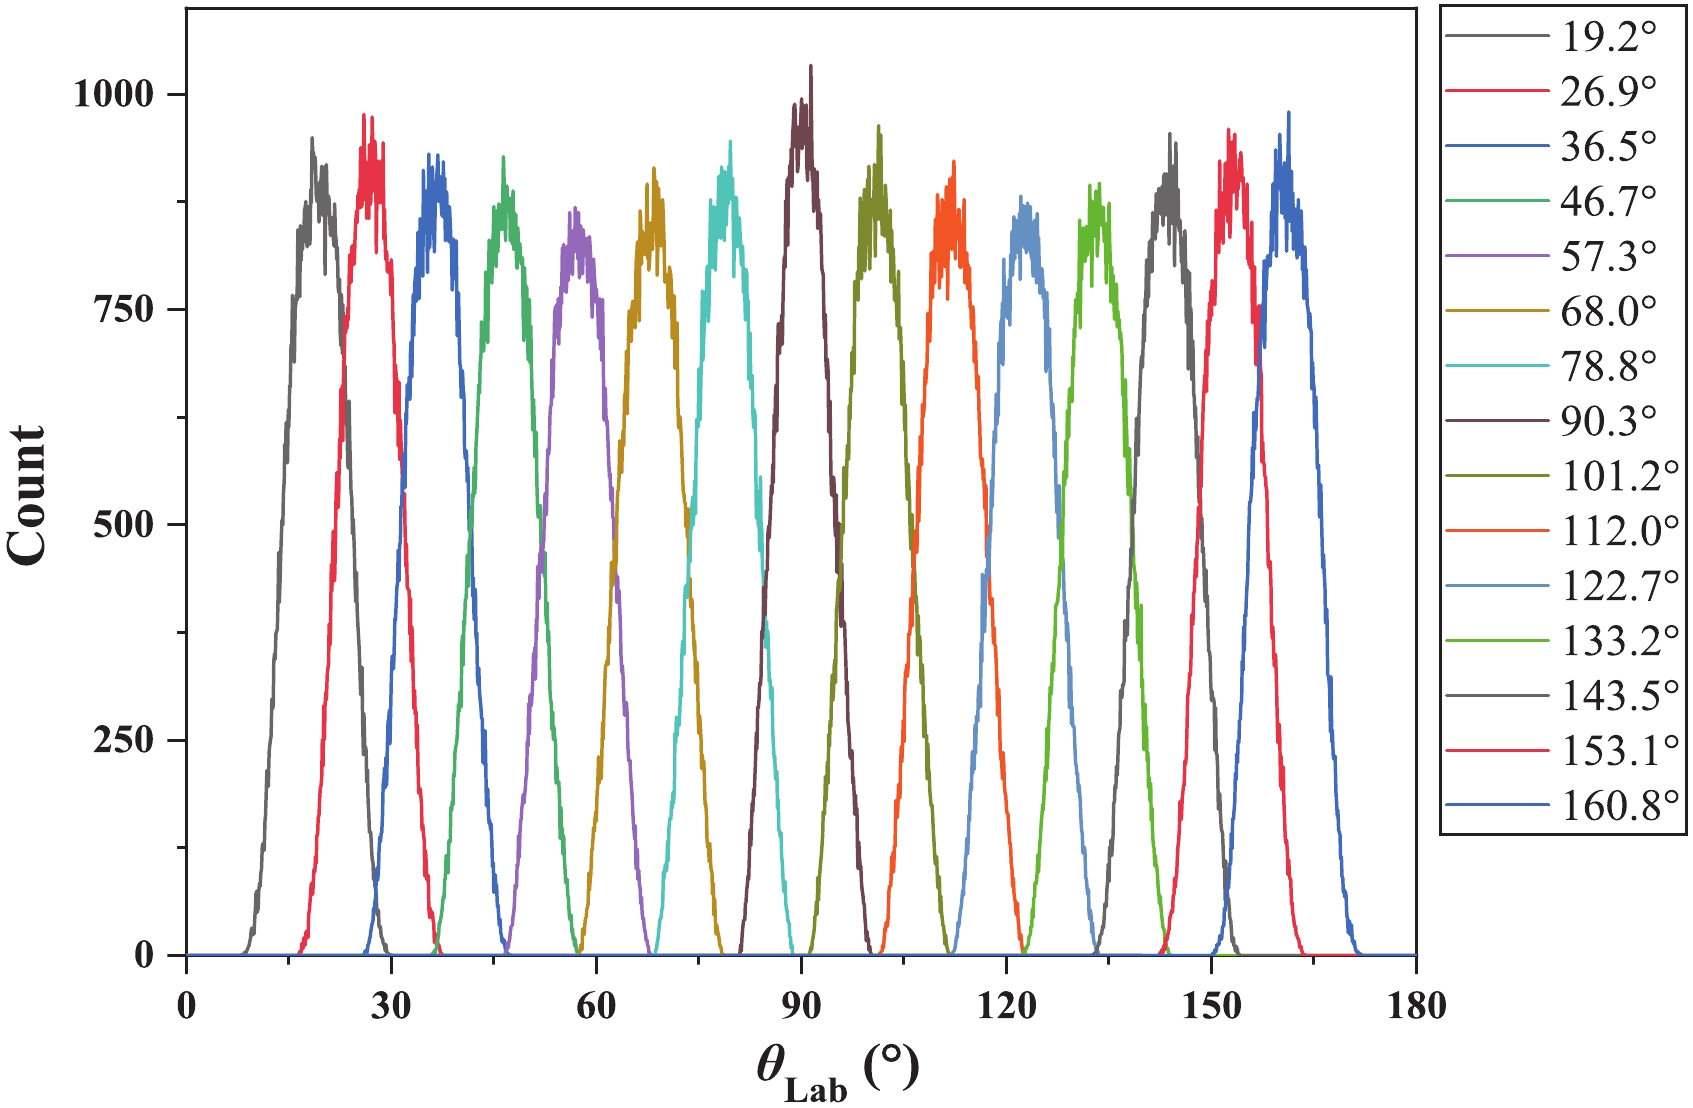
Figure 8. (color online) The simulated distributions of the receiving angles of the silicon detectors.
For each neutron energy bin, the 15 measured
$\sigma _{E\_{\rm{bin,}}\theta }^{\rm re}$ were fitted using the Legendre polynomial series, then the fitting curve were deconvoluted with the simulated distribution shown in Fig. 8. The process of deconvolution and iteration would take the anisotropy into account. After that, the new corrected relative differential cross section$C\_{\sigma} _{E\_{\rm{bin,}}\theta }^{\rm re}$ was obtained. Next, the deconvolution cross section${\rm{cor}}\_{\sigma} _{E\_{\rm{bin,}}\theta }^{\rm re}$ was calculated by${\rm{cor}}\_{\sigma} _{E\_{\rm{bin,}}\theta }^{\rm re} = \sigma _{E\_{\rm{bin,}}\theta }^{\rm re}\frac{{\sigma _{E\_{\rm{bin,}}\theta }^{\rm re}}}{{C\_{\sigma} _{E\_{\rm{bin,}}\theta }^{\rm re}}}.$

(6) This deconvolution process was iterated until the variation of
${\rm{cor}}\_{\sigma} _{E\_{\rm{bin,}}\theta }^{\rm re}$ was less than 0.1% (usually 10 times). This correction could reduce the uncertainty of the detection angles to ~ 0.01°. The uncertainty of the differential cross section introduced from the angle deconvolution is 0.1% − 0.9%. -
It is commonly accepted that the relative differential cross section could be represented by the Legendre polynomial series
$f_{E\_{\rm{bin}}}^{\rm re}(\cos (\theta )) = \sum\limits_{i = 0}^{{M}} {{A_i}} {P_i}(\cos (\theta )),$

(7) where M is the maximum Legendre polynomial order (M = 1 in the 1.0 eV ≤ En < 1.0 keV region, M = 2 in the 1.0 keV ≤ En < 0.1 MeV region, M = 3 in the 0.1 MeV ≤ En < 2.5 MeV region),
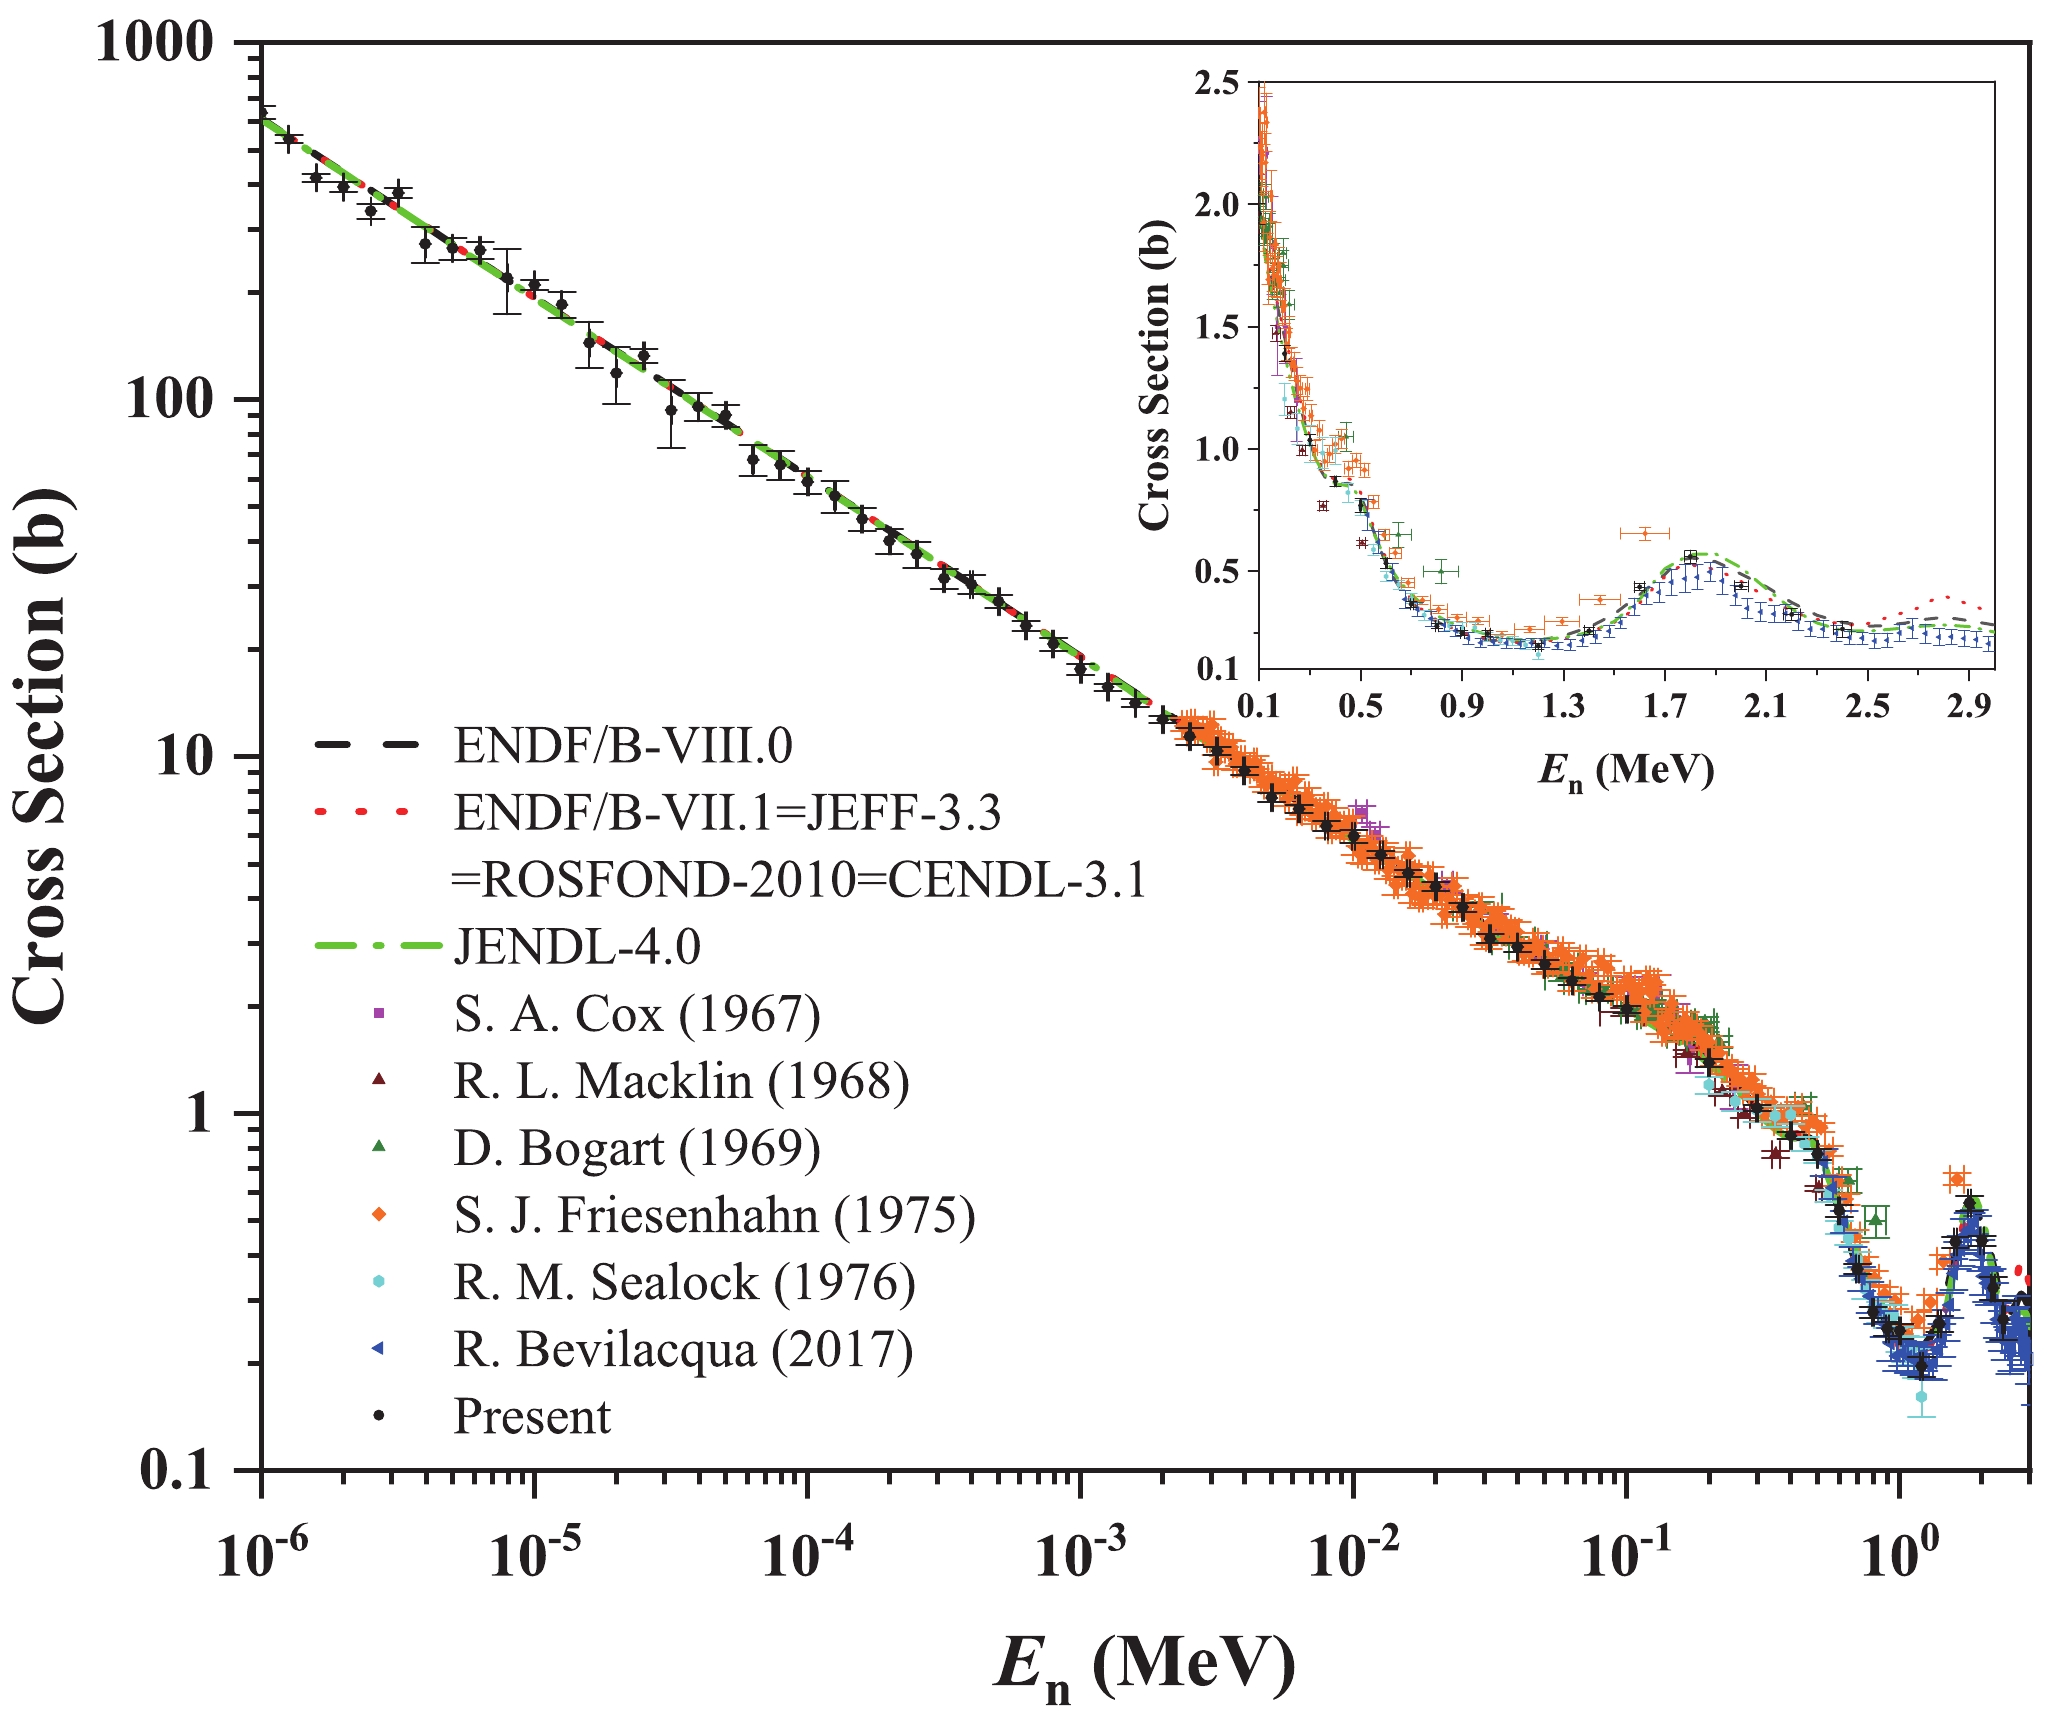
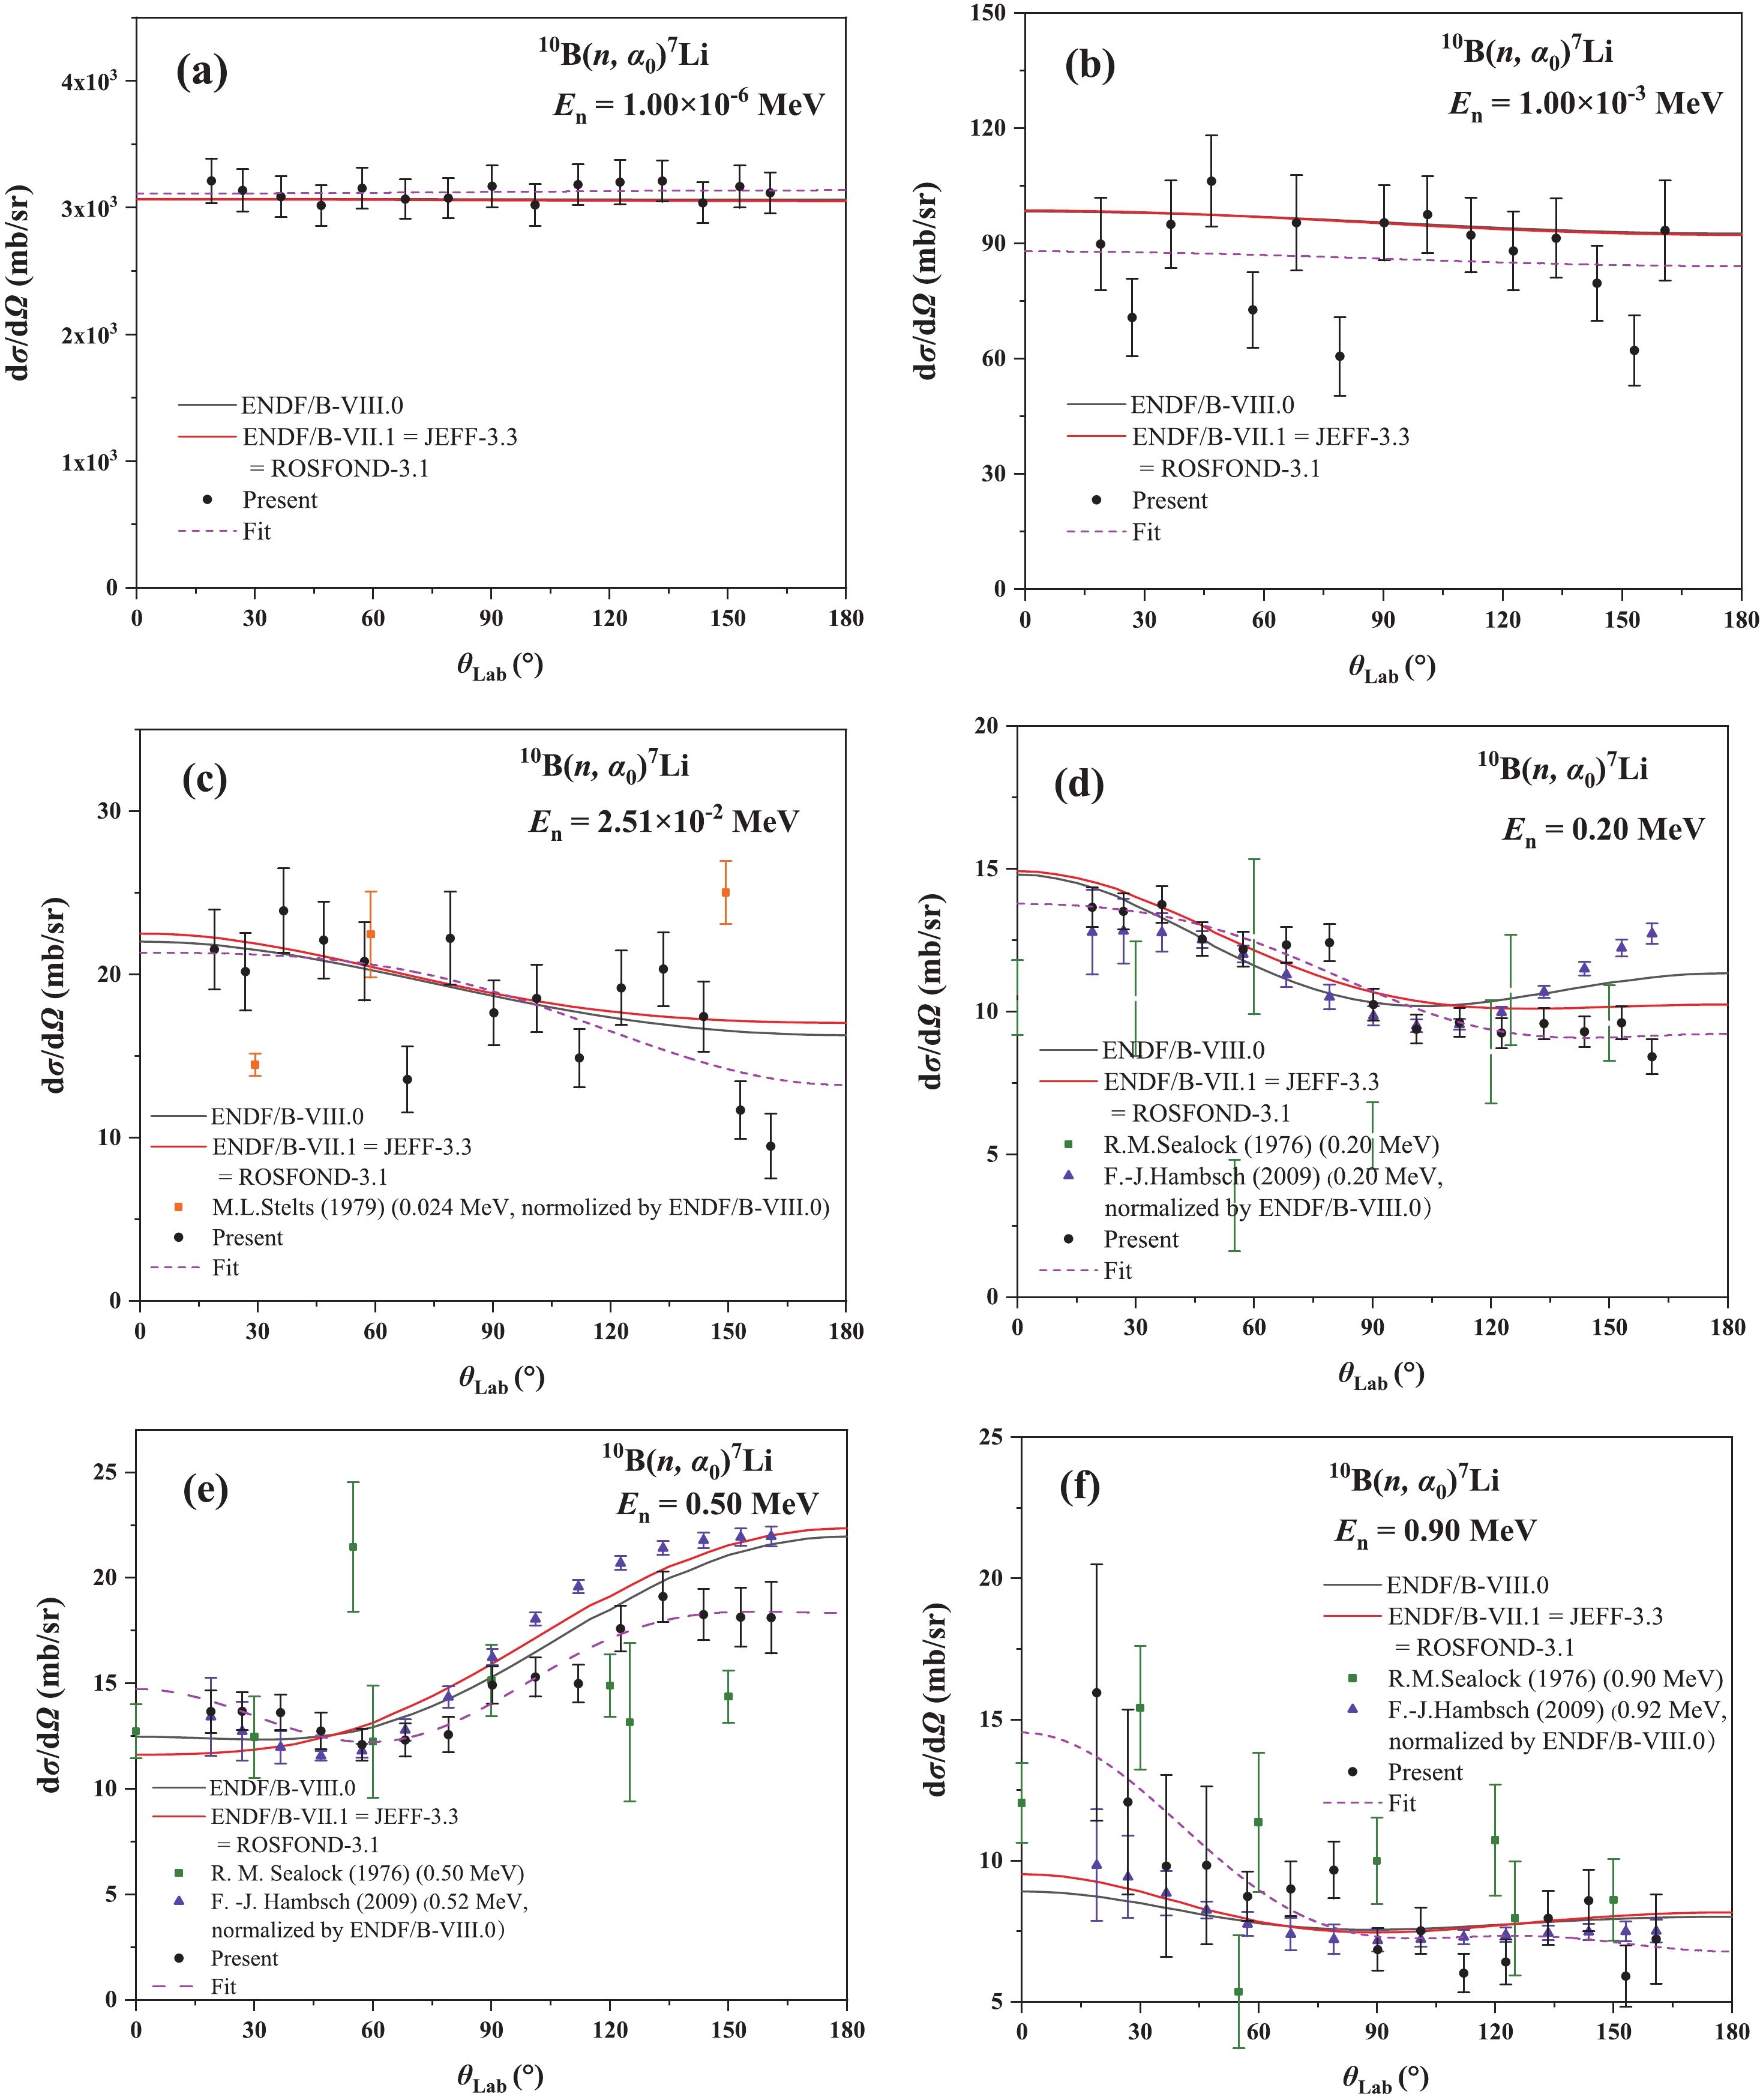
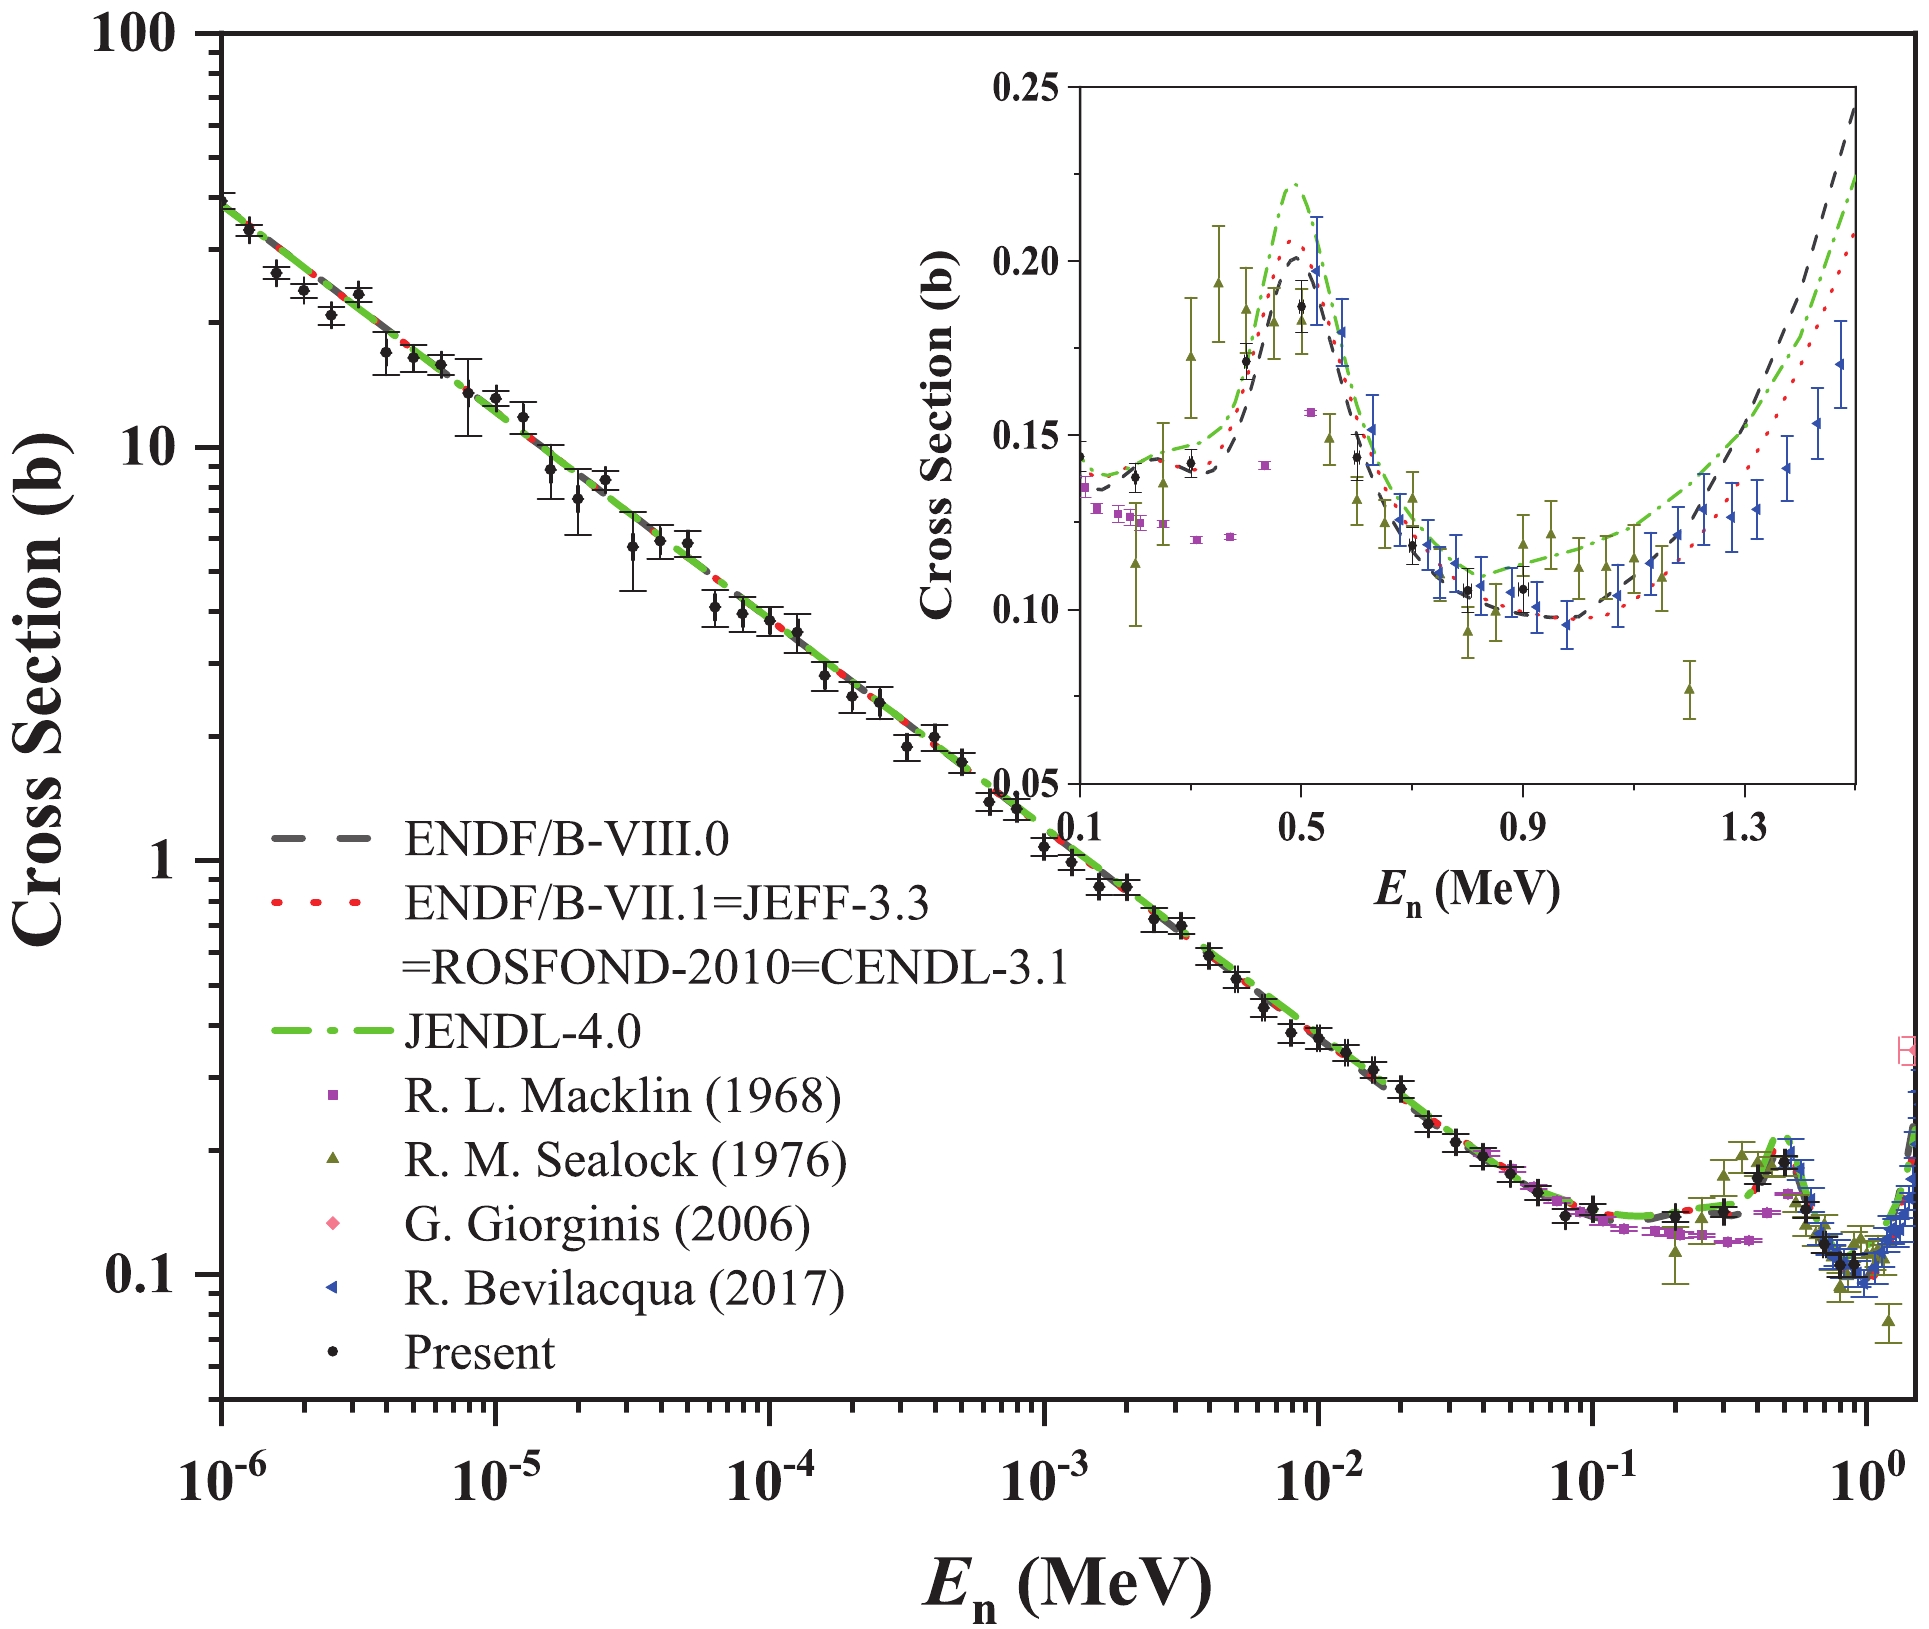
${A_i}$ is the ith coefficient determined by fitting the${\rm{cor}}\_{\sigma} _{E\_{\rm{bin,}}\theta }^{\rm re}$ at each E_bin,${P_i}(\cos (\theta ))$ is the ith-order Legendre polynomial. Then through the integration of$f_{E\_{\rm{bin}}}^{\rm re}$ , the relative angle-integrated cross sections of the 10B(n, α)7Li reaction$\sigma _{E\_{\rm{bin}}}^{\rm re}$ could be obtained, and the uncertainty of the fitting is 0.2% − 9.5%. Since the absolute neutron flux was not measured, the measured cross sections were normalized according to standard cross section$\sigma _{E\_{\rm{bin}}}^{{\rm{standard}}}$ from ENDF/B-VIII.0 in 0.3 − 0.5 MeV region, where the results obtained in the present work have relatively small uncertainties [5]. The uncertainty of normalization is 1.3% deduced from the information of standard library [4, 5]. Then, the cross sections were iterated using the method presented in Sections 3.1 − 3.5 until the variation was less than 1.0% (iterated for 15 times as shown in Fig. 5). Finally, the absolute differential cross section$\sigma _{E\_{\rm{bin,}}\theta }^{}$ and the angle-integrated cross section$\sigma _{E\_{\rm{bin}}}^{}$ of the 10B(n, α)7Li reaction can be obtained. The total uncertainty of the differential cross section$\sigma _{E\_{\rm{bin,}}\theta }^{}$ is 2.6% − 53.0% (for 868 of the 1005$\sigma _{E\_{\rm{bin,}}\theta }^{}$ results, this uncertainty is less than 10%), and those of the angle-integrated cross section$\sigma _{E\_{\rm{bin}}}^{}$ is 2.1% − 21.5% (for 43 of the 67$\sigma _{E\_{\rm{bin}}}^{}$ results, this uncertainty is less than 5%). Sources of uncertainty and their magnitudes were shown in Table 1. The uncertainty of the 10B(n, α)7Li reaction is fairly big around En = 1.0 MeV due to few counts of α events near the valley in the excitation function. The results are presented in Tables A1-A3 of Appendix A. Selected results of differential cross sections are shown in Fig. 9, and those of angle-integrated cross sections are shown in Fig. 10. The variation trend of the differential cross sections will be discussed in Section 5.sources of uncertainty magnitude (%) differential cross sections angle-integrated cross sections relative neutron fluence ( ${\varphi _{E\_{\rm{bin}}}}$ )

0.5 − 21.4a, 0.6 − 1.9b, 0.7 − 0.8c 0.5 −21.4a, 0.6 − 1.9b, 0.7 − 0.8c unfolding of the neutron energy bin width ( ${w_{E\_{\rm{bin,}}\theta }}$ )

0.1 − 4.2a, 0.1 − 7.8b, 0.3 − 51.1c 0.1 − 3.8a, 0.1 − 3.4b, 0.9 − 7.4c unfolding of the expanding of neutron energy due to the double-bunched operation mode ( ${w_{E\_{\rm{bin,}}\theta }}$ )

1.2 − 10.9b, 2.9 − 11.9c 0.4 − 1.3b, 1.0 − 1.6c uncertainty of neutron energy (E_bin, lateral error) 0.4 − 1.4a, 0.6 − 1.0b, 1.0 − 1.5c 0.4 − 1.4a, 0.6 − 1.0b, 1.0 − 1.5c statistical error of the valid α events ( ${W_{E\_{\rm{bin,}}\theta }}$ )

0.7 − 3.1a, 1.0 − 5.6b, 2.6 − 6.9c 0.2 − 0.8a, 0.3 − 1.0b, 0.8 − 1.5c background subtraction ( ${W_{E\_{\rm{bin,}}\theta }}$ )

0.1 − 3.4a, 0.1 − 9.0b, 0.1 − 8.7c < 0.6a, < 0.7b, < 0.7c determination the valid-even-area ( ${W_{E\_{\rm{bin,}}\theta }}$ )

0.1 − 3.8a, 0.3 − 6.5b, 0.4 − 4.4c < 0.4a, < 0.3b, < 0.2c detection solid angle (Ωθ) 0.3 0.3 number of the 10B atoms (NB) 1.0 1.0 deconvolution of the spread of the detection angle ( ${\rm{cor}}\_{\sigma} _{E\_{\rm{bin,}}\theta }^{\rm re}$ )

< 1.0 < 0.1 fitting using the Legendre polynomial series ( $f_{E\_{\rm{bin}}}^{\rm re}$ )

− 0.2 − 1.6a, 0.6 − 2.0b, 1.8 − 9.5c normalization using the standard library ( $\sigma _{E\_{\rm{bin}}}^{{\rm{standard}}}$ )

1.3 1.3 ratios of the 10B(n, α0)7Li reaction ( $R_{{{{E\_{\rm{bin}}{,\theta }}}}}^0$ )

2.9 − 25.8a, 3.6 − 36.4b 1.7 − 4.3a, 1.9 − 4.6b ratios of the 10B(n, α1)7Li reaction ( $R_{{{{E\_{\rm{bin}}{,\theta }}}}}^{\rm{1}}$ )

1.0 − 6.6a, 1.7 − 21.6b 0.4 − 2.0a, 0.9 − 4.3b total uncertainty of the 10B(n, α)7Li reaction ( $\sigma _{E\_{\rm{bin,}}\theta }^{}$ and

${\sigma _{E\_{\rm{bin}}}}$ )

2.8 − 21.6a, 2.6 − 17.3b, 4.5 − 53.0c 2.2 − 21.5a, 2.1 − 4.4b, 3.1 − 12.4c total uncertainty of the 10B(n, α0)7Li reaction ( $\sigma _{{{{E\_{\rm{bin}}{,\theta }}}}}^0$ and

$\sigma _{{E\_{\rm{bin}}}}^0$ )

4.7 − 26.3a, 4.7 − 36.7b 3.2 − 21.6a, 2.8 − 6.3b total uncertainty of the 10B(n, α1)7Li reaction ( $\sigma _{{{{E\_{\rm{bin}}{,\theta }}}}}^{\rm{1}}$ and

$\sigma _{{E\_{\rm{bin}}}}^{\rm{1}}$ )

3.1 − 21.8a, 3.3 − 27.7b 2.5 − 21.5a, 2.3 − 5.7b a: Uncertainties for 1.0 eV ≤ En < 0.02 MeV.
b: Uncertainties for 0.02 MeV ≤ En < 1.0 MeV.
c: Uncertainties for 1.0 MeV ≤ En < 2.5 MeV.Table 1. Sources of uncertainty and their magnitudes.
En /MeV $\sigma _{E\_{\rm{bin,}}\theta }^{}$ /(mb/sr)

19.2° 26.9° 36.5° 46.7° 57.3° 68.0° 1.00×10⁻⁶±4.2×10⁻⁹ 4.99×10⁴±2.1×10³ 5.00×10⁴±2.2×10³ 5.05×10⁴±2.2×10³ 4.96×10⁴±2.2×10³ 5.06×10⁴±2.1×10³ 5.00×10⁴±2.0×10³ 1.26×10⁻⁶±5.4×10⁻⁹ 4.13×10⁴±1.2×10³ 4.18×10⁴±1.2×10³ 4.22×10⁴±1.2×10³ 4.22×10⁴±1.2×10³ 4.24×10⁴±1.2×10³ 4.16×10⁴±1.2×10³ 1.58×10⁻⁶±6.8×10⁻⁹ 3.30×10⁴±9.7×10² 3.24×10⁴±9.4×10² 3.27×10⁴±9.4×10² 3.27×10⁴±9.5×10² 3.29×10⁴±9.5×10² 3.29×10⁴±9.5×10² 2.00×10⁻⁶±8.7×10⁻⁹ 3.07×10⁴±1.0×10³ 3.10×10⁴±1.0×10³ 3.08×10⁴±1.0×10³ 3.06×10⁴±1.0×10³ 3.13×10⁴±1.0×10³ 3.13×10⁴±1.0×10³ 2.51×10⁻⁶±1.1×10⁻⁸ 2.64×10⁴±1.2×10³ 2.65×10⁴±1.2×10³ 2.63×10⁴±1.2×10³ 2.67×10⁴±1.2×10³ 2.61×10⁴±1.2×10³ 2.61×10⁴±1.2×10³ 3.16×10⁻⁶±1.4×10⁻⁸ 2.94×10⁴±1.1×10³ 2.96×10⁴±1.1×10³ 2.92×10⁴±1.1×10³ 3.04×10⁴±1.1×10³ 2.98×10⁴±1.1×10³ 3.01×10⁴±1.1×10³ 3.98×10⁻⁶±1.8×10⁻⁸ 2.09×10⁴±2.5×10³ 2.16×10⁴±2.5×10³ 2.12×10⁴±2.5×10³ 2.13×10⁴±2.5×10³ 2.14×10⁴±2.5×10³ 2.09×10⁴±2.5×10³ 5.01×10⁻⁶±2.3×10⁻⁸ 2.07×10⁴±1.5×10³ 2.07×10⁴±1.5×10³ 2.06×10⁴±1.5×10³ 2.12×10⁴±1.6×10³ 2.07×10⁴±1.5×10³ 2.13×10⁴±1.6×10³ 6.31×10⁻⁶±2.9×10⁻⁸ 2.03×10⁴±1.1×10³ 2.11×10⁴±1.1×10³ 2.03×10⁴±1.1×10³ 2.03×10⁴±1.1×10³ 2.07×10⁴±1.1×10³ 2.05×10⁴±1.1×10³ 7.94×10⁻⁶±3.7×10⁻⁸ 1.70×10⁴±3.5×10³ 1.69×10⁴±3.5×10³ 1.70×10⁴±3.6×10³ 1.73×10⁴±3.6×10³ 1.75×10⁴±3.7×10³ 1.75×10⁴±3.7×10³ 1.00×10⁻⁵±4.7×10⁻⁸ 1.68×10⁴±6.5×10² 1.61×10⁴±6.3×10² 1.66×10⁴±6.4×10² 1.64×10⁴±6.3×10² 1.62×10⁴±6.3×10² 1.65×10⁴±6.4×10² 1.26×10⁻⁵±6.4×10⁻⁸ 1.45×10⁴±1.3×10³ 1.50×10⁴±1.3×10³ 1.44×10⁴±1.3×10³ 1.44×10⁴±1.3×10³ 1.45×10⁴±1.3×10³ 1.45×10⁴±1.3×10³ 1.58×10⁻⁵±8.6×10⁻⁸ 1.11×10⁴±1.7×10³ 1.14×10⁴±1.7×10³ 1.12×10⁴±1.7×10³ 1.13×10⁴±1.7×10³ 1.16×10⁴±1.7×10³ 1.12×10⁴±1.7×10³ 2.00×10⁻⁵±1.2×10⁻⁷ 9.50×10³±1.7×10³ 9.39×10³±1.7×10³ 9.45×10³±1.7×10³ 9.42×10³±1.7×10³ 9.46×10³±1.7×10³ 9.19×10³±1.7×10³ 2.51×10⁻⁵±1.6×10⁻⁷ 1.04×10⁴±5.1×10² 1.03×10⁴±5.1×10² 1.07×10⁴±5.2×10² 1.05×10⁴±5.1×10² 1.02×10⁴±5.0×10² 1.03×10⁴±5.1×10² 3.16×10⁻⁵±2.1×10⁻⁷ 7.29×10³±1.6×10³ 7.35×10³±1.6×10³ 7.40×10³±1.6×10³ 7.53×10³±1.6×10³ 7.49×10³±1.6×10³ 7.19×10³±1.6×10³ 3.98×10⁻⁵±2.7×10⁻⁷ 7.73×10³±7.1×10² 7.36×10³±6.7×10² 7.55×10³±6.9×10² 7.45×10³±6.8×10² 7.60×10³±6.9×10² 7.49×10³±6.8×10² 5.01×10⁻⁵±3.6×10⁻⁷ 7.24×10³±5.2×10² 7.22×10³±5.2×10² 7.00×10³±5.0×10² 6.92×10³±5.0×10² 7.25×10³±5.2×10² 7.07×10³±5.1×10² 6.31×10⁻⁵±4.8×10⁻⁷ 5.40×10³±5.4×10² 5.42×10³±5.4×10² 5.37×10³±5.4×10² 5.34×10³±5.3×10² 5.37×10³±5.4×10² 5.08×10³±5.1×10² 7.94×10⁻⁵±6.4×10⁻⁷ 5.40×10³±5.1×10² 5.24×10³±5.0×10² 5.16×10³±4.9×10² 5.18×10³±4.9×10² 5.00×10³±4.8×10² 5.10×10³±4.9×10² 1.00×10⁻⁴±8.4×10⁻⁷ 4.76×10³±3.7×10² 4.78×10³±3.7×10² 4.62×10³±3.6×10² 4.80×10³±3.7×10² 4.74×10³±3.7×10² 4.55×10³±3.5×10² 1.26×10⁻⁴±1.0×10⁻⁶ 4.48×10³±4.7×10² 4.00×10³±4.3×10² 4.23×10³±4.4×10² 4.32×10³±4.5×10² 4.41×10³±4.6×10² 4.13×10³±4.3×10² 1.58×10⁻⁴±1.3×10⁻⁶ 3.72×10³±2.9×10² 3.72×10³±2.9×10² 3.57×10³±2.8×10² 3.62×10³±2.8×10² 3.86×10³±3.0×10² 3.61×10³±2.8×10² 2.00×10⁻⁴±1.6×10⁻⁶ 3.37×10³±2.8×10² 3.07×10³±2.6×10² 3.08×10³±2.6×10² 3.15×10³±2.6×10² 3.14×10³±2.6×10² 3.04×10³±2.5×10² 2.51×10⁻⁴±2.0×10⁻⁶ 3.08×10³±2.7×10² 2.87×10³±2.5×10² 2.91×10³±2.5×10² 2.93×10³±2.5×10² 2.85×10³±2.5×10² 2.86×10³±2.5×10² 3.16×10⁻⁴±2.5×10⁻⁶ 2.78×10³±1.9×10² 2.41×10³±1.7×10² 2.47×10³±1.7×10² 2.29×10³±1.6×10² 2.55×10³±1.7×10² 2.36×10³±1.6×10² 3.98×10⁻⁴±3.1×10⁻⁶ 2.63×10³±1.8×10² 2.49×10³±1.7×10² 2.28×10³±1.6×10² 2.40×10³±1.6×10² 2.40×10³±1.7×10² 2.27×10³±1.6×10² 5.01×10⁻⁴±3.9×10⁻⁶ 2.28×10³±1.2×10² 2.04×10³±1.1×10² 2.04×10³±1.0×10² 2.30×10³±1.1×10² 2.19×10³±1.1×10² 2.10×10³±1.1×10² 6.31×10⁻⁴±4.8×10⁻⁶ 1.98×10³±8.4×101 1.74×10³±7.7×101 1.87×10³±8.1×101 1.81×10³±7.8×101 1.89×10³±8.2×101 1.73×10³±7.9×101 7.94×10⁻⁴±6.1×10⁻⁶ 1.79×10³±9.4×101 1.62×10³±8.8×101 1.67×10³±8.6×101 1.64×10³±8.2×101 1.60×10³±8.9×101 1.62×10³±8.4×101 1.00×10⁻³±7.7×10⁻⁶ 1.40×10³±6.4×101 1.40×10³±6.2×101 1.42×10³±6.1×101 1.49×10³±6.3×101 1.38×10³±6.0×101 1.25×10³±5.7×101 1.26×10⁻³±9.8×10⁻⁶ 1.24×10³±4.8×101 1.19×10³±4.6×101 1.20×10³±4.3×101 1.32×10³±4.4×101 1.24×10³±4.4×101 1.13×10³±4.6×101 1.58×10⁻³±1.3×10⁻⁵ 1.17×10³±4.3×101 1.08×10³±5.0×101 1.18×10³±4.0×101 1.11×10³±4.0×101 1.13×10³±4.0×101 1.08×10³±4.2×101 2.00×10⁻³±1.6×10⁻⁵ 1.06×10³±3.9×101 1.04×10³±3.8×101 1.03×10³±3.6×101 1.03×10³±3.6×101 1.04×10³±3.6×101 9.41×10²±4.0×101 2.51×10⁻³±2.1×10⁻⁵ 8.72×10²±5.7×101 8.82×10²±5.5×101 9.22×10²±5.6×101 9.55×10²±5.8×101 9.03×10²±5.8×101 7.98×10²±5.5×101 3.16×10⁻³±2.7×10⁻⁵ 8.74×10²±3.6×101 8.29×10²±3.3×101 7.96×10²±3.0×101 8.36×10²±3.1×101 7.91×10²±3.0×101 7.39×10²±3.5×101 3.98×10⁻³±3.6×10⁻⁵ 7.05×10²±3.1×101 7.71×10²±3.3×101 7.62×10²±2.8×101 7.54×10²±2.7×101 7.60×10²±2.8×101 6.85×10²±3.0×101 5.01×10⁻³±4.8×10⁻⁵ 5.90×10²±2.5×101 6.07×10²±2.5×101 6.39×10²±2.4×101 6.32×10²±2.3×101 6.21×10²±2.4×101 5.44×10²±2.5×101 6.31×10⁻³±6.4×10⁻⁵ 6.05×10²±2.5×101 5.94×10²±2.4×101 5.63×10²±2.3×101 5.91×10²±2.2×101 5.66×10²±2.2×101 5.53×10²±2.3×101 7.94×10⁻³±8.6×10⁻⁵ 5.11×10²±2.7×101 5.40×10²±2.5×101 5.06×10²±2.4×101 5.35×10²±2.3×101 5.29×10²±2.4×101 4.81×10²±2.4×101 Continued on next page Table A1. The differential cross sections of the 10B(n, α)7Li reaction in the laboratory reference system.
En/MeV $\sigma _{E\_{\rm{bin,}}\theta }^{}$ /(mb/sr)

$\sigma _{E\_{\rm{bin}}}^{}$ /mb

133.2° 143.5° 153.1° 160.8° 1.00×10⁻⁶±4.2×10⁻⁹ 5.16×10⁴±2.1×10³ 5.16×10⁴±2.2×10³ 5.11×10⁴±2.2×10³ 5.12×10⁴±2.1×10³ 6.38×10⁵±2.7×10⁴ 1.26×10⁻⁶±5.4×10⁻⁹ 4.36×10⁴±1.2×10³ 4.29×10⁴±1.2×10³ 4.34×10⁴±1.2×10³ 4.30×10⁴±1.2×10³ 5.37×10⁵±1.4×10⁴ 1.58×10⁻⁶±6.8×10⁻⁹ 3.42×10⁴±9.9×10² 3.33×10⁴±9.7×10² 3.35×10⁴±9.9×10² 3.39×10⁴±1.0×10³ 4.19×10⁵±1.1×10⁴ 2.00×10⁻⁶±8.7×10⁻⁹ 3.24×10⁴±1.1×10³ 3.21×10⁴±1.1×10³ 3.18×10⁴±1.0×10³ 3.17×10⁴±1.1×10³ 3.95×10⁵±1.2×10⁴ 2.51×10⁻⁶±1.1×10⁻⁸ 2.73×10⁴±1.3×10³ 2.68×10⁴±1.3×10³ 2.71×10⁴±1.3×10³ 2.71×10⁴±1.3×10³ 3.37×10⁵±1.5×10⁴ 3.16×10⁻⁶±1.4×10⁻⁸ 3.10×10⁴±1.1×10³ 3.07×10⁴±1.1×10³ 3.04×10⁴±1.1×10³ 2.96×10⁴±1.1×10³ 3.80×10⁵±1.3×10⁴ 3.98×10⁻⁶±1.8×10⁻⁸ 2.16×10⁴±2.6×10³ 2.26×10⁴±2.7×10³ 2.21×10⁴±2.6×10³ 2.21×10⁴±2.6×10³ 2.73×10⁵±3.2×10⁴ 5.01×10⁻⁶±2.3×10⁻⁸ 2.12×10⁴±1.6×10³ 2.15×10⁴±1.6×10³ 2.21×10⁴±1.6×10³ 2.11×10⁴±1.6×10³ 2.65×10⁵±1.9×10⁴ 6.31×10⁻⁶±2.9×10⁻⁸ 2.11×10⁴±1.1×10³ 2.11×10⁴±1.1×10³ 2.08×10⁴±1.1×10³ 2.09×10⁴±1.1×10³ 2.62×10⁵±1.4×10⁴ 7.94×10⁻⁶±3.7×10⁻⁸ 1.73×10⁴±3.6×10³ 1.78×10⁴±3.7×10³ 1.76×10⁴±3.7×10³ 1.76×10⁴±3.7×10³ 2.19×10⁵±4.6×10⁴ 1.00×10⁻⁵±4.7×10⁻⁸ 1.61×10⁴±6.3×10² 1.68×10⁴±6.6×10² 1.74×10⁴±6.8×10² 1.72×10⁴±6.8×10² 2.10×10⁵±7.5×10³ 1.26×10⁻⁵±6.4×10⁻⁸ 1.49×10⁴±1.3×10³ 1.49×10⁴±1.3×10³ 1.48×10⁴±1.3×10³ 1.43×10⁴±1.2×10³ 1.85×10⁵±1.6×10⁴ 1.58×10⁻⁵±8.6×10⁻⁸ 1.16×10⁴±1.7×10³ 1.18×10⁴±1.8×10³ 1.16×10⁴±1.7×10³ 1.13×10⁴±1.7×10³ 1.44×10⁵±2.1×10⁴ 2.00×10⁻⁵±1.2×10⁻⁷ 9.35×10³±1.7×10³ 9.67×10³±1.7×10³ 9.48×10³±1.7×10³ 9.19×10³±1.7×10³ 1.19×10⁵±2.1×10⁴ 2.51×10⁻⁵±1.6×10⁻⁷ 1.07×10⁴±5.3×10² 1.07×10⁴±5.3×10² 1.07×10⁴±5.3×10² 1.06×10⁴±5.4×10² 1.33×10⁵±6.0×10³ 3.16×10⁻⁵±2.1×10⁻⁷ 7.60×10³±1.6×10³ 7.66×10³±1.7×10³ 7.39×10³±1.6×10³ 7.35×10³±1.6×10³ 9.34×10⁴±2.0×10⁴ Continued on next page Table A3. The differential cross sections in the laboratory reference system and angle-integrated cross sections of the 10B(n, α)7Li reaction.
-
After the processes presented in Sections 3.1 − 3.6, the differential and angle-integrated cross sections of the 10B(n, α)7Li reaction have been obtained. The 10B(n, α)7Li reaction has two reaction channels which are the 10B(n, α0)7Li and 10B(n, α1)7Li* reactions. Their differential cross sections,
$\sigma _{{{{E\_{\rm{bin}}{,\theta }}}}}^0$ and$\sigma _{{{{E\_{\rm{bin}}{,\theta }}}}}^{\rm{1}}$ , can be obtained by$\sigma _{{{{E\_{\rm{bin}}{,\theta }}}}}^0 = R_{{{{E\_{\rm{bin}}{,\theta }}}}}^0{\sigma _{E\_{\rm{bin}}{,\theta }}}$

(8) and
$\sigma _{{{{E\_{\rm{bin}}{,\theta }}}}}^1 = R_{{{{E\_{\rm{bin}}{,\theta }}}}}^1{\sigma _{E\_{\rm{bin}}{,\theta }}},$

(9) where
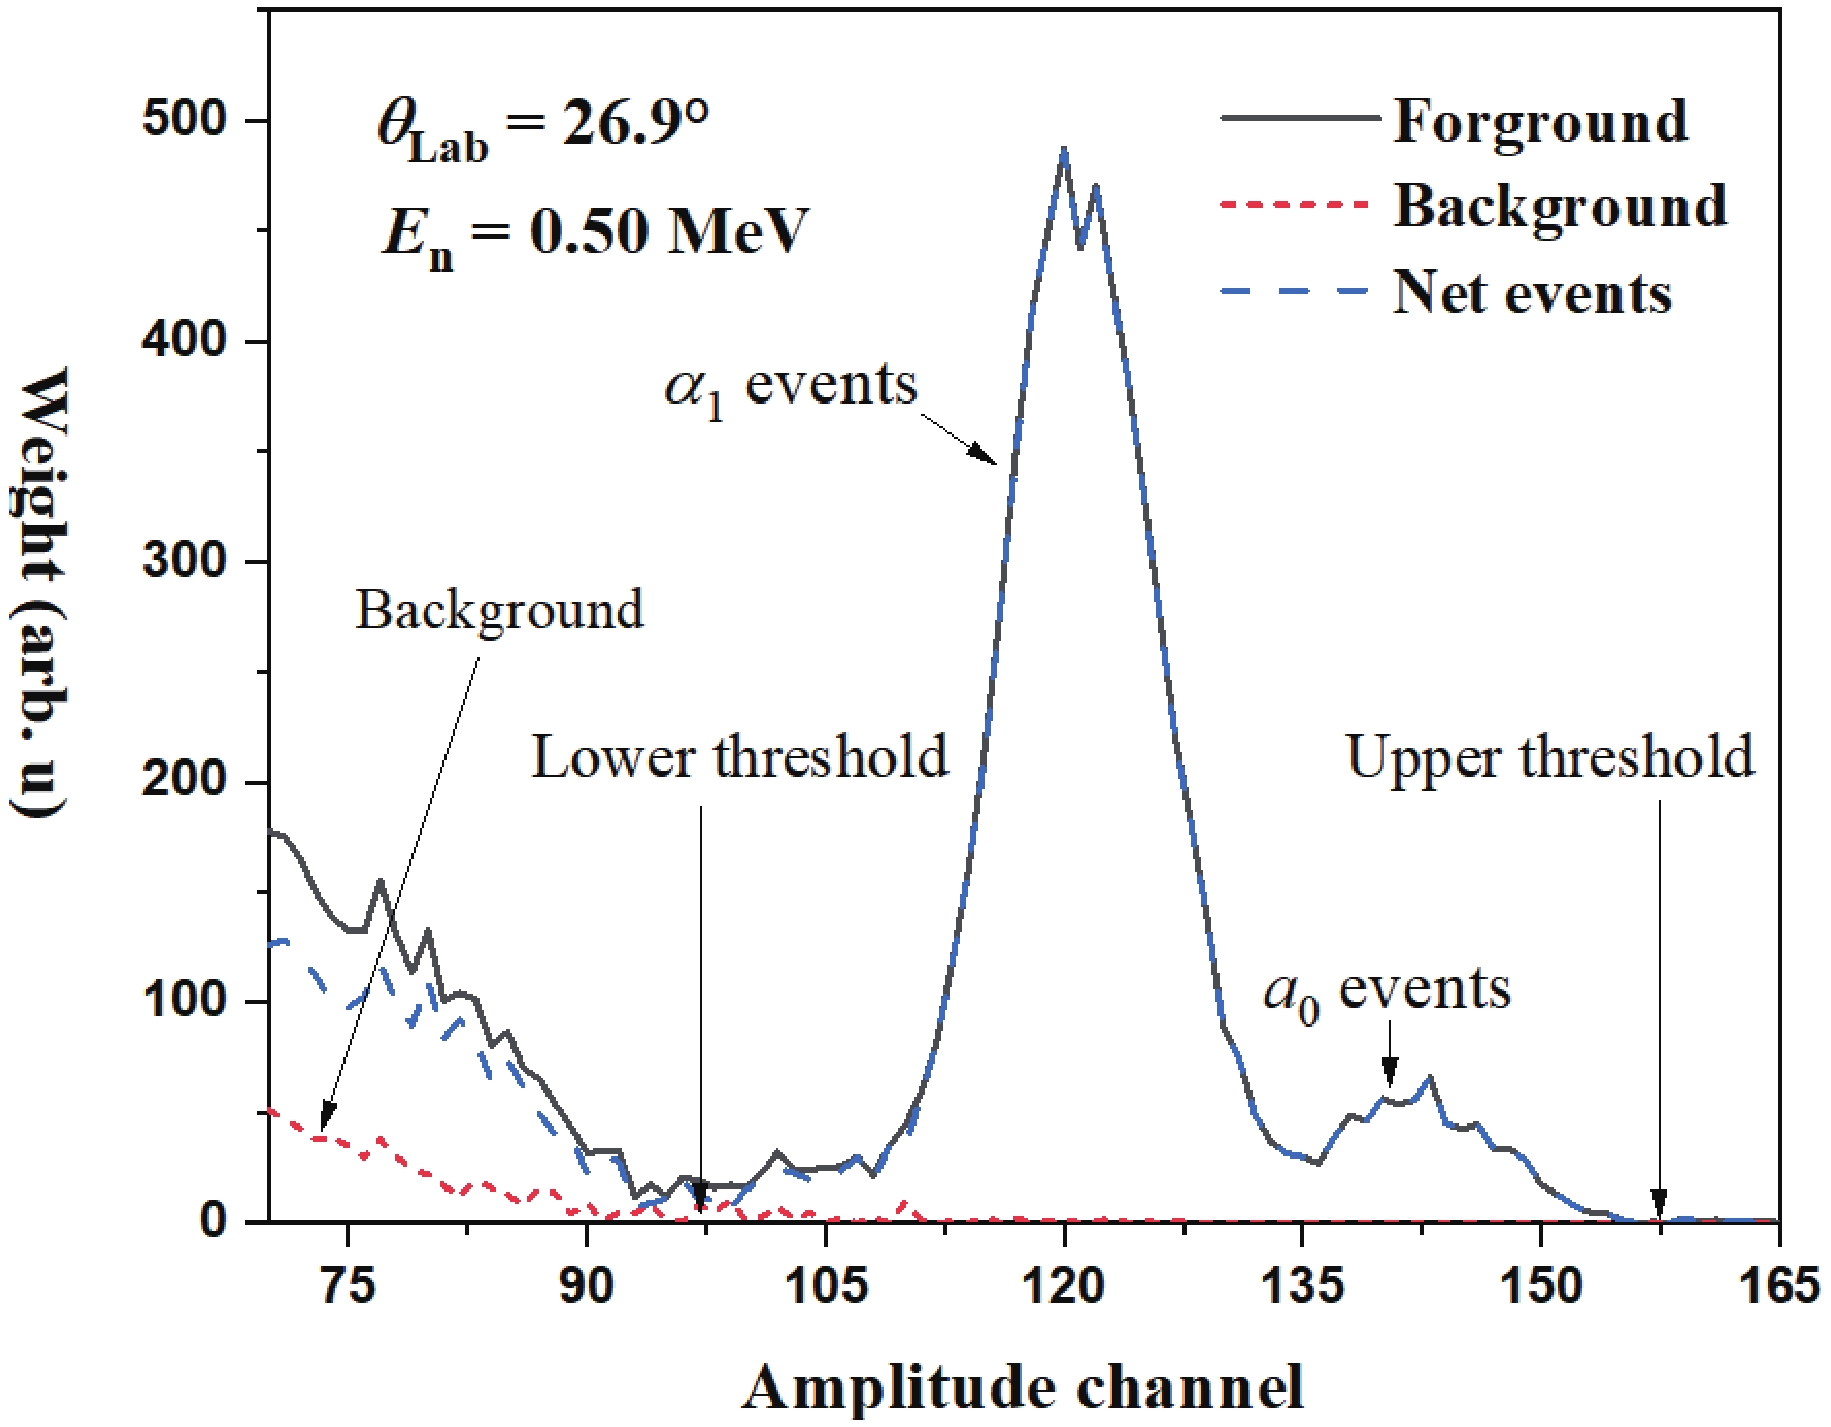
$R_{{{{E\_{\rm{bin}}{,\theta }}}}}^0$ and$R_{{{{E\_{\rm{bin}}{,\theta }}}}}^{\rm{1}}$ are the ratios of the differential cross sections of the 10B(n, α0)7Li and 10B(n, α1)7Li* reactions over that of the 10B(n, α)7Li reaction, respectively. After the processes presented in Sections 3.1 − 3.6, the weight of the events has been corrected at the corresponding neutron energy bin and the detection angle, and the ratios can be obtained from the spectrum of the net α events. The peaks of α0 and α1 could be separated directly from the spectrum in the low neutron energy region from 1.0 eV to 0.01 MeV except for several detection angles, such as 19.2° and 160.8°. However, as the neutron energy increases, overlap occurs between the two peaks. The cross sections of the two reaction channels were obtained from 0.01 MeV to 1.0 MeV using the double Gaussian functions fitting method; above 1.0 MeV, the two peaks overlap almost completely. The calculation detail for$R_{{{{E\_{\rm{bin}}{,\theta }}}}}^0$ and$R_{{{{E\_{\rm{bin}}{,\theta }}}}}^{\rm{1}}$ is described as fellows.Firstly, from the spectrum at the corresponding neutron energy bin and the detection angle, the valley between the two peaks of α0 and α1 could be found. If the minimum height of the valley was less than the one-tenth maximum height of the lower peak (usually α0 peak), a threshold at the least-count position would separate the two peaks directly as an example shown in Fig. 11(a). In this condition, the area of the overlap is less than 2% of the α0 or α1 peak area, and the overlap is thus negligible. Below 0.01 MeV, the α0 and α1 peaks of most spectra could be separated directly, except for the spectra of several detection angles, such as 19.2° and 160.8°.
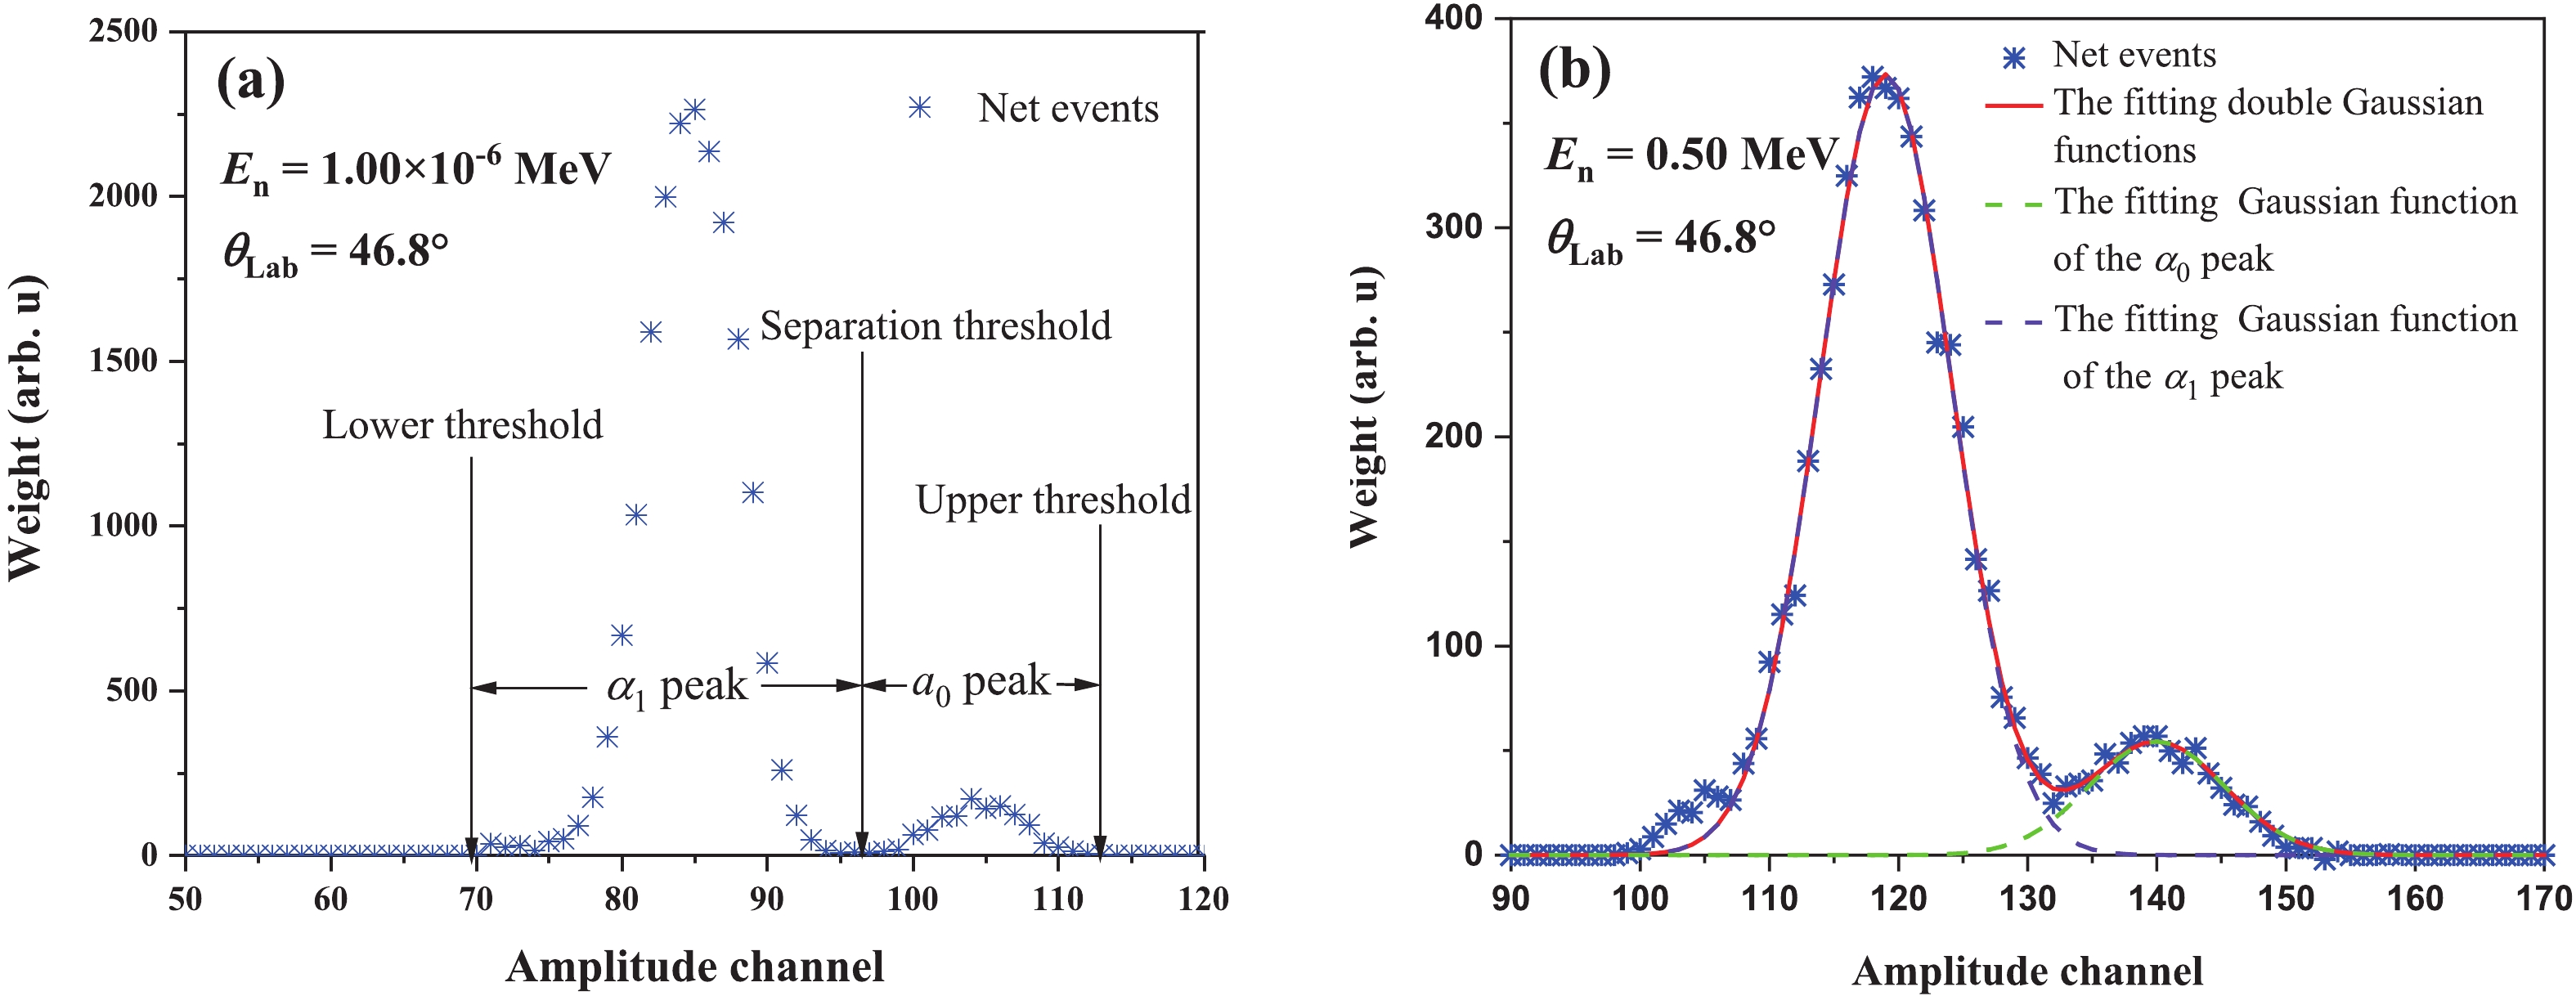
Figure 11. (color online) The separation of the α0 and α1 peaks by (a) threshold at the detection angle 46.8° and at the neutron energy 1.00×10⁻⁶ MeV and (b) the fitting method at the detection angle 46.8° and at the neutron energy 0.50 MeV.
Secondly, if the overlap between the two peaks in the spectrum of net α events cannot be ignored, then double Gaussian functions were used to fit them. Compared with other fitting functions, such as the exponential function and the polynomial function, the double Gaussian function agrees better with the measurement spectrum. Then the area of the overlapping region would be separated by the fitting result. A typical example is shown in Fig. 11(b).
After the calculated
$R_{{{{E\_{\rm{bin}}{,\theta }}}}}^0$ and$R_{{{{E\_{\rm{bin}}{,\theta }}}}}^{\rm{1}}$ ,$\sigma _{{{{E\_{\rm{bin}}{,\theta }}}}}^0$ and$\sigma _{{{{E\_{\rm{bin}}{,\theta }}}}}^{\rm{1}}$ would be obtained from Eqs. (6) and (7). The uncertainties of the calculations of$R_{{{{E\_{\rm{bin}}{,\theta }}}}}^0$ and$R_{{{{E\_{\rm{bin}}{,\theta }}}}}^{\rm{1}}$ are 2.9% − 36.4% and 1.0% − 21.6% (for 503 of the 885$\sigma _{{{{E\_{\rm{bin}}{,\theta }}}}}^0$ results, this uncertainty is less than 10%; for 864 of the 885$\sigma _{{{{E\_{\rm{bin}}{,\theta }}}}}^{\rm{1}}$ results, this uncertainty is less than 10%).The differential cross sections would be fitted by the Legendre polynomial series, then the ratios of the angle-integrated cross sections of the two reaction channel would be calculated using fitting results. Finally, the angle-integrated cross sections of the 10B(n, α0)7Li and 10B(n, α1)7Li* reactions,
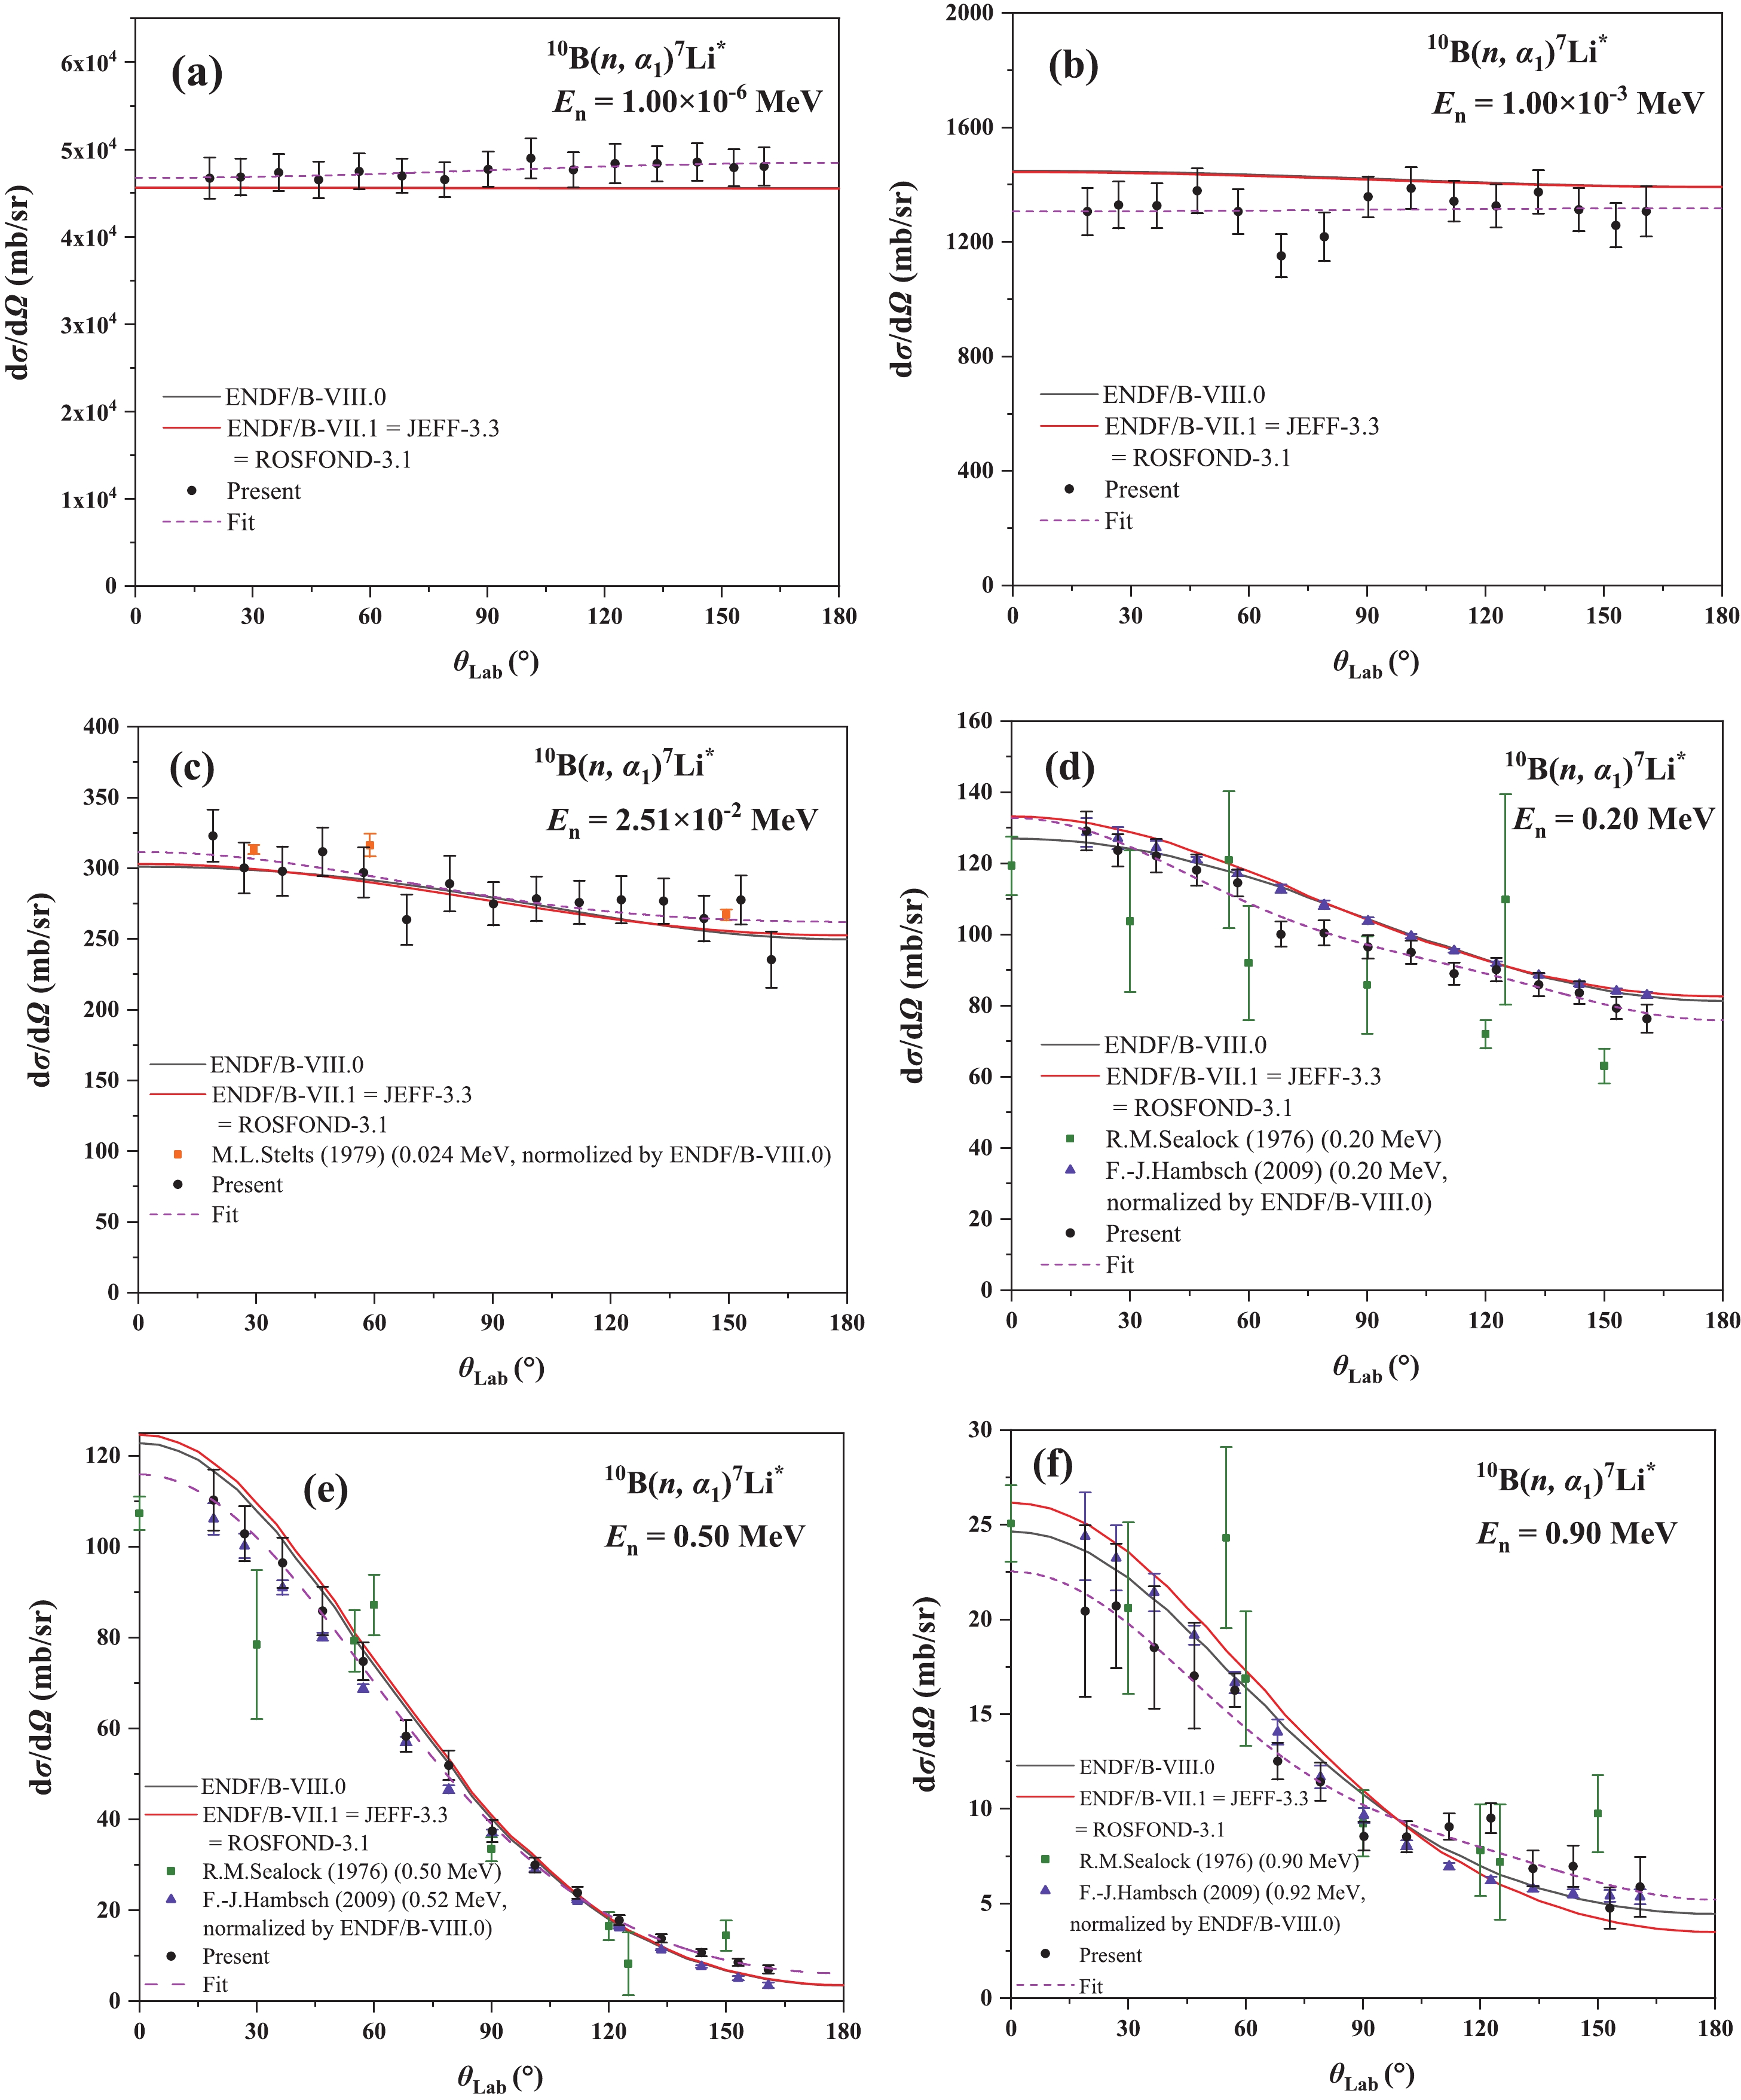
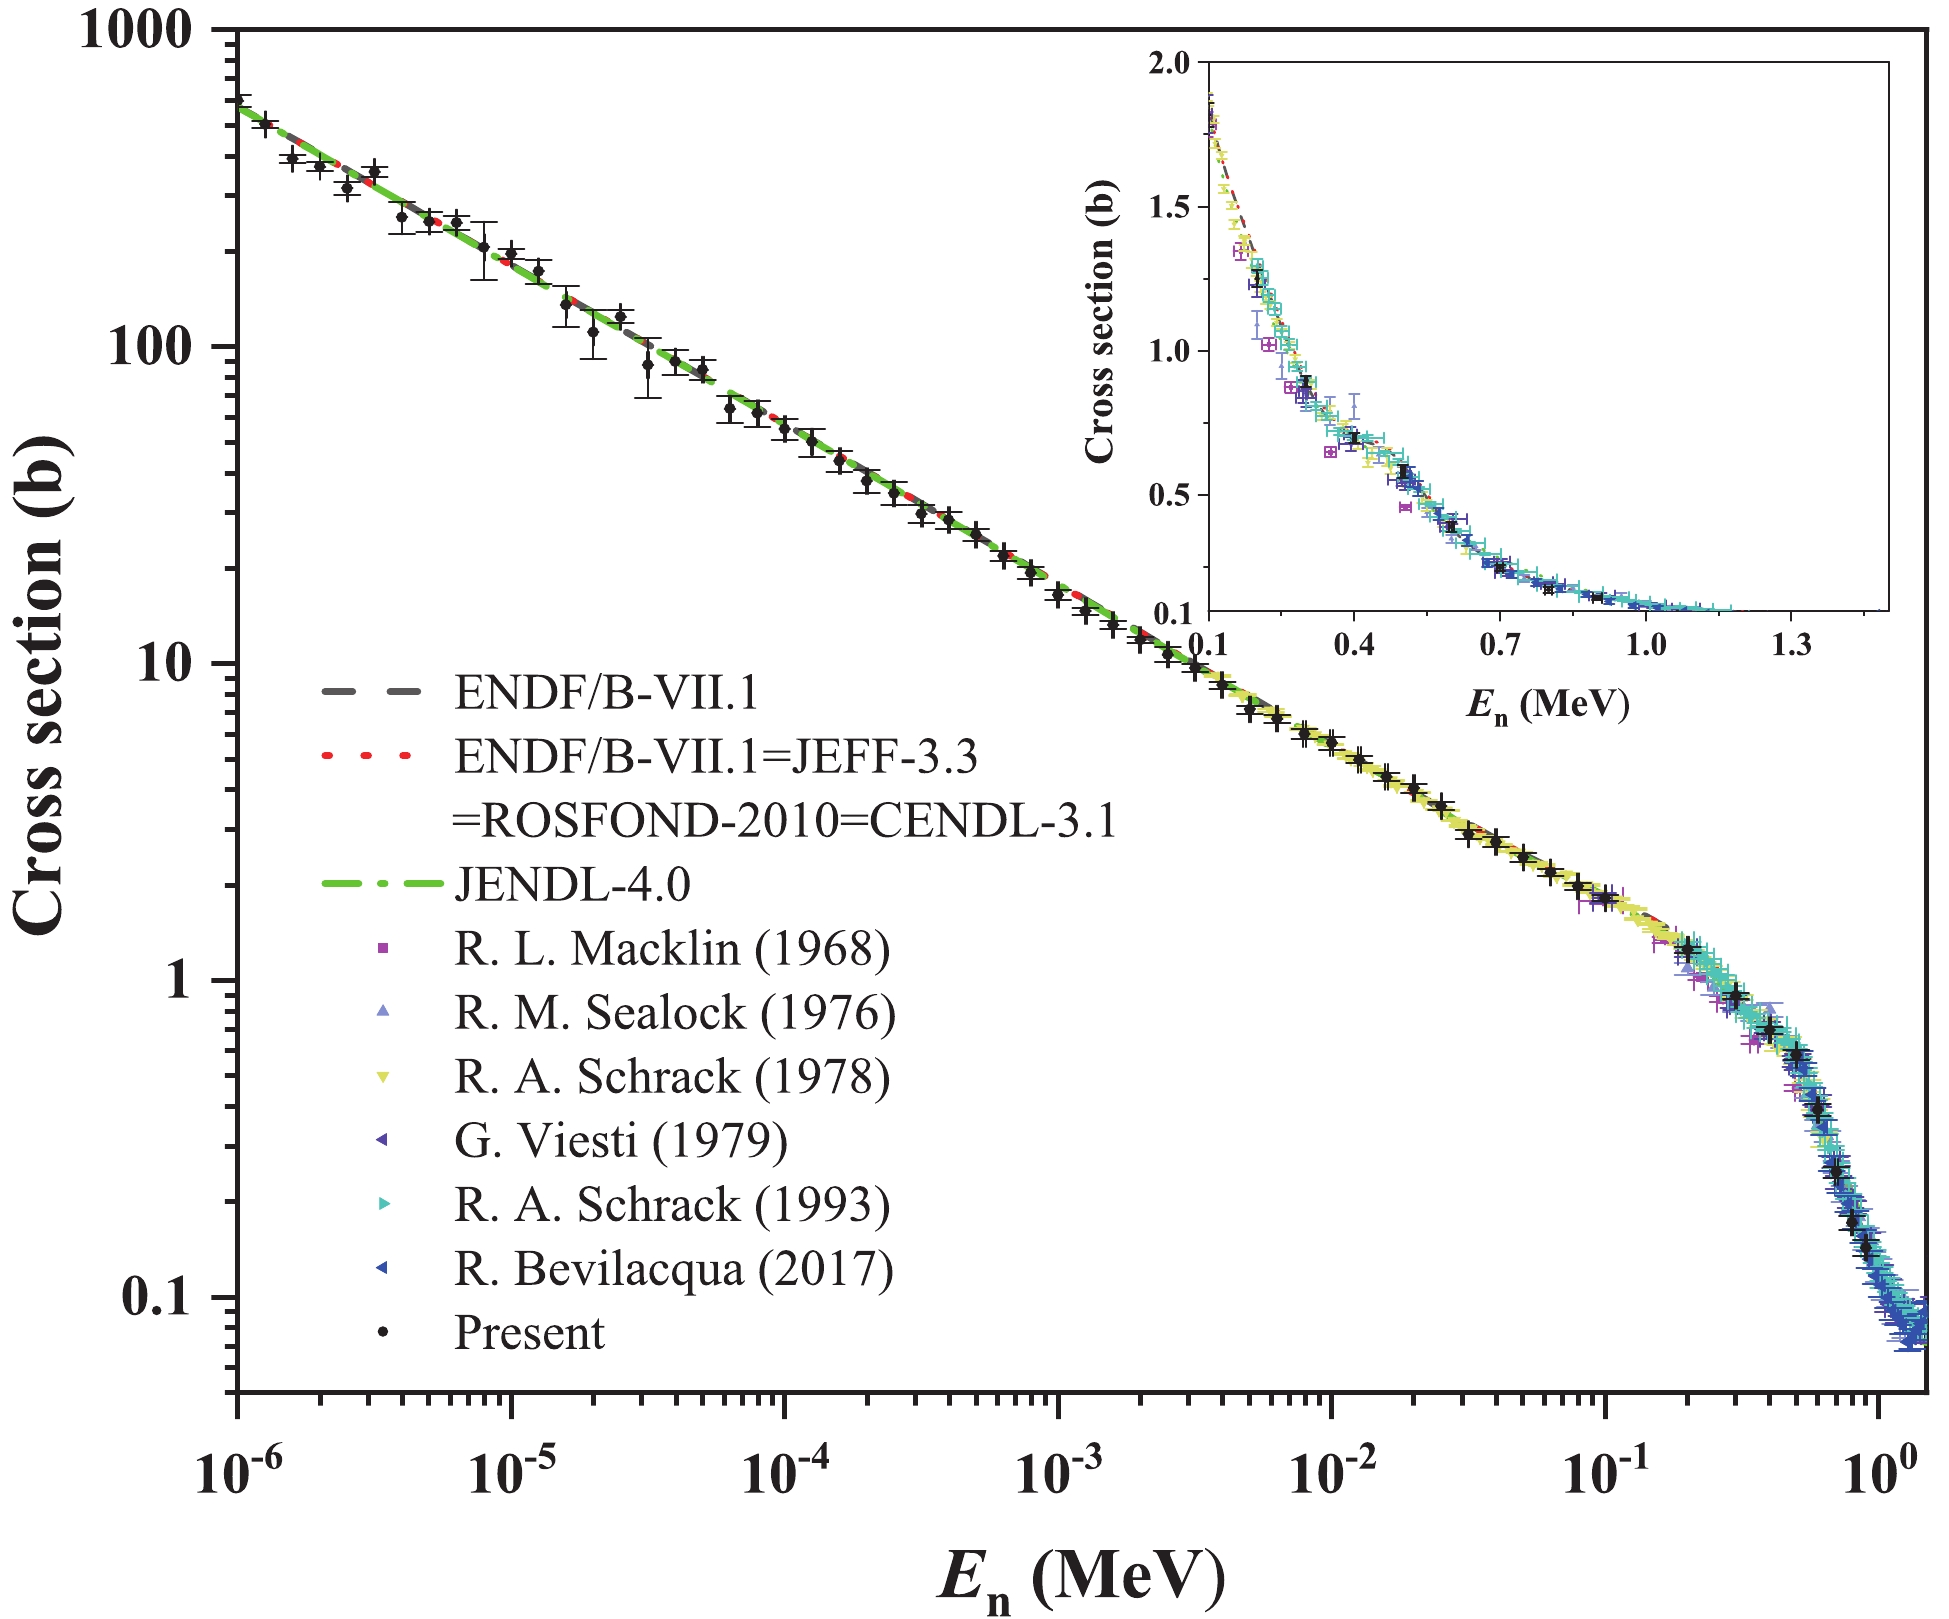
$\sigma _{{E\_{\rm{bin}}}}^0$ and$\sigma _{{E\_{\rm{bin}}}}^{\rm{1}}$ , were obtained. The total uncertainties of the differential cross sections$\sigma _{{{{E\_{\rm{bin}}{,\theta }}}}}^0$ and$\sigma _{{{{E\_{\rm{bin}}{,\theta }}}}}^{\rm{1}}$ are 4.7% − 36.7% and 3.1% − 27.7%, respectively (for 271 of the 885$\sigma _{{{{E\_{\rm{bin}}{,\theta }}}}}^0$ results, this uncertainty is less than 10%; for 738 of the 885$\sigma _{{{{E\_{\rm{bin}}{,\theta }}}}}^{\rm{1}}$ results, this uncertainty is less than 10%), and those of the angle-integrated cross sections$\sigma _{{E\_{\rm{bin}}}}^0$ and$\sigma _{{E\_{\rm{bin}}}}^{\rm{1}}$ are 2.8% − 21.6% and 2.3% − 21.5% (for 31 of the 59$\sigma _{{E\_{\rm{bin}}}}^0$ results, this uncertainty is less than 5%; for 37 of the 59$\sigma _{{E\_{\rm{bin}}}}^{\rm{1}}$ results, this uncertainty is less than 5%). Sources of uncertainty and their magnitudes were shown in Table 1. The uncertainty of the 10B(n, α0) 7Li reaction is quite large for En < 0.1 MeV because of the small counts of α0-particles. Besides, the uncertainties of the ratios,$R_{{{{E\_{\rm{bin}}{,\theta }}}}}^0$ and$R_{{{{E\_{\rm{bin}}{,\theta }}}}}^{\rm{1}}$ , are quite large at the detection angles of 19.2° and 160.8°, because the emitted α-particles at these two emission angles would have longer track in the sample, which lead to increased energy loss and more overlap of the two peaks. The final results are presented in Tables A4-A6 and Tables A7-A9 of Appendix A. Selected results of differential cross sections are shown in Figs. 12 and 13, and the angle-integrated cross sections are shown in Figs. 14 and 15. The differential cross sections of the 10B(n, α1)7Li* reaction are very similar to those of the 10B(n, α)7Li reaction below 1.0 MeV, because the cross section of 10B(n, α1) 7Li* reaction takes a large proportion (> 75% below 0.5 MeV region and > 55% in the 0.5 MeV ≤ En < 1.0 MeV region) of the total 10B(n, α)7Li reaction cross section. The differential cross sections will be discussed in Section 5.En /MeV $\sigma _{{{{E\_{\rm{bin}}}}{,\theta }}}^0$ /(mb/sr)

19.2° 26.9° 36.5° 46.7° 57.3° 68.0° 1.00×10⁻⁶±4.2×10⁻⁹ 3.21×10³±1.8×10² 3.14×10³±1.7×10² 3.09×10³±1.6×10² 3.02×10³±1.6×10² 3.15×10³±1.6×10² 3.07×10³±1.5×10² 1.26×10⁻⁶±5.4×10⁻⁹ 2.68×10³±1.4×10² 2.51×10³±1.2×10² 2.54×10³±1.2×10² 2.46×10³±1.2×10² 2.80×10³±1.3×10² 2.72×10³±1.3×10² 1.58×10⁻⁶±6.8×10⁻⁹ 1.93×10³±1.0×10² 2.08×10³±1.0×10² 2.07×10³±1.0×10² 2.13×10³±1.1×10² 2.07×10³±1.0×10² 2.37×10³±1.1×10² 2.00×10⁻⁶±8.7×10⁻⁹ 1.88×10³±1.1×10² 1.92×10³±1.1×10² 1.91×10³±1.0×10² 1.87×10³±1.0×10² 1.85×10³±1.0×10² 1.92×10³±1.0×10² 2.51×10⁻⁶±1.1×10⁻⁸ 1.69×10³±1.2×10² 1.58×10³±1.1×10² 1.66×10³±1.1×10² 1.75×10³±1.1×10² 1.74×10³±1.1×10² 1.68×10³±1.1×10² 3.16×10⁻⁶±1.4×10⁻⁸ 1.89×10³±1.3×10² 1.87×10³±1.2×10² 1.76×10³±1.2×10² 1.88×10³±1.2×10² 1.94×10³±1.3×10² 1.89×10³±1.2×10² 3.98×10⁻⁶±1.8×10⁻⁸ 1.54×10³±2.2×10² 1.23×10³±1.8×10² 1.33×10³±1.9×10² 1.41×10³±2.0×10² 1.31×10³±1.9×10² 1.26×10³±1.8×10² 5.01×10⁻⁶±2.3×10⁻⁸ 1.44×10³±1.3×10² 1.25×10³±1.2×10² 1.28×10³±1.2×10² 1.29×10³±1.2×10² 1.21×10³±1.1×10² 1.46×10³±1.3×10² 6.31×10⁻⁶±2.9×10⁻⁸ 1.30×10³±1.0×10² 1.23×10³±9.6×101 1.19×10³±9.3×101 1.22×10³±9.5×101 1.28×10³±9.9×101 1.34×10³±1.0×10² 7.94×10⁻⁶±3.7×10⁻⁸ 1.02×10³±2.2×10² 1.12×10³±2.4×10² 9.69×10²±2.1×10² 9.98×10²±2.2×10² 1.08×10³±2.4×10² 1.25×10³±2.7×10² 1.00×10⁻⁵±4.7×10⁻⁸ 1.15×10³±8.4×101 9.53×10²±7.3×101 9.30×10²±7.2×101 1.03×10³±7.7×101 1.06×10³±7.9×101 1.22×10³±8.5×101 1.26×10⁻⁵±6.4×10⁻⁸ 9.95×10²±1.1×10² 1.04×10³±1.1×10² 9.82×10²±1.0×10² 8.62×10²±9.2×101 9.12×10²±9.7×101 9.31×10²±9.8×101 1.58×10⁻⁵±8.6×10⁻⁸ 6.91×10²±1.1×10² 6.65×10²±1.1×10² 6.02×10²±9.8×101 6.94×10²±1.1×10² 6.79×10²±1.1×10² 7.28×10²±1.2×10² 2.00×10⁻⁵±1.2×10⁻⁷ 7.02×10²±1.4×10² 6.60×10²±1.3×10² 5.88×10²±1.1×10² 5.38×10²±1.1×10² 6.39×10²±1.2×10² 5.92×10²±1.2×10² 2.51×10⁻⁵±1.6×10⁻⁷ 7.07×10²±6.5×101 7.09×10²±6.5×101 6.89×10²±6.3×101 6.97×10²±6.3×101 5.97×10²±5.8×101 7.75×10²±6.8×101 3.16×10⁻⁵±2.1×10⁻⁷ 4.97×10²±1.1×10² 4.14×10²±9.5×101 5.62×10²±1.3×10² 4.39×10²±1.0×10² 4.91×10²±1.1×10² 4.43×10²±1.0×10² 3.98×10⁻⁵±2.7×10⁻⁷ 5.22×10²±6.4×101 4.59×10²±5.7×101 4.70×10²±5.7×101 4.97×10²±6.0×101 4.34×10²±5.4×101 4.11×10²±5.2×101 5.01×10⁻⁵±3.6×10⁻⁷ 5.03×10²±5.0×101 4.81×10²±4.8×101 4.31×10²±4.3×101 5.11×10²±5.0×101 4.68×10²±4.6×101 4.40×10²±4.4×101 6.31×10⁻⁵±4.8×10⁻⁷ 3.49×10²±4.2×101 3.21×10²±3.9×101 3.36×10²±4.1×101 3.67×10²±4.3×101 3.24×10²±3.9×101 3.27×10²±4.0×101 7.94×10⁻⁵±6.4×10⁻⁷ 3.54×10²±4.3×101 2.89×10²±3.7×101 3.37×10²±4.1×101 3.16×10²±3.9×101 3.29×10²±4.0×101 2.66×10²±3.4×101 1.00×10⁻⁴±8.4×10⁻⁷ 4.25×10²±4.6×101 3.10×10²±3.5×101 3.01×10²±3.4×101 2.89×10²±3.2×101 2.51×10²±2.9×101 2.70×10²±3.1×101 1.26×10⁻⁴±1.0×10⁻⁶ 3.88×10²±5.3×101 2.56×10²±4.0×101 3.14×10²±4.4×101 2.62×10²±3.8×101 2.75×10²±4.0×101 2.58×10²±3.9×101 1.58×10⁻⁴±1.3×10⁻⁶ 3.26×10²±3.7×101 1.96×10²±2.6×101 2.22×10²±2.8×101 2.40×10²±2.9×101 2.09×10²±2.6×101 2.49×10²±3.0×101 Continued on next page Table A4. The differential cross sections of the 10B(n, α0)7Li reaction in the laboratory reference system.
En/MeV $\sigma _{{{{E\_{\rm{bin}}}}{,\theta }}}^0$ /(mb/sr)

$\sigma {^0_{E\_{\rm{bin} } } } $ /mb

133.2° 143.5° 153.1° 160.8° 1.00×10⁻⁶±4.2×10⁻⁹ 3.21×10³±1.6×10² 3.04×10³±1.6×10² 3.17×10³±1.7×10² 3.12×10³±1.6×10² 3.93×10⁴±1.8×10³ 1.26×10⁻⁶±5.4×10⁻⁹ 2.84×10³±1.4×10² 2.44×10³±1.2×10² 2.63×10³±1.3×10² 2.66×10³±1.4×10² 3.34×10⁴±1.1×10³ 1.58×10⁻⁶±6.8×10⁻⁹ 2.15×10³±1.1×10² 1.98×10³±1.0×10² 1.90×10³±1.0×10² 2.33×10³±1.2×10² 2.63×10⁴±8.6×10² 2.00×10⁻⁶±8.7×10⁻⁹ 1.97×10³±1.1×10² 2.02×10³±1.1×10² 1.80×10³±1.0×10² 1.78×10³±1.1×10² 2.38×10⁴±8.7×10² 2.51×10⁻⁶±1.1×10⁻⁸ 1.70×10³±1.1×10² 1.61×10³±1.1×10² 1.50×10³±1.0×10² 1.54×10³±1.1×10² 2.08×10⁴±1.0×10³ 3.16×10⁻⁶±1.4×10⁻⁸ 1.63×10³±1.2×10² 1.89×10³±1.3×10² 1.96×10³±1.3×10² 1.66×10³±1.2×10² 2.34×10⁴±9.3×10² 3.98×10⁻⁶±1.8×10⁻⁸ 1.31×10³±1.9×10² 1.26×10³±1.9×10² 1.44×10³±2.1×10² 1.21×10³±1.8×10² 1.69×10⁴±2.0×10³ 5.01×10⁻⁶±2.3×10⁻⁸ 1.35×10³±1.3×10² 1.37×10³±1.3×10² 1.25×10³±1.2×10² 1.38×10³±1.3×10² 1.64×10⁴±1.2×10³ 6.31×10⁻⁶±2.9×10⁻⁸ 1.32×10³±1.0×10² 1.26×10³±9.9×101 1.21×10³±9.6×101 1.11×10³±9.1×101 1.58×10⁴±8.9×10² 7.94×10⁻⁶±3.7×10⁻⁸ 1.12×10³±2.4×10² 1.20×10³±2.6×10² 1.11×10³±2.4×10² 9.62×10²±2.1×10² 1.35×10⁴±2.8×10³ 1.00×10⁻⁵±4.7×10⁻⁸ 1.07×10³±8.3×101 9.91×10²±7.7×101 1.01×10³±7.7×101 1.00×10³±7.9×101 1.31×10⁴±5.6×10² 1.26×10⁻⁵±6.4×10⁻⁸ 8.93×10²±9.7×101 9.37×10²±1.0×10² 8.79×10²±9.6×101 8.71×10²±9.6×101 1.18×10⁴±1.0×10³ 1.58×10⁻⁵±8.6×10⁻⁸ 7.94×10²±1.3×10² 7.44×10²±1.2×10² 6.86×10²±1.1×10² 7.59×10²±1.2×10² 8.82×10³±1.3×10³ 2.00×10⁻⁵±1.2×10⁻⁷ 6.26×10²±1.2×10² 6.30×10²±1.2×10² 6.32×10²±1.2×10² 4.67×10²±9.4×101 7.48×10³±1.4×10³ 2.51×10⁻⁵±1.6×10⁻⁷ 5.93×10²±5.8×101 6.70×10²±6.2×101 5.73×10²±5.7×101 6.22×10²±6.2×101 8.32×10³±4.4×10² Continued on next page Table A6. The differential cross sections in the laboratory reference system and angle-integrated cross sections of the 10B(n, α0)7Li reaction.
En /MeV $\sigma _{{{{E\_{\rm{bin}}}}{,\theta }}}^{\rm{1}}$ /(mb/sr)

19.2° 26.9° 36.5° 46.7° 57.3° 68.0° 1.00×10⁻⁶±4.2×10⁻⁹ 4.67×10⁴±2.4×10³ 4.69×10⁴±2.1×10³ 4.74×10⁴±2.1×10³ 4.65×10⁴±2.1×10³ 4.75×10⁴±2.0×10³ 4.70×10⁴±2.0×10³ 1.26×10⁻⁶±5.4×10⁻⁹ 3.86×10⁴±1.2×10³ 3.92×10⁴±1.2×10³ 3.97×10⁴±1.2×10³ 3.97×10⁴±1.2×10³ 3.96×10⁴±1.2×10³ 3.89×10⁴±1.2×10³ 1.58×10⁻⁶±6.8×10⁻⁹ 3.10×10⁴±1.2×10³ 3.03×10⁴±9.8×10² 3.07×10⁴±9.9×10² 3.06×10⁴±9.9×10² 3.09×10⁴±9.9×10² 3.05×10⁴±9.8×10² 2.00×10⁻⁶±8.7×10⁻⁹ 2.88×10⁴±1.2×10³ 2.91×10⁴±1.1×10³ 2.89×10⁴±1.0×10³ 2.87×10⁴±1.1×10³ 2.94×10⁴±1.1×10³ 2.94×10⁴±1.1×10³ 2.51×10⁻⁶±1.1×10⁻⁸ 2.47×10⁴±1.2×10³ 2.49×10⁴±1.2×10³ 2.46×10⁴±1.2×10³ 2.50×10⁴±1.2×10³ 2.43×10⁴±1.2×10³ 2.44×10⁴±1.2×10³ 3.16×10⁻⁶±1.4×10⁻⁸ 2.75×10⁴±1.1×10³ 2.77×10⁴±1.1×10³ 2.75×10⁴±1.1×10³ 2.86×10⁴±1.2×10³ 2.78×10⁴±1.1×10³ 2.82×10⁴±1.1×10³ 3.98×10⁻⁶±1.8×10⁻⁸ 1.94×10⁴±2.4×10³ 2.04×10⁴±2.5×10³ 1.99×10⁴±2.4×10³ 1.99×10⁴±2.4×10³ 2.00×10⁴±2.4×10³ 1.97×10⁴±2.4×10³ 5.01×10⁻⁶±2.3×10⁻⁸ 1.93×10⁴±1.5×10³ 1.95×10⁴±1.5×10³ 1.94×10⁴±1.5×10³ 1.99×10⁴±1.5×10³ 1.95×10⁴±1.5×10³ 1.99×10⁴±1.5×10³ 6.31×10⁻⁶±2.9×10⁻⁸ 1.90×10⁴±1.1×10³ 1.99×10⁴±1.1×10³ 1.91×10⁴±1.1×10³ 1.91×10⁴±1.1×10³ 1.94×10⁴±1.1×10³ 1.92×10⁴±1.1×10³ 7.94×10⁻⁶±3.7×10⁻⁸ 1.59×10⁴±3.3×10³ 1.58×10⁴±3.3×10³ 1.61×10⁴±3.4×10³ 1.63×10⁴±3.4×10³ 1.64×10⁴±3.4×10³ 1.63×10⁴±3.4×10³ 1.00×10⁻⁵±4.7×10⁻⁸ 1.56×10⁴±7.5×10² 1.52×10⁴±6.8×10² 1.57×10⁴±7.0×10² 1.54×10⁴±6.9×10² 1.52×10⁴±6.8×10² 1.52×10⁴±6.8×10² 1.26×10⁻⁵±6.4×10⁻⁸ 1.35×10⁴±1.2×10³ 1.40×10⁴±1.2×10³ 1.34×10⁴±1.2×10³ 1.36×10⁴±1.2×10³ 1.36×10⁴±1.2×10³ 1.36×10⁴±1.2×10³ 1.58×10⁻⁵±8.6×10⁻⁸ 1.05×10⁴±1.6×10³ 1.08×10⁴±1.6×10³ 1.06×10⁴±1.6×10³ 1.06×10⁴±1.6×10³ 1.09×10⁴±1.6×10³ 1.05×10⁴±1.6×10³ 2.00×10⁻⁵±1.2×10⁻⁷ 8.80×10³±1.6×10³ 8.73×10³±1.6×10³ 8.87×10³±1.6×10³ 8.88×10³±1.6×10³ 8.82×10³±1.6×10³ 8.59×10³±1.6×10³ 2.51×10⁻⁵±1.6×10⁻⁷ 9.68×10³±5.5×10² 9.58×10³±5.5×10² 9.98×10³±5.6×10² 9.78×10³±5.5×10² 9.63×10³±5.5×10² 9.52×10³±5.4×10² 3.16×10⁻⁵±2.1×10⁻⁷ 6.80×10³±1.5×10³ 6.93×10³±1.5×10³ 6.84×10³±1.5×10³ 7.09×10³±1.5×10³ 7.00×10³±1.5×10³ 6.75×10³±1.5×10³ 3.98×10⁻⁵±2.7×10⁻⁷ 7.21×10³±6.9×10² 6.90×10³±6.6×10² 7.08×10³±6.8×10² 6.95×10³±6.6×10² 7.16×10³±6.8×10² 7.07×10³±6.8×10² 5.01×10⁻⁵±3.6×10⁻⁷ 6.73×10³±5.3×10² 6.74×10³±5.1×10² 6.57×10³±5.0×10² 6.41×10³±4.9×10² 6.78×10³±5.1×10² 6.63×10³±5.0×10² 6.31×10⁻⁵±4.8×10⁻⁷ 5.05×10³±5.2×10² 5.10×10³±5.2×10² 5.04×10³±5.2×10² 4.97×10³±5.1×10² 5.05×10³±5.2×10² 4.76×10³±4.9×10² 7.94×10⁻⁵±6.4×10⁻⁷ 5.04×10³±5.0×10² 4.95×10³±4.9×10² 4.82×10³±4.8×10² 4.86×10³±4.8×10² 4.67×10³±4.6×10² 4.84×10³±4.8×10² 1.00×10⁻⁴±8.4×10⁻⁷ 4.33×10³±3.7×10² 4.48×10³±3.7×10² 4.32×10³±3.6×10² 4.51×10³±3.7×10² 4.49×10³±3.7×10² 4.28×10³±3.5×10² 1.26×10⁻⁴±1.0×10⁻⁶ 4.09×10³±4.6×10² 3.74×10³±4.3×10² 3.91×10³±4.3×10² 4.06×10³±4.5×10² 4.13×10³±4.6×10² 3.87×10³±4.3×10² 1.58×10⁻⁴±1.3×10⁻⁶ 3.40×10³±3.0×10² 3.52×10³±3.0×10² 3.35×10³±2.8×10² 3.38×10³±2.9×10² 3.65×10³±3.1×10² 3.36×10³±2.8×10² 2.00×10⁻⁴±1.6×10⁻⁶ 3.06×10³±2.9×10² 2.89×10³±2.8×10² 2.87×10³±2.7×10² 2.93×10³±2.7×10² 2.97×10³±2.7×10² 2.87×10³±2.7×10² 2.51×10⁻⁴±2.0×10⁻⁶ 2.79×10³±2.6×10² 2.70×10³±2.6×10² 2.70×10³±2.6×10² 2.70×10³±2.5×10² 2.64×10³±2.5×10² 2.64×10³±2.5×10² 3.16×10⁻⁴±2.5×10⁻⁶ 2.54×10³±2.0×10² 2.30×10³±2.0×10² 2.33×10³±1.9×10² 2.15×10³±1.8×10² 2.37×10³±1.9×10² 2.25×10³±1.9×10² 3.98×10⁻⁴±3.1×10⁻⁶ 2.36×10³±1.9×10² 2.34×10³±1.9×10² 2.14×10³±1.8×10² 2.26×10³±1.8×10² 2.25×10³±1.8×10² 2.10×10³±1.7×10² 5.01×10⁻⁴±3.9×10⁻⁶ 2.06×10³±1.3×10² 1.89×10³±1.3×10² 1.91×10³±1.2×10² 2.16×10³±1.3×10² 2.05×10³±1.3×10² 1.95×10³±1.2×10² 6.31×10⁻⁴±4.8×10⁻⁶ 1.80×10³±1.0×10² 1.65×10³±1.0×10² 1.75×10³±1.0×10² 1.70×10³±9.7×101 1.79×10³±1.0×10² 1.60×10³±9.9×101 7.94×10⁻⁴±6.1×10⁻⁶ 1.62×10³±1.2×10² 1.54×10³±1.1×10² 1.58×10³±1.1×10² 1.51×10³±9.9×101 1.50×10³±1.1×10² 1.51×10³±1.0×10² 1.00×10⁻³±7.7×10⁻⁶ 1.31×10³±8.3×101 1.33×10³±8.1×101 1.33×10³±7.8×101 1.38×10³±7.9×101 1.31×10³±7.8×101 1.15×10³±7.5×101 1.26×10⁻³±9.8×10⁻⁶ 1.20×10³±7.2×101 1.11×10³±6.7×101 1.12×10³±6.3×101 1.23×10³±6.4×101 1.17×10³±6.5×101 1.04×10³±6.5×101 1.58×10⁻³±1.3×10⁻⁵ 1.09×10³±6.2×101 1.02×10³±6.6×101 1.10×10³±5.7×101 1.03×10³±5.6×101 1.06×10³±5.7×101 9.97×10²±5.9×101 2.00×10⁻³±1.6×10⁻⁵ 9.89×10²±5.7×101 9.65×10²±5.5×101 9.43×10²±5.2×101 9.59×10²±5.2×101 9.42×10²±5.1×101 8.70×10²±5.6×101 2.51×10⁻³±2.1×10⁻⁵ 8.05×10²±6.9×101 8.27×10²±6.8×101 8.51×10²±6.7×101 8.87×10²±6.8×101 8.32×10²±6.8×101 7.62×10²±6.8×101 3.16×10⁻³±2.7×10⁻⁵ 8.28×10²±5.2×101 7.68×10²±4.9×101 7.37×10²±4.4×101 7.80×10²±4.5×101 7.37×10²±4.5×101 6.95×10²±4.9×101 3.98×10⁻³±3.6×10⁻⁵ 6.56×10²±4.5×101 7.24×10²±4.6×101 7.17×10²±4.2×101 7.02×10²±4.0×101 6.99×10²±4.1×101 6.39×10²±4.3×101 5.01×10⁻³±4.8×10⁻⁵ 5.57×10²±3.6×101 5.53×10²±3.5×101 5.87×10²±3.4×101 5.90×10²±3.3×101 5.79×10²±3.4×101 4.98×10²±3.5×101 6.31×10⁻³±6.4×10⁻⁵ 5.65×10²±3.7×101 5.54×10²±3.5×101 5.28×10²±3.3×101 5.50×10²±3.3×101 5.27×10²±3.3×101 5.10×10²±3.3×101 Continued on next page Table A7. The differential cross sections of the 10B(n, α1)7Li reaction in the laboratory reference system.
En /MeV $\sigma _{{{{E\_{\rm{bin}}}}{,\theta }}}^{\rm{1}}$ /(mb/sr)

$\sigma {^{\rm{1} }_{E\_{\rm{bin} } } }$ /mb

133.2° 143.5° 153.1° 160.8° 1.00×10⁻⁶±4.2×10⁻⁹ 4.84×10⁴±2.0×10³ 4.86×10⁴±2.1×10³ 4.79×10⁴±2.1×10³ 4.81×10⁴±2.2×10³ 5.98×10⁵±2.5×10⁴ 1.26×10⁻⁶±5.4×10⁻⁹ 4.08×10⁴±1.3×10³ 4.04×10⁴±1.3×10³ 4.07×10⁴±1.3×10³ 4.03×10⁴±1.3×10³ 5.03×10⁵±1.3×10⁴ 1.58×10⁻⁶±6.8×10⁻⁹ 3.21×10⁴±1.0×10³ 3.14×10⁴±1.0×10³ 3.16×10⁴±1.0×10³ 3.16×10⁴±1.0×10³ 3.92×10⁵±1.1×10⁴ 2.00×10⁻⁶±8.7×10⁻⁹ 3.04×10⁴±1.1×10³ 3.01×10⁴±1.1×10³ 3.00×10⁴±1.1×10³ 2.99×10⁴±1.1×10³ 3.71×10⁵±1.2×10⁴ 2.51×10⁻⁶±1.1×10⁻⁸ 2.56×10⁴±1.3×10³ 2.52×10⁴±1.3×10³ 2.56×10⁴±1.3×10³ 2.55×10⁴±1.3×10³ 3.16×10⁵±1.4×10⁴ 3.16×10⁻⁶±1.4×10⁻⁸ 2.93×10⁴±1.2×10³ 2.88×10⁴±1.2×10³ 2.84×10⁴±1.2×10³ 2.80×10⁴±1.2×10³ 3.56×10⁵±1.2×10⁴ 3.98×10⁻⁶±1.8×10⁻⁸ 2.03×10⁴±2.5×10³ 2.13×10⁴±2.6×10³ 2.07×10⁴±2.5×10³ 2.09×10⁴±2.5×10³ 2.56×10⁵±3.0×10⁴ 5.01×10⁻⁶±2.3×10⁻⁸ 1.98×10⁴±1.5×10³ 2.01×10⁴±1.5×10³ 2.09×10⁴±1.6×10³ 1.97×10⁴±1.5×10³ 2.49×10⁵±1.8×10⁴ 6.31×10⁻⁶±2.9×10⁻⁸ 1.98×10⁴±1.1×10³ 1.98×10⁴±1.1×10³ 1.96×10⁴±1.1×10³ 1.98×10⁴±1.1×10³ 2.46×10⁵±1.3×10⁴ 7.94×10⁻⁶±3.7×10⁻⁸ 1.62×10⁴±3.4×10³ 1.66×10⁴±3.5×10³ 1.65×10⁴±3.5×10³ 1.67×10⁴±3.5×10³ 2.06×10⁵±4.3×10⁴ 1.00×10⁻⁵±4.7×10⁻⁸ 1.51×10⁴±6.9×10² 1.58×10⁴±7.2×10² 1.64×10⁴±7.3×10² 1.62×10⁴±7.4×10² 1.97×10⁵±7.2×10³ 1.26×10⁻⁵±6.4×10⁻⁸ 1.40×10⁴±1.3×10³ 1.40×10⁴±1.3×10³ 1.39×10⁴±1.2×10³ 1.34×10⁴±1.2×10³ 1.73×10⁵±1.5×10⁴ 1.58×10⁻⁵±8.6×10⁻⁸ 1.08×10⁴±1.6×10³ 1.10×10⁴±1.7×10³ 1.09×10⁴±1.6×10³ 1.05×10⁴±1.6×10³ 1.36×10⁵±2.0×10⁴ 2.00×10⁻⁵±1.2×10⁻⁷ 8.73×10³±1.6×10³ 9.04×10³±1.6×10³ 8.84×10³±1.6×10³ 8.72×10³±1.6×10³ 1.11×10⁵±2.0×10⁴ 2.51×10⁻⁵±1.6×10⁻⁷ 1.01×10⁴±5.7×10² 1.00×10⁴±5.7×10² 1.01×10⁴±5.8×10² 1.00×10⁴±5.9×10² 1.24×10⁵±5.8×10³ 3.16×10⁻⁵±2.1×10⁻⁷ 7.17×10³±1.6×10³ 7.15×10³±1.6×10³ 6.96×10³±1.5×10³ 6.95×10³±1.5×10³ 8.76×10⁴±1.9×10⁴ 3.98×10⁻⁵±2.7×10⁻⁷ 7.36×10³±7.0×10² 7.33×10³±7.0×10² 7.14×10³±6.9×10² 6.87×10³±6.7×10² 8.97×10⁴±8.1×10³ 5.01×10⁻⁵±3.6×10⁻⁷ 6.95×10³±5.2×10² 6.79×10³±5.1×10² 6.84×10³±5.2×10² 6.61×10³±5.1×10² 8.46×10⁴±5.9×10³ 6.31×10⁻⁵±4.8×10⁻⁷ 5.00×10³±5.1×10² 5.06×10³±5.2×10² 5.21×10³±5.3×10² 5.16×10³±5.3×10² 6.39×10⁴±6.3×10³ 7.94×10⁻⁵±6.4×10⁻⁷ 5.09×10³±5.0×10² 4.95×10³±4.9×10² 5.06×10³±5.0×10² 4.79×10³±4.8×10² 6.17×10⁴±5.8×10³ 1.00×10⁻⁴±8.4×10⁻⁷ 4.30×10³±3.5×10² 4.55×10³±3.7×10² 4.31×10³±3.6×10² 4.02×10³±3.5×10² 5.50×10⁴±4.1×10³ 1.26×10⁻⁴±1.0×10⁻⁶ 4.01×10³±4.4×10² 3.97×10³±4.4×10² 3.85×10³±4.3×10² 3.71×10³±4.3×10² 5.01×10⁴±5.1×10³ 1.58×10⁻⁴±1.3×10⁻⁶ 3.52×10³±2.9×10² 3.59×10³±3.0×10² 3.50×10³±2.9×10² 3.54×10³±3.1×10² 4.35×10⁴±3.3×10³ 2.00×10⁻⁴±1.6×10⁻⁶ 3.13×10³±2.8×10² 3.05×10³±2.8×10² 2.90×10³±2.7×10² 3.01×10³±2.9×10² 3.77×10⁴±3.0×10³ 2.51×10⁻⁴±2.0×10⁻⁶ 2.81×10³±2.6×10² 2.71×10³±2.5×10² 2.79×10³±2.7×10² 2.64×10³±2.6×10² 3.45×10⁴±2.9×10³ 3.16×10⁻⁴±2.5×10⁻⁶ 2.37×10³±1.8×10² 2.46×10³±1.9×10² 2.46×10³±2.0×10² 2.15×10³±2.0×10² 2.97×10⁴±1.9×10³ 3.98×10⁻⁴±3.1×10⁻⁶ 2.32×10³±1.8×10² 2.23×10³±1.7×10² 2.19×10³±1.8×10² 2.23×10³±2.0×10² 2.84×10⁴±1.8×10³ 5.01×10⁻⁴±3.9×10⁻⁶ 2.08×10³±1.3×10² 2.07×10³±1.3×10² 2.09×10³±1.3×10² 2.05×10³±1.4×10² 2.55×10⁴±1.2×10³ 6.31×10⁻⁴±4.8×10⁻⁶ 1.91×10³±1.0×10² 1.82×10³±9.9×101 1.73×10³±1.0×10² 1.67×10³±1.1×10² 2.19×10⁴±8.3×10² 7.94×10⁻⁴±6.1×10⁻⁶ 1.60×10³±1.0×10² 1.56×10³±1.0×10² 1.55×10³±1.0×10² 1.39×10³±1.1×10² 1.94×10⁴±8.7×10² 1.00×10⁻³±7.7×10⁻⁶ 1.37×10³±7.6×101 1.31×10³±7.6×101 1.26×10³±7.7×101 1.31×10³±8.8×101 1.65×10⁴±6.1×10² 1.26×10⁻³±9.8×10⁻⁶ 1.16×10³±6.0×101 1.19×10³±6.2×101 1.16×10³±6.4×101 1.14×10³±7.5×101 1.47×10⁴±3.9×10² 1.58×10⁻³±1.3×10⁻⁵ 1.05×10³±5.4×101 1.10×10³±5.7×101 1.02×10³±5.7×101 9.48×10²±6.5×101 1.33×10⁴±3.6×10² 2.00×10⁻³±1.6×10⁻⁵ 9.48×10²±5.0×101 9.40×10²±5.1×101 9.69×10²±5.2×101 9.50×10²±6.1×101 1.19×10⁴±2.9×10² 2.51×10⁻³±2.1×10⁻⁵ 8.72×10²±6.4×101 7.91×10²±6.1×101 7.97×10²±6.5×101 8.51×10²±7.7×101 1.07×10⁴±5.8×10² 3.16×10⁻³±2.7×10⁻⁵ 8.15×10²±4.3×101 8.05×10²±4.4×101 7.12×10²±4.5×101 7.70×10²±5.4×101 9.68×10³±2.8×10² 3.98×10⁻³±3.6×10⁻⁵ 7.02×10²±3.9×101 6.56×10²±3.8×101 7.07×10²±4.2×101 6.97×10²±4.7×101 8.55×10³±2.3×10² 5.01×10⁻³±4.8×10⁻⁵ 5.76×10²±3.2×101 5.76×10²±3.3×101 5.64×10²±3.5×101 5.33×10²±4.0×101 7.17×10³±2.1×10² 6.31×10⁻³±6.4×10⁻⁵ 5.35×10²±3.1×101 5.52×10²±3.3×101 4.45×10²±3.2×101 5.04×10²±3.9×101 6.70×10³±2.0×10² Continued on next page Table A9. The differential cross sections in the laboratory reference system and angle-integrated cross sections of the 10B(n, α1)7Li reaction.
-
The present differential cross sections have been compared with existing measurement data and evaluations [3, 5]:
1) For En < 0.1 MeV, the present differential cross sections of the10B(n, α)7Li, 10B(n, α0)7Li and 10B(n, α1)7Li* reactions agree well with the measurement data of Hambsch [2] (2009, 0.40 keV − 1.20 MeV, after normalization using ENDF/B-VIII.0 data) and Stelts [7] (1979, 2 keV − 24 keV, after normalization using the ENDF/B-VIII.0 data). The present differential cross sections of the 10B(n, α)7Li, 10B(n, α0)7Li and 10B(n, α1)7Li* reactions show that the differential cross sections are almost isotropic in the center-of-mass system and slightly forward-peaked in the laboratory system, as well as those of different evaluations.
2) In the 0.1 MeV ≤ En < 1.0 MeV region, the present differential cross sections of the 10B(n, α)7Li and 10B(n, α1)7Li* reactions agree with the measurement data of Hambsch (2009, 0.40 keV − 0.98 MeV, after normalization using ENDF/B-VIII.0 data) [2], as well as the ENDF/B-VIII.0 and ENDF/B-VII.1 library.
For the present differential cross sections of the 10B(n, α0)7Li reaction, there are differences between the present data and the measurement data of Hambsch [2], as well as those of ENDF/B-VIII.0 and ENDF/B-VII.1 library. In this neutron energy region, compared with the measurement data of Hambsch [2] and evaluation data, the present differential cross sections are commonly higher in the forward emission angles, and lower in the backward angles. However, due to the large uncertainty of the present results of the 10B(n, α0)7Li reaction, more research is needed to clarify these differences.
Besides, the present differential cross sections of the 10B(n, α0)7Li and 10B(n, α1)7Li* don’t agree with the results of Sealock (1976, 0.20 − 1.20 MeV) [6]. Compared with the results of Sealock [6], the uncertainty of the present differential cross sections is smaller. The average uncertainty of the results of Sealock is 22.4%, while that of the present results is 8.6% in this neutron energy region.
3) In the 1.0 MeV ≤ En < 2.5 MeV region, the discrepancies between the present differential cross sections of the 10B(n, α)7Li reaction and evaluations exist. According to the evaluations, including ENDF/B-VIII.0, ENDF/B-VII.1 and CENDL-3.1 libraries, the differential cross sections of the 10B(n, α)7Li reaction decrease monotonously with the increasing of θLab, while our present results show non-monotone decreasing trend. There is no other data in the 1.0 MeV ≤ En < 2.5 MeV region except the results of Sealock (1976, 0.20 − 1.20 MeV), which have fairly big uncertainties (in the 1.0 MeV ≤ En < 1.20 MeV region, the average uncertainty of Sealock's results is 26.4%, while that of the present results is 8.9%) [6]. So, further researches are therefore demanded in the MeV neutron energy region.
The present cross sections have been also compared with existing measurement data from EXFOR library since 1965 and evaluations [3, 5]:
1) For the 10B(n, α)7Li reaction, the present cross sections agree well with the measurement data of Friesenhahn (1975, 2.35 keV − 1.72 MeV) [18] for En ≤ 0.3 MeV, Sealock (1976, 0.20 − 1.20 MeV) [6] in the 0.2 MeV ≤ En ≤ 1.2 MeV region and Bevilacqu (2017, 0.50 – 3.00 MeV) [17] in the 0.5 MeV < En < 1.0 MeV region. The present cross sections of the 10B(n, α)7Li reaction are 17.7% lower than those of Friesenhahn [18] for En > 0.3 MeV, and 12.6% higher than those of Bevilacqu [17] for En ≥ 1.0 MeV.
2) For the 10B(n, α0)7Li reaction, the present cross sections agree well with the measurement data of Macklin (1968, 0.04 − 0.52 MeV) [19] in the 0.04 MeV ≤ En ≤ 0.1 MeV region, Sealock (1976, 0.20 − 1.20 MeV) [6] in the 0.2 MeV ≤ En < 1.0 MeV region, and Bevilacqu (2017, 0.50 – 3.00 MeV) [17] in the 0.8 MeV ≤ En < 1.0 MeV region. The present cross sections of the 10B(n, α0)7Li reaction are 19.5% higher than those of Macklin [19] for En > 0.1 MeV and 8.1% lower than those of Bevilacqu [17] for En < 0.8 MeV.
3) For the 10B(n, α1)7Li* reaction, the present cross sections agree well with the measurement data of Schrack (1978, 3.82 keV − 0.63 MeV) [20], Viesti (1979, 0.10 − 2.20 MeV) [21], Sealock (1976, 0.20 − 1.20 MeV) [6], Schrack (1993, 0.20 − 4.06 MeV) [22] and Bevilacqu (2017, 0.50 – 3.00 MeV) [17].
Compared with different evaluations, including ENDF/B-VIII.0, ENDF/B-VII.1, JENDL-4.0, ROSFOND-2010 and CENDL-3.1 libraries, the present cross sections of the 10B(n, α0)7Li and 10B(n, α1)7Li* reactions generally agree better with ENDF/B-VIII.0 library; those of the 10B(n, α)7Li reaction agree well with ENDF/B-VIII.0 library for En ≤ 1.8 MeV, and well with ENDF/B-VII.1 library for En > 1.8 MeV [5].
-
The present results have two major sources of uncertainty: for the low neutron energy region (En < 1.0 keV), the major source is the uncertainty of the relative neutron fluence; and for the high neutron energy region (En > 2.0 MeV), the major source is the uncertainty of the unfolding of the expanding of neutron energy due to the double-bunched operation mode. As mentioned in Section 2.1, the experiment was performed at Endstation #1 (the length of flight path was 57.99 m) while the neutron spectrum was measured at Endstation #2 (the length of flight path was 75.78 m), so the actual neutron energy spectrum should be a little different between the two positions. The absolute cross sections are affected by the uncertainty of the neutron energy spectrum, while the relative angular distributions are not. The results of simulation by Fluka code was used to determine this effect [10]. According to the simulation, the deviations between the spectrum of the two position were expected to be less than 2% in the 0.3 − 0.5 MeV region which was chosen for normalization. In the 0.1 − 2.5 MeV region, the deviations were less than 4%. Besides, one could notice that the neutron energy spectrum has fairly big uncertainty for En < 1.0 keV because of the resonance of the cross section of the 235U(n, f) reaction below 2.5 keV region and the uncertainty of the moderation length of the neutron source. In the future, precise neutron energy spectrum at Endstation #1 should be measured.
The present measurement results are limited in En < 2.5 MeV region; more work should be done in the higher neutron energy region. Besides, the peaks of α0 and α1 could not be separated for En > 1.0 MeV in the present work; thinner sample and the detectors with higher resolution should be used in the future. The unfolding of the expanding of neutron energy due to the double-bunched operation mode would introduce fairly big uncertainty for En > 2.0 MeV, so the single bunched proton beam should be used in the coming work.
-
As shown in Figs. 10, 14 and 15, the cross sections of the 10B(n, α) 7Li and 10B(n, α1) 7Li* reactions are smooth and obey the 1/v law for En < 0.1 MeV, as well as those of the 10B(n, α0) 7Li reaction for En < 0.01 MeV. The 10B(n, α1) 7Li* reaction dominates below 0.01 MeV region where the 10B(n, α1) / 10B(n, α) cross-section ratio is 93.77%±0.92% according to the present results. For the low neutron energy region (En < 0.1 MeV), the present differential cross sections of the 10B(n, α)7Li, 10B(n, α0)7Li and 10B(n, α1)7Li* reactions are almost isotropic in the center-of-mass system and slightly forward-peaked in the laboratory system as shown in Figs. 9 (a) − (d), Figs. 12 (a) − (c) and Figs. 13 (a) − (c).
The big 10B(n, α1) / 10B(n, α) cross-section ratio for the low neutron energy region could be explained by the resonance reaction mechanism and the level structure of the 11B compound system [23]. When the 10B target nucleus interacts with the low-energy neutrons (ln=0), the scattering and bound states with Jπ=7/2+ of the compound nucleus 11B would be formed, then 11B would decay to 7Li or 7Li*. The s-wave scattering state of 11B has the resonance energy of En = 0.37 MeV, and the excitation energy of 7Li* is 0.48 MeV. With the broad s-wave state (Γn(C.M.) = 0.77 MeV and Γα1(C.M.) = 0.113 MeV), the 10B(n, α1) 7Li* reaction would have large cross section in the low neutron energy region. The α0 partial width (Γα0(C.M.) = 0.001 MeV) is negligible compared to the α1 partial width, so it is very difficult for the 10B(n, α0) 7Li reaction to have the resonance with this state of 11B. Besides, the two 7/2+ s-wave states are primarily responsible for the 1/v law of the excitation function for the low neutron energy region [24].
In the neutron energy range from 0.1 MeV to 1.0 MeV, the differential cross sections of the 10B(n, α1) 7Li* reaction are forward-peaked as shown in Figs. 13 (d) − (f) which are also mainly contributed by the two 7/2+ s-wave states of the 11B [24]. For the 10B(n, α0) 7Li reaction, the differential cross sections are backward-peaked in 0.3 − 0.6 MeV region as shown in Fig. 12 (e), which are caused by the resonance of 5/2- p-wave state of the 11B which would occur as En ≈ 0.52 MeV. As for the excitation function, the resonance of 5/2- p-wave state would lead to a peak of the 10B(n, α0) 7Li reaction around En = 0.50 MeV. Because of the competition of the 10B(n, α0) 7Li reaction, the cross section of the 10B(n, α1) 7Li* reaction would decrease rapidly above 0.50 MeV region [2].
For 1.0 MeV ≤ En < 2.5 MeV, the differential cross sections of the 10B(n, α)7Li reaction are approximately forward-peaked in the laboratory (lab) system, while the deviations exist between the present measurements and evaluations. For example, the anomaly was observed as shown in Fig. 9 (h) around En = 1.80 MeV. It might be due to the contribution of the resonance of the 9/2- p-wave state at En = 1.83 MeV and 5/2+ or 7/2+ d-wave state at En = 1.88 MeV of 11B [25]. These resonance states would also lead to the peak of the excitation function of the 10B(n, α) 7Li reaction near En ≈ 1.80 MeV as shown in Fig. 10.
-
In the present work, with 15 silicon detectors distributed from 19.2° to 160.8°, differential and angle-integrated cross sections for the 10B(n, α)7Li, 10B(n, α0) 7Li and 10B(n, α1) 7Li* reactions have been measured using the LPDA detector system at CSNS Back-n white neutron source. Compared with existing measurements, the present results have been obtained in the wider neutron energy range. The differential and angle-integrated cross sections were obtained for the 10B(n, α)7Li reaction in the 1.0 eV ≤ En < 2.5 MeV region (67 energy points), as well as the two reaction channels, 10B(n, α0) 7Li and 10B(n, α1) 7Li*, in the 1.0 eV ≤ En < 1.0 MeV region (59 energy points). There is no previous measurement datum of the differential cross section of the 10B(n, α)7Li reaction existing in EXFOR library in the 1.2 MeV < En < 2.5 MeV region; the present data are the first measurement results in this region. The measurement results have been analyzed by the resonance reaction mechanism and the level structure of the 11B compound system. Compared with most existing measurements and evaluations, the present results show a good agreement except for several energy points around 1.0 MeV and above 2.0 MeV, which need further research especially in the MeV neutron energy region.
The authors are indebted to the operation crew of the CSNS Back-n white neutron source. Dr. Qiwen Fan from China Institute of Atomic Energy is appreciated for preparing the 10B samples. Prof. Zhenpeng Chen from Tsinghua University is appreciated for the beneficial discussions.
-
Tables A1-A9 results of differential and angle-integrated cross sections of
${\rm{the}} $ 10B(n, α)7Li, 10B(n, α0)7Li and 10B(n, α1)7Li* reactions.En /MeV $\sigma _{E\_{\rm{bin,}}\theta }^{}$ /(mb/sr)

78.8° 90.3° 101.2° 112.0° 122.7° 1.00×10⁻⁶±4.2×10⁻⁹ 4.96×10⁴±2.1×10³ 5.09×10⁴±2.1×10³ 5.20×10⁴±2.4×10³ 5.09×10⁴±2.1×10³ 5.16×10⁴±2.3×10³ 1.26×10⁻⁶±5.4×10⁻⁹ 4.24×10⁴±1.2×10³ 4.39×10⁴±1.3×10³ 4.34×10⁴±1.2×10³ 4.32×10⁴±1.2×10³ 4.34×10⁴±1.2×10³ 1.58×10⁻⁶±6.8×10⁻⁹ 3.33×10⁴±9.6×10² 3.38×10⁴±9.8×10² 3.38×10⁴±9.8×10² 3.35×10⁴±9.6×10² 3.34×10⁴±9.7×10² 2.00×10⁻⁶±8.7×10⁻⁹ 3.08×10⁴±1.0×10³ 3.17×10⁴±1.1×10³ 3.15×10⁴±1.0×10³ 3.18×10⁴±1.1×10³ 3.18×10⁴±1.0×10³ 2.51×10⁻⁶±1.1×10⁻⁸ 2.69×10⁴±1.3×10³ 2.70×10⁴±1.3×10³ 2.77×10⁴±1.3×10³ 2.69×10⁴±1.3×10³ 2.77×10⁴±1.3×10³ 3.16×10⁻⁶±1.4×10⁻⁸ 2.99×10⁴±1.1×10³ 3.11×10⁴±1.1×10³ 3.07×10⁴±1.1×10³ 3.11×10⁴±1.1×10³ 3.03×10⁴±1.1×10³ 3.98×10⁻⁶±1.8×10⁻⁸ 2.15×10⁴±2.5×10³ 2.25×10⁴±2.6×10³ 2.19×10⁴±2.6×10³ 2.22×10⁴±2.6×10³ 2.20×10⁴±2.6×10³ 5.01×10⁻⁶±2.3×10⁻⁸ 2.05×10⁴±1.5×10³ 2.10×10⁴±1.5×10³ 2.11×10⁴±1.5×10³ 2.13×10⁴±1.6×10³ 2.12×10⁴±1.6×10³ 6.31×10⁻⁶±2.9×10⁻⁸ 2.08×10⁴±1.1×10³ 2.10×10⁴±1.1×10³ 2.12×10⁴±1.1×10³ 2.09×10⁴±1.1×10³ 2.16×10⁴±1.2×10³ Continued on next page Table A2. The differential cross sections of the 10B(n, α)7Li reaction in the laboratory reference system.
En /MeV $\sigma _{{{{E\_{\rm{bin}}}}{,\theta }}}^0$ /(mb/sr)

78.8° 90.3° 101.2° 112.0° 122.7° 1.00×10⁻⁶±4.2×10⁻⁹ 3.08×10³±1.6×10² 3.17×10³±1.7×10² 3.02×10³±1.6×10² 3.18×10³±1.6×10² 3.20×10³±1.8×10² 1.26×10⁻⁶±5.4×10⁻⁹ 2.79×10³±1.3×10² 2.74×10³±1.3×10² 2.65×10³±1.3×10² 2.49×10³±1.2×10² 2.92×10³±1.4×10² 1.58×10⁻⁶±6.8×10⁻⁹ 2.15×10³±1.1×10² 1.96×10³±1.0×10² 2.14×10³±1.1×10² 1.98×10³±9.9×101 2.16×10³±1.1×10² 2.00×10⁻⁶±8.7×10⁻⁹ 1.97×10³±1.1×10² 1.85×10³±1.0×10² 1.84×10³±1.0×10² 1.98×10³±1.1×10² 1.90×10³±1.1×10² 2.51×10⁻⁶±1.1×10⁻⁸ 1.64×10³±1.1×10² 1.70×10³±1.1×10² 1.57×10³±1.0×10² 1.67×10³±1.1×10² 1.80×10³±1.2×10² 3.16×10⁻⁶±1.4×10⁻⁸ 1.95×10³±1.3×10² 2.00×10³±1.3×10² 1.89×10³±1.2×10² 1.73×10³±1.1×10² 1.94×10³±1.3×10² 3.98×10⁻⁶±1.8×10⁻⁸ 1.35×10³±2.0×10² 1.58×10³±2.2×10² 1.31×10³±1.9×10² 1.30×10³±1.8×10² 1.35×10³±2.0×10² 5.01×10⁻⁶±2.3×10⁻⁸ 1.25×10³±1.2×10² 1.22×10³±1.1×10² 1.29×10³±1.2×10² 1.29×10³±1.2×10² 1.28×10³±1.2×10² 6.31×10⁻⁶±2.9×10⁻⁸ 1.25×10³±9.7×101 1.24×10³±9.5×101 1.37×10³±1.0×10² 1.19×10³±9.2×101 1.35×10³±1.1×10² 7.94×10⁻⁶±3.7×10⁻⁸ 1.01×10³±2.2×10² 1.03×10³±2.3×10² 1.17×10³±2.5×10² 9.94×10²±2.2×10² 1.05×10³±2.3×10² 1.00×10⁻⁵±4.7×10⁻⁸ 1.04×10³±7.8×101 1.05×10³±7.6×101 1.02×10³±7.6×101 1.03×10³±7.5×101 1.10×10³±8.4×101 1.26×10⁻⁵±6.4×10⁻⁸ 9.36×10²±1.0×10² 9.84×10²±1.0×10² 8.60×10²±9.2×101 9.22×10²±9.7×101 1.07×10³±1.1×10² 1.58×10⁻⁵±8.6×10⁻⁸ 7.08×10²±1.1×10² 7.38×10²±1.2×10² 6.15×10²±1.0×10² 7.51×10²±1.2×10² 6.81×10²±1.1×10² 2.00×10⁻⁵±1.2×10⁻⁷ 5.65×10²±1.1×10² 5.38×10²±1.0×10² 5.75×10²±1.1×10² 5.45×10²±1.1×10² 6.38×10²±1.2×10² 2.51×10⁻⁵±1.6×10⁻⁷ 6.21×10²±6.0×101 6.97×10²±6.2×101 6.01×10²±5.6×101 6.01×10²±5.5×101 7.75×10²±7.1×101 3.16×10⁻⁵±2.1×10⁻⁷ 4.54×10²±1.0×10² 4.15×10²±9.4×101 4.40×10²±1.0×10² 4.32×10²±9.8×101 4.89×10²±1.1×10² 3.98×10⁻⁵±2.7×10⁻⁷ 4.07×10²±5.3×101 5.27×10²±6.1×101 5.02×10²±5.9×101 4.75×10²±5.6×101 4.90×10²±6.1×101 5.01×10⁻⁵±3.6×10⁻⁷ 4.11×10²±4.3×101 4.81×10²±4.7×101 4.72×10²±4.6×101 4.91×10²±4.7×101 4.35×10²±4.4×101 6.31×10⁻⁵±4.8×10⁻⁷ 2.79×10²±3.5×101 3.16×10²±3.8×101 3.69×10²±4.3×101 3.17×10²±3.8×101 3.49×10²±4.2×101 7.94×10⁻⁵±6.4×10⁻⁷ 3.04×10²±3.9×101 2.87×10²±3.5×101 3.46×10²±4.1×101 2.66×10²±3.3×101 3.34×10²±4.1×101 1.00×10⁻⁴±8.4×10⁻⁷ 2.68×10²±3.2×101 2.73×10²±3.0×101 3.08×10²±3.3×101 3.35×10²±3.5×101 3.17×10²±3.5×101 1.26×10⁻⁴±1.0×10⁻⁶ 2.53×10²±3.9×101 2.63×10²±3.6×101 3.42×10²±4.5×101 2.75×10²±3.8×101 2.35×10²±3.5×101 1.58×10⁻⁴±1.3×10⁻⁶ 2.30×10²±3.0×101 1.95×10²±2.3×101 2.70×10²±3.0×101 1.98×10²±2.4×101 2.26×10²±2.7×101 2.00×10⁻⁴±1.6×10⁻⁶ 2.29×10²±3.2×101 1.76×10²±2.3×101 1.77×10²±2.4×101 1.91×10²±2.4×101 2.12×10²±2.8×101 2.51×10⁻⁴±2.0×10⁻⁶ 1.78×10²±2.7×101 1.77×10²±2.2×101 2.06×10²±2.6×101 1.62×10²±2.1×101 1.91×10²±2.5×101 3.16×10⁻⁴±2.5×10⁻⁶ 2.28×10²±3.1×101 1.24×10²±1.7×101 1.25×10²±1.7×101 1.66×10²±2.0×101 1.74×10²±2.2×101 3.98×10⁻⁴±3.1×10⁻⁶ 1.82×10²±2.6×101 1.41×10²±1.7×101 1.46×10²±1.8×101 1.55×10²±1.8×101 2.03×10²±2.3×101 5.01×10⁻⁴±3.9×10⁻⁶ 1.26×10²±1.7×101 1.09×10²±1.2×101 1.29×10²±1.4×101 1.32×10²±1.4×101 1.27×10²±1.5×101 6.31×10⁻⁴±4.8×10⁻⁶ 7.23×101±1.2×101 8.99×101±1.0×101 8.78×101±1.0×101 1.08×10²±1.2×101 1.23×10²±1.3×101 7.94×10⁻⁴±6.1×10⁻⁶ 9.27×101±1.5×101 1.21×10²±1.3×101 1.01×10²±1.2×101 1.21×10²±1.3×101 8.99×101±1.2×101 1.00×10⁻³±7.7×10⁻⁶ 6.06×101±1.0×101 9.54×101±9.8×100 9.75×101±1.0×101 9.22×101±9.7×100 8.81×101±1.0×101 1.26×10⁻³±9.8×10⁻⁶ 5.13×101±9.4×100 8.21×101±8.7×100 6.73×101±7.9×100 1.05×10²±9.9×100 8.41×101±9.8×100 1.58×10⁻³±1.3×10⁻⁵ 5.74×101±9.2×100 7.19×101±7.6×100 7.16×101±7.7×100 5.43×101±6.4×100 8.05×101±8.9×100 2.00×10⁻³±1.6×10⁻⁵ 7.68×101±1.1×101 7.01×101±7.3×100 6.22×101±6.9×100 6.46×101±7.0×100 6.33×101±7.5×100 2.51×10⁻³±2.1×10⁻⁵ 7.30×101±1.2×101 6.14×101±7.6×100 4.63×101±6.7×100 7.00×101±8.3×100 6.19×101±8.4×100 3.16×10⁻³±2.7×10⁻⁵ 5.88×101±9.0×100 5.12×101±6.2×100 7.31×101±7.3×100 5.61×101±6.2×100 5.25×101±6.6×100 3.98×10⁻³±3.6×10⁻⁵ 5.01×101±8.1×100 5.60×101±6.1×100 3.76×101±4.9×100 3.91×101±5.0×100 4.42×101±5.9×100 5.01×10⁻³±4.8×10⁻⁵ 4.41×101±6.4×100 4.04×101±4.6×100 3.94×101±4.5×100 4.46×101±4.8×100 4.24×101±5.1×100 6.31×10⁻³±6.4×10⁻⁵ 2.28×101±5.0×100 3.08×101±4.0×100 3.82×101±4.6×100 4.21×101±4.8×100 2.98×101±4.3×100 Continued on next page Table A5. The differential cross sections of the 10B(n, α0)7Li reaction in the laboratory reference system.
En /MeV $\sigma _{{{{E\_{\rm{bin}}}}{,\theta }}}^{\rm{1}}$ /(mb/sr)

78.8° 90.3° 101.2° 112.0° 122.7° 1.00×10⁻⁶±4.2×10⁻⁹ 4.65×10⁴±2.0×10³ 4.77×10⁴±2.0×10³ 4.90×10⁴±2.3×10³ 4.77×10⁴±2.0×10³ 4.84×10⁴±2.2×10³ 1.26×10⁻⁶±5.4×10⁻⁹ 3.96×10⁴±1.2×10³ 4.12×10⁴±1.3×10³ 4.07×10⁴±1.3×10³ 4.07×10⁴±1.2×10³ 4.04×10⁴±1.3×10³ 1.58×10⁻⁶±6.8×10⁻⁹ 3.12×10⁴±1.0×10³ 3.19×10⁴±1.0×10³ 3.17×10⁴±1.0×10³ 3.15×10⁴±1.0×10³ 3.12×10⁴±1.0×10³ 2.00×10⁻⁶±8.7×10⁻⁹ 2.88×10⁴±1.0×10³ 2.98×10⁴±1.1×10³ 2.96×10⁴±1.1×10³ 2.99×10⁴±1.1×10³ 2.99×10⁴±1.1×10³ 2.51×10⁻⁶±1.1×10⁻⁸ 2.53×10⁴±1.2×10³ 2.53×10⁴±1.3×10³ 2.61×10⁴±1.3×10³ 2.52×10⁴±1.2×10³ 2.59×10⁴±1.3×10³ 3.16×10⁻⁶±1.4×10⁻⁸ 2.79×10⁴±1.1×10³ 2.91×10⁴±1.2×10³ 2.89×10⁴±1.2×10³ 2.93×10⁴±1.2×10³ 2.83×10⁴±1.2×10³ 3.98×10⁻⁶±1.8×10⁻⁸ 2.02×10⁴±2.5×10³ 2.09×10⁴±2.5×10³ 2.06×10⁴±2.5×10³ 2.09×10⁴±2.5×10³ 2.07×10⁴±2.5×10³ 5.01×10⁻⁶±2.3×10⁻⁸ 1.93×10⁴±1.5×10³ 1.98×10⁴±1.5×10³ 1.98×10⁴±1.5×10³ 2.00×10⁴±1.5×10³ 2.00×10⁴±1.5×10³ 6.31×10⁻⁶±2.9×10⁻⁸ 1.96×10⁴±1.1×10³ 1.98×10⁴±1.1×10³ 1.98×10⁴±1.1×10³ 1.97×10⁴±1.1×10³ 2.03×10⁴±1.2×10³ 7.94×10⁻⁶±3.7×10⁻⁸ 1.64×10⁴±3.4×10³ 1.64×10⁴±3.4×10³ 1.70×10⁴±3.6×10³ 1.66×10⁴±3.5×10³ 1.66×10⁴±3.5×10³ 1.00×10⁻⁵±4.7×10⁻⁸ 1.58×10⁴±7.0×10² 1.58×10⁴±6.9×10² 1.59×10⁴±7.0×10² 1.55×10⁴±6.9×10² 1.61×10⁴±7.3×10² 1.26×10⁻⁵±6.4×10⁻⁸ 1.37×10⁴±1.2×10³ 1.36×10⁴±1.2×10³ 1.37×10⁴±1.2×10³ 1.41×10⁴±1.3×10³ 1.42×10⁴±1.3×10³ 1.58×10⁻⁵±8.6×10⁻⁸ 1.06×10⁴±1.6×10³ 1.09×10⁴±1.6×10³ 1.10×10⁴±1.6×10³ 1.09×10⁴±1.6×10³ 1.14×10⁴±1.7×10³ 2.00×10⁻⁵±1.2×10⁻⁷ 8.72×10³±1.6×10³ 9.24×10³±1.7×10³ 8.99×10³±1.6×10³ 8.68×10³±1.6×10³ 9.10×10³±1.7×10³ 2.51×10⁻⁵±1.6×10⁻⁷ 1.00×10⁴±5.7×10² 1.01×10⁴±5.6×10² 1.01×10⁴±5.6×10² 1.00×10⁴±5.6×10² 9.92×10³±5.7×10² Continued on next page Table A8. The differential cross sections of the 10B(n, α1)7Li reaction in the laboratory reference system.
Measurements of differential and angle-integrated cross sections for the 10B(n, α)7Li reaction in the neutron energy range from 1.0 eV to 2.5 MeV
- Received Date: 2019-08-25
- Available Online: 2019-12-01
Abstract: Differential and angle-integrated cross sections for the 10B(n, α)7Li, 10B(n, α0) 7Li and 10B(n, α1) 7Li* reactions have been measured at CSNS Back-n white neutron source. Two enriched (90%) 10B samples 5.0 cm in diameter and ~85.0 μg/cm2 in thickness each with an aluminum backing were prepared, and back-to-back mounted at the sample holder. The charged particles were detected using the silicon-detector array of the Light-charged Particle Detector Array (LPDA) system. The neutron energy En was determined by TOF (time-of-flight) method, and the valid α events were extracted from the En-Amplitude two-dimensional spectrum. With 15 silicon detectors, the differential cross sections of α-particles were measured from 19.2° to 160.8°. Fitted with the Legendre polynomial series, the (n, α) cross sections were obtained through integration. The absolute cross sections were normalized using the standard cross sections of the 10B(n, α)7Li reaction in the 0.3 − 0.5 MeV neutron energy region. The measurement neutron energy range for the 10B(n, α)7Li reaction is 1.0 eV≤En < 2.5 MeV (67 energy points), and that for the 10B(n, α0) 7Li and 10B(n, α1) 7Li* reactions is 1.0 eV ≤ En < 1.0 MeV (59 energy points). The present results have been analyzed by the resonance reaction mechanism and the level structure of the 11B compound system, and compared with existing measurements and evaluations.


 Abstract
 HTML
HTML Reference
 Related
 PDF
PDF







 DownLoad: