


 Abstract
 HTML
HTML Reference
 Related
 PDF
PDF


-
In order to learn more about how the population of nuclear shells affects unique aspects of the decay of excited nuclear states, it is interesting to investigate the photodisintegration of nuclei located close to the Z = 50 closed proton shell. The yields of different channels of the photodisintegration of isotopes in comparison with the ratio of the numbers of neutrons and protons in the nuclei can highlight the mechanisms of excitation and decay of nuclear states in the energy region between 10 and 50 MeV.
Cadmium (Z = 48) and tellurium (Z = 52) isotopes are suitable for investigations, as they have several stable isotopes under natural conditions, which allows to obtain the dependence of the yields of various reactions on the number of neutrons in a nucleus. The main decay channels of the giant dipole resonance (GDR) are the emission of neutrons or protons. Currently, an extensive database of experimental data on the photoneutron reactions in the stable isotopes of the natural mixture of cadmium and tellurium [1−22] is available. Nevertheless, these data are currently incomplete and lack a proper explanation. The proton channel, despite a small cross section of the (γ,p) reaction, is interesting in connection with the isospin splitting of the GDR [23].
Natural cadmium consists of eight stable isotopes with the following mass numbers and isotopic abundances: 106Cd (1.25%), 108Cd (0.89%), 110Cd (12.49%), 111Cd (12.80%), 112Cd (24.13%), 113Cd (12.22%), 114Cd (28.73%), and 116Cd (7.49%). The photoneutron reaction cross sections σ(γ,n) + σ(γ, np) and σ(γ, 2n) as well as the total absorption cross section σ(γ, sn) = σ(γ,n) + σ(γ, np) + σ(γ, 2n) for a target from a natural mixture of cadmium isotopes were measured by using a beam of quasimonochromatic photons without separating the contributions from the reactions on individual isotopes [1]. The majority of photonuclear reaction data on cadmium isotopes have been obtained in experiments using bremsstrahlung photons. For example, the relative yields of multiparticle reactions on natural cadmium were studied using the end-point energy of 23 MeV [2, 3] and 55 MeV [4−6]; the flux-averaged cross section was determined using the end-point energies of 50 and 60 MeV [7]; isomeric ratios were determined using electron bremsstrahlung for the pairs 115m,gCd [7−15] and 104m,gAg [13].
Natural tellurium consists of eight stable isotopes with the following mass numbers and isotopic abundances: 120Te (0.09%), 122Te (2.55%), 123Te (0.89%), 124Te (4.74%), 125Te (7.07%), 126Te (18.84%), 128Te (31.74%), and 130Te (34.08%). Although all these isotopes can undergo photodisintegration via different reaction channels, only a few have been studied to date, such as photoneutron reactions [10−12,16−22]. The cross sections for the (γ, n) [22], (γ, n) + (γ, pn) [16] and (γ, 2n) + (γ, 2np) [16] reactions on the isotopes 120,124,126,128,130Te induced by bremsstrahlung photons and positron annihilation in flight were determined by detecting neutrons in the energy range of the γ quantum (8.03−26.46 MeV). Isomeric ratios have been measured for the pairs 119m,gTe [10, 17, 19, 20], 121m,gTe [10, 11, 19, 20], 123m,gTe [10, 18], 127m,gTe [11,19, 21], and 129m,gTe [10−12, 17,19, 21].
This study aimed to obtain new data on fundamental photonuclear reactions of cadmium and tellurium isotopes using a bremsstrahlung γ-radiation beam with energies between 10 and 23 MeV. We used TALYS-2.0 [24] and the combined model of photonucleon reactions (CMPR) [25] for simulations and the γ-activation method with bremsstrahlung photons from the electron accelerator to obtain our experimental data. Furthermore, the photoproton reaction product 111Ag is a prospective medicinal isotope [26−29]; thus, examining the reaction yields is beneficial for both research and practical applications.
This paper is organized as follows. Sec. II describes the experimental set-up and procedures. Sec. III outlines the data analysis methods. In Sec. IV, the results for Cd and Te isotopes are presented and discussed. Sec. V presents the conclusions. Appendix A presents the tabulated experimental results, whereas Appendix B examines the TALYS options and GDR isospin splitting.
-
In order to learn more about how the population of nuclear shells affects unique aspects of the decay of excited nuclear states, it is interesting to investigate the photodisintegration of nuclei located close to the Z = 50 closed proton shell. The yields of different channels of the photodisintegration of isotopes compared to the ratio of the numbers of neutrons and protons in nuclei can highlight the mechanisms of excitation and decay of nuclear states in the energy region between 10 and 50 MeV.
Cadmium (Z = 48) and tellurium (Z = 52) isotopes are convenient objects of investigation, since under natural conditions, there exist several stable isotopes, which allows to obtain the dependence of the yields of various reactions on the number of neutrons in a nucleus. The main decay channels of giant dipole resonance (GDR) are the emission of neutrons or protons. Currently, there is an extensive database of experimental data on photoneutron reactions in the stable isotopes of natural mixture of cadmium and tellurium [1-22]. Nevertheless, these data are not yet complete and properly explained. The proton channel, despite a small cross section of the (γ,p) reaction, is interesting in connection with isospin splitting of GDR [23].
Natural cadmium consists of eight stable isotopes with following mass numbers and isotopic abundances: 106Cd (1.25%), 108Cd (0.89%), 110Cd (12.49%), 111Cd (12.80%), 112Cd (24.13%), 113Cd (12.22%), 114Cd (28.73%) and 116Cd (7.49%). The photoneutron reaction cross sections σ(γ,n) + σ(γ, np) and σ(γ, 2n) as well as the total absorption cross section σ(γ, sn) = σ(γ,n) + σ(γ, np) + σ(γ, 2n) for a target from a natural mixture of cadmium isotopes were measured by using a beam of quasimonochromatic photons without separating the contributions from the reactions on individual isotopes [1]. Absolute majority of photonuclear reaction data on cadmium isotopes has been obtained in experiments using bremsstrahlung photons, namely, relative yields of multiparticle reactions on natural cadmium were studied using end-point energy of 23 MeV [2,3], 55 MeV [4-6], the flux-averaged cross section were determined using end-point energies of 50 and 60 MeV [7], isomeric ratios were determined using electron bremsstrahlung for pairs 115m,gCd [7-15] and 104m,gAg [13].
Natural tellurium consists of eight stable isotopes with following mass numbers and isotopic abundances: 120Te (0.09%), 122Te (2.55%), 123Te (0.89%), 124Te (4.74%), 125Te (7.07%), 126Te (18.84%), 128Te (31.74%) and 130Te (34.08%). Although all of these isotopes can undergo photodisintegration via different reaction channels, only a small number have been studied so far, namely, photoneutron reactions [10-12,16-22]. The cross sections for the (γ,n) [22], (γ,n) + (γ,pn) [16] and (γ,2n) + (γ,2np) [16] reactions on the isotopes 120,124,126,128,130Te induced by bremsstrahlung photons and positron annihilation in flight were determined by detecting neutrons in the energy range of γ quantum 8.03-26.46 MeV. Isomeric ratios have been measured for the pairs 119m,gTe [10,17,19,20], 121m,gTe [10,11,19,20], 123m,gTe [10,18], 127m,gTe [11,19,21] and 129m,gTe [10-12,17,19,21].
This work aims to obtain new data on fundamental photonuclear reactions on cadmium and tellurium isotopes using a bremsstrahlung γ-radiation beam with energies between 10 and 23 MeV. We used TALYS-2.0 [24] and combined model of photonucleon reactions (CMPR) [25] for simulations and the γ-activation method with bremsstrahlung photons from the electron accelerator to obtain our experimental data. Furthermore, the photoproton reaction product the 111Ag is prospective medicinal isotope [26-29]; thus, examining the reaction yields is a beneficial for both research and application.
The paper is organized as follows. In Sec. 2 the experimental set-up and procedures are described. In Sec. 3 the methods of data analysis are outlined. In Sec. 4, the results for Cd and Te isotopes are presented and discussed. In Sec. 5, the conclusions are drawn. In Appendix 1, the tabulated experimental results are presented. In Appendix 2, The TALYS options and GDR isospin splitting are inspected.
-
In order to learn more about how the population of nuclear shells affects unique aspects of the decay of excited nuclear states, it is interesting to investigate the photodisintegration of nuclei located close to the Z = 50 closed proton shell. The yields of different channels of the photodisintegration of isotopes in comparison with the ratio of the numbers of neutrons and protons in the nuclei can highlight the mechanisms of excitation and decay of nuclear states in the energy region between 10 and 50 MeV.
Cadmium (Z = 48) and tellurium (Z = 52) isotopes are suitable for investigations, as they have several stable isotopes under natural conditions, which allows to obtain the dependence of the yields of various reactions on the number of neutrons in a nucleus. The main decay channels of the giant dipole resonance (GDR) are the emission of neutrons or protons. Currently, an extensive database of experimental data on the photoneutron reactions in the stable isotopes of the natural mixture of cadmium and tellurium [1−22] is available. Nevertheless, these data are currently incomplete and lack a proper explanation. The proton channel, despite a small cross section of the (γ,p) reaction, is interesting in connection with the isospin splitting of the GDR [23].
Natural cadmium consists of eight stable isotopes with the following mass numbers and isotopic abundances: 106Cd (1.25%), 108Cd (0.89%), 110Cd (12.49%), 111Cd (12.80%), 112Cd (24.13%), 113Cd (12.22%), 114Cd (28.73%), and 116Cd (7.49%). The photoneutron reaction cross sections σ(γ,n) + σ(γ, np) and σ(γ, 2n) as well as the total absorption cross section σ(γ, sn) = σ(γ,n) + σ(γ, np) + σ(γ, 2n) for a target from a natural mixture of cadmium isotopes were measured by using a beam of quasimonochromatic photons without separating the contributions from the reactions on individual isotopes [1]. The majority of photonuclear reaction data on cadmium isotopes have been obtained in experiments using bremsstrahlung photons. For example, the relative yields of multiparticle reactions on natural cadmium were studied using the end-point energy of 23 MeV [2, 3] and 55 MeV [4−6]; the flux-averaged cross section was determined using the end-point energies of 50 and 60 MeV [7]; isomeric ratios were determined using electron bremsstrahlung for the pairs 115m,gCd [7−15] and 104m,gAg [13].
Natural tellurium consists of eight stable isotopes with the following mass numbers and isotopic abundances: 120Te (0.09%), 122Te (2.55%), 123Te (0.89%), 124Te (4.74%), 125Te (7.07%), 126Te (18.84%), 128Te (31.74%), and 130Te (34.08%). Although all these isotopes can undergo photodisintegration via different reaction channels, only a few have been studied to date, such as photoneutron reactions [10−12,16−22]. The cross sections for the (γ, n) [22], (γ, n) + (γ, pn) [16] and (γ, 2n) + (γ, 2np) [16] reactions on the isotopes 120,124,126,128,130Te induced by bremsstrahlung photons and positron annihilation in flight were determined by detecting neutrons in the energy range of the γ quantum (8.03−26.46 MeV). Isomeric ratios have been measured for the pairs 119m,gTe [10, 17, 19, 20], 121m,gTe [10, 11, 19, 20], 123m,gTe [10, 18], 127m,gTe [11,19, 21], and 129m,gTe [10−12, 17,19, 21].
This study aimed to obtain new data on fundamental photonuclear reactions of cadmium and tellurium isotopes using a bremsstrahlung γ-radiation beam with energies between 10 and 23 MeV. We used TALYS-2.0 [24] and the combined model of photonucleon reactions (CMPR) [25] for simulations and the γ-activation method with bremsstrahlung photons from the electron accelerator to obtain our experimental data. Furthermore, the photoproton reaction product 111Ag is a prospective medicinal isotope [26−29]; thus, examining the reaction yields is beneficial for both research and practical applications.
This paper is organized as follows. Sec. II describes the experimental set-up and procedures. Sec. III outlines the data analysis methods. In Sec. IV, the results for Cd and Te isotopes are presented and discussed. Sec. V presents the conclusions. Appendix A presents the tabulated experimental results, whereas Appendix B examines the TALYS options and GDR isospin splitting.
-
This experiment was conducted using the output electron beam of the MT-25 microtron [30]. The electron energies ranged from 10 to 23 MeV, with an energy step of 1 MeV. Table 1 lists the main experimental parameters. A tungsten radiator target, a common convertor material, was used to generate the γ-radiation. The tungsten target was thick enough (3 mm) to maximize the amount of photons in the energy range of the GDR, which dominates the photonuclear cross section between the nucleon separation threshold and 20−30 MeV. To eliminate the leftover electrons from the bremsstrahlung beam, a 30 mm thick aluminum absorber was positioned behind the tungsten converter. The Cd and Te targets were located perpendicular to the electron beam and 1 cm away from the converter. The target of natural cadmium had dimensions 10 mm×10 mm×0.5 mm (at 10−19 MeV) and 5 mm×5 mm×0.5 mm (at 20−23 MeV). The natural tellurium target in powder form was enclosed in aluminum foils in the form of a square envelope with sizes of 15 mm×15 mm×2 mm (at 10−15 MeV), 8 mm×8 mm×2 mm (at 16−19 MeV), and 6 mm×6 mm×2 mm (at 20−23 MeV).
Energy of electrons/MeV Mass of targets/mg Integral charge/mC Irradiation time/min Total measurement time of spectra/d natCd natTe natCd natTe natCd natTe natCd natTe 10 475 1050 50 (5) 30 (3) 97 100 1.8 3.9 11 448 1100 50 (5) 20 (2) 150 62 1.8 3.1 12 454 1010 50 (5) 10 (1) 125 32 1.8 3.8 13 451 1060 50 (5) 10 (1) 155 29 2.0 3.2 14 451 1080 30 (3) 4.0 (4) 175 50 1.6 3.6 15 414 1000 20 (2) 4.0 (4) 65 12 1.7 3.5 16 417 220 10 (1) 4.0 (4) 65 15 1.7 3.8 17 427 190 4.0 (4) 4.0 (4) 37 34 1.6 4.7 18 401 100 3.0 (3) 4.0 (4) 24 49 1.5 4.7 19 389 110 3.0 (3) 4.0 (4) 32 55 1.6 3.5 20 113 90 3.0 (3) 4.0 (4) 51 28 1.6 2.9 21 116 90 3.0 (3) 4.0 (4) 35 41 1.5 3.3 22 116 90 3.0 (3) 4.0 (4) 27 37 1.7 4.7 23 112 90 3.0 (3) 4.0 (4) 21 31 1.7 4.1 Table 1. Main parameters of the experiment.
In the trials, a bremsstrahlung flux generated in the tungsten converter was utilized to irradiate the metallic natural cadmium and tellurium samples. The fluctuations in the beam current were measured using a Faraday cup and calibrated ionization chamber in the beam, and subsequently recorded in a web-accessible database for future analysis by using LabView software and an analog-to-digital converter card. [31]. Along with the Faraday cup and ionization chamber, the beam current was determined by digitizing the electrical charge accumulated on the target. During irradiation, the electron current of the accelerator was measured using a Faraday cup. A 0.15-mm-thick copper monitor was positioned behind the irradiation target. The absolute value of the current was calculated by comparing the experimentally measured and theoretical yields at the monitor based on the 65Cu(γ, n)64Cu reaction. The experimental cross sections of the partial photoneutron reactions for the 65Cu nucleus, obtained on quasimonoenergetic annihilation photon beams [32] using the neutron multiplicity sorting method, display considerable systematic uncertainties and do not satisfy the specially introduced objective physical data reliability criteria. We applied the corrected theoretical cross sections, which were used to evaluate the cross sections of the partial reactions by employing the experimental-theoretical approach [33]. The yield of the 65Cu(γ, n)64Cu reaction was determined using the expected cross section [33], and the bremsstrahlung spectrum was generated using Geant4 [34].
Once the radiation levels in the experimental hall were safe, the targets were transferred to a different measurement room and the induced activity in the irradiated target was measured. We used a high purity germanium (HPGe) γ-detector with a resolution of 16 keV at 1332 keV, together with standard measurement electronics and a 16K ADC/MCA (Multiport II Multichannel Analyser, CANBERRA). The energy and efficiency of the HPGe detector were calibrated using standard γ-ray sources. A detailed explanation of the γ-activation measurement method used in this study can be found in Refs. [35, 36].
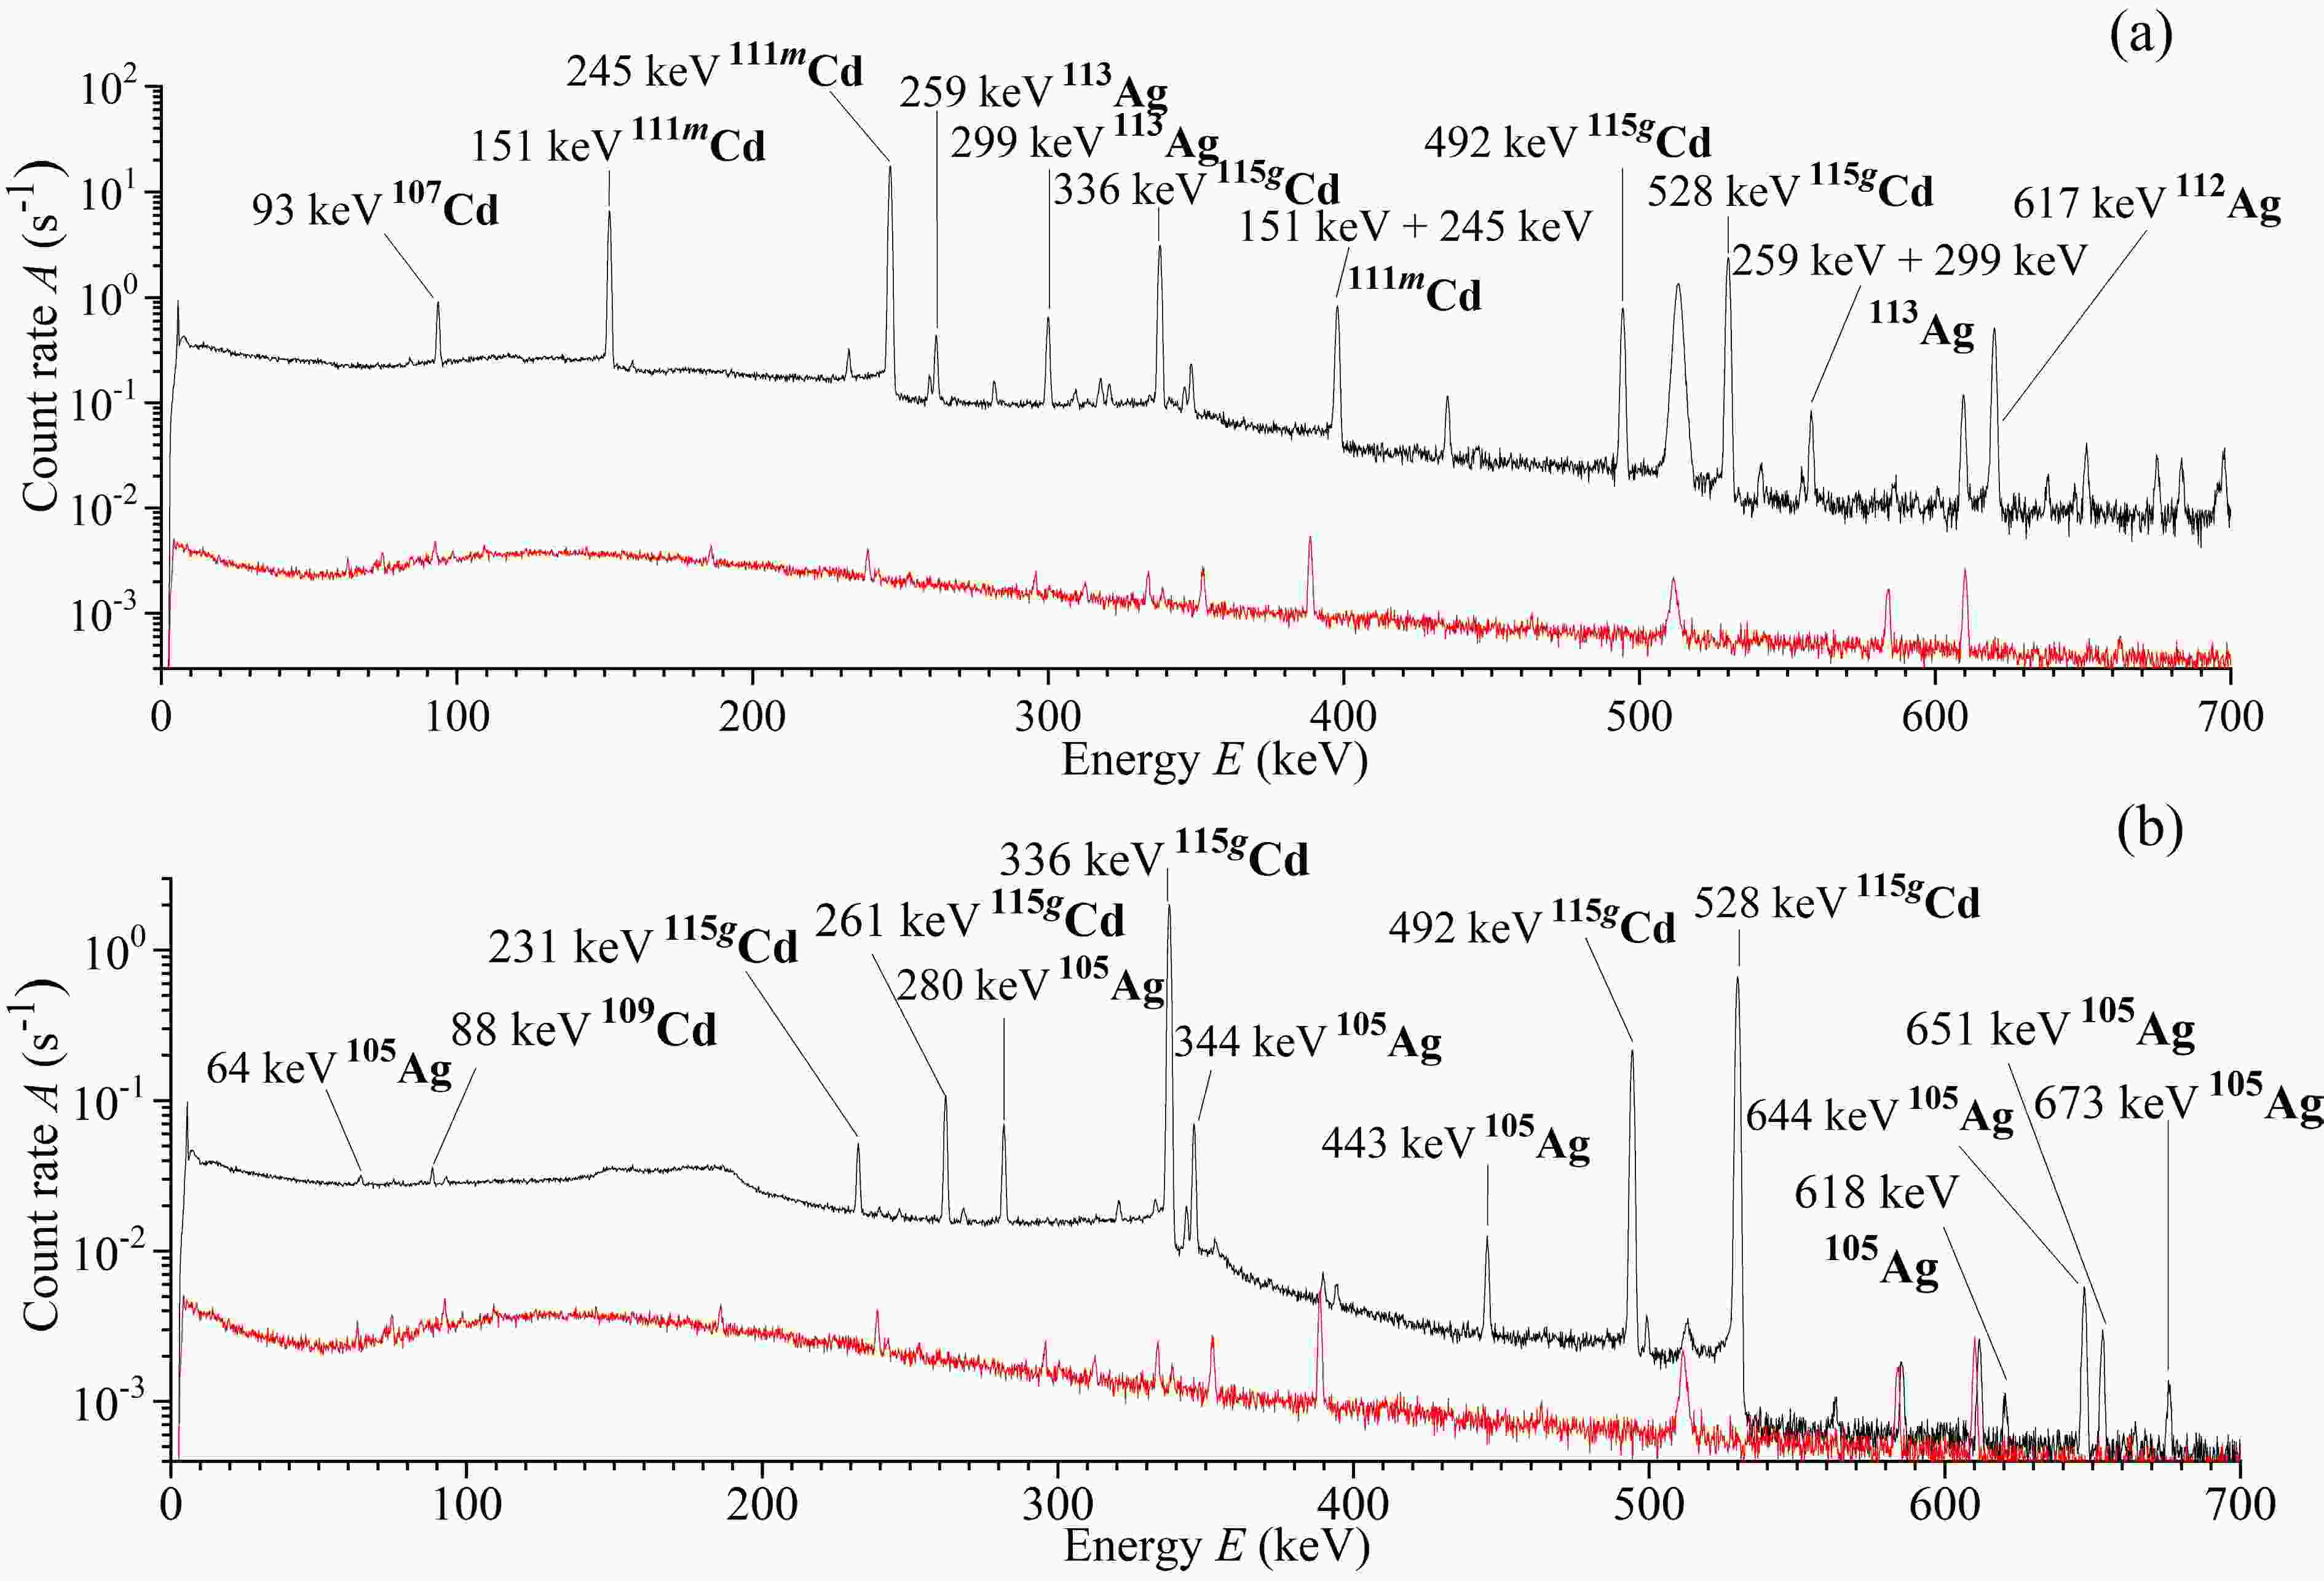
The duration between the end of the irradiation process and beginning of the measurement was between 10 and 15 min, designated as the cooling period. The spectra of each sample were taken many times over a total of 0.5, 1, 12, and 24 h. Fig. 1 and Fig. 2 display the typical γ-ray spectra of the chemical products generated from natCd and natTe, respectively. A background spectrum (red line) is also shown in Fig. 1. Bremsstrahlung radiation with an end-point energy of 23 MeV was used to irradiate the samples.
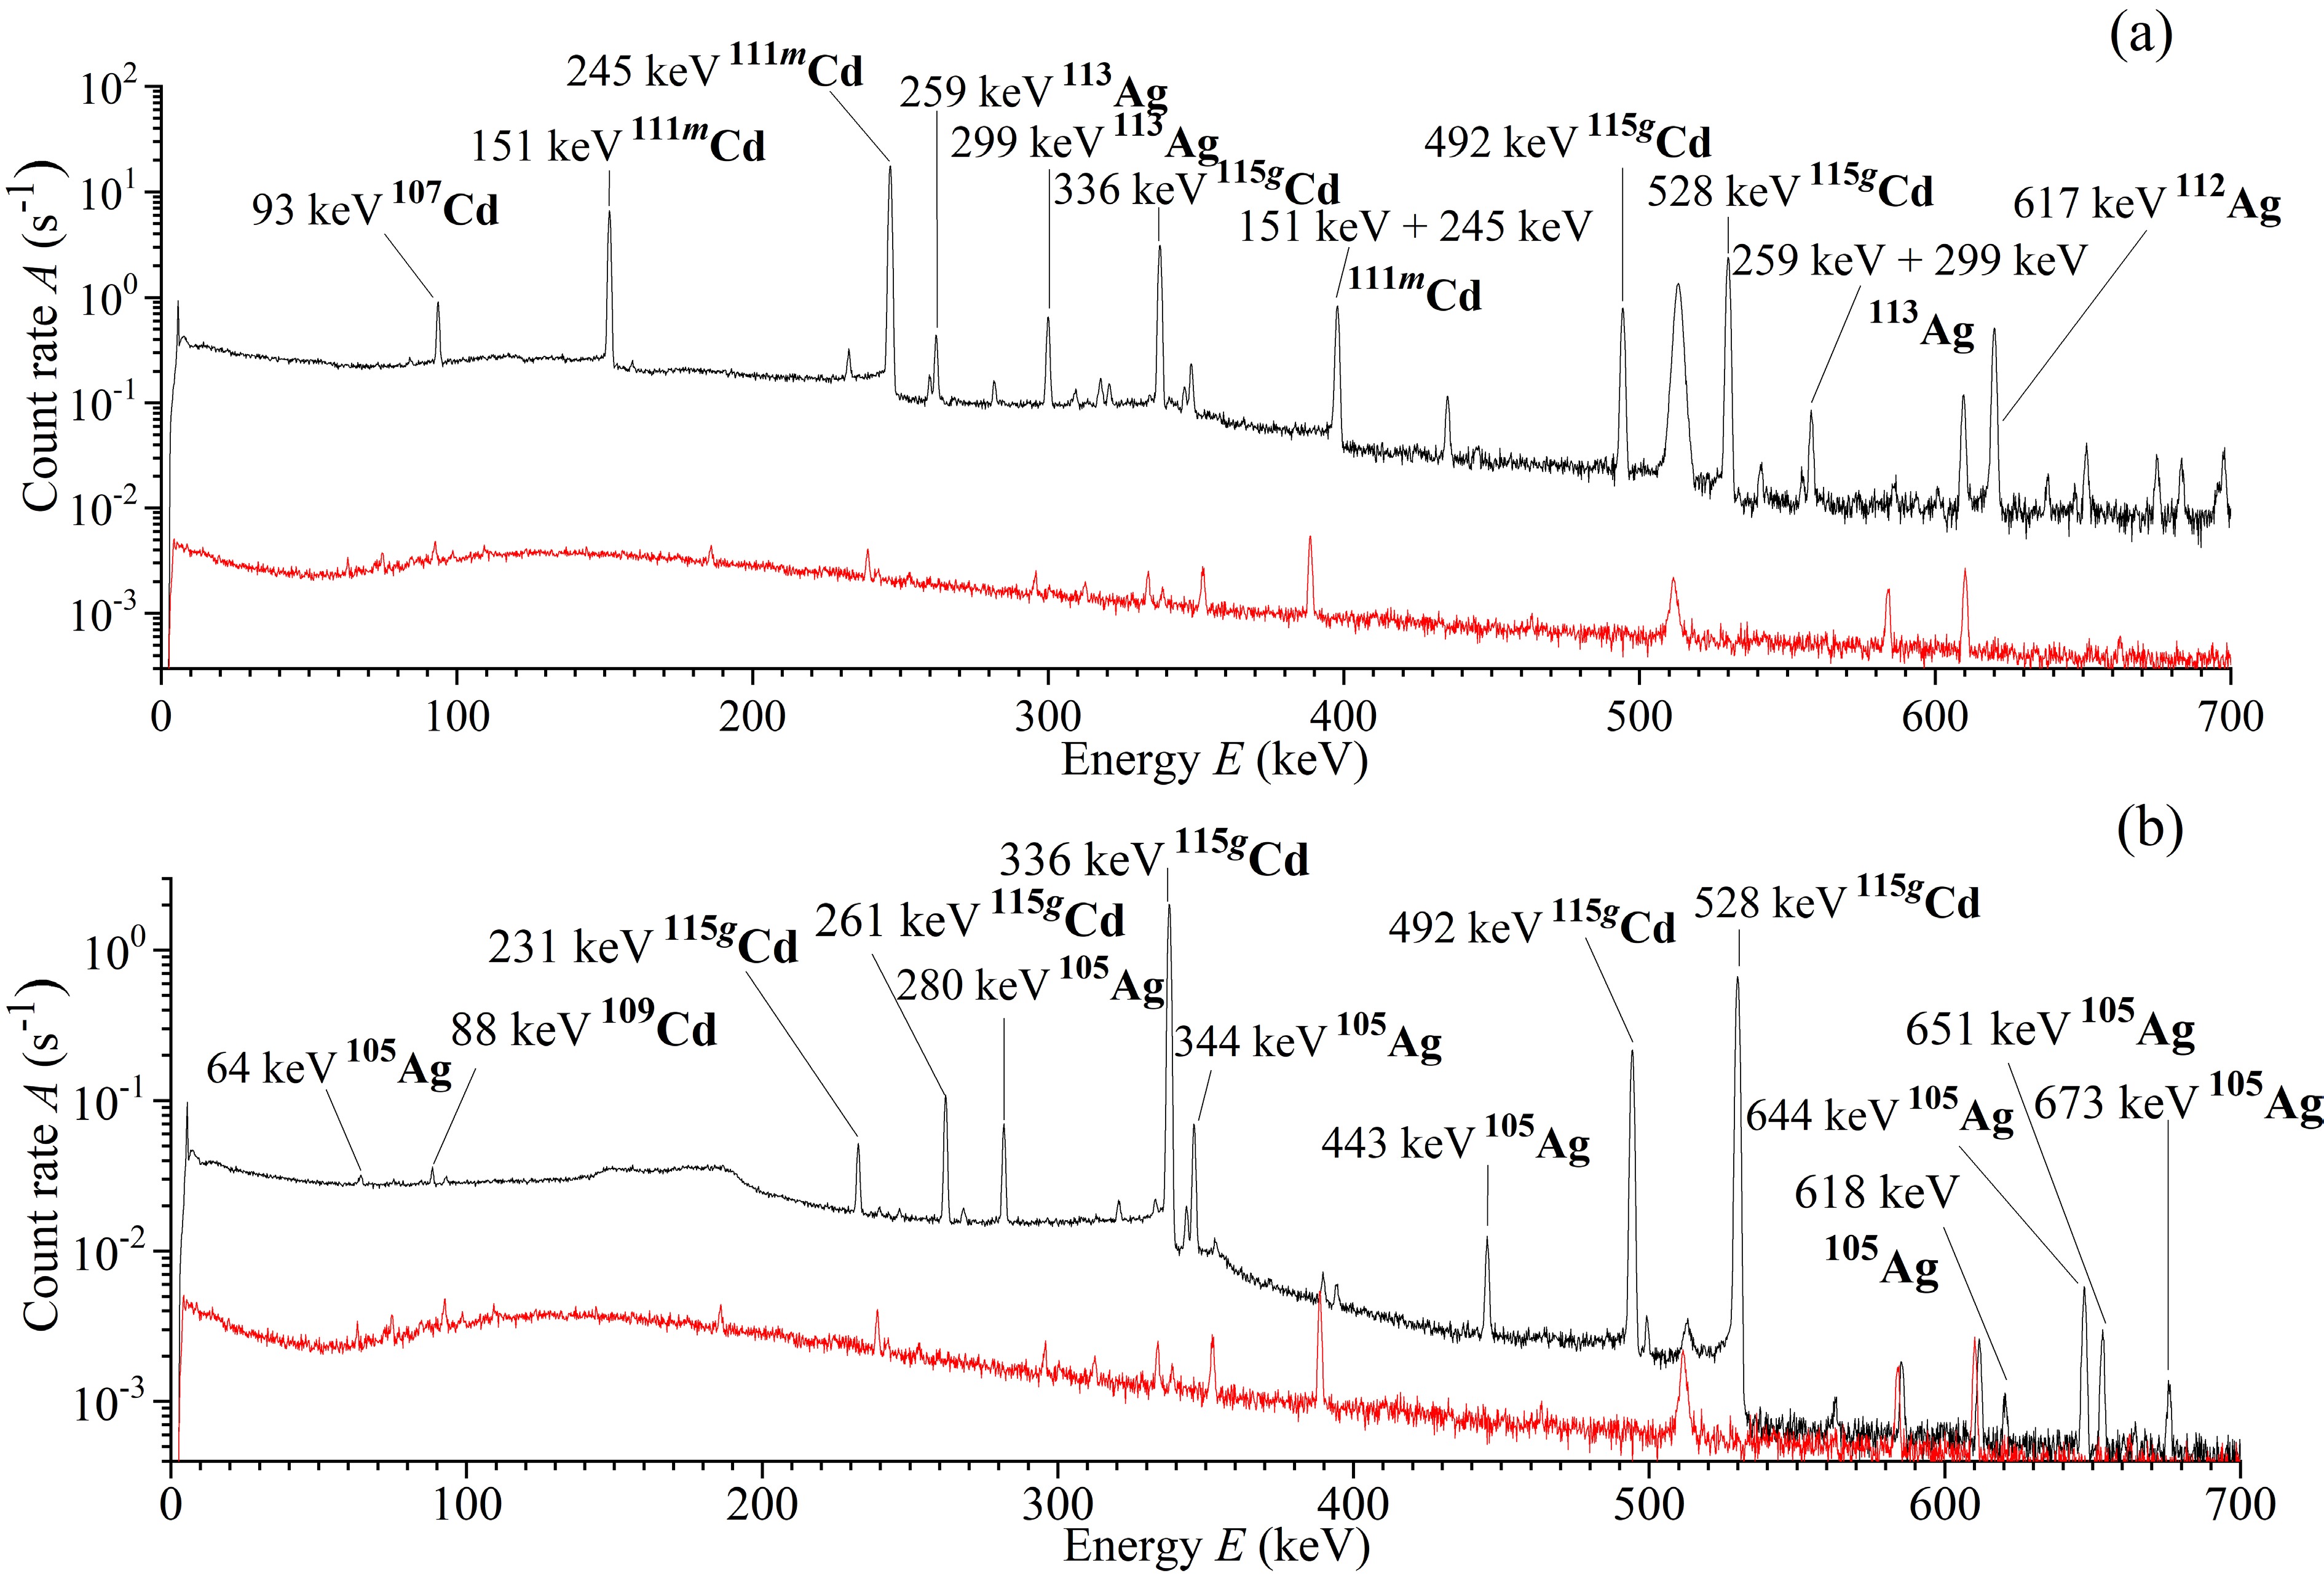
Figure 1. (color online) Spectra of residual activity of the irradiated sample of natCd (top-to-bottom) 3 h (a) and 4 days (b) after irradiation. The spectra measurement durations were 1 h (a) and 1 day (b), respectively.
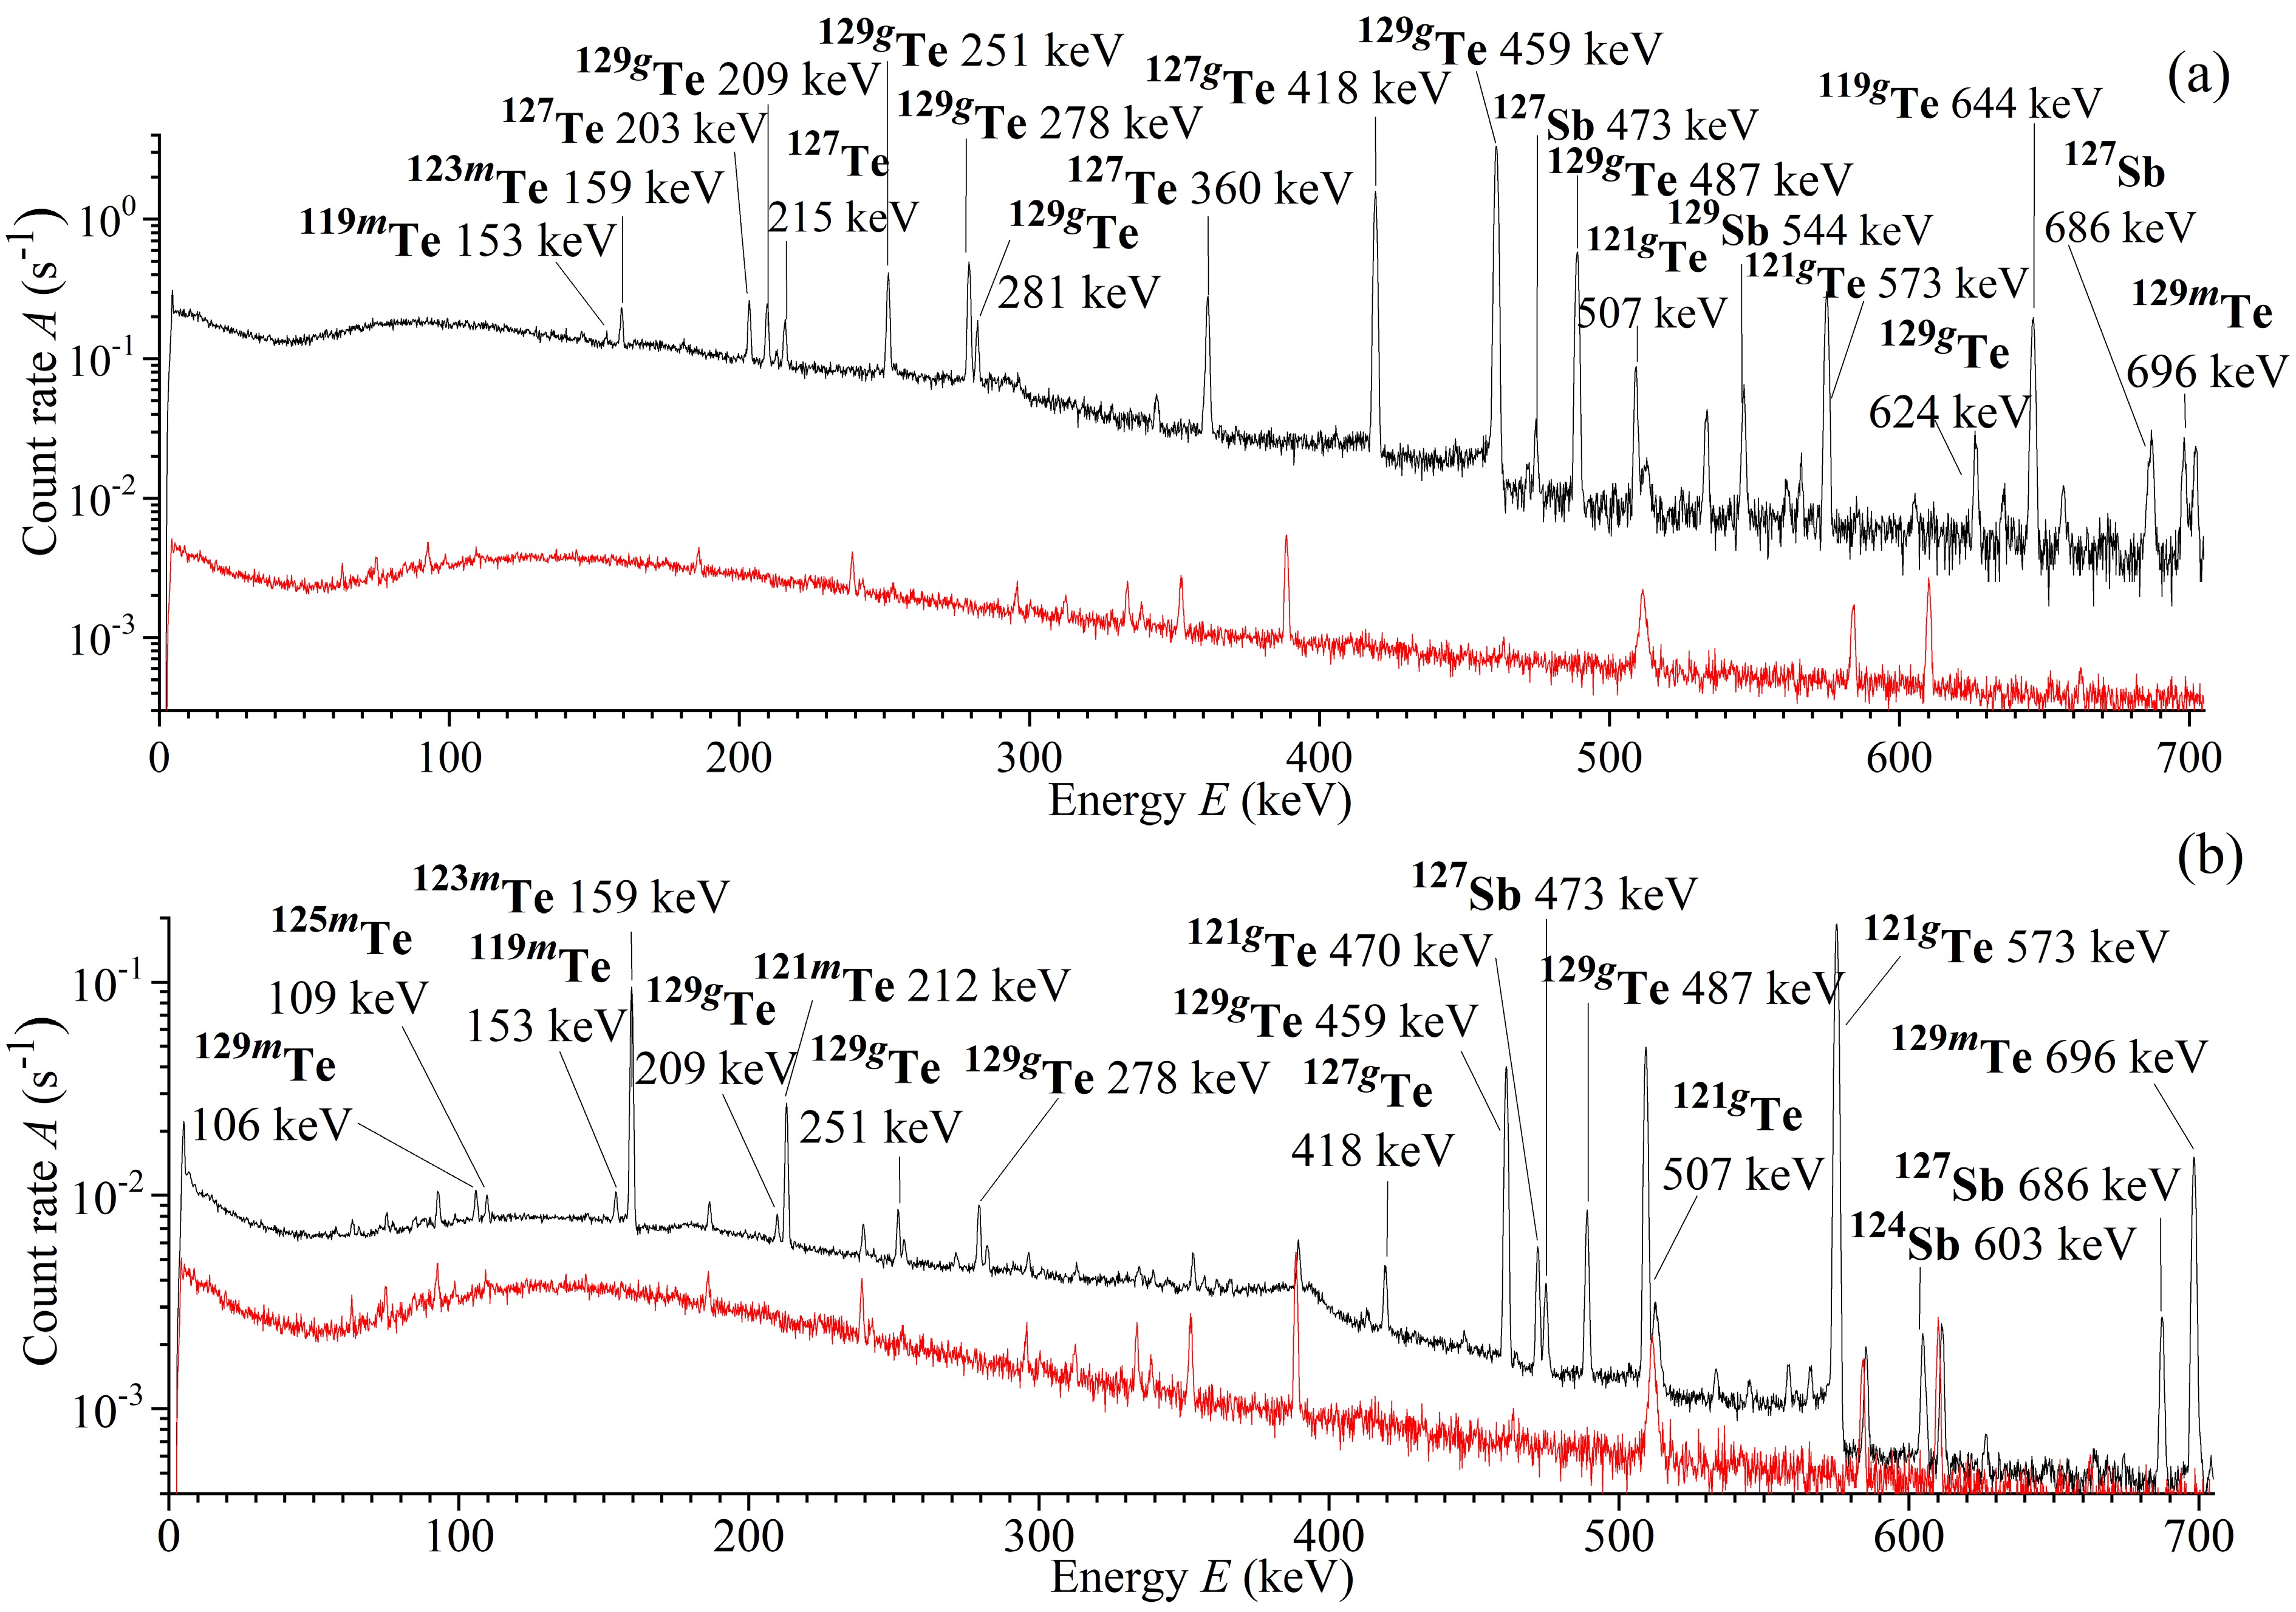
Figure 2. (color online) Spectra of residual activity of the irradiated sample of natTe (top-to-bottom) 6 h (a) and 11 days (b) after irradiation. The spectra measurement durations were 1 h (a) and 3 days (b), respectively.
The γ-ray spectra were processed using the DEIMOS32 code [37]. This code uses the Gaussian function to fit the count area of the full-energy peaks. The processed peaks were identified using the half-life of the residual nuclei, γ-ray energy, and intensity. The radionuclides were identified based on their different γ-ray energies and half-lives. Table 2 provides the key γ-ray energies and intensities used to compute the reaction product yield. The columns 4−5 in Table 2 contain the nuclear data from Ref. [38].
Nucleus Half-life T1/2 Decay mode (%) γ-ray energy Eγ/keV (Iγ (%)) Reaction Eth/MeV Data for irradiated cadmium target 105Cd 55.5 m EC 346.87 (4.2), 961.84 (4.69) 106Cd(γ, n) 10.9 107Cd 6.5 h EC 93.124 (4.7) 108Cd(γ, n) 10.3 109Cd 461.9 d EC 88.03 (3.644) 110Cd(γ, n)+
111Cd(γ, 2n)9.9
16.89111mCd 48.54 m IT 150.82 (29.1), 245.39 (94) 112Cd(γ, n)+
113Cd(γ, 2n)9.4
15.93115gCd 53.46 h β– 336.24 (46.02), 527.9 (27.45) 116Cd(γ, n) 8.7 115mCd 44.56 d β– 933.8 (2) 116Cd(γ, n) 8.9 105Ag 41.29 d EC 280.41 (30.2), 344.52 (41) 106Cd(γ, p) 7.4 111Ag 7.45 d β– 342.13 (6.7) 112Cd(γ, p)+
113Cd(γ, np)9.6
16.19112Ag 3.13 h β– 617.51 (43), 1387.68 (5.3) 113Cd(γ, p)+
114Cd(γ, np)9.7
18.76113Ag 5.37 h β– 298.6 (10) 114Cd(γ, p) 10.3 115Ag 20 m β– 229.1 (18) 116Cd(γ, p) 11 Data for irradiated tellurium target 119gTe 16.05 h EC 644.01 (84.1), 699.85 (10.1) 120Te(γ, n) 10.29 119mTe 4.7 d EC 153.59 (66), 1212.73 (66.1) 120Te(γ, n) 10.55 121gTe 19.17 d EC 573.14 (80.4) 122Te(γ, n)+
123Te(γ, 2n)9.83
16.76121mTe 164.2 d IT: 88.6
EC: 11.4212.19 (81.5) 122Te(γ, n)+
123Te(γ, 2n)10.12
17.05123mTe 119.2 d IT 159.0 (84.3) 123Te(γ, γ`)+
124Te(γ, n)+
125Te(γ, 2n)
9.67
16.24125mTe 57.4 d IT 109.28 (0.28) 125Te(γ, γ`)+
126Te(γ, n)
9.25127Te 9.35 h β– 417.9 (0.99) 128Te(γ, n) 8.78 129gTe 69.6 min β– 459.60 (7.7) 130Te(γ, n) 8.42 129mTe 33.6 d IT: 64
EC: 36695.88 (3.0) 130Te(γ, n) 8.52 122Sb 2.72 d β–:97.59
EC: 2.41564.24 (70.67) 123Te(γ, p)+
124Te(γ, np)8.13
17.55124Sb 60.2 d β– 602.72 (97.8), 1690.97 (47.57) 125Te(γ, p)+
126Te(γ, np)8.69
17.80127Sb 3.85 d β– 473.0 (25.8), 685.7 (36.8) 128Te(γ, p) 9.58 129Sb 4.366 h β– 812.97 (48.2), 914.96 (23.3) 130Te(γ, p) 10.01 Table 2. Spectroscopic data from Ref. [38] for the product nuclei from the photonuclear reactions on stable isotopes of cadmium and tellurium.
The half-lives of previously investigated radionuclides ranged from 20 min (115Ag) to 461.9 days (109Cd) as well as from 69.6 min (129gTe) to 164.2 days (121mTe). To compute the radioactive half-lives and select the appropriate spectra for the activity of each isotope, γ-ray spectra were collected over a range of waiting times, from minutes to a day, after irradiation. The activity is typically measured using the highest intensity, well-separated, interference-free, and correctable γ-ray.
-
This experiment was carried out using the MT-25 microtron's output electron beam [30]. The electron energies ranged from 10 to 23 MeV, with an energy step of 1 MeV. Table 1 lists the main parameters of the experiments. To generate γ-radiation, a tungsten radiator target, a common convertor material, was employed. The tungsten target was thick enough (3 mm) to maximise the amount of photons in the energy range of the giant dipole resonance (GDR), which dominates the photonuclear cross section between the nucleon separation threshold and 20-30 MeV. To eliminate the leftover electrons from the bremsstrahlung beam, a 30 mm thick aluminium absorber was positioned behind the tungsten converter. The Cd and Te targets were located perpendicular to the electron beam and 1 cm away from the converter. The target of natural cadmium had dimensions 10×10×0.5 mm (at 10–19 MeV) and 5×5×0.5 mm (at 20–23 MeV). The natural tellurium target in a form of a powder in an aluminium foil in the form of a square envelope with a size of 15×15×2 mm (at 10-15 MeV), 8×8×2 mm (at 16-19 MeV) and 6×6×2 mm (at 20-23 MeV).
Energy of electrons (MeV) Mass of targets (mg) Integral charge (mC) Irradiation time (min) Total measuring time of spectra (days) natCd natTe natCd natTe natCd natTe natCd natTe 10 475 1050 50 (5) 30 (3) 97 100 1.8 3.9 11 448 1100 50 (5) 20 (2) 150 62 1.8 3.1 12 454 1010 50 (5) 10 (1) 125 32 1.8 3.8 13 451 1060 50 (5) 10 (1) 155 29 2.0 3.2 14 451 1080 30 (3) 4.0 (4) 175 50 1.6 3.6 15 414 1000 20 (2) 4.0 (4) 65 12 1.7 3.5 16 417 220 10 (1) 4.0 (4) 65 15 1.7 3.8 17 427 190 4.0 (4) 4.0 (4) 37 34 1.6 4.7 18 401 100 3.0 (3) 4.0 (4) 24 49 1.5 4.7 19 389 110 3.0 (3) 4.0 (4) 32 55 1.6 3.5 20 113 90 3.0 (3) 4.0 (4) 51 28 1.6 2.9 21 116 90 3.0 (3) 4.0 (4) 35 41 1.5 3.3 22 116 90 3.0 (3) 4.0 (4) 27 37 1.7 4.7 23 112 90 3.0 (3) 4.0 (4) 21 31 1.7 4.1 Table 1. Main parameters of the experiments
In the trials, a bremsstrahlung flux generated in the tungsten converter was utilised to irradiate metallic natural cadmium and tellurium samples. The fluctuations in beam current were measured using a Faraday cup and a calibrated ionisation chamber in the beam, and then recorded into a web-accessible database for use in the study with LabView software and an analog-to-digital converter card. [31]. Along with the Faraday cup and ionisation chamber, the beam current was determined by digitising the electrical charge accumulated on the target. During irradiation, the electron current of the accelerator was measured using a Faraday cup. A 0.15-mm-thick copper monitor was positioned behind the irradiation target. The absolute value of the current was calculated by comparison of experimentally measured and theoretical yields at the monitor on the basis of the 65Cu(γ,n)64Cu reaction. The experimental cross sections of the partial photoneutron reactions for the 65Cu nucleus, obtained on quasimonoenergetic annihilation photon beams [32] using the neutron multiplicity sorting method display considerable systematic uncertainties and do not satisfy the specially introduced objective physical data reliability criteria. We used the corrected theoretical cross sections which were used to evaluate the cross sections of the partial reactions using their experimental-theoretical approach [33]. The yield of the 65Cu(γ,n)64Cu reaction was determined using the expected cross section [33], and the bremsstrahlung spectrum was generated using Geant4 [34].
Once the radiation levels in the experimental hall were safe, the targets were transferred to a different measurement room and the induced activity in the irradiated target was measured. We used a high purity germanium (HPGe) γ-detector with a resolution of 16 keV at 1332 keV, together with standard measurement electronics and a 16K ADC/MCA (Multiport II Multichannel Analyser, CANBERRA). The energy and efficiency of the HPGe detector were calibrated using standard γ-ray sources. A thorough explanation of the γ-activation measurement method used in this study can be found in [35,36].
The duration that elapsed between the end of the irradiation process and the beginning of the measurement was between 10 and 15 minutes, designated as the cooling period. The spectra of each sample were taken many times over a total of 0.5, 1, 12, and 24 hours. Fig. 1 and Fig. 2 display typical γ-ray spectra of the chemical products generated from the natCd and natTe, respectively. A background spectrum (red line) is also shown in Fig. 1. Bremsstrahlung radiation with end-point energy of 23 MeV was used to irradiate the samples.
Figure 1. (color online) Spectra of residual activity of the irradiated sample of natCd (top-to-bottom) 3 h (a) and 4 days (b) after irradiation. The spectra measurement duration was 1 h (a) and 1 day (b), respectively
Figure 2. (color online) Spectra of residual activity of the irradiated sample of natTe (top-to-bottom) 6 h (a) and 11 days (b) after irradiation. The spectra measurement duration was 1 h (a) and 3 days (b), respectively
The γ-ray spectra were processed using the DEIMOS32 code [37]. This code uses the Gaussian function to fit the count area of full-energy peaks. The processed peaks were identified using the half-life of residual nuclei, γ-ray energy, and intensity. The radionuclides were identified based on their different γ-ray energies and half-lives. Table 2 provides the key γ-ray energies and intensities used to compute the reaction product yield. Table 2's columns 4-5 contain nuclear data from Ref. [38].
Nucleus Half-life T1/2 Decay mode (%) γ-ray energy Eγ (keV) (Iγ (%)) Reaction Eth (MeV) Data for irradiated cadmium target 105Cd 55.5 m EC 346.87 (4.2), 961.84 (4.69) 106Cd(γ,n) 10.9 107Cd 6.5 h EC 93.124 (4.7) 108Cd(γ,n) 10.3 109Cd 461.9 d EC 88.03 (3.644) 110Cd(γ,n)+
111Cd(γ,2n)9.9
16.89111mCd 48.54 m IT 150.82 (29.1), 245.39 (94) 112Cd(γ,n)+
113Cd(γ,2n)9.4
15.93115gCd 53.46 h β– 336.24 (46.02), 527.9 (27.45) 116Cd(γ,n) 8.7 115mCd 44.56 d β– 933.8 (2) 116Cd(γ,n) 8.9 105Ag 41.29 d EC 280.41 (30.2), 344.52 (41) 106Cd(γ,p) 7.4 111Ag 7.45 d β– 342.13 (6.7) 112Cd(γ,p)+
113Cd(γ,np)9.6
16.19112Ag 3.13 h β– 617.51 (43), 1387.68 (5.3) 113Cd(γ,p)+
114Cd(γ,np)9.7
18.76113Ag 5.37 h β– 298.6 (10) 114Cd(γ,p) 10.3 115Ag 20 m β– 229.1 (18) 116Cd(γ,p) 11 Data for irradiated tellurium target 119gTe 16.05 h EC 644.01 (84.1), 699.85 (10.1) 120Te(γ,n) 10.29 119mTe 4.7 d EC 153.59 (66), 1212.73 (66.1) 120Te(γ,n) 10.55 121gTe 19.17 d EC 573.14 (80.4) 122Te(γ,n)+
123Te(γ,2n)9.83
16.76121mTe 164.2 d IT: 88.6
EC: 11.4212.19 (81.5) 122Te(γ,n)+
123Te(γ,2n)10.12
17.05123mTe 119.2 d IT 159.0 (84.3) 123Te(γ,γ`)+
124Te(γ,n)+
125Te(γ,2n)
9.67
16.24125mTe 57.4 d IT 109.28 (0.28) 125Te(γ,γ`)+
126Te(γ,n)
9.25127Te 9.35 h β– 417.9 (0.99) 128Te(γ,n) 8.78 129gTe 69.6 min β– 459.60 (7.7) 130Te(γ,n) 8.42 129mTe 33.6 d IT: 64
EC: 36695.88 (3.0) 130Te(γ,n) 8.52 122Sb 2.72 d β–:97.59
EC: 2.41564.24 (70.67) 123Te(γ,p)+
124Te(γ,np)8.13
17.55124Sb 60.2 d β– 602.72 (97.8), 1690.97 (47.57) 125Te(γ,p)+
126Te(γ,np)8.69
17.80127Sb 3.85 d β– 473.0 (25.8), 685.7 (36.8) 128Te(γ,p) 9.58 129Sb 4.366 h β– 812.97 (48.2), 914.96 (23.3) 130Te(γ,p) 10.01 Table 2. Spectroscopic data from ref. [38] for the product nuclei from the photonuclear reactions on stable isotopes of cadmium and tellurium
The half-lives of previously investigated radionuclides ranged from 20 min (115Ag) to 461.9 days (109Cd) as well as from 69.6 min (129gTe) to 164.2 days (121mTe). To compute radioactive half-lives and select appropriate spectra for each isotope's activity, γ-ray spectra were collected throughout a range of waiting times, from minutes to a day after irradiation. The activity is typically measured using the highest intensity, well-separated, interference-free, and correctable γ-ray.
-
This experiment was conducted using the output electron beam of the MT-25 microtron [30]. The electron energies ranged from 10 to 23 MeV, with an energy step of 1 MeV. Table 1 lists the main experimental parameters. A tungsten radiator target, a common convertor material, was used to generate the γ-radiation. The tungsten target was thick enough (3 mm) to maximize the amount of photons in the energy range of the GDR, which dominates the photonuclear cross section between the nucleon separation threshold and 20−30 MeV. To eliminate the leftover electrons from the bremsstrahlung beam, a 30 mm thick aluminum absorber was positioned behind the tungsten converter. The Cd and Te targets were located perpendicular to the electron beam and 1 cm away from the converter. The target of natural cadmium had dimensions 10 mm×10 mm×0.5 mm (at 10−19 MeV) and 5 mm×5 mm×0.5 mm (at 20−23 MeV). The natural tellurium target in powder form was enclosed in aluminum foils in the form of a square envelope with sizes of 15 mm×15 mm×2 mm (at 10−15 MeV), 8 mm×8 mm×2 mm (at 16−19 MeV), and 6 mm×6 mm×2 mm (at 20−23 MeV).
Energy of electrons/MeV Mass of targets/mg Integral charge/mC Irradiation time/min Total measurement time of spectra/d natCd natTe natCd natTe natCd natTe natCd natTe 10 475 1050 50 (5) 30 (3) 97 100 1.8 3.9 11 448 1100 50 (5) 20 (2) 150 62 1.8 3.1 12 454 1010 50 (5) 10 (1) 125 32 1.8 3.8 13 451 1060 50 (5) 10 (1) 155 29 2.0 3.2 14 451 1080 30 (3) 4.0 (4) 175 50 1.6 3.6 15 414 1000 20 (2) 4.0 (4) 65 12 1.7 3.5 16 417 220 10 (1) 4.0 (4) 65 15 1.7 3.8 17 427 190 4.0 (4) 4.0 (4) 37 34 1.6 4.7 18 401 100 3.0 (3) 4.0 (4) 24 49 1.5 4.7 19 389 110 3.0 (3) 4.0 (4) 32 55 1.6 3.5 20 113 90 3.0 (3) 4.0 (4) 51 28 1.6 2.9 21 116 90 3.0 (3) 4.0 (4) 35 41 1.5 3.3 22 116 90 3.0 (3) 4.0 (4) 27 37 1.7 4.7 23 112 90 3.0 (3) 4.0 (4) 21 31 1.7 4.1 Table 1. Main parameters of the experiment.
In the trials, a bremsstrahlung flux generated in the tungsten converter was utilized to irradiate the metallic natural cadmium and tellurium samples. The fluctuations in the beam current were measured using a Faraday cup and calibrated ionization chamber in the beam, and subsequently recorded in a web-accessible database for future analysis by using LabView software and an analog-to-digital converter card. [31]. Along with the Faraday cup and ionization chamber, the beam current was determined by digitizing the electrical charge accumulated on the target. During irradiation, the electron current of the accelerator was measured using a Faraday cup. A 0.15-mm-thick copper monitor was positioned behind the irradiation target. The absolute value of the current was calculated by comparing the experimentally measured and theoretical yields at the monitor based on the 65Cu(γ, n)64Cu reaction. The experimental cross sections of the partial photoneutron reactions for the 65Cu nucleus, obtained on quasimonoenergetic annihilation photon beams [32] using the neutron multiplicity sorting method, display considerable systematic uncertainties and do not satisfy the specially introduced objective physical data reliability criteria. We applied the corrected theoretical cross sections, which were used to evaluate the cross sections of the partial reactions by employing the experimental-theoretical approach [33]. The yield of the 65Cu(γ, n)64Cu reaction was determined using the expected cross section [33], and the bremsstrahlung spectrum was generated using Geant4 [34].
Once the radiation levels in the experimental hall were safe, the targets were transferred to a different measurement room and the induced activity in the irradiated target was measured. We used a high purity germanium (HPGe) γ-detector with a resolution of 16 keV at 1332 keV, together with standard measurement electronics and a 16K ADC/MCA (Multiport II Multichannel Analyser, CANBERRA). The energy and efficiency of the HPGe detector were calibrated using standard γ-ray sources. A detailed explanation of the γ-activation measurement method used in this study can be found in Refs. [35, 36].
The duration between the end of the irradiation process and beginning of the measurement was between 10 and 15 min, designated as the cooling period. The spectra of each sample were taken many times over a total of 0.5, 1, 12, and 24 h. Fig. 1 and Fig. 2 display the typical γ-ray spectra of the chemical products generated from natCd and natTe, respectively. A background spectrum (red line) is also shown in Fig. 1. Bremsstrahlung radiation with an end-point energy of 23 MeV was used to irradiate the samples.
Figure 1. (color online) Spectra of residual activity of the irradiated sample of natCd (top-to-bottom) 3 h (a) and 4 days (b) after irradiation. The spectra measurement durations were 1 h (a) and 1 day (b), respectively.
Figure 2. (color online) Spectra of residual activity of the irradiated sample of natTe (top-to-bottom) 6 h (a) and 11 days (b) after irradiation. The spectra measurement durations were 1 h (a) and 3 days (b), respectively.
The γ-ray spectra were processed using the DEIMOS32 code [37]. This code uses the Gaussian function to fit the count area of the full-energy peaks. The processed peaks were identified using the half-life of the residual nuclei, γ-ray energy, and intensity. The radionuclides were identified based on their different γ-ray energies and half-lives. Table 2 provides the key γ-ray energies and intensities used to compute the reaction product yield. The columns 4−5 in Table 2 contain the nuclear data from Ref. [38].
Nucleus Half-life T1/2 Decay mode (%) γ-ray energy Eγ/keV (Iγ (%)) Reaction Eth/MeV Data for irradiated cadmium target 105Cd 55.5 m EC 346.87 (4.2), 961.84 (4.69) 106Cd(γ, n) 10.9 107Cd 6.5 h EC 93.124 (4.7) 108Cd(γ, n) 10.3 109Cd 461.9 d EC 88.03 (3.644) 110Cd(γ, n)+
111Cd(γ, 2n)9.9
16.89111mCd 48.54 m IT 150.82 (29.1), 245.39 (94) 112Cd(γ, n)+
113Cd(γ, 2n)9.4
15.93115gCd 53.46 h β– 336.24 (46.02), 527.9 (27.45) 116Cd(γ, n) 8.7 115mCd 44.56 d β– 933.8 (2) 116Cd(γ, n) 8.9 105Ag 41.29 d EC 280.41 (30.2), 344.52 (41) 106Cd(γ, p) 7.4 111Ag 7.45 d β– 342.13 (6.7) 112Cd(γ, p)+
113Cd(γ, np)9.6
16.19112Ag 3.13 h β– 617.51 (43), 1387.68 (5.3) 113Cd(γ, p)+
114Cd(γ, np)9.7
18.76113Ag 5.37 h β– 298.6 (10) 114Cd(γ, p) 10.3 115Ag 20 m β– 229.1 (18) 116Cd(γ, p) 11 Data for irradiated tellurium target 119gTe 16.05 h EC 644.01 (84.1), 699.85 (10.1) 120Te(γ, n) 10.29 119mTe 4.7 d EC 153.59 (66), 1212.73 (66.1) 120Te(γ, n) 10.55 121gTe 19.17 d EC 573.14 (80.4) 122Te(γ, n)+
123Te(γ, 2n)9.83
16.76121mTe 164.2 d IT: 88.6
EC: 11.4212.19 (81.5) 122Te(γ, n)+
123Te(γ, 2n)10.12
17.05123mTe 119.2 d IT 159.0 (84.3) 123Te(γ, γ`)+
124Te(γ, n)+
125Te(γ, 2n)
9.67
16.24125mTe 57.4 d IT 109.28 (0.28) 125Te(γ, γ`)+
126Te(γ, n)
9.25127Te 9.35 h β– 417.9 (0.99) 128Te(γ, n) 8.78 129gTe 69.6 min β– 459.60 (7.7) 130Te(γ, n) 8.42 129mTe 33.6 d IT: 64
EC: 36695.88 (3.0) 130Te(γ, n) 8.52 122Sb 2.72 d β–:97.59
EC: 2.41564.24 (70.67) 123Te(γ, p)+
124Te(γ, np)8.13
17.55124Sb 60.2 d β– 602.72 (97.8), 1690.97 (47.57) 125Te(γ, p)+
126Te(γ, np)8.69
17.80127Sb 3.85 d β– 473.0 (25.8), 685.7 (36.8) 128Te(γ, p) 9.58 129Sb 4.366 h β– 812.97 (48.2), 914.96 (23.3) 130Te(γ, p) 10.01 Table 2. Spectroscopic data from Ref. [38] for the product nuclei from the photonuclear reactions on stable isotopes of cadmium and tellurium.
The half-lives of previously investigated radionuclides ranged from 20 min (115Ag) to 461.9 days (109Cd) as well as from 69.6 min (129gTe) to 164.2 days (121mTe). To compute the radioactive half-lives and select the appropriate spectra for the activity of each isotope, γ-ray spectra were collected over a range of waiting times, from minutes to a day, after irradiation. The activity is typically measured using the highest intensity, well-separated, interference-free, and correctable γ-ray.
-
The experimental yields of the reactions, Yexp, were normalized to one electron of the accelerated beam incident on the bremsstrahlung target and calculated using the following formula:
$ Y\mathrm{_{exp}}=\frac{S_p\cdot C_{\mathrm{abs}}}{\varepsilon\cdot I_{\gamma}}\frac{t_{\mathrm{real}}}{t_{\mathrm{live}}}\frac{1}{N}\frac{1}{N_e}\frac{\mathrm{e}^{\lambda\cdot t_{\mathrm{cool}}}}{(1-\mathrm{e}^{-\lambda\cdot t_{\mathrm{real}}})}\frac{\lambda\cdot t\mathrm{_{irr}}}{(1-\mathrm{e}^{-\lambda\cdot t\mathrm{_{irr}}})},~~~~~ $
(1) where
$ {S}_{p} $ is the full-energy-peak area;$ \varepsilon $ is the full-energy-peak detector efficiency;$ {I}_{\gamma } $ is the γ- emission probability;$ C\mathrm{_{abs}} $ is the correction for self-absorption of γ-rays in the sample;$ t\mathrm{_{real}} $ and$ t\mathrm{_{live}} $ are the real time and live time of the measurement, respectively;$ N $ is the number of atoms in the activation sample;$ {N}_{e} $ is the integral number of incident electrons;$ \lambda $ is the decay constant;$ t\mathrm{_{cool}} $ is the cooling time; and$ t\mathrm{_{irr}} $ is the irradiation time.The experiment determined the yields Ytheor of the photonuclear reactions, which reflect the convolution of the photonuclear reaction cross section σi(E), and distribution density of the number of bremsstrahlung photons over the energy per electron of the accelerator W(E, Eγmax). The outcome of measuring the yield of isotope generation in all possible reactions on a natural mixture of isotopes is as follows:
$ {Y}_{\mathrm{theor}}({E}_{\gamma \mathrm{max}})=\sum \limits_{i}{\eta }_{i}\int \limits_{{E}_{i\mathrm{th}}}^{{E}_{\gamma \mathrm{max}}}{\sigma }_{i}\left(E\right)W\left(E,{E}_{\gamma \mathrm{max}}\right)\mathrm{d}E, $
(2) where Eγmax is the kinetic energy of the electrons hitting the tungsten radiator, E is the energy of bremsstrahlung photons produced on the radiator, Eth is the threshold of the studied photonuclear reaction, ηi is the percentage of the studied isotope in the natural mixture, and the index i corresponds to the number of reactions contributing to the production of the studied isotope.
Figure 3 illustrates the distribution density of the number of bremsstrahlung photons W(E, Eγmax) per electron of the accelerator for accelerated electron energies from 10 to 23 MeV, determined using Geant4 for the bremsstrahlung target made of tungsten with a thickness of 3 mm.
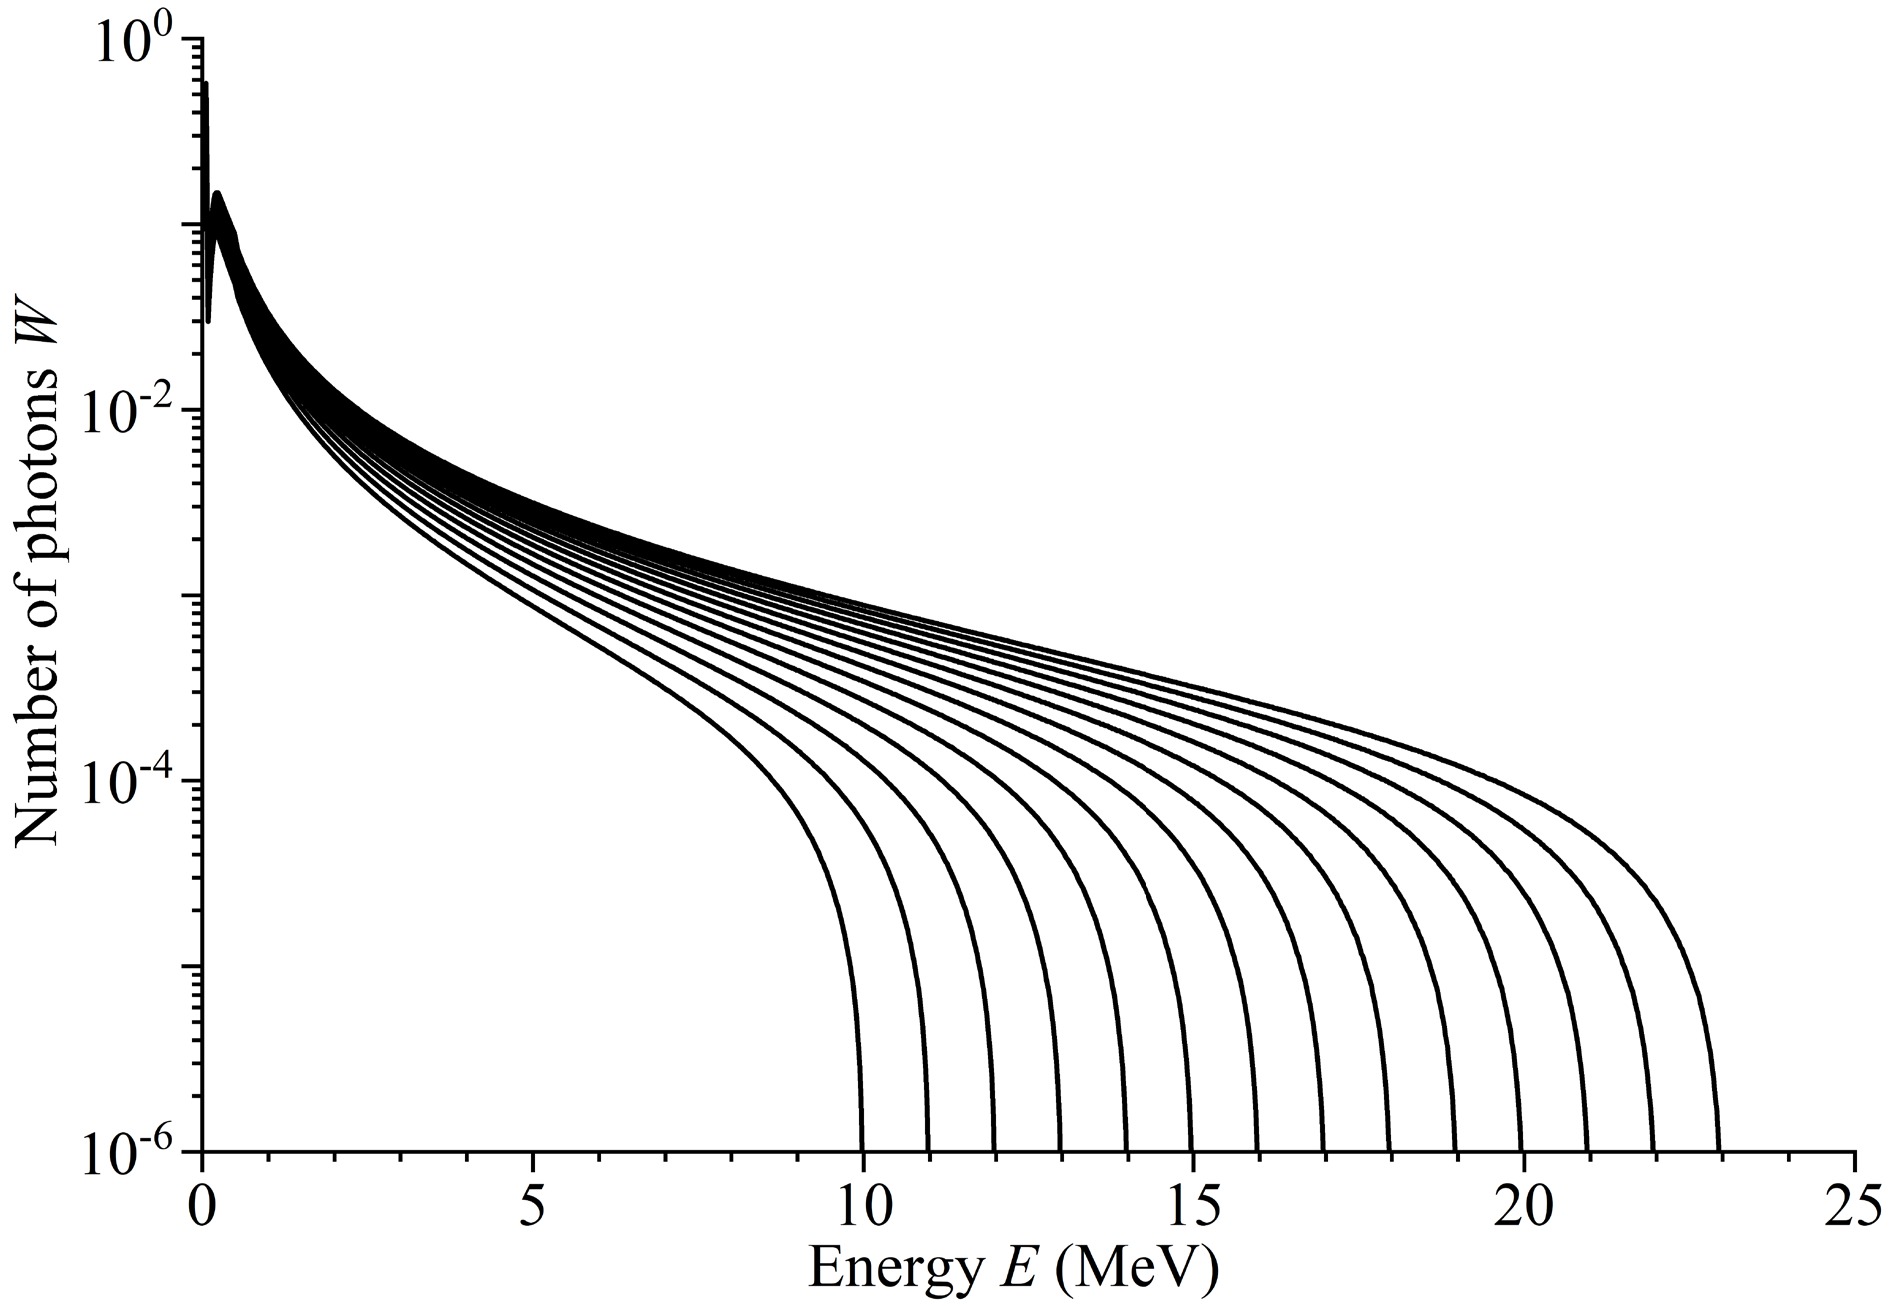
Figure 3. Distribution density of the number of bremsstrahlung photons at the energies of 10−23 MeV
The total and partial cross sections σ(E) of the photonuclear reactions on the cadmium and tellurium isotopes were estimated for monochromatic photons using the TALYS code [24] with standard parameters and CMPR [25]. The TALYS program examines all processes in the nucleus and transitions between the states. As a result, it is possible to calculate not only the total cross section of a photonuclear reaction but also the cross sections of reactions involving the production of certain states, particularly isomeric states. The standard (default) TALYS option uses the Simple Modified Lorentzian (SMLO) model for photon strength functions (PSFs). This model is used to calculate E1, M1, and upbend components, generally providing more accurate, temperature-dependent resonance shapes than those achieved with older models.
When compared with TALYS, the CMPR accurately considers the GDR isospin splitting, which is crucial for describing the proton decay channel. The basics of the GDR isospin splitting and some relevant CMPR results are presented in Appendix B. This Appendix also provides information on TALYS options as well as examples of comparison between the TALYS and CMPR results.
The yield measurement for a natural mixture of isotopes yields gives the amount of isotope produced in all potential reactions on the natural mixture. The primary problem of bremsstrahlung beam experiments is that the yield of photonuclear reaction depends on both the investigated cross section of the reaction σi(E) and the form of the bremsstrahlung spectrum W(E, Eγmax), which is often known with inadequate accuracy. The use of relative yields allows us to determine the dependency of the yield of photonuclear reactions on the maximal energy of bremsstrahlung under various experimental settings. The overall photon absorption cross section is not taken into account when calibrating the yield of one of the most likely reactions. The the most probable and well-studied 116Cd(γ, n)115Cd and 130Te(γ, n)129Te reactions were chosen as a primary reaction in case of cadmium and tellurium, respectively. In addition, there are no other channels (for example, (γ, 2n) reaction on heavier stable nuclei) for the product formation of 115Cd and 129Te, as the nuclei 116Cd and 130Te are the heaviest stable nuclei in the natural mixture of Cd and Te.
The theoretical values of the relative yields can be calculated using the following formula:
$ {Y}_{\mathrm{rel}}{(E}_{\gamma \mathrm{max}})=\frac{\displaystyle\sum \limits_{i}{\eta }_{i} \displaystyle\int\nolimits_{{E}_{\mathrm{th}}}^{{E}_{\gamma \mathrm{max}}}{\sigma }_{i}\left(E\right)W\left(E,{E}_{\gamma \mathrm{max}}\right) \mathrm{d}E}{\eta \displaystyle\int\nolimits_{{E}_{\mathrm{th}}}^{{E}_{\gamma \mathrm{max}}}{\sigma }_{(\gamma ,n)}\left(E\right)W\left(E,{E}_{\gamma \mathrm{max}}\right) \mathrm{d}E},~~~~~ $
(3) where η denotes the percentages of the 116Cd and 130Te isotopes in the natural mixture of cadmium and tellurium isotopes, respectively. Owing to the assumption regarding the unchanged shape of the bremsstrahlung spectrum, the bremsstrahlung spectrum W(E, Eγmax) can be replaced by the photon production cross section σ(E, Eγmax) calculated using the Seltzer-Berger tables [39].
$ {Y}_{\mathrm{rel}}{(E}_{\gamma \mathrm{max}})=\frac{\displaystyle\sum \limits_{i}{\eta }_{i}\displaystyle\int\nolimits_{{E}_{\mathrm{th}}}^{{E}_{\gamma \mathrm{max}}}{\sigma }_{i}\left(E\right)\sigma \left(E,{E}_{\gamma \mathrm{max}}\right)\mathrm{d}E}{\eta \displaystyle\int\nolimits_{{E}_{\mathrm{th}}}^{{E}_{\gamma \mathrm{max}}}{\sigma }_{(\gamma ,n)}\left(E\right)\sigma \left(E,{E}_{\gamma \mathrm{max}}\right)\mathrm{d}E}.~~~~~ $
(4) To represent the experimental photonuclear reaction data, the cross section per equivalent quantum σq, determined by the following expression, is used:
$ \sigma_q(E_{\mathrm{\gamma max}})=\frac{\displaystyle\int\nolimits_{E_{\mathrm{th}}}^{E_{\mathrm{\gamma max}}}\sigma\left(E\right)\sigma\left(E,E_{\mathrm{\gamma max}}\right)\mathrm{d}E}{\dfrac{1}{E_{\mathrm{\gamma max}}}\displaystyle\int\nolimits_0^{E_{\mathrm{\gamma max}}}E\cdot\sigma\left(E,E_{\mathrm{\gamma max}}\right)\mathrm{d}E}. $
(5) The cross section per equivalent quantum for a natural mixture of isotopes includes all possible channels of the final isotope production, where the percentage of initial nuclei is accounted for as follows:
$ \sigma_q^{\mathrm{nat}}(E\mathrm{_{\gamma max}})=\frac{\displaystyle\sum\limits_{i=1}^8\eta_i \displaystyle\int\nolimits_{E_{\mathrm{th}}}^{E_{\mathrm{\gamma max}}}\sigma_i\left(E\right)\sigma\left(E,E_{\mathrm{\gamma max}}\right)\mathrm{d}E}{\dfrac{1}{E\mathrm{_{\gamma max}}}\displaystyle\int\nolimits_0^{E_{\mathrm{\gamma max}}}E\cdot\sigma\left(E,E_{\mathrm{\gamma max}}\right)\mathrm{d}E}. $
(6) The experimental points along the cross sections of the (γ, n) [22] and (γ, n) + (γ, pn) [16] reactions on the isotopes 120,128,130Te were approximated by the Lorentz function, and the relative yields Yrel and cross sections per equivalent quantum σq were calculated based on the least squares approximation. In Figs. 4−10, these points are indicated by open circles [22] and open rectangles [16], respectively.
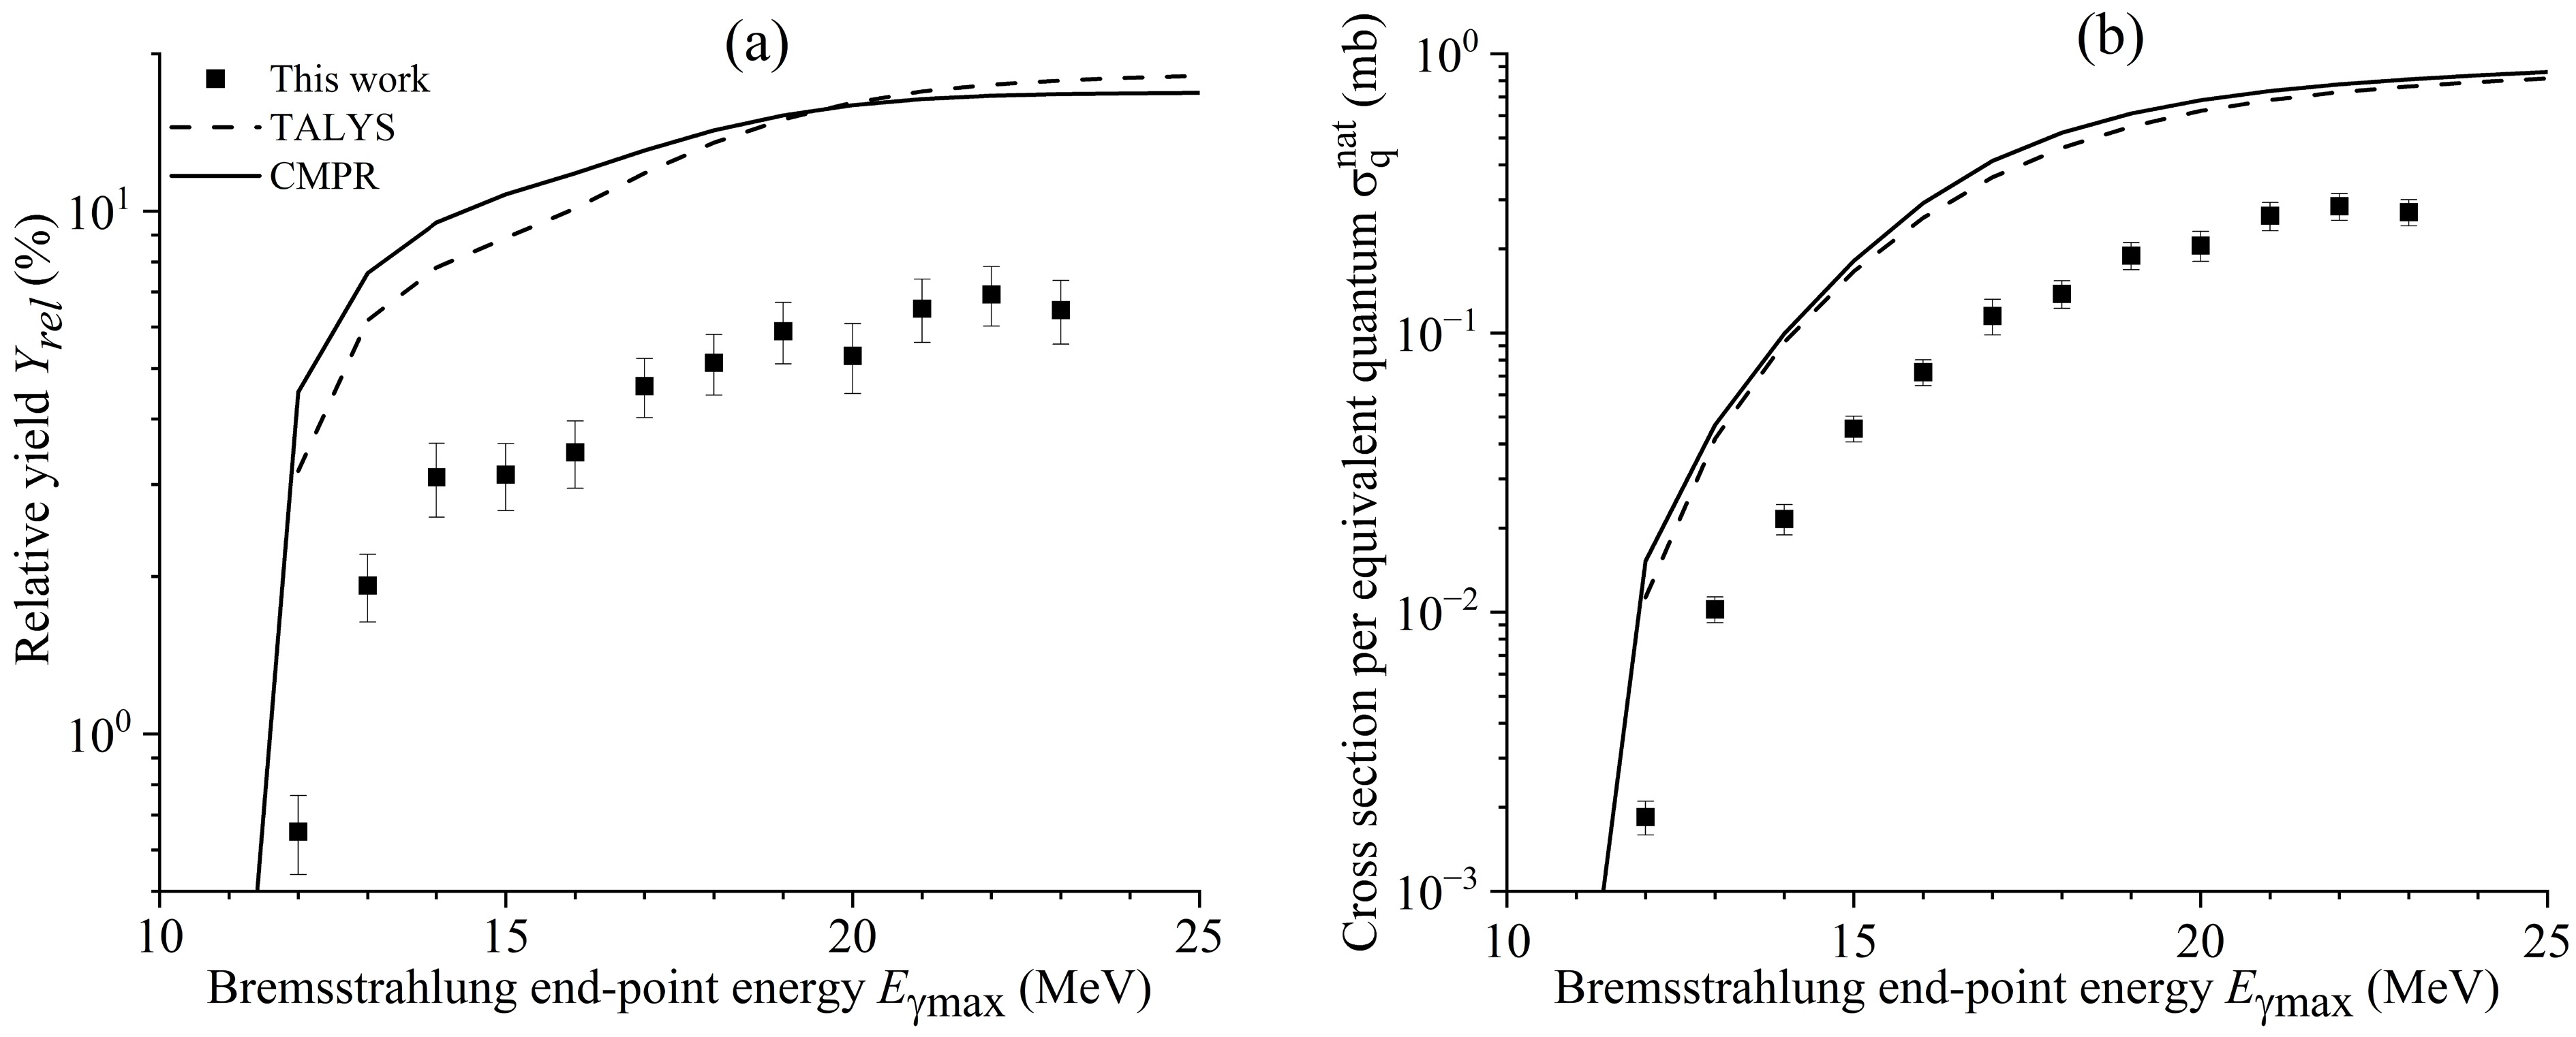
Figure 4. Relative yields (a) and cross section per equivalent quantum (b) of reaction 106Cd(γ, n)105Cd as functions of the bremsstrahlung end-point energy from this study (solid rectangles) and simulated values using the CMPR (solid lines) and TALYS code (dashed lines).
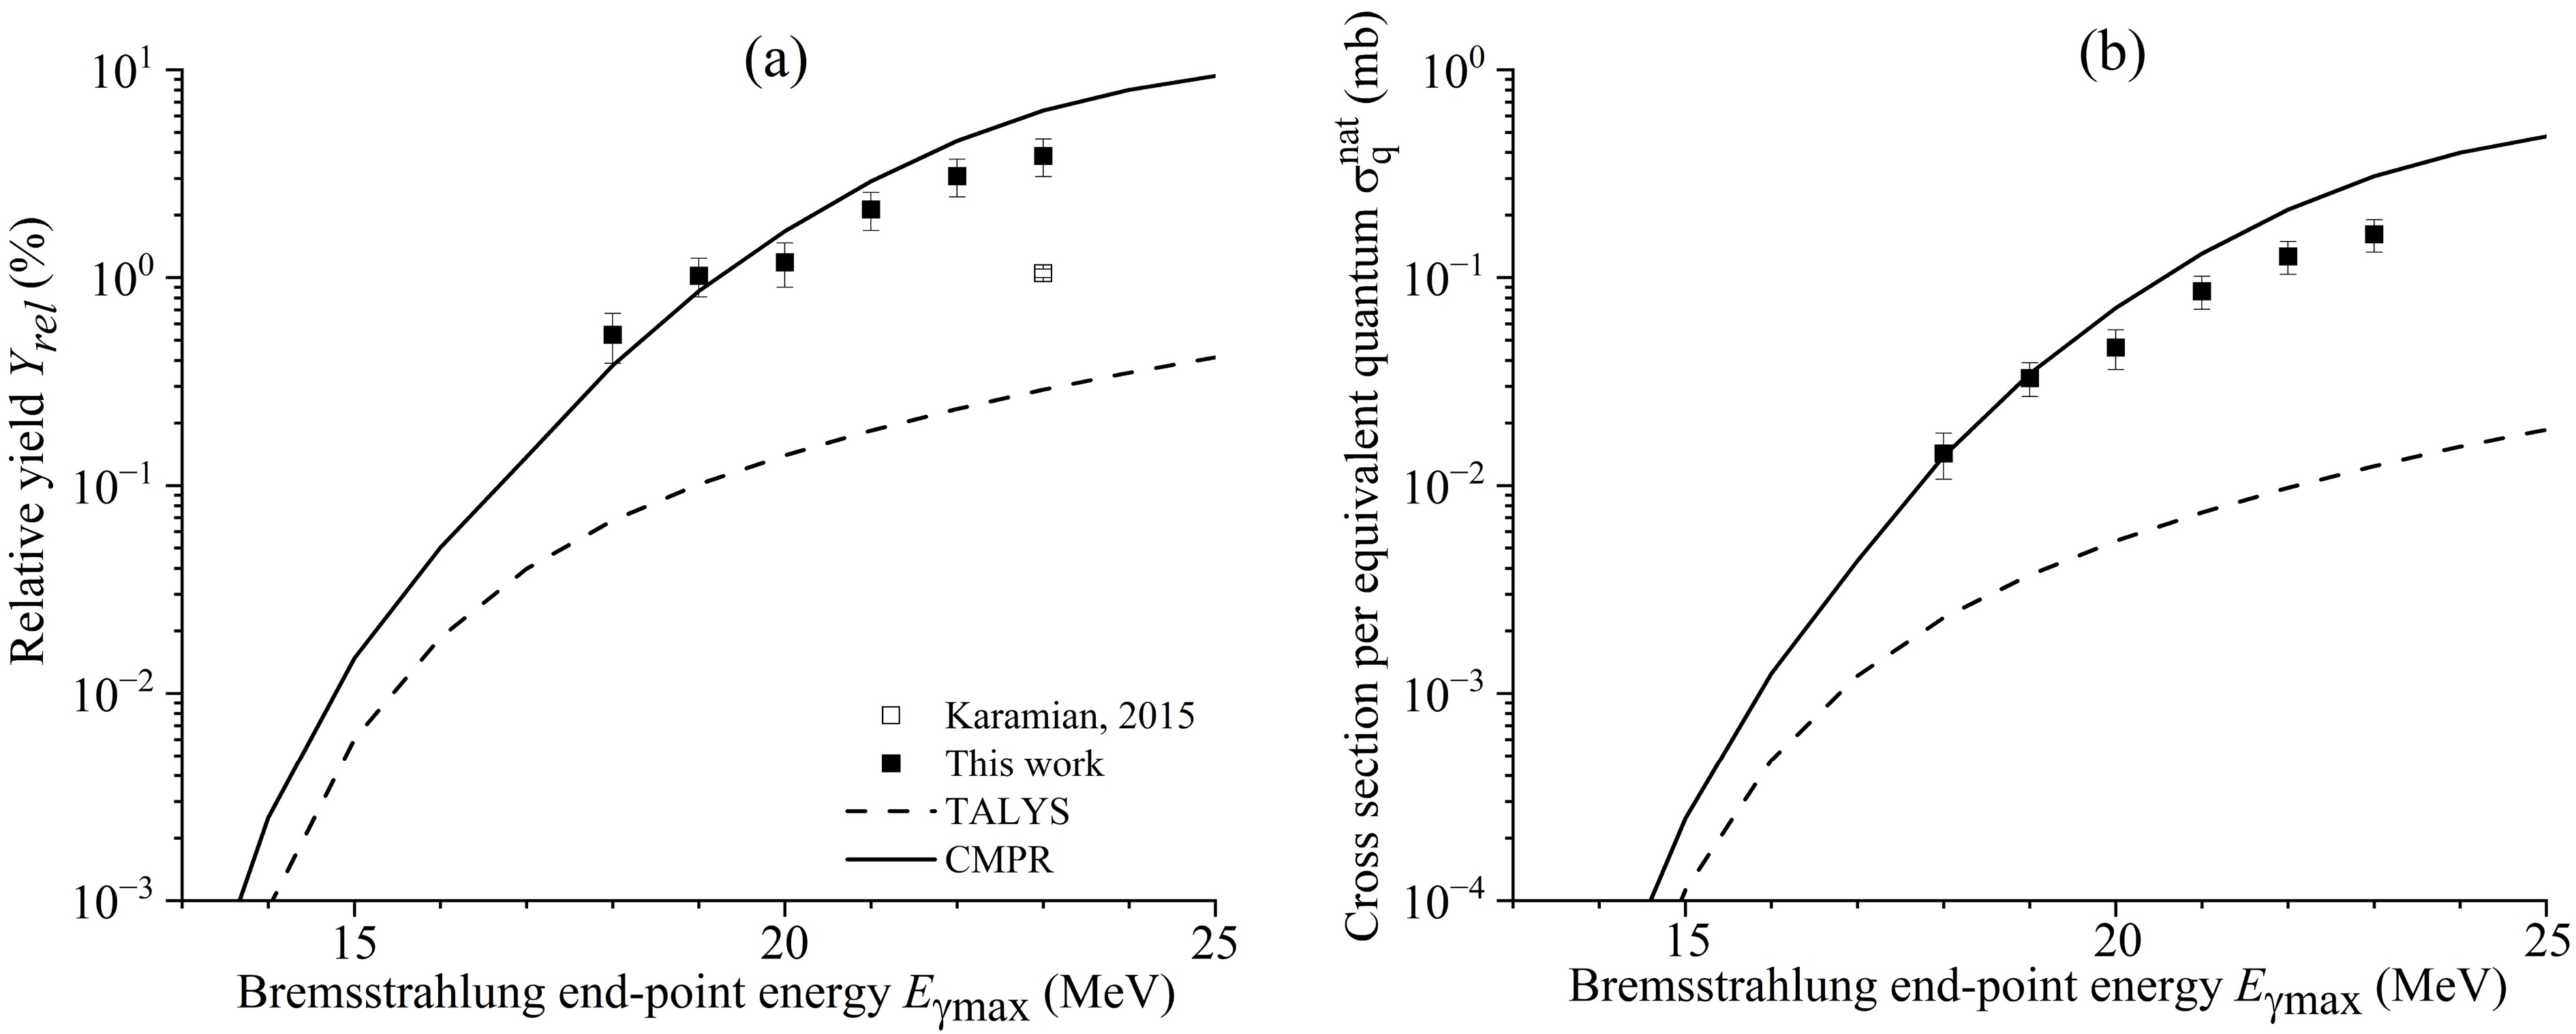
Figure 11. Relative yields (a) and cross section per equivalent quantum (b) of reaction 112Cd(γ, p)111Ag as functions of the bremsstrahlung end-point energy from this study (solid rectangles), literature data [3] (open rectangle), and simulated values using the CMPR (solid lines) and TALYS code (dashed lines).
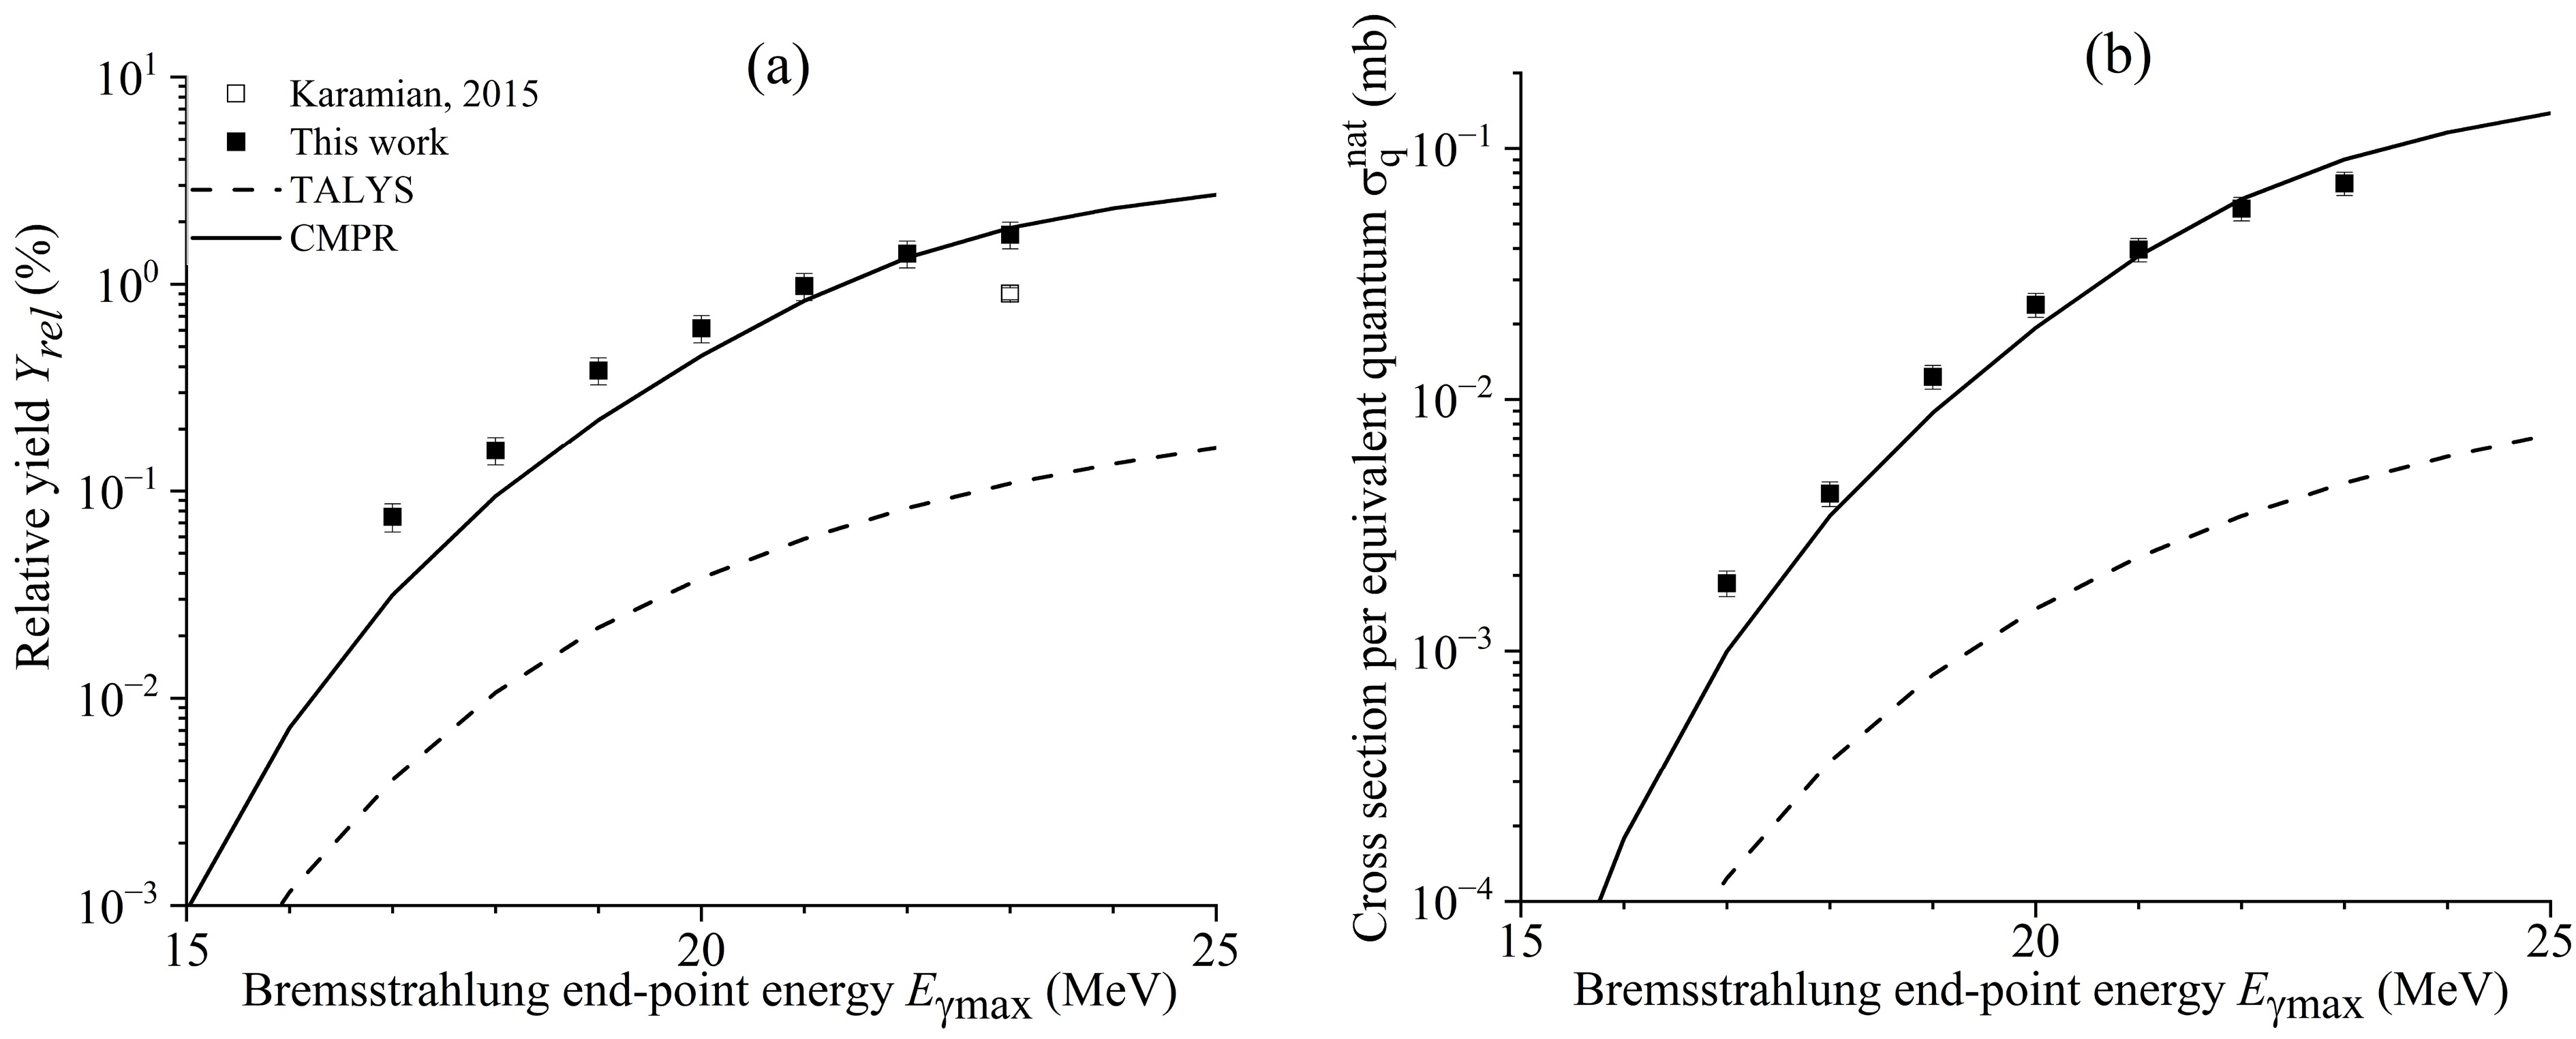
Figure 12. Relative yields (a) and cross section per equivalent quantum (b) of reaction 113Cd(γ, p)112Ag as functions of the bremsstrahlung end-point energy from this study (solid rectangles), literature data [3] (open rectangle), and simulated values using the CMPR (solid lines) and TALYS code (dashed lines).
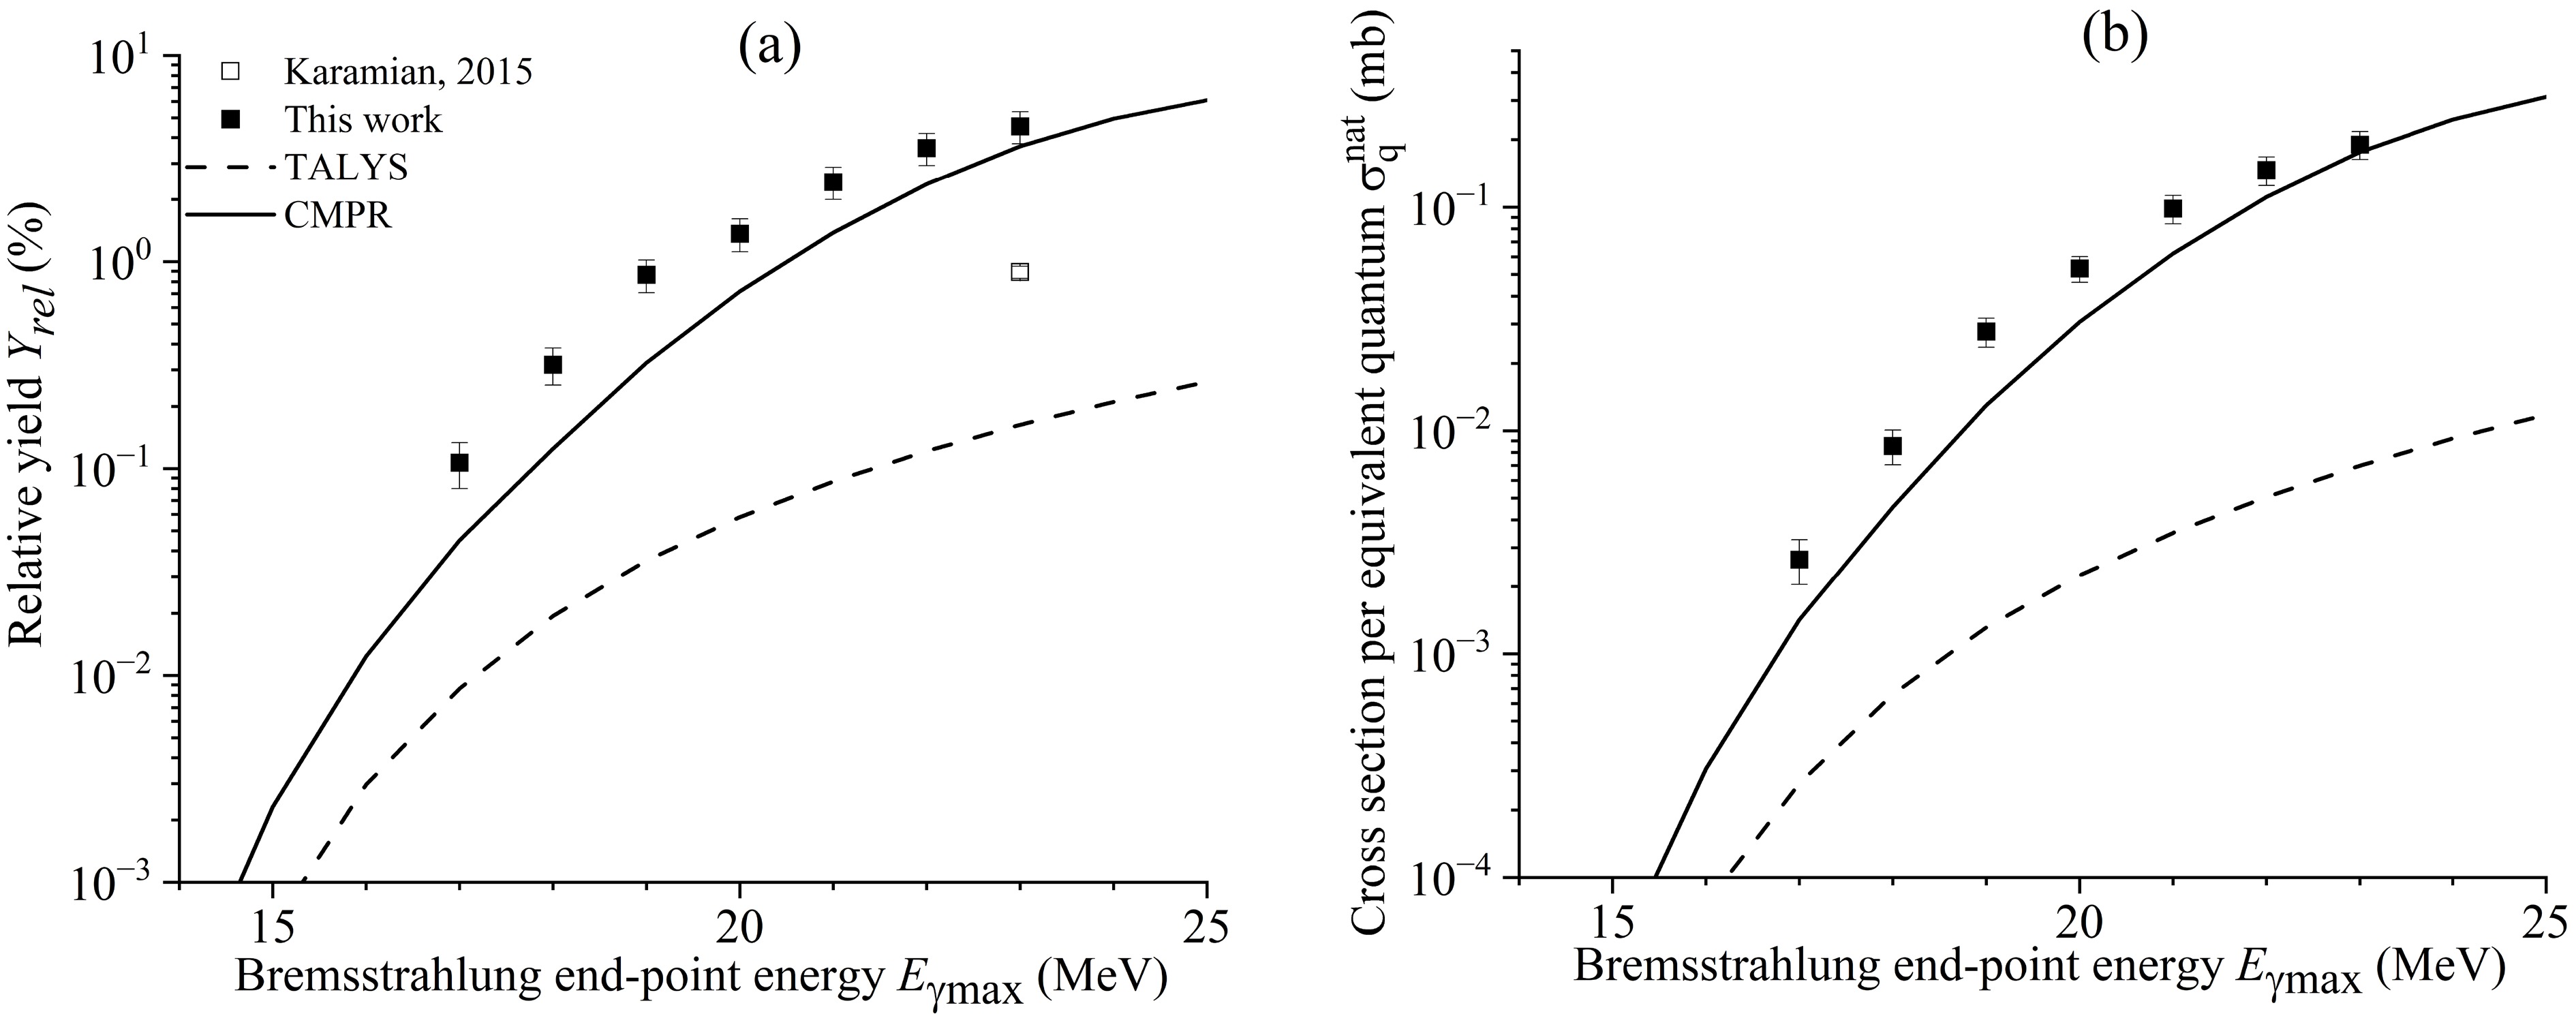
Figure 13. Relative yields (a) and cross section per equivalent quantum (b) of reaction 114Cd(γ, p)113Ag as functions of the bremsstrahlung end-point energy from this study (solid rectangles), literature data [3] (open rectangle), and simulated values using the CMPR (solid lines) and TALYS code (dashed lines).
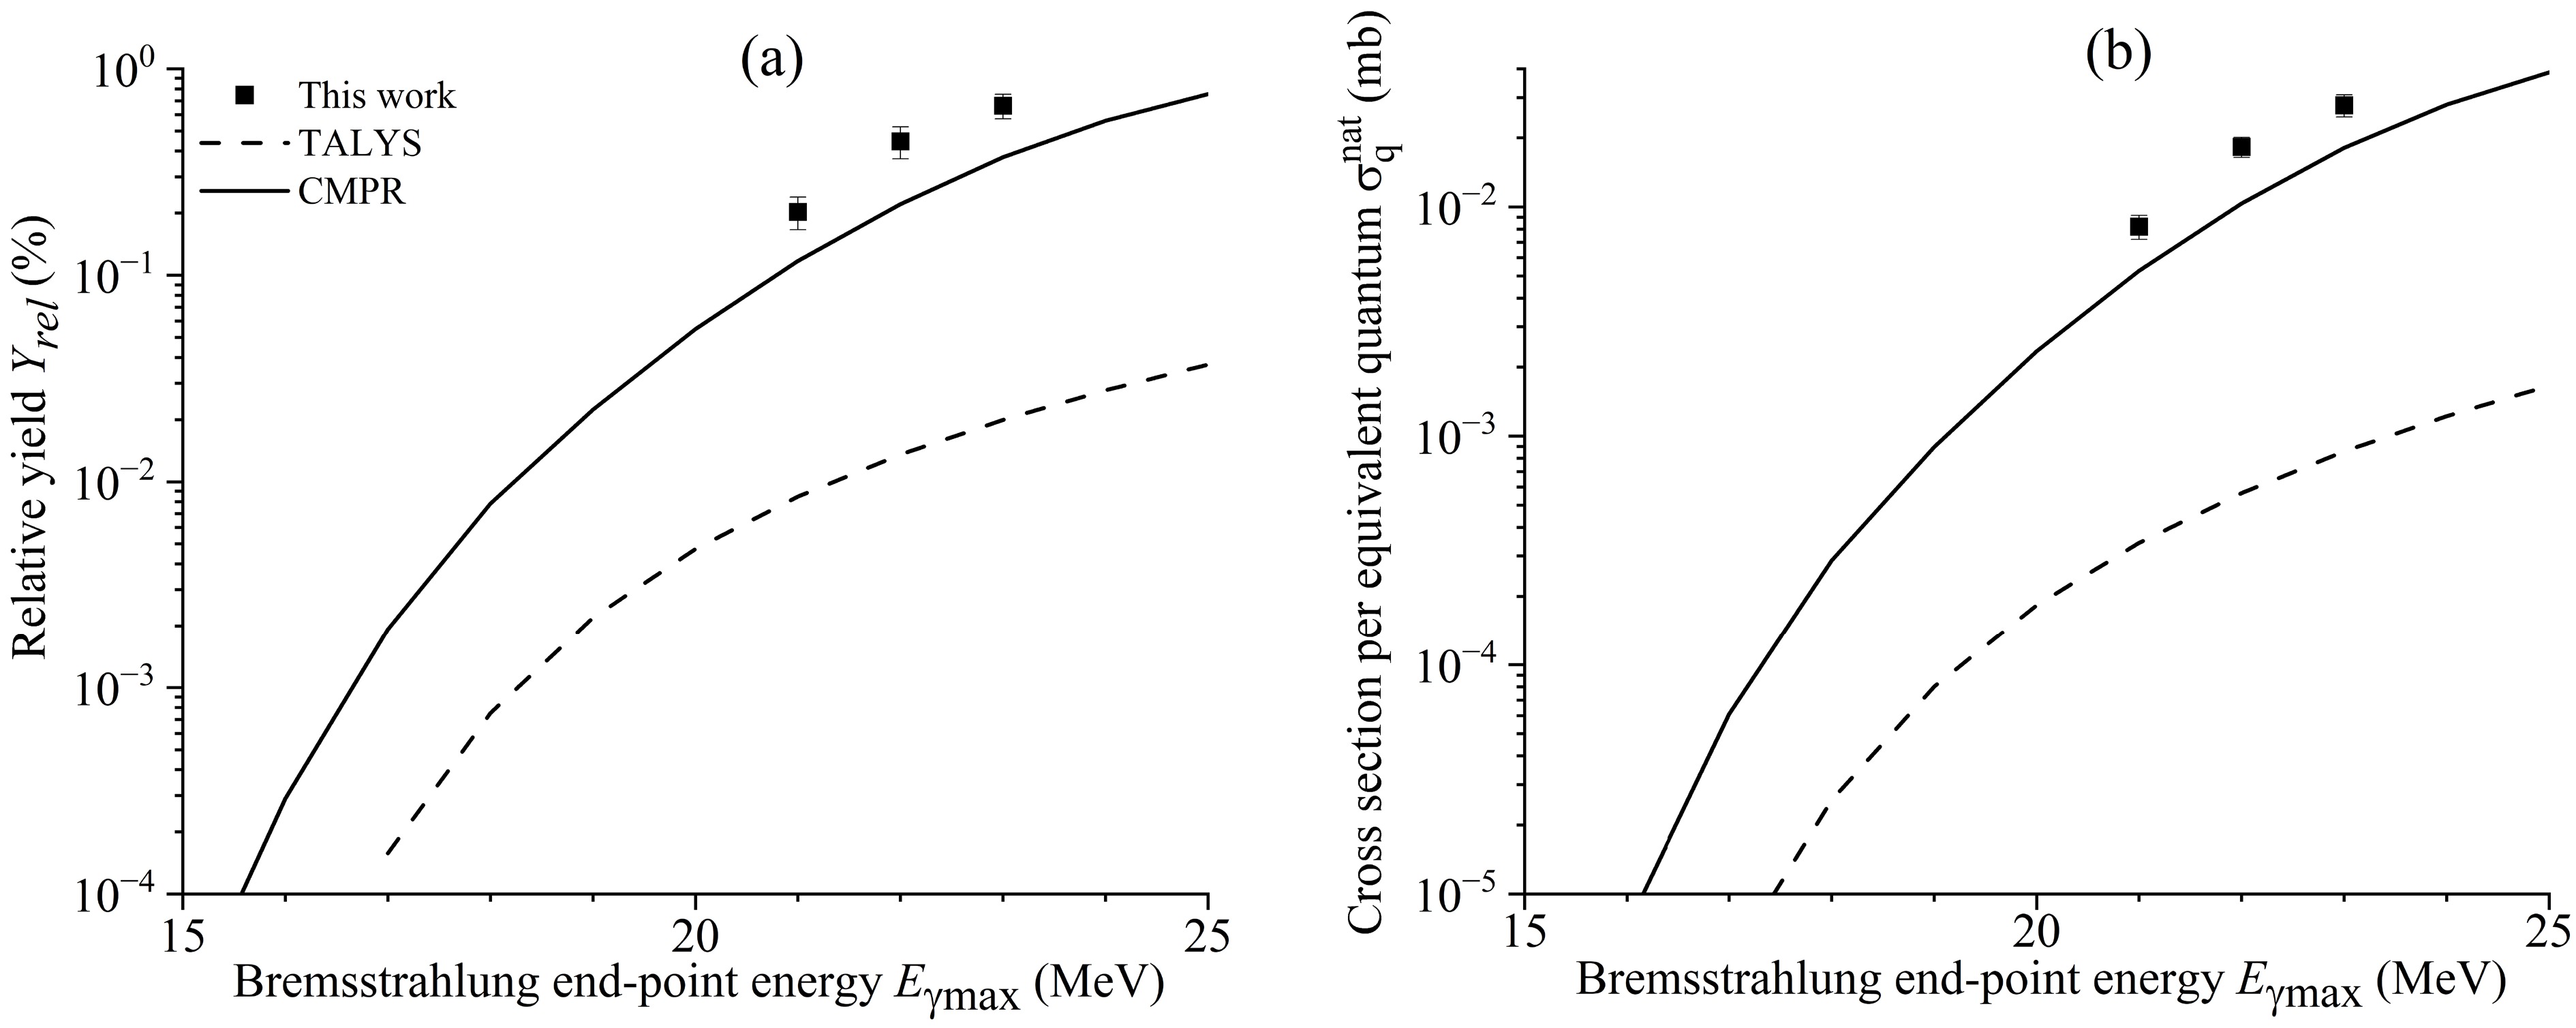
Figure 14. Relative yields (a) and cross section per equivalent quantum (b) of reaction 116Cd(γ, p)115Ag as functions of bremsstrahlung end-point energy from this study (solid rectangles) and simulated values using the CMPR (solid lines) and TALYS code (dashed lines).
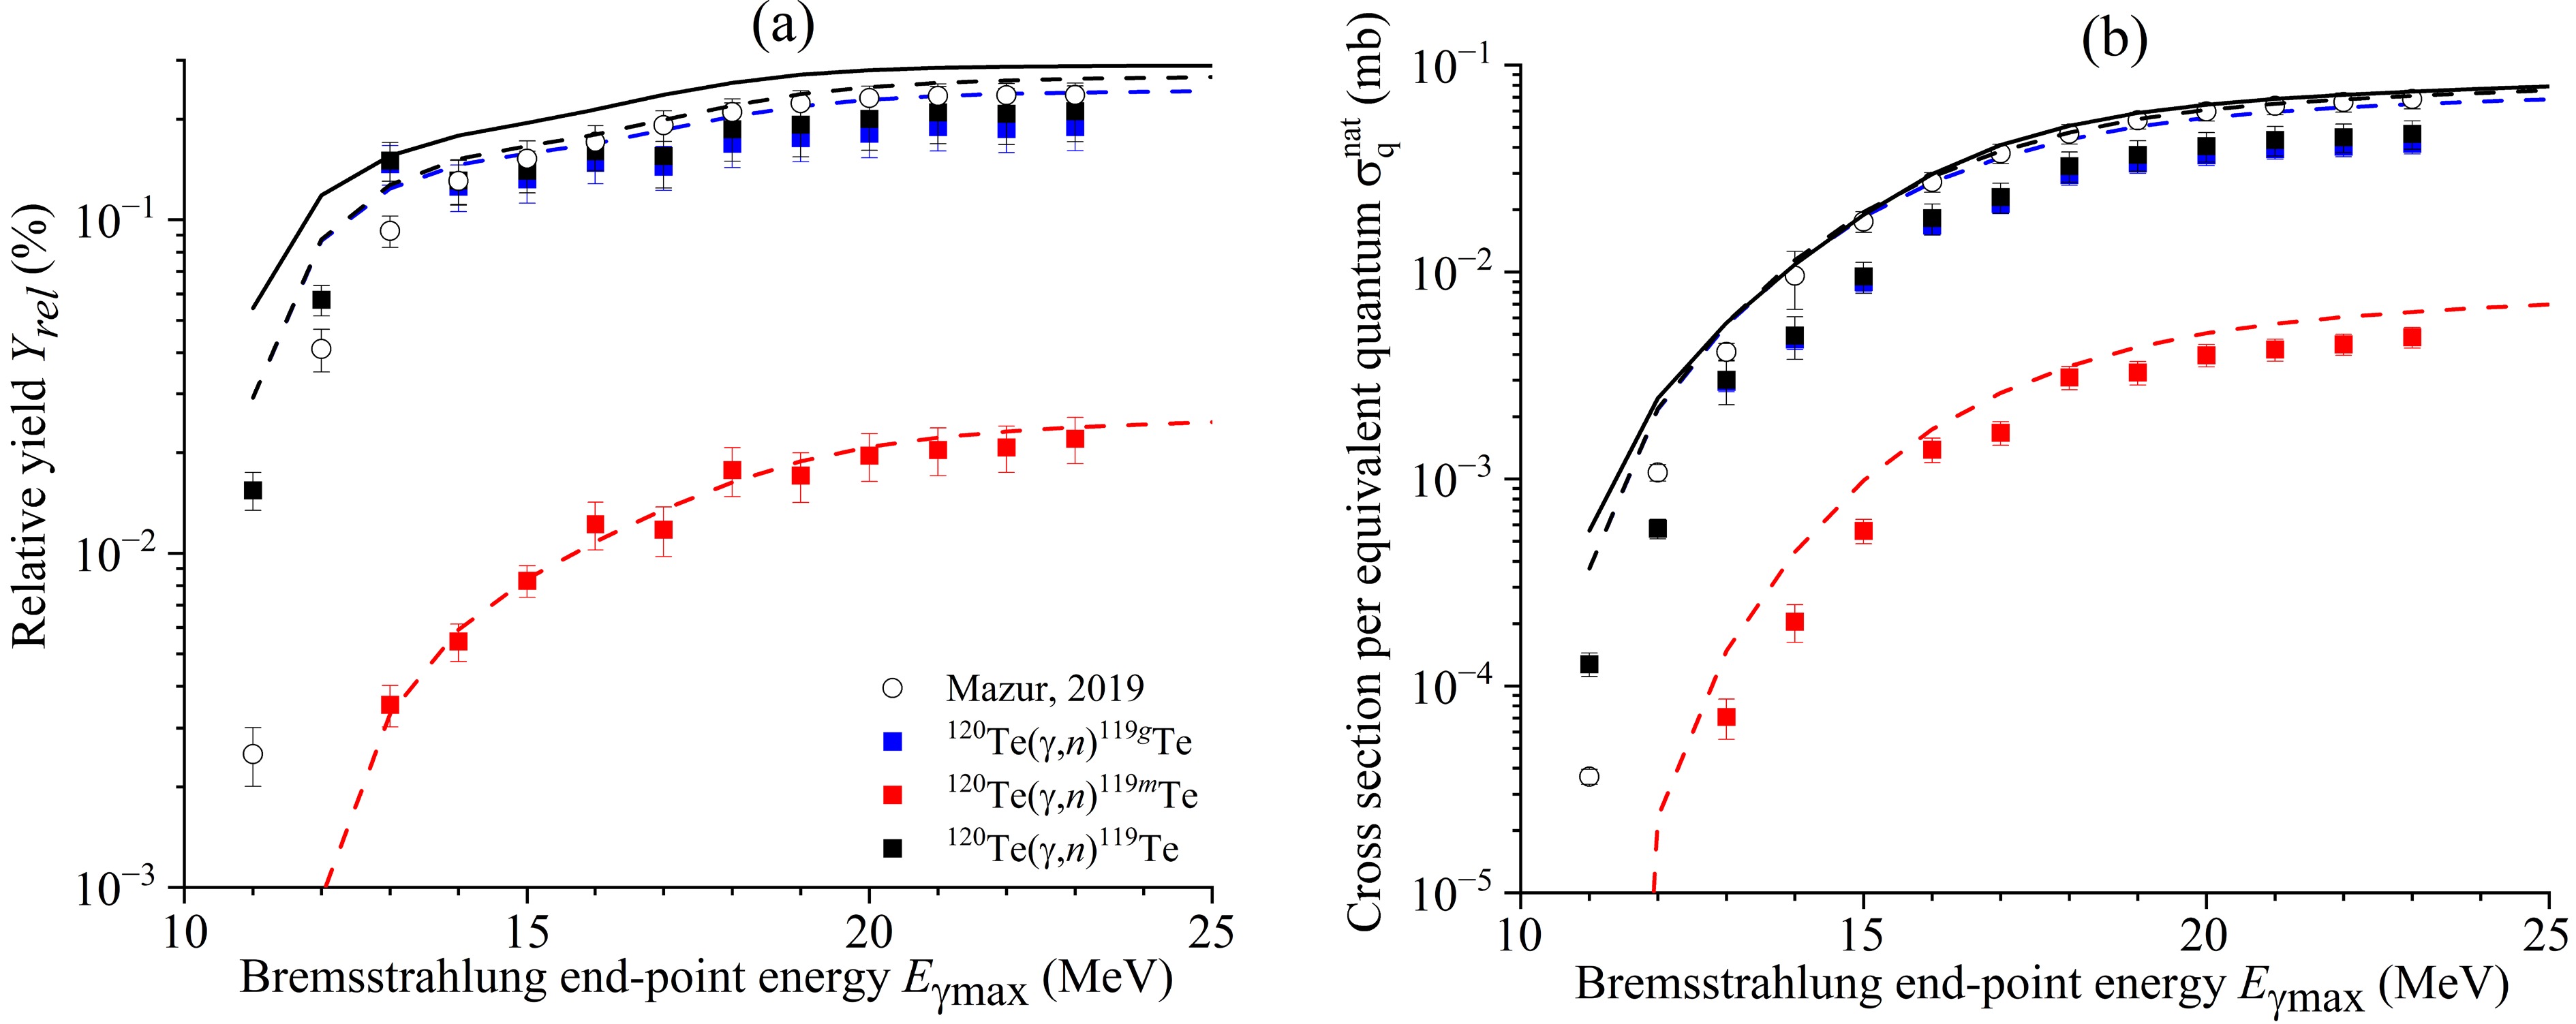
Figure 15. (color online) Relative yields (a) and cross section per equivalent quantum (b) of reaction 120Te(γ, n)119Te as functions of the bremsstrahlung end-point energy from this study (solid rectangles), literature data [22] (open circles), and simulated values using the CMPR (solid lines) and TALYS code (dashed lines).
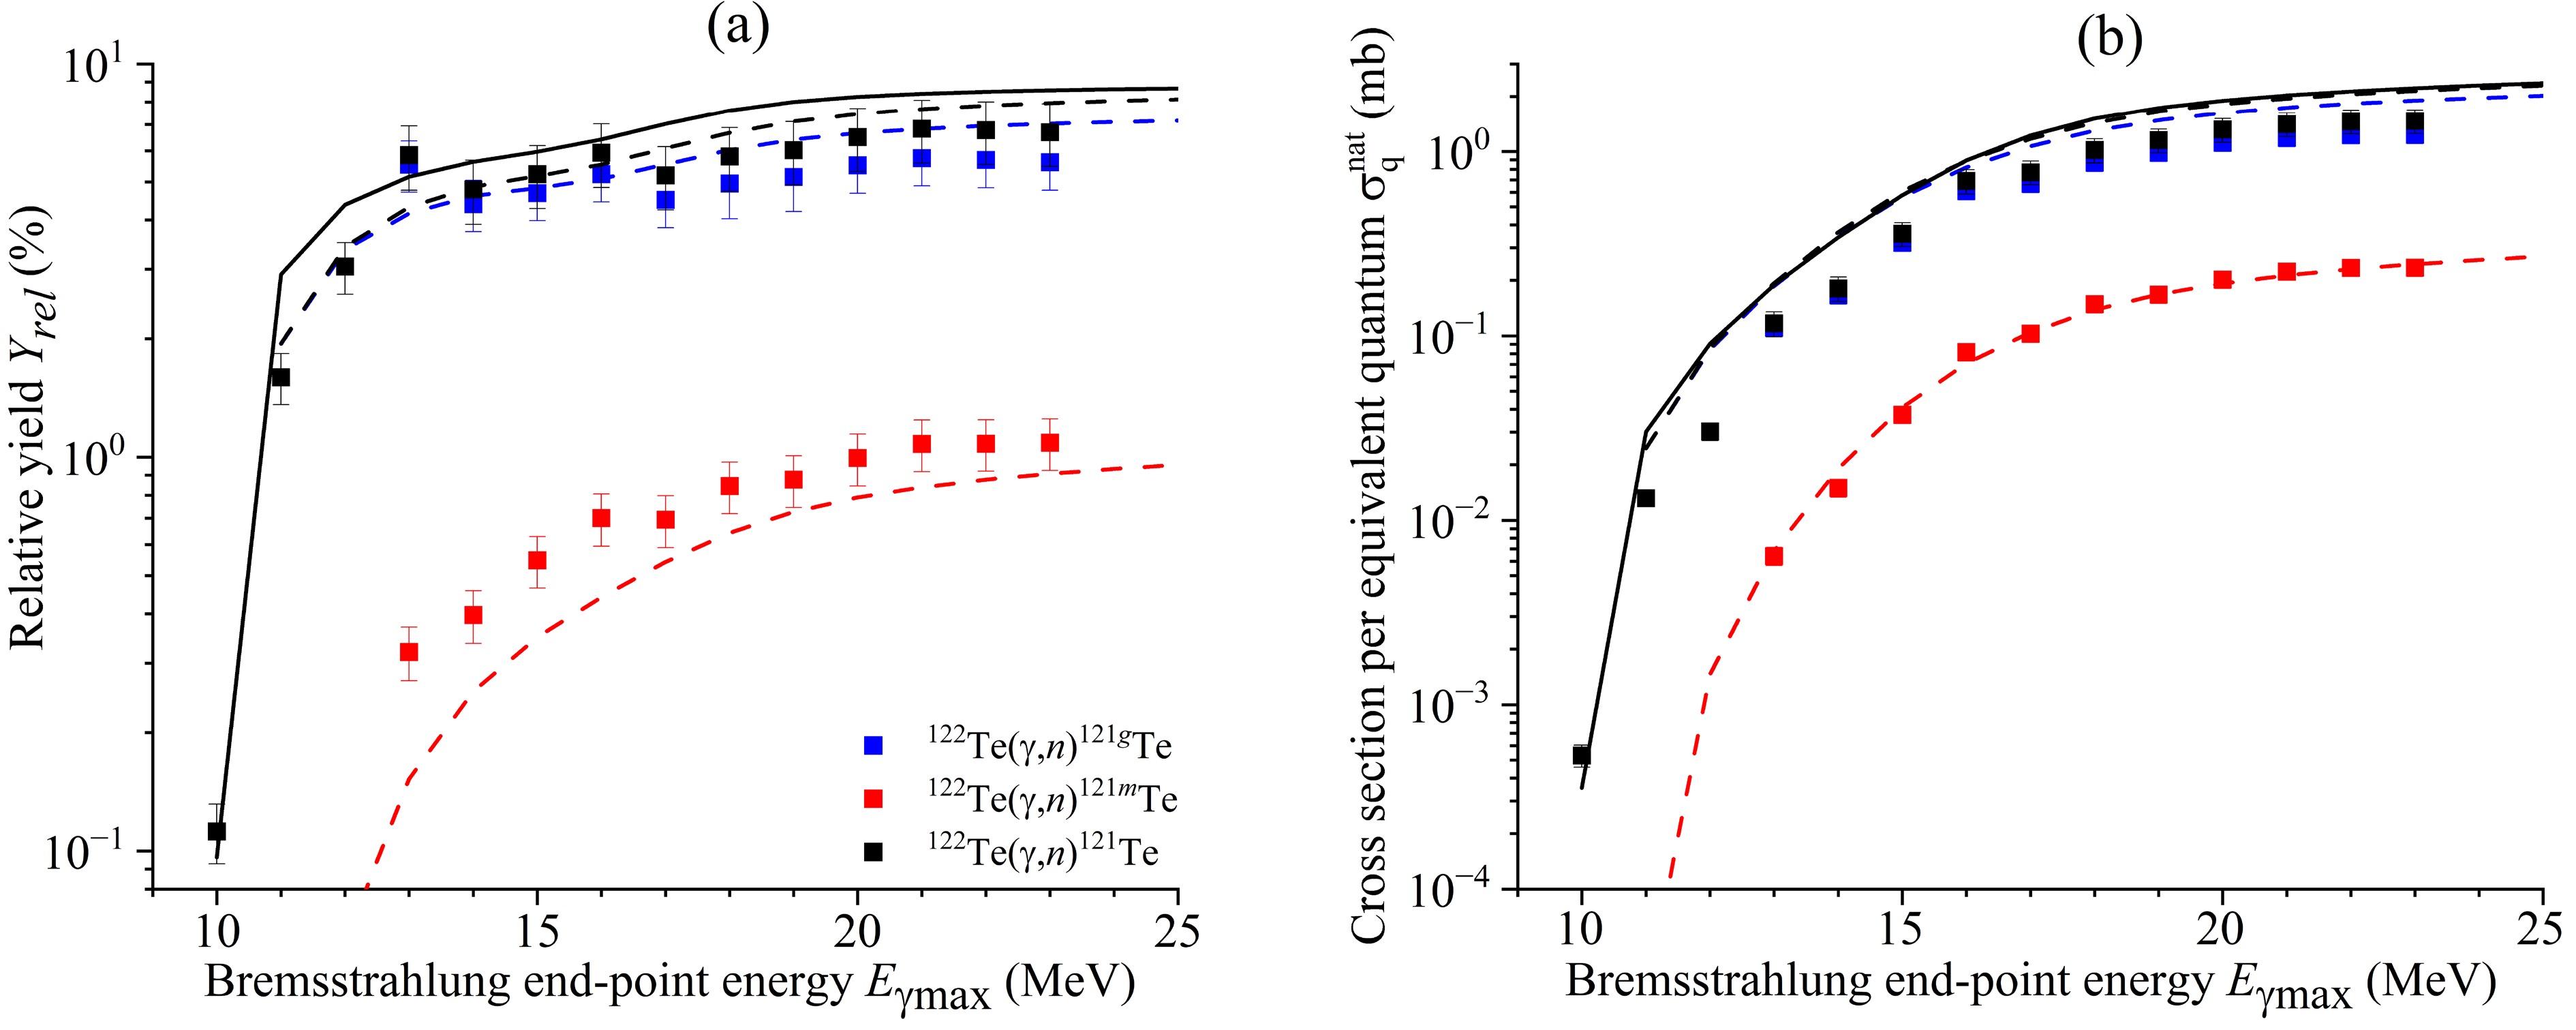
Figure 16. (color online) Relative yields (a) and cross section per equivalent quantum (b) of the 122Te(γ, n)121Te and 123Te(γ, 2n)121Te reactions as functions of the bremsstrahlung end-point energy from this study (solid rectangles) and simulated values using the CMPR (solid lines) and TALYS code (dashed lines).
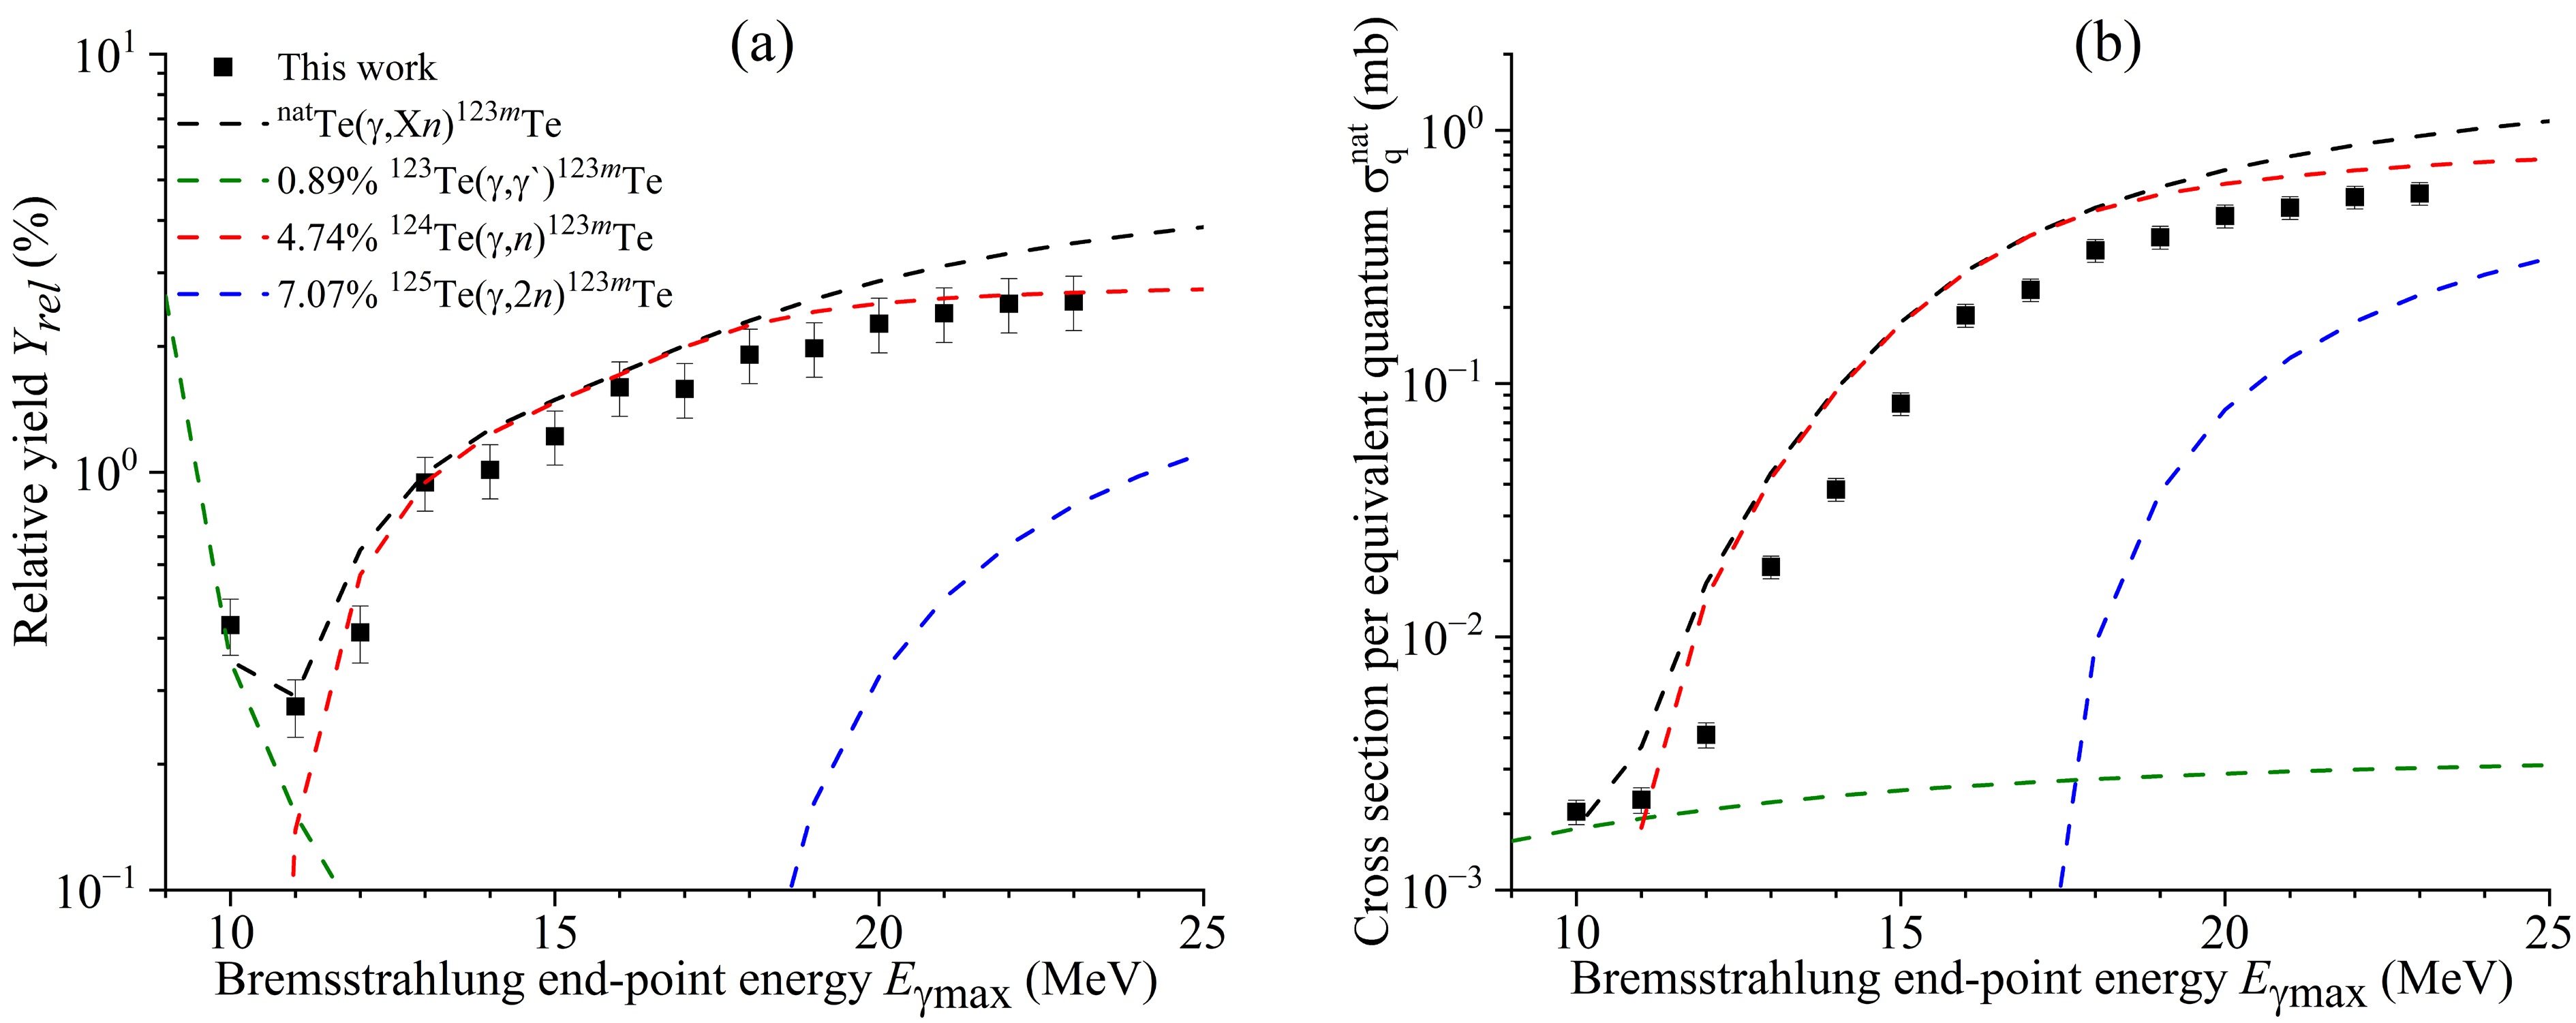
Figure 17. (color online) Relative yields (a) and cross section per equivalent quantum (b) of 123Te(γ, γ`)123mTe, 124Te(γ, n)123mTe, and 125Te(γ, 2n)123mTe reactions as functions of the bremsstrahlung end-point energy from this study (solid rectangles) and simulated values using TALYS code.
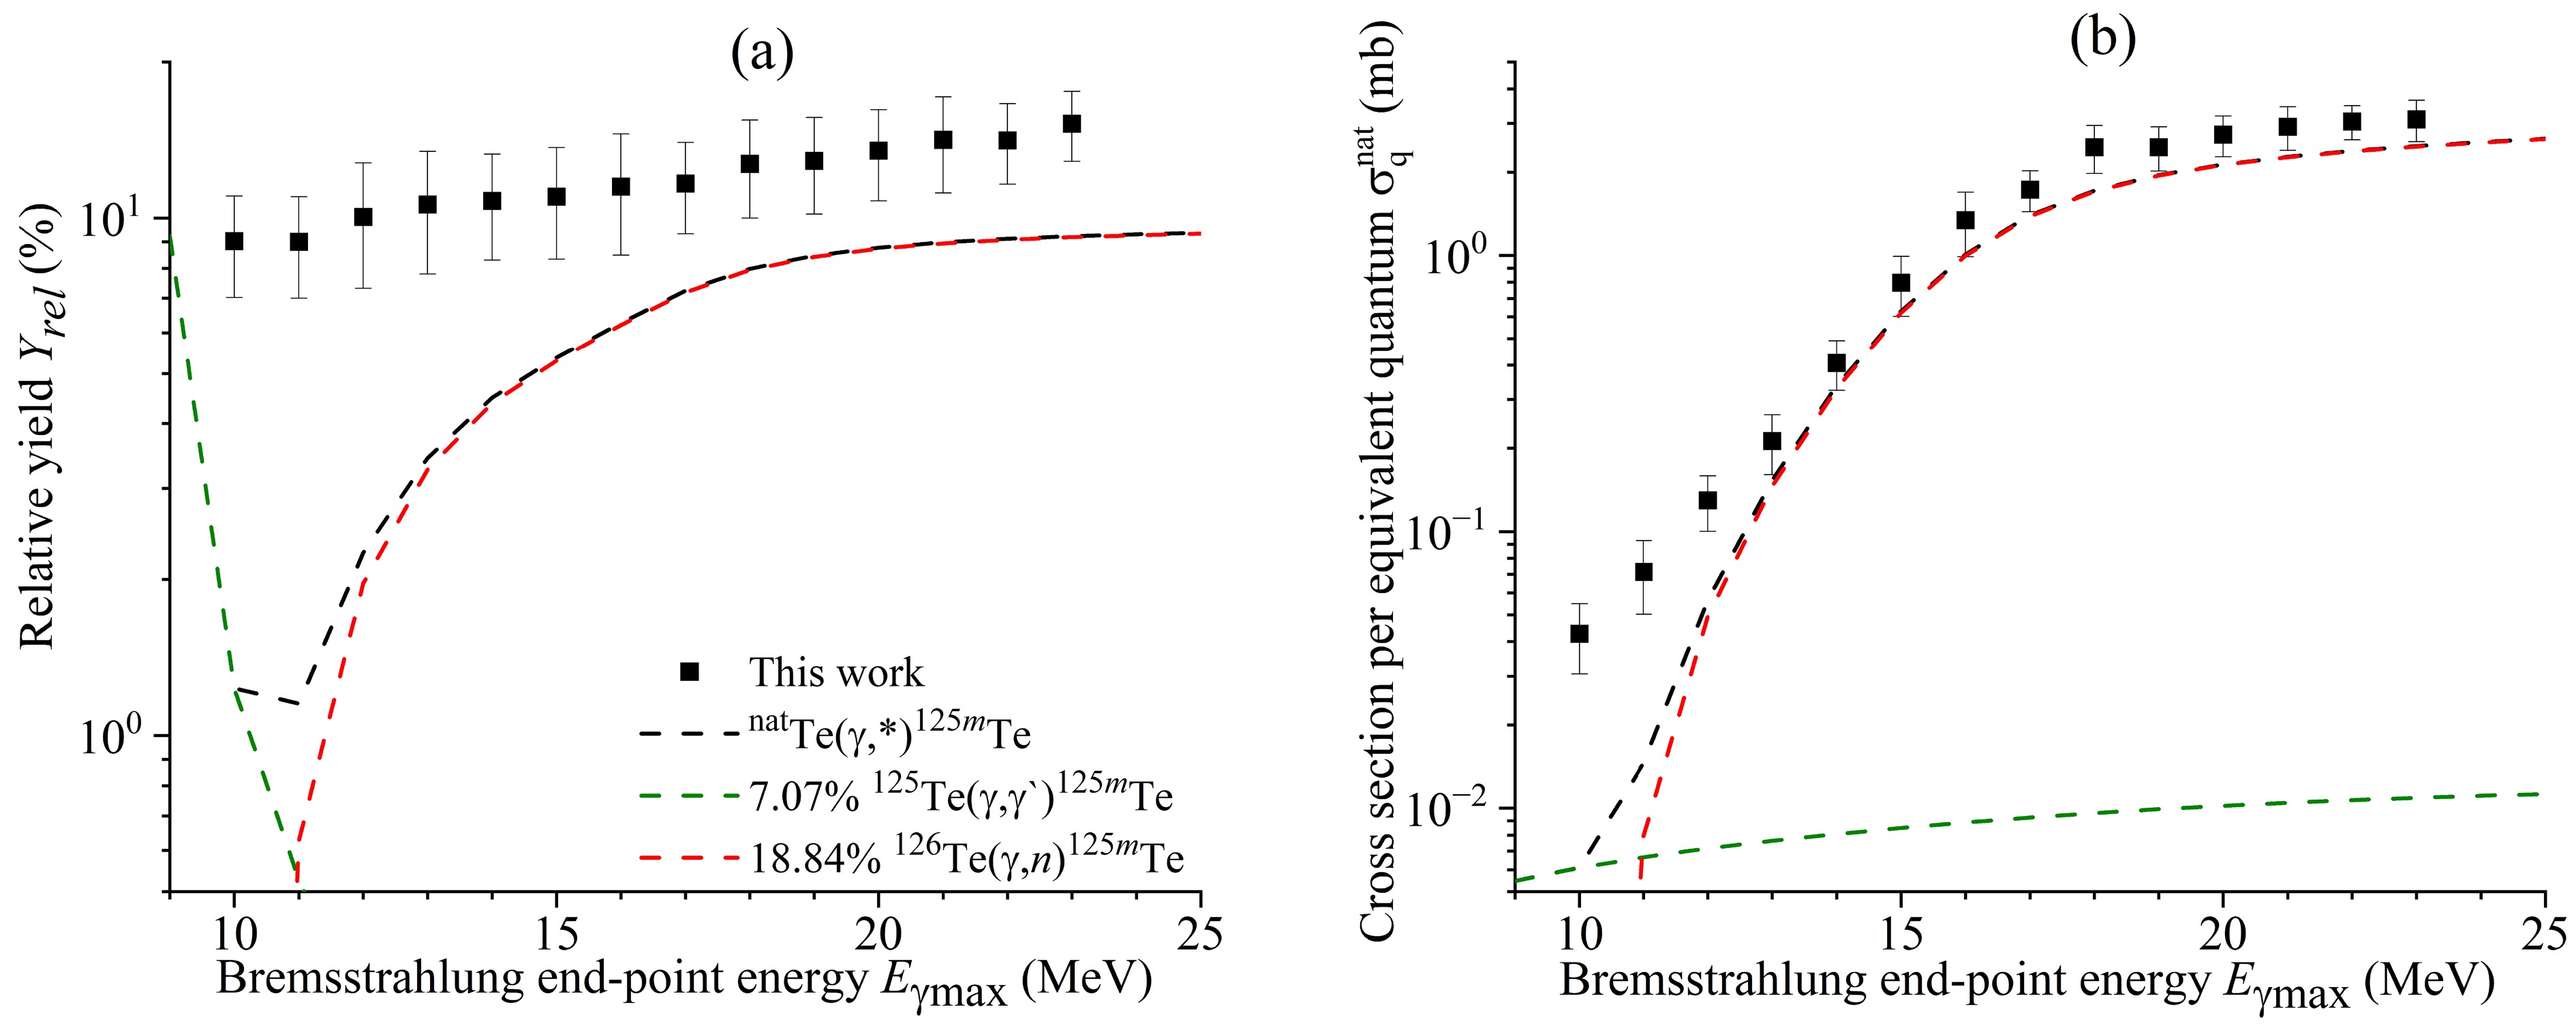
Figure 18. (color online) Relative yields (a) and cross section per equivalent quantum (b) of 125Te(γ, γ`)125mTe and 126Te(γ, n)125mTe reactions as functions of the bremsstrahlung end-point energy from this study (solid rectangles) and simulated values using TALYS code.
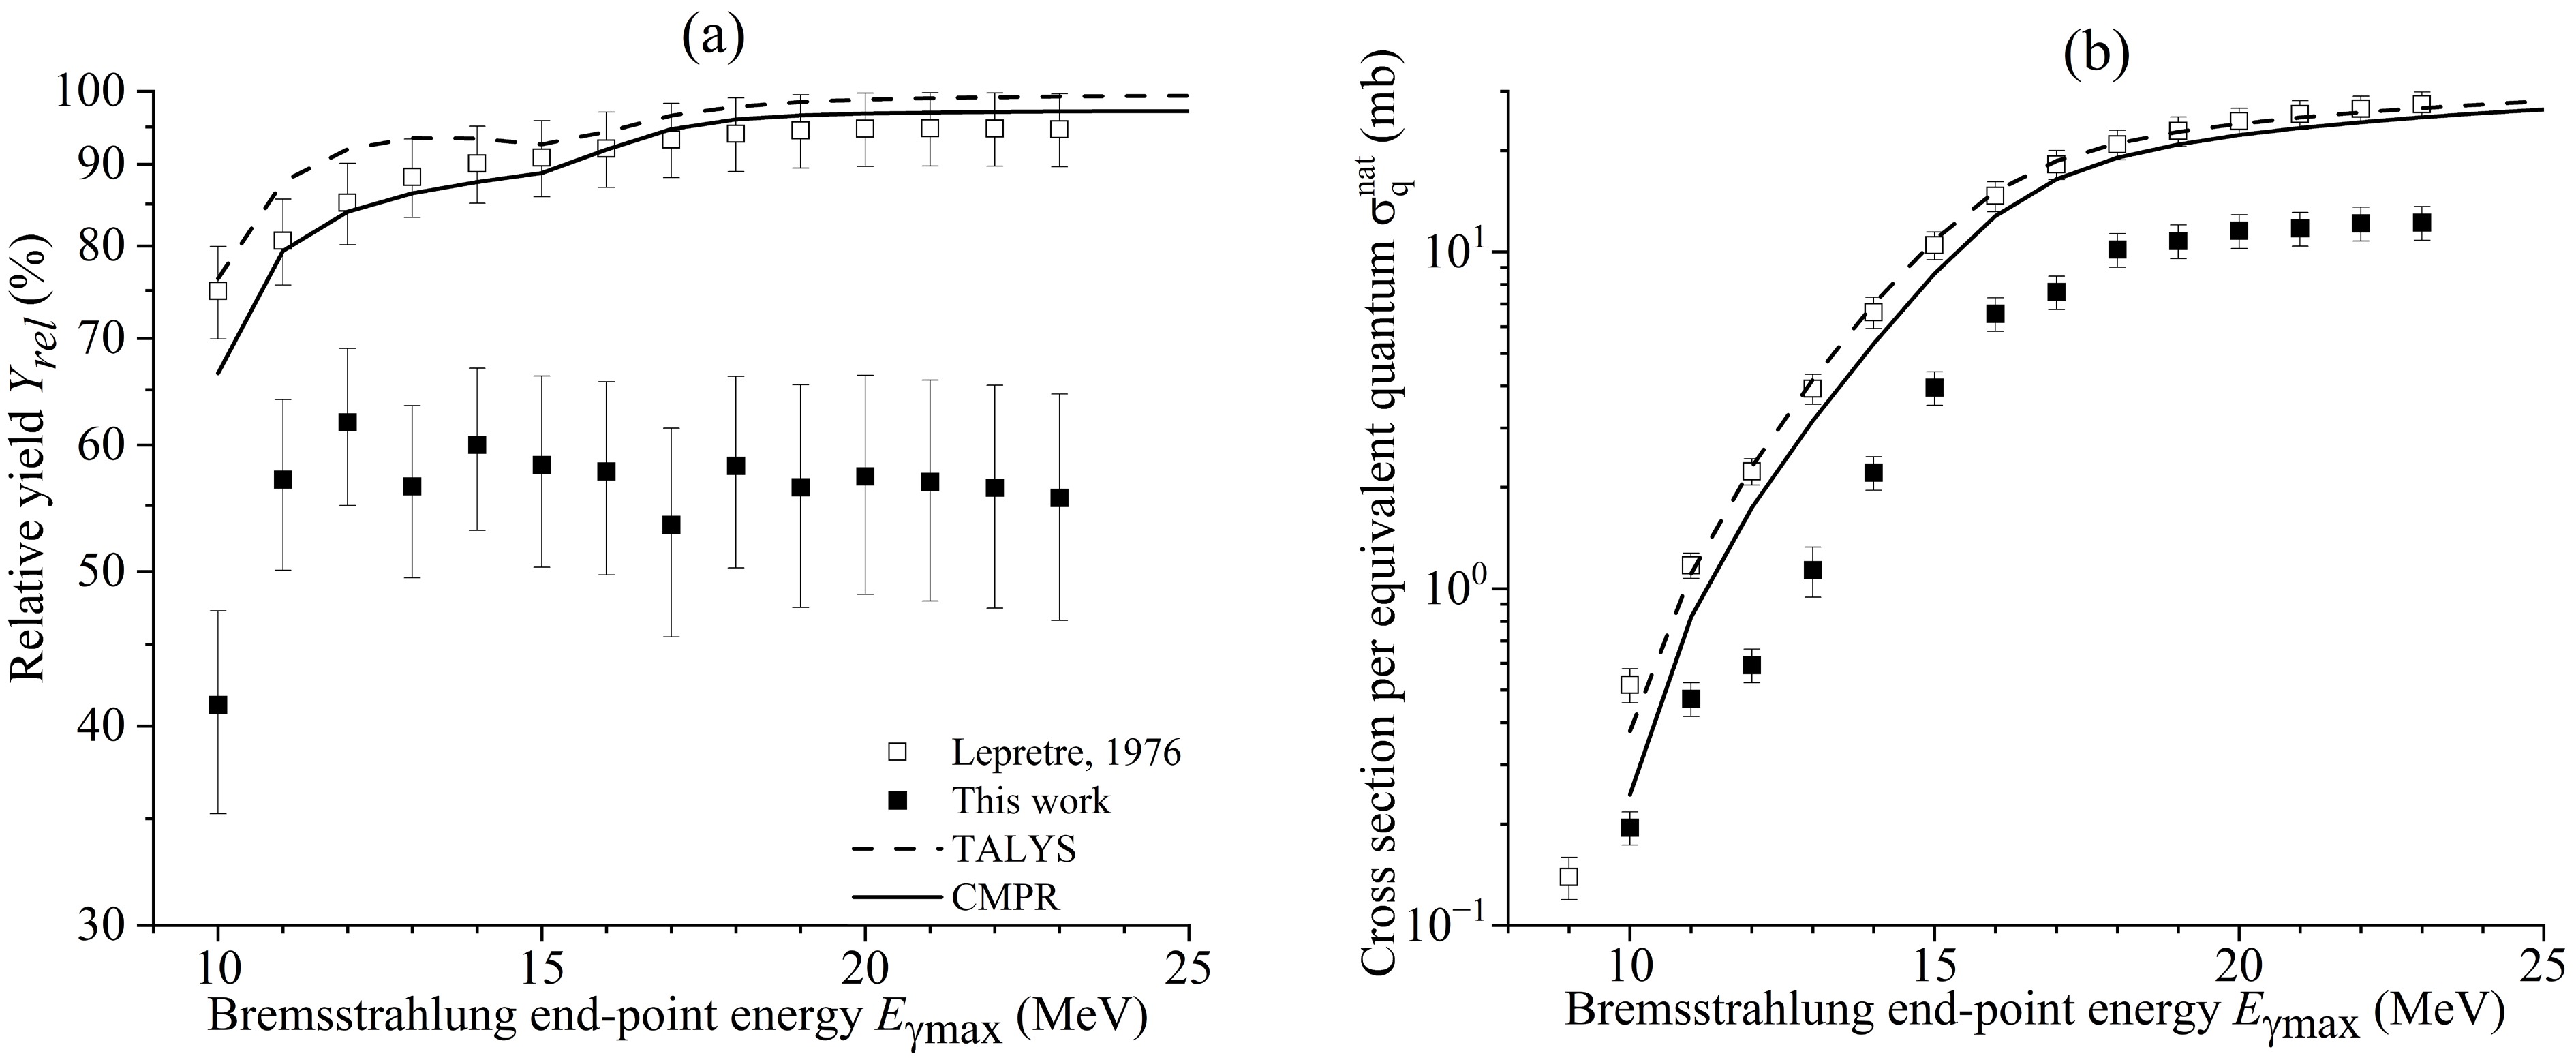
Figure 19. Relative yields (a) and cross section per equivalent quantum (b) of 128Te(γ, n)127Te reaction as functions of the bremsstrahlung end-point energy from this study (solid rectangles), literature data [22] (open rectangles), and simulated values using the CMPR (solid lines) and TALYS code (dashed lines).
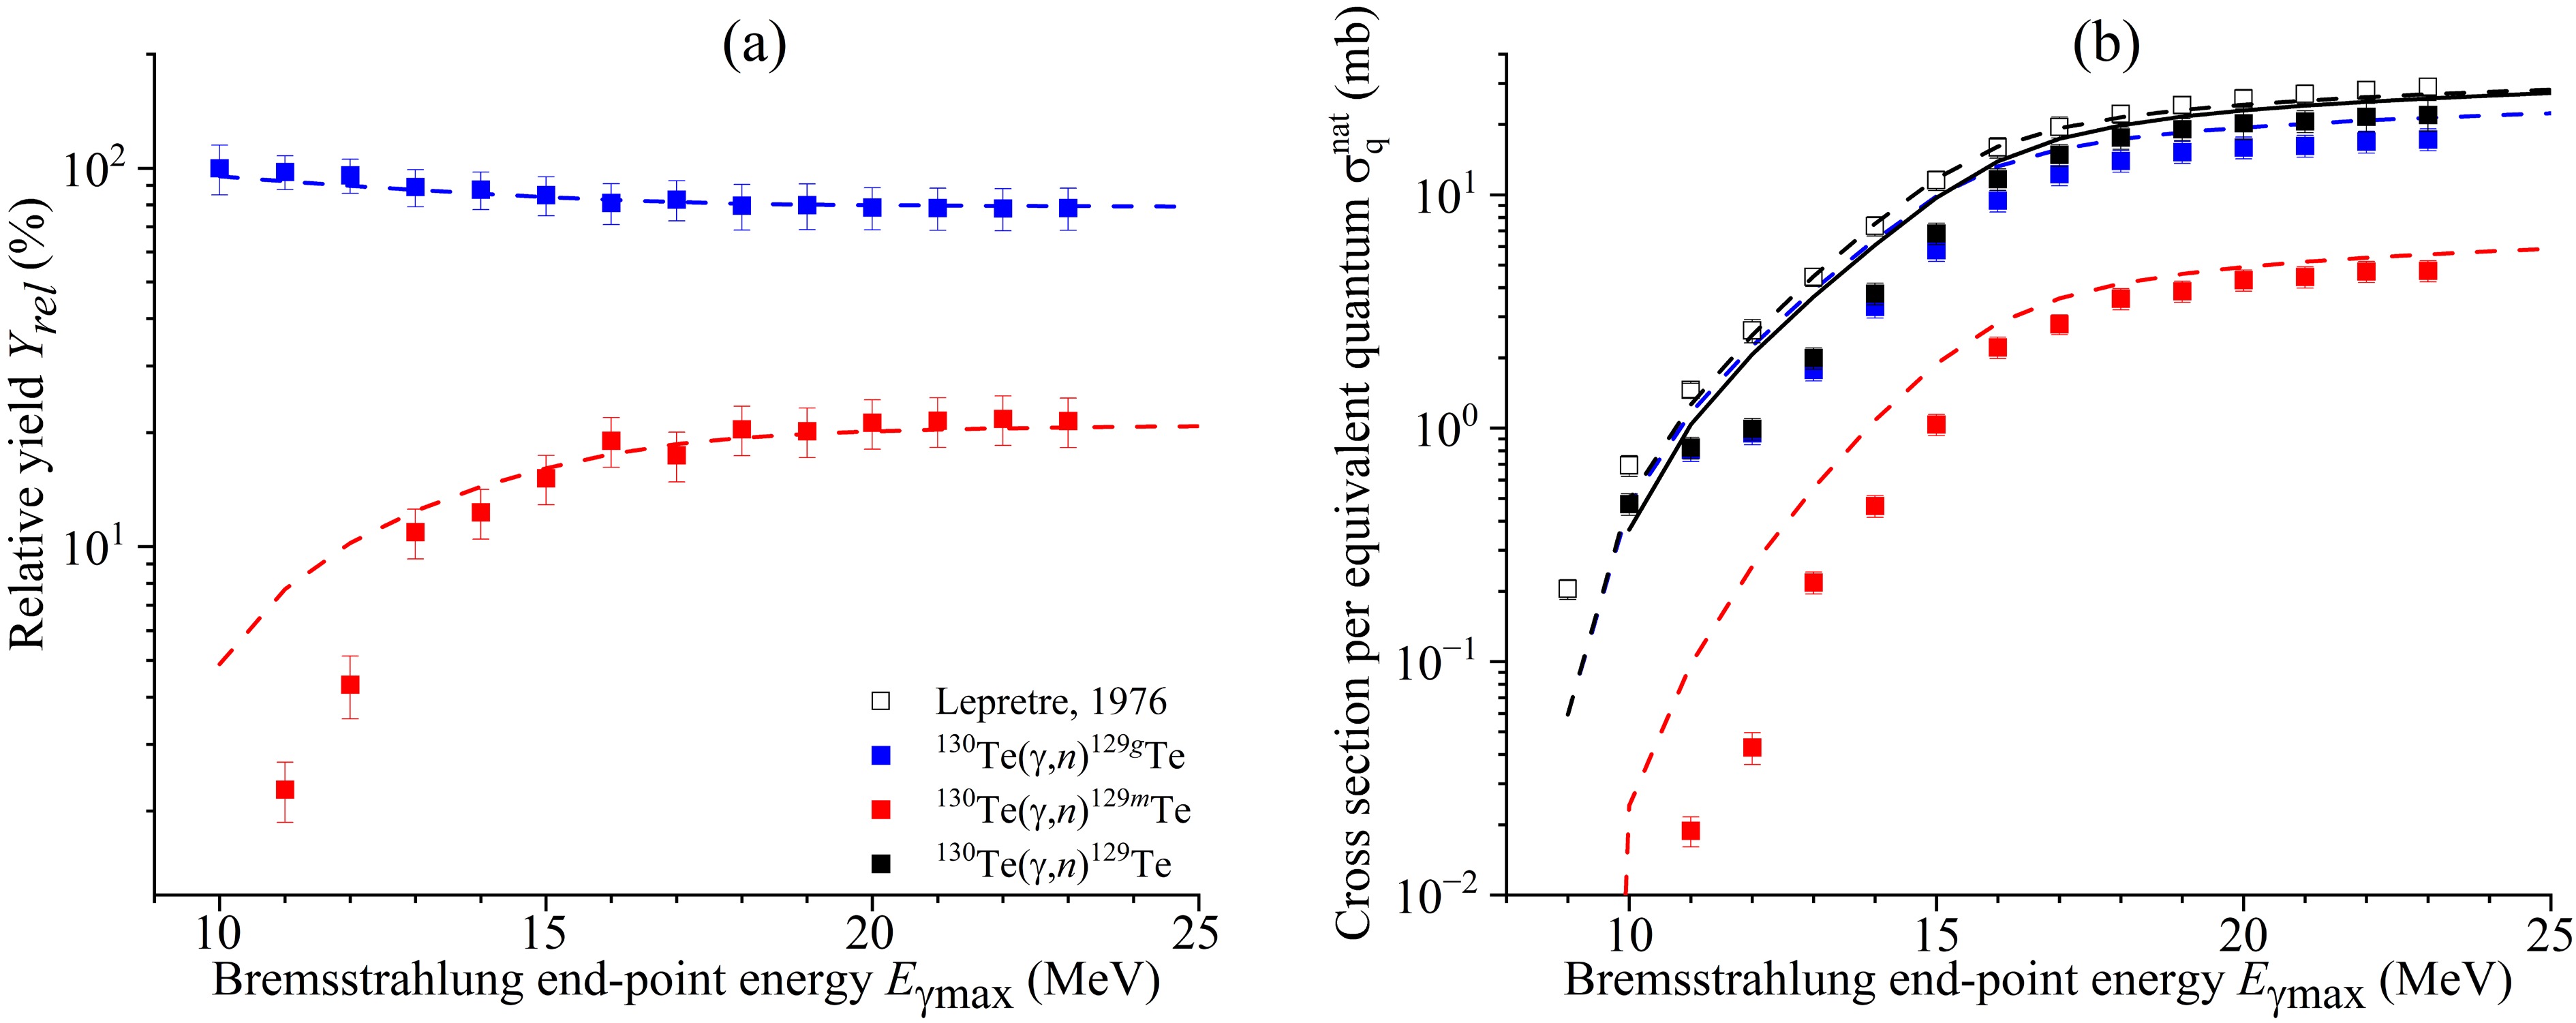
Figure 20. (color online) Relative yields (a) and cross section per equivalent quantum (b) of the reaction 130Te(γ, n)129Te as functions of the bremsstrahlung end-point energy from this study (solid rectangles), literature data [22] (open rectangles), and simulated values using the CMPR (solid line) and TALYS code (dashed lines).
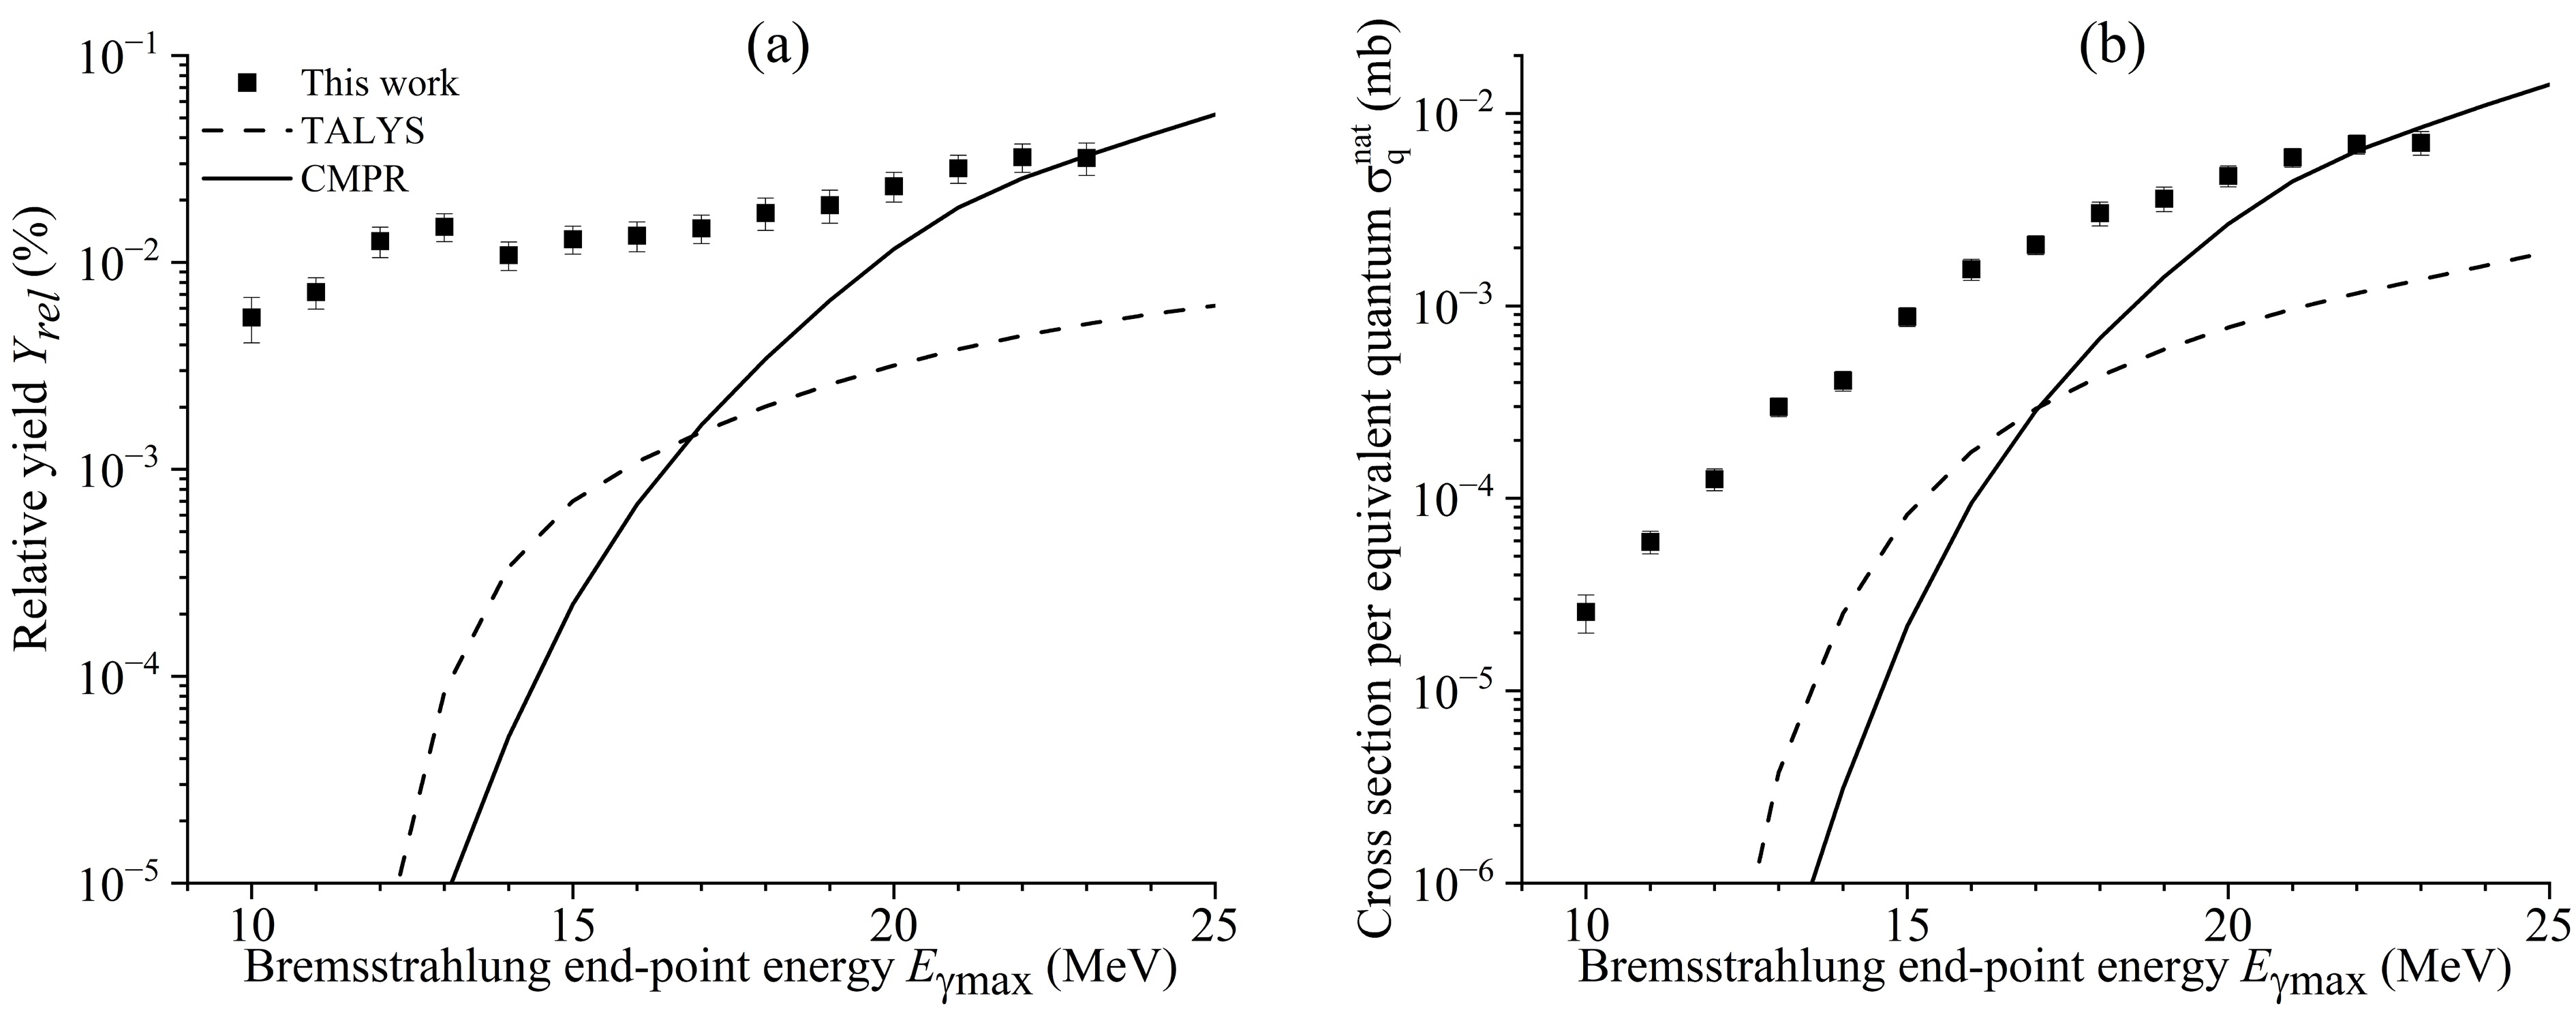
Figure 21. Relative yields (a) and cross section per equivalent quantum (b) of the 123Te(γ, p)122Sb and 124Te(γ, np)122Sb reactions as functions of the bremsstrahlung end-point energy from this study (solid rectangles) and simulated values using the CMPR (solid lines) and TALYS code (dashed lines).
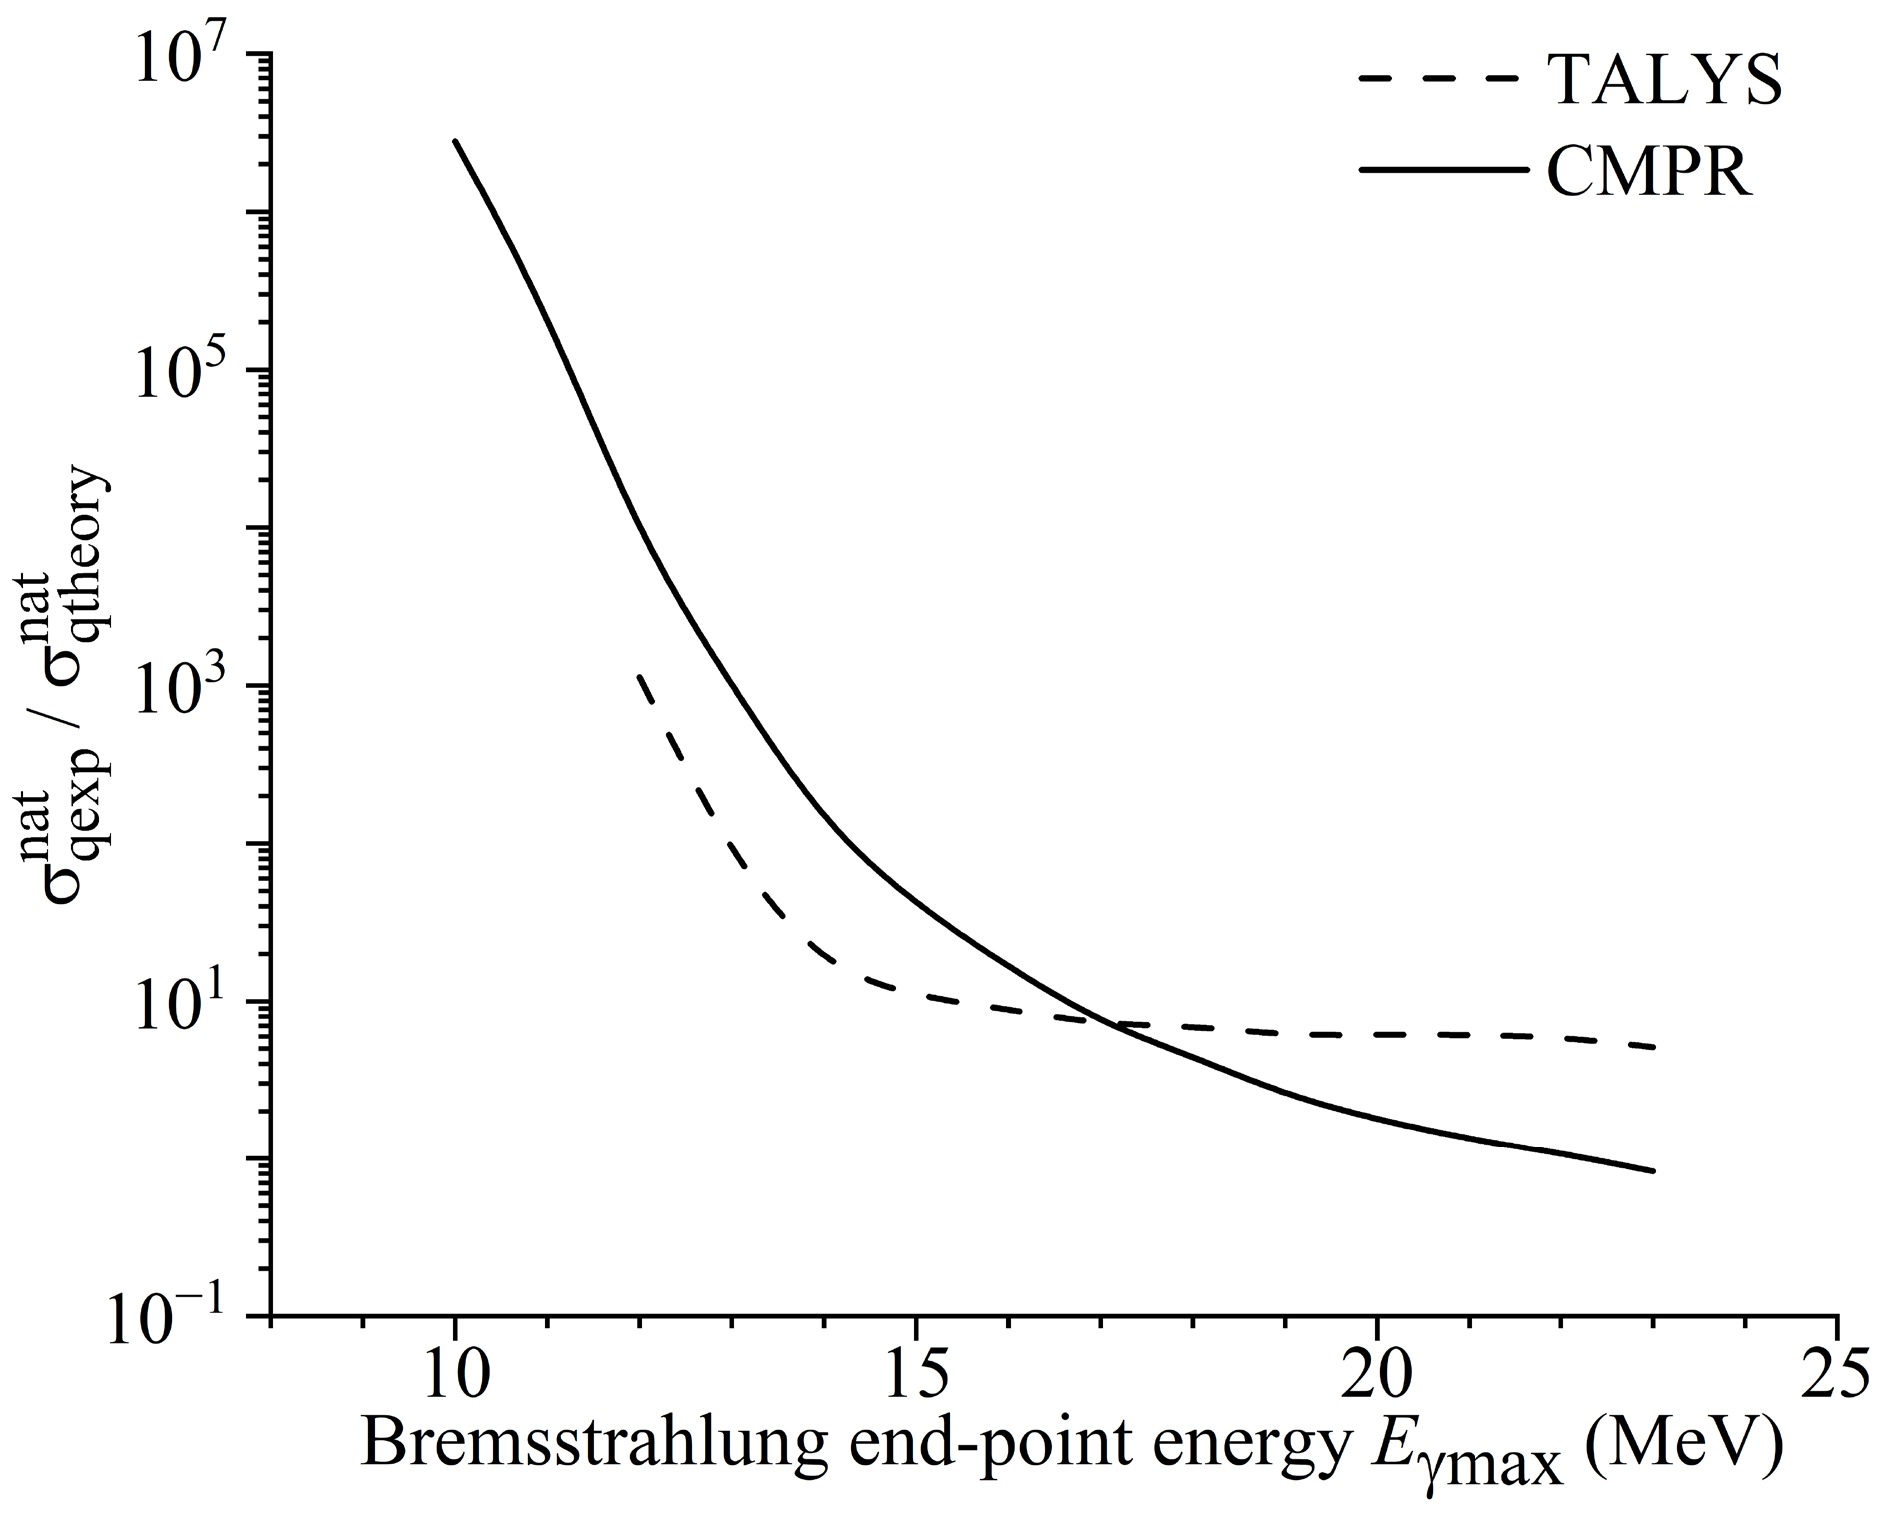
Figure 22. Ratio of the cross section per equivalent quantum
$ \sigma_{q\mathrm{exp}}^{\mathrm{nat}}/\sigma_{q\mathrm{theory}}^{\mathrm{nat}} $ for the 123Te(γ, p)122Sb reaction.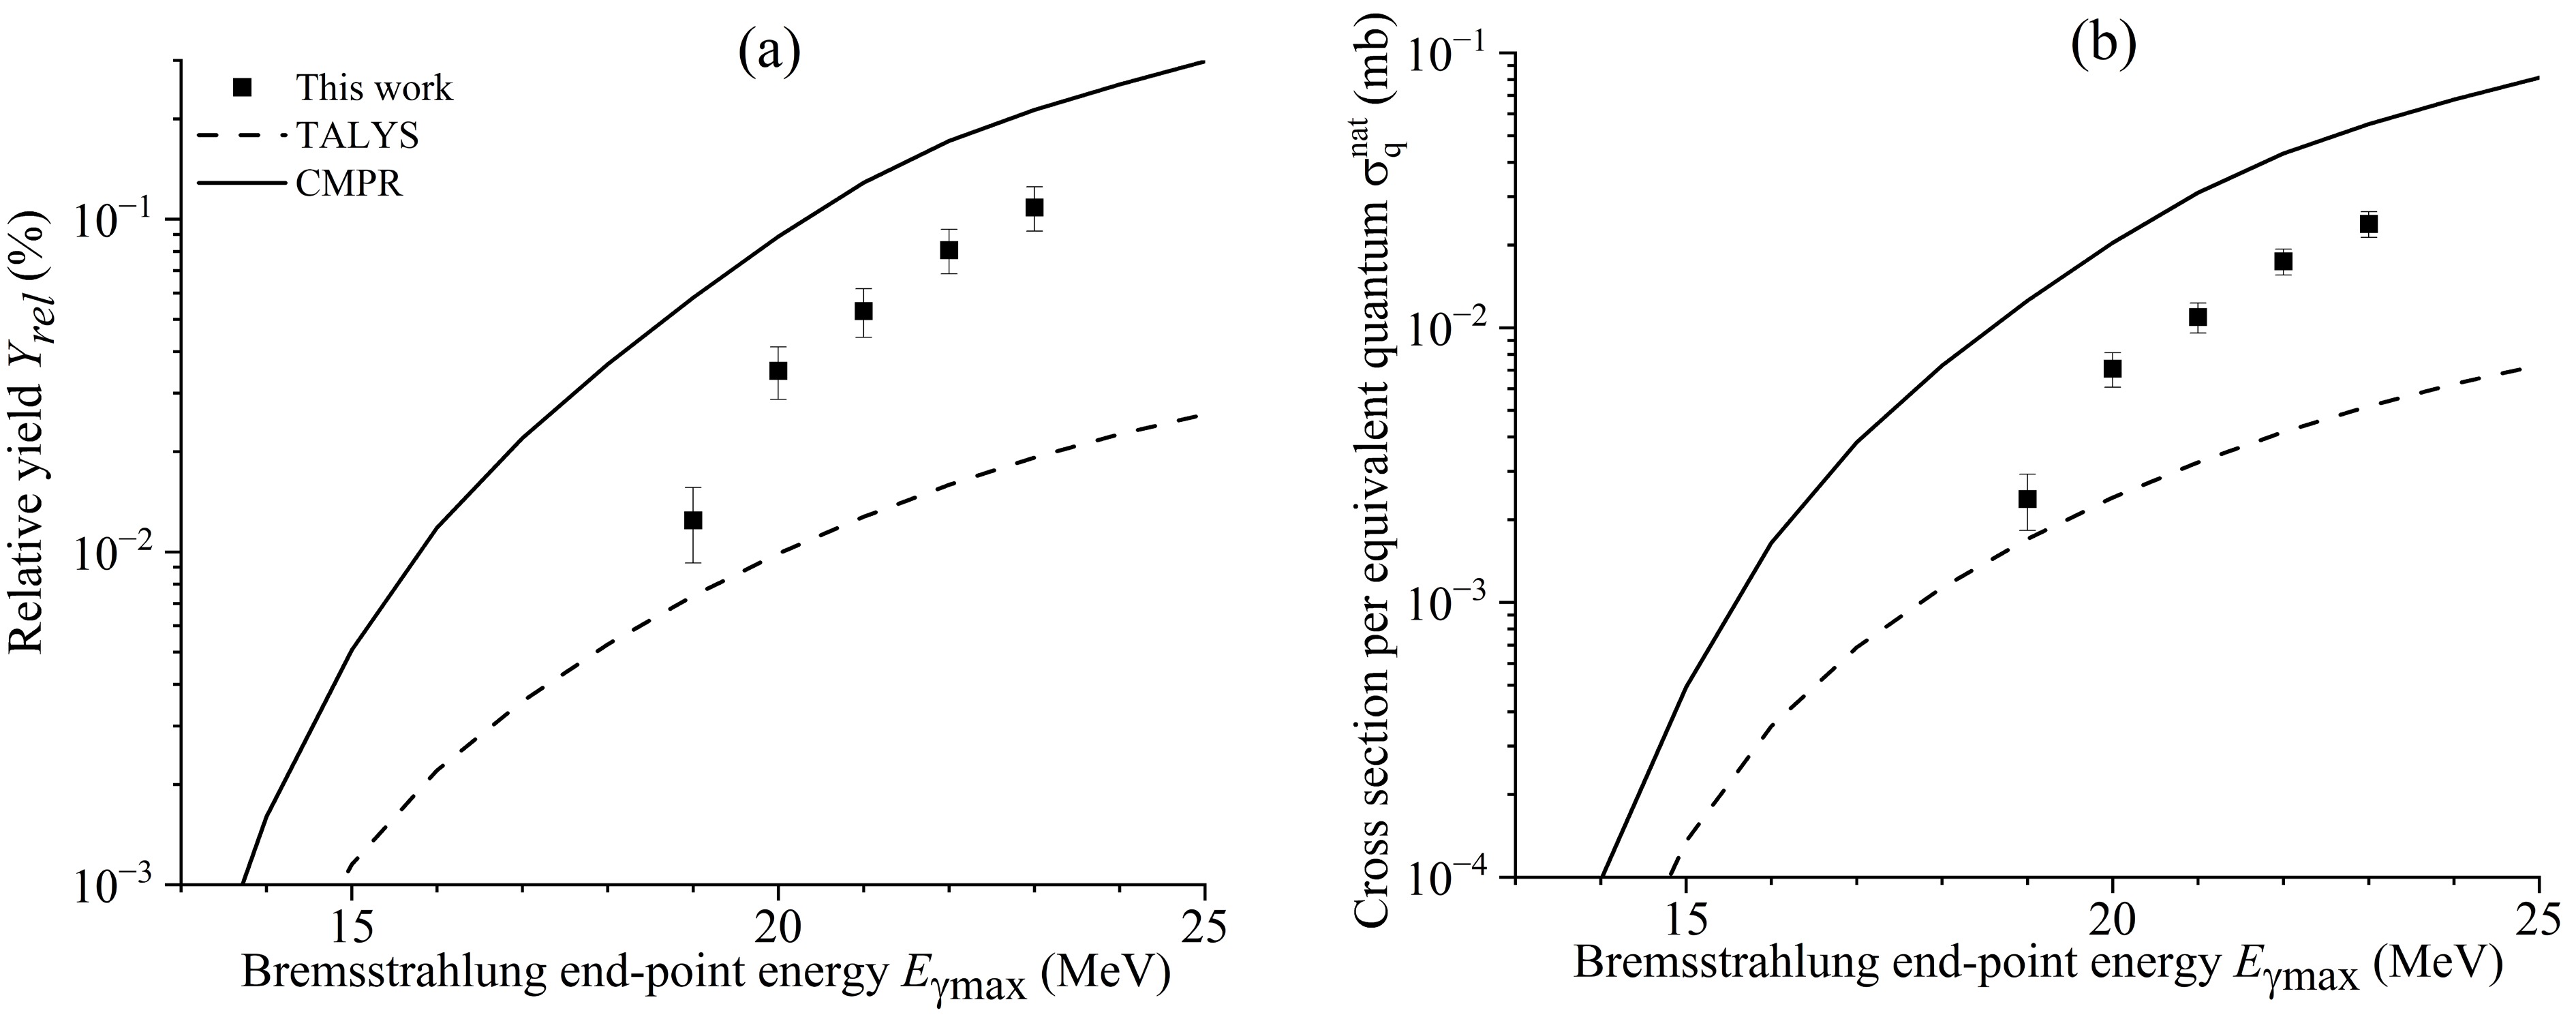
Figure 23. Relative yields (a) and cross section per equivalent quantum (b) of the 125Te(γ, p)124Sb and 126Te(γ, np)124Sb reactions as functions of the bremsstrahlung end-point energy from this study (solid rectangles) and simulated values using the CMPR (solid lines) and TALYS code (dashed lines).
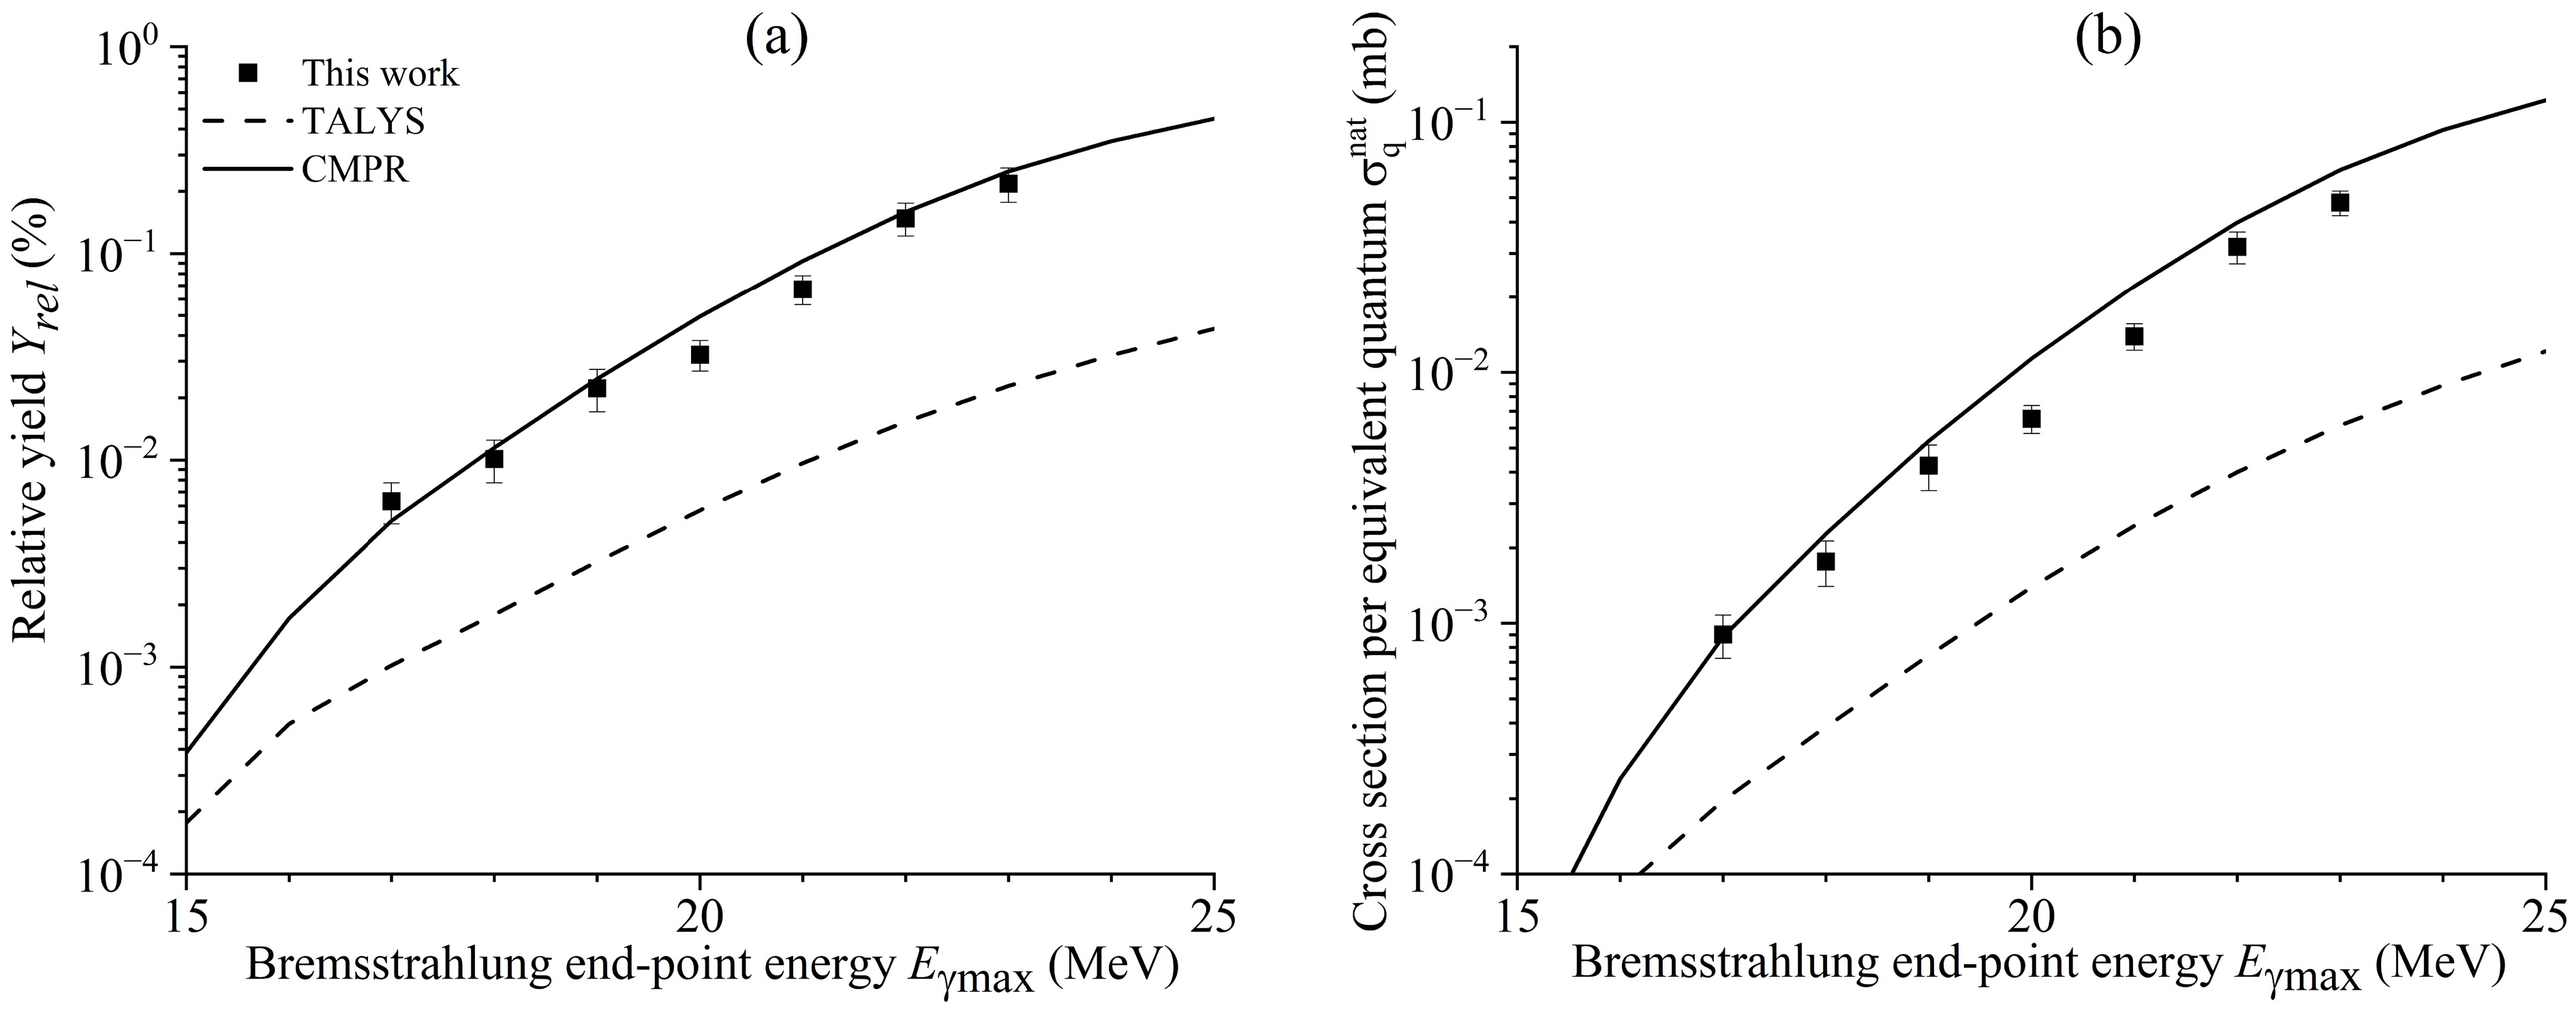
Figure 24. Relative yields (a) and cross section per equivalent quantum (b) of the reaction 128Te(γ, p)127Sb as functions of the bremsstrahlung end-point energy from this study (solid rectangles) and simulated values using the CMPR (solid lines) and TALYS code (dashed lines).
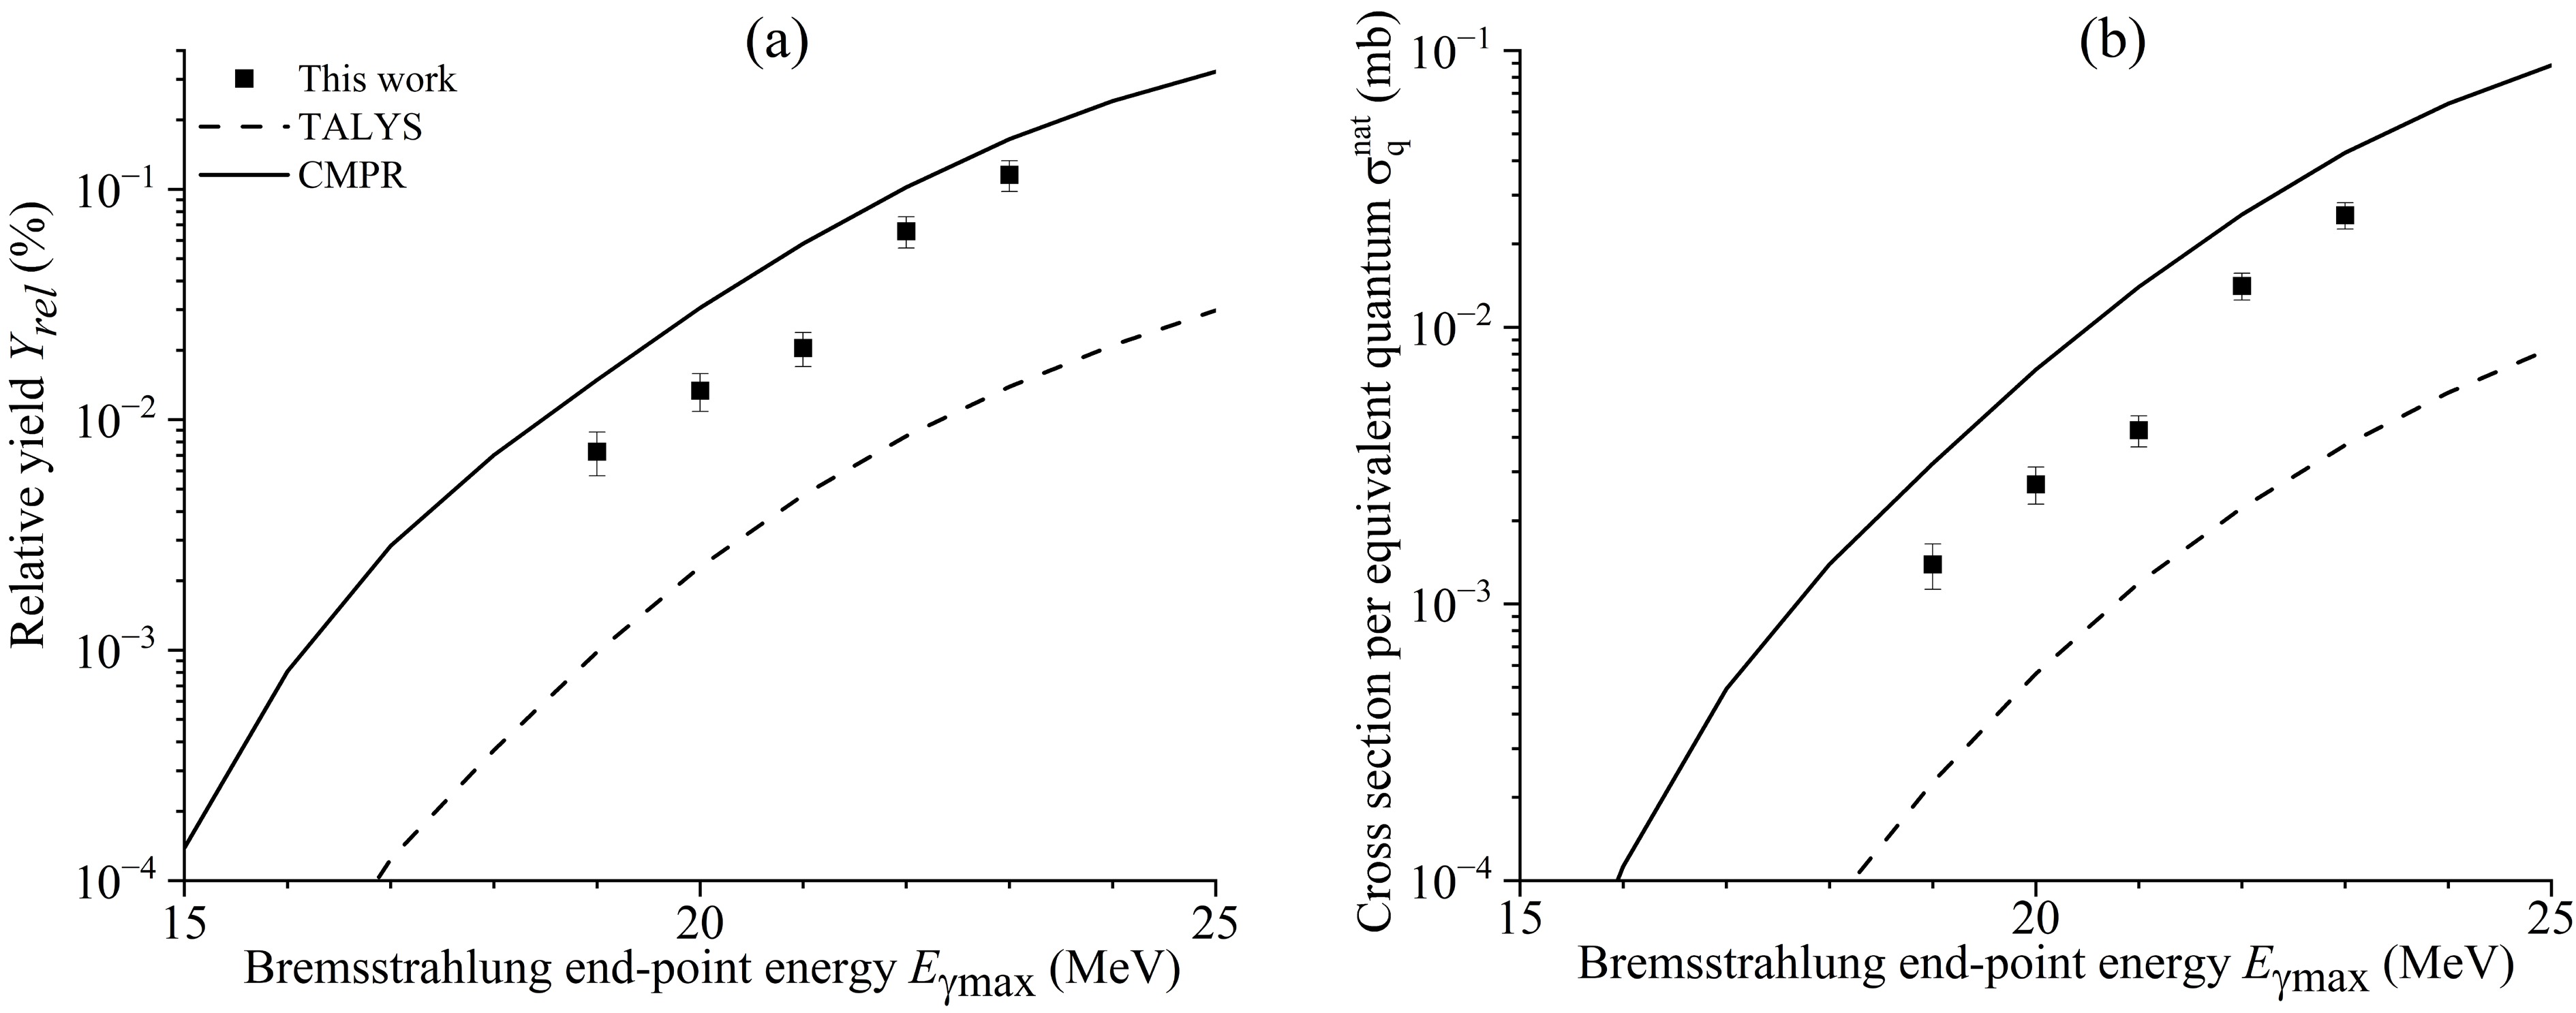
Figure 25. Relative yields (a) and cross section per equivalent quantum (b) of the reaction 130Te(γ, p)129Sb as functions of the bremsstrahlung end-point energy from this study (solid rectangles) and simulated values using the CMPR (solid lines) and TALYS code (dashed lines).
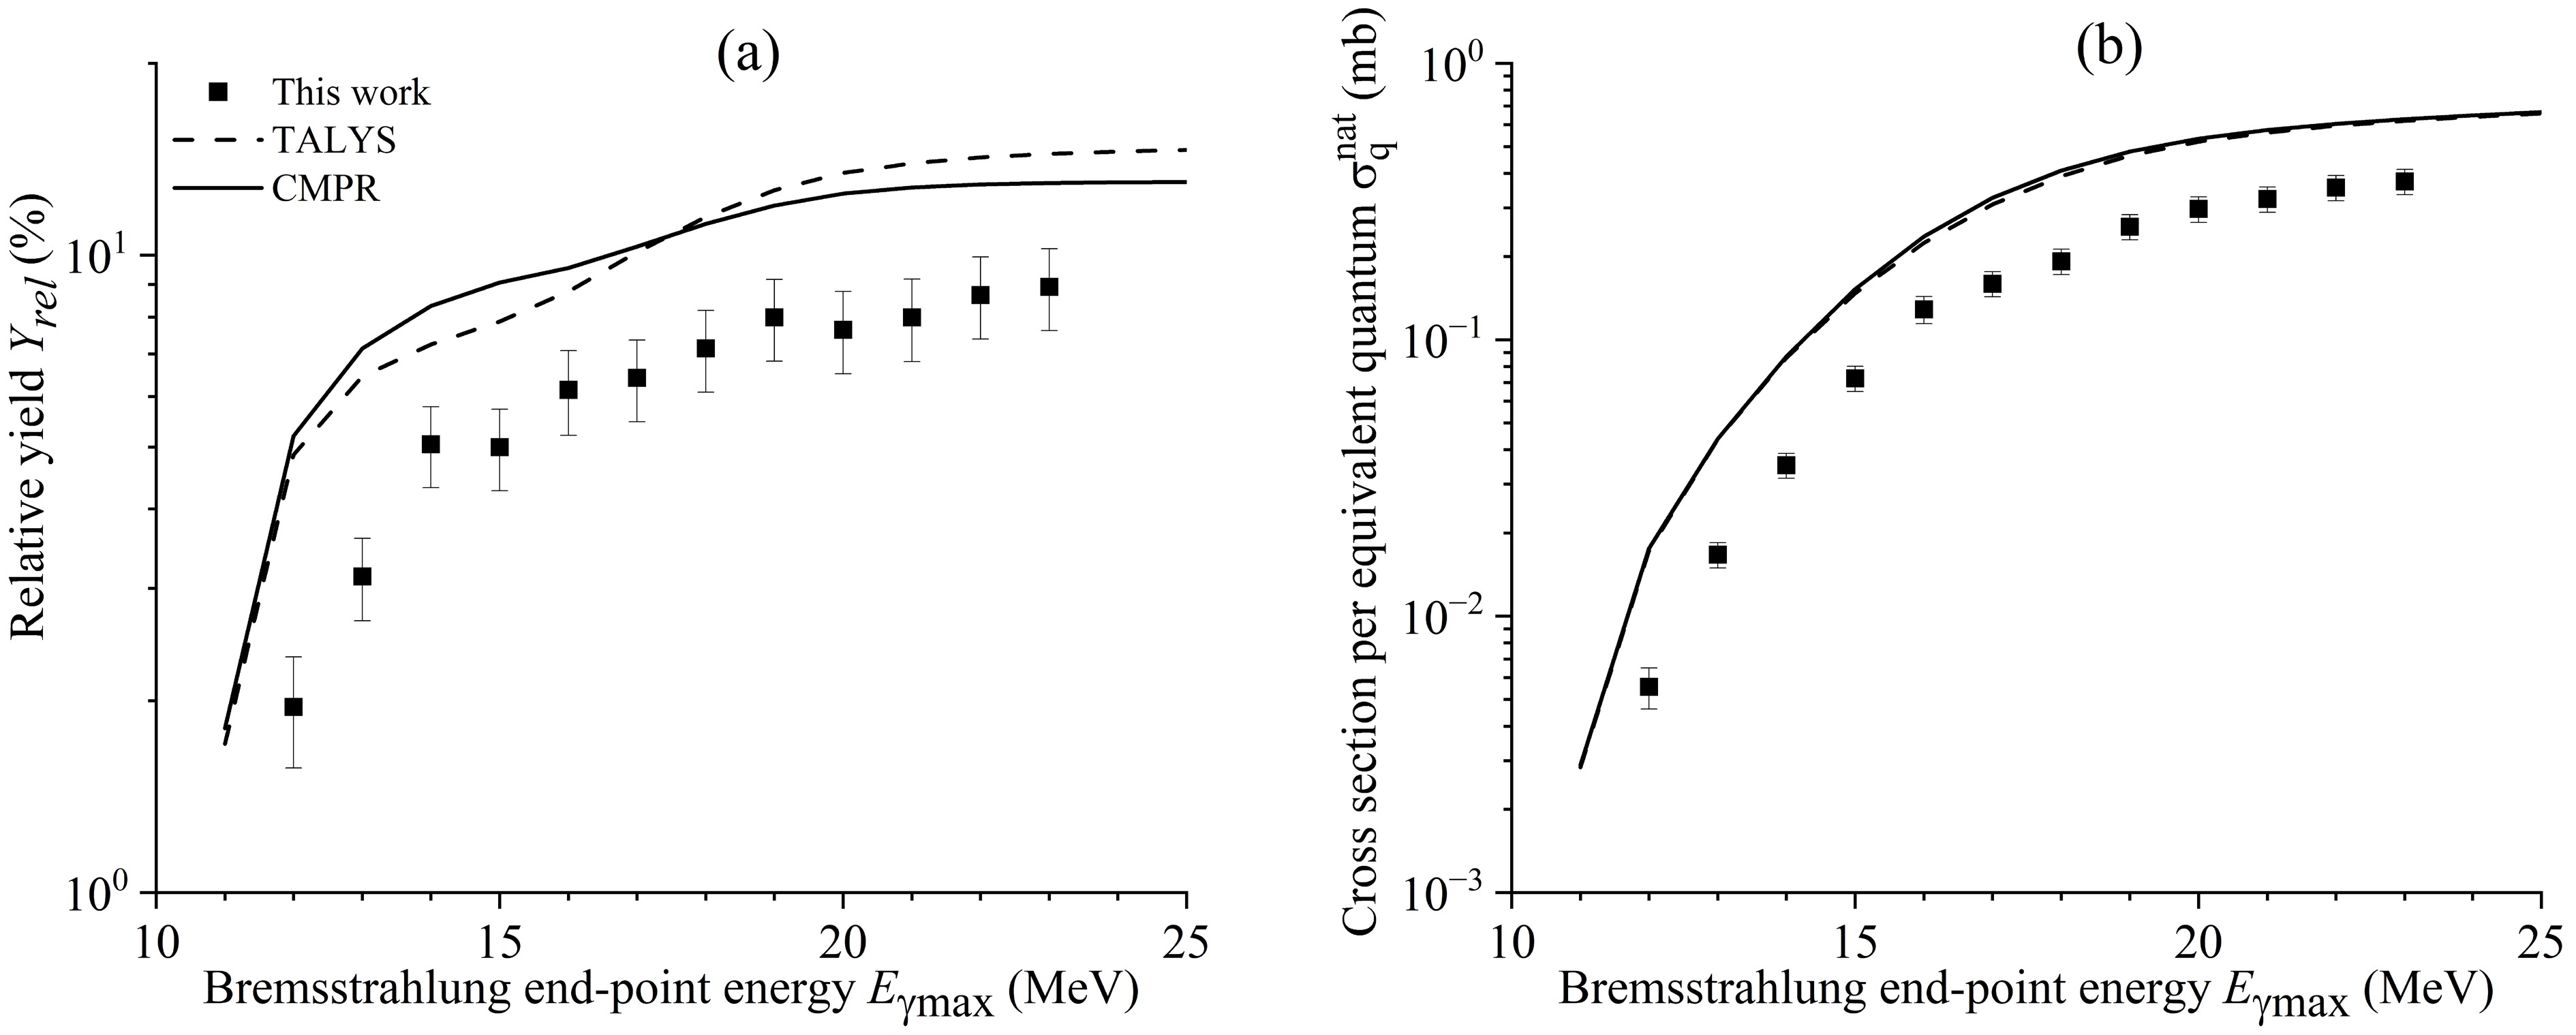
Figure 5. Relative yields (a) and cross section per equivalent quantum (b) of reaction 108Cd(γ, n)107Cd as functions of the bremsstrahlung end-point energy from this study (solid rectangles) as well as simulated values using the CMPR (solid lines) and TALYS code (dashed lines).
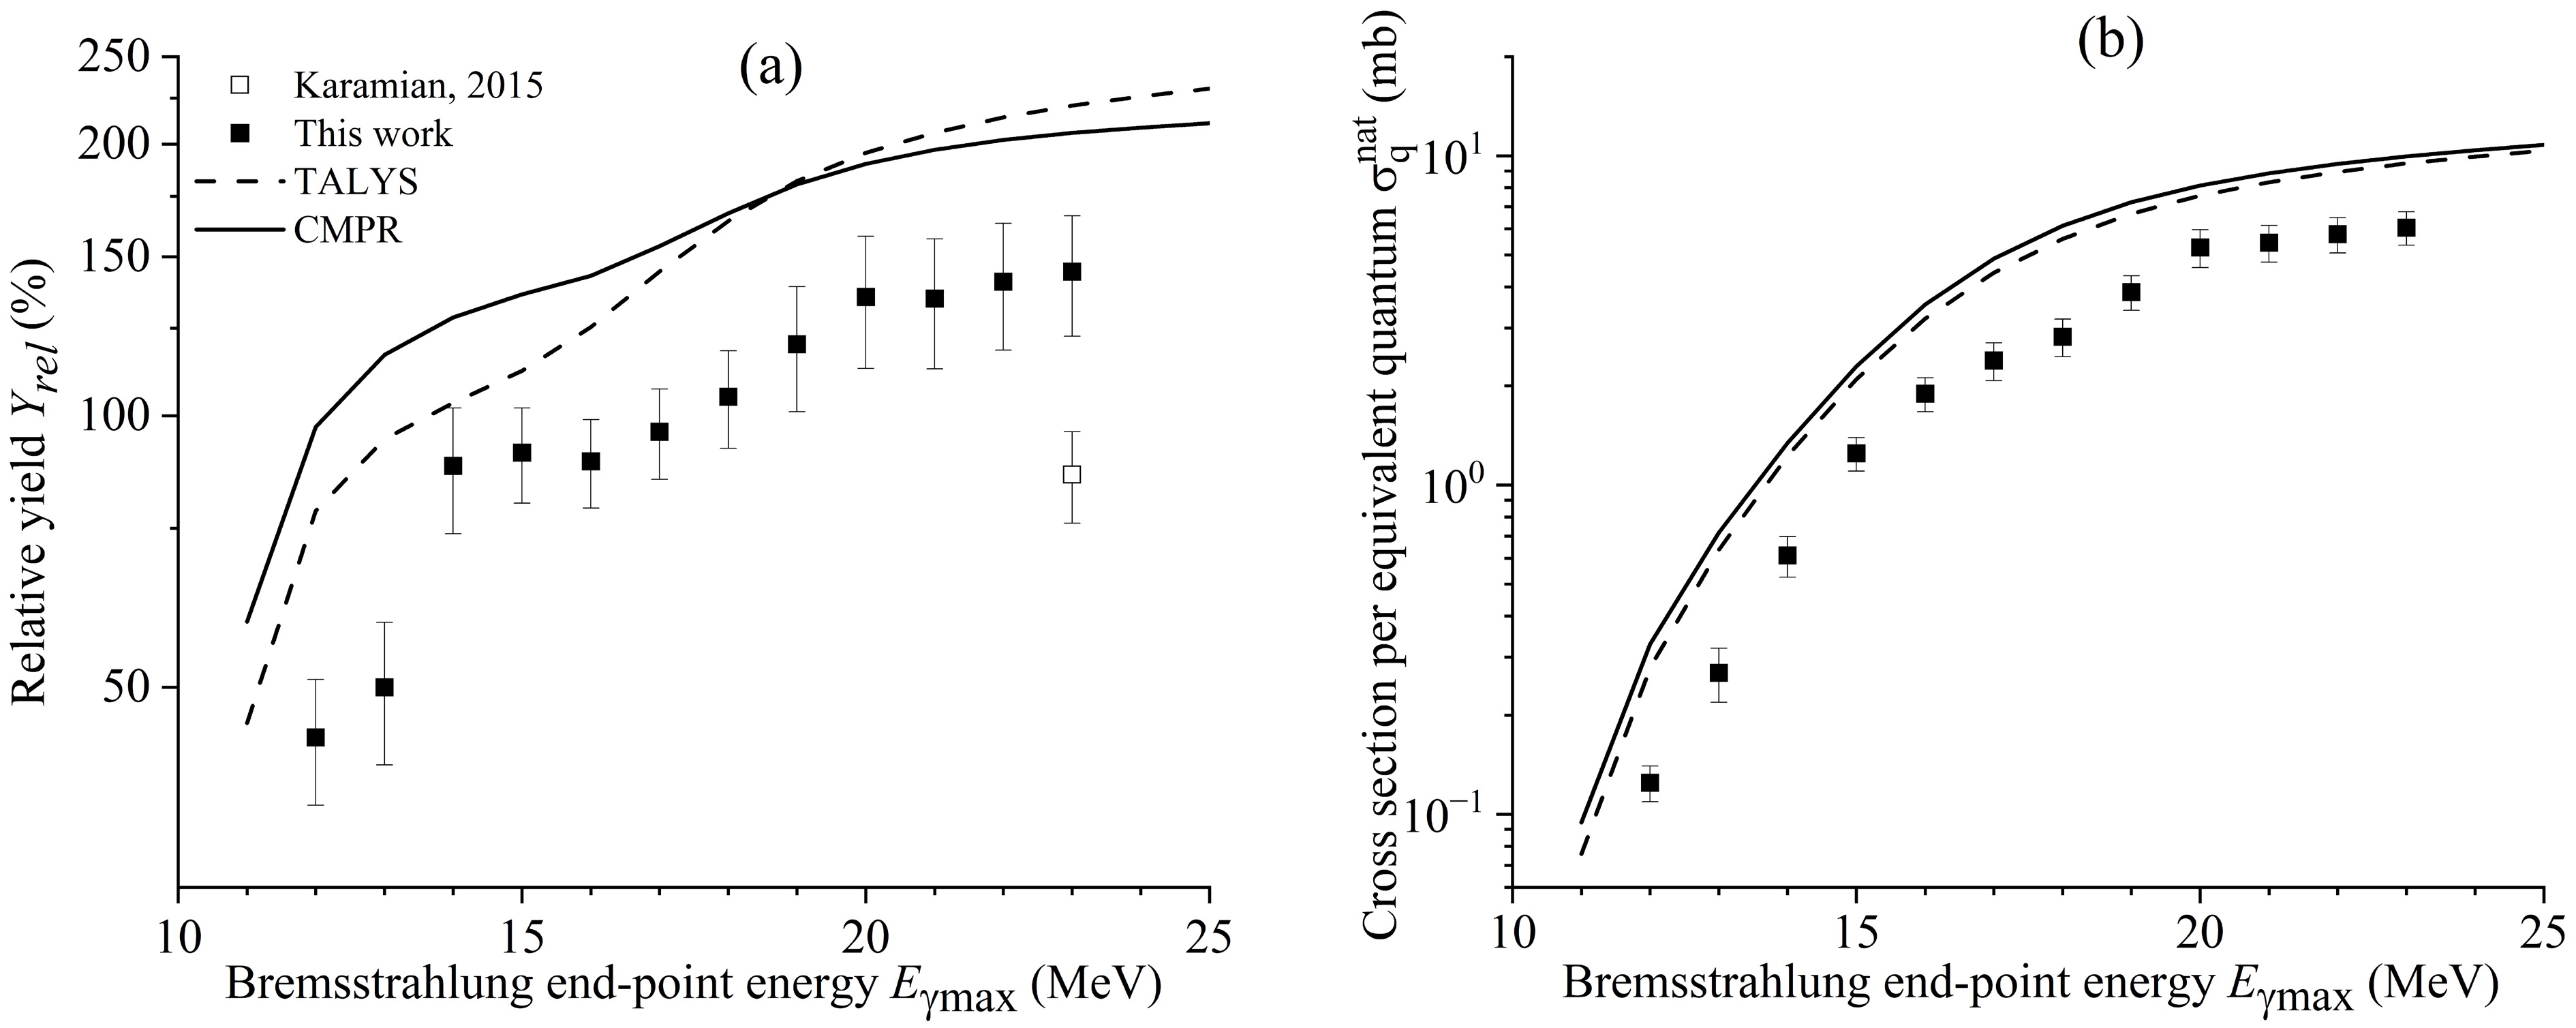
Figure 6. Relative yields (a) and cross section per equivalent quantum (b) of reactions 110Cd(γ, n)109Cd and 111Cd(γ, 2n)109Cd as functions of the bremsstrahlung end-point energy from this study (solid rectangles), literature data [3] (open rectangle), and simulated values using the CMPR (solid lines) and TALYS code (dashed lines).
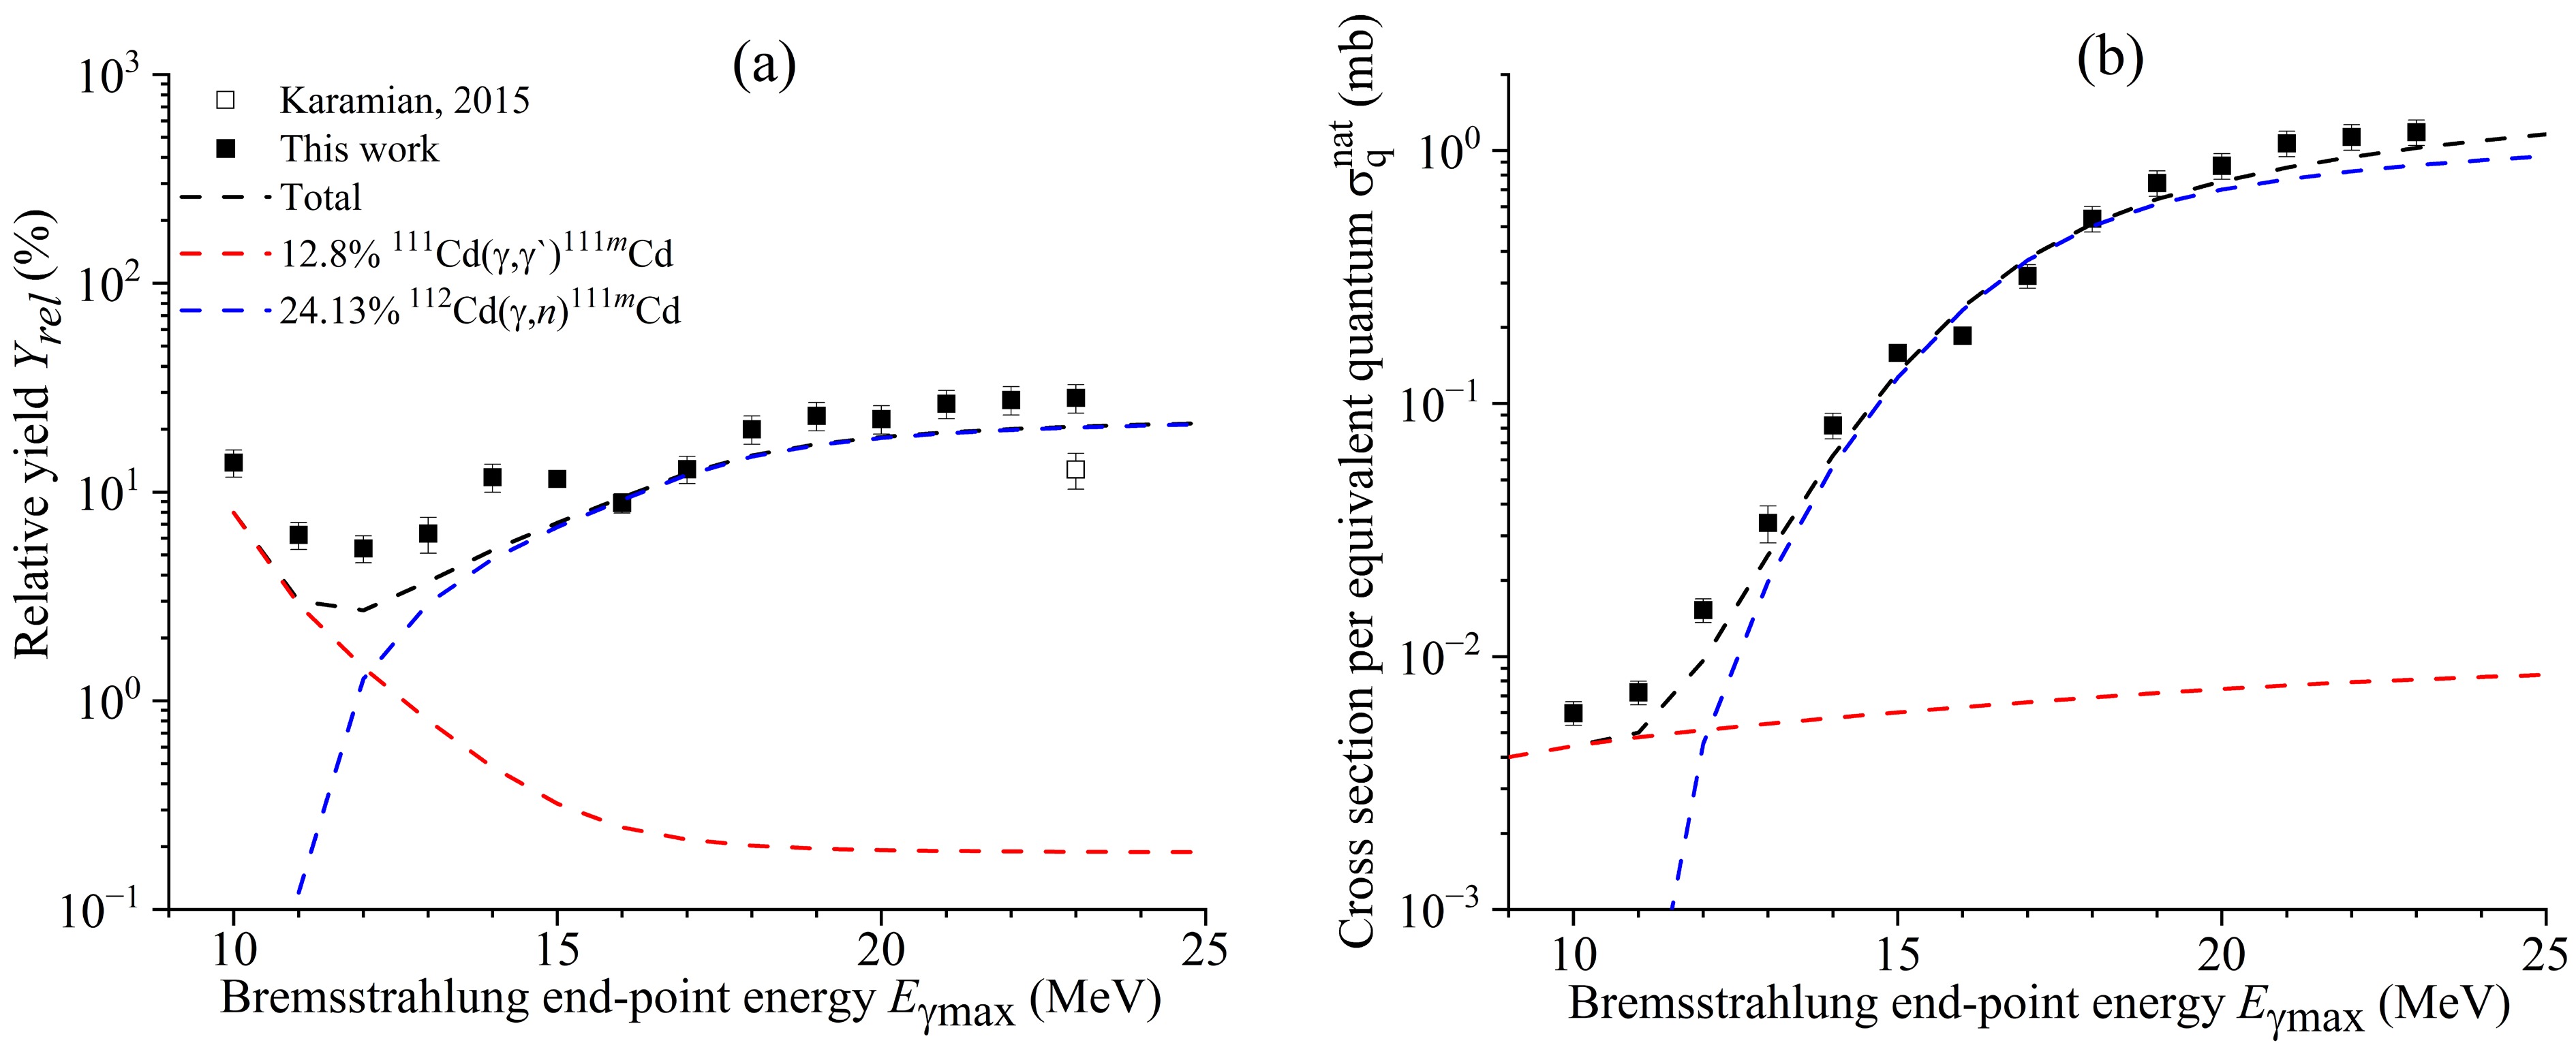
Figure 7. (color online) Relative yields (a) and cross section per equivalent quantum (b) of 111Cd(γ, γ`)111mCd and 112Cd(γ, n)111mCd reactions as functions of bremsstrahlung end-point energy from this study (solid rectangles), literature data [3] (open rectangle), and simulated values using TALYS code (dashed lines).
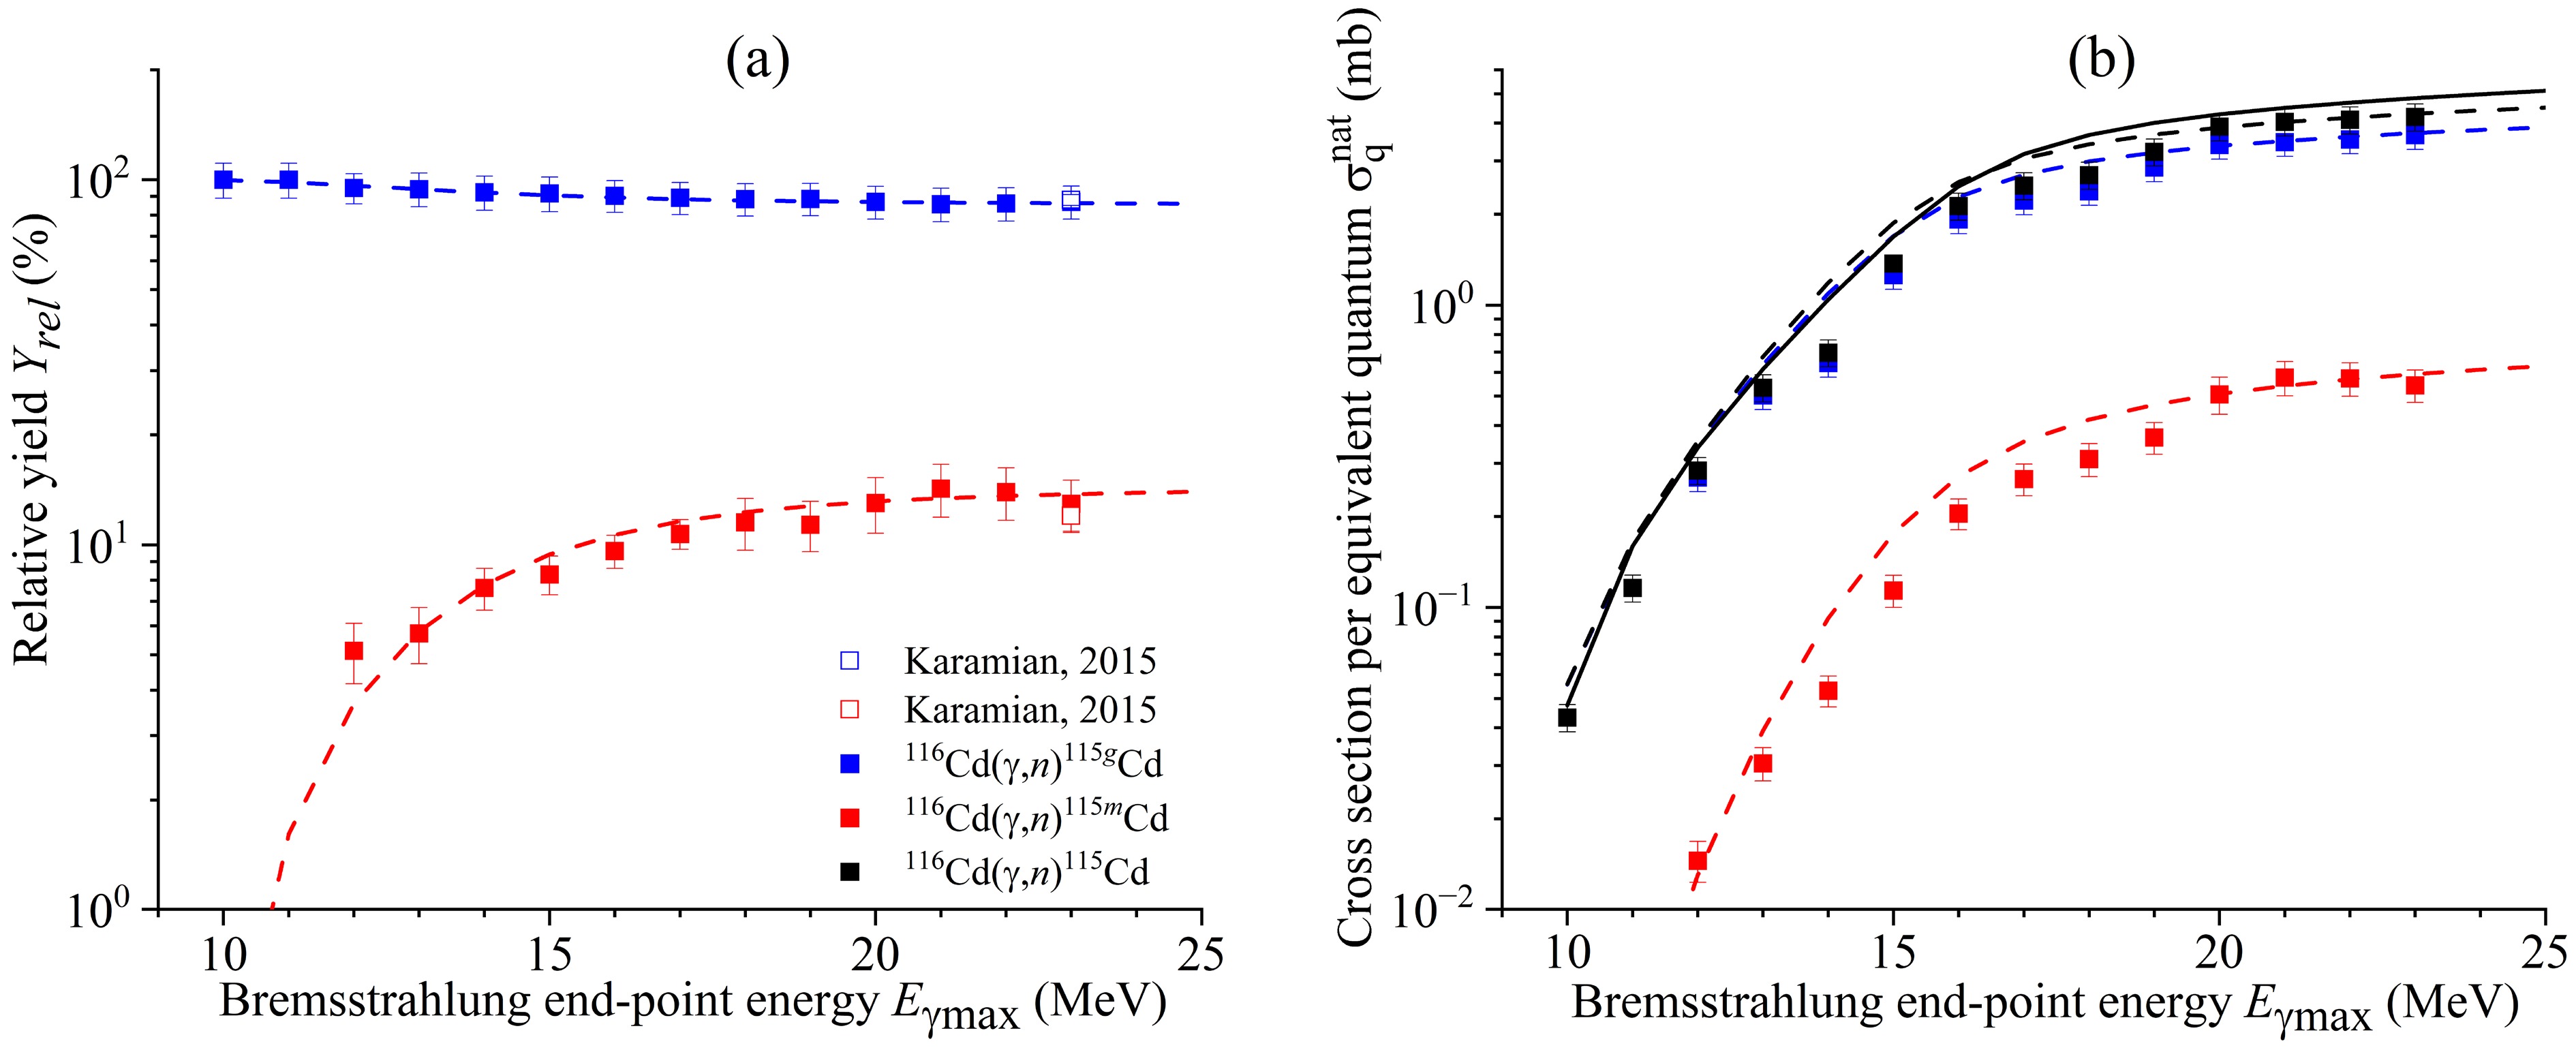
Figure 8. (color online) Relative yields (a) and cross section per equivalent quantum (b) of reaction 116Cd(γ, n)115Cd as functions of bremsstrahlung end-point energy from this study (solid rectangles), literature data [3] (open rectangles), and simulated values using the CMPR (solid line) and TALYS code (dashed lines).
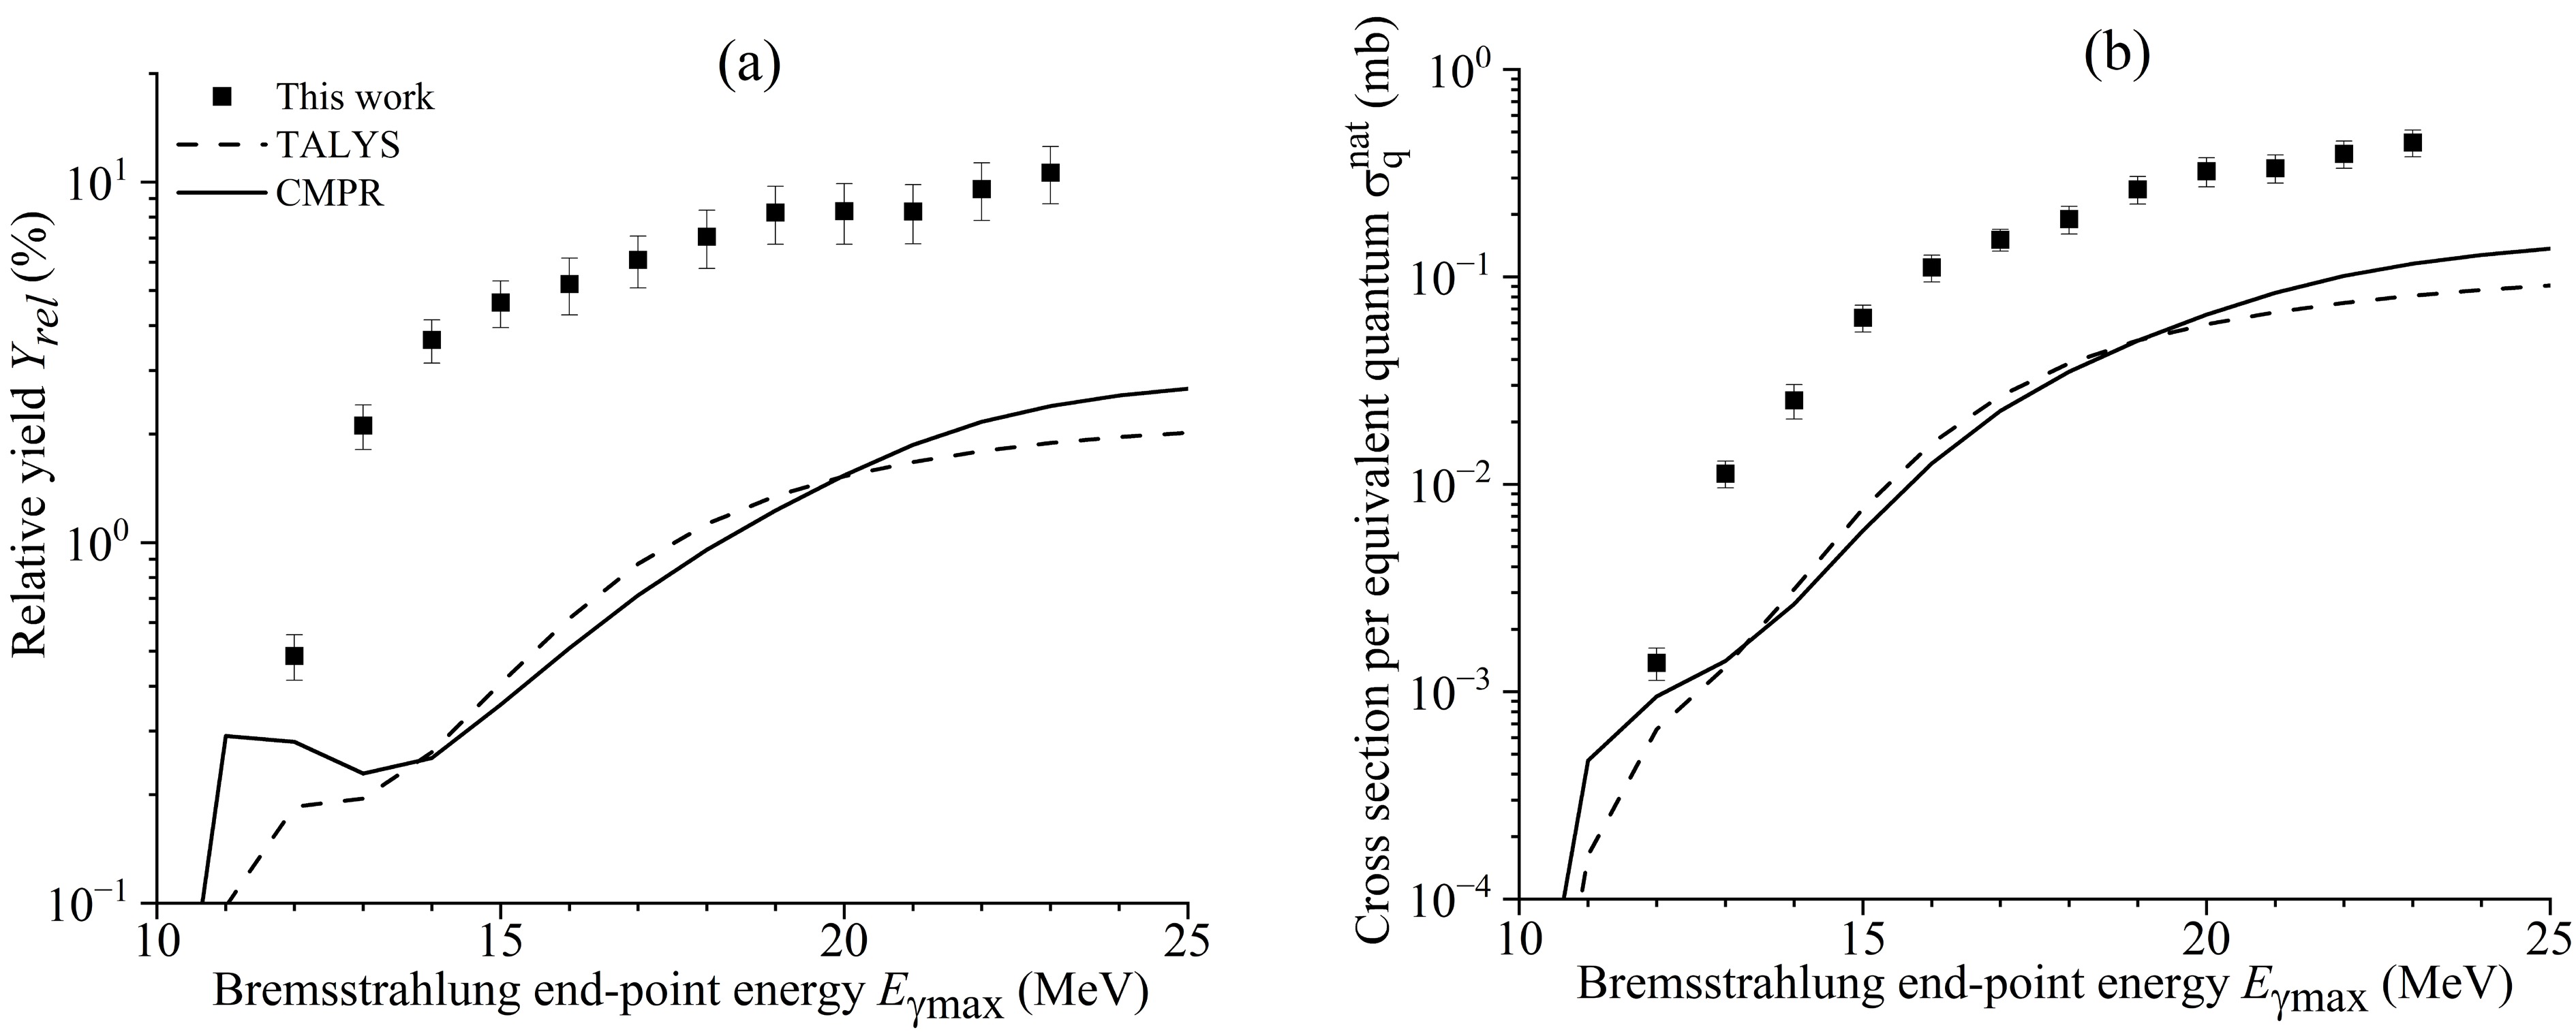
Figure 9. Relative yields (a) and cross section per equivalent quantum (b) of reaction 106Cd(γ, p)105Ag as functions of bremsstrahlung end-point energy from this study (solid rectangles) and simulated values using the CMPR (solid lines) and TALYS code (dashed lines).
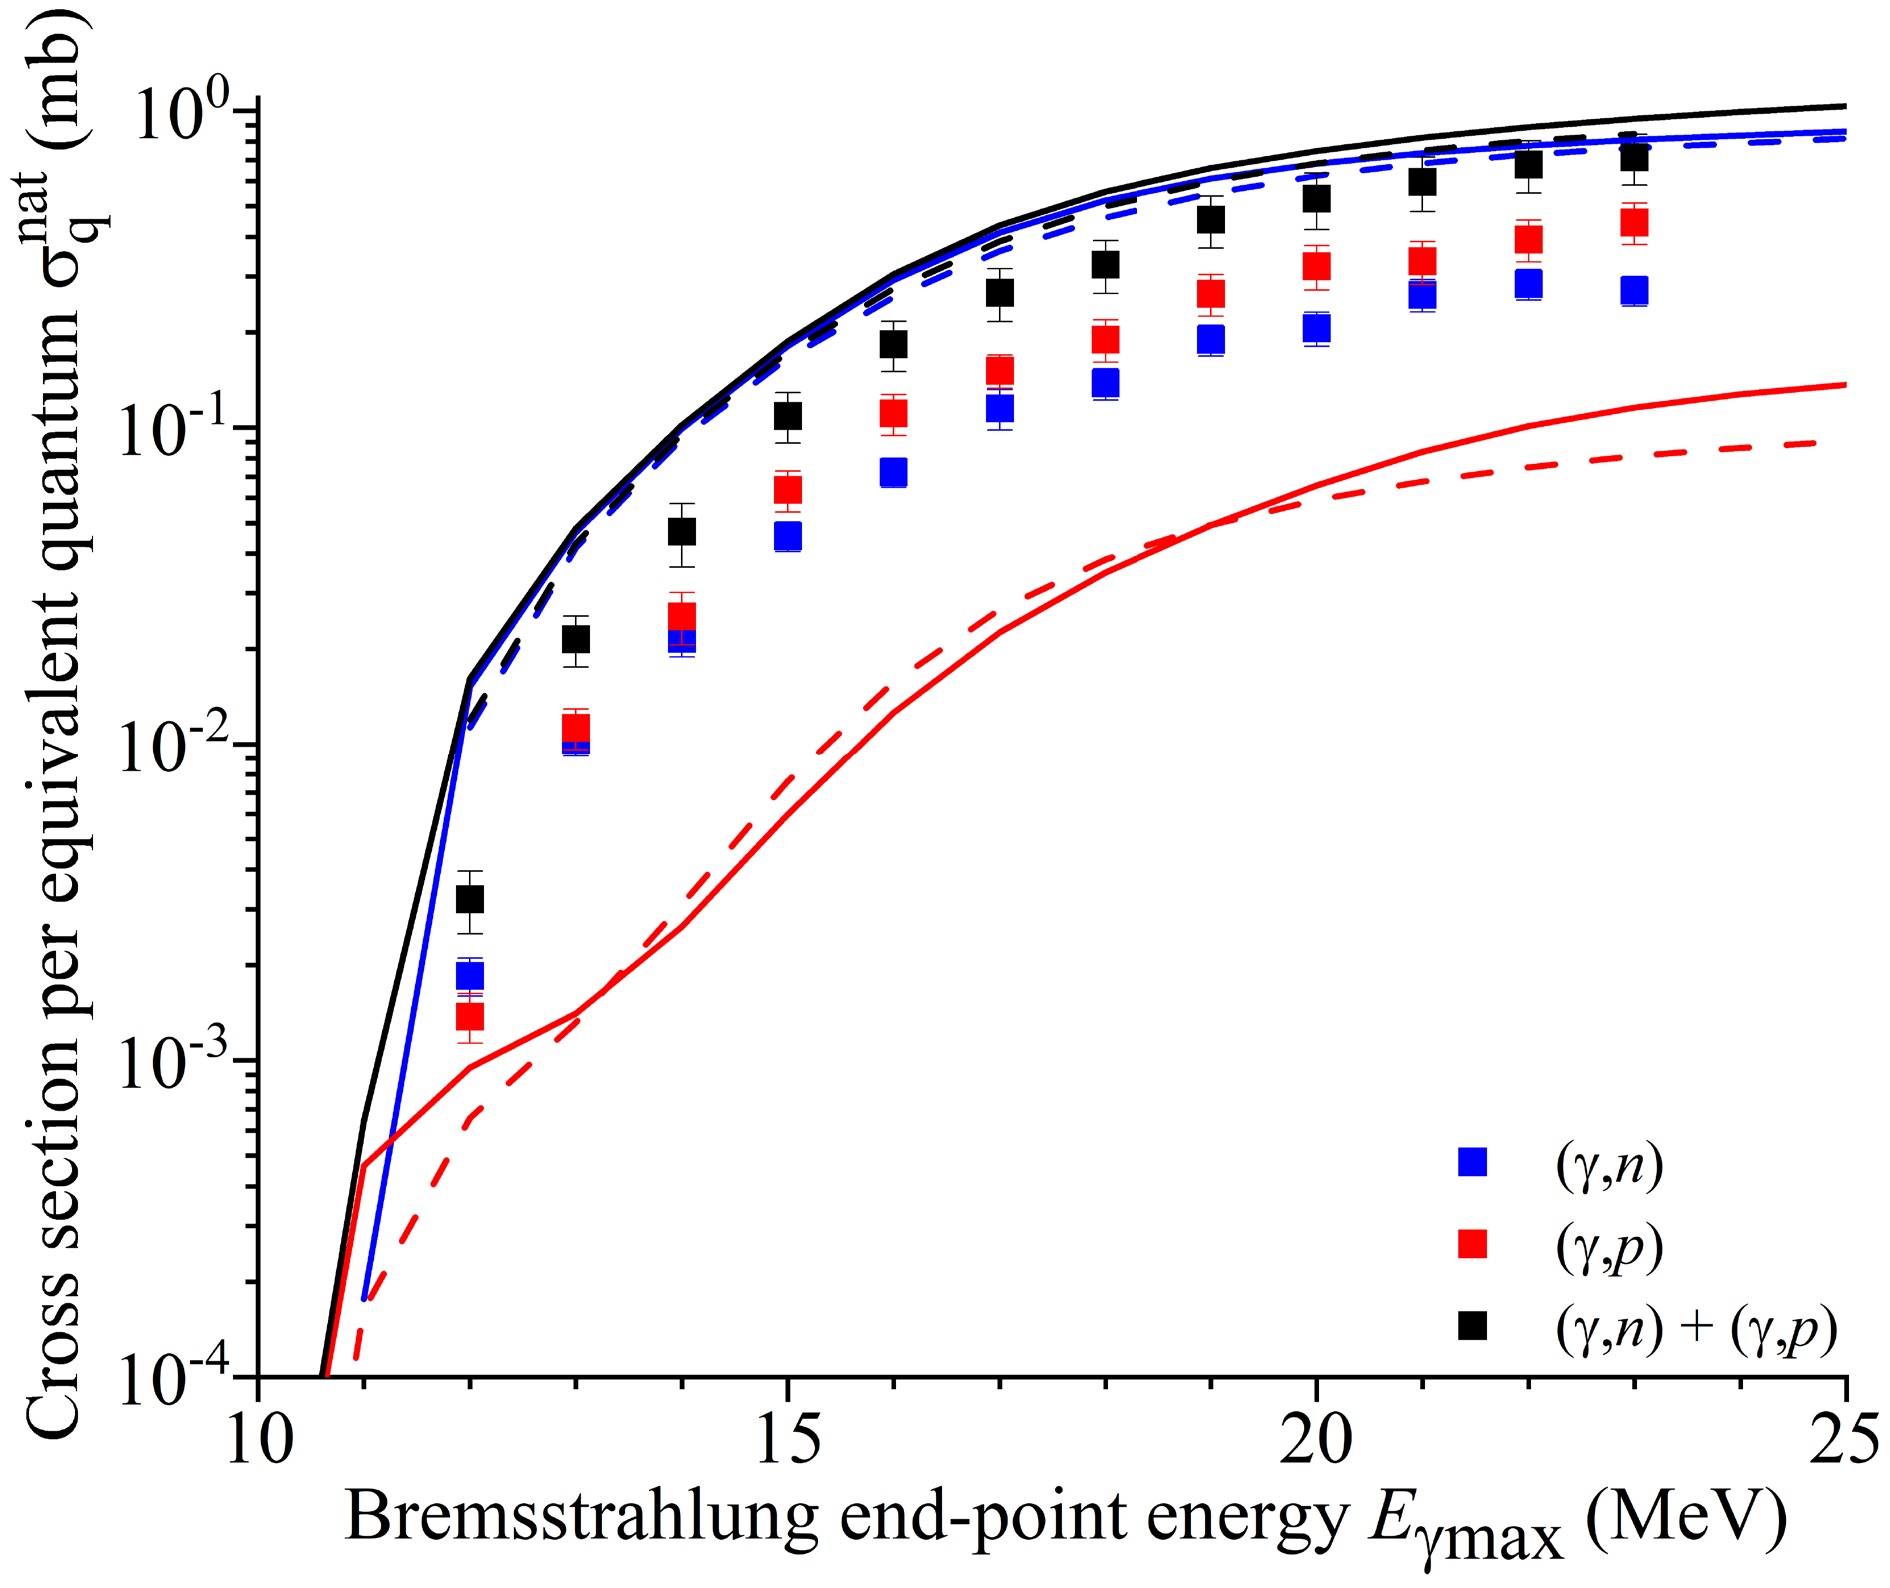
Figure 10. (color online) Cross section per equivalent quantum of 106Cd(γ, n)105Cd and 106Cd(γ, p)105Ag reactions as functions of the bremsstrahlung end-point energy from this study (solid rectangles) and simulated values using the CMPR (solid lines) and TALYS code (dashed lines).
-
The experimental yields of the reactions, Yexp, were normalized to one electron of the accelerated beam incident on the bremsstrahlung target and calculated using the following formula:
$ Y\mathrm{_{exp}}=\frac{S_p\cdot C_{\mathrm{abs}}}{\varepsilon\cdot I_{\gamma}}\frac{t_{\mathrm{real}}}{t_{\mathrm{live}}}\frac{1}{N}\frac{1}{N_e}\frac{\mathrm{e}^{\lambda\cdot t_{\mathrm{cool}}}}{(1-\mathrm{e}^{-\lambda\cdot t_{\mathrm{real}}})}\frac{\lambda\cdot t\mathrm{_{irr}}}{(1-\mathrm{e}^{-\lambda\cdot t\mathrm{_{irr}}})},~~~~~ $
(1) where
$ {S}_{p} $ is the full-energy-peak area;$ \varepsilon $ is the full-energy-peak detector efficiency;$ {I}_{\gamma } $ is the γ- emission probability;$ C\mathrm{_{abs}} $ is the correction for self-absorption of γ-rays in the sample;$ t\mathrm{_{real}} $ and$ t\mathrm{_{live}} $ are the real time and live time of the measurement, respectively;$ N $ is the number of atoms in the activation sample;$ {N}_{e} $ is the integral number of incident electrons;$ \lambda $ is the decay constant;$ t\mathrm{_{cool}} $ is the cooling time; and$ t\mathrm{_{irr}} $ is the irradiation time.The experiment determined the yields Ytheor of the photonuclear reactions, which reflect the convolution of the photonuclear reaction cross section σi(E), and distribution density of the number of bremsstrahlung photons over the energy per electron of the accelerator W(E, Eγmax). The outcome of measuring the yield of isotope generation in all possible reactions on a natural mixture of isotopes is as follows:
$ {Y}_{\mathrm{theor}}({E}_{\gamma \mathrm{max}})=\sum \limits_{i}{\eta }_{i}\int \limits_{{E}_{i\mathrm{th}}}^{{E}_{\gamma \mathrm{max}}}{\sigma }_{i}\left(E\right)W\left(E,{E}_{\gamma \mathrm{max}}\right)\mathrm{d}E, $
(2) where Eγmax is the kinetic energy of the electrons hitting the tungsten radiator, E is the energy of bremsstrahlung photons produced on the radiator, Eth is the threshold of the studied photonuclear reaction, ηi is the percentage of the studied isotope in the natural mixture, and the index i corresponds to the number of reactions contributing to the production of the studied isotope.
Figure 3 illustrates the distribution density of the number of bremsstrahlung photons W(E, Eγmax) per electron of the accelerator for accelerated electron energies from 10 to 23 MeV, determined using Geant4 for the bremsstrahlung target made of tungsten with a thickness of 3 mm.
Figure 3. Distribution density of the number of bremsstrahlung photons at the energies of 10−23 MeV
The total and partial cross sections σ(E) of the photonuclear reactions on the cadmium and tellurium isotopes were estimated for monochromatic photons using the TALYS code [24] with standard parameters and CMPR [25]. The TALYS program examines all processes in the nucleus and transitions between the states. As a result, it is possible to calculate not only the total cross section of a photonuclear reaction but also the cross sections of reactions involving the production of certain states, particularly isomeric states. The standard (default) TALYS option uses the Simple Modified Lorentzian (SMLO) model for photon strength functions (PSFs). This model is used to calculate E1, M1, and upbend components, generally providing more accurate, temperature-dependent resonance shapes than those achieved with older models.
When compared with TALYS, the CMPR accurately considers the GDR isospin splitting, which is crucial for describing the proton decay channel. The basics of the GDR isospin splitting and some relevant CMPR results are presented in Appendix B. This Appendix also provides information on TALYS options as well as examples of comparison between the TALYS and CMPR results.
The yield measurement for a natural mixture of isotopes yields gives the amount of isotope produced in all potential reactions on the natural mixture. The primary problem of bremsstrahlung beam experiments is that the yield of photonuclear reaction depends on both the investigated cross section of the reaction σi(E) and the form of the bremsstrahlung spectrum W(E, Eγmax), which is often known with inadequate accuracy. The use of relative yields allows us to determine the dependency of the yield of photonuclear reactions on the maximal energy of bremsstrahlung under various experimental settings. The overall photon absorption cross section is not taken into account when calibrating the yield of one of the most likely reactions. The the most probable and well-studied 116Cd(γ, n)115Cd and 130Te(γ, n)129Te reactions were chosen as a primary reaction in case of cadmium and tellurium, respectively. In addition, there are no other channels (for example, (γ, 2n) reaction on heavier stable nuclei) for the product formation of 115Cd and 129Te, as the nuclei 116Cd and 130Te are the heaviest stable nuclei in the natural mixture of Cd and Te.
The theoretical values of the relative yields can be calculated using the following formula:
$ {Y}_{\mathrm{rel}}{(E}_{\gamma \mathrm{max}})=\frac{\displaystyle\sum \limits_{i}{\eta }_{i} \displaystyle\int\nolimits_{{E}_{\mathrm{th}}}^{{E}_{\gamma \mathrm{max}}}{\sigma }_{i}\left(E\right)W\left(E,{E}_{\gamma \mathrm{max}}\right) \mathrm{d}E}{\eta \displaystyle\int\nolimits_{{E}_{\mathrm{th}}}^{{E}_{\gamma \mathrm{max}}}{\sigma }_{(\gamma ,n)}\left(E\right)W\left(E,{E}_{\gamma \mathrm{max}}\right) \mathrm{d}E},~~~~~ $
(3) where η denotes the percentages of the 116Cd and 130Te isotopes in the natural mixture of cadmium and tellurium isotopes, respectively. Owing to the assumption regarding the unchanged shape of the bremsstrahlung spectrum, the bremsstrahlung spectrum W(E, Eγmax) can be replaced by the photon production cross section σ(E, Eγmax) calculated using the Seltzer-Berger tables [39].
$ {Y}_{\mathrm{rel}}{(E}_{\gamma \mathrm{max}})=\frac{\displaystyle\sum \limits_{i}{\eta }_{i}\displaystyle\int\nolimits_{{E}_{\mathrm{th}}}^{{E}_{\gamma \mathrm{max}}}{\sigma }_{i}\left(E\right)\sigma \left(E,{E}_{\gamma \mathrm{max}}\right)\mathrm{d}E}{\eta \displaystyle\int\nolimits_{{E}_{\mathrm{th}}}^{{E}_{\gamma \mathrm{max}}}{\sigma }_{(\gamma ,n)}\left(E\right)\sigma \left(E,{E}_{\gamma \mathrm{max}}\right)\mathrm{d}E}.~~~~~ $
(4) To represent the experimental photonuclear reaction data, the cross section per equivalent quantum σq, determined by the following expression, is used:
$ \sigma_q(E_{\mathrm{\gamma max}})=\frac{\displaystyle\int\nolimits_{E_{\mathrm{th}}}^{E_{\mathrm{\gamma max}}}\sigma\left(E\right)\sigma\left(E,E_{\mathrm{\gamma max}}\right)\mathrm{d}E}{\dfrac{1}{E_{\mathrm{\gamma max}}}\displaystyle\int\nolimits_0^{E_{\mathrm{\gamma max}}}E\cdot\sigma\left(E,E_{\mathrm{\gamma max}}\right)\mathrm{d}E}. $
(5) The cross section per equivalent quantum for a natural mixture of isotopes includes all possible channels of the final isotope production, where the percentage of initial nuclei is accounted for as follows:
$ \sigma_q^{\mathrm{nat}}(E\mathrm{_{\gamma max}})=\frac{\displaystyle\sum\limits_{i=1}^8\eta_i \displaystyle\int\nolimits_{E_{\mathrm{th}}}^{E_{\mathrm{\gamma max}}}\sigma_i\left(E\right)\sigma\left(E,E_{\mathrm{\gamma max}}\right)\mathrm{d}E}{\dfrac{1}{E\mathrm{_{\gamma max}}}\displaystyle\int\nolimits_0^{E_{\mathrm{\gamma max}}}E\cdot\sigma\left(E,E_{\mathrm{\gamma max}}\right)\mathrm{d}E}. $
(6) The experimental points along the cross sections of the (γ, n) [22] and (γ, n) + (γ, pn) [16] reactions on the isotopes 120,128,130Te were approximated by the Lorentz function, and the relative yields Yrel and cross sections per equivalent quantum σq were calculated based on the least squares approximation. In Figs. 4−10, these points are indicated by open circles [22] and open rectangles [16], respectively.
Figure 4. Relative yields (a) and cross section per equivalent quantum (b) of reaction 106Cd(γ, n)105Cd as functions of the bremsstrahlung end-point energy from this study (solid rectangles) and simulated values using the CMPR (solid lines) and TALYS code (dashed lines).
Figure 11. Relative yields (a) and cross section per equivalent quantum (b) of reaction 112Cd(γ, p)111Ag as functions of the bremsstrahlung end-point energy from this study (solid rectangles), literature data [3] (open rectangle), and simulated values using the CMPR (solid lines) and TALYS code (dashed lines).
Figure 12. Relative yields (a) and cross section per equivalent quantum (b) of reaction 113Cd(γ, p)112Ag as functions of the bremsstrahlung end-point energy from this study (solid rectangles), literature data [3] (open rectangle), and simulated values using the CMPR (solid lines) and TALYS code (dashed lines).
Figure 13. Relative yields (a) and cross section per equivalent quantum (b) of reaction 114Cd(γ, p)113Ag as functions of the bremsstrahlung end-point energy from this study (solid rectangles), literature data [3] (open rectangle), and simulated values using the CMPR (solid lines) and TALYS code (dashed lines).
Figure 14. Relative yields (a) and cross section per equivalent quantum (b) of reaction 116Cd(γ, p)115Ag as functions of bremsstrahlung end-point energy from this study (solid rectangles) and simulated values using the CMPR (solid lines) and TALYS code (dashed lines).
Figure 15. (color online) Relative yields (a) and cross section per equivalent quantum (b) of reaction 120Te(γ, n)119Te as functions of the bremsstrahlung end-point energy from this study (solid rectangles), literature data [22] (open circles), and simulated values using the CMPR (solid lines) and TALYS code (dashed lines).
Figure 16. (color online) Relative yields (a) and cross section per equivalent quantum (b) of the 122Te(γ, n)121Te and 123Te(γ, 2n)121Te reactions as functions of the bremsstrahlung end-point energy from this study (solid rectangles) and simulated values using the CMPR (solid lines) and TALYS code (dashed lines).
Figure 17. (color online) Relative yields (a) and cross section per equivalent quantum (b) of 123Te(γ, γ`)123mTe, 124Te(γ, n)123mTe, and 125Te(γ, 2n)123mTe reactions as functions of the bremsstrahlung end-point energy from this study (solid rectangles) and simulated values using TALYS code.
Figure 18. (color online) Relative yields (a) and cross section per equivalent quantum (b) of 125Te(γ, γ`)125mTe and 126Te(γ, n)125mTe reactions as functions of the bremsstrahlung end-point energy from this study (solid rectangles) and simulated values using TALYS code.
Figure 19. Relative yields (a) and cross section per equivalent quantum (b) of 128Te(γ, n)127Te reaction as functions of the bremsstrahlung end-point energy from this study (solid rectangles), literature data [22] (open rectangles), and simulated values using the CMPR (solid lines) and TALYS code (dashed lines).
Figure 20. (color online) Relative yields (a) and cross section per equivalent quantum (b) of the reaction 130Te(γ, n)129Te as functions of the bremsstrahlung end-point energy from this study (solid rectangles), literature data [22] (open rectangles), and simulated values using the CMPR (solid line) and TALYS code (dashed lines).
Figure 21. Relative yields (a) and cross section per equivalent quantum (b) of the 123Te(γ, p)122Sb and 124Te(γ, np)122Sb reactions as functions of the bremsstrahlung end-point energy from this study (solid rectangles) and simulated values using the CMPR (solid lines) and TALYS code (dashed lines).
Figure 22. Ratio of the cross section per equivalent quantum
$ \sigma_{q\mathrm{exp}}^{\mathrm{nat}}/\sigma_{q\mathrm{theory}}^{\mathrm{nat}} $ for the 123Te(γ, p)122Sb reaction.
Figure 23. Relative yields (a) and cross section per equivalent quantum (b) of the 125Te(γ, p)124Sb and 126Te(γ, np)124Sb reactions as functions of the bremsstrahlung end-point energy from this study (solid rectangles) and simulated values using the CMPR (solid lines) and TALYS code (dashed lines).
Figure 24. Relative yields (a) and cross section per equivalent quantum (b) of the reaction 128Te(γ, p)127Sb as functions of the bremsstrahlung end-point energy from this study (solid rectangles) and simulated values using the CMPR (solid lines) and TALYS code (dashed lines).
Figure 25. Relative yields (a) and cross section per equivalent quantum (b) of the reaction 130Te(γ, p)129Sb as functions of the bremsstrahlung end-point energy from this study (solid rectangles) and simulated values using the CMPR (solid lines) and TALYS code (dashed lines).
Figure 5. Relative yields (a) and cross section per equivalent quantum (b) of reaction 108Cd(γ, n)107Cd as functions of the bremsstrahlung end-point energy from this study (solid rectangles) as well as simulated values using the CMPR (solid lines) and TALYS code (dashed lines).
Figure 6. Relative yields (a) and cross section per equivalent quantum (b) of reactions 110Cd(γ, n)109Cd and 111Cd(γ, 2n)109Cd as functions of the bremsstrahlung end-point energy from this study (solid rectangles), literature data [3] (open rectangle), and simulated values using the CMPR (solid lines) and TALYS code (dashed lines).
Figure 7. (color online) Relative yields (a) and cross section per equivalent quantum (b) of 111Cd(γ, γ`)111mCd and 112Cd(γ, n)111mCd reactions as functions of bremsstrahlung end-point energy from this study (solid rectangles), literature data [3] (open rectangle), and simulated values using TALYS code (dashed lines).
Figure 8. (color online) Relative yields (a) and cross section per equivalent quantum (b) of reaction 116Cd(γ, n)115Cd as functions of bremsstrahlung end-point energy from this study (solid rectangles), literature data [3] (open rectangles), and simulated values using the CMPR (solid line) and TALYS code (dashed lines).
Figure 9. Relative yields (a) and cross section per equivalent quantum (b) of reaction 106Cd(γ, p)105Ag as functions of bremsstrahlung end-point energy from this study (solid rectangles) and simulated values using the CMPR (solid lines) and TALYS code (dashed lines).
Figure 10. (color online) Cross section per equivalent quantum of 106Cd(γ, n)105Cd and 106Cd(γ, p)105Ag reactions as functions of the bremsstrahlung end-point energy from this study (solid rectangles) and simulated values using the CMPR (solid lines) and TALYS code (dashed lines).
-
The experimental yields of the reactions Yexp were normalized to one electron of the accelerated beam incident on the bremsstrahlung target and calculated using the following formula:
$ {Y}_{exp}=\frac{{S}_{p}\cdot {C}_{abs}}{\varepsilon \cdot {I}_{\gamma }}\frac{{t}_{real}}{{t}_{live}}\frac{1}{N}\frac{1}{{N}_{e}}\frac{{e}^{\lambda \cdot {{t}_{cool}}}}{(1-{e}^{-\lambda \cdot {{t}_{real}}})}\frac{\lambda \cdot {t}_{irr}}{(1-{e}^{-\lambda \cdot {{t}_{irr}}})},~~~~~ $
(1) where
$ {S}_{p} $ is the full-energy-peak area;$ \varepsilon $ is the full-energy-peak detector efficiency;$ {I}_{\gamma } $ is the γ- emission probability;$ {C}_{abs} $ is the correction for self-absorption of γ-rays in the sample;$ {t}_{real} $ and$ {t}_{live} $ are the real time and live time of the measurement, respectively;$ N $ is the number of atoms in the activation sample;$ {N}_{e} $ is the integral number of incident electrons;$ \lambda $ is the decay constant;$ {t}_{cool} $ is the cooling time; and$ {t}_{irr} $ is the irradiation time.The experiment determined the yields Ytheor of photonuclear reactions, which reflect the convolution of the photonuclear reactions cross section σi(E), and the distribution density of the number of bremsstrahlung photons over energy per one electron of the accelerator W(E, Eγmax). The outcome of measuring the yield of isotope generation in all possible reactions on a natural mixture of isotopes is as follows:
$ {Y}_{theor}({E}_{\gamma max})=\sum \limits_{i}{\eta }_{i}\int \limits_{{E}_{ith}}^{{E}_{\gamma max}}{\sigma }_{i}\left(E\right)W\left(E,{E}_{\gamma max}\right)dE $
(2) where Eγmax is the kinetic energy of electrons hitting the tungsten radiator, E is the energy of bremsstrahlung photons produced on the radiator, Eth is the threshold of the studied photonuclear reaction, ηi is the percentage of the studied isotope in the natural mixture, and the index i corresponds to the number of the reaction contributing to the production of the studied isotope.
Figure 3 illustrates the distribution density of the number of bremsstrahlung photons W(E, Eγmax) per one electron of the accelerator for accelerated electron energies from 10 to 23 MeV, determined using Geant4 for the bremsstrahlung target made of tungsten with a thickness of 3 mm.
Figure 3. The distribution density of the number of bremsstrahlung photons at the energies of 10-23 MeV
The total and partial cross sections σ(E) of photonuclear reactions on cadmium and tellurium isotopes were estimated for monochromatic photons using the TALYS code [24] with standard parameters, and CMPR [25]. The TALYS program examines all processes in the nucleus and transitions between states. As a result, it is possible to calculate not only the total cross sections of photonuclear reactions, but also the cross sections of reactions involving the production of certain states, particularly isomeric states. The standard (default) TALYS option uses Simple Modified Lorentzian (SMLO) model for photon strength functions (PSF). This model is used to calculate E1, M1, and upbend components, generally providing more accurate, temperature-dependent resonance shapes than older models.
As compared with TALYS, the CMPR accurately takes into account the GDR isospin splitting, which is of a crucial importance for description of the proton decay channel. The basics of the GDR isospin splitting and some relevant CMPR results are presented in Appendix 2. This Appendix also provides the information on TALYS options as well as examples of comparison of TALYS and CMPR results
The yield measurement for a natural mixture of isotopes yields gives the amount of isotope produced in all potential reactions on the natural mixture. The primary problem of bremsstrahlung beam experiments is that the yield of photonuclear reaction depends on both the investigated cross section of the reaction σi(E) and the form of the bremsstrahlung spectrum W(E, Eγmax), which is often known with inadequate accuracy. The use of relative yields allows us to determine the dependency of the yield of photonuclear reactions on the maximal energy of bremsstrahlung under various experimental settings. The overall photon absorption cross section is not taken into account when calibrating the yield of one of the most likely reactions. The the most probable and well-studied 116Cd(γ,n)115Cd and 130Te(γ,n)129Te reactions were chosen as a primary reaction in case of cadmium and tellurium, respectively. Also there are no other channels (for example, (γ,2n) reaction on heavier stable nuclei) for product formation of 115Cd and 129Te since the nuclei 116Cd and 130Te are the heaviest stable nuclei in the natural mixture of Cd and Te, respectively.
Theoretical values of the relative yields can be calculated using the following formula:
$ {Y}_{rel}{(E}_{\gamma max})=\frac{\sum \limits_{i}{\eta }_{i}\int \limits_{{E}_{th}}^{{E}_{\gamma max}}{\sigma }_{i}\left(E\right)W\left(E,{E}_{\gamma max}\right)dE}{\eta \int \limits_{{E}_{th}}^{{E}_{\gamma max}}{\sigma }_{(\gamma ,n)}\left(E\right)W\left(E,{E}_{\gamma max}\right)dE}.~~~~~ $
(3) where η is the percentage of the 116Cd and 130Te isotopes in the natural mixture of cadmium and tellurium isotopes, respectively. Owing to the assumption on the unchanged shape of the bremsstrahlung spectrum, the bremsstrahlung spectrum W(E, Eγmax) can be replaced by the photon production cross section σ(E, Eγmax) calculated using Seltzer-Berger tables [39]:
$ {Y}_{rel}{(E}_{\gamma max})=\frac{\sum \limits_{i}{\eta }_{i}\int \limits_{{E}_{th}}^{{E}_{\gamma max}}{\sigma }_{i}\left(E\right)\sigma \left(E,{E}_{\gamma max}\right)dE}{\eta \int \limits_{{E}_{th}}^{{E}_{\gamma max}}{\sigma }_{(\gamma ,n)}\left(E\right)\sigma \left(E,{E}_{\gamma max}\right)dE}.~~~~~ $
(4) To represent the experimental photonuclear reaction data, the cross section per equivalent quantum σq is used determined by the expression:
$ {\sigma }_{q}{(E}_{\gamma max})=\frac{\int \limits_{{E}_{th}}^{{E}_{\gamma max}}\sigma \left(E\right)\sigma \left({E,E}_{\gamma max}\right)dE}{\dfrac{1}{{E}_{\gamma max}}\int \limits_{0}^{{E}_{\gamma max}}E\cdot \sigma \left(E,{E}_{\gamma max}\right)dE}. $
(5) The cross section per equivalent quantum for a natural mixture of isotopes includes all possible channels of the final isotope production with account for the percentage of initial nuclei is:
$ \sigma _{q}^{nat}{(E}_{\gamma max})=\frac{\sum \limits_{i=1}^{8}{\eta }_{i}\int \limits_{{E}_{th}}^{{E}_{\gamma max}}{\sigma }_{i}\left(E\right)\sigma \left({E,E}_{\gamma max}\right)dE}{\dfrac{1}{{E}_{\gamma max}}\int \limits_{0}^{{E}_{\gamma max}}E\cdot \sigma \left({E,E}_{\gamma max}\right)dE}. $
(6) The experimental points along the cross sections of the (γ,n) [22] and (γ,n) + (γ,pn) [16] reactions on the isotopes 120,128,130Te were approximated by the Lorentz function, the relative yields Yrel and cross sections per equivalent quantum σq were calculated based on the least squares approximation. In Fig. 4-10 these points are indicated by open circles [22] and open rectangles [16], respectively.
Figure 4. Relative yields (a) and cross section per equivalent quantum (b) of reaction 106Cd(γ, n)105Cd as a function of bremsstrahlung end-point energy from the present work (solid rectangles) and simulated values using the CMPR (solid lines) and TALYS code (dashed lines)
Figure 11. Relative yields (a) and cross section per equivalent quantum (b) of reaction 112Cd(γ, p)111Ag as a function of bremsstrahlung end-point energy from the present work (solid rectangles), literature data [3] (open rectangle) as well as simulated values using the CMPR (solid lines) and TALYS code (dashed lines)
Figure 12. Relative yields (a) and cross section per equivalent quantum (b) of reaction 113Cd(γ, p)112Ag as a function of bremsstrahlung end-point energy from the present work (solid rectangles), literature data [3] (open rectangle) as well as simulated values using the CMPR (solid lines) and TALYS code (dashed lines)
Figure 13. Relative yields (a) and cross section per equivalent quantum (b) of reaction 114Cd(γ, p)113Ag as a function of bremsstrahlung end-point energy from the present work (solid rectangles), literature data [3] (open rectangle) as well as simulated values using the CMPR (solid lines) and TALYS code (dashed lines)
Figure 14. Relative yields (a) and cross section per equivalent quantum (b) of reaction 116Cd(γ, p)115Ag as a function of bremsstrahlung end-point energy from the present work (solid rectangles) and simulated values using the CMPR (solid lines) and TALYS code (dashed lines)
Figure 15. (color online) Relative yields (a) and cross section per equivalent quantum (b) of reaction 120Te(γ, n)119Te as a function of bremsstrahlung end-point energy from the present work (solid rectangles), literature data [22] (open circles) as well as simulated values using the CMPR (solid lines) and TALYS code (dashed lines)
Figure 16. (color online) Relative yields (a) and cross section per equivalent quantum (b) of the 122Te(γ,n)121Te and 123Te(γ,2n)121Te reactions as a function of bremsstrahlung end-point energy from the present work (solid rectangles) as well as simulated values using the CMPR (solid lines) and TALYS code (dashed lines)
Figure 17. (color online) Relative yields (a) and cross section per equivalent quantum (b) of 123Te(γ, γ`)123mTe, 124Te(γ, n)123mTe and 125Te(γ, 2n)123mTe reactions as a function of bremsstrahlung end-point energy from the present work (solid rectangles) and simulated values using TALYS code
Figure 18. (color online) Relative yields (a) and cross section per equivalent quantum (b) of 125Te(γ, γ`)125mTe and 126Te(γ, n)125mTe reactions as a function of bremsstrahlung end-point energy from the present work (solid rectangles) and simulated values using TALYS code
Figure 19. Relative yields (a) and cross section per equivalent quantum (b) of 128Te(γ, n)127Te reaction as a function of bremsstrahlung end-point energy from the present work (solid rectangles), literature data [22] (open rectangles) as well as simulated values using the CMPR (solid lines) and TALYS code (dashed lines)
Figure 20. (color online) Relative yields (a) and cross section per equivalent quantum (b) of reaction 130Te(γ, n)129Te as a function of bremsstrahlung end-point energy from the present work (solid rectangles), literature data [22] (open rectangles) as well as simulated values using the CMPR (solid line) and TALYS code (dashed lines)
Figure 21. Relative yields (a) and cross section per equivalent quantum (b) of the 123Te(γ, p)122Sb and 124Te(γ, np)122Sb reactions as a function of bremsstrahlung end-point energy from the present work (solid rectangles) as well as simulated values using the CMPR (solid lines) and TALYS code (dashed lines)
Figure 22. The ratio of the cross section per equivalent quantum
$ \sigma _{qexp}^{nat}/\sigma _{qtheory}^{nat} $ for the 123Te(γ, p)122Sb reaction
Figure 23. Relative yields (a) and cross section per equivalent quantum (b) of the 125Te(γ, p)124Sb and 126Te(γ, np)124Sb reactions as a function of bremsstrahlung end-point energy from the present work (solid rectangles) as well as simulated values using the CMPR (solid lines) and TALYS code (dashed lines)
Figure 24. Relative yields (a) and cross section per equivalent quantum (b) of the reaction 128Te(γ, p)127Sb as a function of bremsstrahlung end-point energy from the present work (solid rectangles) as well as simulated values using the CMPR (solid lines) and TALYS code (dashed lines)
Figure 25. Relative yields (a) and cross section per equivalent quantum (b) of the reaction 130Te(γ, p)129Sb as a function of bremsstrahlung end-point energy from the present work (solid rectangles) as well as simulated values using the CMPR (solid lines) and TALYS code (dashed lines)
Figure 5. Relative yields (a) and cross section per equivalent quantum (b) of reaction 108Cd(γ, n)107Cd as a function of bremsstrahlung end-point energy from the present work (solid rectangles) as well as simulated values using the CMPR (solid lines) and TALYS code (dashed lines)
Figure 6. Relative yields (a) and cross section per equivalent quantum (b) of reactions 110Cd(γ, n)109Cd and 111Cd(γ, 2n)109Cd as a function of bremsstrahlung end-point energy from the present work (solid rectangles), literature data [3] (open rectangle) as well as simulated values using the CMPR (solid lines) and TALYS code (dashed lines)
Figure 7. (color online) Relative yields (a) and cross section per equivalent quantum (b) of 111Cd(γ, γ`)111mCd and 112Cd(γ, n)111mCd reactions as a function of bremsstrahlung end-point energy from the present work (solid rectangles), literature data [3] (open rectangle) and simulated values using TALYS code (dashed lines)
Figure 8. (color online) Relative yields (a) and cross section per equivalent quantum (b) of reaction 116Cd(γ, n)115Cd as a function of bremsstrahlung end-point energy from the present work (solid rectangles), literature data [3] (open rectangles) as well as simulated values using the CMPR (solid line) and TALYS code (dashed lines)
Figure 9. Relative yields (a) and cross section per equivalent quantum (b) of reaction 106Cd(γ, p)105Ag as a function of bremsstrahlung end-point energy from the present work (solid rectangles) and simulated values using the CMPR (solid lines) and TALYS code (dashed lines)
Figure 10. (color online) Cross section per equivalent quantum of 106Cd(γ, n)105Cd and 106Cd(γ, p)105Ag reactions as a function of bremsstrahlung end-point energy from the present work (solid rectangles) and simulated values using the CMPR (solid lines) and TALYS code (dashed lines)
-
The experimental yields of the reactions, Yexp, were normalized to one electron of the accelerated beam incident on the bremsstrahlung target and calculated using the following formula:
$ Y\mathrm{_{exp}}=\frac{S_p\cdot C_{\mathrm{abs}}}{\varepsilon\cdot I_{\gamma}}\frac{t_{\mathrm{real}}}{t_{\mathrm{live}}}\frac{1}{N}\frac{1}{N_e}\frac{\mathrm{e}^{\lambda\cdot t_{\mathrm{cool}}}}{(1-\mathrm{e}^{-\lambda\cdot t_{\mathrm{real}}})}\frac{\lambda\cdot t\mathrm{_{irr}}}{(1-\mathrm{e}^{-\lambda\cdot t\mathrm{_{irr}}})},~~~~~ $
(1) where
$ {S}_{p} $ is the full-energy-peak area;$ \varepsilon $ is the full-energy-peak detector efficiency;$ {I}_{\gamma } $ is the γ- emission probability;$ C\mathrm{_{abs}} $ is the correction for self-absorption of γ-rays in the sample;$ t\mathrm{_{real}} $ and$ t\mathrm{_{live}} $ are the real time and live time of the measurement, respectively;$ N $ is the number of atoms in the activation sample;$ {N}_{e} $ is the integral number of incident electrons;$ \lambda $ is the decay constant;$ t\mathrm{_{cool}} $ is the cooling time; and$ t\mathrm{_{irr}} $ is the irradiation time.The experiment determined the yields Ytheor of the photonuclear reactions, which reflect the convolution of the photonuclear reaction cross section σi(E), and distribution density of the number of bremsstrahlung photons over the energy per electron of the accelerator W(E, Eγmax). The outcome of measuring the yield of isotope generation in all possible reactions on a natural mixture of isotopes is as follows:
$ {Y}_{\mathrm{theor}}({E}_{\gamma \mathrm{max}})=\sum \limits_{i}{\eta }_{i}\int \limits_{{E}_{i\mathrm{th}}}^{{E}_{\gamma \mathrm{max}}}{\sigma }_{i}\left(E\right)W\left(E,{E}_{\gamma \mathrm{max}}\right)\mathrm{d}E, $
(2) where Eγmax is the kinetic energy of the electrons hitting the tungsten radiator, E is the energy of bremsstrahlung photons produced on the radiator, Eth is the threshold of the studied photonuclear reaction, ηi is the percentage of the studied isotope in the natural mixture, and the index i corresponds to the number of reactions contributing to the production of the studied isotope.
Figure 3 illustrates the distribution density of the number of bremsstrahlung photons W(E, Eγmax) per electron of the accelerator for accelerated electron energies from 10 to 23 MeV, determined using Geant4 for the bremsstrahlung target made of tungsten with a thickness of 3 mm.
Figure 3. Distribution density of the number of bremsstrahlung photons at the energies of 10−23 MeV
The total and partial cross sections σ(E) of the photonuclear reactions on the cadmium and tellurium isotopes were estimated for monochromatic photons using the TALYS code [24] with standard parameters and CMPR [25]. The TALYS program examines all processes in the nucleus and transitions between the states. As a result, it is possible to calculate not only the total cross section of a photonuclear reaction but also the cross sections of reactions involving the production of certain states, particularly isomeric states. The standard (default) TALYS option uses the Simple Modified Lorentzian (SMLO) model for photon strength functions (PSFs). This model is used to calculate E1, M1, and upbend components, generally providing more accurate, temperature-dependent resonance shapes than those achieved with older models.
When compared with TALYS, the CMPR accurately considers the GDR isospin splitting, which is crucial for describing the proton decay channel. The basics of the GDR isospin splitting and some relevant CMPR results are presented in Appendix B. This Appendix also provides information on TALYS options as well as examples of comparison between the TALYS and CMPR results.
The yield measurement for a natural mixture of isotopes yields gives the amount of isotope produced in all potential reactions on the natural mixture. The primary problem of bremsstrahlung beam experiments is that the yield of photonuclear reaction depends on both the investigated cross section of the reaction σi(E) and the form of the bremsstrahlung spectrum W(E, Eγmax), which is often known with inadequate accuracy. The use of relative yields allows us to determine the dependency of the yield of photonuclear reactions on the maximal energy of bremsstrahlung under various experimental settings. The overall photon absorption cross section is not taken into account when calibrating the yield of one of the most likely reactions. The the most probable and well-studied 116Cd(γ, n)115Cd and 130Te(γ, n)129Te reactions were chosen as a primary reaction in case of cadmium and tellurium, respectively. In addition, there are no other channels (for example, (γ, 2n) reaction on heavier stable nuclei) for the product formation of 115Cd and 129Te, as the nuclei 116Cd and 130Te are the heaviest stable nuclei in the natural mixture of Cd and Te.
The theoretical values of the relative yields can be calculated using the following formula:
$ {Y}_{\mathrm{rel}}{(E}_{\gamma \mathrm{max}})=\frac{\displaystyle\sum \limits_{i}{\eta }_{i} \displaystyle\int\nolimits_{{E}_{\mathrm{th}}}^{{E}_{\gamma \mathrm{max}}}{\sigma }_{i}\left(E\right)W\left(E,{E}_{\gamma \mathrm{max}}\right) \mathrm{d}E}{\eta \displaystyle\int\nolimits_{{E}_{\mathrm{th}}}^{{E}_{\gamma \mathrm{max}}}{\sigma }_{(\gamma ,n)}\left(E\right)W\left(E,{E}_{\gamma \mathrm{max}}\right) \mathrm{d}E},~~~~~ $
(3) where η denotes the percentages of the 116Cd and 130Te isotopes in the natural mixture of cadmium and tellurium isotopes, respectively. Owing to the assumption regarding the unchanged shape of the bremsstrahlung spectrum, the bremsstrahlung spectrum W(E, Eγmax) can be replaced by the photon production cross section σ(E, Eγmax) calculated using the Seltzer-Berger tables [39].
$ {Y}_{\mathrm{rel}}{(E}_{\gamma \mathrm{max}})=\frac{\displaystyle\sum \limits_{i}{\eta }_{i}\displaystyle\int\nolimits_{{E}_{\mathrm{th}}}^{{E}_{\gamma \mathrm{max}}}{\sigma }_{i}\left(E\right)\sigma \left(E,{E}_{\gamma \mathrm{max}}\right)\mathrm{d}E}{\eta \displaystyle\int\nolimits_{{E}_{\mathrm{th}}}^{{E}_{\gamma \mathrm{max}}}{\sigma }_{(\gamma ,n)}\left(E\right)\sigma \left(E,{E}_{\gamma \mathrm{max}}\right)\mathrm{d}E}.~~~~~ $
(4) To represent the experimental photonuclear reaction data, the cross section per equivalent quantum σq, determined by the following expression, is used:
$ \sigma_q(E_{\mathrm{\gamma max}})=\frac{\displaystyle\int\nolimits_{E_{\mathrm{th}}}^{E_{\mathrm{\gamma max}}}\sigma\left(E\right)\sigma\left(E,E_{\mathrm{\gamma max}}\right)\mathrm{d}E}{\dfrac{1}{E_{\mathrm{\gamma max}}}\displaystyle\int\nolimits_0^{E_{\mathrm{\gamma max}}}E\cdot\sigma\left(E,E_{\mathrm{\gamma max}}\right)\mathrm{d}E}. $
(5) The cross section per equivalent quantum for a natural mixture of isotopes includes all possible channels of the final isotope production, where the percentage of initial nuclei is accounted for as follows:
$ \sigma_q^{\mathrm{nat}}(E\mathrm{_{\gamma max}})=\frac{\displaystyle\sum\limits_{i=1}^8\eta_i \displaystyle\int\nolimits_{E_{\mathrm{th}}}^{E_{\mathrm{\gamma max}}}\sigma_i\left(E\right)\sigma\left(E,E_{\mathrm{\gamma max}}\right)\mathrm{d}E}{\dfrac{1}{E\mathrm{_{\gamma max}}}\displaystyle\int\nolimits_0^{E_{\mathrm{\gamma max}}}E\cdot\sigma\left(E,E_{\mathrm{\gamma max}}\right)\mathrm{d}E}. $
(6) The experimental points along the cross sections of the (γ, n) [22] and (γ, n) + (γ, pn) [16] reactions on the isotopes 120,128,130Te were approximated by the Lorentz function, and the relative yields Yrel and cross sections per equivalent quantum σq were calculated based on the least squares approximation. In Figs. 4−10, these points are indicated by open circles [22] and open rectangles [16], respectively.
Figure 4. Relative yields (a) and cross section per equivalent quantum (b) of reaction 106Cd(γ, n)105Cd as functions of the bremsstrahlung end-point energy from this study (solid rectangles) and simulated values using the CMPR (solid lines) and TALYS code (dashed lines).
Figure 11. Relative yields (a) and cross section per equivalent quantum (b) of reaction 112Cd(γ, p)111Ag as functions of the bremsstrahlung end-point energy from this study (solid rectangles), literature data [3] (open rectangle), and simulated values using the CMPR (solid lines) and TALYS code (dashed lines).
Figure 12. Relative yields (a) and cross section per equivalent quantum (b) of reaction 113Cd(γ, p)112Ag as functions of the bremsstrahlung end-point energy from this study (solid rectangles), literature data [3] (open rectangle), and simulated values using the CMPR (solid lines) and TALYS code (dashed lines).
Figure 13. Relative yields (a) and cross section per equivalent quantum (b) of reaction 114Cd(γ, p)113Ag as functions of the bremsstrahlung end-point energy from this study (solid rectangles), literature data [3] (open rectangle), and simulated values using the CMPR (solid lines) and TALYS code (dashed lines).
Figure 14. Relative yields (a) and cross section per equivalent quantum (b) of reaction 116Cd(γ, p)115Ag as functions of bremsstrahlung end-point energy from this study (solid rectangles) and simulated values using the CMPR (solid lines) and TALYS code (dashed lines).
Figure 15. (color online) Relative yields (a) and cross section per equivalent quantum (b) of reaction 120Te(γ, n)119Te as functions of the bremsstrahlung end-point energy from this study (solid rectangles), literature data [22] (open circles), and simulated values using the CMPR (solid lines) and TALYS code (dashed lines).
Figure 16. (color online) Relative yields (a) and cross section per equivalent quantum (b) of the 122Te(γ, n)121Te and 123Te(γ, 2n)121Te reactions as functions of the bremsstrahlung end-point energy from this study (solid rectangles) and simulated values using the CMPR (solid lines) and TALYS code (dashed lines).
Figure 17. (color online) Relative yields (a) and cross section per equivalent quantum (b) of 123Te(γ, γ`)123mTe, 124Te(γ, n)123mTe, and 125Te(γ, 2n)123mTe reactions as functions of the bremsstrahlung end-point energy from this study (solid rectangles) and simulated values using TALYS code.
Figure 18. (color online) Relative yields (a) and cross section per equivalent quantum (b) of 125Te(γ, γ`)125mTe and 126Te(γ, n)125mTe reactions as functions of the bremsstrahlung end-point energy from this study (solid rectangles) and simulated values using TALYS code.
Figure 19. Relative yields (a) and cross section per equivalent quantum (b) of 128Te(γ, n)127Te reaction as functions of the bremsstrahlung end-point energy from this study (solid rectangles), literature data [22] (open rectangles), and simulated values using the CMPR (solid lines) and TALYS code (dashed lines).
Figure 20. (color online) Relative yields (a) and cross section per equivalent quantum (b) of the reaction 130Te(γ, n)129Te as functions of the bremsstrahlung end-point energy from this study (solid rectangles), literature data [22] (open rectangles), and simulated values using the CMPR (solid line) and TALYS code (dashed lines).
Figure 21. Relative yields (a) and cross section per equivalent quantum (b) of the 123Te(γ, p)122Sb and 124Te(γ, np)122Sb reactions as functions of the bremsstrahlung end-point energy from this study (solid rectangles) and simulated values using the CMPR (solid lines) and TALYS code (dashed lines).
Figure 22. Ratio of the cross section per equivalent quantum
$ \sigma_{q\mathrm{exp}}^{\mathrm{nat}}/\sigma_{q\mathrm{theory}}^{\mathrm{nat}} $ for the 123Te(γ, p)122Sb reaction.
Figure 23. Relative yields (a) and cross section per equivalent quantum (b) of the 125Te(γ, p)124Sb and 126Te(γ, np)124Sb reactions as functions of the bremsstrahlung end-point energy from this study (solid rectangles) and simulated values using the CMPR (solid lines) and TALYS code (dashed lines).
Figure 24. Relative yields (a) and cross section per equivalent quantum (b) of the reaction 128Te(γ, p)127Sb as functions of the bremsstrahlung end-point energy from this study (solid rectangles) and simulated values using the CMPR (solid lines) and TALYS code (dashed lines).
Figure 25. Relative yields (a) and cross section per equivalent quantum (b) of the reaction 130Te(γ, p)129Sb as functions of the bremsstrahlung end-point energy from this study (solid rectangles) and simulated values using the CMPR (solid lines) and TALYS code (dashed lines).
Figure 5. Relative yields (a) and cross section per equivalent quantum (b) of reaction 108Cd(γ, n)107Cd as functions of the bremsstrahlung end-point energy from this study (solid rectangles) as well as simulated values using the CMPR (solid lines) and TALYS code (dashed lines).
Figure 6. Relative yields (a) and cross section per equivalent quantum (b) of reactions 110Cd(γ, n)109Cd and 111Cd(γ, 2n)109Cd as functions of the bremsstrahlung end-point energy from this study (solid rectangles), literature data [3] (open rectangle), and simulated values using the CMPR (solid lines) and TALYS code (dashed lines).
Figure 7. (color online) Relative yields (a) and cross section per equivalent quantum (b) of 111Cd(γ, γ`)111mCd and 112Cd(γ, n)111mCd reactions as functions of bremsstrahlung end-point energy from this study (solid rectangles), literature data [3] (open rectangle), and simulated values using TALYS code (dashed lines).
Figure 8. (color online) Relative yields (a) and cross section per equivalent quantum (b) of reaction 116Cd(γ, n)115Cd as functions of bremsstrahlung end-point energy from this study (solid rectangles), literature data [3] (open rectangles), and simulated values using the CMPR (solid line) and TALYS code (dashed lines).
Figure 9. Relative yields (a) and cross section per equivalent quantum (b) of reaction 106Cd(γ, p)105Ag as functions of bremsstrahlung end-point energy from this study (solid rectangles) and simulated values using the CMPR (solid lines) and TALYS code (dashed lines).
Figure 10. (color online) Cross section per equivalent quantum of 106Cd(γ, n)105Cd and 106Cd(γ, p)105Ag reactions as functions of the bremsstrahlung end-point energy from this study (solid rectangles) and simulated values using the CMPR (solid lines) and TALYS code (dashed lines).
-
The measured yields relative to the yield of the reaction 116Cd(γ, n)115Cd (in the case of natCd) and 130Te(γ, n)129Te (in the case of natTe) and cross sections per equivalent quantum for a natural mixture of isotopes are shown in Figs. 4−25 and Tables A1−A2 in Appendix A, along with theoretical computations using the TALYS and CMPR programs and previously published data.
The square root of the quadratic sum of all independent statistical and systematic uncertainties was used to determine the overall uncertainties in the results. The counting statistics from the observed number of counts under the photo-peak of each γ-line (2.5%−10.5%) were the primary contributors to the ensuing statistical uncertainty. Data accumulation for an optimal duration of measurements based on the half-life of the generated nuclides was used to estimate this. In addition, the systematic uncertainties were computed using the uncertainties in the following: number of target nuclei (~0.3%), irradiation and cooling time (~0.5%), current and electron beam energy (~2.5%), detector efficiency (~3%), half-life of reaction products (~2%), distance between the sample and detector (~2%), γ-ray abundance (~2%), flux estimation (~11.5%), and normalization of the experimental data to the yield of the 116Cd(γ, n)115Cd and 130Te(γ, n)129Te monitor reactions (0.5%−2%). The overall systematic uncertainty is approximately 12.58%. It is determined that the overall uncertainty ranges from approximately 12% to approximately 19%.
-
The measured relative yields to the yield of the reaction 116Cd(γ,n)115Cd (in the case of natCd) and 130Te(γ,n)129Te (in the case of natTe) and cross sections per equivalent quantum for a natural mixture of isotopes are shown in Fig. 4-25 and Tables 1-2 in Appendix, along with theoretical computations using the TALYS and CMPR programs and previously published data.
The square root of the quadratic sum of all independent statistical and systematic uncertainties was used to determine the overall uncertainties in the results. The counting statistics from the observed number of counts under the photo-peak of each γ-line (2.5%~10.5%) were the primary contributors to the ensuing statistical uncertainty. Data accumulation for an optimal duration of measurements based on the half-life of the generated nuclides was used to estimate this. The systematic uncertainties, on the other hand, were computed using the uncertainties of the following: the number of target nuclei (~0.3%), the irradiation and cooling time (~0.5%), the current and electron beam energy (~2.5%), the detector efficiency (~3%), the half-life of the reaction products (~2%), the distance between the sample and detector (~2%), the γ-ray abundance (~2%), the flux estimation (~11.5%) and normalization of the experimental data to the 116Cd(γ,n)115Cd and 130Te(γ,n)129Te monitor reactions’ yield 0.5-2%. Roughly 12.58% is the overall systematic uncertainty. It is determined that the overall uncertainty ranges from about 12% to about 19%.
-
The measured yields relative to the yield of the reaction 116Cd(γ, n)115Cd (in the case of natCd) and 130Te(γ, n)129Te (in the case of natTe) and cross sections per equivalent quantum for a natural mixture of isotopes are shown in Figs. 4−25 and Tables A1−A2 in Appendix A, along with theoretical computations using the TALYS and CMPR programs and previously published data.
The square root of the quadratic sum of all independent statistical and systematic uncertainties was used to determine the overall uncertainties in the results. The counting statistics from the observed number of counts under the photo-peak of each γ-line (2.5%−10.5%) were the primary contributors to the ensuing statistical uncertainty. Data accumulation for an optimal duration of measurements based on the half-life of the generated nuclides was used to estimate this. In addition, the systematic uncertainties were computed using the uncertainties in the following: number of target nuclei (~0.3%), irradiation and cooling time (~0.5%), current and electron beam energy (~2.5%), detector efficiency (~3%), half-life of reaction products (~2%), distance between the sample and detector (~2%), γ-ray abundance (~2%), flux estimation (~11.5%), and normalization of the experimental data to the yield of the 116Cd(γ, n)115Cd and 130Te(γ, n)129Te monitor reactions (0.5%−2%). The overall systematic uncertainty is approximately 12.58%. It is determined that the overall uncertainty ranges from approximately 12% to approximately 19%.
-
Five cadmium isotopes are directly generated by natCd(γ, n) reactions when natural cadmium is irradiated with bremsstrahlung radiation with end-point energy of 10-23 MeV. In this study, the relative yields and cross section per equivalent quantum of the natCd(γ, n)105,107,109,111m,115g,115mCd reactions at the bremsstrahlung end-point energies of 10-23 MeV are determined and presented in Fig. 4-8. Besides, the tabulated results are given in Appendix 1.
-
Five cadmium isotopes are directly generated by natCd(γ, n) reactions when natural cadmium is irradiated with bremsstrahlung radiation with an end-point energy of 10−23 MeV. In this study, the relative yields and cross section per equivalent quantum of the natCd(γ, n)105,107,109,111m,115g,115mCd reactions at the bremsstrahlung end-point energies of 10−23 MeV were determined, and the results are presented in Figs. 4−8. In addition, the tabulated results are given in Appendix A.
-
No literature data are available for this reaction; hence, its measurements were compared only with the theoretical calculations. Figure 4 shows the experimentally obtained and simulated values of the relative yield as well as cross section per equivalent quantum of the reaction 106Cd(γ, n)105Cd. In Fig. 4, it is clear that the cross section per equivalent quantum, calculated by the TALYS and CMPR codes, are almost the same, but they are higher than the currently presented results for the 106Cd(γ, n)105Cd reaction.
At an energy of 12 MeV, the theoretical values for the two models are 4 times higher than the experimental values. When the energy is increased to 20 MeV, the ratio
$ \sigma_{q\mathrm{exp}}^{\mathrm{nat}}/\sigma_{q\mathrm{theory}}^{\mathrm{nat}} $ decreases and is equal to approximately 2.5. The apparent disparity between the theoretical and experimental values may stem from the fact that statistical models of photonuclear reactions, such as the CMPR and TALYS codes, overlook the unique structural characteristics of cadmium isotopes. Alternatively, the low experimental neutron yield in the reaction 106Cd(γ, n)105Cd can be partly explained by the bypassed character of the nucleus 106Cd. -
For this reaction, no literature data was available; hence, its measurements were only compared with the theoretical calculations. Fig. 4 shows experimental obtained and simulated values relative yields as well as cross section per equivalent quantum of reaction 106Cd(γ, n)105Cd. In Fig. 4, it is clear that the cross section per equivalent quantum calculated by the TALYS and CMPR codes are almost the same, but they are higher than the currently presented results for the 106Cd(γ, n)105Cd reaction.
At an energy of 12 MeV, the theoretical values for the two models are 4 times higher than the experimental point, then with an increase in energy to 20 MeV, the ratio
$ \sigma _{qexp}^{nat}/\sigma _{qtheory}^{nat} $ decreases and is equal to approximately 2.5. The apparent disparity between theory and experiment may stem from the fact that statistical models of photonuclear reactions, such as the CMPR and TALYS codes, overlook the unique structural characteristics of cadmium isotopes. Alternatively, the low experimental neutron yield in reaction 106Cd(γ, n)105Cd can be partly explained by bypassed character of the nucleus 106Cd. -
No literature data are available for this reaction; hence, its measurements were compared only with the theoretical calculations. Figure 4 shows the experimentally obtained and simulated values of the relative yield as well as cross section per equivalent quantum of the reaction 106Cd(γ, n)105Cd. In Fig. 4, it is clear that the cross section per equivalent quantum, calculated by the TALYS and CMPR codes, are almost the same, but they are higher than the currently presented results for the 106Cd(γ, n)105Cd reaction.
At an energy of 12 MeV, the theoretical values for the two models are 4 times higher than the experimental values. When the energy is increased to 20 MeV, the ratio
$ \sigma_{q\mathrm{exp}}^{\mathrm{nat}}/\sigma_{q\mathrm{theory}}^{\mathrm{nat}} $ decreases and is equal to approximately 2.5. The apparent disparity between the theoretical and experimental values may stem from the fact that statistical models of photonuclear reactions, such as the CMPR and TALYS codes, overlook the unique structural characteristics of cadmium isotopes. Alternatively, the low experimental neutron yield in the reaction 106Cd(γ, n)105Cd can be partly explained by the bypassed character of the nucleus 106Cd. -
Figure 5 shows that the current results follow the graphical shape but are lower than the theoretical values. The experimental results (γ, n) are two times lesser than the corresponding theoretical values. This discrepancy indicates the need for further research on photoneutron reactions on 106,108Cd.
-
Fig. 5 shows that the current results follow the graphical shape but are lower than the theoretical values. The experimental results (γ,n) are two times as less as its theoretical counterparts. This discrepancy indicates the need for further research in the study of photoneutron reactions on 106,108Cd.
-
Figure 5 shows that the current results follow the graphical shape but are lower than the theoretical values. The experimental results (γ, n) are two times lesser than the corresponding theoretical values. This discrepancy indicates the need for further research on photoneutron reactions on 106,108Cd.
-
Regarding the production of 109Cd from the natCd(γ, Xn)109Cd reactions, only one previous experimental data set in the GDR energy region based on the bremsstrahlung photons is available [3]; the values were found to be lower than the theoretical values obtained using the TALYS and CMPR codes, as shown in Fig. 6. The figure shows that the current results follow the graphical shape but are lower than the theoretical values; they are the closest to the values calculated using the TALYS code.
-
For the production of 109Cd from the natCd(γ, Xn)109Cd reactions, only one previous experimental data sets in the GDR energy region based on bremsstrahlung photons was available [3]; this was found to be lower than the theoretical values obtained using the TALYS and CMPR codes as shown in Fig. 6. The figure shows that the current results follow the graphical shape but are lower than the theoretical values; they are the closest to the values calculated using TALYS code.
-
Regarding the production of 109Cd from the natCd(γ, Xn)109Cd reactions, only one previous experimental data set in the GDR energy region based on the bremsstrahlung photons is available [3]; the values were found to be lower than the theoretical values obtained using the TALYS and CMPR codes, as shown in Fig. 6. The figure shows that the current results follow the graphical shape but are lower than the theoretical values; they are the closest to the values calculated using the TALYS code.
-
The measured results for the 111Cd(γ, γ`)111mCd and 112Cd(γ, n)111mCd reactions are compared with the theoretical values obtained with the TALYS and CMPR codes in Fig. 7. For the production of 111mCd from the natCd target, only one previous experimental data set in the GDR energy region based on bremsstrahlung photons is available [3]. The value was found to be lower than the theoretical values obtained using the TALYS code, as shown in Fig. 7. The figure also shows that the theoretical values from both the TALYS and CMPR codes as well as literature data are in agreement with the data from this study. Based on Fig. 7, it can also be said that in the energy range up to 11 MeV, the 111mCd nucleus is formed by the 111Cd(γ, γ`)111mCd reaction, and the contributions of the 111Cd(γ, γ`)111mCd and 112Cd(γ, n)111mCd reactions to the formation of 111mCd are equal at 12 MeV, after which the 112Cd(γ, n)111mCd reaction plays the dominant role.
-
The measured results for the 111Cd(γ, γ`)111mCd and 112Cd(γ, n)111mCd reactions are compared with the theoretical values obtained with the TALYS and CMPR codes, as shown in Fig. 7. For the production of 111mCd from the natCd target, only one previous experimental data set in the GDR energy region based on bremsstrahlung photons were available [3], this was found to be lower than the theoretical values obtained using the TALYS code as shown in Fig. 7. The figure also shows that the theoretical values from both the TALYS and CMPR codes as well as literature data are in agreement with the data from this study. Based on the Fig. 7, it can also be said that in the energy range up to 11 MeV, the 111mCd nucleus is formed due to the 111Cd(γ, γ`)111mCd reaction, the contributions of the 111Cd(γ, γ`)111mCd and 112Cd(γ, n)111mCd reactions to the formation of 111mCd are equal at 12 MeV, and then the 112Cd(γ, n)111mCd reaction plays a dominant role.
-
The measured results for the 116Cd(γ, n)115m,gCd reactions are compared with the theoretical values obtained using the TALYS and CMPR codes in Fig. 8. Only one value is available in literature for the 116Cd(γ, n)115m,gCd reaction [3] at 23 MeV. As shown in Fig. 8, it is clear that the theoretical values from both the TALYS and CMPR codes as well as the literature value are in agreement with the data from this study.
-
The measured results for the 116Cd(γ, n)115m,gCd reactions are compared with the theoretical values obtained with the TALYS and CMPR codes, as shown in Fig. 8. There is only one literature data for the 116Cd(γ, n)115m,gCd reaction [3] in 23 MeV. As shown in Fig. 8, it is clear that the theoretical values from both the TALYS and CMPR codes as well as literature data are in agreement with the data from this study.
-
The measured results for the 116Cd(γ, n)115m,gCd reactions are compared with the theoretical values obtained using the TALYS and CMPR codes in Fig. 8. Only one value is available in literature for the 116Cd(γ, n)115m,gCd reaction [3] at 23 MeV. As shown in Fig. 8, it is clear that the theoretical values from both the TALYS and CMPR codes as well as the literature value are in agreement with the data from this study.
-
Five argentum isotopes are directly generated by natCd(γ, p) reactions when natural cadmium is irradiated with bremsstrahlung radiation with end-point energy of 10-23 MeV. In this study, the relative yields and cross section per equivalent quantum of the natCd(γ, p)105,111,112,113,115Ag reactions at the bremsstrahlung end-point energies of 12-23 MeV are determined for the first time and presented in Fig. 9-14.
-
Five argentum isotopes are directly generated by the natCd(γ, p) reactions when natural cadmium is irradiated with bremsstrahlung radiation with the end-point energy of 10−23 MeV. The relative yields and cross section per equivalent quantum of the natCd(γ, p)105,111,112,113,115Ag reactions at the bremsstrahlung end-point energies of 12−23 MeV were determined for the first time in this study, and the results are presented in Figs. 9−14.
-
These measurements were compared only with the theoretical values owing to unavailability of published data. In Fig. 9, the measured values are revealed to be higher than the calculated values. No theoretical calculation can describe the experimental data.
The ratio
$ \sigma_{\mathrm{\mathit{q}exp}}^{\mathrm{nat}}/\sigma_{q\mathrm{theory}}^{\mathrm{nat}} $ is approximately 10 for the two models. As discussed in Section A1, the proton Fermi surface is significantly higher than the neutron Fermi surface in the 106Cd nucleus. Because of a reduction in the effective width of the Coulomb barrier, this must raise the proton penetrabilities and, consequently, the proton yield.The proton yield on 106Cd can also be boosted by the direct photoelectric effect, which is predominantly localized at the nucleus surface. Protons are expected to dominate in β+-radioactive nuclei and the nuclei bordering them. The structural (shell) unique features of the target nucleus have a significant effect on the direct photonuclear reactions. Cadmium isotopes exhibit the most significant single-particle dipole excitations during the 1g9/2 → 1h11/2 transitions. The decay of such excitations, which have a probability of approximately 40% in both the proton and neutron channels, leads to the emission of protons with the maximum possible energy, because the final-state nucleus {Z–1, N} arises in the ground state. The energy carried away by neutrons is 3 to 4 MeV smaller, because the final-state nucleus {Z, N–1} remains in an excited (hole) state. This significantly influences the relative output of protons and neutrons in proton-rich cadmium isotopes.
Figure 10 shows the relative yields of 106Cd(γ, n)105Cd and 106Cd(γ, p)105Ag reactions as well as the sum of the values for the 106Cd(γ, n)105Cd and 106Cd(γ, p)105Ag reactions. The results in Fig. 10 show that the theoretical yields of the (γ, n) and (γ, p) reactions on 106Cd nuclei differ significantly from their experimental counterparts, but their summed value agrees with the respective experimental value. This means that the original photoabsorption cross section calculated using the TALYS code is unlikely to differ significantly from the true value. The discrepancy in the cross section per equivalent quantum is owing to the redistribution of the cross section between the (γ, n) and (γ, p) reactions.
-
These measurements were only compared with the theoretical values due to unavailability of published data. In Fig. 9, the measured values are revealed to be higher than the calculated values. No theoretical calculation can describe the experimental data.
The ratio
$ \sigma _{qexp}^{nat}/\sigma _{qtheory}^{nat} $ is approximately 10 for the two models. As we discussed in Section A1 that, the proton Fermi surface is significantly higher than the neutron Fermi surface in the 106Cd nucleus. As a result of a reduction in the effective width of the Coulomb barrier, this must raise the proton penetrabilities and, consequently, the proton yield.Proton yield on 106Cd can also be boosted by the direct photoelectric effect, which is predominantly localised at the nucleus’ surface. Protons are expected to dominate in β+-radioactive nuclei and nuclei bordering them. The target nucleus's structural (shell) unique features have a significant impact on direct photonuclear reactions. Cadmium isotopes exhibit the most significant single-particle dipole excitations during the 1g9/2 → 1h11/2 transitions. The decay of such excitations, which have a probability of about 40% in both the proton and neutron channels, leads to the emission of protons with the maximum possible energy, because the final-state nucleus {Z-1, N} arises in the ground state. The energy carried away by neutrons is 3 to 4 MeV smaller, because the final-state nucleus {Z, N-1} remains in an excited (hole) state. This significantly influences the relative output of protons and neutrons in proton-rich cadmium isotopes.
Fig. 10 shows the relative yields of 106Cd(γ, n)105Cd and 106Cd(γ, p)105Ag reactions as well as sum of the 106Cd(γ, n)105Cd and 106Cd(γ, p)105Ag reactions. The results in Fig. 10 show that the theoretical yields of the (γ,n) and (γ,p) reactions on 106Cd nuclei differ significantly from their experimental counterparts, but their summed value agrees with the respective experimental value. This means that the original photoabsorption cross section calculated using the TALYS code is unlikely to differ significantly from the true value. The discrepancy in cross sections per equivalent quantum is due to the redistribution of the cross section between the (γ,n) and (γ,p) reactions.
-
These measurements were compared only with the theoretical values owing to unavailability of published data. In Fig. 9, the measured values are revealed to be higher than the calculated values. No theoretical calculation can describe the experimental data.
The ratio
$ \sigma_{\mathrm{\mathit{q}exp}}^{\mathrm{nat}}/\sigma_{q\mathrm{theory}}^{\mathrm{nat}} $ is approximately 10 for the two models. As discussed in Section A1, the proton Fermi surface is significantly higher than the neutron Fermi surface in the 106Cd nucleus. Because of a reduction in the effective width of the Coulomb barrier, this must raise the proton penetrabilities and, consequently, the proton yield.The proton yield on 106Cd can also be boosted by the direct photoelectric effect, which is predominantly localized at the nucleus surface. Protons are expected to dominate in β+-radioactive nuclei and the nuclei bordering them. The structural (shell) unique features of the target nucleus have a significant effect on the direct photonuclear reactions. Cadmium isotopes exhibit the most significant single-particle dipole excitations during the 1g9/2 → 1h11/2 transitions. The decay of such excitations, which have a probability of approximately 40% in both the proton and neutron channels, leads to the emission of protons with the maximum possible energy, because the final-state nucleus {Z–1, N} arises in the ground state. The energy carried away by neutrons is 3 to 4 MeV smaller, because the final-state nucleus {Z, N–1} remains in an excited (hole) state. This significantly influences the relative output of protons and neutrons in proton-rich cadmium isotopes.
Figure 10 shows the relative yields of 106Cd(γ, n)105Cd and 106Cd(γ, p)105Ag reactions as well as the sum of the values for the 106Cd(γ, n)105Cd and 106Cd(γ, p)105Ag reactions. The results in Fig. 10 show that the theoretical yields of the (γ, n) and (γ, p) reactions on 106Cd nuclei differ significantly from their experimental counterparts, but their summed value agrees with the respective experimental value. This means that the original photoabsorption cross section calculated using the TALYS code is unlikely to differ significantly from the true value. The discrepancy in the cross section per equivalent quantum is owing to the redistribution of the cross section between the (γ, n) and (γ, p) reactions.
-
For the 112Cd(γ, p)111Ag reaction only one previous experimental data sets in 23 MeV [3]; this was found to be lower than the theoretical values obtained using the CMPR code as shown in Fig. 11. In Fig. 11, it is shown that the currently measured and theoretical values based on the CMPR code are in good agreement, in terms of not only shape but also magnitude. TALYS predicts results that are approximately 5 times lower than CMPR, and this difference increases rapidly with increasing energy.
-
For the 112Cd(γ, p)111Ag reaction only one previous experimental data sets in 23 MeV [3]; this was found to be lower than the theoretical values obtained using the CMPR code as shown in Fig. 11. In Fig. 11, it is shown that the currently measured and theoretical values based on the CMPR code are in good agreement, in terms of not only shape but also magnitude. TALYS predicts results that are about almost 5 times lower than CMPR, and this difference increases rapidly with increasing energy.
-
For the 112Cd(γ, p)111Ag reaction only one previous experimental data sets in 23 MeV [3]; this was found to be lower than the theoretical values obtained using the CMPR code as shown in Fig. 11. In Fig. 11, it is shown that the currently measured and theoretical values based on the CMPR code are in good agreement, in terms of not only shape but also magnitude. TALYS predicts results that are approximately 5 times lower than CMPR, and this difference increases rapidly with increasing energy.
-
For the 113Cd(γ, p)112Ag reaction only one previous experimental data sets in 23 MeV [3]; this was found to be lower than the theoretical values obtained using the CMPR code as shown in Fig. 12. In Fig. 12, it is shown that the measured values for the reaction are higher than the calculated values; however, they are the closest to the values calculated using the CMPR code. TALYS predicts results that are about almost 5 times lower than CMPR, and this difference increases rapidly with increasing energy.
-
For the 113Cd(γ, p)112Ag reaction only one previous experimental data sets in 23 MeV [3]; this was found to be lower than the theoretical values obtained using the CMPR code as shown in Fig. 12. In Fig. 12, the measured values for the reaction are higher than the calculated values; however, they are the closest to the values calculated using the CMPR code. TALYS predicts results that are approximately 5 times lower than CMPR, and this difference increases rapidly with increasing energy.
-
For the 114Cd(γ, p)113Ag reaction, only one previous experimental data set is available for 23 MeV [3]; this value was found to be lower than the theoretical values obtained using the CMPR code, as shown in Fig. 13. In Fig. 13, the measured values for the reaction are higher than the calculated values; however, they are the closest to the values calculated using the CMPR code. The results predicted by TALYS are approximately 5 times lower than the CMPR values, and this difference increases rapidly with increasing energy.
As can be seen in Figs. 11−13, a discrepancy in the experimental data for the reactions natCd(γ, p)111-113Ag is clearly observed, where our results are higher than the literature data [3]. The large difference between the results in [3] and those of this study for the reactions natCd(γ, p)111-113Ag might have originated from the difference in the measurement duration of the irradiated targets.
-
For the 114Cd(γ, p)113Ag reaction only one previous experimental data sets in 23 MeV [3]; this was found to be lower than the theoretical values obtained using the CMPR code as shown in Fig. 13. In Fig. 13, it is shown that the measured values for the reaction are higher than the calculated values; however, they are the closest to the values calculated using the CMPR code. TALYS predicts results that are about almost 5 times lower than CMPR, and this difference increases rapidly with increasing energy.
As can be seen in Fig.11-13, it is clear that a discrepancy in experimental data on the reactions natCd(γ, p)111-113Ag is observed, our results are higher than literature data [3]. The large difference between the results of the work [3] and the present ones on the reactions natCd(γ, p)111-113Ag might arise from the difference in the measuring duration of the irradiated targets.
-
For the 114Cd(γ, p)113Ag reaction, only one previous experimental data set is available for 23 MeV [3]; this value was found to be lower than the theoretical values obtained using the CMPR code, as shown in Fig. 13. In Fig. 13, the measured values for the reaction are higher than the calculated values; however, they are the closest to the values calculated using the CMPR code. The results predicted by TALYS are approximately 5 times lower than the CMPR values, and this difference increases rapidly with increasing energy.
As can be seen in Figs. 11−13, a discrepancy in the experimental data for the reactions natCd(γ, p)111-113Ag is clearly observed, where our results are higher than the literature data [3]. The large difference between the results in [3] and those of this study for the reactions natCd(γ, p)111-113Ag might have originated from the difference in the measurement duration of the irradiated targets.
-
The measurements from the reaction were only compared with the theoretical values due to unavailability of published data. In Fig. 14, it is shown that the measured values for the reaction are higher than the calculated values; however, they are the closest to the values calculated using the CMPR code. TALYS predicts results approximately 16 times lower than CMPR.
-
The measurements from the reaction were compared with only the theoretical values owing to unavailability of published data. In Fig. 14, the measured values for the reaction are higher than the calculated values; however, they are the closest to the values calculated using the CMPR code. The results predicted by TALYS are approximately 16 times lower than the CMPR results.
-
Nine tellurium isotopes are directly generated by the natTe(γ, n) reactions when natural tellurium is irradiated with bremsstrahlung radiation with an end-point energy of 10-23 MeV. In this study, the relative yields and cross sections per equivalent quantum of the natTe(γ, n)119g,119m,121g,121m,123m,125m,127,129g,129mTe reactions at the bremsstrahlung end-point energies of 10−23 MeV were determined, and the results are presented in Figs. 15−20.
-
Nine tellurium isotopes are directly generated by natTe(γ, n) reactions when natural tellurium is irradiated with bremsstrahlung radiation with end-point energy of 10-23 MeV. In this study, the relative yields and cross sections per equivalent quantum of the natTe(γ, n)119g,119m,121g,121m,123m,125m,127,129g,129mTe reactions at the bremsstrahlung end-point energies of 10-23 MeV are determined and presented in Fig. 15-20.
-
Nine tellurium isotopes are directly generated by the natTe(γ, n) reactions when natural tellurium is irradiated with bremsstrahlung radiation with an end-point energy of 10-23 MeV. In this study, the relative yields and cross sections per equivalent quantum of the natTe(γ, n)119g,119m,121g,121m,123m,125m,127,129g,129mTe reactions at the bremsstrahlung end-point energies of 10−23 MeV were determined, and the results are presented in Figs. 15−20.
-
The measured results for the 120Te(γ, n)119m,gTe reactions are compared with the theoretical values obtained with the TALYS and CMPR codes in Fig. 15. There is only one value in literature for the 120Te(γ, n)119Te reaction [22] in the energy range of the γ quantum (8.03−26.46 MeV). The theoretical values from both the TALYS and CMPR codes align with the literature data; however, our results are inferior to them, as shown in Fig. 15.
-
The measured results for the 120Te(γ, n)119m,gTe reactions are compared with the theoretical values obtained with the TALYS and CMPR codes, as shown in Fig. 15. There is only one literature data for the 120Te(γ, n)119Te reaction [22] in the energy range of γ quantum 8.03-26.46 MeV. The theoretical values from both the TALYS and CMPR codes align with the literature data; yet, our results are inferior to them, as shown in Fig. 15.
-
The measured results for the 120Te(γ, n)119m,gTe reactions are compared with the theoretical values obtained with the TALYS and CMPR codes in Fig. 15. There is only one value in literature for the 120Te(γ, n)119Te reaction [22] in the energy range of the γ quantum (8.03−26.46 MeV). The theoretical values from both the TALYS and CMPR codes align with the literature data; however, our results are inferior to them, as shown in Fig. 15.
-
The measured results for the 122Te(γ,n)121Te and 123Te(γ,2n)121Te reactions are compared with the theoretical values obtained with the TALYS and CMPR codes, as shown in Fig. 16. The measured values for the reaction are lower than the calculated values, as seen in Fig. 16.
-
The measured results for the 122Te(γ, n)121Te and 123Te(γ, 2n)121Te reactions are compared with the theoretical values obtained with the TALYS and CMPR codes in Fig. 16. The figure shows that the measured values for the reaction are lower than the calculated values.
-
The measured results for the 122Te(γ, n)121Te and 123Te(γ, 2n)121Te reactions are compared with the theoretical values obtained with the TALYS and CMPR codes in Fig. 16. The figure shows that the measured values for the reaction are lower than the calculated values.
-
The measured results for the 122Te(γ, n)121Te and 123Te(γ, 2n)121Te reactions are compared with the theoretical values obtained with the TALYS and CMPR codes in Fig. 16. The figure shows that the measured values for the reaction are lower than the calculated values.
-
The measured results for the 123Te(γ, γ`)123mTe, 124Te(γ, n)123mTe and 125Te(γ, 2n)123mTe reactions are compared with the theoretical values obtained with the TALYS code, as shown in Fig. 17. The measured values for the reaction are lower than the calculated values, as seen in Fig. 17.
-
The measured results for the 123Te(γ, γ`)123mTe, 124Te(γ, n)123mTe, and 125Te(γ, 2n)123mTe reactions are compared with the theoretical values obtained with the TALYS code in Fig. 17. The figure shows that the measured values for the reaction are lower than the calculated values.
-
The measured results for the 123Te(γ, γ`)123mTe, 124Te(γ, n)123mTe, and 125Te(γ, 2n)123mTe reactions are compared with the theoretical values obtained with the TALYS code in Fig. 17. The figure shows that the measured values for the reaction are lower than the calculated values.
-
The measured results for the 123Te(γ, γ`)123mTe, 124Te(γ, n)123mTe, and 125Te(γ, 2n)123mTe reactions are compared with the theoretical values obtained with the TALYS code in Fig. 17. The figure shows that the measured values for the reaction are lower than the calculated values.
-
The measured results for the 125Te(γ, γ`)125mTe and 126Te(γ, n)125mTe reactions are compared with the theoretical values obtained with the TALYS code in Fig. 18. As can be seen in Fig. 18(a), the measured values for the reaction are higher than the calculated values. This may be because the nucleus 125mTe emits a γ-ray with a low intensity (109.28 keV (0.28%)). However, with the exception of the data for 10−12 MeV, a good agreement is observed between the measured data and TALYS value in Fig. 18(b).
-
The measured results for the 125Te(γ, γ`)125mTe and 126Te(γ, n)125mTe reactions are compared with the theoretical values obtained with the TALYS code, as shown in Fig. 18. As can be seen in Fig. 18a, the measured values for the reaction are higher than the calculated values. This may be due to the fact that the nucleus 125mTe emits a γ-ray with low intensity (109.28 keV (0.28%)). However, with exception data in 10-12 MeV, there is a good agreement between measured data and TALYS value in Fig. 18b.
-
The measured results for the 128Te(γ,n)127Te reaction are compared with the theoretical values obtained with the TALYS, as shown in Fig. 19. The measured values for the reaction are lower than the calculated values, as seen in Fig. 19. There is a good agreement between literature data and theoretical calculations.
-
The measured results for the 128Te(γ,n)127Te reaction are compared with the theoretical values obtained with TALYS in Fig. 19. The figure shows that the measured values for the reaction are lower than the calculated values. There is a good agreement between the literature data and theoretical calculations.
-
The measured results for the 120Te(γ, n)119m,gTe reactions are compared with the theoretical values obtained with the TALYS and CMPR codes, as shown in Fig. 20. There is only one literature data for the 130Te(γ, n)129Te reaction [22] in the energy range of γ quantum 8.03-26.46 MeV. It is clear that the theoretical values from both the TALYS and CMPR codes are in agreement with the literature data, but our results are below them, as shown in Fig. 20.
-
The measured results for the 120Te(γ, n)119m,gTe reactions are compared with the theoretical values obtained with the TALYS and CMPR codes in Fig. 20. Only one value is available in literature for the 130Te(γ, n)129Te reaction [22] in the energy range of the γ quantum (8.03−26.46 MeV). It is clear that the theoretical values from both the TALYS and CMPR codes are in agreement with the literature data, but our results are lower, as shown in Fig. 20.
-
Four stibium (122Sb, 124Sb, 127Sb, 129Sb) radioisotopes were directly produced by the natTe(γ, p) reactions. The relative yields and cross section per equivalent quantum of the natTe(γ, p)122,124,127,129Sb reactions at the bremsstrahlung end-point energies of 10−23 MeV were determined for the first time in this study and are presented in Figs. 21−25.
-
Four stibium (122Sb, 124Sb, 127Sb, 129Sb) radioisotopes were directly produced by natTe(γ, p) reactions. In this study, the relative yields and cross section per equivalent quantum of the natTe(γ, p)122,124,127,129Sb reactions at the bremsstrahlung end-point energies of 10-23 MeV are determined for the first time and presented in Fig. 21-25.
-
Fig. 21 displays the measured data as well as the computed values. It is evident from the Fig. 21 that there is good agreement between the theoretical values on the basis of CMPR only for 22 and 23 MeV. The remaining experimental points are almost 100 times larger than theoretical calculations.
Since the threshold of the reaction 124Te(γ, d)122Sb is 15.33 MeV, then we can assume that up to 19 MeV (taking into account the Coulomb barrier) the nucleus 122Sb is formed as a result of the reaction 123Te(γ, p). Fig. 22 shows the ratios of the cross section per equivalent quantum
$ \sigma _{qexp}^{nat}/\sigma _{qtheory}^{nat} $ for the (γ, p) reaction on 123Te. As can be seen in Fig. 22, both models cannot describe the experimental points. -
Figure 21 displays the measured data and computed values. It is evident from Fig. 21 that the theoretical values based on the CMPR show a good agreement only for 22 and 23 MeV. The remaining experimental points are almost 100 times larger than the theoretical calculations.
Because the threshold of the reaction 124Te(γ, d)122Sb is 15.33 MeV, we can assume that up to 19 MeV (considering the Coulomb barrier), the nucleus 122Sb is formed as a result of the reaction 123Te(γ, p). Figure 22 shows the ratios of the cross section per equivalent quantum
$ \sigma_{q\mathrm{exp}}^{\mathrm{nat}}/\sigma_{q\mathrm{theory}}^{\mathrm{nat}} $ for the (γ, p) reaction on 123Te. As can be seen in Fig. 22, both models cannot describe the experimental points. -
The measured results for the 125Te(γ, p)124Sb and 126Te(γ, np)124Sb reactions are compared with the theoretical values obtained with the TALYS and CMPR codes in Fig. 23. A discrepancy between the theoretical calculations is clearly observed, and the experimental points are higher than the TALYS curve but lower than the CMPR curve with an exception at 19 MeV (this point is in good agreement with the TALYS calculation).
-
The measured results for the 125Te(γ, p)124Sb and 126Te(γ, np)124Sb reactions are compared with the theoretical values obtained with the TALYS and CMPR codes, as shown in Fig. 23. It is clear that there is a discrepancy between theoretical calculations, and the experimental points are higher than the TALYS curve, but lower than the CMPR curve with an exception 19 MeV (this point is in good agreement with the TALYS calculation).
-
The measured results for the 125Te(γ, p)124Sb and 126Te(γ, np)124Sb reactions are compared with the theoretical values obtained with the TALYS and CMPR codes in Fig. 23. A discrepancy between the theoretical calculations is clearly observed, and the experimental points are higher than the TALYS curve but lower than the CMPR curve with an exception at 19 MeV (this point is in good agreement with the TALYS calculation).
-
The measured results for the 128Te(γ, p)127Sb reaction are compared with the theoretical values obtained with the TALYS and CMPR codes in Fig. 24. It is evident from Fig. 24 that the theoretical values based on the CMPR and the measured values in this study agree well in terms of both form and magnitude.
-
The measured results for the 128Te(γ,p)127Sb reaction are compared with the theoretical values obtained with the TALYS and CMPR codes, as shown in Fig. 24. It is evident from the Fig. 24 that there is good agreement between the theoretical values on the basis of CMPR and currently measured values in terms of both form and magnitude.
-
The measured results for the 128Te(γ, p)127Sb reaction are compared with the theoretical values obtained with the TALYS and CMPR codes in Fig. 24. It is evident from Fig. 24 that the theoretical values based on the CMPR and the measured values in this study agree well in terms of both form and magnitude.
-
Figure 25 displays the measured data and the computed values. A discrepancy between the theoretical calculations is clearly observed, and the experimental points are higher than the TALYS curve but lower than the CMPR curve. The experimentally obtained results lie closer to the theoretical curve obtained from the CMPR.
-
Fig. 25 displays the measured data as well as the computed values. It is clear that there is a discrepancy between theoretical calculations, and the experimental points are higher than the TALYS curve, but lower than the CMPR curve. The experimentally obtained results lie closer to the theoretical curve according to the CMPR.
-
Figure 25 displays the measured data and the computed values. A discrepancy between the theoretical calculations is clearly observed, and the experimental points are higher than the TALYS curve but lower than the CMPR curve. The experimentally obtained results lie closer to the theoretical curve obtained from the CMPR.
-
The irradiation of the natural mixtures of Cd and Te allows us to study photonuclear reactions over a wide mass range of A=106−130. The cross section per equivalent quantum of the (γ, p) reaction in the case of monoisotopes σq calculated using CMPR and TALYS by applying Eq. (5) are contrasted against the experimental data in Fig. 26. The data in Fig. 26 show that the measured yields of the (γ, p) reactions on the isotopes 112,113,114,116Cd and 128,130Te agree within 30% with the results of the calculations based on the CMPR. The (γ, p) yields calculated using the TALYS code are underestimated with respect to the experimental data by one order of magnitude. The reason behind this difference is that the TALYS code disregards the special features of the decay of the T> GDR component, where the decay through the proton channel to low-lying states of the final nucleus is forbidden by the isospin-selection rules. Thus, the T> states decay through the proton channel with a higher probability. The cross section per equivalent quantum calculations for the reactions 114Cd(γ, p)113Ag and 128Te(γ, p)127Sb using the TALYS parameters, models of the nuclear level densities and γ-ray strength functions, and accounting for isospin splitting in the CMPR are given in Appendix B.
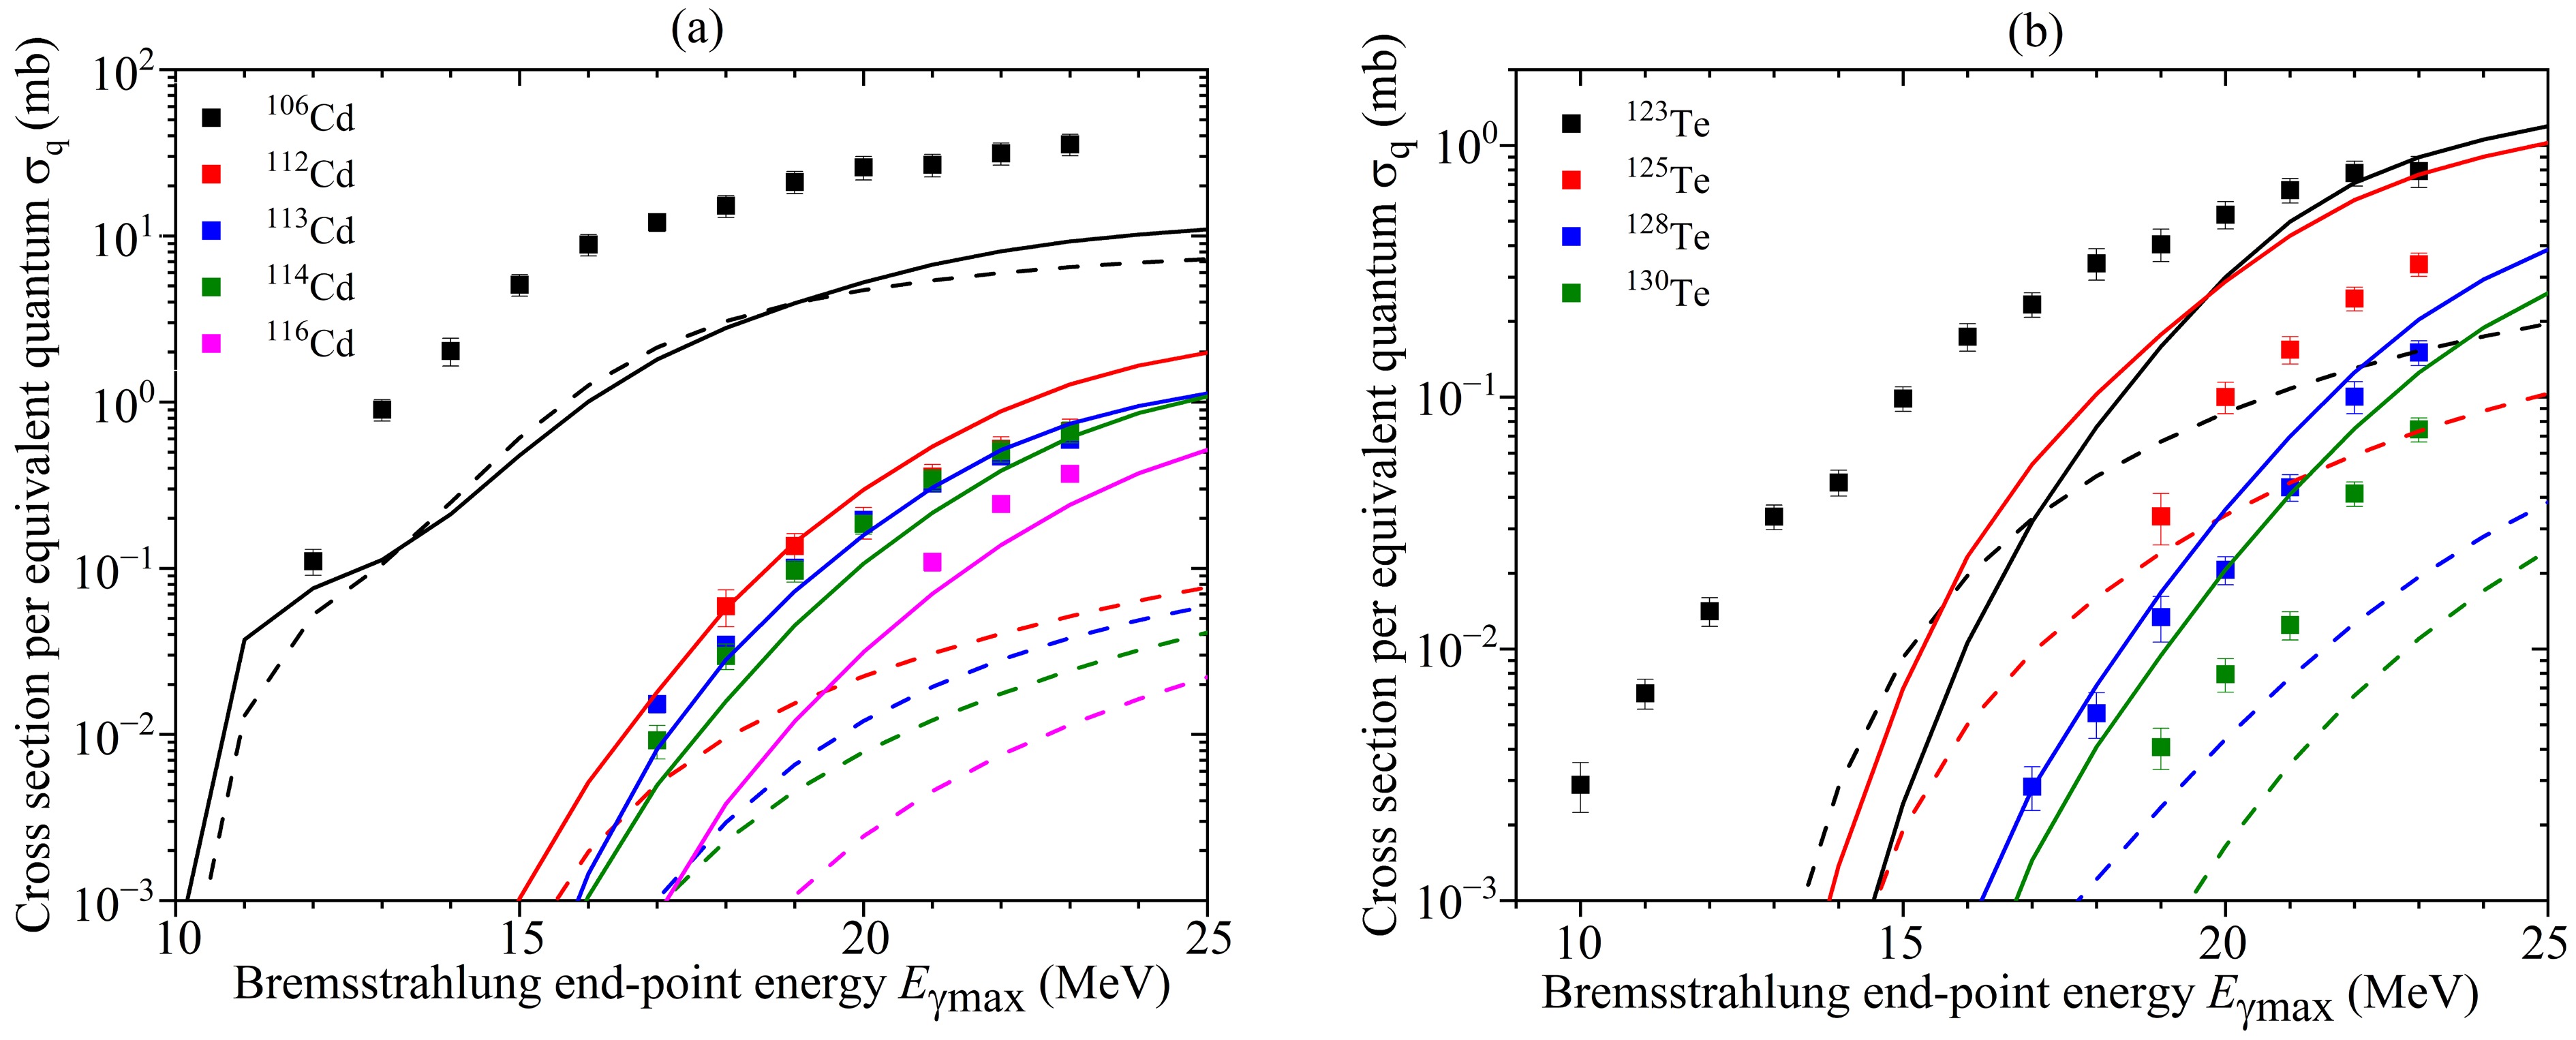
Figure 26. (color online) Cross section per equivalent quantum of the (γ, p) reaction in the case of monoisotopes σq for the stable isotopes of cadmium (a) and tellurium (b).
The measured (γ, p) yields are a few percent of the (γ,n) yields for all nuclei, with the exception of the 106Cd nucleus, for which the yield of the reaction 106Cd(γ, p)105Cd is commensurate with the yield of the reaction 106Cd(γ, n)105Cd, but this contradicts the results of the theoretical calculations in [24, 25]. The situation is unclear for the 123Te(γ, p)122Sb reaction. In all experiments, the spectra show a line at 564 keV. However, theoretical calculations using TALYS and CMPR are several orders of magnitude smaller.
For a more thorough analysis of the obtained results, the ratios between the reaction yields (γ,p) and (γ,n) were calculated for the nuclei 106Cd (105Ag/105Cd), 116Cd (115Ag/115Cd), 128Te (127Sb/127Te), and 130Te (129Sb/129Te). In addition, the ratios of the yields (γ, p)/(γ, n) were calculated for the nucleus 74Se based on the experimental results in our previous study [40]. Figure 27(a) shows that the ratio between the reaction yields (γ, p) and (γ, n) depends on the electron energy of the accelerator. As shown in Fig. 27(a), the ratios of the yields (γ, p)/(γ, n) are almost equal to 1 for the bypassed nuclei 74Se and 106Cd. It can be seen that with the exception of the points for the nucleus 106Cd, the experimental points are consistent with the calculated curves of the CMPR. In the case of 106Cd (105Ag/105Cd), CMPR and TALYS cannot describe the experimental results. The reason for the observed discrepancy between theory and experiment may be explained by the fact that statistical models of photonuclear reactions do not consider the individual structural features of the Cd isotopes.
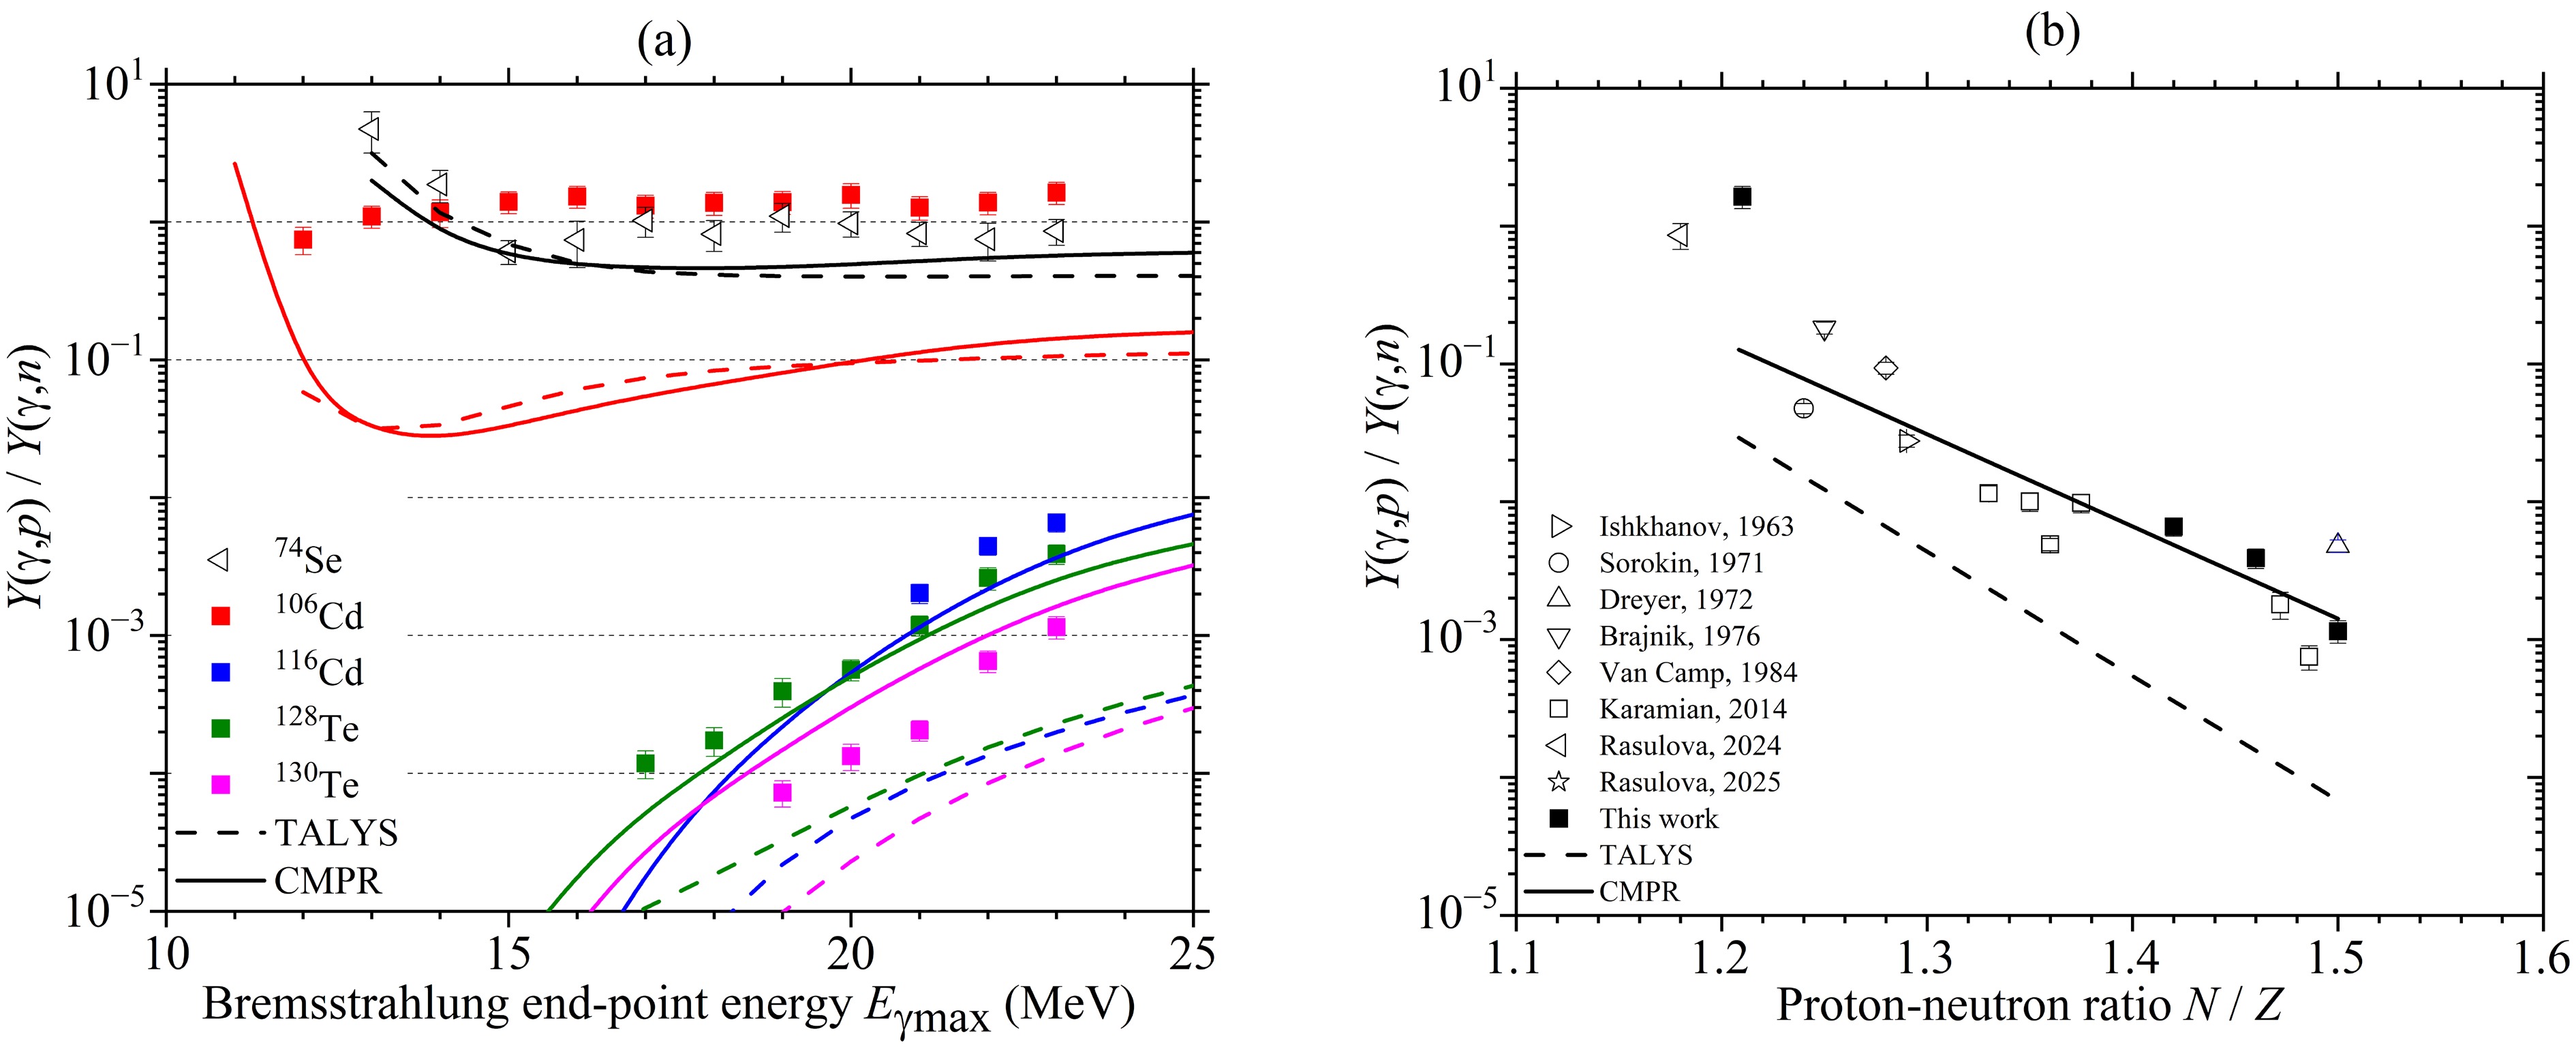
Figure 27. (color online) Ratio of the reaction yields (γ, p)/(γ, n) as functions of: (a) the electron energy of the accelerator and (b) the proton-neutron ratio N/Z at the electron energy of 23 MeV of the accelerator.
Figure 27(b) shows the ratios of the yields (γ, p)/(γ, n) as functions of the proton-neutron ratio N/Z at the electron energy of 23 MeV of the accelerator. The literature data were calculated using the experimentally measured reaction cross sections (γ, p) and (γ, n) on the nuclei 90Zr [41–42], 89Y [42–43], 103Rh [1, 44], 112Sn [45–46], and 160Gd [47]. With the exception of the points at N/Z = 1.176 (74Se) and 1.208 (106Cd), the experimental points are consistent with the curve calculated using the CMPR. The ratio of the yields (γ, p)/(γ, n) decreases with increasing proton-neutron ratio N/Z.
-
The irradiation of the natural mixtures of Cd and Te allows us to study photonuclear reactions over a wide mass range of A=106−130. The cross section per equivalent quantum of the (γ, p) reaction in the case of monoisotopes σq calculated using CMPR and TALYS by applying Eq. (5) are contrasted against the experimental data in Fig. 26. The data in Fig. 26 show that the measured yields of the (γ, p) reactions on the isotopes 112,113,114,116Cd and 128,130Te agree within 30% with the results of the calculations based on the CMPR. The (γ, p) yields calculated using the TALYS code are underestimated with respect to the experimental data by one order of magnitude. The reason behind this difference is that the TALYS code disregards the special features of the decay of the T> GDR component, where the decay through the proton channel to low-lying states of the final nucleus is forbidden by the isospin-selection rules. Thus, the T> states decay through the proton channel with a higher probability. The cross section per equivalent quantum calculations for the reactions 114Cd(γ, p)113Ag and 128Te(γ, p)127Sb using the TALYS parameters, models of the nuclear level densities and γ-ray strength functions, and accounting for isospin splitting in the CMPR are given in Appendix B.
Figure 26. (color online) Cross section per equivalent quantum of the (γ, p) reaction in the case of monoisotopes σq for the stable isotopes of cadmium (a) and tellurium (b).
The measured (γ, p) yields are a few percent of the (γ,n) yields for all nuclei, with the exception of the 106Cd nucleus, for which the yield of the reaction 106Cd(γ, p)105Cd is commensurate with the yield of the reaction 106Cd(γ, n)105Cd, but this contradicts the results of the theoretical calculations in [24, 25]. The situation is unclear for the 123Te(γ, p)122Sb reaction. In all experiments, the spectra show a line at 564 keV. However, theoretical calculations using TALYS and CMPR are several orders of magnitude smaller.
For a more thorough analysis of the obtained results, the ratios between the reaction yields (γ,p) and (γ,n) were calculated for the nuclei 106Cd (105Ag/105Cd), 116Cd (115Ag/115Cd), 128Te (127Sb/127Te), and 130Te (129Sb/129Te). In addition, the ratios of the yields (γ, p)/(γ, n) were calculated for the nucleus 74Se based on the experimental results in our previous study [40]. Figure 27(a) shows that the ratio between the reaction yields (γ, p) and (γ, n) depends on the electron energy of the accelerator. As shown in Fig. 27(a), the ratios of the yields (γ, p)/(γ, n) are almost equal to 1 for the bypassed nuclei 74Se and 106Cd. It can be seen that with the exception of the points for the nucleus 106Cd, the experimental points are consistent with the calculated curves of the CMPR. In the case of 106Cd (105Ag/105Cd), CMPR and TALYS cannot describe the experimental results. The reason for the observed discrepancy between theory and experiment may be explained by the fact that statistical models of photonuclear reactions do not consider the individual structural features of the Cd isotopes.
Figure 27. (color online) Ratio of the reaction yields (γ, p)/(γ, n) as functions of: (a) the electron energy of the accelerator and (b) the proton-neutron ratio N/Z at the electron energy of 23 MeV of the accelerator.
Figure 27(b) shows the ratios of the yields (γ, p)/(γ, n) as functions of the proton-neutron ratio N/Z at the electron energy of 23 MeV of the accelerator. The literature data were calculated using the experimentally measured reaction cross sections (γ, p) and (γ, n) on the nuclei 90Zr [41–42], 89Y [42–43], 103Rh [1, 44], 112Sn [45–46], and 160Gd [47]. With the exception of the points at N/Z = 1.176 (74Se) and 1.208 (106Cd), the experimental points are consistent with the curve calculated using the CMPR. The ratio of the yields (γ, p)/(γ, n) decreases with increasing proton-neutron ratio N/Z.
-
Since we are irradiating natural mixtures of Cd and Te, this will give us the opportunity to study photonuclear reactions over a wide mass range with A=106-130. The cross section per equivalent quantum of the (γ,p) reaction in a case of monoisotopes σq calculated on the basis of the CMPR and TALYS by equation (5) are contrasted against experimental data in Fig. 26. The data in Fig. 26 shows that the measured yields of the (γ,p) reactions on the isotopes 112,113,114,116Cd and 128,130Te agree within 30% with the results of the calculations based on the CMPR. The (γ,p) yields calculated on the basis of the TALYS code are underestimated with respect to experimental data by one order of magnitude. The reason behind this difference is that the TALYS code disregards special features of the decay of the T> GDR component, whose decay through the proton channel to low-lying states of the final nucleus is forbidden by isospin-selection rules. As a result, T> states decay through the proton channel with a higher probability. The cross section per equivalent quantum calculations for the reactions 114Cd(γ,p)113Ag and 128Te(γ,p)127Sb using TALYS parameters on the basis of the models of the nuclear level densities and γ-ray strength functions and accounting of isospin splitting in CMPR are given in Appendix 2.
Figure 26. (color online) Cross section per equivalent quantum of the (γ,p) reaction in a case of monoisotopes σq for the stable isotopes of cadmium (a) and tellurium (b)
The measured (γ,p) yields are a few percent of the (γ,n) yields for all nuclei, with the exception of the 106Cd nucleus, for which the yield of the reaction 106Cd(γ,p)105Cd is commensurate with the yield of the reaction 106Cd(γ,n)105Cd, but this contradicts the results of the theoretical calculations in [24,25]. In the case of the 123Te(γ,p)122Sb reaction, the situation is completely unclear. In all experiments, the spectra show a line at 564 keV. However, theoretical calculations on the basis of TALYS and CMPR are several orders of magnitude smaller.
For a more thorough analysis of the obtained results, the ratios of the reaction yield (γ,p) to the reaction yield (γ,n) were calculated for the nuclei 106Cd (105Ag/105Cd), 116Cd (115Ag/115Cd), 128Te (127Sb/127Te) and 130Te (129Sb/129Te). Also the ratios of yields (γ,p)/(γ,n) are calculated for the nucleus 74Se on the basis of the experimental results of our previously work [41]. Figure 27a shows the ratio of the reaction yield (γ,p) to the reaction yield (γ,n) depending on the electron energy of the accelerator. As shown in Fig. 27a the ratios of yields (γ,p)/(γ,n) are almost equal to 1 for bypassed nuclei 74Se and 106Cd. It can be seen that with the exception of the points for the nucleus 106Cd, the experimental points are consistent with the calculated curves of CMPR. In the case of 106Cd (105Ag/105Cd), the CMPR and TALYS cannot describe the experimental results. The reason for the observed discrepancy between theory and experiment may be explained by the fact that statistical models of photonuclear reactions do not take into account the individual structural features of Cd isotopes.
Figure 27. (color online) The ratio of the reactions’ yields (γ,p)/(γ,n) as a function of: (a) the electron energy of the accelerator and (b) the proton-neutron ratio N/Z at the electron energy of the accelerator 23 MeV
Figure 27b shows the ratios of yields (γ,p)/(γ,n) as a function of the proton-neutron ratio N/Z at the electron energy of the accelerator 23 MeV. The literature data were calculated using experimentally measured reaction cross sections (γ,p) and (γ,n) on the nuclei 90Zr [42,43], 89Y [43,44], 103Rh [1,45], 112Sn [46,47] and 160Gd [48]. With the exception of the points at N/Z = 1.176 (74Se) and 1.208 (106Cd), the experimental points are consistent with the calculated curve on the basis of CMPR. The ratio of yields (γ,p)/(γ,n) decreases with increasing proton-neutron ratio N/Z.
-
The irradiation of the natural mixtures of Cd and Te allows us to study photonuclear reactions over a wide mass range of A=106−130. The cross section per equivalent quantum of the (γ, p) reaction in the case of monoisotopes σq calculated using CMPR and TALYS by applying Eq. (5) are contrasted against the experimental data in Fig. 26. The data in Fig. 26 show that the measured yields of the (γ, p) reactions on the isotopes 112,113,114,116Cd and 128,130Te agree within 30% with the results of the calculations based on the CMPR. The (γ, p) yields calculated using the TALYS code are underestimated with respect to the experimental data by one order of magnitude. The reason behind this difference is that the TALYS code disregards the special features of the decay of the T> GDR component, where the decay through the proton channel to low-lying states of the final nucleus is forbidden by the isospin-selection rules. Thus, the T> states decay through the proton channel with a higher probability. The cross section per equivalent quantum calculations for the reactions 114Cd(γ, p)113Ag and 128Te(γ, p)127Sb using the TALYS parameters, models of the nuclear level densities and γ-ray strength functions, and accounting for isospin splitting in the CMPR are given in Appendix B.
Figure 26. (color online) Cross section per equivalent quantum of the (γ, p) reaction in the case of monoisotopes σq for the stable isotopes of cadmium (a) and tellurium (b).
The measured (γ, p) yields are a few percent of the (γ,n) yields for all nuclei, with the exception of the 106Cd nucleus, for which the yield of the reaction 106Cd(γ, p)105Cd is commensurate with the yield of the reaction 106Cd(γ, n)105Cd, but this contradicts the results of the theoretical calculations in [24, 25]. The situation is unclear for the 123Te(γ, p)122Sb reaction. In all experiments, the spectra show a line at 564 keV. However, theoretical calculations using TALYS and CMPR are several orders of magnitude smaller.
For a more thorough analysis of the obtained results, the ratios between the reaction yields (γ,p) and (γ,n) were calculated for the nuclei 106Cd (105Ag/105Cd), 116Cd (115Ag/115Cd), 128Te (127Sb/127Te), and 130Te (129Sb/129Te). In addition, the ratios of the yields (γ, p)/(γ, n) were calculated for the nucleus 74Se based on the experimental results in our previous study [40]. Figure 27(a) shows that the ratio between the reaction yields (γ, p) and (γ, n) depends on the electron energy of the accelerator. As shown in Fig. 27(a), the ratios of the yields (γ, p)/(γ, n) are almost equal to 1 for the bypassed nuclei 74Se and 106Cd. It can be seen that with the exception of the points for the nucleus 106Cd, the experimental points are consistent with the calculated curves of the CMPR. In the case of 106Cd (105Ag/105Cd), CMPR and TALYS cannot describe the experimental results. The reason for the observed discrepancy between theory and experiment may be explained by the fact that statistical models of photonuclear reactions do not consider the individual structural features of the Cd isotopes.
Figure 27. (color online) Ratio of the reaction yields (γ, p)/(γ, n) as functions of: (a) the electron energy of the accelerator and (b) the proton-neutron ratio N/Z at the electron energy of 23 MeV of the accelerator.
Figure 27(b) shows the ratios of the yields (γ, p)/(γ, n) as functions of the proton-neutron ratio N/Z at the electron energy of 23 MeV of the accelerator. The literature data were calculated using the experimentally measured reaction cross sections (γ, p) and (γ, n) on the nuclei 90Zr [41–42], 89Y [42–43], 103Rh [1, 44], 112Sn [45–46], and 160Gd [47]. With the exception of the points at N/Z = 1.176 (74Se) and 1.208 (106Cd), the experimental points are consistent with the curve calculated using the CMPR. The ratio of the yields (γ, p)/(γ, n) decreases with increasing proton-neutron ratio N/Z.
-
Based on the measured experimental yields of the metastable and ground states from Tables 1−2 in Appendix 1, we obtained the isomeric yield ratio (IR=σh/σl) of 115gCd (nuclear spin=1/2+) and 115mCd (nuclear spin=11/2–) in the natCd(γ,n) reactions, which are given in Table 3 for various bremsstrahlung end-point energies. The photon induced isomeric ratios in this study and the literature data in the GDR region [7−15] are shown in Fig. 28(a). As seen in Fig. 28(a), the experimental isomeric ratios in the 116Cd(γ, n) reaction are in agreement with the theoretical values. Furthermore, Fig. 28(a) shows that the isomeric ratios of 115m,gCd increase with increasing excitation energy.
Eγmax/MeV 116Cd(γ,n)115Cd 120Te(γ,n)119Te 122Te(γ,n)121Te 130Te(γ,n)129Te 11 0.023 (4) 12 0.05 (1) 0.045 (8) 13 0.06 (1) 0.024 (6) 0.06 (1) 0.12 (2) 14 0.08 (1) 0.04 (1) 0.09 (1) 0.14 (2) 15 0.09 (1) 0.06 (1) 0.12 (2) 0.18 (3) 16 0.11 (2) 0.08 (1) 0.13 (2) 0.23 (3) 17 0.12 (2) 0.08 (1) 0.15 (2) 0.21 (4) 18 0.13 (2) 0.11 (2) 0.17 (3) 0.25 (4) 19 0.13 (2) 0.10 (2) 0.17 (3) 0.25 (4) 20 0.15 (2) 0.11 (2) 0.18 (3) 0.27 (4) 21 0.16 (2) 0.11 (2) 0.19 (3) 0.27 (4) 22 0.16 (2) 0.11 (2) 0.19 (3) 0.28 (4) 23 0.15 (2) 0.12 (2) 0.19 (3) 0.27 (4) Table 3. Isomeric ratios of the 116Cd(γ,n)115Cd and natTe(γ,n)119,121,129Te reactions at the bremsstrahlung end-point energies of 11−23 MeV from the present work
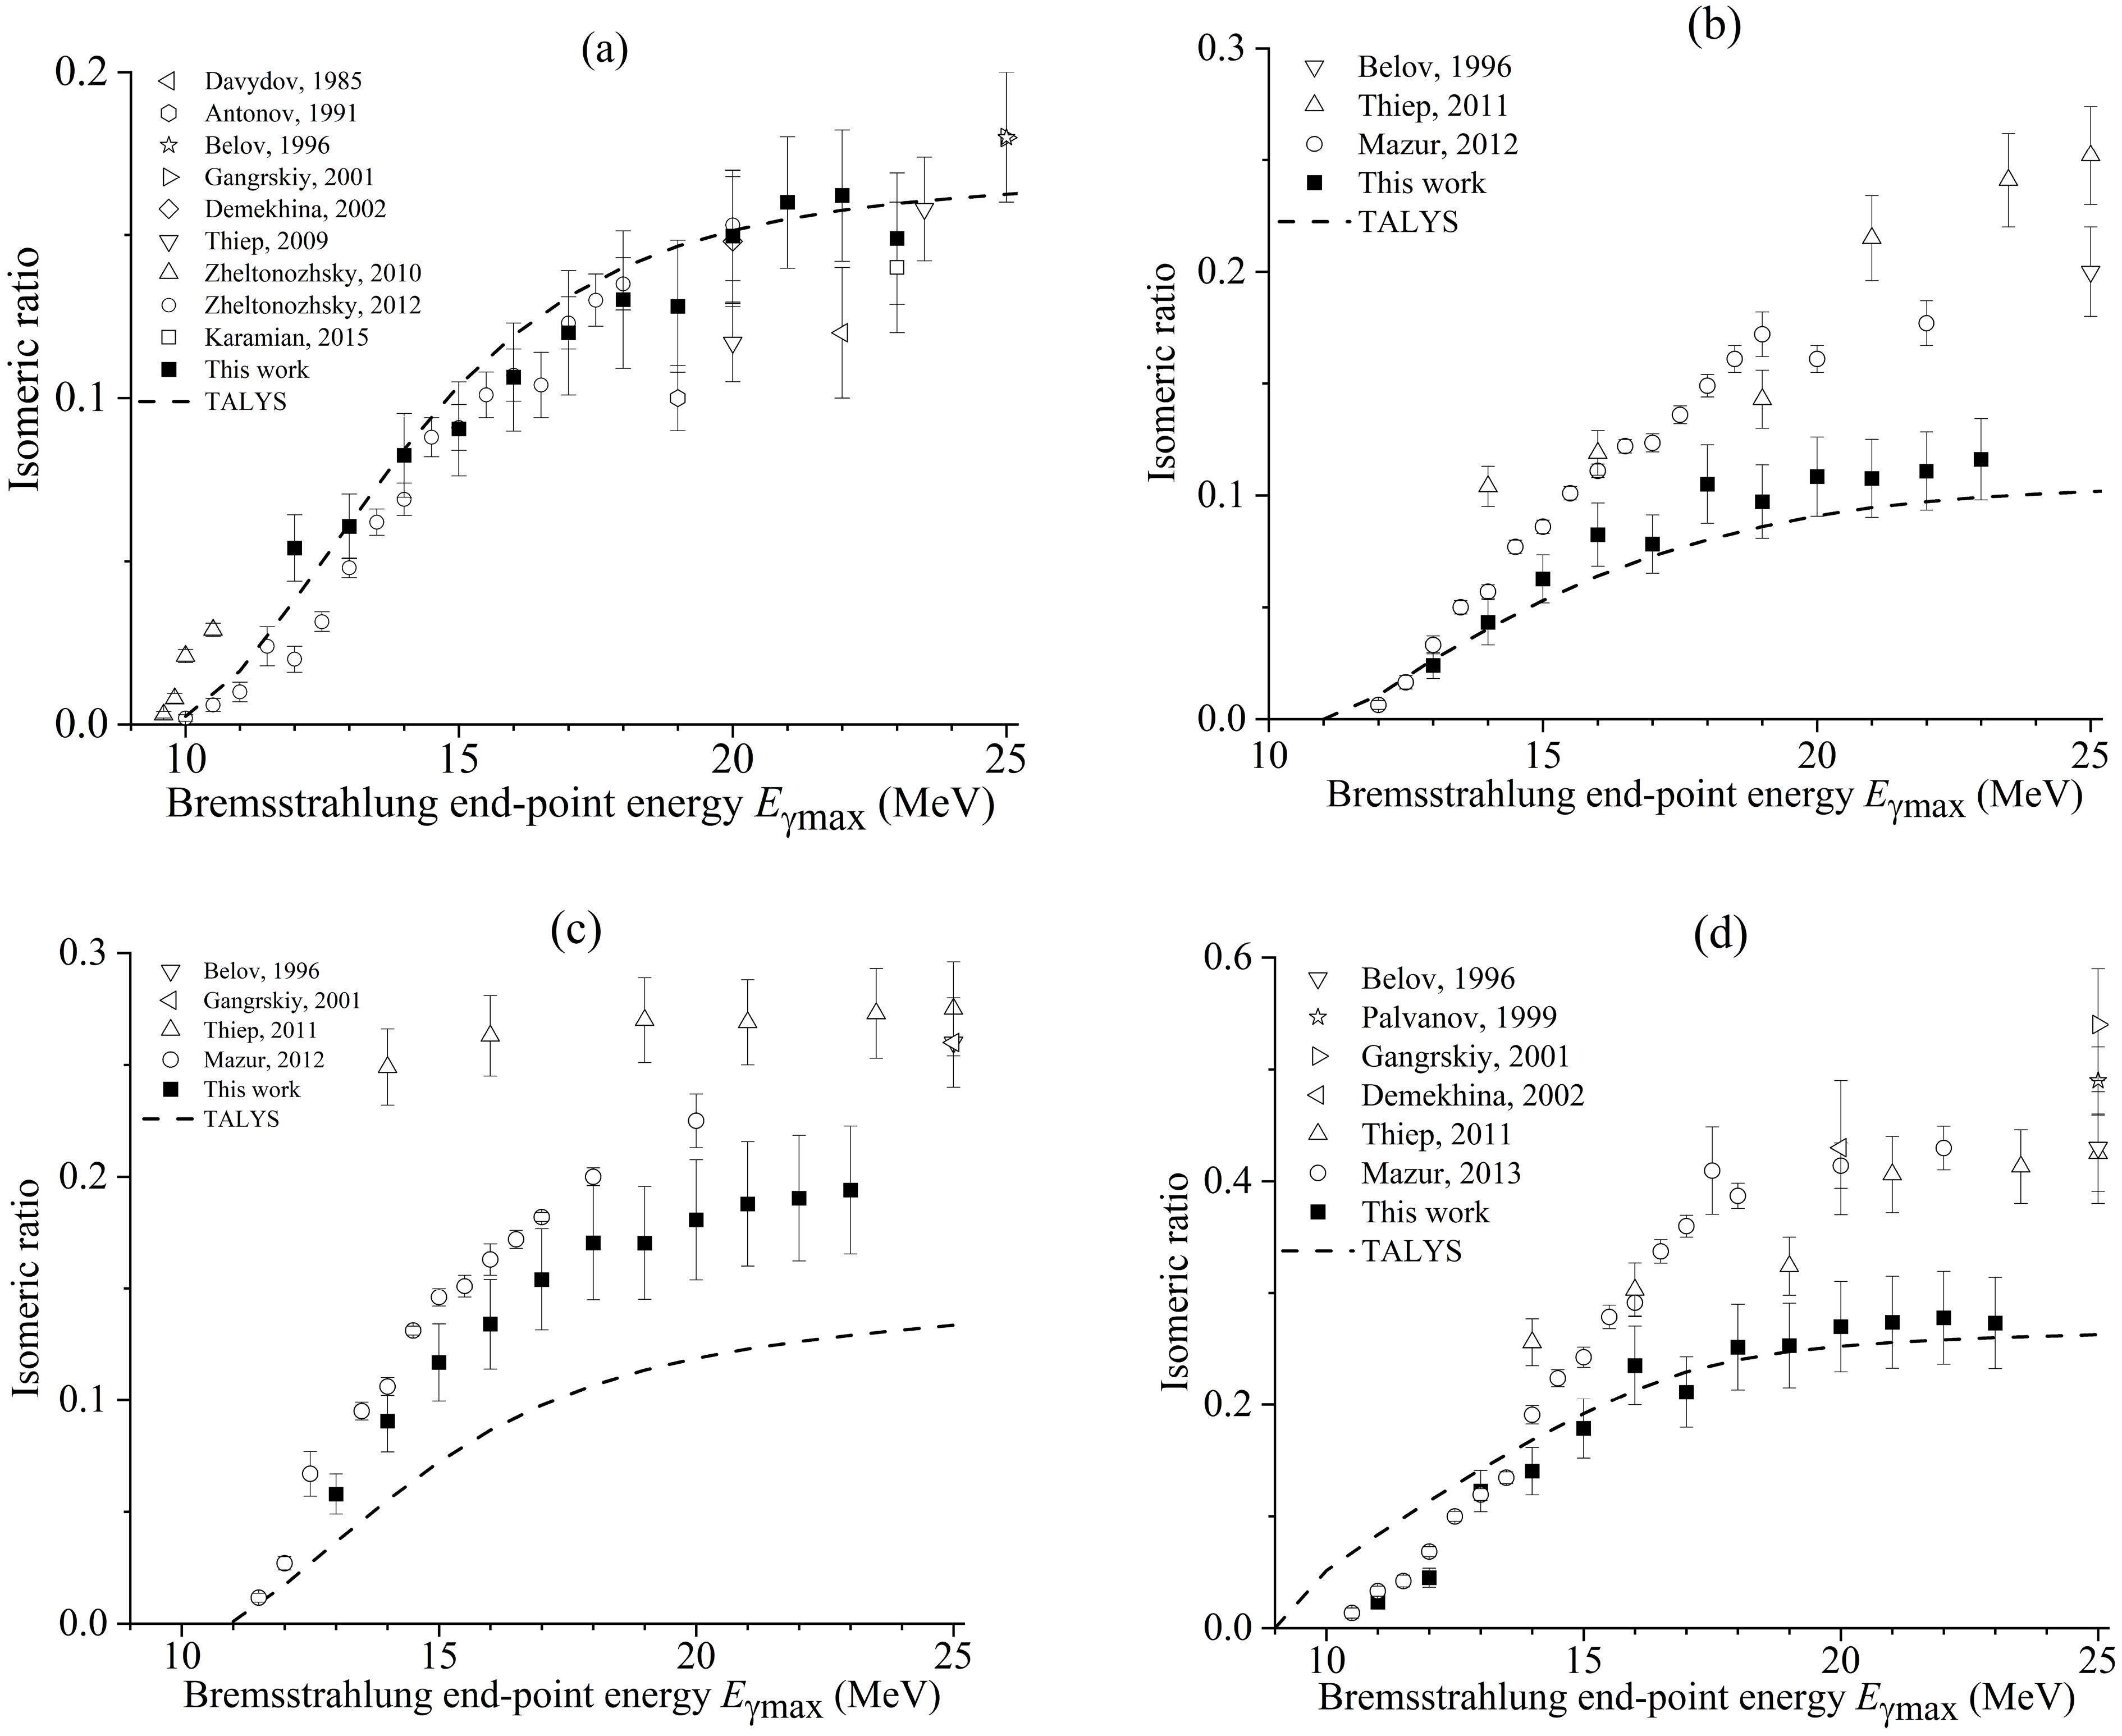
Figure 28. Isomeric yield ratios of the pairs 116Cd(γ, n)115m,gCd (a), 120Te(γ, n)119m,gTe (b), 122Te(γ, n)121m,gTe (c), and 130Te(γ, n)129m,gTe (d) as functions of the bremsstrahlung end-point energy from this study (solid squares), literature data, and simulated values using TALYS code (dashed lines).
In the experiments, we registered three isomeric pairs of tellurium, 119,121,129Te. All isomeric states have the nuclear spin 11/2–. Based on the measured experimental yields of the metastable and ground states, we obtained the isomeric yield ratio (IR=σh/σl) for each of them, as shown in Figs. 28(b), (c), (d), for various bremsstrahlung end-point energies.
For the reaction 120Te(γ, n)119Te, the photon induced isomeric ratios in this study and the literature data in the GDR region [10, 19, 20] are shown in Fig. 27(b). As seen in Fig. 28(b), our experimental isomeric ratios in the 120Te(γ, n) reaction are in agreement with the TALYS curve. Starting from 15 MeV, a scatter is observed in our results and the literature data for the isomeric ratios. Moreover, the figure shows that the isomeric ratios of 119m,gTe increase with increasing excitation energy.
For the reaction 122Te(γ, n)121Te, the photon induced isomeric ratios from this study and the literature data in the GDR region [10, 11, 19, 20] are shown in Fig. 28(c). As seen in Fig. 28(c), our experimental values of the isomeric ratios in the reaction natTe(γ, n)121m,gTe are consistent with the literature data, but they diverge from the TALYS curve from 11 MeV onward. Additionally, as the excitation energy increases, the isomeric ratios of 121m,gTe rise, as shown in the figure.
For the reaction 130Te(γ, n)129Te, the photon-induced isomeric ratios from this study and the literature data in the GDR region [10−12, 17, 19, 21] are shown in Fig. 28(d). As seen in Fig. 28(d), our experimental isomeric ratios in the 130Te(γ, n) reaction are in agreement with the TALYS curve. Starting from 14 MeV, a scatter is observed in our results and the literature data for the isomeric ratios. Furthermore, the figure shows that the isomeric ratios of 129m,gTe increase with increasing excitation energy.
-
Based on the measured experimental yields of the metastable and ground states from Tables 1−2 in Appendix 1, we obtained the isomeric yield ratio (IR=σh/σl) of 115gCd (nuclear spin=1/2+) and 115mCd (nuclear spin=11/2–) in the natCd(γ,n) reactions, which are given in Table 3 for various bremsstrahlung end-point energies. The photon induced isomeric ratios in this study and the literature data in the GDR region [7−15] are shown in Fig. 28(a). As seen in Fig. 28(a), the experimental isomeric ratios in the 116Cd(γ, n) reaction are in agreement with the theoretical values. Furthermore, Fig. 28(a) shows that the isomeric ratios of 115m,gCd increase with increasing excitation energy.
Eγmax/MeV 116Cd(γ,n)115Cd 120Te(γ,n)119Te 122Te(γ,n)121Te 130Te(γ,n)129Te 11 0.023 (4) 12 0.05 (1) 0.045 (8) 13 0.06 (1) 0.024 (6) 0.06 (1) 0.12 (2) 14 0.08 (1) 0.04 (1) 0.09 (1) 0.14 (2) 15 0.09 (1) 0.06 (1) 0.12 (2) 0.18 (3) 16 0.11 (2) 0.08 (1) 0.13 (2) 0.23 (3) 17 0.12 (2) 0.08 (1) 0.15 (2) 0.21 (4) 18 0.13 (2) 0.11 (2) 0.17 (3) 0.25 (4) 19 0.13 (2) 0.10 (2) 0.17 (3) 0.25 (4) 20 0.15 (2) 0.11 (2) 0.18 (3) 0.27 (4) 21 0.16 (2) 0.11 (2) 0.19 (3) 0.27 (4) 22 0.16 (2) 0.11 (2) 0.19 (3) 0.28 (4) 23 0.15 (2) 0.12 (2) 0.19 (3) 0.27 (4) Table 3. Isomeric ratios of the 116Cd(γ,n)115Cd and natTe(γ,n)119,121,129Te reactions at the bremsstrahlung end-point energies of 11−23 MeV from the present work
Figure 28. Isomeric yield ratios of the pairs 116Cd(γ, n)115m,gCd (a), 120Te(γ, n)119m,gTe (b), 122Te(γ, n)121m,gTe (c), and 130Te(γ, n)129m,gTe (d) as functions of the bremsstrahlung end-point energy from this study (solid squares), literature data, and simulated values using TALYS code (dashed lines).
In the experiments, we registered three isomeric pairs of tellurium, 119,121,129Te. All isomeric states have the nuclear spin 11/2–. Based on the measured experimental yields of the metastable and ground states, we obtained the isomeric yield ratio (IR=σh/σl) for each of them, as shown in Figs. 28(b), (c), (d), for various bremsstrahlung end-point energies.
For the reaction 120Te(γ, n)119Te, the photon induced isomeric ratios in this study and the literature data in the GDR region [10, 19, 20] are shown in Fig. 27(b). As seen in Fig. 28(b), our experimental isomeric ratios in the 120Te(γ, n) reaction are in agreement with the TALYS curve. Starting from 15 MeV, a scatter is observed in our results and the literature data for the isomeric ratios. Moreover, the figure shows that the isomeric ratios of 119m,gTe increase with increasing excitation energy.
For the reaction 122Te(γ, n)121Te, the photon induced isomeric ratios from this study and the literature data in the GDR region [10, 11, 19, 20] are shown in Fig. 28(c). As seen in Fig. 28(c), our experimental values of the isomeric ratios in the reaction natTe(γ, n)121m,gTe are consistent with the literature data, but they diverge from the TALYS curve from 11 MeV onward. Additionally, as the excitation energy increases, the isomeric ratios of 121m,gTe rise, as shown in the figure.
For the reaction 130Te(γ, n)129Te, the photon-induced isomeric ratios from this study and the literature data in the GDR region [10−12, 17, 19, 21] are shown in Fig. 28(d). As seen in Fig. 28(d), our experimental isomeric ratios in the 130Te(γ, n) reaction are in agreement with the TALYS curve. Starting from 14 MeV, a scatter is observed in our results and the literature data for the isomeric ratios. Furthermore, the figure shows that the isomeric ratios of 129m,gTe increase with increasing excitation energy.
-
Based on the measured experimental yields of the metastable and ground states from Table 1-2 in Appendix 1, we obtained the isomeric yield ratio (IR=σh/σl) of 115gCd (nuclear spin=1/2+) and 115mCd (nuclear spin=11/2–) in the natCd(γ,n) reactions, which are given in Table 3 for various bremsstrahlung end-point energies. The photon induced isomeric ratio values from this study, the literature data in the GDR region [7-15] are shown in Fig. 28a. As seen in Fig. 28a, the experimental isomeric ratio values in the 116Cd(γ, n) reaction are in agreement with the theoretical values. Furthermore, Fig. 28a shows that the isomeric ratio values of 115m,gCd increase with increasing excitation energy.
Energy (MeV) 116Cd(γ,n)115Cd 120Te(γ,n)119Te 122Te(γ,n)121Te 130Te(γ,n)129Te 11 0.023 ± 0.004 12 0.05 ± 0.01 0.045 ± 0.008 13 0.06 ± 0.01 0.024 ± 0.006 0.06 ± 0.01 0.12 ± 0.02 14 0.08 ± 0.01 0.04 ± 0.01 0.09 ± 0.01 0.14 ± 0.02 15 0.09 ± 0.01 0.06 ± 0.01 0.12 ± 0.02 0.18 ± 0.03 16 0.11 ± 0.02 0.08 ± 0.01 0.13 ± 0.02 0.23 ± 0.03 17 0.12 ± 0.02 0.08 ± 0.01 0.15 ± 0.02 0.21 ± 0.03 18 0.13 ± 0.02 0.11 ± 0.02 0.17 ± 0.03 0.25 ± 0.04 19 0.13 ± 0.02 0.10 ± 0.02 0.17 ± 0.03 0.25 ± 0.04 20 0.15 ± 0.02 0.11 ± 0.02 0.18 ± 0.03 0.27 ± 0.04 21 0.16 ± 0.02 0.11 ± 0.02 0.19 ± 0.03 0.27 ± 0.04 22 0.16 ± 0.02 0.11 ± 0.02 0.19 ± 0.03 0.28 ± 0.04 23 0.15 ± 0.02 0.12 ± 0.02 0.19 ± 0.03 0.27 ± 0.04 Table 3. Isomeric ratios of the 116Cd(γ,n)115Cd and natTe(γ,n)119,121,129Te reactions at the bremsstrahlung end-point energies of 11–23 MeV from the present work
Figure 28. Isomeric yield ratios of the pairs 116Cd(γ,n)115m,gCd (a), 120Te(γ,n)119m,gTe (b), 122Te(γ,n)121m,gTe (c) and 130Te(γ,n)129m,gTe (d) as a function of the bremsstrahlung end-point energy from the present work (solid squares), literature data and simulated values using TALYS code (dashed lines)
In the experiments we have registered three isomeric pairs of tellurium 119,121,129Te. All of the isomeric states are with nuclear spin 11/2–. Based on the measured experimental yields of the metastable and ground states, we obtained the isomeric yield ratio (IR=σh/σl) for all of them, which are given in Fig. 28b,c,d for various bremsstrahlung end-point energies.
For the reaction 120Te(γ,n)119Te the photon induced isomeric ratio values from this study, the literature data in the GDR region [10,19,20] are shown in Fig. 27b. As seen in Fig. 28b, our experimental isomeric ratio values in the 120Te(γ, n) reaction are in agreement with the TALYS curve. Starting from 15 MeV, there is a scatter in our and literature data in isomeric ratios. Moreover, the figure shows that the isomeric ratio values of 119m,gTe increase with increasing excitation energy.
For the reaction 122Te(γ,n)121Te the photon induced isomeric ratio values from this study, the literature data in the GDR region [10,11,19,20] are shown in Fig. 28c. As seen in Fig. 28c, our experimental values of isomeric ratios in the reaction natTe(γ,n)121m,gTe are consistent with the literature data, but they diverge from the TALYS curve starting from 11 MeV. Additionally, As the excitation energy increases, the isomeric ratio values of 121m,gTe rise, as the figure illustrates.
For the reaction 130Te(γ,n)129Te the photon induced isomeric ratio values from this study, the literature data in the GDR region [10-12,17,19,21] are shown in Fig. 28d. As seen in Fig. 28d, our experimental isomeric ratio values in the 130Te(γ,n) reaction are in agreement with the TALYS curve. Starting from 14 MeV, there is a scatter in our and literature data in isomeric ratios. Furthermore, the figure shows that the isomeric ratio values of 129m,gTe increase with increasing excitation energy.
-
This study addressed the measurements of the relative yields and cross section per equivalent quantum for the photonuclear reactions on a natural mixture of cadmium and tellurium using bremsstrahlung end-point energies of 10 to 23 MeV. The bremsstrahlung photon flux was computed using the Geant4.11.1 code. The experimental results were compared with the calculations using the TALYS model with standard parameters and the CMPR. For the photoneutron reactions on the nuclei 112,116Cd(γ, n) and 120,122,124,126,130Te, a good agreement was observed between the experimental data and theoretical calculations.
The measured (γ, p) yields are a few percent of the (γ, n) yields for all nuclei, with the exception of the bypassed nucleus 106Cd, for which the yield of the reaction 106Cd(γ, p)105Cd is commensurate with the yield of the reaction 106Cd(γ, n)105Cd, but this contradicts the results of the theoretical calculations. For the reaction 123Te(γ, p)122Sb, the experimental points are almost 100 times larger than the theoretical calculations.
On the heavy isotopes 112,113,114,116Cd and 128,130Te, the experimental results agree with the theoretical relative yields calculated using the CMPR. Including isospin splitting in the CMPR enables a much better description of the experimental data on the reactions with proton escape in the energy range from 12 to 23 MeV. Therefore, the consideration of isospin splitting is necessary for a more reasonable description of the GDR decay. The study of photonuclear reactions on cadmium and tellurium isotopes is important for understanding the formation and decay of the bypassed nuclei during nucleosynthesis.
-
The present study addressed the measurements of relative yields and cross section per equivalent quantum for the photonuclear reactions on a natural mixture of cadmium and tellurium using bremsstrahlung end-point energies of 10 to 23 MeV. The bremsstrahlung photon flux was computed in the Geant4.11.1 code. The experimental results were compared with calculations using the TALYS model with the standard parameters and the CMPR. For the photoneutron reactions on the nuclei 112,116Cd(γ,n) and 120,122,124,126,130Te, a good agreement was observed between the experimental data and theoretical calculations.
The measured (γ,p) yields are a few percent of the (γ,n) yields for all nuclei, with the exception of the bypassed nucleus 106Cd, for which the yield of the reaction 106Cd(γ,p)105Cd is commensurate with the yield of the reaction 106Cd(γ,n)105Cd, but this contradicts the results of the theoretical calculations. For the reaction 123Te(γ,p)122Sb experimental points are almost 100 times larger than theoretical calculations.
On the heavy isotopes 112,113,114,116Cd and 128,130Te, the experimental results agree with theoretical relative yields calculated using the CMPR. Including isospin splitting in the CMPR allows for much better description of experimental data on reactions with proton escape in the energy range from 12 to 23 MeV. Therefore, taking into account isospin splitting is necessary for a more reasonable description of the GDR decay. The study of photonuclear reactions on cadmium and tellurium isotopes is important for understanding the formation and decay of bypassed nuclei during nucleosynthesis.
-
In this Appendix, the tabulated experimental results discussed in Sec. 4 are presented.
Reaction Eγmax (MeV) Yrel (%) $ \sigma _{q}^{nat} $ (mb)106Cd(γ, n)105Cd 12 0.7 ± 0.1 0.0018 ± 0.0003 13 1.9 ± 0.3 0.010 ± 0.001 14 3.1 ± 0.5 0.022 ± 0.003 15 3.3 ± 0.4 0.045 ± 0.005 16 3.4 ± 0.5 0.072 ± 0.008 17 4.6 ± 0.6 0.11 ± 0.02 18 5.1 ± 0.7 0.14 ± 0.02 19 5.9 ± 0.8 0.19 ± 0.02 20 5.3 ± 0.8 0.21 ± 0.02 21 6.5 ± 0.9 0.26 ± 0.03 22 6.9 ± 0.9 0.28 ± 0.03 23 6.7 ± 0.9 0.27 ± 0.03 108Cd(γ, n)107Cd 12 1.9 ± 0.4 0.006 ± 0.001 13 3.1 ± 0.5 0.017 ± 0.002 14 5.0 ± 0.7 0.035 ± 0.004 15 5.3 ± 0.6 0.073 ± 0.008 16 6.1 ± 0.9 0.13 ± 0.02 17 6.4 ± 0.9 0.16 ± 0.02 18 7 ± 1 0.19 ± 0.02 19 8 ± 1 0.26 ± 0.03 20 7 ± 1 0.30 ± 0.03 21 8 ± 1 0.32 ± 0.03 22 9 ± 1 0.35 ± 0.04 23 9 ± 1 0.37 ± 0.04 110Cd(γ, n)109Cd 12 44 ± 7 0.13 ± 0.02 13 50 ± 9 0.27 ± 0.05 14 88 ± 14 0.61 ± 0.09 15 91 ± 11 1.2 ± 0.2 16 89 ± 10 1.9 ± 0.2 17 96 ± 11 2.4 ± 0.3 18 105 ± 13 2.8 ± 0.4 19 120 ± 19 3.9 ± 0.5 20 135 ± 23 5.3 ± 0.7 21 135 ± 22 5.4 ± 0.7 22 141 ± 22 5.8 ± 0.7 23 144 ± 22 6.0 ± 0.7 112Cd(γ, n)111mCd 10 14 ± 2 0.006 ± 0.001 11 6.2 ± 0.9 0.007 ± 0.001 12 6.0 ± 0.9 0.015 ± 0.002 13 6 ± 1 0.034 ± 0.006 14 12 ± 2 0.082 ± 0.009 15 12 ± 2 0.16 ± 0.02 16 8.7 ± 0.9 0.19 ± 0.02 17 13 ± 2 0.32 ± 0.03 18 20 ± 3 0.54 ± 0.06 19 23 ± 3 0.75 ± 0.08 20 22 ± 3 0.9 ± 0.1 21 26 ± 4 1.1 ± 0.1 22 27 ± 4 1.1 ± 0.1 23 28 ± 4 1.2 ± 0.1 116Cd(γ, n)115gCd 10 100 ± 11 0.06 ± 0.01 11 100 ± 11 0.12 ± 0.01 12 95 ± 10 0.27 ± 0.03 13 94 ± 10 0.50 ± 0.05 14 92 ± 10 0.64 ± 0.07 15 92 ± 10 1.3 ± 0.2 16 90 ± 9 1.9 ± 0.2 17 89 ± 9 2.2 ± 0.2 18 88 ± 9 2.4 ± 0.2 19 89 ± 9 2.9 ± 0.3 20 87 ± 9 3.4 ± 0.3 21 86 ± 9 3.5 ± 0.4 22 86 ± 9 3.5 ± 0.4 23 87 ± 9 3.6 ± 0.4 116Cd(γ, n)115mCd 12 5 ± 1 0.015 ± 0.002 13 6 ± 1 0.031 ± 0.004 14 8 ± 1 0.053 ± 0.006 15 8 ± 1 0.11 ± 0.02 16 10 ± 1 0.20 ± 0.02 17 11 ± 1 0.26 ± 0.03 18 12 ± 2 0.31 ± 0.04 19 11 ± 2 0.36 ± 0.04 20 13 ± 2 0.51 ± 0.06 21 14 ± 2 0.58 ± 0.07 22 14 ± 2 0.57 ± 0.07 23 13 ± 2 0.54 ± 0.07 116Cd(γ, n)115Cd 10 0.06 ± 0.01 116Cd(γ, n)115Cd 11 0.12 ± 0.01 12 0.28 ± 0.03 13 0.53 ± 0.05 14 0.69 ± 0.07 15 1.4 ± 0.2 16 2.1 ± 0.2 17 2.5 ± 0.3 18 2.7 ± 0.3 19 3.2 ± 0.3 20 3.9 ± 0.4 21 4.0 ± 0.4 22 4.1 ± 0.4 23 4.2 ± 0.4 106Cd(γ, p)105Ag 12 0.5 ± 0.1 0.0014 ± 0.0002 13 2.1 ± 0.4 0.011 ± 0.002 14 3.7 ± 0.8 0.025 ± 0.005 15 4.6 ± 0.7 0.06 ± 0.001 16 5.2 ± 0.9 0.11 ± 0.02 17 6.1 ± 0.9 0.15 ± 0.02 18 7.0 ± 1.3 0.19 ± 0.03 19 8.0 ± 1.5 0.26 ± 0.04 20 8.3 ± 1.6 0.32 ± 0.05 21 8.3 ± 1.5 0.33 ± 0.05 22 9.6 ± 1.5 0.39 ± 0.06 23 11 ± 2 0.44 ± 0.06 112Cd(γ, p)111Ag 18 0.5 ± 0.1 0.014 ± 0.004 19 1.0 ± 0.2 0.033 ± 0.006 20 1.2 ± 0.3 0.05 ± 0.01 21 2.1 ± 0.4 0.08 ± 0.01 22 3.1 ± 0.6 0.13 ± 0.02 23 3.8 ± 0.8 0.16 ± 0.03 113Cd(γ, p)112Ag 17 0.07 ± 0.01 0.0019 ± 0.0002 18 0.16 ± 0.02 0.0042 ± 0.0004 19 0.38 ± 0.06 0.012 ± 0.001 20 0.61 ± 0.09 0.024 ± 0.003 21 0.98 ± 0.15 0.039 ± 0.004 22 1.4 ± 0.2 0.058 ± 0.006 23 1.7 ± 0.2 0.073 ± 0.008 114Cd(γ, p)113Ag 17 0.11 ± 0.03 0.003 ± 0.001 18 0.32 ± 0.06 0.009 ± 0.002 19 0.9 ± 0.1 0.028 ± 0.004 114Cd(γ, p)113Ag 20 1.4 ± 0.2 0.053 ± 0.007 21 2.4 ± 0.4 0.098 ± 0.014 22 3.6 ± 0.6 0.15 ± 0.02 23 4.5 ± 0.8 0.19 ± 0.03 116Cd(γ, p)115Ag 21 0.20 ± 0.03 0.008 ± 0.001 22 0.44 ± 0.08 0.018 ± 0.002 23 0.66 ± 0.09 0.028 ± 0.003 Table A1. Experimental results of natCd(γ,n) and natCd(γ,p) reactions
Reaction Eγmax (MeV) Yrel (%) σq (mb) 120Te(γ, n)119gTe 11 0.015 ± 0.002 0.00013 ± 0.0002 12 0.058 ± 0.006 0.00058 ± 0.0006 13 0.15 ± 0.02 0.0029 ± 0.0003 14 0.13 ± 0.02 0.0047 ± 0.0005 15 0.13 ± 0.02 0.009 ± 0.001 16 0.15 ± 0.02 0.017 ± 0.002 17 0.14 ± 0.02 0.021 ± 0.002 18 0.17 ± 0.03 0.029 ± 0.003 19 0.17 ± 0.03 0.034 ± 0.004 20 0.18 ± 0.03 0.037 ± 0.004 21 0.19 ± 0.03 0.039 ± 0.004 22 0.19 ± 0.03 0.040 ± 0.004 23 0.19 ± 0.03 0.042 ± 0.004 120Te(γ, n)119mTe 13 0.004 ± 0.001 0.00007 ± 0.00002 14 0.005 ± 0.001 0.00020 ± 0.00004 15 0.008 ± 0.001 0.0006 ± 0.0001 16 0.012 ± 0.002 0.0014 ± 0.0002 17 0.011 ± 0.002 0.0017 ± 0.0002 18 0.018 ± 0.003 0.0031 ± 0.0004 19 0.017 ± 0.003 0.0033 ± 0.0004 20 0.019 ± 0.003 0.0040 ± 0.0005 21 0.020 ± 0.003 0.0042 ± 0.0005 22 0.021 ± 0.003 0.0045 ± 0.0005 23 0.022 ± 0.003 0.0048 ± 0.0005 120Te(γ, n)119Te 11 0.015 ± 0.002 0.00013 ± 0.0002 12 0.058 ± 0.006 0.00058 ± 0.0006 13 0.15 ± 0.02 0.003 ± 0.001 14 0.13 ± 0.02 0.005 ± 0.001 15 0.14 ± 0.02 0.009 ± 0.002 120Te(γ, n)119Te 16 0.16 ± 0.02 0.018 ± 0.003 17 0.15 ± 0.03 0.023 ± 0.004 18 0.18 ± 0.03 0.033 ± 0.005 19 0.19 ± 0.04 0.037 ± 0.006 20 0.20 ± 0.04 0.041 ± 0.007 21 0.21 ± 0.04 0.043 ± 0.007 22 0.21 ± 0.04 0.045 ± 0.007 23 0.21 ± 0.04 0.046 ± 0.007 122Te(γ, n)121gTe 10 0.11 ± 0.02 0.0005 ± 0.0001 11 1.6 ± 0.2 0.013 ± 0.001 12 3.0 ± 0.5 0.030 ± 0.003 13 5.5 ± 0.8 0.11 ± 0.01 14 4.4 ± 0.7 0.17 ± 0.02 15 4.7 ± 0.7 0.32 ± 0.03 16 5.2 ± 0.8 0.61 ± 0.06 17 4.5 ± 0.7 0.67 ± 0.07 18 4.9 ± 0.9 0.87 ± 0.09 19 5.1 ± 0.9 1.0 ± 0.1 20 5.5 ± 0.8 1.1 ± 0.1 21 5.7 ± 0.8 1.2 ± 0.1 22 5.7 ± 0.8 1.2 ± 0.1 23 5.6 ± 0.8 1.2 ± 0.1 122Te(γ, n)121mTe 13 0.32 ± 0.05 0.006 ± 0.001 14 0.40 ± 0.06 0.015 ± 0.002 15 0.55 ± 0.08 0.034 ± 0.004 16 0.7 ± 0.1 0.08 ± 0.01 17 0.7 ± 0.1 0.10 ± 0.01 18 0.8 ± 0.1 0.15 ± 0.02 19 0.9 ± 0.1 0.17 ± 0.02 20 1.0 ± 0.2 0.20 ± 0.02 21 1.1 ± 0.2 0.22 ± 0.02 22 1.1 ± 0.2 0.23 ± 0.02 23 1.1 ± 0.2 0.23 ± 0.02 122Te(γ, n)121Te 10 0.11 ± 0.02 0.0005 ± 0.0001 11 1.6 ± 0.2 0.013 ± 0.002 12 3.0 ± 0.5 0.030 ± 0.003 13 5.8 ± 1.1 0.12 ± 0.02 14 4.8 ± 0.9 0.18 ± 0.03 15 5.2 ± 0.9 0.36 ± 0.05 16 5.9 ± 0.9 0.7 ± 0.1 17 5.2 ± 0.9 0.8 ± 0.1 122Te(γ, n)121Te 18 5.8 ± 1.0 1.0 ± 0.2 19 6.0 ± 1.1 1.1 ± 0.2 20 6.5 ± 1.1 1.3 ± 0.2 21 6.8 ± 1.2 1.4 ± 0.2 22 6.8 ± 1.2 1.4 ± 0.2 23 6.7 ± 1.2 1.4 ± 0.2 123Te(γ, γ`)123mTe+ 124Te(γ, n)123mTe+ 125Te(γ, 2n)123mTe 10 0.43 ± 0.07 0.0020 ± 0.0002 11 0.27 ± 0.04 0.0023 ± 0.0002 12 0.41 ± 0.06 0.0041 ± 0.0005 13 0.9 ± 0.1 0.019 ± 0.002 14 1.0 ± 0.2 0.038 ± 0.004 15 1.2 ± 0.2 0.08 ± 0.01 16 1.6 ± 0.2 0.19 ± 0.02 17 1.6 ± 0.2 0.23 ± 0.02 18 1.9 ± 0.3 0.34 ± 0.03 19 2.0 ± 0.3 0.38 ± 0.04 20 2.3 ± 0.3 0.46 ± 0.05 21 2.4 ± 0.4 0.50 ± 0.05 22 2.5 ± 0.4 0.54 ± 0.06 23 2.6 ± 0.4 0.56 ± 0.06 125Te(γ, γ`)125mTe+ 126Te(γ, n)125mTe 10 9 ± 2 0.04 ± 0.01 11 9 ± 2 0.07 ± 0.02 12 10 ± 3 0.13 ± 0.03 13 11 ± 3 0.21 ± 0.05 14 11 ± 2 0.41 ± 0.08 15 11 ± 2 0.8 ± 0.2 16 11 ± 3 1.3 ± 0.3 17 12 ± 2 1.7 ± 0.3 18 13 ± 3 2.4 ± 0.4 19 13 ± 3 2.5 ± 0.4 20 13 ± 3 2.7 ± 0.5 21 14 ± 3 2.9 ± 0.5 22 14 ± 3 3.0 ± 0.4 23 15 ± 3 3.1 ± 0.5 128Te(γ, n)127Te 10 41 ± 6 0.19 ± 0.02 11 57 ± 7 0.47 ± 0.05 12 62 ± 7 0.59 ± 0.07 13 56 ± 7 1.1 ± 0.2 14 60 ± 7 2.2 ± 0.3 15 58 ± 8 3.9 ± 0.4 16 58 ± 8 6.6 ± 0.7 128Te(γ, n)127Te 17 53 ± 8 7.6 ± 0.9 18 58 ± 8 10 ± 1 19 56 ± 9 11 ± 1 20 57 ± 9 12 ± 1 21 57 ± 9 12 ± 1 22 56 ± 9 12 ± 1 23 56 ± 9 12 ± 1 130Te(γ, n)129gTe 10 100 ± 15 0.47 ± 0.05 11 98 ± 10 0.81 ± 0.09 12 96 ± 10 0.95 ± 0.09 13 89 ± 10 1.8 ± 0.2 14 88 ± 10 3.3 ± 0.3 15 85 ± 10 5.8 ± 0.6 16 81 ± 10 9.4 ± 0.9 17 83 ± 10 12 ± 1 18 80 ± 11 14 ± 1 19 80 ± 11 15 ± 2 20 79 ± 10 16 ± 2 21 79 ± 10 16 ± 2 22 78 ± 10 17 ± 2 23 79 ± 10 17 ± 2 130Te(γ, n)129mTe 11 2.0 ± 0.4 0.019 ± 0.003 12 4.0 ± 0.8 0.046 ± 0.007 13 11 ± 2 0.22 ± 0.02 14 12 ± 2 0.46 ± 0.05 15 15 ± 2 1.0 ± 0.1 16 19 ± 3 2.2 ± 0.2 17 17 ± 3 2.8 ± 0.3 18 20 ± 3 3.5 ± 0.4 19 20 ± 3 3.9 ± 0.4 20 21 ± 3 4.3 ± 0.4 21 21 ± 3 4.4 ± 0.4 22 22 ± 3 4.7 ± 0.5 23 21 ± 3 4.7 ± 0.5 130Te(γ, n)129Te 10 0.47 ± 0.05 11 0.83 ± 0.09 12 1.0 ± 0.1 13 2.0 ± 0.2 14 3.8 ± 0.4 15 6.8 ± 0.7 16 11 ± 1 130Te(γ, n)129Te 17 15 ± 2 18 17 ± 2 19 19 ± 2 20 20 ± 3 21 20 ± 3 22 22 ± 3 23 22 ± 3 123Te(γ, p)122Sb 10 0.005 ± 0.001 0.00003 ± 0.00001 11 0.007 ± 0.001 0.00006 ± 0.00001 12 0.013 ± 0.002 0.00013 ± 0.00002 13 0.015 ± 0.002 0.00030 ± 0.00004 14 0.011 ± 0.002 0.00041 ± 0.00005 15 0.013 ± 0.002 0.0009 ± 0.0001 16 0.014 ± 0.002 0.0016 ± 0.0002 17 0.015 ± 0.002 0.0021 ± 0.0002 18 0.017 ± 0.003 0.0030 ± 0.0004 19 0.019 ± 0.003 0.0036 ± 0.0005 20 0.023 ± 0.004 0.005 ± 0.001 21 0.028 ± 0.004 0.006 ± 0.001 22 0.032 ± 0.005 0.007 ± 0.001 23 0.032 ± 0.006 0.007 ± 0.001 125Te(γ, p)124Sb 19 0.012 ± 0.003 0.0024 ± 0.0005 20 0.035 ± 0.006 0.007 ± 0.001 21 0.053 ± 0.009 0.011 ± 0.001 22 0.08 ± 0.01 0.017 ± 0.002 23 0.11 ± 0.02 0.024 ± 0.003 128Te(γ, p)127Sb 17 0.006 ± 0.001 0.0009 ± 0.0001 18 0.010 ± 0.002 0.0018 ± 0.0003 19 0.022 ± 0.005 0.004 ± 0.001 20 0.032 ± 0.005 0.006 ± 0.001 21 0.07 ± 0.01 0.014 ± 0.002 22 0.15 ± 0.03 0.032 ± 0.004 23 0.22 ± 0.04 0.048 ± 0.005 130Te(γ, p)129Sb 19 0.007 ± 0.001 0.0014 ± 0.0002 20 0.013 ± 0.002 0.0027 ± 0.0004 21 0.020 ± 0.003 0.0042 ± 0.0005 22 0.07 ± 0.01 0.014 ± 0.002 23 0.11 ± 0.02 0.025 ± 0.003 Table A2. Experimental results of natTe(γ,n) and natTe(γ,p) reactions
-
In this Appendix, the tabulated experimental results discussed in Sec. IV are presented.
natCd(γ, n) Eγmax/MeV 106Cd(γ, n)105Cd 108Cd(γ, n)107Cd 110Cd(γ, n)109Cd 112Cd(γ, n)111mCd 116Cd(γ, n)115gCd 116Cd(γ, n)115mCd Yrel (%) $ \sigma _{q}^{\rm{nat}}\;{\rm{/mb}} $ Yrel (%) $ \sigma _{q}^{\rm{nat}}\;{\rm{/mb}} $ Yrel (%) $ \sigma _{q}^{\rm{nat}}\;{\rm{/mb}} $ Yrel (%) $ \sigma _{q}^{\rm{nat}}\;{\rm{/mb}} $ Yrel (%) $ \sigma _{q}^{\rm{nat}}\;{\rm{/mb}} $ Yrel (%) $ \sigma _{q}^{\rm{nat}}\;{\rm{/mb}} $ 10 14 (2) 0.006 (1) 100 (11) 0.06 (1) 11 6.2 (9) 0.007 (1) 100 (11) 0.12 (1) 12 0.7 (1) 0.0018 (3) 1.9 (4) 0.006 (1) 44 (7) 0.13 (2) 6.0 (9) 0.015 (2) 95 (10) 0.27 (3) 5 (1) 0.015 (2) 13 1.9 (3) 0.010 (1) 3.1 (5) 0.017 (2) 50 (9) 0.27 (5) 6 (1) 0.034 (6) 94 (10) 0.50 (5) 6 (1) 0.031 (4) 14 3.1 (5) 0.022 (3) 5.0 (7) 0.035 (4) 88 (14) 0.61 (9) 12 (2) 0.082 (9) 92 (10) 0.64 (7) 8 (1) 0.053 (6) 15 3.3 (4) 0.045 (5) 5.3 (6) 0.073 (8) 91 (11) 1.2 (2) 12 (2) 0.16 (2) 92 (10) 1.3 (2) 8 (1) 0.11 (2) 16 3.4 (5) 0.072 (8) 6.1 (9) 0.13 (2) 89 (10) 1.9 (2) 8.7 (9) 0.19 (2) 90 (9) 1.9 (2) 10 (1) 0.20 (2) 17 4.6 (6) 0.11 (2) 6.4 (9) 0.16 (2) 96 (11) 2.4 (3) 13 (2) 0.32 (3) 89 (9) 2.2 (2) 11 (1) 0.26 (3) 18 5.1 (7) 0.14 (2) 7 (1) 0.19 (2) 105 (13) 2.8 (4) 20 (3) 0.54 (6) 88 (9) 2.4 (2) 12 (2) 0.31 (4) 19 5.9 (8) 0.19 (2) 8 (1) 0.26 (3) 120 (19) 3.9 (5) 23 (3) 0.75 (8) 89 (9) 2.9 (3) 11 (2) 0.36 (4) 20 5.3 (8) 0.21 (2) 7 (1) 0.30 (3) 135 (23) 5.3 (7) 22 (3) 0.9 (1) 87 (9) 3.4 (3) 13 (2) 0.51 (6) 21 6.5 (9) 0.26 (3) 8 (1) 0.32 (3) 135 (22) 5.4 (7) 26 (4) 1.1 (1) 86 (9) 3.5 (4) 14 (2) 0.58 (7) 22 6.9 (9) 0.28 (3) 9 (1) 0.35 (4) 141 (22) 5.8 (7) 27 (4) 1.1 (1) 86 (9) 3.5 (4) 14 (2) 0.57 (7) 23 6.7 (9) 0.27 (3) 9 (1) 0.37 (4) 144 (22) 6.0 (7) 28 (4) 1.2 (1) 87 (9) 3.6 (4) 13 (2) 0.54 (7) 116Cd(γ, n)115Cd natCd(γ, p) 106Cd(γ, p)105Ag 112Cd(γ, p)111Ag 113Cd(γ, p)112Ag 114Cd(γ, p)113Ag 116Cd(γ, p)115Ag 10 0.06 (1) 11 0.12 (1) 12 0.28 (3) 0.5 (1) 0.0014 (2) 13 0.53 (5) 2.1 (4) 0.011 (2) 14 0.69 (7) 3.7 (8) 0.025 (5) 15 1.4 (2) 4.6 (7) 0.06 (1) 16 2.1 (2) 5.2 (9) 0.11 (2) 17 2.5 (3) 6.1 (9) 0.15 (2) 0.07 (1) 0.0019 (2) 0.11 (3) 0.003 (1) 18 2.7 (3) 7.0 (1.3) 0.19 (3) 0.5 (1) 0.014 (4) 0.16 (2) 0.0042 (4) 0.32 (6) 0.009 (2) 19 3.2 (3) 8.0 (1.5) 0.26 (4) 1.0 (2) 0.033 (6) 0.38 (6) 0.012 (1) 0.9 (1) 0.028 (4) 20 3.9 (4) 8.3 (1.6) 0.32 (5) 1.2 (3) 0.05 (1) 0.61 (9) 0.024 (3) 1.4 (2) 0.053 (7) 21 4.0 (4) 8.3 (1.5) 0.33 (5) 2.1 (4) 0.08 (1) 0.98 (15) 0.039 (4) 2.4 (4) 0.098 (14) 0.20 (3) 0.008 (1) 22 4.1 (4) 9.6 (1.5) 0.39 (6) 3.1 (6) 0.13 (2) 1.4 (2) 0.058 (6) 3.6 (6) 0.15 (2) 0.44 (8) 0.018 (2) 23 4.2 (4) 11 (2) 0.44 (6) 3.8 (8) 0.16 (3) 1.7 (2) 0.073 (8) 4.5 (8) 0.19 (3) 0.66 (9) 0.028 (3) Table A1. Experimental results of natCd(γ, n) and natCd(γ, p) reactions.
natTe(γ, n) reactions Eγmax
/MeV120Te(γ, n)119gTe 120Te(γ, n)119mTe 120Te(γ, n)119Te 122Te(γ, n)121gTe 122Te(γ, n)121mTe 122Te(γ, n)121Te 123Te(γ, γ`)123mTe +
124Te(γ, n)123mTe +
125Te(γ, 2n)123mTe125Te(γ, γ`)125mTe +
126Te(γ, n)125mTeYrel (%) $ \sigma _{q}^{\rm{nat}}\;{\rm{/mb}} $ Yrel (%) $ \sigma _{q}^{\rm{nat}}\;{\rm{/mb}} $ Yrel (%) $ \sigma _{q}^{\rm{nat}}\;{\rm{/mb}} $ Yrel (%) $ \sigma _{q}^{\rm{nat}}\;{\rm{/mb}} $ Yrel (%) $ \sigma _{q}^{\rm{nat}}\;{\rm{/mb}} $ Yrel (%) $ \sigma _{q}^{\rm{nat}}\;{\rm{/mb}} $ Yrel (%) $ \sigma _{q}^{\rm{nat}}\;{\rm{/mb}} $ Yrel (%) $ \sigma _{q}^{\rm{nat}}\;{\rm{/mb}} $ 10 0.11 (2) 0.0005 (1) 0.11 (2) 0.0005 (1) 0.43 (7) 0.0020 (2) 9 (2) 0.04 (1) 11 0.015 (2) 0.00013 (2) 0.015 (2) 0.00013 (2) 1.6 (2) 0.013 (1) 1.6 (2) 0.013 (2) 0.27 (4) 0.0023 (2) 9 (2) 0.07 (2) 12 0.058 (6) 0.00058 (6) 0.058 (6) 0.00058 (6) 3.0 (5) 0.030 3() 3.0 (5) 0.030 (3) 0.41 (6) 0.0041 (5) 10 (3) 0.13 (3) 13 0.15 (2) 0.0029 (3) 0.004 (1) 0.00007 (2) 0.15 (2) 0.003 (1) 5.5 (8) 0.11 (1) 0.32 (5) 0.006 (1) 5.8 (9) 0.12 (2) 0.9 (1) 0.019 (2) 11 (3) 0.21 (5) 14 0.13 (2) 0.0047 (5) 0.005 (1) 0.00020 (4) 0.13 (2) 0.005 (1) 4.4 (7) 0.17 (2) 0.40 (6) 0.015 (2) 4.8 (9) 0.18 (3) 1.0 (2) 0.038 (4) 11 (2) 0.41 (8) 15 0.13 (2) 0.009 (2) 0.008 (1) 0.0006 (1) 0.14 (2) 0.009 (2) 4.7 (7) 0.32 (3) 0.55 (8) 0.034 (4) 5.2 (9) 0.36 (5) 1.2 (2) 0.08 (1) 11 (2) 0.8 (2) 16 0.15 (2) 0.017 (2) 0.012 (2) 0.0014 (2) 0.16 (2) 0.018 (3) 5.2 (8) 0.61 (6) 0.7 (1) 0.08 (1) 5.9 (9) 0.7 (1) 1.6 (2) 0.19 (2) 11 (3) 1.3 3 17 0.14 (2) 0.021 (2) 0.011 (2) 0.0017 (2) 0.15 (3) 0.023 (4) 4.5 (7) 0.67 (7) 0.7 (1) 0.10 (1) 5.2 (9) 0.8 (1) 1.6 (2) 0.23 (2) 12 (2) 1.7 (3) 18 0.17 (3) 0.029 (3) 0.018 (3) 0.0031 (4) 0.18 (3) 0.033 (5) 4.9 (9) 0.87 (9) 0.8 (1) 0.15 (2) 5.8 (9) 1.0 (2) 1.9 (3) 0.34 (3) 13 (3) 2.4 (4) 19 0.17 (3) 0.034 (4) 0.017 (3) 0.0033 (4) 0.19 (4) 0.037 (6) 5.1 (9) 1.0 (1) 0.9 (1) 0.17 (2) 6 (9) 1.1 (2) 2.0 (3) 0.38 (4) 13 (3) 2.5 (4) 20 0.18 (3) 0.037 (4) 0.019 (3) 0.0040 (5) 0.20 (4) 0.041 (7) 5.5 (8) 1.1 (1) 1.0 (2) 0.20 (2) 6.5 (9) 1.3 (2) 2.3 (3) 0.46 (5) 13 (3) 2.7 (5) 21 0.19 (3) 0.039 (4) 0.020 (3) 0.0042 (5) 0.21 (4) 0.043 (7) 5.7 (8) 1.2 (1) 1.1 (2) 0.22 (2) 6.8 (9) 1.4 (2) 2.4 (4) 0.50 (5) 14 (3) 2.9 (5) 22 0.19 (3) 0.040 (4) 0.021 (3) 0.0045 (5) 0.21 (4) 0.045 (7) 5.7 (8) 1.2 (1) 1.1 (2) 0.23 (2) 6.8 (9) 1.4 (2) 2.5 (4) 0.54 (6) 14 (3) 3.0 (4) 23 0.19 (3) 0.042 (4) 0.022 (3) 0.0048 (5) 0.21 (4) 0.046 (7) 5.6 (8) 1.2 (1) 1.1 (2) 0.23 (2) 6.7 (9) 1.4 (2) 2.6 (4) 0.56 (6) 15 (3) 3.1 (5) natTe(γ, p) reactions 128Te(γ, n)127Te 130Te(γ, n)129gTe 130Te(γ, n)129mTe 130Te(γ, n)129Te 123Te(γ, p)122Sb 125Te(γ, p)124Sb 128Te(γ, p)127Sb 130Te(γ, p)129Sb 10 41 (6) 0.19 (2) 100 (15) 0.47 (5) 0.47 (5) 0.005 (1) 0.00003 (1) 11 57 (7) 0.47 (5) 98 (10) 0.81 (9) 2.0 (4) 0.019 (3) 0.83 (9) 0.007 (1) 0.00006 (1) 12 62 (7) 0.59 (7) 96 (10) 0.95 (9) 4.0 (8) 0.046 (7) 1.0 (1) 0.013 (2) 0.00013 (2) 13 56 (7) 1.1 (2) 89 (10) 1.8 (2) 11 (2) 0.22 (2) 2.0 (2) 0.015 (2) 0.00030 (4) 14 60 (7) 2.2 (3) 88 (10) 3.3 (3) 12 (2) 0.46 (5) 3.8 (4) 0.011 (2) 0.00041 (5) 15 58 (8) 3.9 (4) 85 (10) 5.8 (6) 15 (2) 1.0 (1) 6.8 (7) 0.013 (2) 0.0009 (1) 16 58 (8) 6.6 (7) 81 (10) 9.4 (9) 19 (3) 2.2 (2) 11 (1) 0.014 (2) 0.0016 (2) 17 53 (8) 7.6 (9) 83 (10) 12 (1) 17 (3) 2.8 (3) 15 (2) 0.015 (2) 0.0021 (2) 0.006 (1) 0.0009 (1) 18 58 (8) 10 (1) 80 (11) 14 (1) 20 (3) 3.5 (4) 17 (2) 0.017 (3) 0.0030 (4) 0.010 (2) 0.0018 (3) 19 56 (9) 11 (1) 80 (11) 15 (2) 20 (3) 3.9 (4) 19 (2) 0.019 (3) 0.0036 (5) 0.012 (3) 0.0024 (5) 0.022 (5) 0.004 (1) 0.007 (1) 0.0014 (2) 20 57 (9) 12 (1) 79 (10) 16 (2) 21 (3) 4.3 (4) 20 (3) 0.023 (4) 0.005 (1) 0.035 (6) 0.007 (1) 0.032 (5) 0.006 (1) 0.013 (2) 0.0027 (4) 21 57 (9) 12 (1) 79 (10) 16 (2) 21 (3) 4.4 (4) 20 (3) 0.028 (4) 0.006 (1) 0.053 (9) 0.011 (1) 0.07 (1) 0.014 (2) 0.020 (3) 0.0042 (5) 22 56 (9) 12 (1) 78 (10) 17 (2) 22 (3) 4.7 (5) 22 (3) 0.032 (5) 0.007 (1) 0.08 (1) 0.017 (2) 0.15 (3) 0.032 (4) 0.07 (1) 0.014 (2) 23 56 (9) 12 (1) 79 (10) 17 (2) 21 (3) 4.7 (5) 22 (3) 0.032 (6) 0.007 (1) 0.11 (2) 0.024 (3) 0.22 (4) 0.048 (5) 0.11 (2) 0.025 (3) Table A2. Experimental results of natTe(γ, n) and natTe(γ, p) reactions.
-
The essential components of TALYS calculations for photonuclear reaction cross sections are the nuclear level densities and γ-ray strength functions. The cross sections of the reactions are computed in this work using TALYS 2.0 with standard parameters. For the reactions 114Cd(γ,p)113Ag and 128Te(γ,p)127Sb, the effects of altering a number of input options are examined, including level densities (Constant Temperature + Fermi gas model, Back-shifted Fermi gas Model, Generalised Superfluid Model, Skyrme-Hartree-Fock-Bogolyubov level densities from numerical tables, Skyrme-Hartree-Fock-Bogolyubov combinatorial level densities from numerical tables, Temperature-dependent Gogny-Hartree-Fock-Bogolyubov combinatorial level densities from numerical tables) and γ-strength functions (Kopecky-Uhl generalized Lorentzian, Brink-Axel Lorentzian, Hartree-Fock BCS tables, Hartree-Fock-Bogoliubov tables, Goriely’s hybrid model, Goriely T-dependent HFB, T-dependent RMF, Gogny D1M HFB+QRPA, Simplified Modified Lorentzian Model, Skyrme HFB+QRPA).
Using these options, the cross section per equivalent quantum for the reactions 114Cd(γ,p)113Ag and 128Te(γ,p)127Sb are displayed in Figures B1 and B2. Changing the parameters LD 1–6 and GSF 1–10 leads to 60 different results for theoretical σ(E) and
$ \sigma _{q}^{nat} $ (E). As seen in the Fig. B1 and Fig. B2, the change of these input options has no impact on the TALYS results. Thus, it is confirmed that the difference between the TALYS and CMPR results is due to the consideration of isospin splitting in CMPR. A brief description of isospin splitting is given below.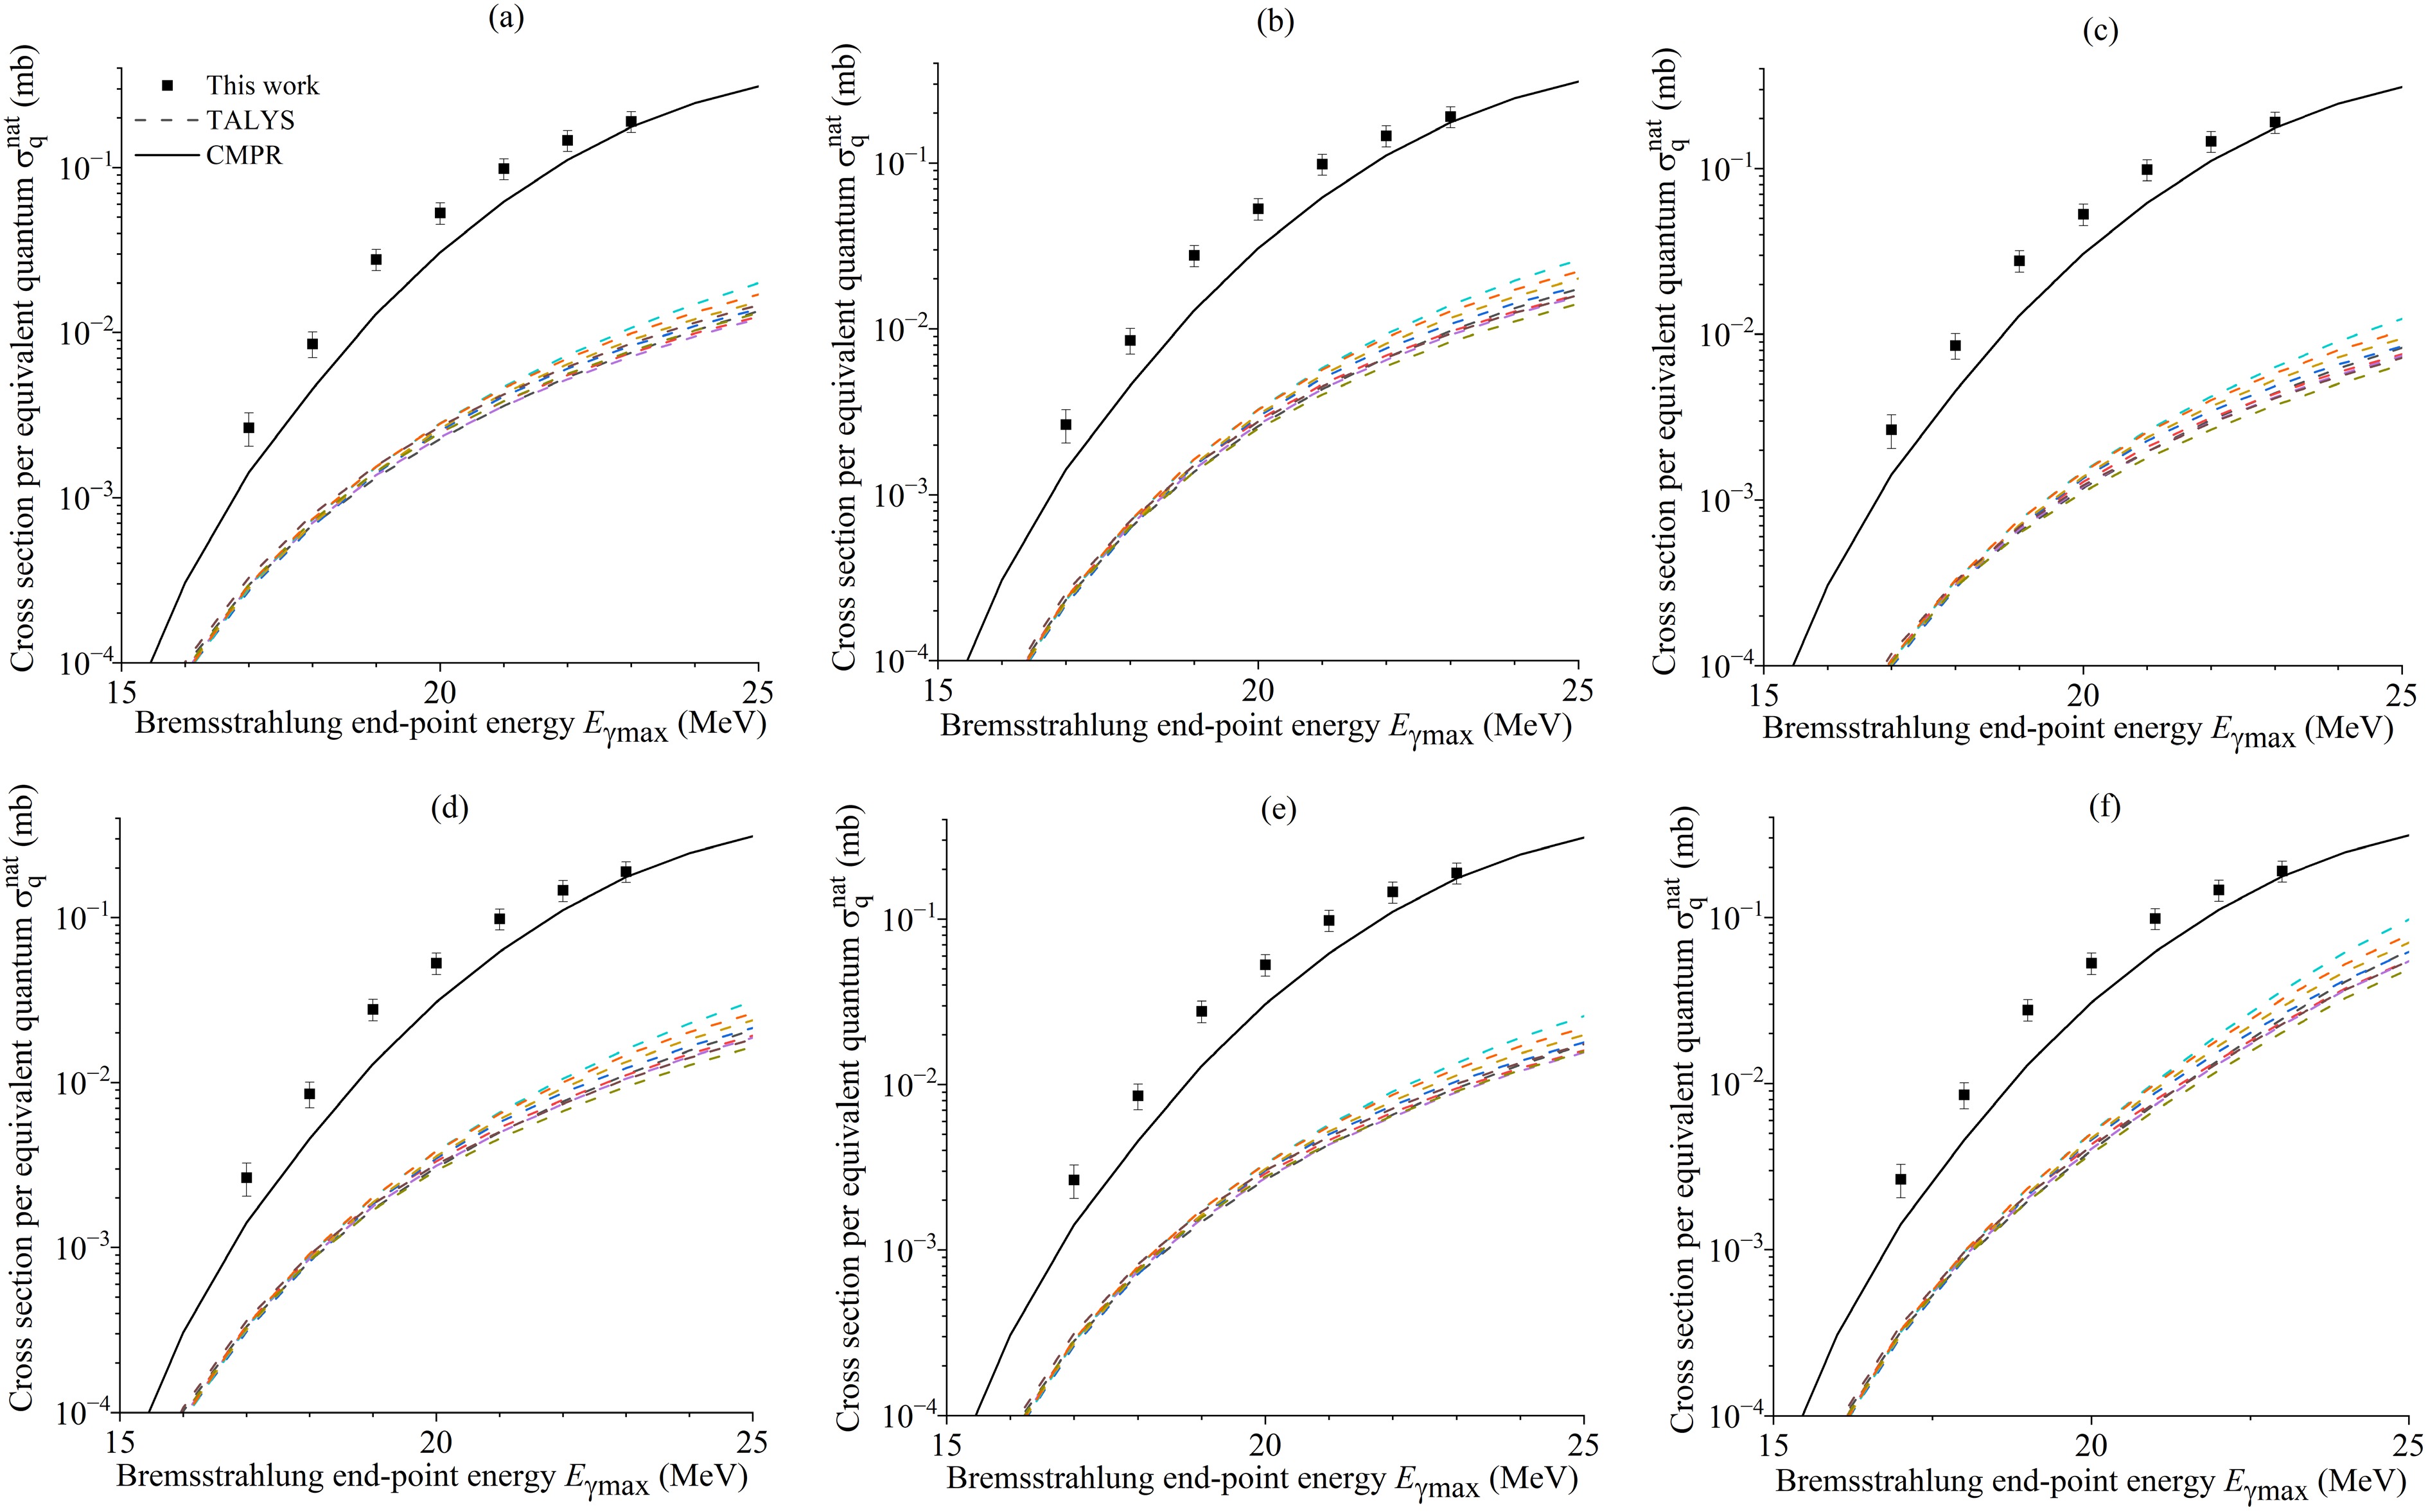
Figure B1. (color online) Cross sections per equivalent quantum
$ \sigma _{q}^{nat} $ (E) for the 114Cd(γ,p)113Ag reaction calculated with the TALYS code for six level density models LD1-LD6 (a-f) and ten gamma strength functions (dashed lines) as well as simulated values using the CMPR (solid lines)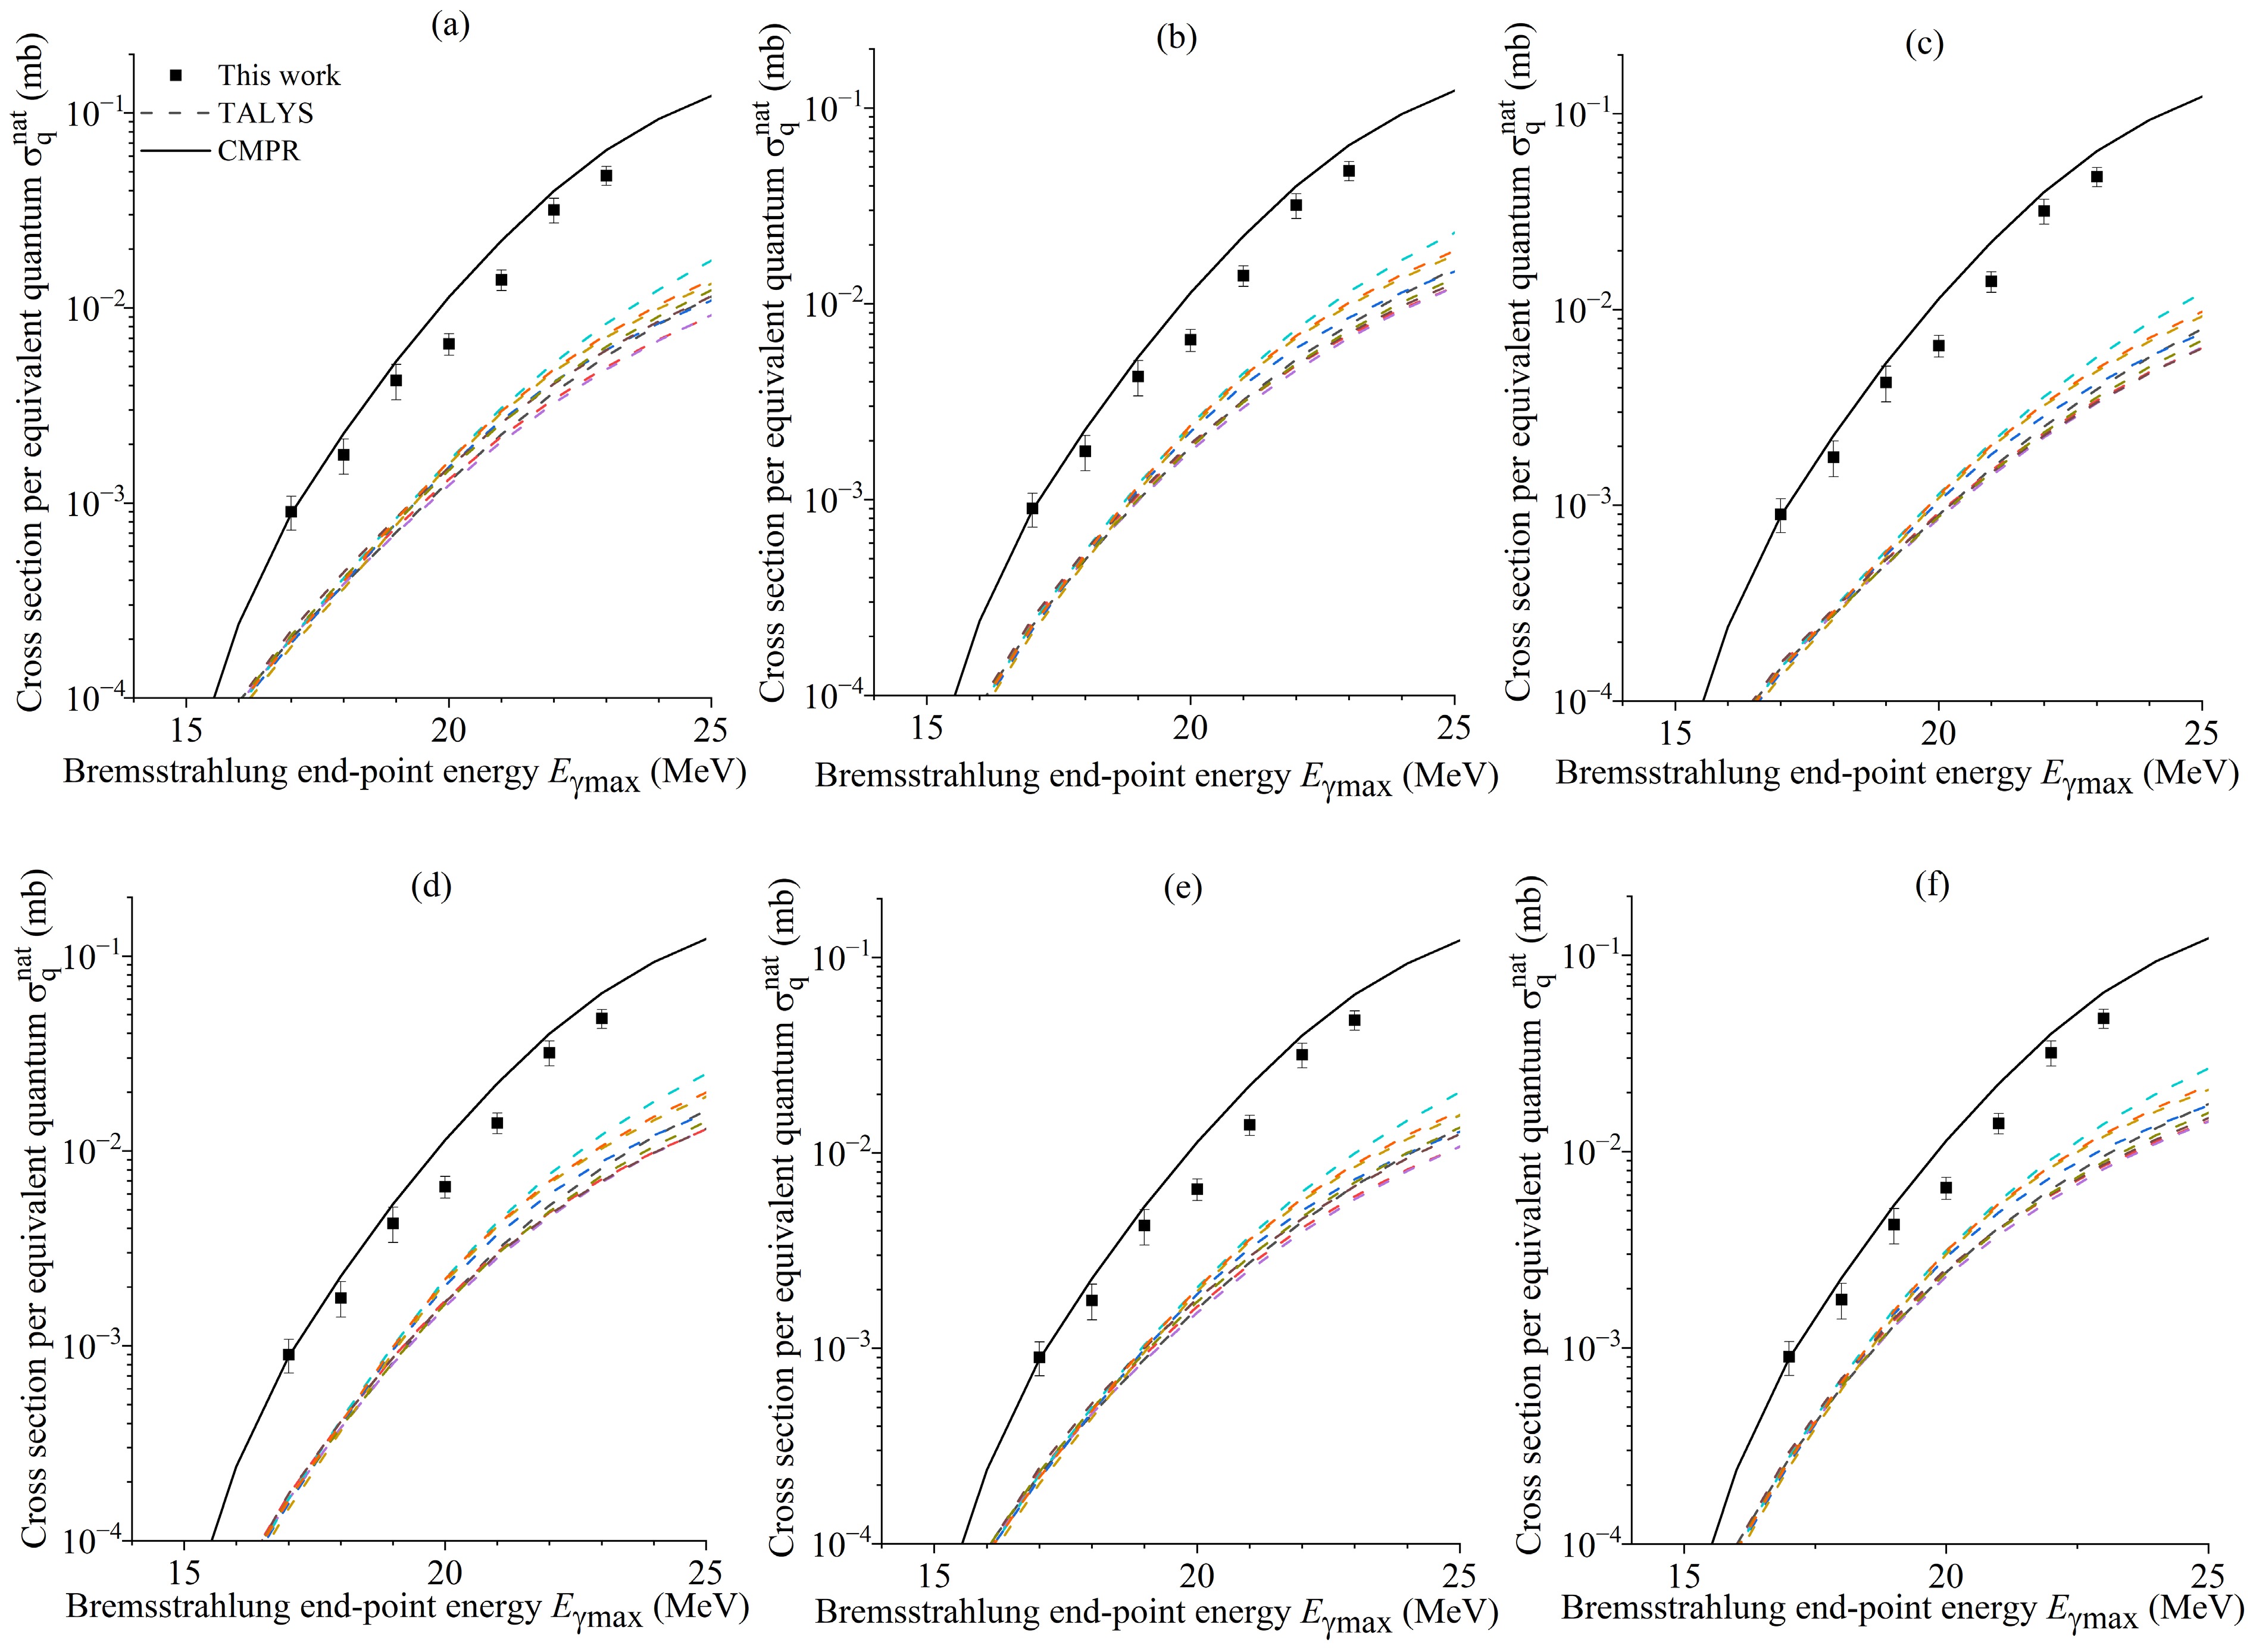
Figure B2. (color online) Cross sections per equivalent quantum
$ \sigma _{q}^{nat} $ (E) for the 128Te(γ,p)127Sb reaction calculated with the TALYS code for six level density models LD1-LD6 (a-f) and ten gamma strength functions (dashed lines) as well as simulated values using the CMPR (solid lines)In nuclei with N ≠ Z, upon absorption of electric dipole γ photons, two branches of the GDR are excited, T<= T0 and T>= T0 + 1, where T0=
$ \dfrac{|N-Z|}{2} $ [49]. Fig. B3 shows the excitations of the isospin components T< and T> of the GDR in initial nucleus (N, Z) and their decay according to the proton (N, Z − 1) and neutron (N − 1, Z) channels. From Fig. B3, it can be observed that the decay of excited GDR states with isospin T>= T0 + 1 according to the neutron channel to low-lying states T = T0 – 1/2 with neutron emission is forbidden, which leads to an increase in the reaction cross section (γ,p) and to a maximum shift of the reaction cross section (γ,p) with respect to reactions (γ,n) towards higher energies in the nucleus (N, Z).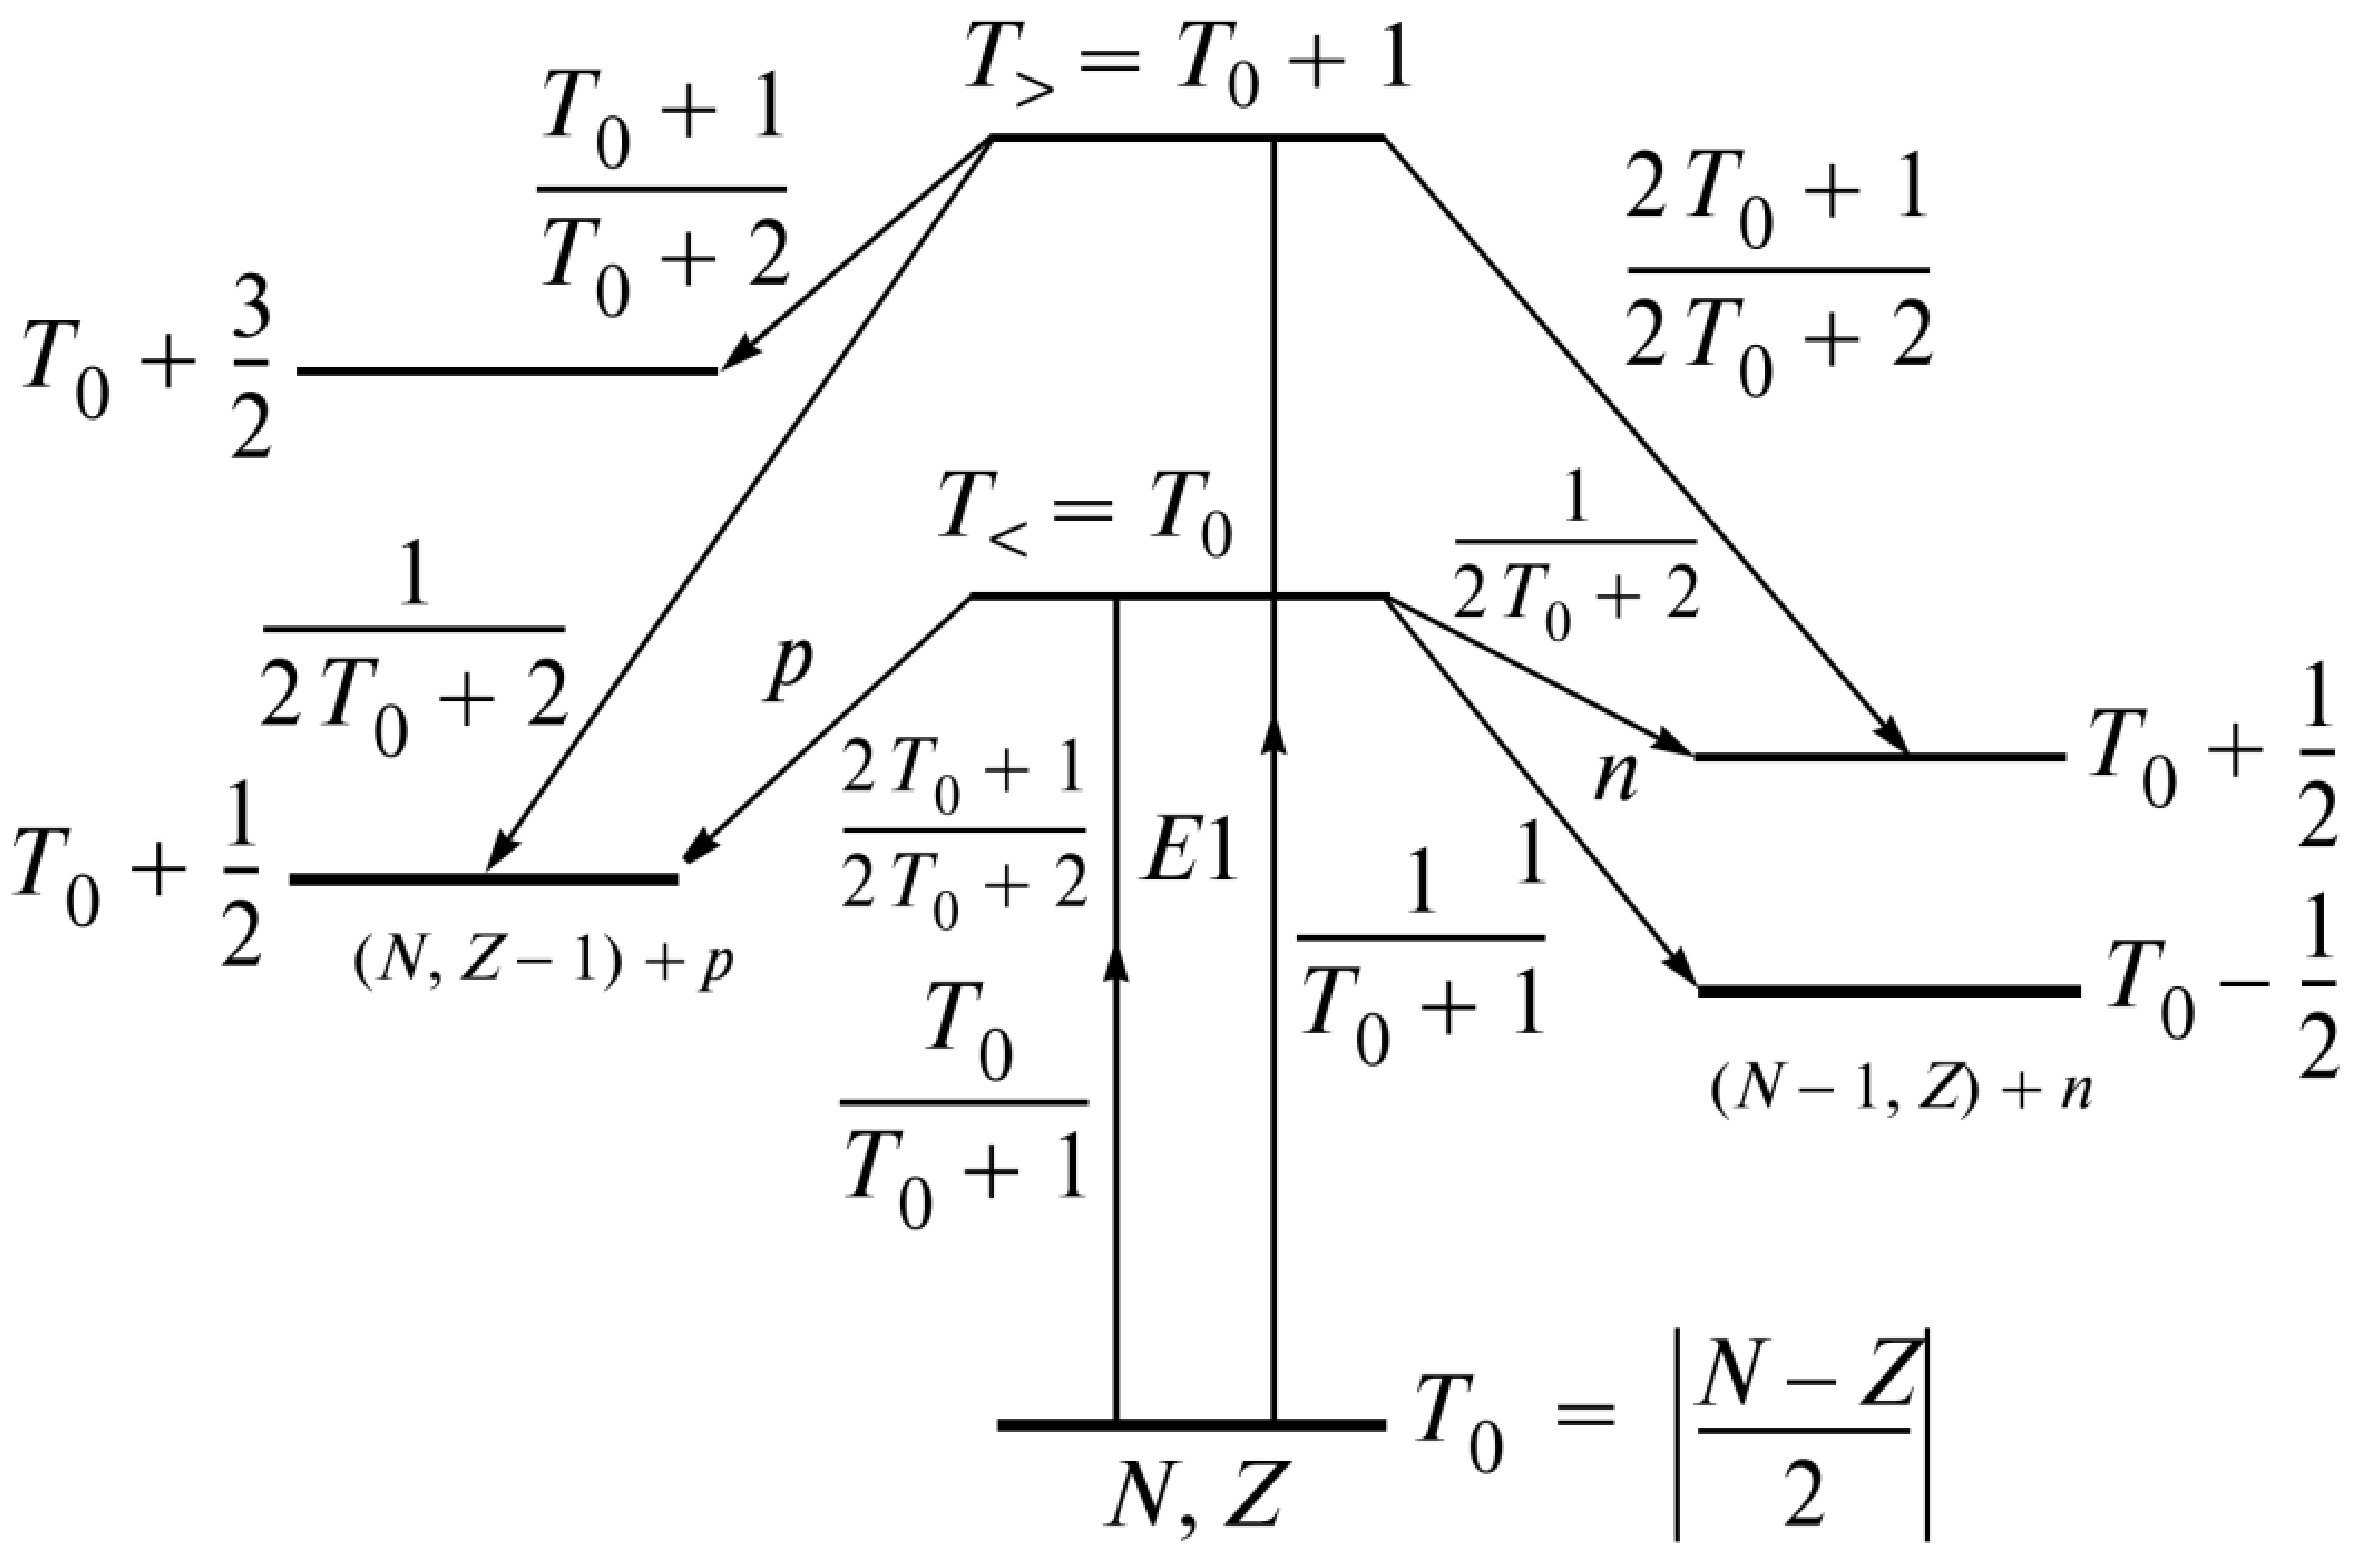
Figure B3. Scheme of excitation of states T< and T> in the nucleus (N, Z) and their decay along the proton channel (N, Z − 1) and neutron channel (N − 1, Z)
The value of isospin splitting of the GDR is determined by the following relation [50]:
$ \Delta E=E\left({T}_{> }\right)-E\left({T}_{< }\right)=\frac{60}{A}\left({T}_{0}+1\right) $
(B1) The ratio of the probabilities of excitation of states T> and T< is described by the following relation [51]:
$ \frac{\sigma ({T}_{> })}{\sigma ({T}_{< })}=\frac{1}{{T}_{0}}\frac{1-1.5{T}_{0}{A}^{-2/3}}{1+1.5{A}^{-2/3}} $
(B2) Table B1 shows the values of the energy of the GDR isospin energy splitting calculated on the basis of relations (1) for isotopes natCd and natTe. Also Table B1 contains integral cross sections
$ \sigma _{< }^{int} $ and$ \sigma _{> }^{int} $ of the isospin components reactions (γ, sn) = (γ, n) + (γ, np) + (γ, 2n) and (γ, sp) = (γ, p) + (γ, np) + (γ, 2p) in the energy region below 40 MeV, the ratio of the reaction cross sections$ \frac{\sigma _{> }^{int}}{\sigma _{< }^{int}} $ , calculated on the basis of CMPR for isotopes natCd and natTe. Table B1 shows that, for natCd, the growth of the mass number A from 106 to 116 results in increase of the isospin energy splitting by the value ≈2.29 MeV. For natTe, the growth of A from 120 to 130, leads to the increase of energy splitting by the value ≈2.16 MeV. The isospin splitting leads to the shift of the proton cross section of the relatively neutron in the side of the high energy.natCd A T0 E(T>)-E(T<) (γ, sn) (γ, sp) $ \sigma _{< }^{int} $ (MeVmb)$ \sigma _{> }^{int} $ (MeVmb)$ \frac{\sigma _{> }^{int}}{\sigma _{< }^{int}} $ $ \sigma _{< }^{int} $ (MeVmb)$ \sigma _{> }^{int} $ (MeVmb)$ \frac{\sigma _{> }^{int}}{\sigma _{< }^{int}} $ 106 5 3.40 1405 42 0.03 193 210 1.09 108 6 3.89 1560 42 0.03 92 156 1.70 110 7 4.36 1648 45 0.03 58 112 1.92 111 7.5 4.59 1716 66 0.04 57 99 1.73 112 8 4.82 1711 49 0.03 47 77 1.64 113 8.5 5.04 1778 69 0.04 46 60 1.30 114 9 5.26 1772 50 0.03 41 48 1.17 116 10 5.69 1823 46 0.03 36 27 0.75 natTe A T0 E(T>)-E(T<) (γ, sn) (γ, sp) $ \sigma _{< }^{int} $ (MeVmb)$ \sigma _{> }^{int} $ (MeVmb)$ \frac{\sigma _{> }^{int}}{\sigma _{< }^{int}} $ $ \sigma _{< }^{int} $ (MeVmb)$ \sigma _{> }^{int} $ (MeVmb)$ \frac{\sigma _{> }^{int}}{\sigma _{< }^{int}} $ 120 8 4.50 1819 43 0.02 63 108 1.71 122 9 4.92 1891 46 0.02 40 74 1.85 123 9.5 5.12 1964 63 0.03 39 62 1.59 124 10 5.32 1943 47 0.02 34 47 1.38 125 10.5 5.52 2015 49 0.02 35 49 1.40 126 11 5.71 1995 42 0.02 30 31 1.03 128 12 6.09 2043 36 0.02 28 18 0.64 130 13 6.46 2084 28 0.01 27 12 0.44 Table B1. CMPR results for GDR isospin energy splitting,, integral cross sections
$ \sigma _{< }^{int} $ and$ \sigma _{> }^{int} $ of the isospin components reactions (γ, sn) and (γ, sp), the ratio of the reaction cross sections$ \frac{\sigma _{> }^{int}}{\sigma _{< }^{int}} $ , calculated on the basis of CMPR -
The essential components of the TALYS calculations for photonuclear reaction cross sections are the nuclear level densities and γ-ray strength functions. The cross sections of the reactions were computed in this study using TALYS 2.0 with standard parameters. For the reactions 114Cd(γ, p)113Ag and 128Te(γ, p)127Sb, the effects of altering various input options were examined, including the level densities (Constant Temperature + Fermi gas model, Back-shifted Fermi gas Model, Generalized Superfluid Model, Skyrme-Hartree-Fock-Bogolyubov level densities from numerical tables, Skyrme-Hartree-Fock-Bogolyubov combinatorial level densities from numerical tables, Temperature-dependent Gogny-Hartree-Fock-Bogolyubov combinatorial level densities from numerical tables) and γ-strength functions (Kopecky-Uhl generalized Lorentzian, Brink-Axel Lorentzian, Hartree-Fock BCS tables, Hartree-Fock-Bogoliubov tables, Goriely’s hybrid model, Goriely T-dependent HFB, T-dependent RMF, Gogny D1M HFB+QRPA, Simplified Modified Lorentzian Model, Skyrme HFB+QRPA).
Using these options, the cross section per equivalent quantum for the reactions 114Cd(γ, p)113Ag and 128Te(γ, p)127Sb are displayed in Figures B1 and B2. Changing the parameters LD 1−6 and GSF 1−10 gives 60 different results for the theoretical σ(E) and
$ \sigma_q^{\mathrm{nat}} $ (E). As seen in Fig. B1 and Fig. B2, changes in these input options have no effect on the TALYS results. Thus, it is confirmed that the difference between the TALYS and CMPR results is due to the consideration of isospin splitting in the CMPR. A brief description of isospin splitting is given below.
Figure B1. (color online) Cross sections per equivalent quantum
$ \sigma_q^{\mathrm{nat}} $ (E) for the 114Cd(γ, p)113Ag reaction calculated with the TALYS code for six level density models LD1-LD6 (a-f) and ten gamma strength functions (dashed lines) as well as simulated values using the CMPR (solid lines).
Figure B2. (color online) Cross sections per equivalent quantum
$ \sigma_q^{\mathrm{nat}} $ (E) for the 128Te(γ, p)127Sb reaction calculated with the TALYS code for six level density models LD1-LD6 (a-f) and ten gamma strength functions (dashed lines) as well as simulated values using the CMPR (solid lines).In the nuclei with N ≠ Z, upon absorption of the electric dipole γ photons, two branches of the GDR are excited, T<= T0 and T>= T0 + 1, where T0=
$ \dfrac{|N-Z|}{2} $ [48]. Fig. B3 shows the excitations of the isospin components T< and T> of the GDR in the initial nucleus (N, Z) and their decay according to the proton (N, Z − 1) and neutron (N − 1, Z) channels. From Fig. B3, it can be observed that the decay of the excited GDR states with isospin T>= T0 + 1 according to the neutron channel to low-lying states T = T0 – 1/2 with neutron emission is forbidden, which leads to an increase in the reaction cross section (γ, p) and a maximum shift of the reaction cross section (γ, p) with respect to the reactions (γ, n) toward higher energies in the nucleus (N, Z).
Figure B3. Scheme of excitation of states T< and T> in the nucleus (N, Z) and their decay along the proton channel (N, Z − 1) and neutron channel (N − 1, Z).
The value of isospin splitting of the GDR is determined by the following relation [49]:
$ \Delta E=E\left({T}_{> }\right)-E\left({T}_{< }\right)=\frac{60}{A}\left({T}_{0}+1\right). $
(B1) The ratio of the probabilities of the excitation of states T> and T< is described by the following relation [50]:
$ \frac{\sigma ({T}_{> })}{\sigma ({T}_{< })}=\frac{1}{{T}_{0}}\frac{1-1.5{T}_{0}{A}^{-2/3}}{1+1.5{A}^{-2/3}}. $
(B2) Table B1 shows the values of the energy of the GDR isospin energy splitting calculated based on the relations (1) for isotopes natCd and natTe. In addition, Table B1 contains the integral cross sections
$ \sigma_ \lt ^{\mathrm{int}} $ and$ \sigma_ \gt ^{\mathrm{int}} $ of the isospin component reactions (γ, sn) = (γ, n) + (γ, np) + (γ, 2n) and (γ, sp) = (γ, p) + (γ, np) + (γ, 2p) in the energy region below 40 MeV and ratio of the reaction cross sections$ \frac{\sigma_ \gt ^{\mathrm{int}}}{\sigma_ \lt ^{\mathrm{int}}} $ , calculated based on the CMPR for isotopes natCd and natTe. Table B1 shows that for natCd, the growth in the mass number A from 106 to 116 results in an increase in the isospin energy splitting by ≈2.29 MeV. For natTe, the growth in A from 120 to 130 leads to an increase in energy splitting by the value ≈2.16 MeV. The isospin splitting leads to the shift in the proton cross section of the relatively neutron on the side of the high energy.natCd A T0 E(T>)-E(T<) (γ, sn) (γ, sp) $ \sigma_ \lt ^{\mathrm{int}} $ /(MeV·mb)$ \sigma_ \gt ^{\mathrm{int}} $ /(MeV·mb)$ \frac{\sigma_ \gt ^{\mathrm{int}}}{\sigma_ \lt ^{\mathrm{int}}} $ $ \sigma_ \lt ^{\mathrm{int}} $ /(MeV·mb)$ \sigma_ \gt ^{\mathrm{int}} $ /(MeV·mb)$ \frac{\sigma_ \gt ^{\mathrm{int}}}{\sigma_ \lt ^{\mathrm{int}}} $ 106 5 3.40 1405 42 0.03 193 210 1.09 108 6 3.89 1560 42 0.03 92 156 1.70 110 7 4.36 1648 45 0.03 58 112 1.92 111 7.5 4.59 1716 66 0.04 57 99 1.73 112 8 4.82 1711 49 0.03 47 77 1.64 113 8.5 5.04 1778 69 0.04 46 60 1.30 114 9 5.26 1772 50 0.03 41 48 1.17 116 10 5.69 1823 46 0.03 36 27 0.75 natTe A T0 E(T>)-E(T<) (γ, sn) (γ, sp) $ \sigma_ \lt ^{\mathrm{int}} $ /(MeV·mb)$ \sigma_ \gt ^{\mathrm{int}} $ /(MeV·mb)$ \frac{\sigma_ \gt ^{\mathrm{int}}}{\sigma_ \lt ^{\mathrm{int}}} $ $ \sigma_ \lt ^{\mathrm{int}} $ /(MeV·mb)$ \sigma_ \gt ^{\mathrm{int}} $ /(MeV·mb)$ \frac{\sigma_ \gt ^{\mathrm{int}}}{\sigma_ \lt ^{\mathrm{int}}} $ 120 8 4.50 1819 43 0.02 63 108 1.71 122 9 4.92 1891 46 0.02 40 74 1.85 123 9.5 5.12 1964 63 0.03 39 62 1.59 124 10 5.32 1943 47 0.02 34 47 1.38 125 10.5 5.52 2015 49 0.02 35 49 1.40 126 11 5.71 1995 42 0.02 30 31 1.03 128 12 6.09 2043 36 0.02 28 18 0.64 130 13 6.46 2084 28 0.01 27 12 0.44 Table B1. CMPR results for GDR isospin energy splitting, integral cross sections
$ \sigma_ \lt ^{\mathrm{int}} $ and$ \sigma_ \gt ^{\mathrm{int}} $ of the isospin component reactions (γ, sn) and (γ, sp), and ratio of the reaction cross sections$ \frac{\sigma\mathrm{_ \gt ^{int}}}{\sigma_ \lt ^{\mathrm{int}}} $ , calculated based on CMPR. -
The essential components of the TALYS calculations for photonuclear reaction cross sections are the nuclear level densities and γ-ray strength functions. The cross sections of the reactions were computed in this study using TALYS 2.0 with standard parameters. For the reactions 114Cd(γ, p)113Ag and 128Te(γ, p)127Sb, the effects of altering various input options were examined, including the level densities (Constant Temperature + Fermi gas model, Back-shifted Fermi gas Model, Generalized Superfluid Model, Skyrme-Hartree-Fock-Bogolyubov level densities from numerical tables, Skyrme-Hartree-Fock-Bogolyubov combinatorial level densities from numerical tables, Temperature-dependent Gogny-Hartree-Fock-Bogolyubov combinatorial level densities from numerical tables) and γ-strength functions (Kopecky-Uhl generalized Lorentzian, Brink-Axel Lorentzian, Hartree-Fock BCS tables, Hartree-Fock-Bogoliubov tables, Goriely’s hybrid model, Goriely T-dependent HFB, T-dependent RMF, Gogny D1M HFB+QRPA, Simplified Modified Lorentzian Model, Skyrme HFB+QRPA).
Using these options, the cross section per equivalent quantum for the reactions 114Cd(γ, p)113Ag and 128Te(γ, p)127Sb are displayed in Figures B1 and B2. Changing the parameters LD 1−6 and GSF 1−10 gives 60 different results for the theoretical σ(E) and
$ \sigma_q^{\mathrm{nat}} $ (E). As seen in Fig. B1 and Fig. B2, changes in these input options have no effect on the TALYS results. Thus, it is confirmed that the difference between the TALYS and CMPR results is due to the consideration of isospin splitting in the CMPR. A brief description of isospin splitting is given below.
Figure B1. (color online) Cross sections per equivalent quantum
$ \sigma_q^{\mathrm{nat}} $ (E) for the 114Cd(γ, p)113Ag reaction calculated with the TALYS code for six level density models LD1-LD6 (a-f) and ten gamma strength functions (dashed lines) as well as simulated values using the CMPR (solid lines).
Figure B2. (color online) Cross sections per equivalent quantum
$ \sigma_q^{\mathrm{nat}} $ (E) for the 128Te(γ, p)127Sb reaction calculated with the TALYS code for six level density models LD1-LD6 (a-f) and ten gamma strength functions (dashed lines) as well as simulated values using the CMPR (solid lines).In the nuclei with N ≠ Z, upon absorption of the electric dipole γ photons, two branches of the GDR are excited, T<= T0 and T>= T0 + 1, where T0=
$ \dfrac{|N-Z|}{2} $ [48]. Fig. B3 shows the excitations of the isospin components T< and T> of the GDR in the initial nucleus (N, Z) and their decay according to the proton (N, Z − 1) and neutron (N − 1, Z) channels. From Fig. B3, it can be observed that the decay of the excited GDR states with isospin T>= T0 + 1 according to the neutron channel to low-lying states T = T0 – 1/2 with neutron emission is forbidden, which leads to an increase in the reaction cross section (γ, p) and a maximum shift of the reaction cross section (γ, p) with respect to the reactions (γ, n) toward higher energies in the nucleus (N, Z).
Figure B3. Scheme of excitation of states T< and T> in the nucleus (N, Z) and their decay along the proton channel (N, Z − 1) and neutron channel (N − 1, Z).
The value of isospin splitting of the GDR is determined by the following relation [49]:
$ \Delta E=E\left({T}_{> }\right)-E\left({T}_{< }\right)=\frac{60}{A}\left({T}_{0}+1\right). $
(B1) The ratio of the probabilities of the excitation of states T> and T< is described by the following relation [50]:
$ \frac{\sigma ({T}_{> })}{\sigma ({T}_{< })}=\frac{1}{{T}_{0}}\frac{1-1.5{T}_{0}{A}^{-2/3}}{1+1.5{A}^{-2/3}}. $
(B2) Table B1 shows the values of the energy of the GDR isospin energy splitting calculated based on the relations (1) for isotopes natCd and natTe. In addition, Table B1 contains the integral cross sections
$ \sigma_ \lt ^{\mathrm{int}} $ and$ \sigma_ \gt ^{\mathrm{int}} $ of the isospin component reactions (γ, sn) = (γ, n) + (γ, np) + (γ, 2n) and (γ, sp) = (γ, p) + (γ, np) + (γ, 2p) in the energy region below 40 MeV and ratio of the reaction cross sections$ \frac{\sigma_ \gt ^{\mathrm{int}}}{\sigma_ \lt ^{\mathrm{int}}} $ , calculated based on the CMPR for isotopes natCd and natTe. Table B1 shows that for natCd, the growth in the mass number A from 106 to 116 results in an increase in the isospin energy splitting by ≈2.29 MeV. For natTe, the growth in A from 120 to 130 leads to an increase in energy splitting by the value ≈2.16 MeV. The isospin splitting leads to the shift in the proton cross section of the relatively neutron on the side of the high energy.natCd A T0 E(T>)-E(T<) (γ, sn) (γ, sp) $ \sigma_ \lt ^{\mathrm{int}} $ /(MeV·mb)$ \sigma_ \gt ^{\mathrm{int}} $ /(MeV·mb)$ \frac{\sigma_ \gt ^{\mathrm{int}}}{\sigma_ \lt ^{\mathrm{int}}} $ $ \sigma_ \lt ^{\mathrm{int}} $ /(MeV·mb)$ \sigma_ \gt ^{\mathrm{int}} $ /(MeV·mb)$ \frac{\sigma_ \gt ^{\mathrm{int}}}{\sigma_ \lt ^{\mathrm{int}}} $ 106 5 3.40 1405 42 0.03 193 210 1.09 108 6 3.89 1560 42 0.03 92 156 1.70 110 7 4.36 1648 45 0.03 58 112 1.92 111 7.5 4.59 1716 66 0.04 57 99 1.73 112 8 4.82 1711 49 0.03 47 77 1.64 113 8.5 5.04 1778 69 0.04 46 60 1.30 114 9 5.26 1772 50 0.03 41 48 1.17 116 10 5.69 1823 46 0.03 36 27 0.75 natTe A T0 E(T>)-E(T<) (γ, sn) (γ, sp) $ \sigma_ \lt ^{\mathrm{int}} $ /(MeV·mb)$ \sigma_ \gt ^{\mathrm{int}} $ /(MeV·mb)$ \frac{\sigma_ \gt ^{\mathrm{int}}}{\sigma_ \lt ^{\mathrm{int}}} $ $ \sigma_ \lt ^{\mathrm{int}} $ /(MeV·mb)$ \sigma_ \gt ^{\mathrm{int}} $ /(MeV·mb)$ \frac{\sigma_ \gt ^{\mathrm{int}}}{\sigma_ \lt ^{\mathrm{int}}} $ 120 8 4.50 1819 43 0.02 63 108 1.71 122 9 4.92 1891 46 0.02 40 74 1.85 123 9.5 5.12 1964 63 0.03 39 62 1.59 124 10 5.32 1943 47 0.02 34 47 1.38 125 10.5 5.52 2015 49 0.02 35 49 1.40 126 11 5.71 1995 42 0.02 30 31 1.03 128 12 6.09 2043 36 0.02 28 18 0.64 130 13 6.46 2084 28 0.01 27 12 0.44 Table B1. CMPR results for GDR isospin energy splitting, integral cross sections
$ \sigma_ \lt ^{\mathrm{int}} $ and$ \sigma_ \gt ^{\mathrm{int}} $ of the isospin component reactions (γ, sn) and (γ, sp), and ratio of the reaction cross sections$ \frac{\sigma\mathrm{_ \gt ^{int}}}{\sigma_ \lt ^{\mathrm{int}}} $ , calculated based on CMPR.
Photonuclear reactions on stable isotopes of cadmium and tellurium at bremsstrahlung end-point energies of 10−23 MeV
- Received Date: 2025-11-26
- Available Online: 2026-06-15
Abstract: In this study, the γ-activation approach was used to conduct tests at the bremsstrahlung end-point energies of 10−23 MeV by utilizing the MT-25 microtron beam. The experimental values of the relative yields and cross sections per equivalent quantum of photonuclear reactions on the stable isotopes of cadmium and tellurium were compared with the theoretical calculation results obtained from TALYS-2.0 using the default parameters and the combined model of photonucleon reactions (CMPR). The inclusion of isospin splitting in the CMPR allows for the definition of experimental data on the proton escape reactions with energies ranging from 17 to 23 MeV. Therefore, isospin splitting must be considered to accurately describe the decay of the giant dipole resonance. For Cd isotopes, essential discrepancies of yet unclear origin between theory (TALYS 2.0 and CMPR) and experimental data are found in the neutron channel.


 DownLoad: