


 Abstract
 HTML
 Reference
 Related
 PDF



-
Alpha decay and spontaneous fission (SF) are the principal decay modes of heavy and superheavy nuclei (SHN) [1−7]. The unambiguous identification of new isotopes is greatly facilitated by the observation of their
$ \alpha $ -decay chains terminating in SF. Experimental and theoretical investigations of these nuclei constitute a major frontier in modern nuclear physics [8−21]. Consequently, a comprehensive understanding of the competition between$ \alpha $ decay and SF is indispensable for guiding experimental exploration and accurately mapping the extent and boundaries of the island of stability [1−3, 22−30].Although various microscopic approaches have been developed to describe
$ \alpha $ decay [31−35] and SF [36−42], their application to heavy and superheavy systems remains computationally demanding and sensitive to uncertainties in shell structure and fission barrier heights. These challenges have sustained strong interest in developing fast semi-empirical methods for systematic half-life predictions [43−55].For
$ \alpha $ decay, the Viola–Seaborg relation [45] remains a widely used semi-empirical tool. It is commonly expressed as$ \log_{10} T_{1/2}^{\alpha} \ ({\rm{s}}) = \frac{a Z + b}{\sqrt{Q_\alpha}} + c Z + d + h_{\alpha}, $
(1) where Z is the proton number and
$ Q_\alpha $ is the$ \alpha $ -decay energy. In this work, we adopt the Parkhomenko–Sobiczewski parameterization [56], which, as demonstrated in Ref. [57], provides high accuracy for SHN when benchmarked against experimental$ T_{1/2}^{\alpha} $ data. The corresponding coefficients are$ a = 1.3892 $ ,$ b = 13.862 $ ,$ c = -0.1086 $ , and$ d = -41.458 $ , while$ h_{\alpha} = 0 $ , 0.437, 0.641, and 1.024 for even-even, odd-even, even-odd, and odd-odd nuclei, respectively.For SF half-lives, we have previously found that, at fixed
$ N-Z $ ,$ \log_{10} T_{1/2}^{\rm{SF}} $ depends nearly linearly on$ Q_\alpha $ [58, 59]. This observation enabled us to derive an empirical formula that relates SF half-lives directly to the$ \alpha $ -decay energy$ Q_\alpha $ and the neutron excess$ N-Z $ :$ \log_{10} T_{1/2}^{\rm{SF}} \ ({\rm{s}}) = c_0 + c_1 (N-Z) + c_2 (N-Z)^2 + c_Q Q_\alpha + h_{\rm{SF}}, $
(2) where
$ h_{\rm{SF}} = 0 $ , h, and$ 1.575h $ for even-even, odd-A, and odd-odd nuclei, respectively. The coefficients are divided into two sets according to Z: for$ 90 \le Z \le 102 $ ,$ c_0 = -244.845 $ ,$ c_1 = 12.2843 $ ,$ c_2 = -0.12658 $ ,$ c_Q = -6.1023 $ , and$ h = 4.309 $ ; for$ Z \ge 103 $ ,$ c_0 = -0.414 $ ,$ c_1 = 0.1379 $ ,$ c_2 = 0 $ ,$ c_Q = -0.9097 $ , and$ h = 2.327 $ . Because Eq. (2) uses only$ Q_\alpha $ , which is typically determined more reliably than absolute masses or shell-correction energies [60], it avoids the model-dependent uncertainties inherent in microscopic fission calculations.Most heavy and superheavy nuclei are deformed, and deformation can affect both
$ \alpha $ -decay and SF half-lives. Explicitly incorporating quadrupole and hexadecapole deformation parameters into the generalized liquid drop model has been shown to improve agreement with experimental data, particularly in the superheavy region [61]. Because the ground-state masses of the parent and daughter nuclei depend on their shapes, deformation is partially embedded in the$ \alpha $ -particle separation energy$ Q_\alpha $ . In the present work, therefore, deformation is treated implicitly through$ Q_\alpha $ .The aim of the present work is to investigate the competition between
$ \alpha $ decay and SF along the$ \alpha $ -decay chains of$ Z=119 $ and$ Z=120 $ isotopes, whose properties are currently the subject of intensive experimental and theoretical studies. For this purpose, we employ Eq. (1) and Eq. (2) to estimate the corresponding half-lives for nuclei in the$ \alpha $ -decay chains of$ Z=119 $ isotopes with A = 293–298 and$ Z=120 $ isotopes with A = 295–300, extending down to Lr and Rf isotopes. The corresponding neutron-excess values,$ N-Z = 55 $ to 60, place these nuclei near the predicted island of stability, making their decay characteristics particularly relevant for guiding future experimental efforts at the limits of the nuclear chart. The novelty of the present work lies in its systematic mapping of this competition and its identification of robust experimental decay chains. -
To obtain an overall picture of the competition between
$ \alpha $ decay and SF in the region of interest, we first calculate the partial half-lives using the formulas described above. The$ \alpha $ -decay half-life$ T_{1/2}^\alpha $ is obtained from Eq. (1), whereas the SF half-life$ T_{1/2}^{\rm{SF}} $ is calculated using Eq. (2). Both formulas require the$ \alpha $ -decay energy$ Q_\alpha $ as input.The calculations use experimental
$ Q_\alpha $ values from Ref. [62] whenever available; otherwise, the values are taken from the macroscopic–microscopic model of Ref. [63]. This model combines the Yukawa-plus-exponential macroscopic energy [64] with microscopic shell and pairing corrections obtained via the Strutinsky method from the single-particle levels of a deformed Woods–Saxon potential. It is widely used in this mass region and provides calculated$ Q_\alpha $ values for all nuclei of interest. To quantify its accuracy, we define the deviation for$ Q_\alpha $ as$ \delta^{Q_\alpha} = Q_\alpha^{{\rm{calc}}.} - Q_\alpha^{{\rm{exp}}.} $ . Its performance against the experimental$ Q_\alpha $ data from Ref. [62] is characterized by a mean deviation (indicating overestimation) of$ \langle \delta^{Q_\alpha} \rangle = 136 $ keV, a mean absolute deviation of$ \langle \left| \delta^{Q_\alpha} \right| \rangle = 260 $ keV, and a root-mean-square deviation of$ \delta_{\rm{rms}}^{Q_\alpha} = 315 $ keV, evaluated for 92 nuclei with$ Z \ge 103 $ .To assess the quality of the description, the calculated half-lives for both decay modes are compared with experimental data. For
$ \alpha $ -decay half-lives, the primary source is Ref. [7], supplemented by the most recent experimental data for 272Hs, 275Ds [13], 276Ds [12], and 257Sg [15]. The ground-state half-lives of 261Rf, 265Sg, 271Hs, and 273Ds are updated according to the one-quasiparticle level schemes proposed in Ref. [13]. Additional data for 251Lr [65], 253Rf [30], 257Db [66], 268Db [9, 11], 272Bh, 282–285Nh and 286Mc [11], 258Sg [67], 262Sg [68], 264Sg [25], 269Sg, 281Cn, 289Lv [69], 288Lv [70], 271Sg, 275Hs, 283Cn, 286Fl [10], 265Bh [71], 264Hs [29], 267Hs [24], 273Hs [72], 282Mt, 286Rg, 284Fl [23], and 284Cn [20] are also included, with half-lives and branching ratios (or their limits) taken from the original publications or updated as necessary.For SF half-lives, experimental values are taken primarily from Refs. [7, 29], together with the recently reported half-lives of 252Rf [14], 263Rf [13], 264Lr [9, 11], 257Db [66], 266Db [11], 257Sg [15], 268Sg, and 276Ds [12]. In addition, the data for 255Lr [73], 267,268Db, 279,281Rg, 285Nh [11], 277Mt [74], 259Sg [75], 269Sg, 281Cn [69], 260Bh [76], 265Hs [77], 270Hs [78], 275Hs [10], and 284Fl [23] are updated or supplemented, including branching ratios and half-life limits where applicable.
To validate the use of theoretical
$ Q_\alpha $ values from Ref. [63] in the present calculations, we compare the resulting half-lives with experimental data. Nuclei for which only limits are available were excluded from the statistical analysis. For each decay mode m ($ m=\alpha $ or SF), we define the deviation as$ \delta^{T_{1/2}^{m}} = \log_{10} ( T_{1/2}^{m,\,{{\rm{calc}}.}} / T_{1/2}^{m,\,{{\rm{exp}}.}} ) $ . For 120 nuclei with$ Z \ge 103 $ and known experimental$ \alpha $ -decay half-lives, the use of theoretical$ Q_\alpha $ values in Eq. (1) yields a mean absolute deviation$ \langle | \delta^{T_{1/2}^{\alpha}} | \rangle = 0.80 $ orders of magnitude and a root-mean-square deviation$ \delta_{{\rm{rms}}}^{T_{1/2}^{\alpha}} = 1.10 $ . For 59 nuclei with$ Z \ge 103 $ and known experimental SF half-lives, the same$ Q_\alpha $ input in Eq. (2) gives$ \langle | \delta^{T_{1/2}^{{\rm{SF}}}} | \rangle = 0.97 $ orders of magnitude and$ \delta_{{\rm{rms}}}^{T_{1/2}^{{\rm{SF}}}} = 1.40 $ . These deviations are within the typical accuracy of empirical systematics and confirm that the formulas reproduce the overall magnitudes of the half-lives. We therefore use theoretical$ Q_\alpha $ values for all nuclei for which experimental values are unavailable.Figure 1 presents contour maps of the logarithms of the calculated half-lives for SF and
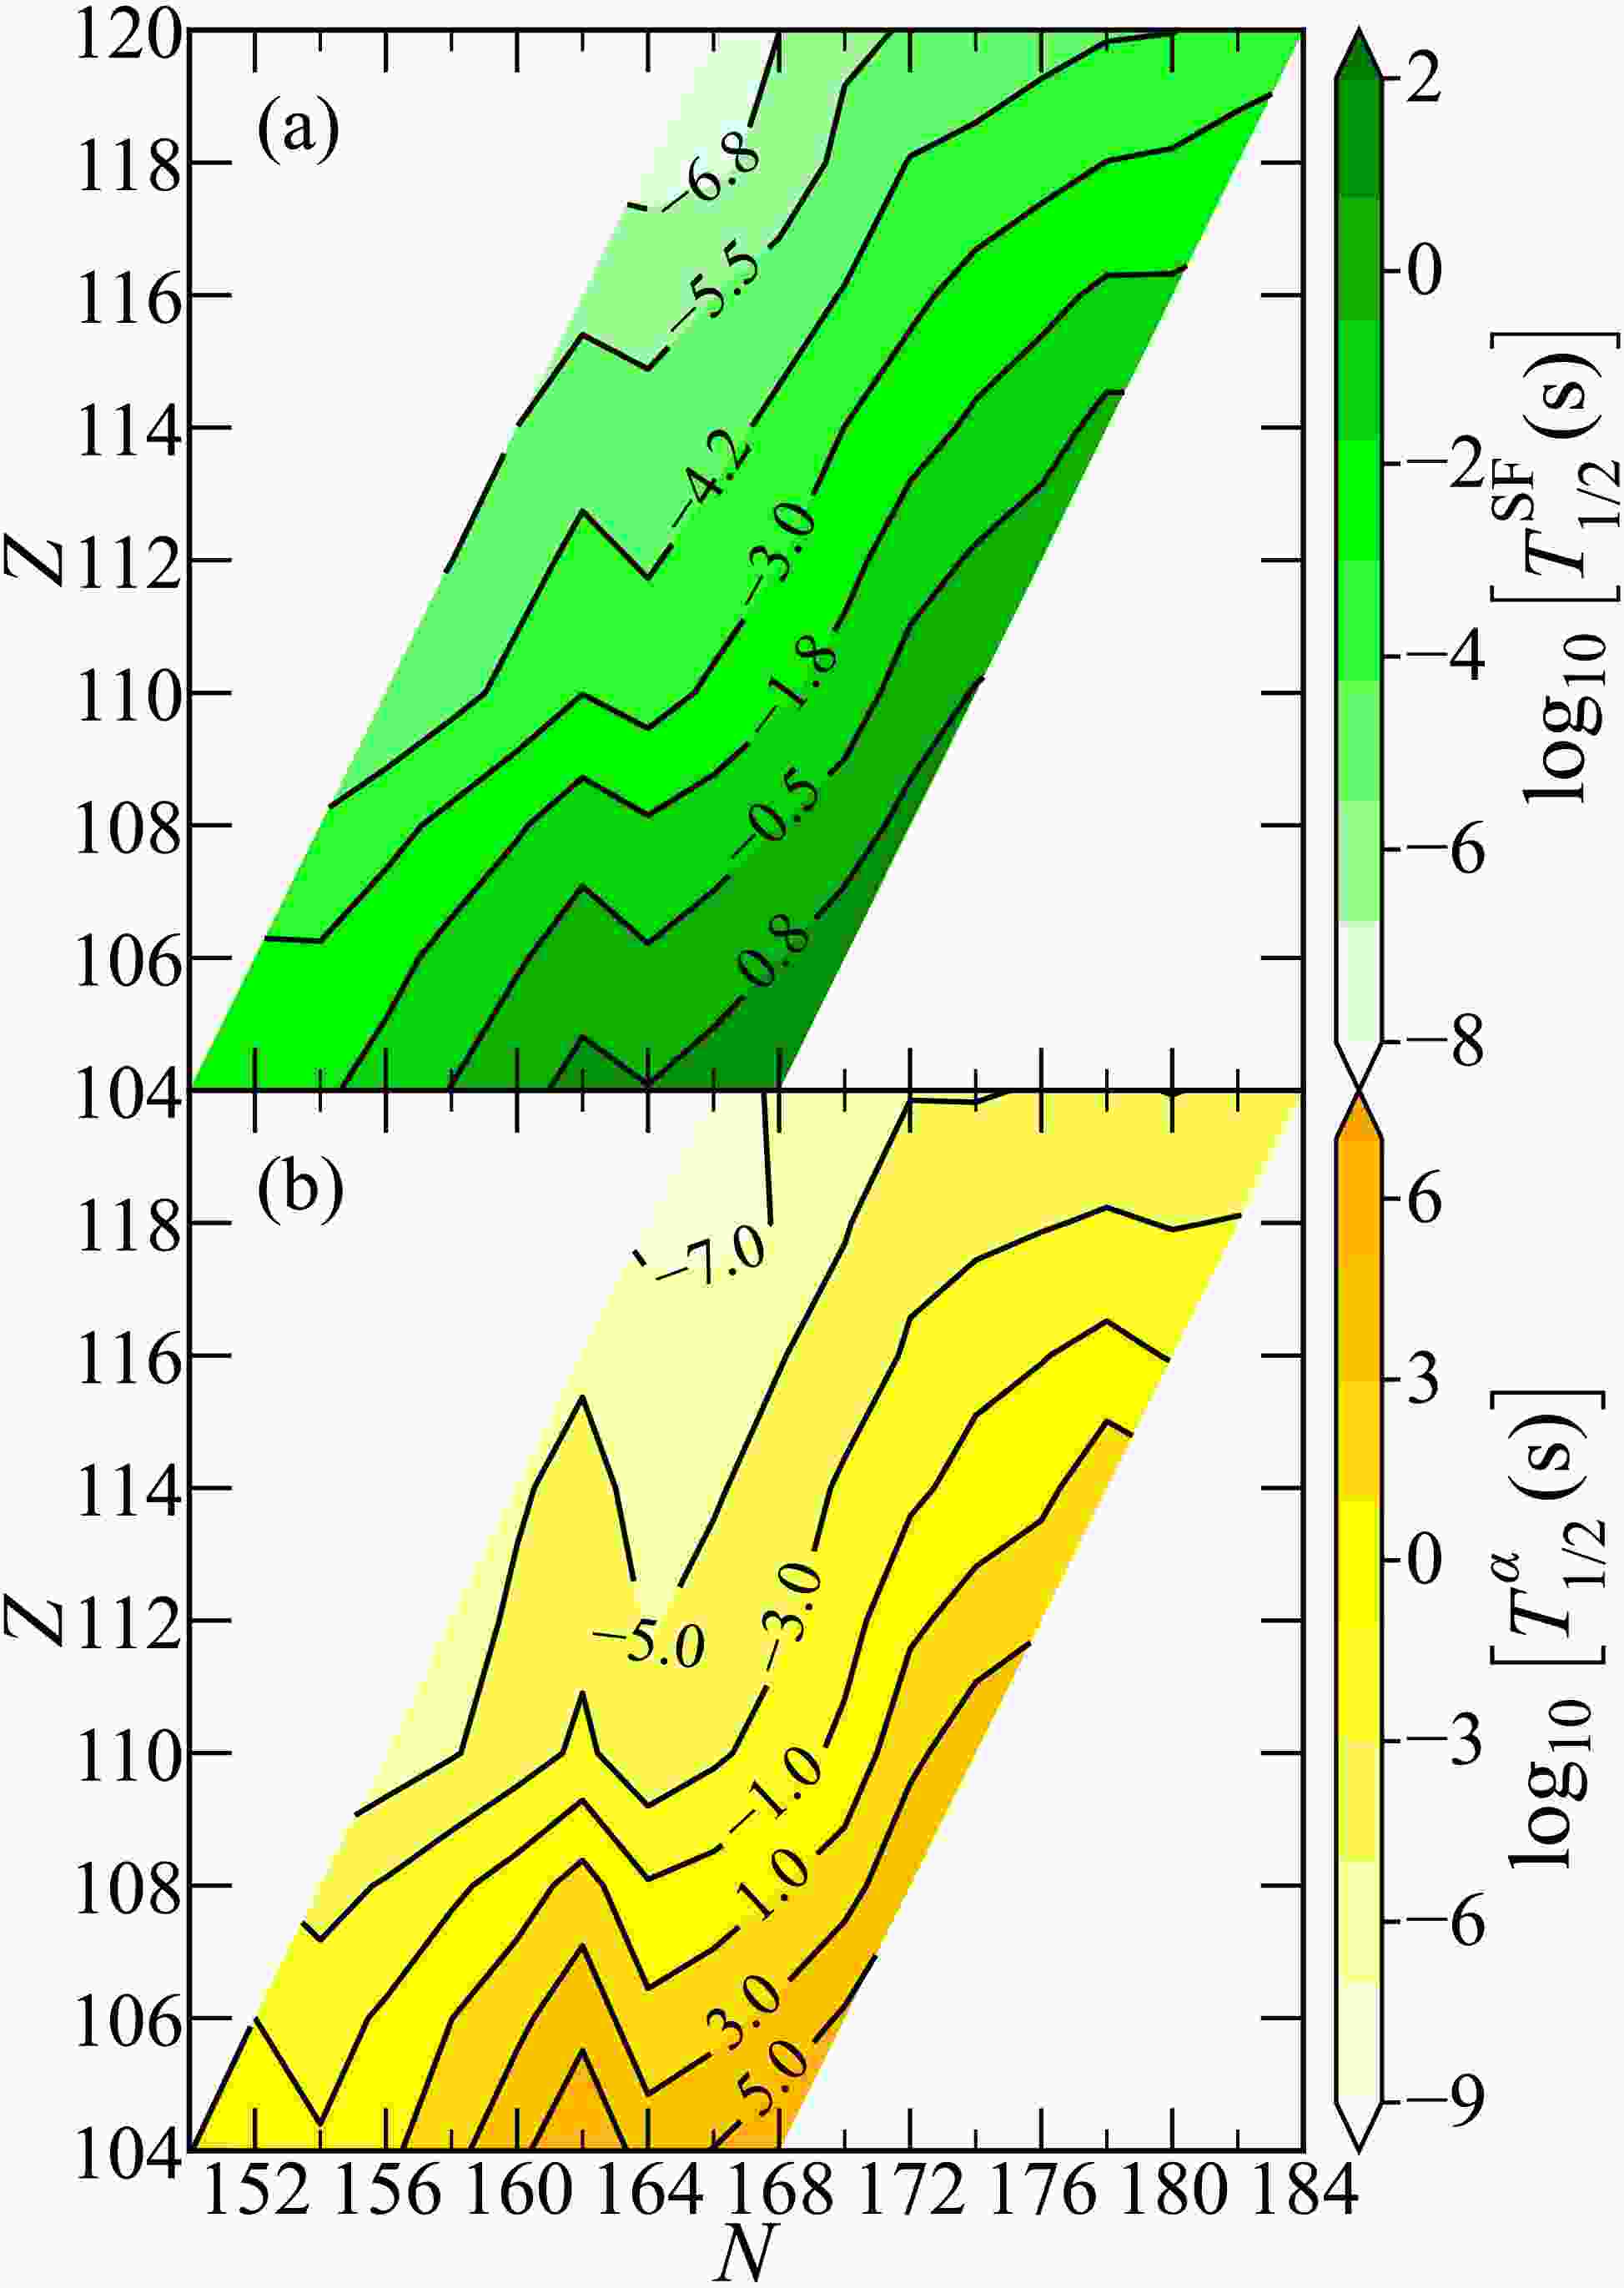
$ \alpha $ decay of even-even nuclei in the region$ 104 \le Z \le 120 $ and$ 46 \le N-Z \le 64 $ . The calculations use$ Q_\alpha $ values obtained from Ref. [63]. The half-lives exhibit smooth trends, decreasing gradually with decreasing neutron excess and increasing proton number. In contrast to shell-correction energies, which typically exhibit pronounced structures around magic numbers [79−81], the half-lives vary more smoothly across the considered region. Although the formulas used for both decay modes do not explicitly include shell corrections, shell-structure information enters through the$ Q_\alpha $ values and is reflected in the observed half-life variations. An increase in both SF and$ \alpha $ -decay half-lives is observed near the deformed shell closure at$ N=162 $ . Within the present semi-empirical description, the enhancement of the half-lives associated with this shell closure is less pronounced for SF than for$ \alpha $ decay.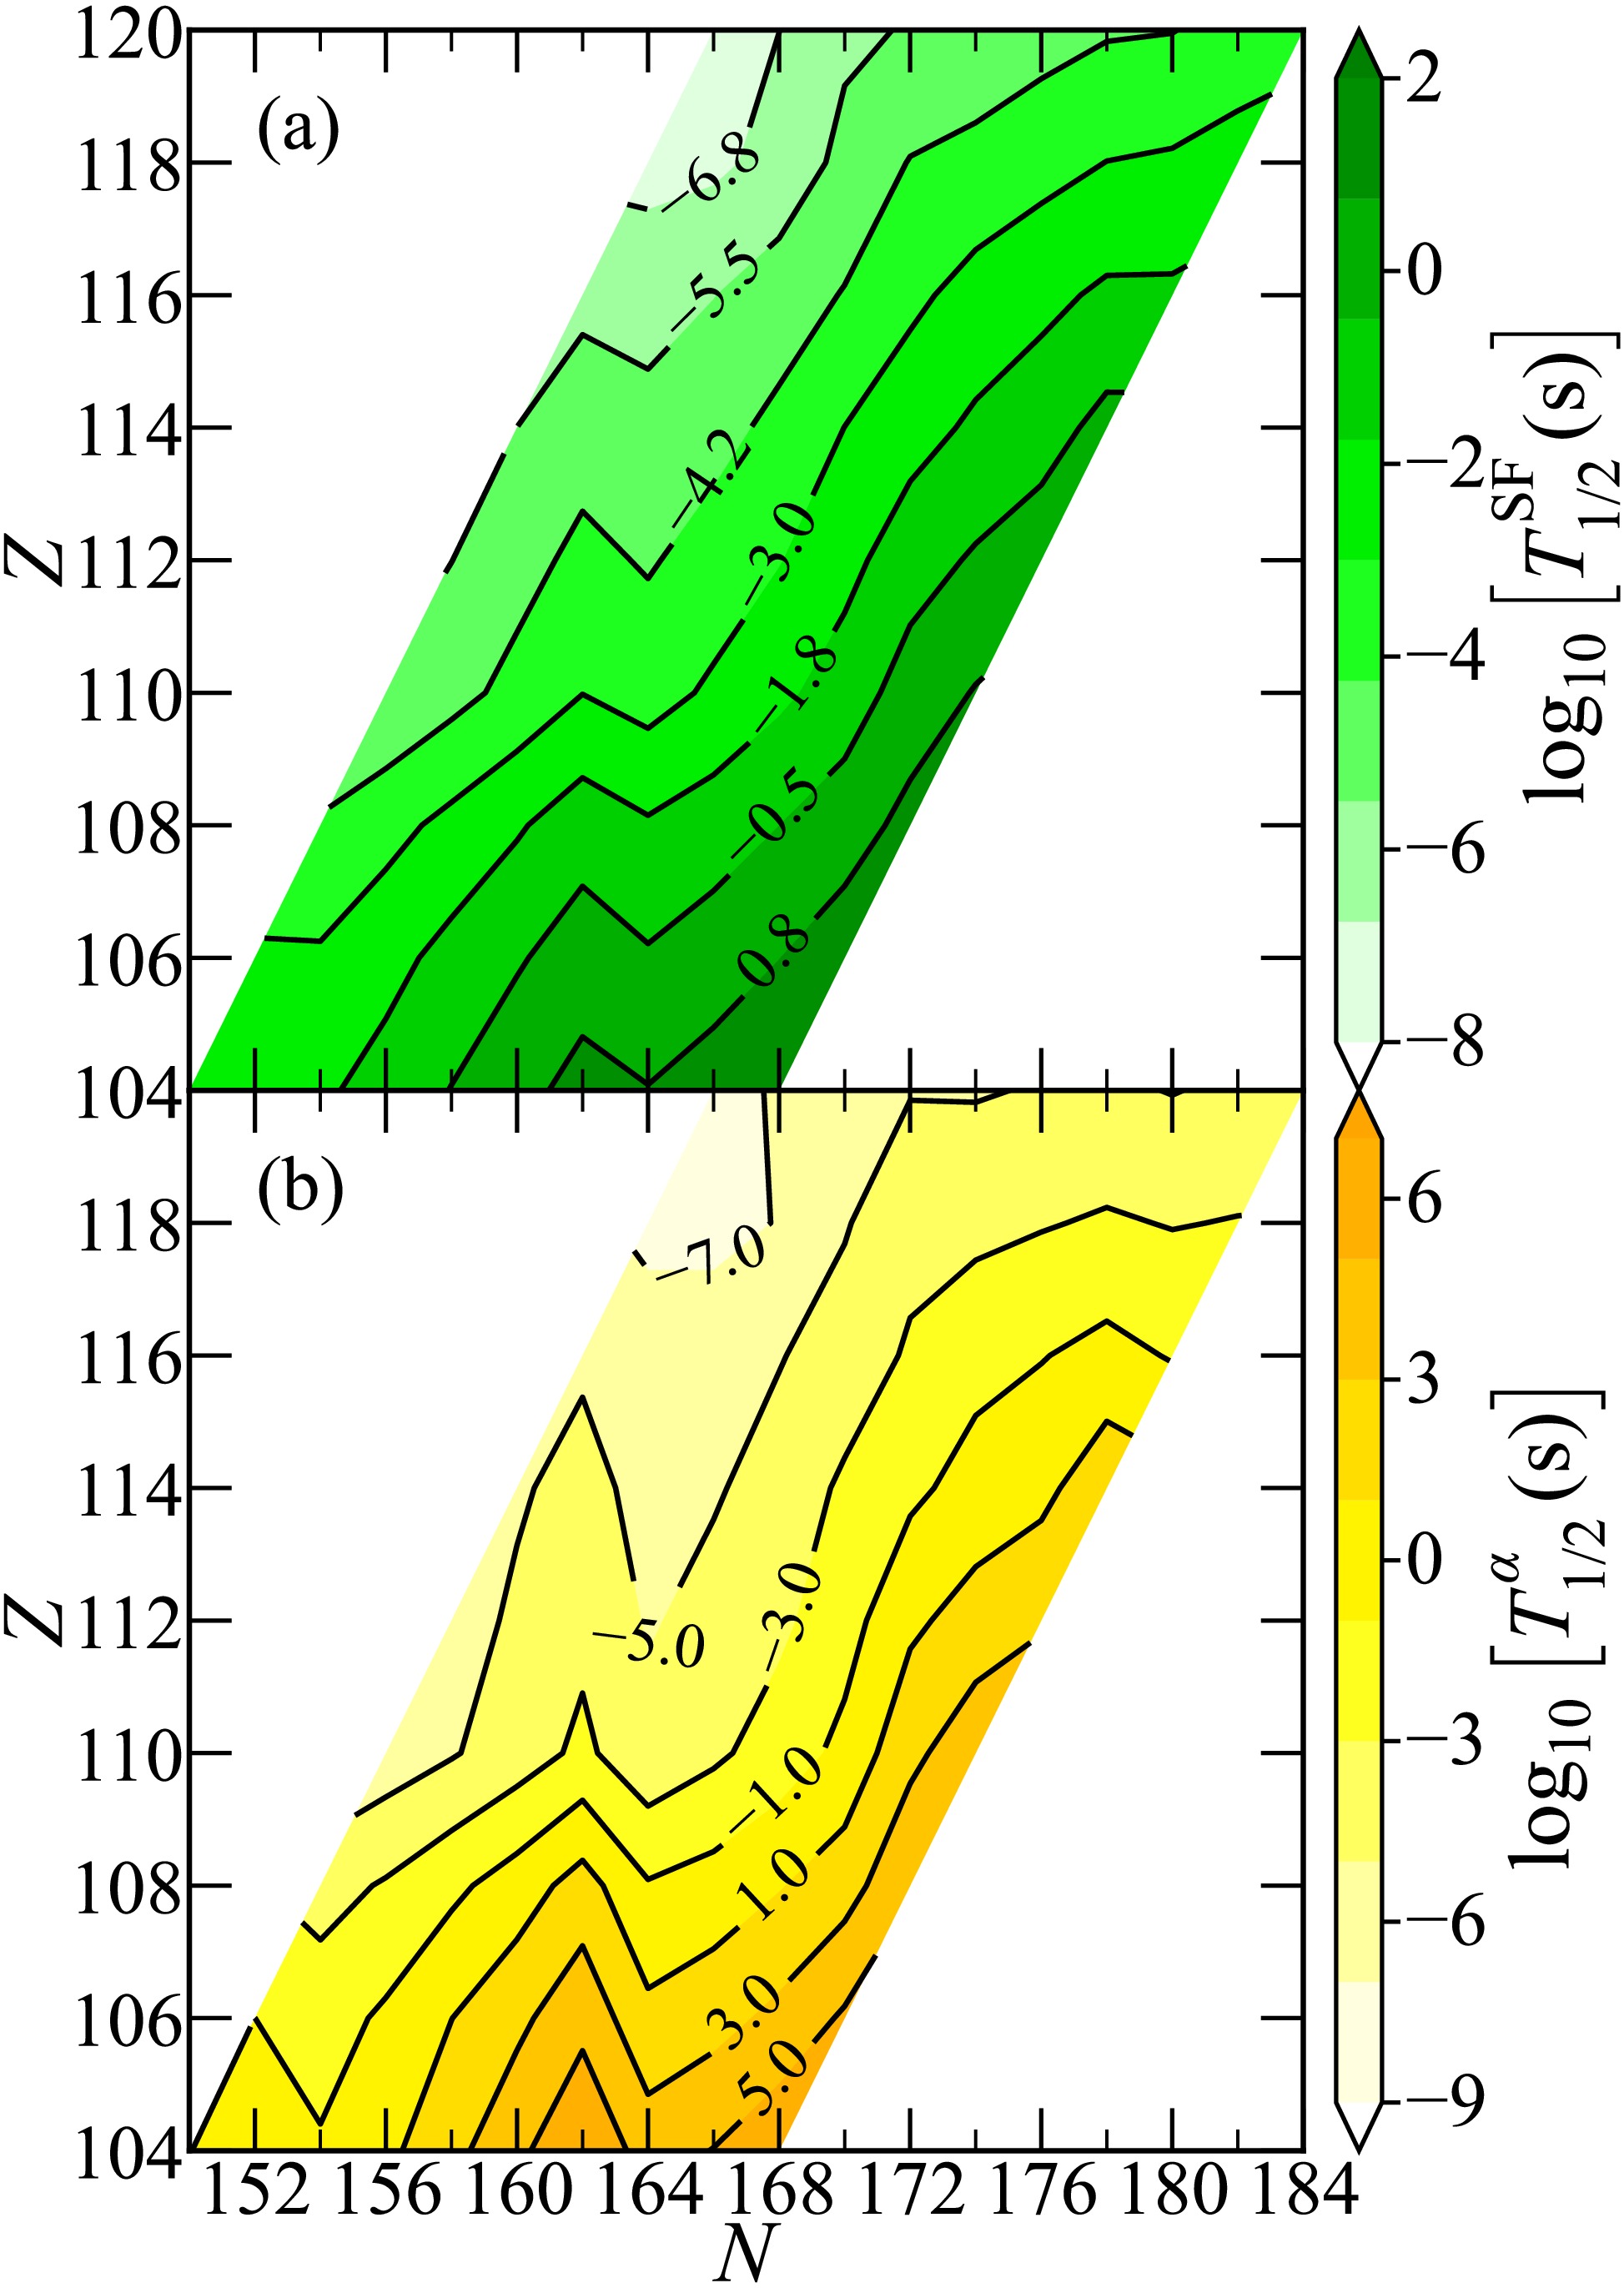
Figure 1. (color online) Color contour maps show the logarithms of SF (a) and
$ \alpha $ -decay (b) half-lives, expressed in seconds, for even-even nuclei with proton numbers$ 104 \le Z \le 120 $ and neutron excess$ 46 \le N-Z \le 64 $ . The half-lives were calculated using Eq. (1) for$ \alpha $ decay and Eq. (2) for SF, with$ Q_\alpha $ values from Ref. [63].Figures 2 and 3 present the calculated partial half-lives for
$ \alpha $ decay and SF along the$ \alpha $ -decay chains of$ Z=119 $ and$ Z=120 $ isotopes, respectively, in comparison with experimental data. Experimental$ Q_\alpha $ values from Ref. [62] are used where available; otherwise, theoretical$ Q_\alpha $ values from Ref. [63] are employed.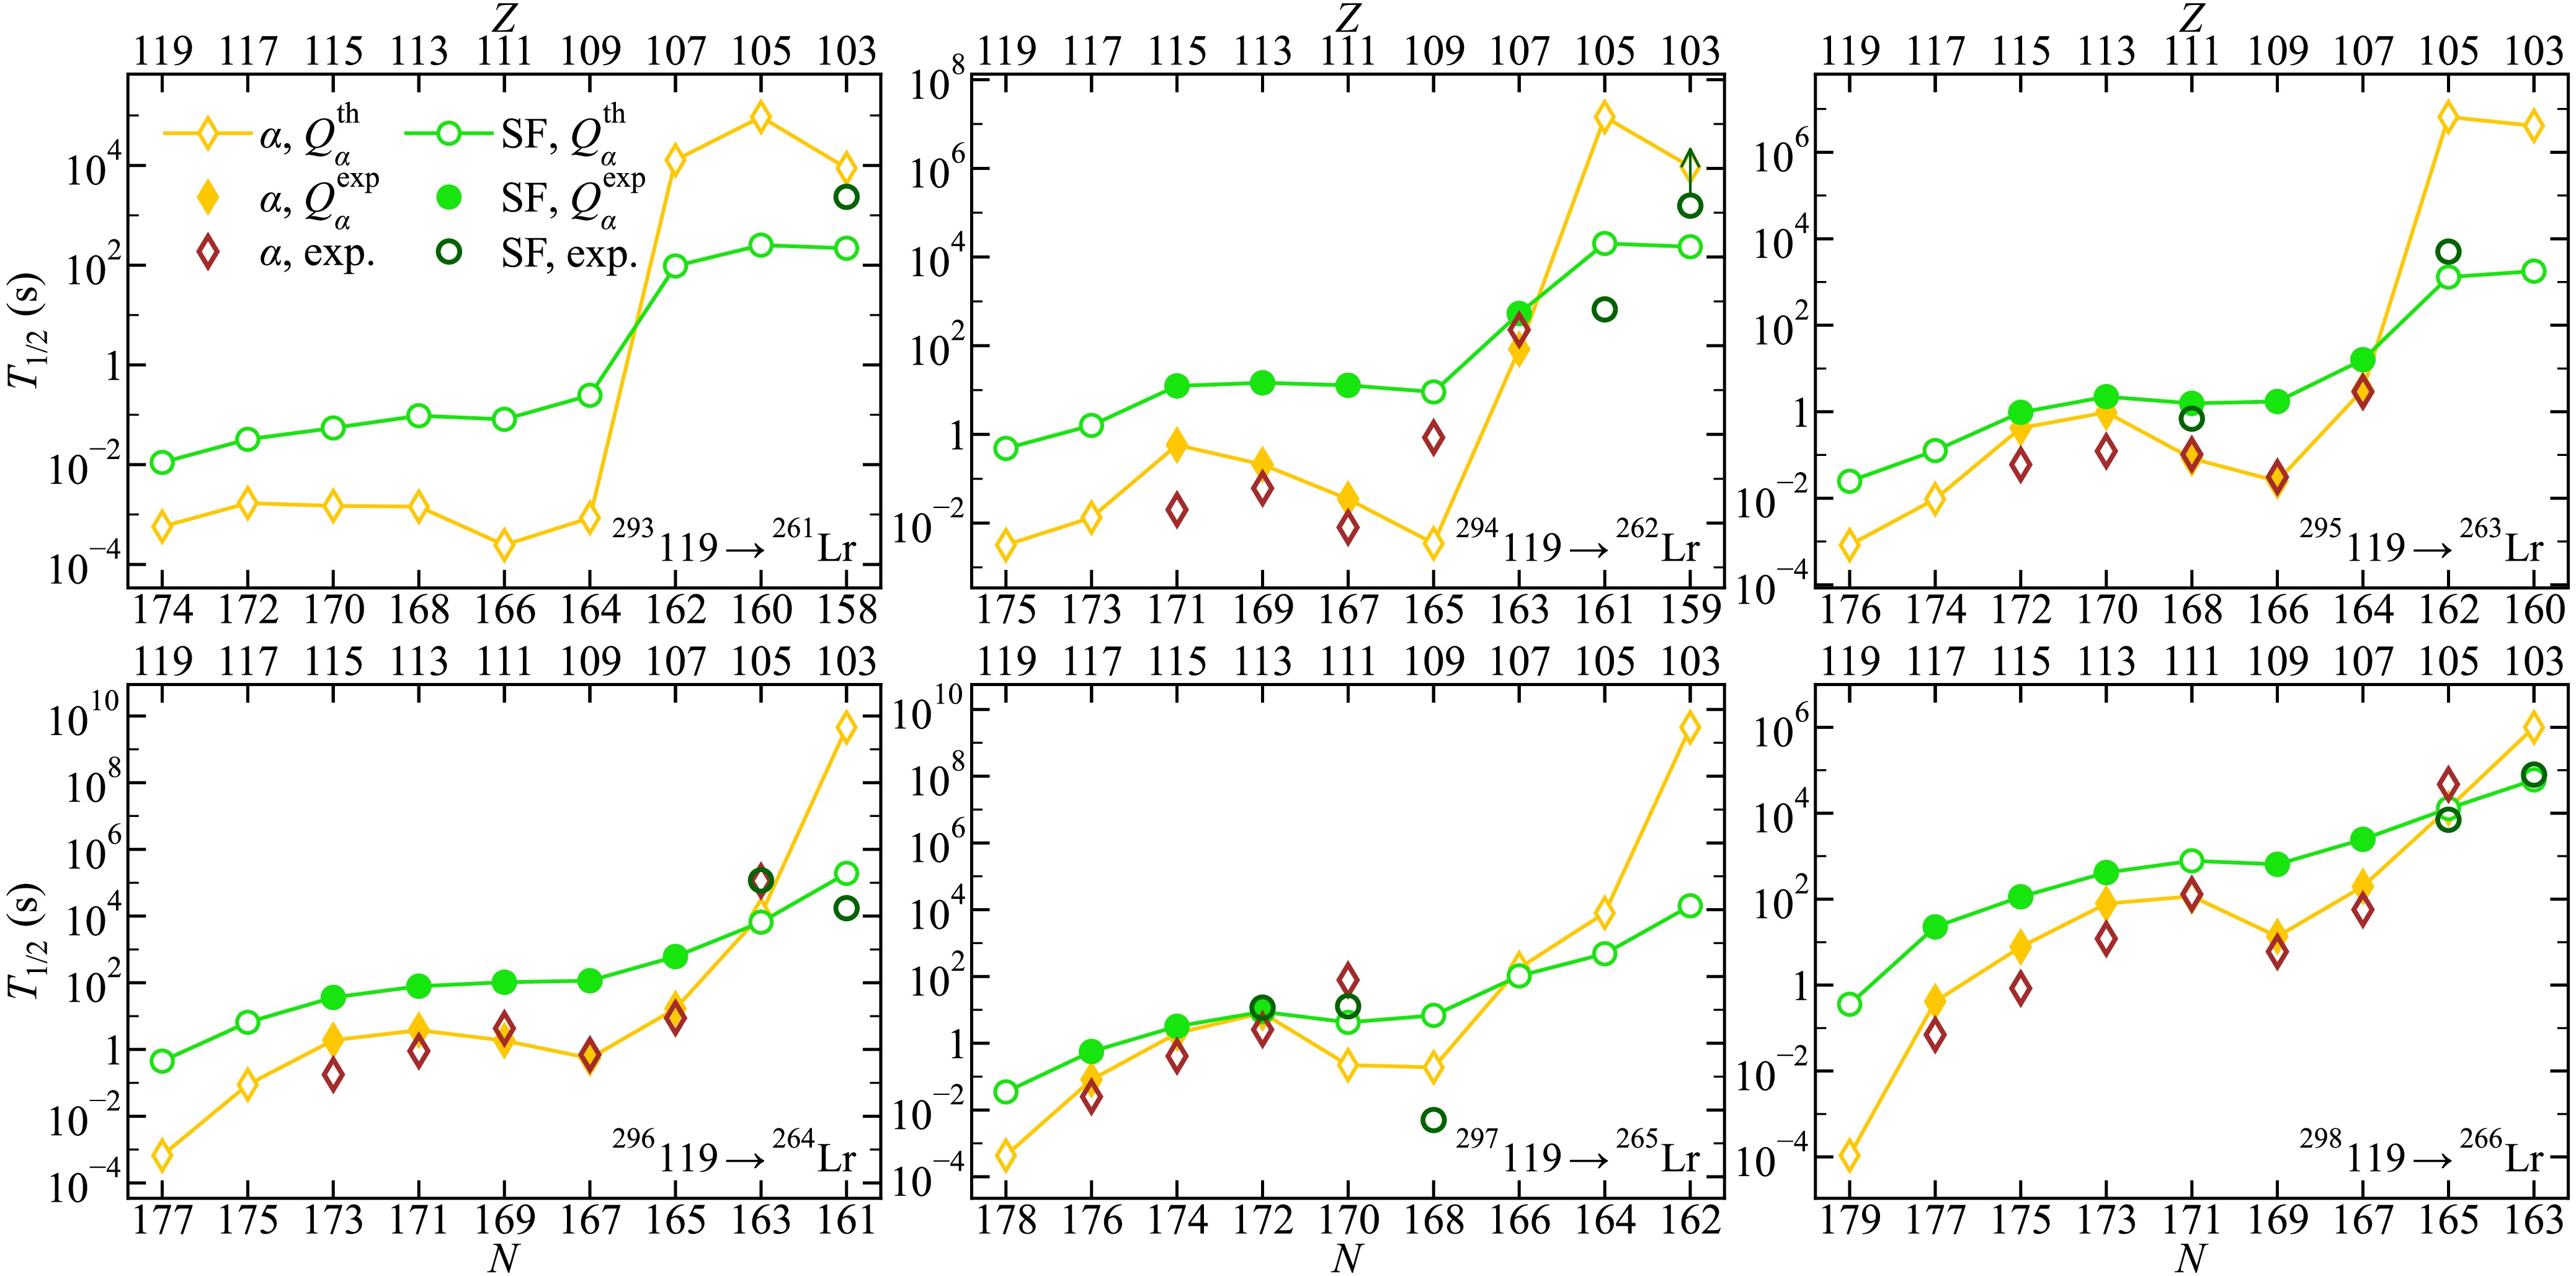
Figure 2. (color online) Comparison of the calculated
$ \alpha $ -decay (yellow diamonds connected by lines) and SF (green circles connected by lines) half-lives for$ \alpha $ -decay chains originating from isotopes of element 119 with mass numbers A = 293–298. The$ \alpha $ -decay and SF half-lives are calculated using Eq. (1) and Eq. (2), respectively. Solid symbols denote calculations based on experimental$ Q_\alpha $ values from Ref. [62], whereas open symbols denote calculations based on theoretical$ Q_\alpha $ values from Ref. [63]. Experimental$ \alpha $ -decay (open brown diamonds) and SF (open darkgreen circles) half-lives are taken from Refs. [7, 29]. Downward (upward) arrows indicate upper (lower) limits on the half-life for the corresponding decay mode.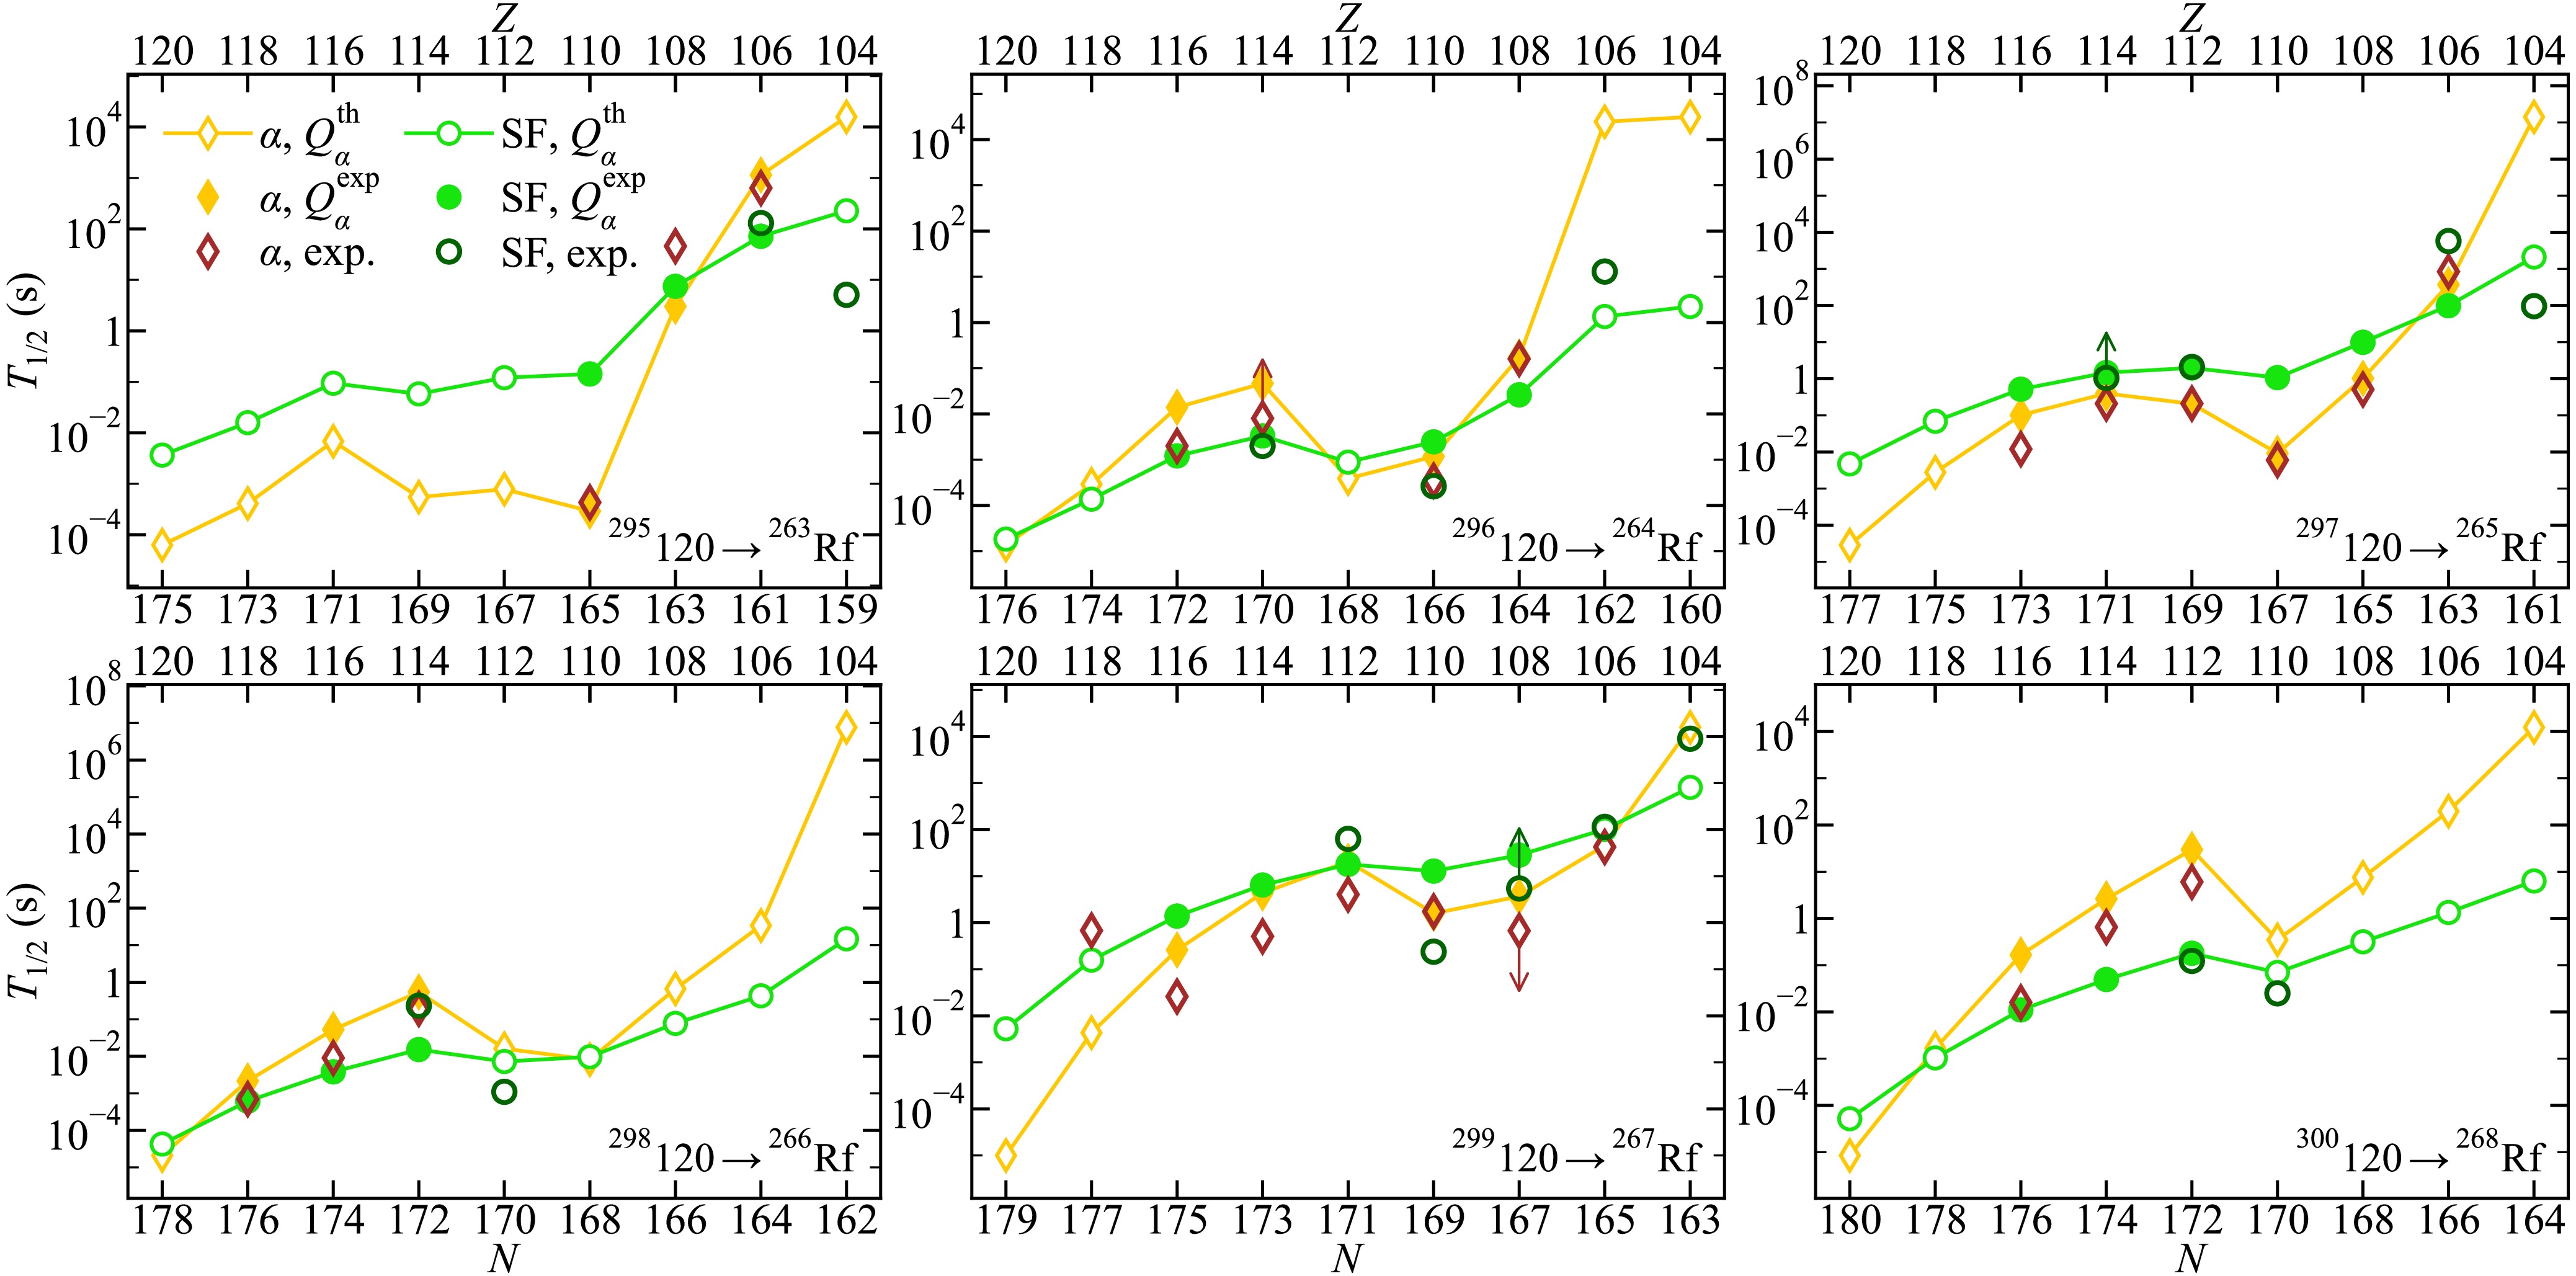
Figure 3. (color online) Same as in Fig. 2, but for the
$ \alpha $ -decay chains of$ Z=120 $ isotopes with mass numbers A = 295–300.A global trend observed in both figures is the decrease in the partial half-lives for both decay modes as one moves further into the superheavy region. The extent to which one decay mode dominates over the other can be assessed from the vertical separation between the two corresponding curves: the larger the separation, the higher the probability of decay through the mode with the shorter half-life.
For chains starting from 293,294,296119 and 295120,
$ \alpha $ decay clearly dominates over SF by about two orders of magnitude at the initial members of the chains. However, this behavior changes abruptly at neutron number$ N=162 $ , where the$ \alpha $ -decay half-lives increase sharply, whereas the SF half-lives exhibit a much less pronounced increase. Consequently, SF becomes the dominant decay mode for$ N<162 $ . In contrast, for chains starting from 295,297,298119 and 297,299120, the two decay modes already exhibit strong competition from the initial steps of the chains, with SF clearly dominating for$ N<162 $ . For chains initiated by 296,298,300120, SF dominates almost immediately. A particularly prominent feature is observed at$ N=172 $ , where the$ \alpha $ -decay half-lives increase more substantially than the SF half-lives, leading to pronounced SF dominance.Comparing the two elements, the half-lives of
$ Z=119 $ isotopes are systematically longer than those of$ Z=120 $ isotopes. Odd-even effects are also evident: for even-Z-odd-N nuclei, the SF half-lives are noticeably longer than those of even-even nuclei, whereas the$ \alpha $ -decay half-lives show much weaker sensitivity to these effects.To further assess the predictive power of the approach, we compare the calculated dominant decay modes with experimental data for 64 nuclei with
$ 103 \le Z \le 118 $ and$ 261 \le A \le 295 $ . This set comprises the nuclei for which at least one partial half-life of the two considered decay modes is experimentally known with sufficient accuracy for a quantitative comparison. The full comparison of the calculated and experimental half-lives and branching ratios is given in Table 1 of Appendix A, which also includes two additional nuclei for which only limits on the branching ratios are available. The predicted dominant decay mode agrees with experiment in 53 cases. The remaining 11 discrepancies are discussed below and grouped according to the predicted dominant mode.Nuclide $ Q_\alpha $ (MeV)$ T_{1/2}^{{{\rm{calc}}.}} $ $ b_{\alpha, \, {{\rm{calc}}.}} $ (%)$ b_{{\rm{SF}}, {\rm{calc}}.} $ (%)$ T_{1/2}^{\alpha, \, {{\rm{calc}}.}} $ (s)$ T_{1/2}^{{\rm{SF}}, {\rm{calc}}.} $ (s)$ T_{1/2}^{{{\rm{exp}}.}} $ $ b_{\alpha, \, {{\rm{exp}}.}} $ (%)$ b_{{\rm{SF}}, {\rm{exp}}.} $ (%)$ T_{1/2}^{\alpha, \, {{\rm{exp}}.}} $ (s)$ T_{1/2}^{{\rm{SF}}, {\rm{exp}}.} $ (s)References 261Lr 7.87 3.54 min 2.4 97.6 $ 8.8 \times 10^{3} $ $ 2.2 \times 10^{2} $ 39 min $ \approx 100 $ $ 2.3 \times 10^{3} $ [7] 262Lr 7.41 4.67 h 1.5 98.5 $ 1.1 \times 10^{6} $ $ 1.7 \times 10^{4} $ $ \approx 4 $ h$< 10 $ $> 1.4 \times 10^{5} $ [7] 264Lr 6.56 2.21 d 0.004 100.0 $ 4.6 \times 10^{9} $ $ 1.9 \times 10^{5} $ 4.8 h 100 $ 1.7 \times 10^{4} $ [11] 266Lr 7.42 15.6 h 5.6 94.4 $ 1.0 \times 10^{6} $ $ 6.0 \times 10^{4} $ 22 h 100 $ 7.9 \times 10^{4} $ [7] 263Rf 7.85 3.73 min 1.4 98.6 $ 1.6 \times 10^{4} $ $ 2.3 \times 10^{2} $ 5.1 s 100 5.1 [13] 265Rf 7.09 35.1 min 0.01 100.0 $ 1.4 \times 10^{7} $ $ 2.1 \times 10^{3} $ 1.6 min $ \approx 100 $ $ 9.6 \times 10^{1} $ [7] 267Rf 7.85 12.8 min 4.9 95.1 $ 1.6 \times 10^{4} $ $ 8.1 \times 10^{2} $ 2.5 h 100 $ 9.0 \times 10^{3} $ [7] 266Db 7.33 5.60 h 0.1 99.9 $ 1.4 \times 10^{7} $ $ 2.0 \times 10^{4} $ 11 min 100 $ 6.6 \times 10^{2} $ [11] 267Db 7.32 21.7 min 0.02 100.0 $ 6.6 \times 10^{6} $ $ 1.3 \times 10^{3} $ 1.4 h 100 $ 5.0 \times 10^{3} $ [11] 268Db 8.17 1.14 h 37.2 62.8 $ 1.1 \times 10^{4} $ $ 6.6 \times 10^{3} $ 16 h 51 49 $ 1.1 \times 10^{5} $ $ 1.2 \times 10^{5} $ [11] 270Db 8.15 1.80 h 49.9 50.1 $ 1.3 \times 10^{4} $ $ 1.3 \times 10^{4} $ 1.7 h $ \approx 13 $ $ \approx 87 $ $ 4.7 \times 10^{4} $ $ 7.0 \times 10^{3} $ [7] 267Sg $ 8.40^\ast $ 1.13 min 5.9 94.1 $ 1.1 \times 10^{3} $ $ 7.2 \times 10^{1} $ 1.8 min 17 83 $ 6.4 \times 10^{2} $ $ 1.3 \times 10^{2} $ [7] 268Sg 7.89 1.35 s 0.01 100.0 $ 2.5 \times 10^{4} $ 1.4 13 s 100 $ 1.3 \times 10^{1} $ [12] 269Sg $ 8.55^\ast $ 1.30 min 21.1 78.9 $ 3.7 \times 10^{2} $ $ 9.9 \times 10^{1} $ 13 min 87 13 $ 8.4 \times 10^{2} $ $ 5.8 \times 10^{3} $ [69] 271Sg 8.84 31.4 s 69.1 30.9 $ 4.5 \times 10^{1} $ $ 1.0 \times 10^{2} $ 31 s 73 27 $ 4.2 \times 10^{1} $ $ 1.1 \times 10^{2} $ [10] 270Bh 9.06 1.20 min 86.5 13.5 $ 8.3 \times 10^{1} $ $ 5.3 \times 10^{2} $ 3.8 min 100 $ 2.3 \times 10^{2} $ [7] 271Bh 9.42 2.69 s 83.2 16.8 3.2 $ 1.6 \times 10^{1} $ 2.90 s 100 2.9 [7] 272Bh 9.30 16.3 s 97.3 2.7 $ 1.7 \times 10^{1} $ $ 6.1 \times 10^{2} $ 8.8 s 100 8.8 [11] 274Bh 8.94 3.05 min 92.6 7.4 $ 2.0 \times 10^{2} $ $ 2.5 \times 10^{3} $ 57 s 100 $ 5.7 \times 10^{1} $ [7] 271Hs $ 9.48^\ast $ 2.15 s 71.2 28.8 3.0 7.5 46 s 100 $ 4.6 \times 10^{1} $ [13] 272Hs 9.77 22.8 ms 13.0 87.0 $ 1.7 \times 10^{-1} $ $ 2.6 \times 10^{-2} $ 0.16 s 100 $ 1.6 \times 10^{-1} $ [12] 273Hs 9.65 927 ms 90.6 9.4 1.0 9.9 0.51 s 100 $ 5.1 \times 10^{-1} $ [72] 275Hs 9.45 3.25 s 88.5 11.5 3.7 $ 2.8 \times 10^{1} $ 0.60 s $> 89 $ $< 11 $ $< 6.7 \times 10^{-1} $ $> 5.5 $ [10] 274Mt 11.01 3.48 ms 100.0 0.04 $ 3.5 \times 10^{-3} $ 9.1 850 ms 100 $ 8.5 \times 10^{-1} $ [7] 275Mt 10.48 24.5 ms 98.6 1.4 $ 2.5 \times 10^{-2} $ 1.7 31 ms 100 $ 3.1 \times 10^{-2} $ [7] 276Mt 10.10 543 ms 99.5 0.5 $ 5.5 \times 10^{-1} $ $ 1.2 \times 10^{2} $ 700 ms 100 $ 7.0 \times 10^{-1} $ [7] 277Mt 10.13 184 ms 97.3 2.7 $ 1.9 \times 10^{-1} $ 6.8 5 ms 100 $ 5.0 \times 10^{-3} $ [74] 278Mt 9.58 13.2 s 98.0 2.0 $ 1.3 \times 10^{1} $ $ 6.5 \times 10^{2} $ 6 s 100 6.0 [7] 275Ds 11.37 290 μs 99.8 0.2 $ 2.9 \times 10^{-4} $ $ 1.4 \times 10^{-1} $ 0.43 ms 100 $ 4.3 \times 10^{-4} $ [13] 276Ds 10.90 795 μs 67.5 32.5 $ 1.2 \times 10^{-3} $ $ 2.4 \times 10^{-3} $ 0.15 ms 43 57 $ 3.5 \times 10^{-4} $ $ 2.6 \times 10^{-4} $ [12] 277Ds 10.71 9.10 ms 99.2 0.8 $ 9.2 \times 10^{-3} $ 1.1 6 ms $ \approx 100 $ $ 6.0 \times 10^{-3} $ [7] 279Ds 9.83 1.42 s 89.0 11.0 1.6 $ 1.3 \times 10^{1} $ 210 ms 12 88 1.8 $ 2.4 \times 10^{-1} $ [7] 280Ds 9.91 58.3 ms 16.7 83.3 $ 3.5 \times 10^{-1} $ $ 7.0 \times 10^{-2} $ 25 ms 100 $ 2.5 \times 10^{-2} $ [7] 278Rg 10.85 34.7 ms 99.7 0.3 $ 3.5 \times 10^{-2} $ $ 1.3 \times 10^{1} $ 8 ms 100 $ 8.0 \times 10^{-3} $ [7] 279Rg 10.53 79.0 ms 95.0 5.0 $ 8.3 \times 10^{-2} $ 1.6 90 ms 87 13 $ 1.0 \times 10^{-1} $ $ 6.9 \times 10^{-1} $ [11] 280Rg 10.15 1.82 s 98.3 1.7 1.8 $ 1.0 \times 10^{2} $ 4.3 s 100 4.3 [7] 281Rg 10.36 209 ms 95.0 5.0 $ 2.2 \times 10^{-1} $ 4.2 11 s 14 86 $ 7.9 \times 10^{1} $ $ 1.3 \times 10^{1} $ [11] 282Rg 9.49 1.69 min 87.0 13.0 $ 1.2 \times 10^{2} $ $ 7.8 \times 10^{2} $ 130 s 100 $ 1.3 \times 10^{2} $ [7] 281Cn $ 10.42^\ast $ 187 ms 90.5 9.5 $ 2.1 \times 10^{-1} $ 2.0 0.19 s 91 9 $ 2.1 \times 10^{-1} $ 2.1 [69] 282Cn 10.69 4.99 ms 31.0 69.0 $ 1.6 \times 10^{-2} $ $ 7.2 \times 10^{-3} $ 1.1 ms $ \approx 100 $ $ 1.1 \times 10^{-3} $ [7] 283Cn 9.67 9.63 s 46.5 53.5 $ 2.1 \times 10^{1} $ $ 1.8 \times 10^{1} $ 3.81 s 94 6 4.1 $ 6.3 \times 10^{1} $ [10] 284Cn $ 9.46^\ast $ 178 ms 0.6 99.4 $ 3.0 \times 10^{1} $ $ 1.8 \times 10^{-1} $ 121 ms 2 98 6.0 $ 1.2 \times 10^{-1} $ [20] 282Nh 10.78 206 ms 98.6 1.4 $ 2.1 \times 10^{-1} $ $ 1.5 \times 10^{1} $ 61 ms 100 $ 6.1 \times 10^{-2} $ [11] 283Nh $ 10.36^\ast $ 677 ms 69.6 30.4 $ 9.7 \times 10^{-1} $ 2.2 123 ms 100 $ 1.2 \times 10^{-1} $ [11] 284Nh 10.28 3.61 s 95.4 4.6 3.8 $ 7.9 \times 10^{1} $ 0.90 s 100 $ 9.0 \times 10^{-1} $ [11] 285Nh 10.01 4.21 s 52.0 48.0 8.1 8.8 2.1 s 82 18 2.6 $ 1.2 \times 10^{1} $ [11] 286Nh 9.79 1.10 min 84.1 15.9 $ 7.9 \times 10^{1} $ $ 4.2 \times 10^{2} $ 12 s 100 $ 1.2 \times 10^{1} $ [7] 284Fl $ 10.76^\ast $ 3.09 ms 6.7 93.3 $ 4.6 \times 10^{-2} $ $ 3.3 \times 10^{-3} $ 2 ms $ \le 20 $ 100 $ \ge 8.0 \times 10^{-3} $ $ 2.0 \times 10^{-3} $ [23] 285Fl 10.56 313 ms 78.7 21.3 $ 4.0 \times 10^{-1} $ 1.5 210 ms $ \approx 100 $ $< 20 $ $ 2.1 \times 10^{-1} $ $> 1.0 $ [7] 286Fl 10.34 14.8 ms 2.7 97.3 $ 5.4 \times 10^{-1} $ $ 1.5 \times 10^{-2} $ 105 ms 55 45 $ 1.9 \times 10^{-1} $ $ 2.3 \times 10^{-1} $ [10] 287Fl 10.16 2.60 s 59.6 40.4 4.4 6.4 510 ms $ \approx 100 $ $ 5.1 \times 10^{-1} $ [7] 288Fl 10.08 48.5 ms 1.8 98.2 2.6 $ 4.9 \times 10^{-2} $ 653 ms $ \approx 100 $ $ 6.5 \times 10^{-1} $ [7] 286Mc 10.86 552 ms 95.6 4.4 $ 5.8 \times 10^{-1} $ $ 1.2 \times 10^{1} $ 20 ms 100 $ 2.0 \times 10^{-2} $ [11] 287Mc 10.76 293 ms 69.7 30.3 $ 4.2 \times 10^{-1} $ $ 9.7 \times 10^{-1} $ 60 ms 100 $ 6.0 \times 10^{-2} $ [7] 288Mc 10.65 1.81 s 95.0 5.0 1.9 $ 3.6 \times 10^{1} $ 177 ms 100 $ 1.8 \times 10^{-1} $ [7] 289Mc 10.49 1.23 s 61.7 38.3 2.0 3.2 410 ms 100 $ 4.1 \times 10^{-1} $ [7] 290Mc 10.41 7.24 s 93.6 6.4 7.7 $ 1.1 \times 10^{2} $ 840 ms 100 $ 8.4 \times 10^{-1} $ [7] 288Lv $ 11.24^\ast $ 1.11 ms 8.0 92.0 $ 1.4 \times 10^{-2} $ $ 1.2 \times 10^{-3} $ 2.0 ms 100 $ 2.0 \times 10^{-3} $ [70] 289Lv $ 11.06^\ast $ 85.0 ms 83.5 16.5 $ 1.0 \times 10^{-1} $ $ 5.2 \times 10^{-1} $ 12 ms 100 $ 1.2 \times 10^{-2} $ [69] 290Lv 11.00 3.55 ms 6.8 93.2 $ 5.2 \times 10^{-2} $ $ 3.8 \times 10^{-3} $ 9 ms $ \approx 100 $ $ 9.0 \times 10^{-3} $ [7] 291Lv 10.89 219 ms 84.2 15.8 $ 2.6 \times 10^{-1} $ 1.4 26 ms $ \approx 100 $ $ 2.6 \times 10^{-2} $ [7] 292Lv 10.79 10.4 ms 6.2 93.8 $ 1.7 \times 10^{-1} $ $ 1.1 \times 10^{-2} $ 16 ms $ \approx 100 $ $ 1.6 \times 10^{-2} $ [7] 293Ts 11.32 70.4 ms 87.5 12.5 $ 8.0 \times 10^{-2} $ $ 5.6 \times 10^{-1} $ 25 ms 100 $ 2.5 \times 10^{-2} $ [7] 294Ts 11.18 406 ms 98.2 1.8 $ 4.1 \times 10^{-1} $ $ 2.3 \times 10^{1} $ 70 ms 100 $ 7.0 \times 10^{-2} $ [7] 294Og 11.87 479 μs 22.1 77.9 $ 2.2 \times 10^{-3} $ $ 6.1 \times 10^{-4} $ 0.7 ms $ \approx 100 $ $ 7.0 \times 10^{-4} $ [7] 295Og 11.93 4.22 ms 97.3 2.7 $ 4.3 \times 10^{-3} $ $ 1.6 \times 10^{-1} $ 680 ms $ \approx 100 $ $ 6.8 \times 10^{-1} $ [7] Table 1. Comparison of calculated and experimental half-lives for 66 nuclei with atomic numbers
$ 103 \le Z \le 118 $ and neutron excesses$ 55 \le N-Z \le 60 $ . The first column lists the nucleus. The second column gives the$ Q_\alpha $ values; values in roman typeface are experimental data from Ref. [62], whereas values in italics are theoretical$ Q_\alpha $ values taken from Ref. [63].$ Q_\alpha $ values marked with an asterisk are taken from the reference listed in the last column. Columns 3 to 7 contain the calculated total half-life (considering only$ \alpha $ decay and SF), the$ \alpha $ -decay and SF branching ratios, and the corresponding partial half-lives$ T_{1/2}^{\alpha, \, {{\rm{calc}}.}} $ and$ T_{1/2}^{{\rm{SF}}, {\rm{calc}}.} $ . The partial$ \alpha $ -decay half-life is obtained using Eq. (1), and the SF half-life is obtained using Eq. (2). Columns 8 to 12 list the corresponding available experimental quantities: the total half-life$ T_{1/2}^{{{\rm{exp}}.}} $ , branching ratios$ b_{\alpha, \, {{\rm{exp}}.}} $ and$ b_{{\rm{SF}}, {\rm{exp}}.} $ , and partial half-lives$ T_{1/2}^{\alpha, \, {{\rm{exp}}.}} $ and$ T_{1/2}^{{\rm{SF}}, {\rm{exp}}.} $ . The last column provides references for the experimental data.For 277Mt and 279,281Rg,
$ \alpha $ decay is predicted to dominate. For 277Mt, only SF has been observed, whereas for 279Rg and 281Rg, the available experimental data on both modes indicate competition between$ \alpha $ decay and SF. Microscopic calculations of$ T_{1/2}^{{\rm{SF}}} $ are not available for these three nuclei. For 281Rg, the WS4 model [82, 83] gives$ Q_\alpha = 9.76 $ MeV, which is 0.60 MeV lower than the value used here, and the corresponding$ T_{1/2}^{\alpha,\,{{\rm{calc}}.}} = 8.4 $ s is only about one order of magnitude smaller than the experimental value$ T_{1/2}^{\alpha,\,{{\rm{exp}}.}} = 79 $ s. For 277Mt, all considered models [63, 81, 83] give$ T_{1/2}^{{\rm{SF}},\,{{\rm{calc}}.}} \sim 10 $ s, which is three to four orders of magnitude larger than$ T_{1/2}^{{\rm{SF}},\,{{\rm{exp}}.}} = 5.0 $ μs. For 279Rg, the values calculated with$ Q_\alpha^{{\rm{exp}}} $ favour$ \alpha $ decay but differ only by a factor of 19, which is still consistent with the experimentally observed competition.For 286,288Fl and 288,290,292Lv, SF is predicted to dominate. For 286Fl, the available experimental data on both modes indicate competition between
$ \alpha $ decay and SF, whereas for 288Fl and the Lv isotopes, only$ \alpha $ decay has been detected so far. The microscopic models show considerable disagreement for these nuclei when compared with the$ T_{1/2}^{\alpha} $ values calculated from$ Q_\alpha^{{\rm{exp}}} $ using Eq. (1). For 288Fl, Ref. [84] predicts SF dominance, whereas Refs. [36, 38] favour$ \alpha $ decay. For 286Fl and 288Lv, Ref. [39] predicts SF dominance, Refs. [36−38] favour$ \alpha $ decay, and Ref. [84] predicts competition. For 292Lv and 290Lv, Refs. [39, 84] predict competition, whereas Refs. [37, 38] favour$ \alpha $ decay. In particular, for 290Lv, Refs. [39] and [84] give$ T_{1/2}^{{\rm{SF}}} = 13 $ ms and 10 ms, respectively, which are comparable to the$ T_{1/2}^{\alpha} = 52 $ ms calculated from$ Q_\alpha^{{\rm{exp}}} $ using Eq. (1) and thus lead to the same competition between the two modes. In contrast, Refs. [37] and [38] give$ T_{1/2}^{{\rm{SF}}} = 12 $ min and 3 y, respectively, and therefore favour$ \alpha $ decay.For 272Hs, 283Cn, and 294Og, competition between
$ \alpha $ decay and SF is predicted. For 272Hs and 294Og, only$ \alpha $ decay has been observed, whereas for 283Cn, the available experimental data on both modes show$ \alpha $ -decay dominance. For 272Hs, Ref. [39] gives$ T_{1/2}^{{\rm{SF}}} = 66 $ ms, which is comparable to$ T_{1/2}^{\alpha} \left( Q_\alpha^{{\rm{exp}}} \right) = 170 $ ms and therefore also indicates competition, whereas Ref. [38] gives$ T_{1/2}^{{\rm{SF}}} = 9 $ days, which strongly favours$ \alpha $ decay. For 294Og, all four microscopic models [37−39, 84] predict$ \alpha $ -decay dominance when compared with the corresponding$ T_{1/2}^{\alpha} \left( Q_\alpha^{{\rm{exp}}} \right) $ value; in particular, Ref. [84] gives$ T_{1/2}^{{\rm{SF}}} = 3.2\times10^{-1} $ s, which is consistent with the experimentally observed$ \alpha $ decay. For 283Cn, no microscopic calculations of$ T_{1/2}^{{\rm{SF}}} $ have been reported. Nevertheless, the experimental values of the two half-lives differ by a factor of less than 16, so this observation does not contradict the competition predicted by the empirical formulas.The spread among the microscopic predictions of
$ T_{1/2}^{{\rm{SF}}} $ is substantial and exceeds ten orders of magnitude for several nuclei. For example, for 288Fl, the values of$ T_{1/2}^{{\rm{SF}}} $ are$ 8.7\times10^{-6} $ s [39],$ 2.4\times10^{6} $ s [38],$ 2.1\times10^{3} $ s [36], and$ 1.0\times10^{-2} $ s [84], spanning about twelve orders of magnitude. This spread makes it difficult to draw unambiguous conclusions about the dominant decay mode from any single microscopic prediction. Furthermore, the discrepancies in the predicted dominant decay modes may reflect the sensitivity of$ T_{1/2}^{\alpha} $ and$ T_{1/2}^{{\rm{SF}}} $ , calculated with Eqs. (1) and (2), respectively, to$ Q_\alpha $ and especially to variations in the predicted$ Q_\alpha $ values among different mass models.To assess the robustness of the predicted dominant decay modes against variations in the input
$ Q_\alpha $ values, we performed a sensitivity analysis by varying$ Q_\alpha $ by$ \pm \delta^{Q_\alpha} $ . For nuclei with an experimental$ Q_\alpha^{\rm{exp}} $ value, the calculations were performed using$ Q_\alpha^{\rm{exp}} $ and$ Q_\alpha^{\rm{exp}} \pm Q_\alpha^{{\rm{err}}} $ , where$ Q_\alpha^{{\rm{err}}} $ is the experimental uncertainty; thus,$ \delta^{Q_\alpha} = Q_\alpha^{{\rm{err}}} $ . Both$ Q_\alpha^{\rm{exp}} $ and$ Q_\alpha^{{\rm{err}}} $ were taken from Ref. [62]. For the remaining nuclei, for which only the theoretical$ Q_\alpha^{\rm{th}} $ value from Ref. [63] is available,$ Q_\alpha^{\rm{th}} $ was varied by$ \pm \delta_{\rm{rms}}^{Q_\alpha} = \pm 315 $ keV, so that$ \delta^{Q_\alpha} = \delta_{\rm{rms}}^{Q_\alpha} $ . The competition regime between$ \alpha $ decay and SF was defined by$ \left| \log_{10} \left( T_{1/2}^{\alpha} / T_{1/2}^{\rm{SF}} \right) \right| \le 1 $ . The complete set of predictions for all 108 nuclei in the region$ 103 \le Z \le 120 $ and$ 55 \le N-Z \le 60 $ is given in Table 2 in Appendix B.Nuclide $ Q_\alpha $ $ Q_\alpha $ $ Q_\alpha+\delta^{Q_\alpha} $ $ Q_\alpha-\delta^{Q_\alpha} $ Mode shift $ T_{1/2}^{\alpha} $ $ T_{1/2}^{{\rm{SF}}} $ Mode $ T_{1/2}^{\alpha} $ $ T_{1/2}^{{\rm{SF}}} $ Mode $ T_{1/2}^{\alpha} $ $ T_{1/2}^{{\rm{SF}}} $ Mode 261Lr 7.870 $ 8.8 \times 10^{3} $ $ 2.2 \times 10^{2} $ SF $ 7.2 \times 10^{2} $ $ 1.1 \times 10^{2} $ SF/ $ \alpha $ $ 1.3 \times 10^{5} $ $ 4.2 \times 10^{2} $ SF $ +\delta^{Q_\alpha} $ 262Lr 7.410 $ 1.1 \times 10^{6} $ $ 1.7 \times 10^{4} $ SF $ 7.1 \times 10^{4} $ $ 8.8 \times 10^{3} $ SF/ $ \alpha $ $ 2.0 \times 10^{7} $ $ 3.3 \times 10^{4} $ SF $ +\delta^{Q_\alpha} $ 263Lr 7.170 $ 4.1 \times 10^{6} $ $ 1.8 \times 10^{3} $ SF $ 2.3 \times 10^{5} $ $ 9.2 \times 10^{2} $ SF $ 8.8 \times 10^{7} $ $ 3.4 \times 10^{3} $ SF 264Lr 6.560 $ 4.6 \times 10^{9} $ $ 1.9 \times 10^{5} $ SF $ 1.7 \times 10^{8} $ $ 9.9 \times 10^{4} $ SF $ 1.5 \times 10^{11} $ $ 3.7 \times 10^{5} $ SF 265Lr 6.520 $ 2.9 \times 10^{9} $ $ 1.3 \times 10^{4} $ SF $ 1.1 \times 10^{8} $ $ 6.8 \times 10^{3} $ SF $ 1.0 \times 10^{11} $ $ 2.5 \times 10^{4} $ SF 266Lr 7.420 $ 1.0 \times 10^{6} $ $ 6.0 \times 10^{4} $ SF $ 6.5 \times 10^{4} $ $ 3.1 \times 10^{4} $ SF/ $ \alpha $ $ 1.8 \times 10^{7} $ $ 1.2 \times 10^{5} $ SF $ +\delta^{Q_\alpha} $ 263Rf 7.850 $ 1.6 \times 10^{4} $ $ 2.3 \times 10^{2} $ SF $ 1.3 \times 10^{3} $ $ 1.2 \times 10^{2} $ SF $ 2.3 \times 10^{5} $ $ 4.4 \times 10^{2} $ SF 264Rf 7.650 $ 3.1 \times 10^{4} $ 2.2 SF $ 2.2 \times 10^{3} $ 1.2 SF $ 5.1 \times 10^{5} $ 4.3 SF 265Rf 7.090 $ 1.4 \times 10^{7} $ $ 2.1 \times 10^{3} $ SF $ 7.4 \times 10^{5} $ $ 1.1 \times 10^{3} $ SF $ 3.3 \times 10^{8} $ $ 4.1 \times 10^{3} $ SF 266Rf 7.050 $ 7.6 \times 10^{6} $ $ 1.5 \times 10^{1} $ SF $ 3.9 \times 10^{5} $ 7.7 SF $ 1.8 \times 10^{8} $ $ 2.9 \times 10^{1} $ SF 267Rf 7.850 $ 1.6 \times 10^{4} $ $ 8.1 \times 10^{2} $ SF $ 1.3 \times 10^{3} $ $ 4.2 \times 10^{2} $ SF/ $ \alpha $ $ 2.3 \times 10^{5} $ $ 1.6 \times 10^{3} $ SF $ +\delta^{Q_\alpha} $ 268Rf 7.760 $ 1.2 \times 10^{4} $ 6.3 SF $ 9.3 \times 10^{2} $ 3.3 SF $ 1.9 \times 10^{5} $ $ 1.2 \times 10^{1} $ SF 265Db 7.800 $ 9.4 \times 10^{4} $ $ 2.5 \times 10^{2} $ SF $ 7.1 \times 10^{3} $ $ 1.3 \times 10^{2} $ SF $ 1.5 \times 10^{6} $ $ 4.9 \times 10^{2} $ SF 266Db 7.330 $ 1.4 \times 10^{7} $ $ 2.0 \times 10^{4} $ SF $ 8.5 \times 10^{5} $ $ 1.0 \times 10^{4} $ SF $ 3.0 \times 10^{8} $ $ 3.9 \times 10^{4} $ SF 267Db 7.320 $ 6.6 \times 10^{6} $ $ 1.3 \times 10^{3} $ SF $ 3.9 \times 10^{5} $ $ 6.7 \times 10^{2} $ SF $ 1.3 \times 10^{8} $ $ 2.5 \times 10^{3} $ SF 268Db 8.170 $ 1.1 \times 10^{4} $ $ 6.6 \times 10^{3} $ SF/ $ \alpha $ $ 9.9 \times 10^{2} $ $ 3.4 \times 10^{3} $ $ \alpha $ /SF$ 1.4 \times 10^{5} $ $ 1.3 \times 10^{4} $ SF $ -\delta^{Q_\alpha} $ 269Db 8.100 $ 8.0 \times 10^{3} $ $ 4.8 \times 10^{2} $ SF $ 7.0 \times 10^{2} $ $ 2.5 \times 10^{2} $ SF/ $ \alpha $ $ 1.1 \times 10^{5} $ $ 9.3 \times 10^{2} $ SF $ +\delta^{Q_\alpha} $ 270Db 8.150 $ 1.3 \times 10^{4} $ $ 1.3 \times 10^{4} $ SF/ $ \alpha $ $ 1.2 \times 10^{3} $ $ 6.7 \times 10^{3} $ $ \alpha $ /SF$ 1.7 \times 10^{5} $ $ 2.5 \times 10^{4} $ SF/ $ \alpha $ 267Sg $ 8.400 \pm 0.050 $ $ 1.1 \times 10^{3} $ $ 7.2 \times 10^{1} $ SF $ 7.8 \times 10^{2} $ $ 6.5 \times 10^{1} $ SF $ 1.7 \times 10^{3} $ $ 8.0 \times 10^{1} $ SF 268Sg 7.890 $ 2.5 \times 10^{4} $ 1.4 SF $ 1.9 \times 10^{3} $ $ 7.0 \times 10^{-1} $ SF $ 3.7 \times 10^{5} $ 2.6 SF 269Sg $ 8.550 \pm 0.013 $ $ 3.7 \times 10^{2} $ $ 9.9 \times 10^{1} $ SF/ $ \alpha $ $ 3.4 \times 10^{2} $ $ 9.6 \times 10^{1} $ SF/ $ \alpha $ $ 4.1 \times 10^{2} $ $ 1.0 \times 10^{2} $ SF/ $ \alpha $ 270Sg 8.740 $ 3.4 \times 10^{1} $ $ 4.3 \times 10^{-1} $ SF 3.7 $ 2.2 \times 10^{-1} $ SF $ 3.5 \times 10^{2} $ $ 8.3 \times 10^{-1} $ SF 271Sg 8.840 $ 4.5 \times 10^{1} $ $ 1.0 \times 10^{2} $ $ \alpha $ /SF5.2 $ 5.3 \times 10^{1} $ $ \alpha $ $ 4.5 \times 10^{2} $ $ 2.0 \times 10^{2} $ SF/ $ \alpha $ $ +\delta^{Q_\alpha} $ 272Sg 8.500 $ 2.0 \times 10^{2} $ 1.3 SF $ 2.0 \times 10^{1} $ $ 6.9 \times 10^{-1} $ SF $ 2.2 \times 10^{3} $ 2.6 SF 269Bh 8.260 $ 1.3 \times 10^{4} $ $ 9.6 \times 10^{1} $ SF $ 1.1 \times 10^{3} $ $ 5.0 \times 10^{1} $ SF $ 1.6 \times 10^{5} $ $ 1.9 \times 10^{2} $ SF 270Bh $ 9.064 \pm 0.095 $ $ 8.3 \times 10^{1} $ $ 5.3 \times 10^{2} $ $ \alpha $ /SF$ 4.4 \times 10^{1} $ $ 4.4 \times 10^{2} $ $ \alpha $ $ 1.6 \times 10^{2} $ $ 6.5 \times 10^{2} $ $ \alpha $ /SF$ +\delta^{Q_\alpha} $ 271Bh $ 9.420 \pm 0.086 $ 3.2 $ 1.6 \times 10^{1} $ $ \alpha $ /SF1.9 $ 1.3 \times 10^{1} $ $ \alpha $ /SF5.7 $ 1.9 \times 10^{1} $ $ \alpha $ /SF272Bh $ 9.303 \pm 0.054 $ $ 1.7 \times 10^{1} $ $ 6.1 \times 10^{2} $ $ \alpha $ $ 1.2 \times 10^{1} $ $ 5.5 \times 10^{2} $ $ \alpha $ $ 2.4 \times 10^{1} $ $ 6.8 \times 10^{2} $ $ \alpha $ 273Bh 8.830 $ 1.8 \times 10^{2} $ $ 1.0 \times 10^{2} $ SF/ $ \alpha $ $ 2.0 \times 10^{1} $ $ 5.4 \times 10^{1} $ $ \alpha $ /SF$ 1.8 \times 10^{3} $ $ 2.0 \times 10^{2} $ SF/ $ \alpha $ 274Bh $ 8.940 \pm 0.060 $ $ 2.0 \times 10^{2} $ $ 2.5 \times 10^{3} $ $ \alpha $ $ 1.3 \times 10^{2} $ $ 2.2 \times 10^{3} $ $ \alpha $ $ 3.0 \times 10^{2} $ $ 2.8 \times 10^{3} $ $ \alpha $ /SF$ -\delta^{Q_\alpha} $ 271Hs $ 9.480 \pm 0.020 $ 3.0 7.5 $ \alpha $ /SF2.7 7.2 $ \alpha $ /SF3.4 7.8 $ \alpha $ /SF272Hs $ 9.772 \pm 0.021 $ $ 1.7 \times 10^{-1} $ $ 2.6 \times 10^{-2} $ SF/ $ \alpha $ $ 1.5 \times 10^{-1} $ $ 2.5 \times 10^{-2} $ SF/ $ \alpha $ $ 2.0 \times 10^{-1} $ $ 2.7 \times 10^{-2} $ SF/ $ \alpha $ 273Hs $ 9.650 \pm 0.064 $ 1.0 9.9 $ \alpha $ /SF$ 6.9 \times 10^{-1} $ 8.6 $ \alpha $ 1.5 $ 1.1 \times 10^{1} $ $ \alpha $ /SF$ +\delta^{Q_\alpha} $ 274Hs 9.560 $ 6.6 \times 10^{-1} $ $ 7.7 \times 10^{-2} $ SF/ $ \alpha $ $ 9.3 \times 10^{-2} $ $ 4.0 \times 10^{-2} $ SF/ $ \alpha $ 5.2 $ 1.5 \times 10^{-1} $ SF $ -\delta^{Q_\alpha} $ 275Hs $ 9.450 \pm 0.054 $ 3.7 $ 2.8 \times 10^{1} $ $ \alpha $ /SF2.6 $ 2.5 \times 10^{1} $ $ \alpha $ /SF5.2 $ 3.2 \times 10^{1} $ $ \alpha $ /SF276Hs 9.190 7.5 $ 3.2 \times 10^{-1} $ SF $ 9.4 \times 10^{-1} $ $ 1.6 \times 10^{-1} $ SF/ $ \alpha $ $ 6.7 \times 10^{1} $ $ 6.1 \times 10^{-1} $ SF $ +\delta^{Q_\alpha} $ 273Mt 11.110 $ 8.6 \times 10^{-4} $ $ 2.5 \times 10^{-1} $ $ \alpha $ $ 1.8 \times 10^{-4} $ $ 1.3 \times 10^{-1} $ $ \alpha $ $ 4.5 \times 10^{-3} $ $ 4.8 \times 10^{-1} $ $ \alpha $ 274Mt 11.010 $ 3.5 \times 10^{-3} $ 9.1 $ \alpha $ $ 7.0 \times 10^{-4} $ 4.7 $ \alpha $ $ 1.9 \times 10^{-2} $ $ 1.8 \times 10^{1} $ $ \alpha $ 275Mt $ 10.483 \pm 0.051 $ $ 2.5 \times 10^{-2} $ 1.7 $ \alpha $ $ 1.9 \times 10^{-2} $ 1.6 $ \alpha $ $ 3.3 \times 10^{-2} $ 1.9 $ \alpha $ 276Mt $ 10.100 \pm 0.010 $ $ 5.5 \times 10^{-1} $ $ 1.2 \times 10^{2} $ $ \alpha $ $ 5.1 \times 10^{-1} $ $ 1.1 \times 10^{2} $ $ \alpha $ $ 5.8 \times 10^{-1} $ $ 1.2 \times 10^{2} $ $ \alpha $ 277Mt 10.130 $ 1.9 \times 10^{-1} $ 6.8 $ \alpha $ $ 3.1 \times 10^{-2} $ 3.5 $ \alpha $ 1.3 $ 1.3 \times 10^{1} $ $ \alpha $ 278Mt $ 9.580 \pm 0.030 $ $ 1.3 \times 10^{1} $ $ 6.5 \times 10^{2} $ $ \alpha $ $ 1.1 \times 10^{1} $ $ 6.1 \times 10^{2} $ $ \alpha $ $ 1.6 \times 10^{1} $ $ 6.9 \times 10^{2} $ $ \alpha $ 275Ds $ 11.370 \pm 0.020 $ $ 2.9 \times 10^{-4} $ $ 1.4 \times 10^{-1} $ $ \alpha $ $ 2.6 \times 10^{-4} $ $ 1.4 \times 10^{-1} $ $ \alpha $ $ 3.2 \times 10^{-4} $ $ 1.5 \times 10^{-1} $ $ \alpha $ 276Ds $ 10.904 \pm 0.028 $ $ 1.2 \times 10^{-3} $ $ 2.4 \times 10^{-3} $ $ \alpha $ /SF$ 1.0 \times 10^{-3} $ $ 2.3 \times 10^{-3} $ $ \alpha $ /SF$ 1.4 \times 10^{-3} $ $ 2.6 \times 10^{-3} $ $ \alpha $ /SF277Ds $ 10.710 \pm 0.040 $ $ 9.2 \times 10^{-3} $ 1.1 $ \alpha $ $ 7.4 \times 10^{-3} $ $ 9.9 \times 10^{-1} $ $ \alpha $ $ 1.1 \times 10^{-2} $ 1.2 $ \alpha $ 278Ds 10.550 $ 8.1 \times 10^{-3} $ $ 9.7 \times 10^{-3} $ $ \alpha $ /SF$ 1.4 \times 10^{-3} $ $ 5.0 \times 10^{-3} $ $ \alpha $ /SF$ 4.9 \times 10^{-2} $ $ 1.9 \times 10^{-2} $ SF/ $ \alpha $ 279Ds $ 9.827 \pm 0.015 $ 1.6 $ 1.3 \times 10^{1} $ $ \alpha $ /SF1.4 $ 1.2 \times 10^{1} $ $ \alpha $ /SF1.7 $ 1.3 \times 10^{1} $ $ \alpha $ /SF280Ds 9.910 $ 3.5 \times 10^{-1} $ $ 7.0 \times 10^{-2} $ SF/ $ \alpha $ $ 5.2 \times 10^{-2} $ $ 3.6 \times 10^{-2} $ SF/ $ \alpha $ 2.5 $ 1.4 \times 10^{-1} $ SF $ -\delta^{Q_\alpha} $ 277Rg 11.640 $ 2.4 \times 10^{-4} $ $ 8.1 \times 10^{-2} $ $ \alpha $ $ 5.4 \times 10^{-5} $ $ 4.2 \times 10^{-2} $ $ \alpha $ $ 1.2 \times 10^{-3} $ $ 1.6 \times 10^{-1} $ $ \alpha $ 278Rg $ 10.846 \pm 0.095 $ $ 3.5 \times 10^{-2} $ $ 1.3 \times 10^{1} $ $ \alpha $ $ 2.1 \times 10^{-2} $ $ 1.0 \times 10^{1} $ $ \alpha $ $ 5.9 \times 10^{-2} $ $ 1.6 \times 10^{1} $ $ \alpha $ 279Rg $ 10.530 \pm 0.168 $ $ 8.3 \times 10^{-2} $ 1.6 $ \alpha $ $ 3.3 \times 10^{-2} $ 1.1 $ \alpha $ $ 2.2 \times 10^{-1} $ 2.2 $ \alpha $ 280Rg $ 10.149 \pm 0.010 $ 1.8 $ 1.0 \times 10^{2} $ $ \alpha $ 1.7 $ 1.0 \times 10^{2} $ $ \alpha $ 2.0 $ 1.1 \times 10^{2} $ $ \alpha $ 281Rg 10.360 $ 2.2 \times 10^{-1} $ 4.2 $ \alpha $ $ 3.7 \times 10^{-2} $ 2.2 $ \alpha $ 1.4 8.2 $ \alpha $ /SF$ -\delta^{Q_\alpha} $ 282Rg 9.490 $ 1.2 \times 10^{2} $ $ 7.8 \times 10^{2} $ $ \alpha $ /SF$ 1.5 \times 10^{1} $ $ 4.0 \times 10^{2} $ $ \alpha $ $ 9.9 \times 10^{2} $ $ 1.5 \times 10^{3} $ $ \alpha $ /SF$ +\delta^{Q_\alpha} $ 279Cn 11.450 $ 7.8 \times 10^{-4} $ $ 1.2 \times 10^{-1} $ $ \alpha $ $ 1.7 \times 10^{-4} $ $ 6.2 \times 10^{-2} $ $ \alpha $ $ 4.0 \times 10^{-3} $ $ 2.3 \times 10^{-1} $ $ \alpha $ 280Cn 11.390 $ 3.9 \times 10^{-4} $ $ 8.8 \times 10^{-4} $ $ \alpha $ /SF$ 8.1 \times 10^{-5} $ $ 4.6 \times 10^{-4} $ $ \alpha $ /SF$ 2.0 \times 10^{-3} $ $ 1.7 \times 10^{-3} $ SF/ $ \alpha $ 281Cn $ 10.418 \pm 0.017 $ $ 2.1 \times 10^{-1} $ 2.0 $ \alpha $ /SF$ 1.9 \times 10^{-1} $ 1.9 $ \alpha $ $ 2.3 \times 10^{-1} $ 2.0 $ \alpha $ /SF$ +\delta^{Q_\alpha} $ 282Cn 10.690 $ 1.6 \times 10^{-2} $ $ 7.2 \times 10^{-3} $ SF/ $ \alpha $ $ 2.9 \times 10^{-3} $ $ 3.7 \times 10^{-3} $ $ \alpha $ /SF$ 9.7 \times 10^{-2} $ $ 1.4 \times 10^{-2} $ SF/ $ \alpha $ 283Cn $ 9.667 \pm 0.015 $ $ 2.1 \times 10^{1} $ $ 1.8 \times 10^{1} $ SF/ $ \alpha $ $ 1.9 \times 10^{1} $ $ 1.7 \times 10^{1} $ SF/ $ \alpha $ $ 2.3 \times 10^{1} $ $ 1.9 \times 10^{1} $ SF/ $ \alpha $ 284Cn $ 9.460 \pm 0.010 $ $ 3.0 \times 10^{1} $ $ 1.8 \times 10^{-1} $ SF $ 2.8 \times 10^{1} $ $ 1.8 \times 10^{-1} $ SF $ 3.2 \times 10^{1} $ $ 1.8 \times 10^{-1} $ SF 281Nh 11.560 $ 1.4 \times 10^{-3} $ $ 9.6 \times 10^{-2} $ $ \alpha $ $ 3.1 \times 10^{-4} $ $ 5.0 \times 10^{-2} $ $ \alpha $ $ 7.2 \times 10^{-3} $ $ 1.9 \times 10^{-1} $ $ \alpha $ 282Nh $ 10.783 \pm 0.095 $ $ 2.1 \times 10^{-1} $ $ 1.5 \times 10^{1} $ $ \alpha $ $ 1.2 \times 10^{-1} $ $ 1.2 \times 10^{1} $ $ \alpha $ $ 3.6 \times 10^{-1} $ $ 1.8 \times 10^{1} $ $ \alpha $ 283Nh $ 10.360 \pm 0.042 $ $ 9.7 \times 10^{-1} $ 2.2 $ \alpha $ /SF$ 7.6 \times 10^{-1} $ 2.0 $ \alpha $ /SF1.2 2.4 $ \alpha $ /SF284Nh $ 10.280 \pm 0.038 $ 3.8 $ 7.9 \times 10^{1} $ $ \alpha $ 3.0 $ 7.3 \times 10^{1} $ $ \alpha $ 4.8 $ 8.6 \times 10^{1} $ $ \alpha $ 285Nh $ 10.010 \pm 0.040 $ 8.1 8.8 $ \alpha $ /SF6.3 8.1 $ \alpha $ /SF$ 1.0 \times 10^{1} $ 9.5 SF/ $ \alpha $ 286Nh $ 9.790 \pm 0.050 $ $ 7.9 \times 10^{1} $ $ 4.2 \times 10^{2} $ $ \alpha $ /SF$ 5.7 \times 10^{1} $ $ 3.7 \times 10^{2} $ $ \alpha $ /SF$ 1.1 \times 10^{2} $ $ 4.6 \times 10^{2} $ $ \alpha $ /SF283Fl 11.800 $ 5.5 \times 10^{-4} $ $ 5.8 \times 10^{-2} $ $ \alpha $ $ 1.2 \times 10^{-4} $ $ 3.0 \times 10^{-2} $ $ \alpha $ $ 2.6 \times 10^{-3} $ $ 1.1 \times 10^{-1} $ $ \alpha $ 284Fl $ 10.760 \pm 0.100 $ $ 4.6 \times 10^{-2} $ $ 3.3 \times 10^{-3} $ SF $ 2.7 \times 10^{-2} $ $ 2.7 \times 10^{-3} $ SF/ $ \alpha $ $ 8.2 \times 10^{-2} $ $ 4.1 \times 10^{-3} $ SF $ +\delta^{Q_\alpha} $ 285Fl $ 10.560 \pm 0.071 $ $ 4.0 \times 10^{-1} $ 1.5 $ \alpha $ /SF$ 2.6 \times 10^{-1} $ 1.3 $ \alpha $ /SF$ 6.0 \times 10^{-1} $ 1.7 $ \alpha $ /SF286Fl $ 10.335 \pm 0.010 $ $ 5.4 \times 10^{-1} $ $ 1.5 \times 10^{-2} $ SF $ 5.1 \times 10^{-1} $ $ 1.5 \times 10^{-2} $ SF $ 5.8 \times 10^{-1} $ $ 1.6 \times 10^{-2} $ SF 287Fl $ 10.157 \pm 0.010 $ 4.4 6.4 $ \alpha $ /SF4.1 6.3 $ \alpha $ /SF4.6 6.6 $ \alpha $ /SF288Fl $ 10.076 \pm 0.012 $ 2.6 $ 4.9 \times 10^{-2} $ SF 2.4 $ 4.8 \times 10^{-2} $ SF 2.8 $ 5.1 \times 10^{-2} $ SF 285Mc 11.830 $ 1.5 \times 10^{-3} $ $ 5.4 \times 10^{-2} $ $ \alpha $ $ 3.3 \times 10^{-4} $ $ 2.8 \times 10^{-2} $ $ \alpha $ $ 7.2 \times 10^{-3} $ $ 1.1 \times 10^{-1} $ $ \alpha $ 286Mc $ 10.860 \pm 0.020 $ $ 5.8 \times 10^{-1} $ $ 1.2 \times 10^{1} $ $ \alpha $ $ 5.2 \times 10^{-1} $ $ 1.2 \times 10^{1} $ $ \alpha $ $ 6.5 \times 10^{-1} $ $ 1.3 \times 10^{1} $ $ \alpha $ 287Mc $ 10.760 \pm 0.071 $ $ 4.2 \times 10^{-1} $ $ 9.7 \times 10^{-1} $ $ \alpha $ /SF$ 2.8 \times 10^{-1} $ $ 8.3 \times 10^{-1} $ $ \alpha $ /SF$ 6.3 \times 10^{-1} $ 1.1 $ \alpha $ /SF288Mc $ 10.650 \pm 0.050 $ 1.9 $ 3.6 \times 10^{1} $ $ \alpha $ 1.4 $ 3.3 \times 10^{1} $ $ \alpha $ 2.5 $ 4.0 \times 10^{1} $ $ \alpha $ 289Mc $ 10.490 \pm 0.050 $ 2.0 3.2 $ \alpha $ /SF1.5 2.9 $ \alpha $ /SF2.7 3.6 $ \alpha $ /SF290Mc $ 10.410 \pm 0.040 $ 7.7 $ 1.1 \times 10^{2} $ $ \alpha $ 6.1 $ 1.0 \times 10^{2} $ $ \alpha $ 9.8 $ 1.2 \times 10^{2} $ $ \alpha $ 287Lv 11.570 $ 6.8 \times 10^{-3} $ $ 9.4 \times 10^{-2} $ $ \alpha $ $ 1.4 \times 10^{-3} $ $ 4.8 \times 10^{-2} $ $ \alpha $ $ 3.5 \times 10^{-2} $ $ 1.8 \times 10^{-1} $ $ \alpha $ /SF$ -\delta^{Q_\alpha} $ 288Lv $ 11.240 \pm 0.015 $ $ 1.4 \times 10^{-2} $ $ 1.2 \times 10^{-3} $ SF $ 1.3 \times 10^{-2} $ $ 1.2 \times 10^{-3} $ SF $ 1.5 \times 10^{-2} $ $ 1.3 \times 10^{-3} $ SF 289Lv $ 11.059 \pm 0.013 $ $ 1.0 \times 10^{-1} $ $ 5.2 \times 10^{-1} $ $ \alpha $ /SF$ 9.5 \times 10^{-2} $ $ 5.0 \times 10^{-1} $ $ \alpha $ /SF$ 1.1 \times 10^{-1} $ $ 5.3 \times 10^{-1} $ $ \alpha $ /SF290Lv $ 10.997 \pm 0.058 $ $ 5.2 \times 10^{-2} $ $ 3.8 \times 10^{-3} $ SF $ 3.8 \times 10^{-2} $ $ 3.4 \times 10^{-3} $ SF $ 7.2 \times 10^{-2} $ $ 4.3 \times 10^{-3} $ SF 291Lv $ 10.890 \pm 0.086 $ $ 2.6 \times 10^{-1} $ 1.4 $ \alpha $ /SF$ 1.6 \times 10^{-1} $ 1.2 $ \alpha $ /SF$ 4.2 \times 10^{-1} $ 1.7 $ \alpha $ /SF292Lv $ 10.791 \pm 0.012 $ $ 1.7 \times 10^{-1} $ $ 1.1 \times 10^{-2} $ SF $ 1.5 \times 10^{-1} $ $ 1.1 \times 10^{-2} $ SF $ 1.8 \times 10^{-1} $ $ 1.1 \times 10^{-2} $ SF 289Ts 12.080 $ 1.7 \times 10^{-3} $ $ 3.2 \times 10^{-2} $ $ \alpha $ $ 3.8 \times 10^{-4} $ $ 1.7 \times 10^{-2} $ $ \alpha $ $ 8.0 \times 10^{-3} $ $ 6.2 \times 10^{-2} $ $ \alpha $ /SF$ -\delta^{Q_\alpha} $ 290Ts 11.840 $ 1.3 \times 10^{-2} $ 1.6 $ \alpha $ $ 2.9 \times 10^{-3} $ $ 8.2 \times 10^{-1} $ $ \alpha $ $ 6.6 \times 10^{-2} $ 3.1 $ \alpha $ 291Ts 11.730 $ 9.6 \times 10^{-3} $ $ 1.3 \times 10^{-1} $ $ \alpha $ $ 2.0 \times 10^{-3} $ $ 6.5 \times 10^{-2} $ $ \alpha $ $ 4.9 \times 10^{-2} $ $ 2.4 \times 10^{-1} $ $ \alpha $ /SF$ -\delta^{Q_\alpha} $ 292Ts 11.470 $ 8.8 \times 10^{-2} $ 6.5 $ \alpha $ $ 1.8 \times 10^{-2} $ 3.4 $ \alpha $ $ 4.7 \times 10^{-1} $ $ 1.3 \times 10^{1} $ $ \alpha $ 293Ts $ 11.320 \pm 0.050 $ $ 8.0 \times 10^{-2} $ $ 5.6 \times 10^{-1} $ $ \alpha $ /SF$ 6.2 \times 10^{-2} $ $ 5.1 \times 10^{-1} $ $ \alpha $ /SF$ 1.1 \times 10^{-1} $ $ 6.3 \times 10^{-1} $ $ \alpha $ /SF294Ts $ 11.180 \pm 0.040 $ $ 4.1 \times 10^{-1} $ $ 2.3 \times 10^{1} $ $ \alpha $ $ 3.3 \times 10^{-1} $ $ 2.1 \times 10^{1} $ $ \alpha $ $ 5.1 \times 10^{-1} $ $ 2.5 \times 10^{1} $ $ \alpha $ 291Og 12.420 $ 4.1 \times 10^{-4} $ $ 1.6 \times 10^{-2} $ $ \alpha $ $ 9.6 \times 10^{-5} $ $ 8.2 \times 10^{-3} $ $ \alpha $ $ 1.8 \times 10^{-3} $ $ 3.1 \times 10^{-2} $ $ \alpha $ 292Og 12.280 $ 2.9 \times 10^{-4} $ $ 1.4 \times 10^{-4} $ SF/ $ \alpha $ $ 6.7 \times 10^{-5} $ $ 7.1 \times 10^{-5} $ $ \alpha $ /SF$ 1.3 \times 10^{-3} $ $ 2.7 \times 10^{-4} $ SF/ $ \alpha $ 293Og 12.020 $ 2.8 \times 10^{-3} $ $ 6.9 \times 10^{-2} $ $ \alpha $ $ 6.1 \times 10^{-4} $ $ 3.6 \times 10^{-2} $ $ \alpha $ $ 1.3 \times 10^{-2} $ $ 1.3 \times 10^{-1} $ $ \alpha $ /SF$ -\delta^{Q_\alpha} $ 294Og $ 11.867 \pm 0.031 $ $ 2.2 \times 10^{-3} $ $ 6.1 \times 10^{-4} $ SF/ $ \alpha $ $ 1.9 \times 10^{-3} $ $ 5.8 \times 10^{-4} $ SF/ $ \alpha $ $ 2.5 \times 10^{-3} $ $ 6.6 \times 10^{-4} $ SF/ $ \alpha $ 295Og 11.930 $ 4.3 \times 10^{-3} $ $ 1.6 \times 10^{-1} $ $ \alpha $ $ 9.4 \times 10^{-4} $ $ 8.1 \times 10^{-2} $ $ \alpha $ $ 2.1 \times 10^{-2} $ $ 3.0 \times 10^{-1} $ $ \alpha $ 296Og 11.920 $ 1.7 \times 10^{-3} $ $ 1.0 \times 10^{-3} $ SF/ $ \alpha $ $ 3.6 \times 10^{-4} $ $ 5.4 \times 10^{-4} $ $ \alpha $ /SF$ 8.2 \times 10^{-3} $ $ 2.0 \times 10^{-3} $ SF/ $ \alpha $ 293119 12.590 $ 5.7 \times 10^{-4} $ $ 1.1 \times 10^{-2} $ $ \alpha $ $ 1.4 \times 10^{-4} $ $ 5.7 \times 10^{-3} $ $ \alpha $ $ 2.5 \times 10^{-3} $ $ 2.1 \times 10^{-2} $ $ \alpha $ /SF$ -\delta^{Q_\alpha} $ 294119 12.410 $ 3.2 \times 10^{-3} $ $ 4.8 \times 10^{-1} $ $ \alpha $ $ 7.4 \times 10^{-4} $ $ 2.5 \times 10^{-1} $ $ \alpha $ $ 1.5 \times 10^{-2} $ $ 9.3 \times 10^{-1} $ $ \alpha $ 295119 12.510 $ 8.3 \times 10^{-4} $ $ 2.5 \times 10^{-2} $ $ \alpha $ $ 2.0 \times 10^{-4} $ $ 1.3 \times 10^{-2} $ $ \alpha $ $ 3.7 \times 10^{-3} $ $ 4.8 \times 10^{-2} $ $ \alpha $ 296119 12.750 $ 6.6 \times 10^{-4} $ $ 4.5 \times 10^{-1} $ $ \alpha $ $ 1.6 \times 10^{-4} $ $ 2.3 \times 10^{-1} $ $ \alpha $ $ 2.8 \times 10^{-3} $ $ 8.7 \times 10^{-1} $ $ \alpha $ 297119 12.650 $ 4.3 \times 10^{-4} $ $ 3.5 \times 10^{-2} $ $ \alpha $ $ 1.1 \times 10^{-4} $ $ 1.8 \times 10^{-2} $ $ \alpha $ $ 1.9 \times 10^{-3} $ $ 6.7 \times 10^{-2} $ $ \alpha $ 298119 13.160 $ 1.1 \times 10^{-4} $ $ 3.6 \times 10^{-1} $ $ \alpha $ $ 2.8 \times 10^{-5} $ $ 1.8 \times 10^{-1} $ $ \alpha $ $ 4.3 \times 10^{-4} $ $ 6.9 \times 10^{-1} $ $ \alpha $ 295120 13.120 $ 6.3 \times 10^{-5} $ $ 3.6 \times 10^{-3} $ $ \alpha $ $ 1.6 \times 10^{-5} $ $ 1.9 \times 10^{-3} $ $ \alpha $ $ 2.6 \times 10^{-4} $ $ 7.1 \times 10^{-3} $ $ \alpha $ 296120 13.240 $ 1.4 \times 10^{-5} $ $ 1.8 \times 10^{-5} $ $ \alpha $ /SF$ 3.6 \times 10^{-6} $ $ 9.5 \times 10^{-6} $ $ \alpha $ /SF$ 5.4 \times 10^{-5} $ $ 3.6 \times 10^{-5} $ SF/ $ \alpha $ 297120 13.300 $ 2.9 \times 10^{-5} $ $ 4.7 \times 10^{-3} $ $ \alpha $ $ 7.6 \times 10^{-6} $ $ 2.4 \times 10^{-3} $ $ \alpha $ $ 1.1 \times 10^{-4} $ $ 9.1 \times 10^{-3} $ $ \alpha $ 298120 13.140 $ 2.1 \times 10^{-5} $ $ 4.3 \times 10^{-5} $ $ \alpha $ /SF$ 5.4 \times 10^{-6} $ $ 2.2 \times 10^{-5} $ $ \alpha $ /SF$ 8.5 \times 10^{-5} $ $ 8.3 \times 10^{-5} $ SF/ $ \alpha $ 299120 13.550 $ 1.0 \times 10^{-5} $ $ 5.3 \times 10^{-3} $ $ \alpha $ $ 2.8 \times 10^{-6} $ $ 2.7 \times 10^{-3} $ $ \alpha $ $ 3.8 \times 10^{-5} $ $ 1.0 \times 10^{-2} $ $ \alpha $ 300120 13.350 $ 8.5 \times 10^{-6} $ $ 5.2 \times 10^{-5} $ $ \alpha $ /SF$ 2.3 \times 10^{-6} $ $ 2.7 \times 10^{-5} $ $ \alpha $ $ 3.3 \times 10^{-5} $ $ 1.0 \times 10^{-4} $ $ \alpha $ /SF$ +\delta^{Q_\alpha} $ Table 2. Calculated
$ \alpha $ -decay and SF half-lives, together with the resulting dominant decay modes, for 108 nuclei with$ 103 \le Z \le 120 $ and$ 55 \le N-Z \le 60 $ . The second column lists experimental$ Q_\alpha^{\rm{exp}} $ values from Ref. [62] with their errors$ Q_\alpha^{{\rm{err}}} $ , while theoretical$ Q_\alpha^{\rm{th}} $ values from Ref. [63] are shown in italic. For nuclei with an experimental$ Q_\alpha^{\rm{exp}} $ value, the calculations are performed using$ Q_\alpha^{\rm{exp}} $ and$ Q_\alpha^{\rm{exp}} \pm Q_\alpha^{{\rm{err}}} $ , so that$ \delta^{Q_\alpha} = Q_\alpha^{{\rm{err}}} $ . Otherwise, the theoretical$ Q_\alpha^{\rm{th}} $ value from Ref. [63] is varied by$ \pm \delta_{\rm{rms}}^{Q_\alpha} $ , so that$ \delta^{Q_\alpha} = \delta_{\rm{rms}}^{Q_\alpha} = 315 $ keV. All$ Q_\alpha $ values are given in MeV. For each$ Q_\alpha $ value,$ T_{1/2}^{\alpha} $ and$ T_{1/2}^{{\rm{SF}}} $ are calculated from Eq. (1) and Eq. (2), respectively. All half-lives are given in seconds. The dominant decay mode is classified as$ \alpha $ if$ \log_{10}(T_{1/2}^{\alpha}/T_{1/2}^{{\rm{SF}}}) \lt -1 $ , SF if$ \log_{10}(T_{1/2}^{\alpha}/T_{1/2}^{{\rm{SF}}}) \gt +1 $ , and competition otherwise, i.e., when the two half-lives agree within one order of magnitude. In the competition regime, the first symbol indicates the formally dominant mode. The last column indicates whether the dominant decay mode changes upon variation of$ Q_\alpha $ . A blank cell indicates no change, whereas$ +\delta^{Q_\alpha} $ or$ -\delta^{Q_\alpha} $ indicates the cases in which the mode differs from the prediction obtained with the central$ Q_\alpha $ value.Among the 108 nuclei considered, 85 (78.7%) retain their predicted dominant decay mode under the
$ Q_\alpha $ variation, whereas 23 (21.3%) change it. In all cases, the change occurs at only one of the two limits, while the other limit preserves the same mode as the central value. Moreover, the transition always occurs between a single dominant mode and the competition regime, and never directly between$ \alpha $ decay and SF.The 23 nuclei for which the prediction changes can be divided into four groups. For 13 of them, the change occurs when
$ Q_\alpha $ is increased,$ Q_\alpha + \delta^{Q_\alpha} $ . In 7 of these cases, 271Sg, 270Bh, 271,273Hs, 282Rg, 281Cn, and 300120, the competition regime is replaced by$ \alpha $ -decay dominance. In the remaining 6 cases, 261,262,266Lr, 267Rf, 269Db, and 276Hs, SF dominance is replaced by competition. For the other 10 nuclei, the change occurs when$ Q_\alpha $ is decreased,$ Q_\alpha - \delta^{Q_\alpha} $ . In 7 of these cases, 274Bh, 281Rg, 287Lv, 289,291Ts, 293Og, and 293119,$ \alpha $ -decay dominance is replaced by competition. In the remaining 3 cases, 268Db, 274Hs, and 280Ds, the competition regime is replaced by SF dominance.The predicted modes were also compared with available experimental data. For 13 of the 23 nuclei for which the prediction changes upon
$ Q_\alpha $ variation, experimental information on at least one decay mode is available. In 5 cases (270Bh, 273Hs, 280Ds, and 281,282Rg), varying$ Q_\alpha $ brings the predicted mode into agreement with the experimental observation, whereas the central prediction disagrees. For example, for 281Rg, the central$ Q_\alpha $ value yields$ \alpha $ dominance with$ T_{1/2}^{\alpha} = 0.22 $ s and$ T_{1/2}^{{\rm{SF}}} = 4.2 $ s, whereas the experimental data indicate competition between the two modes. Lowering$ Q_\alpha $ by$ \delta_{\rm{rms}}^{Q_\alpha} $ gives$ T_{1/2}^{\alpha} = 1.4 $ s and$ T_{1/2}^{{\rm{SF}}} = 8.1 $ s, placing the prediction within the competition regime and in agreement with experiment. For 282Rg, the central prediction gives competition with$ T_{1/2}^{\alpha} = 1.9 $ min and$ T_{1/2}^{{\rm{SF}}} = 13 $ min, while only$ \alpha $ decay has been observed experimentally. Increasing$ Q_\alpha $ yields$ T_{1/2}^{\alpha} = 15 $ s and$ T_{1/2}^{{\rm{SF}}} = 6.7 $ min, shifting the prediction to$ \alpha $ dominance and restoring agreement with experiment. Conversely, for 280Ds, the central prediction gives competition with$ T_{1/2}^{\alpha} = 348 $ ms and$ T_{1/2}^{{\rm{SF}}} = 70 $ s, whereas SF is observed experimentally. Decreasing$ Q_\alpha $ yields$ T_{1/2}^{\alpha} = 2.5 $ s and$ T_{1/2}^{{\rm{SF}}} = 0.14 $ s, resulting in SF dominance and a correct prediction.The sensitivity analysis shows that predictions for nuclei in the competition regime are inherently sensitive to
$ Q_\alpha $ variations and should therefore be treated with caution.The few remaining mismatches highlight the sensitivity of decay competition to fine structural details of the nucleus and indicate the limitations of the empirical formulas in regimes where the two decay modes are in close competition. Nevertheless, the overall agreement for the vast majority of cases supports the reliability of the formulas for predicting the dominant decay mode in yet unexplored nuclei.
-
The total half-life of each nucleus, considering only
$ \alpha $ decay and SF, is calculated as$ T_{1/2}= \left( \frac{1}{T_{1/2}^{\alpha}} + \frac{1}{T_{1/2}^{\rm{SF}}} \right)^{-1}, $
(3) where the branching ratios are defined as
$ b_{\alpha} = T_{1/2}/ T_{1/2}^{\alpha} $ and$ b_{{\rm{SF}}} = T_{1/2}/ T_{1/2}^{\rm{SF}} $ , so that$ b_{\alpha} + b_{{\rm{SF}}} = 1 $ . The quoted branching ratios are normalized within the two-channel ($ \alpha $ decay and SF) approximation.The partial half-lives
$ T_{1/2}^{\alpha} $ and$ T_{1/2}^{\rm{SF}} $ are taken from three sources in order of priority. Direct experimental half-lives from Refs. [7, 29] are used whenever available. If no direct experimental half-life is available but an experimental$ Q_{\alpha} $ value is known from Ref. [62], the partial half-lives are calculated using Eq. (1) and Eq. (2). In the absence of both direct experimental half-lives and experimental$ Q_{\alpha} $ values, the$ Q_{\alpha} $ values predicted by the macroscopic–microscopic model of Ref. [63] are employed.The results are summarized in Figs. 4 and 5. Each figure presents the complete decay chains for a given element and shows, for each nucleus, the total half-life, the branching ratios
$ b_{{\rm{SF}}} $ and$ b_{\alpha} $ (in %), and the$ Q_{\alpha} $ value of the parent nucleus. A detailed comparison of calculated and experimental half-lives for all nuclei with available data is given in Table 1 in Appendix A.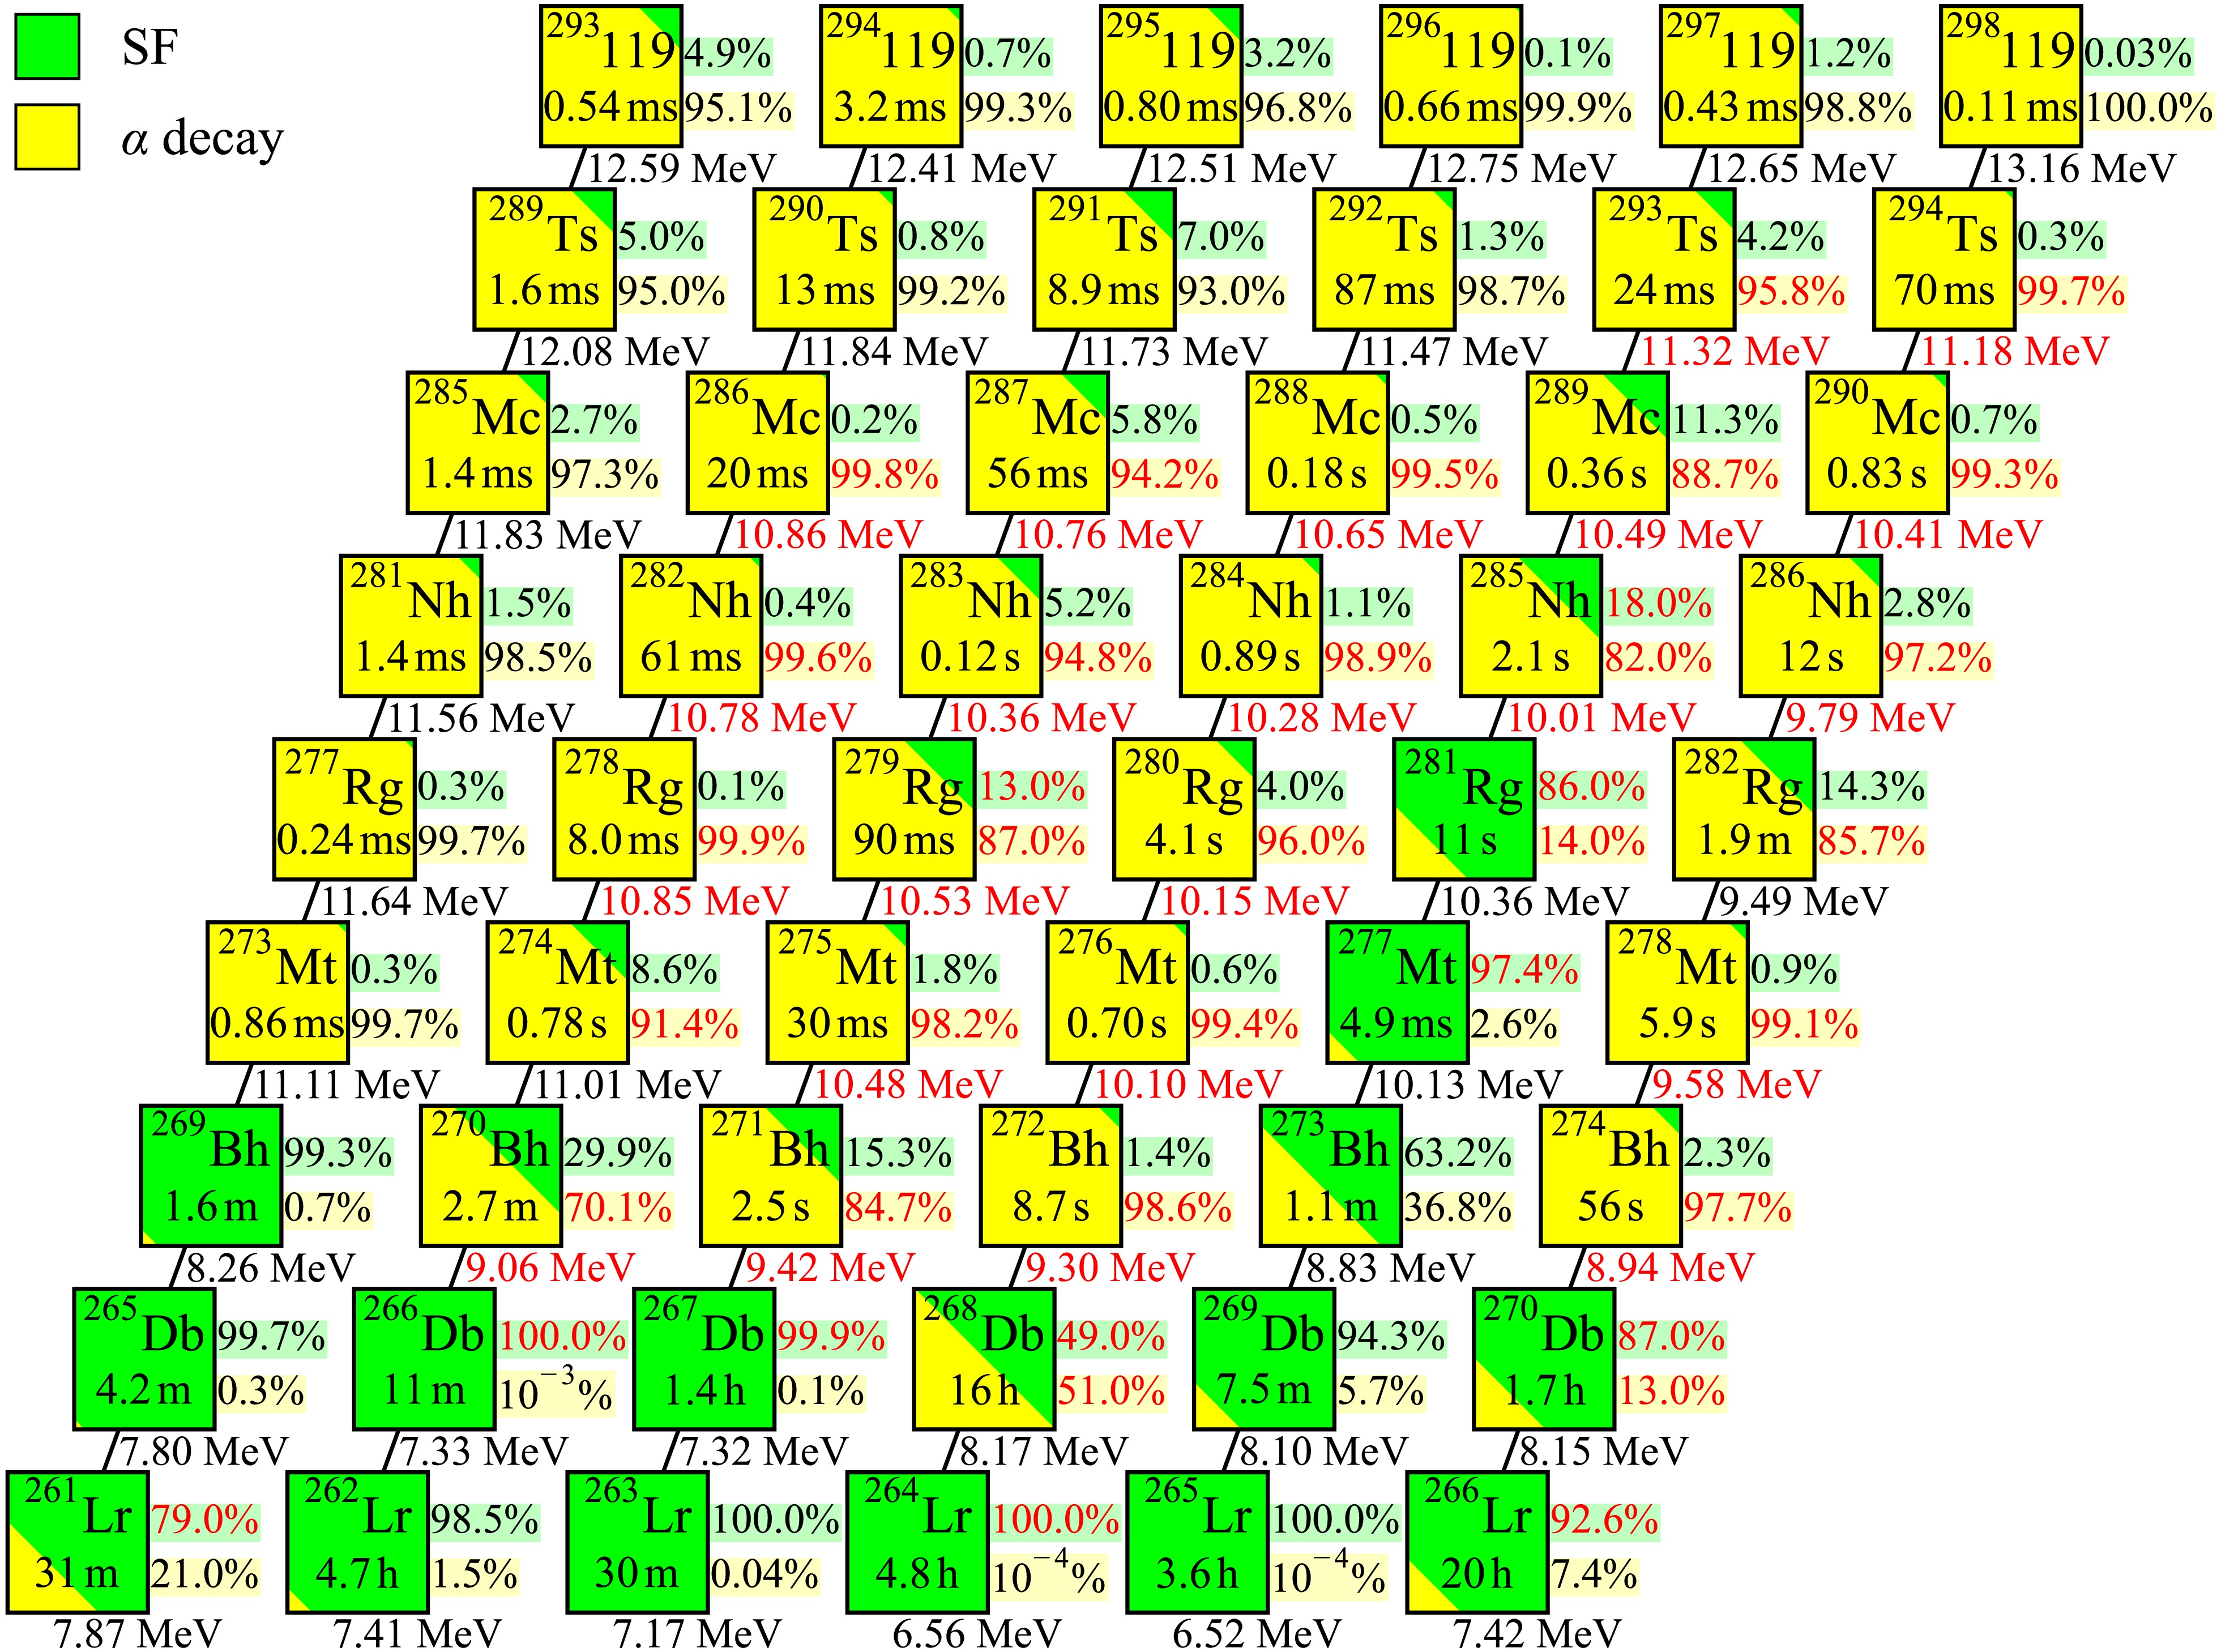
Figure 4. (color online)
$ \alpha $ -decay chains of$ Z=119 $ isotopes with mass numbers A = 293–298. Each cell lists the nuclear symbol and the total half-life, taking into account competition between$ \alpha $ decay (yellow) and SF (green). The SF and$ \alpha $ -decay branching ratios,$ b_{\rm{SF}} $ and$ b_{\alpha} $ , respectively (in %), are given to the right of each cell ($ b_{\alpha}+b_{\rm{SF}} $ = 100%); the upper value is$ b_{\rm{SF}} $ , and the lower value is$ b_{\alpha} $ . Branching ratios shown in red indicate that the corresponding partial half-life was taken from experimental data [7, 10−13, 20, 29]; those shown in black indicate that the partial half-lives for$ \alpha $ decay and SF were calculated using Eq. (1) and Eq. (2), respectively. The$ Q_\alpha $ value for each parent nucleus is shown below the cell. Red$ Q_\alpha $ values are experimental [62], whereas black values are theoretical values obtained from Ref. [63].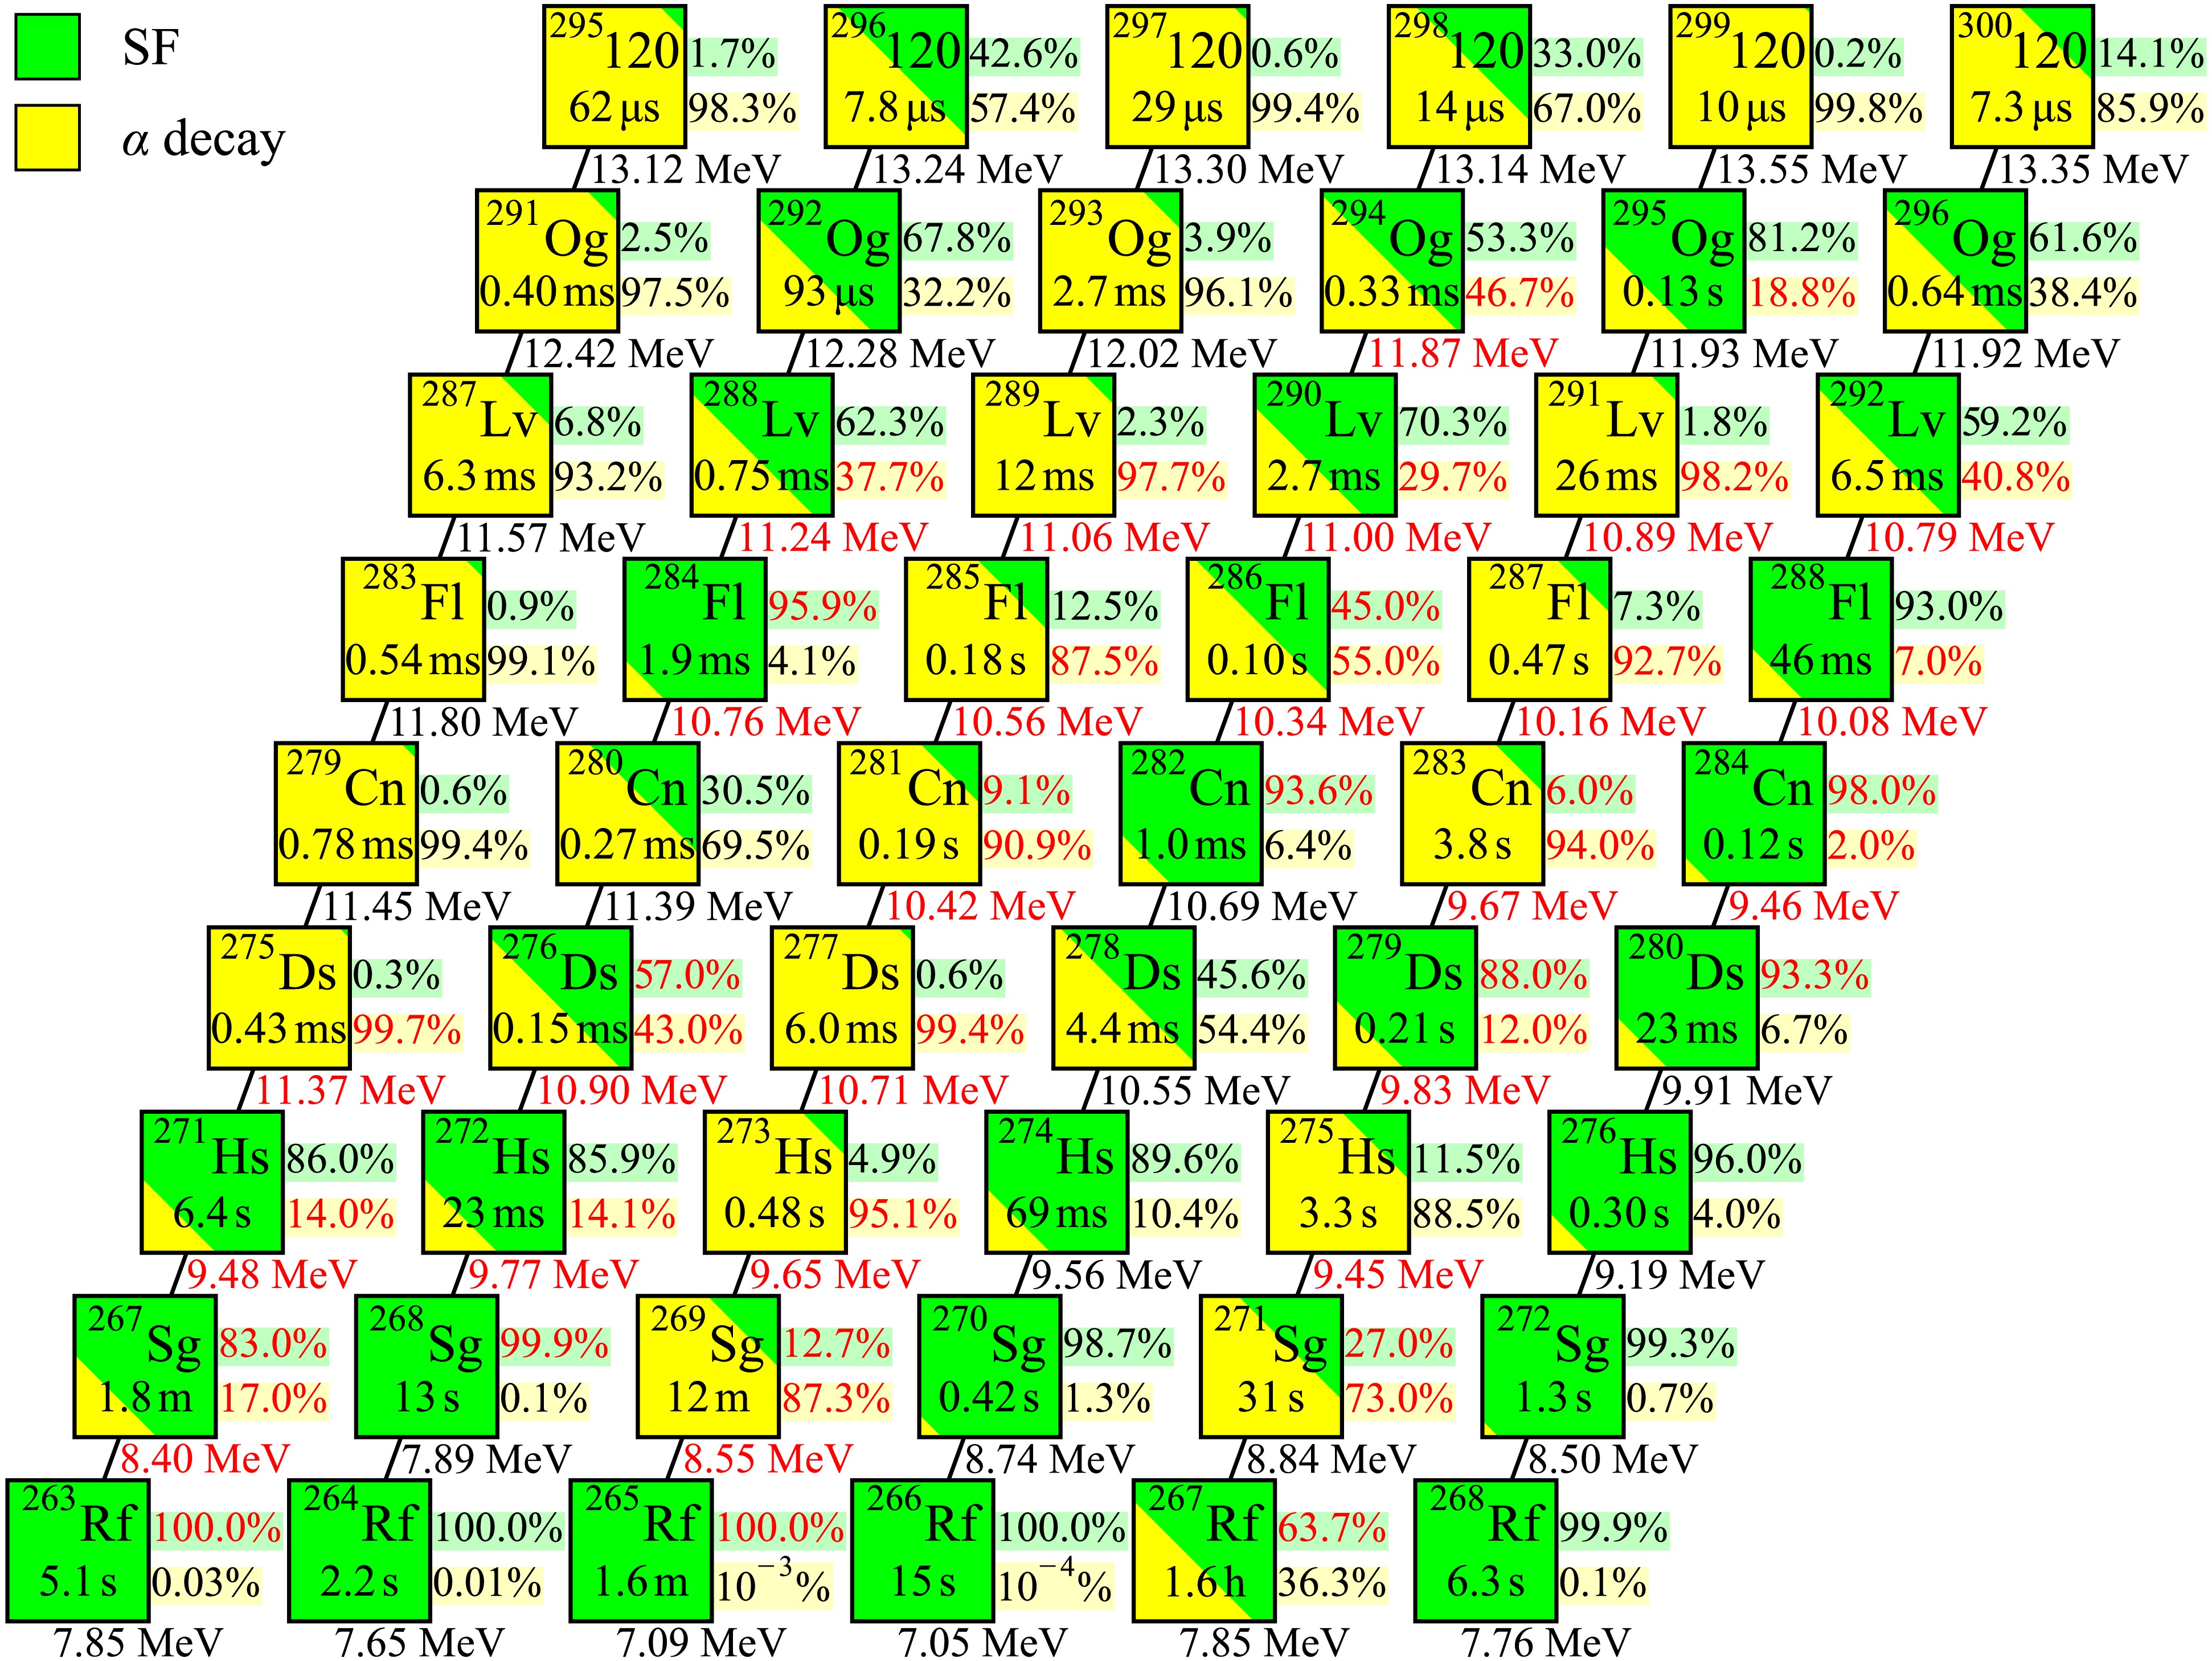
Figure 5. (color online) Same as Fig. 4, but for the
$ \alpha $ -decay chains of$ Z=120 $ isotopes with mass numbers A = 295–300.To systematically assess the competition between the two decay modes, we classify each nucleus according to the relative magnitudes of its partial half-lives. When the two half-lives differ by no more than one order of magnitude, i.e.,
$ \left| \log_{10} \left( T_{1/2}^{\alpha} / T_{1/2}^{\rm{SF}} \right) \right| \le 1 $ , the nucleus is regarded as exhibiting strong competition between the two decay modes. Otherwise, if$ T_{1/2}^{\alpha} \lt T_{1/2}^{\rm{SF}} $ ,$ \alpha $ decay is considered to be the dominant mode, whereas if$ T_{1/2}^{\alpha} \gt T_{1/2}^{\rm{SF}} $ , SF is considered dominant.We now discuss each chain individually, focusing on the competition between
$ \alpha $ decay and SF and on the prospects for experimental observation of the isotopes of elements 119 and 120 through their$ \alpha $ -decay chains. -
The most favorable cases for experimental identification are those in which
$ \alpha $ decay remains the dominant mode over many consecutive steps, producing extended correlated sequences that terminate in SF. Among the isotopes of elements 119 and 120 considered here, this behavior is found in the chains starting from 293,294,296119 and 295120. Here and below, the number of$ \alpha $ decays in a chain is defined as the number of consecutive$ \alpha $ -emitting steps up to the first nucleus that undergoes SF.Chain starting from 293119 (
$ N-Z = 55 $ ). This chain provides six consecutive$ \alpha $ decays, from 293119 down to 273Mt. Throughout this sequence,$ \alpha $ decay remains clearly dominant. The transition to SF dominance occurs at 269Bh, where the chain terminates. The half-lives along the$ \alpha $ -dominated part of the chain are in the submillisecond-to-millisecond range. This chain is among the most promising candidates for experimental identification.Chain starting from 294119 (
$ N-Z = 56 $ ). This chain yields seven$ \alpha $ decays, from 294119 down to 270Bh. The dominance of$ \alpha $ decay is clear from 294119 through 274Mt. At 270Bh, competition between the two modes becomes apparent, although$ \alpha $ decay still dominates. SF becomes dominant at 266Db. Our predictions for the nuclei from 286Mc onward are consistent with experimental data, which show only$ \alpha $ decays down to 266Db.Chain starting from 296119 (
$ N-Z = 58 $ ). This chain provides seven$ \alpha $ decays before SF terminates the sequence at 264Lr. The dominance of$ \alpha $ decay is clear from 296119 through 272Bh. At 268Db, our calculations predict strong competition between the two modes, and the experimental data confirm this competition.Chain starting from 295120 (
$ N-Z = 55 $ ). This chain provides six consecutive$ \alpha $ decays, from 295120 down to 271Hs. Throughout this sequence,$ \alpha $ decay remains clearly dominant. At 267Sg, competition between the two modes emerges, and the chain terminates at 263Rf. Our predictions for the lower part of the chain are consistent with experimental data. -
The chains discussed in this section contain one or more nuclei exhibiting strong competition according to the above criterion, although smaller but non-negligible SF branches may occur at other steps. Although these chains may still be observable as
$ \alpha $ emitters, the presence of SF branches could affect the decay pattern or shorten the observed sequence in some cases. Such behavior is found in the chains starting from 295,297,298119 and 297,299120.Chain starting from 295119 (
$ N-Z = 57 $ ). The dominant decay sequence contains seven consecutive$ \alpha $ decay steps, from 295119 down to 271Bh. A noticeable SF admixture appears at 283Nh and remains appreciable at 279Rg. For 287Mc, the experimental$ \alpha $ -decay half-life is significantly shorter than our prediction, although$ \alpha $ decay remains the observed mode. The chain can terminate by SF at 267Db.Chain starting from 297119 (
$ N-Z = 59 $ ). This chain exhibits competition between$ \alpha $ decay and SF from the initial steps. A notable discrepancy with experiment appears at 281Rg: while our calculations predict$ \alpha $ -decay dominance with a significant SF admixture, the experimental data indicate SF as the dominant mode. An even larger discrepancy is observed at 277Mt, where the experimental SF half-life is three orders of magnitude shorter than our prediction. The chain terminates at 265Lr in our calculations, although the experimental observation of SF only for 277Mt indicates a possible earlier termination.Chain starting from 298119 (
$ N-Z = 60 $ ). Starting from 298119, the chain proceeds through seven consecutive$ \alpha $ decays down to 274Bh. A noticeable SF admixture appears at 282Rg and becomes strong at 270Db, where the two decay modes compete. Experimental data for 270Db indicate SF dominance, consistent with our predictions. The chain can terminate at 266Lr.Chain starting from 297120 (
$ N-Z = 57 $ ). The chain beginning at 297120 undergoes seven consecutive$ \alpha $ decays down to 273Hs before SF terminates the sequence at 269Sg. The dominance of$ \alpha $ decay is clear in the initial steps. Competition becomes noticeable starting from 285Fl and persists through 273Hs, apart from a return to$ \alpha $ -decay dominance at 277Ds. At 269Sg, our calculations predict competition between the two modes, whereas only$ \alpha $ decay has been observed experimentally, indicating a possible overestimation of the SF branch in this nucleus.Chain starting from 299120 (
$ N-Z = 59 $ ). Among the$ Z=120 $ isotopes, the chain starting from 299120 is the longest$ \alpha $ -dominated chain, with seven consecutive$ \alpha $ decays. Strong competition appears already at the second decay step, at 295Og, and persists throughout the chain. Notably, at 279Ds, our calculations predict$ \alpha $ -decay dominance, whereas experimental data indicate strong competition with SF. The chain continues beyond 267Rf in our calculations, although the calculated SF branch becomes increasingly important. -
For some isotopes, SF becomes the dominant decay mode at an early stage in the chain, preventing the observation of extended
$ \alpha $ -decay sequences. Among the isotopes of element 120, this behavior is found in the chains starting from 296,298,300120.Chain starting from 296120 (
$ N-Z = 56 $ ). This chain exhibits strong competition between$ \alpha $ decay and SF from the first step, beginning with 296120, and this competition persists throughout the chain. For 276Ds, the experimentally observed competition between the two modes is consistent with our predictions. At 272Hs, however, only$ \alpha $ decay has been observed experimentally, whereas our calculations indicate a significant SF component. The chain terminates by SF at 268Sg, in agreement with experiment.Chain starting from 298120 (
$ N-Z = 58 $ ). This chain is characterized by strong competition already at 298120, and the two modes remain competitive throughout most of the chain. For 294Og and 290Lv, only$ \alpha $ decay has been observed experimentally, whereas our calculations predict competition with SF. For 286Fl, the experimental data confirm competition between the two decay modes.Chain starting from 300120 (
$ N-Z = 60 $ ). In this chain, strong competition is already present at 300120 and continues through 296Og and beyond. For 292Lv and 288Fl, only$ \alpha $ decay has been observed experimentally, whereas our calculations indicate strong competition with SF. For 284Cn, both the experimental data and our predictions show SF dominance, with both decay modes observed. At 280Ds, only SF has been observed experimentally, consistent with our calculated SF dominance. The early onset and persistence of strong competition with SF make this chain particularly unfavorable for experimental identification via$ \alpha $ -decay chains. -
The competition between
$ \alpha $ decay and SF was analyzed along the$ \alpha $ -decay chains of the as-yet-unsynthesized elements$ Z=119 $ and$ Z=120 $ in the mass ranges A = 293–298 and A = 295–300, respectively. These ranges correspond to neutron-excess values of$ N-Z $ = 55–60, which may be accessible in fusion-evaporation reactions. The$ \alpha $ -decay half-lives were calculated using the Viola–Seaborg formula [45] with the Parkhomenko–Sobiczewski parameterization [56], whereas the SF half-lives were obtained using our recently proposed empirical formula [58, 59]. Theoretical$ Q_\alpha $ values were taken from the macroscopic–microscopic model of Ref. [63] when experimental values from Ref. [62] were unavailable.The chains originating from 293,294,296119 and 295120 are found to be the most favorable for experimental identification, with six or more consecutive
$ \alpha $ decays expected. For the chains originating from 295,297,298119 and 297,299120, the presence of significant SF branches indicates a more complex decay pattern. Among the considered isotopes, the chains originating from 296,298,300120 are the least favorable, with SF becoming dominant at early stages.The present results may be of interest for ongoing experimental searches at JINR (Dubna) [8, 85, 86], LBNL (Berkeley) [87], GSI (Darmstadt) [23, 28, 88], RIKEN (Tokyo) [89], and IMP (Lanzhou) [90], all of which are currently pursuing the synthesis of elements 119 and 120 at the upper end of the nuclear chart.
-
Table 1 compares the calculated and experimental half-lives of 66 nuclei in the region
$ 103 \le Z \le 118 $ and$ 55 \le N-Z \le 60 $ for which experimental data or limits are available for at least one decay mode. The total half-lives and branching ratios are obtained using Eq. (3) within the two-channel ($ \alpha $ decay + SF) approximation. -
Table 2 presents the calculated
$ \alpha $ -decay and SF half-lives, the resulting dominant decay modes for the three considered input$ Q_\alpha $ values, and an indication of whether the predicted mode is robust against the$ Q_\alpha $ uncertainty.
Empirical predictions of α-decay and spontaneous fission half-lives in the decay chains of elements 119 and 120
- Received Date: 2026-08-30
- Available Online: 2026-11-01
Abstract: The competition between $\alpha$ decay and spontaneous fission in the decay chains of isotopes with Z = 119 and 120 is investigated using empirical formulas. The $\alpha$-decay half-lives are calculated with the Viola-Seaborg semi-empirical formula, whereas the spontaneous-fission half-lives are evaluated using an empirical formula based on the neutron excess N-Z and the $\alpha$-decay energy $Q_\alpha$. The reliability of this approach is validated by comparison with experimental data for known nuclei with $Z \ge 103$. Several $\alpha$-decay chains are identified as promising candidates for experimental observation, with six or more consecutive $\alpha$ decays expected before termination by spontaneous fission. The present results may be useful for future experimental searches for superheavy nuclei.



 DownLoad: