-
The cosmic distance duality relation (CDDR) is a fundamental relation in modern cosmology [1], relating the luminosity distance (LD)
$ D_{\rm{L}}(z) $ and angular diameter distance (ADD)$ D_{\rm{A}}(z) $ through the identity equation$ {D_{\rm{L}}}= {D_{\rm{A}}}{(1+z)}^{2} $ , where z represents the cosmological redshift. This relation relies on three fundamental assumptions: space-time is described by the metric theory, light travels along null geodesics between the source and observer, and photon number is conserved. As a fundamental relation, the CDDR has undoubtedly been applied in various research fields of astronomy, including the large-scale distribution of galaxies and uniformity of the cosmic microwave background (CMB) temperature [2], as well as the gas mass density distribution and temperature distribution of galaxy clusters [3, 4]. In astronomical observations, any violation of the CDDR suggests the presence of new physics or unaccounted errors in observational data. Therefore, it is necessary to conduct reliable testing on the CDDR.The CDDR test is conducted using a parametric method. Three different forms can be used for parameterization, namely,
$ \eta(z)=1+\eta_0z $ ,$ \eta(z)=1+\eta_0z/ (1+z) $ , and$ \eta(z)=1+\eta_0\ln(1+z) $ , where$ \eta_{0} $ represents a possible violation from the CDDR. Considering the advantages of the$ \eta(z) $ expression such as a manageable one-dimensional phase space and good sensitivity to observational data [5], the parameterizations of$ \eta(z) $ listed above are used to test the validity of the CDDR. Some studies have focused on testing the validity of CDDR by comparing LD data from the observations of Type Ia supernovae (SNIa), HII galaxies, or gamma-ray bursts with the various ADD data from the X-ray plus Sunyaev-Zeldovich (SZ) effect and the gas mass fraction measurements in galaxy clusters [5–17]. The results confirm that CDDR is consistent with astronomical observations within various redshift ranges [18–29]. Recent efforts have explored the use of compact radio quasars (QSOs) as standard rulers that can provide ADD measurements for CDDR constraints. Qi et al. combined QSO data with simulated future gravitational wave observations from the Einstein Telescope, which act as standard sirens for LD [30]. Their work highlighted the potential of future multi-messenger observations to test the CDDR at high redshifts with high precision. In addition, one issue may be that it is difficult to obtain LD and ADD measurements from astronomic observation at the same redshifts. To solve this problem, several methods have been proposed in some literature. Using the galaxy cluster samples [31, 32] and SNIa data, Holanda et al. [8] and Li et al. [10] selected the closest one through a selection criterion ($ \Delta z=|z_{\rm{ADD}}-z_{\rm{SNIa}}|< 0.005 $ ) for CDDR test. To minimize statistical errors that could arise from utilizing only a single SNIa data point from all those that meet the selection criteria, Meng et al. [12] used a binning method to bin the available data that meets the selection criterion to derive LD instead of using the closest measurement.SNIa and QSO measurements play important roles in constraining cosmological parameters. The LD derived from SNIa observations is dependent on its peak absolute magnitude
$ M_{\rm{B}} $ , which is assumed to be a constant value unaffected by other variables. Recently, efforts have been made to derive the value of$ M_{\rm{B}} $ from cosmological observations [33–35]. Various values of$ M_{\rm{B}} $ have been determined by combining SNIa data, including Pantheon, with other observational datasets, including CMB observations, cosmic chronometer data related to the Hubble parameter, and baryon acoustic oscillations (BAO). A discrepancy in the absolute magnitude of SNIa calibrated by Cepheids was observed between$ z\leq0.01 $ and$ z>0.01 $ [36, 37]. Recent studies [38, 39] also indicated a potential weak evolution of$ M_{\rm{B}} $ . In addition, due to the negligible dependence of the compact structure sizes of intermediate-luminosity quasars on source luminosity and redshift, these quasars with very-long-baseline interferometry (VLBI) observations are potentially promising standard rulers [40]. The ADD obtained from these QSO observations depends on the linear size scaling factor l. Systematic errors can arise based on different calibration methods and data for l, leading to varying calibration values for l. For example, in Ref. [41], Cao et al. used a cosmological model-independent Gaussian process method to reconstruct Hubble$ H(z) $ measurements from 24 cosmic chronometer data points in the redshift range of 0.7 to 1.2 for the calibration of l. In Ref. [42], Cao et al. calibrated the value of l using the flat ΛCDM model with$ Planck $ Collaboration data. In Ref. [43], Cao et al. used Gaussian processes to reconstruct the ADD from the BAO sample to calibrate l. These calibration results indicate that the value of l varies slightly depending on the observational data and cosmological model.Indeed, if the exact values of
$ M_{\rm{B}} $ and l are not determined by astronomical observations, the specific prior values for$ M_{\rm{B}} $ and l may potentially introduce biases into the constraints on cosmological parameters. Furthermore, the independence of the CDDR test, which relies on the prior values of$ M_{\rm{B}} $ and l, may be questionable, as the values of$ M_{\rm{B}} $ and l are obtained from specific cosmological models. The measurement error of a single SNIa or QSO measurement is not dependent on the parameter$ M_{\rm{B}} $ or l, and therefore, theoretically, one can use marginalization methods to eliminate$ M_{\rm{B}} $ or l parameters during statistical analysis. Thus, it is important to further study the impacts of specific prior values for$ M_{\rm{B}} $ or l on the CDDR test and to develop new testing methods that are not dependent on$ M_{\rm{B}} $ and l, which can improve the reliability of CDDR testing. This is also the main motivation driving this research.In this study, we perform the CDDR test by comparing the LD derived from Pantheon+ SNIa data with the ADD from QSO data. The binning method and artificial neural network (ANN) are used to match the SNIa data with the QSO data at the same redshifts. We first investigate the effects on the CDDR test by considering the specific value of
$ M_{\rm{B}} $ and l to derive the LD and ADD. The results indicate that the priors of$ M_{\rm{B}} $ and l may induce significant biases in the CDDR test. To avoid these biases, we combine$ M_{\rm{B}} $ and l into a new variable κ, defined as$ \kappa\equiv 10^{M_{\rm{B}} \over 5}\,l $ , and we consider it as a nuisance parameter with a flat prior in statistical analysis, marginalizing its impact on CDDR test. Therefore, all quantities used in the CDDR test come directly from observations, which means that the absolute magnitudes from SNIa and the linear size scaling factor from QSO measurements do not need to be calibrated. We demonstrate that CDDR is consistent with the observed data, and the parametric method of testing the CDDR is independent of specific cosmological models. -
Two types of cosmic distances are typically required to verify the validity of CDDR: LD (
$ D_{\rm{L}} $ ) and ADD ($ D_{\rm{A}} $ ). The LD data in this study are obtained from the Pantheon+ SNIa observational dataset [44]. This dataset combines observations from 18 different survey programs, containing 1701 light curves of 1550 spectroscopically confirmed unique SNIa, with a redshift range of$ 0 < z < 2.3 $ . Pantheon+ employs an improved version of the SALT2 light-curve fitter to calculate the distance modulus, utilizing recalibrated photometric systems and updated training parameters. The analysis applies the Bayesian estimation applied to multiple species with bias corrections method to determine nuisance parameters and correct for distance biases, such as the distance modulus formula$ \mu = m_{\rm{B}}-M_{\rm{B}} $ , where$ m_{\rm{B}} $ represents the observed peak apparent magnitude in the rest-frame B-band. Recently, some research has focused on the possible evolution of$ M_{\rm{B}} $ with redshift. The CMB constraint on the sound horizon forecasts$ M_{\rm{B}}\sim -19.4\,{\rm{mag}} $ using an inverse distance ladder [35], whereas the approximation from SH0ES gives$ M_{\rm{B}}\sim -19.2\,{\rm{mag}} $ [33]. Hence, we first investigate the effects of different prior values of$ M_{\rm{B}} $ on the CDDR test. In this study, we considered two specific priors of$ M_{\rm{B}} $ derived from different observational data sets within various redshift ranges: (a)$ M_{\rm{B}}^{\rm{D20}}=-19.23\pm 0.0404\,{\rm{mag}} $ obtained from the SNIa observation within the relatively low redshift range of$ 0.023 < z < 0.15 $ by Camarena and Marra [33] in ΛCDM through a de-marginalization of the SH0ES determination [45] (hereafter,$ M_{\rm{B}}^{\rm{D20}} $ ) and (b)$ M_{\rm{B}}^{\rm{B23}}={-19.396\pm0.016\,{\rm{mag}}} $ obtained by combining SNIa observations with BAO observations [35] (hereafter,$ M_{\rm{B}}^{\rm{B23}} $ ). Considering the observational uncertainty of$ M_{\rm{B}} $ , the error bar on μ can be represented as$ \sigma_{\mu}=\sqrt{\sigma_{M_{\rm{B}}}^2+\sigma_{m_{\rm{B}}}^2} $ . The relationship between the LD$ D_{\rm{L}} $ [46] and distance modulus μ can be expressed as$ \mu(z)=5\log_{10}(D_{\rm{L}}(z))+25\,, $

(1) and the uncertainty in
$ D_{\rm{L}} $ can be obtained from$ \sigma_{D_{\rm{L}}}={{\ln{10}}D_{\rm{L}}\sigma_{\mu}\over5}\,. $

(2) The angular size-distance relationship of QSO is utilized for cosmological inference, originally proposed by Kellermann [47], who attempted to obtain the deceleration parameter using VLBI observations of 79 compact radio sources at 5 GHz. Subsequently, Gurvits [48] extended this method and attempted to study the dependence of the observed characteristic sizes of 337 active galactic nuclei at 2.29 GHz on luminosity and redshift [49]. In the following analysis, the angular size θ of the radio source is refined in Ref. [48] using the visibility modulus
$ \Gamma=S_{\rm{c}}/S_{\rm{t}} $ , which can be expressed as$ \theta=\dfrac{2\sqrt{-\ln \Gamma \ln2}}{\pi B} $ , where B represents the interferometer baseline measured in multiple of wavelengths, and$ S_{\rm{c}} $ and$ S_{\rm{t}} $ represent the correlated flux density and total flux density, respectively. The linear size$ l_{\rm{m}} $ of compact structures in the radio sources, intrinsic luminosity L, and redshift z of the background source supply the relationship$ l_{\rm{m}}=lL^{\beta}(1+z)^{n}\,, $

(3) where l represents the linear size scaling factor, which describes the apparent distribution of radio brightness within the core, and β and n are used to quantify the possible "angular size-luminosity" and "angular size-redshift" relationships, respectively. Further, for a cosmological rod with intrinsic length, the relationship of the angular size-redshift can be expressed as [50]
$ \theta(z)={l_{\rm{m}}\over{D_{\rm{A}}(z)}}\,, $

(4) where
$ \theta(z) $ represents the observed angular size measured by VLBI techniques. As demonstrated by Ref. [51–53], the VLBI measurement of$ \theta(z) $ is a direct result based on the principles of interferometry (baselines, wavelength) and data analysis. This measurement process is fundamentally independent of cosmological model assumptions related to cosmic expansion, curvature, or geometry. Therefore, the process of obtaining the observed$ \theta(z) $ possesses cosmological model independence. Combining Eqs. (3) and (4),$ D_{\rm{A}}(z) $ can be written as$ D_{\rm{A}}(z)={lL^{\beta}(1+z)^{n}\over{\theta(z)}}\,. $

(5) Recently, Cao et al. found that the linear size scaling factor is almost independent on redshift and intrinsic luminosity (
$ |n|\simeq10^{-3} $ ,$ |\beta|\simeq10^{-4} $ ) [41, 42]. The sample comprising 120 intermediate-luminosity radio quasars within a redshift range of$ 0.4 < z < 2.8 $ selected in [41] has been widely used in various cosmological studies [40, 54–56]. The ADD obtained from the QSO samples has already been used to test the CDDR along with the LD obtained from HII galaxies and supernovae [57, 58] and to infer the value of the Hubble constant$ H_0 $ together with the unanchored luminosity from supernovae data [59].The value of the linear size scaling factor l can be constrained to
$ l=11.19\pm1.64\,{\rm{pc}} $ [42] (hereafter,$ l^{\rm{C17}} $ ) in the flat ΛCDM model with$ Planck $ Collaboration. Then, as an independent study on the cosmological model, Cao et al. obtained$ l=10.86\pm1.58\, \rm{pc} $ [42] by using 36 Hubble data points, some of which were inferred from 30 cosmic chronometers [60–62], whereas the rest were derived from six BAO measurements [63]. Furthermore, Cao et al. obtained a more accurate value of l [43] using ADD from the BAO sample [64–66] and 41 Hubble data points, some of which were inferred from 31 passively evolving galaxies [19, 61, 67–70], whereas the rest were derived from ten BAO measurements [64–66, 71–74]. The obtained values of l are$ l={11.04\pm0.40}\,{\rm{pc}} $ (hereafter,$ l^{\rm{C19}} $ ) and$ l={11.12\pm0.50}\,{\rm{pc}} $ , respectively. The values of l provided by different observation data exhibit slight variations. Consequently, the prior values of l may potentially induce bias in testing the CDDR. In this study, we consider the values of the linear size scaling factors$ l^{\rm{C17}} $ and$ l^{\rm{C19}} $ calibrated using methods that depend and do not depend on the cosmological model, respectively, to investigate their effects on the CDDR test. -
A straightforward approach to test the validity of the CDDR is comparing the ADD and LD from different observations at the same redshift. Owing to the lack of observational ADD and LD data at the same redshift, we bin the SNIa data points satisfying the selection criterion
$ \Delta z=|z_{\rm{ADD}}-z_{\rm{SNIa}}|<0.005 $ , as proposed in the literature [8, 10, 27]. This method, referred to as the binning method, can be used to avoid statistical errors caused by using only one SNIa data point among those satisfying the selection criterion, and it has been employed to discuss the CDDR test in Ref. [12, 75]. We take the inverse variance weighted average of all selected data. We select the SNIa samples following a procedure to avoid correlations among the individual CDDR tests. The weighted average LD$ \bar{D_{\rm{L}}} $ and its uncertainty$ \sigma_{D_{\rm{L}}} $ can be obtained using the conventional data processing techniques detailed in Section 4 of Ref. [76].$ \bar{D_{\rm{L}}}={\sum(D_{{\rm{L}}i}/\sigma_{D_{{\rm{L}}i}}^2)\over \sum1/\sigma_{D_{{\rm{L}}i}}^2}, $

(6) $ \sigma^2_{\bar{D_{\rm{L}}}}={1\over \sum1/\sigma_{D_{{\rm{L}}i}}^2}\,. $

(7) where
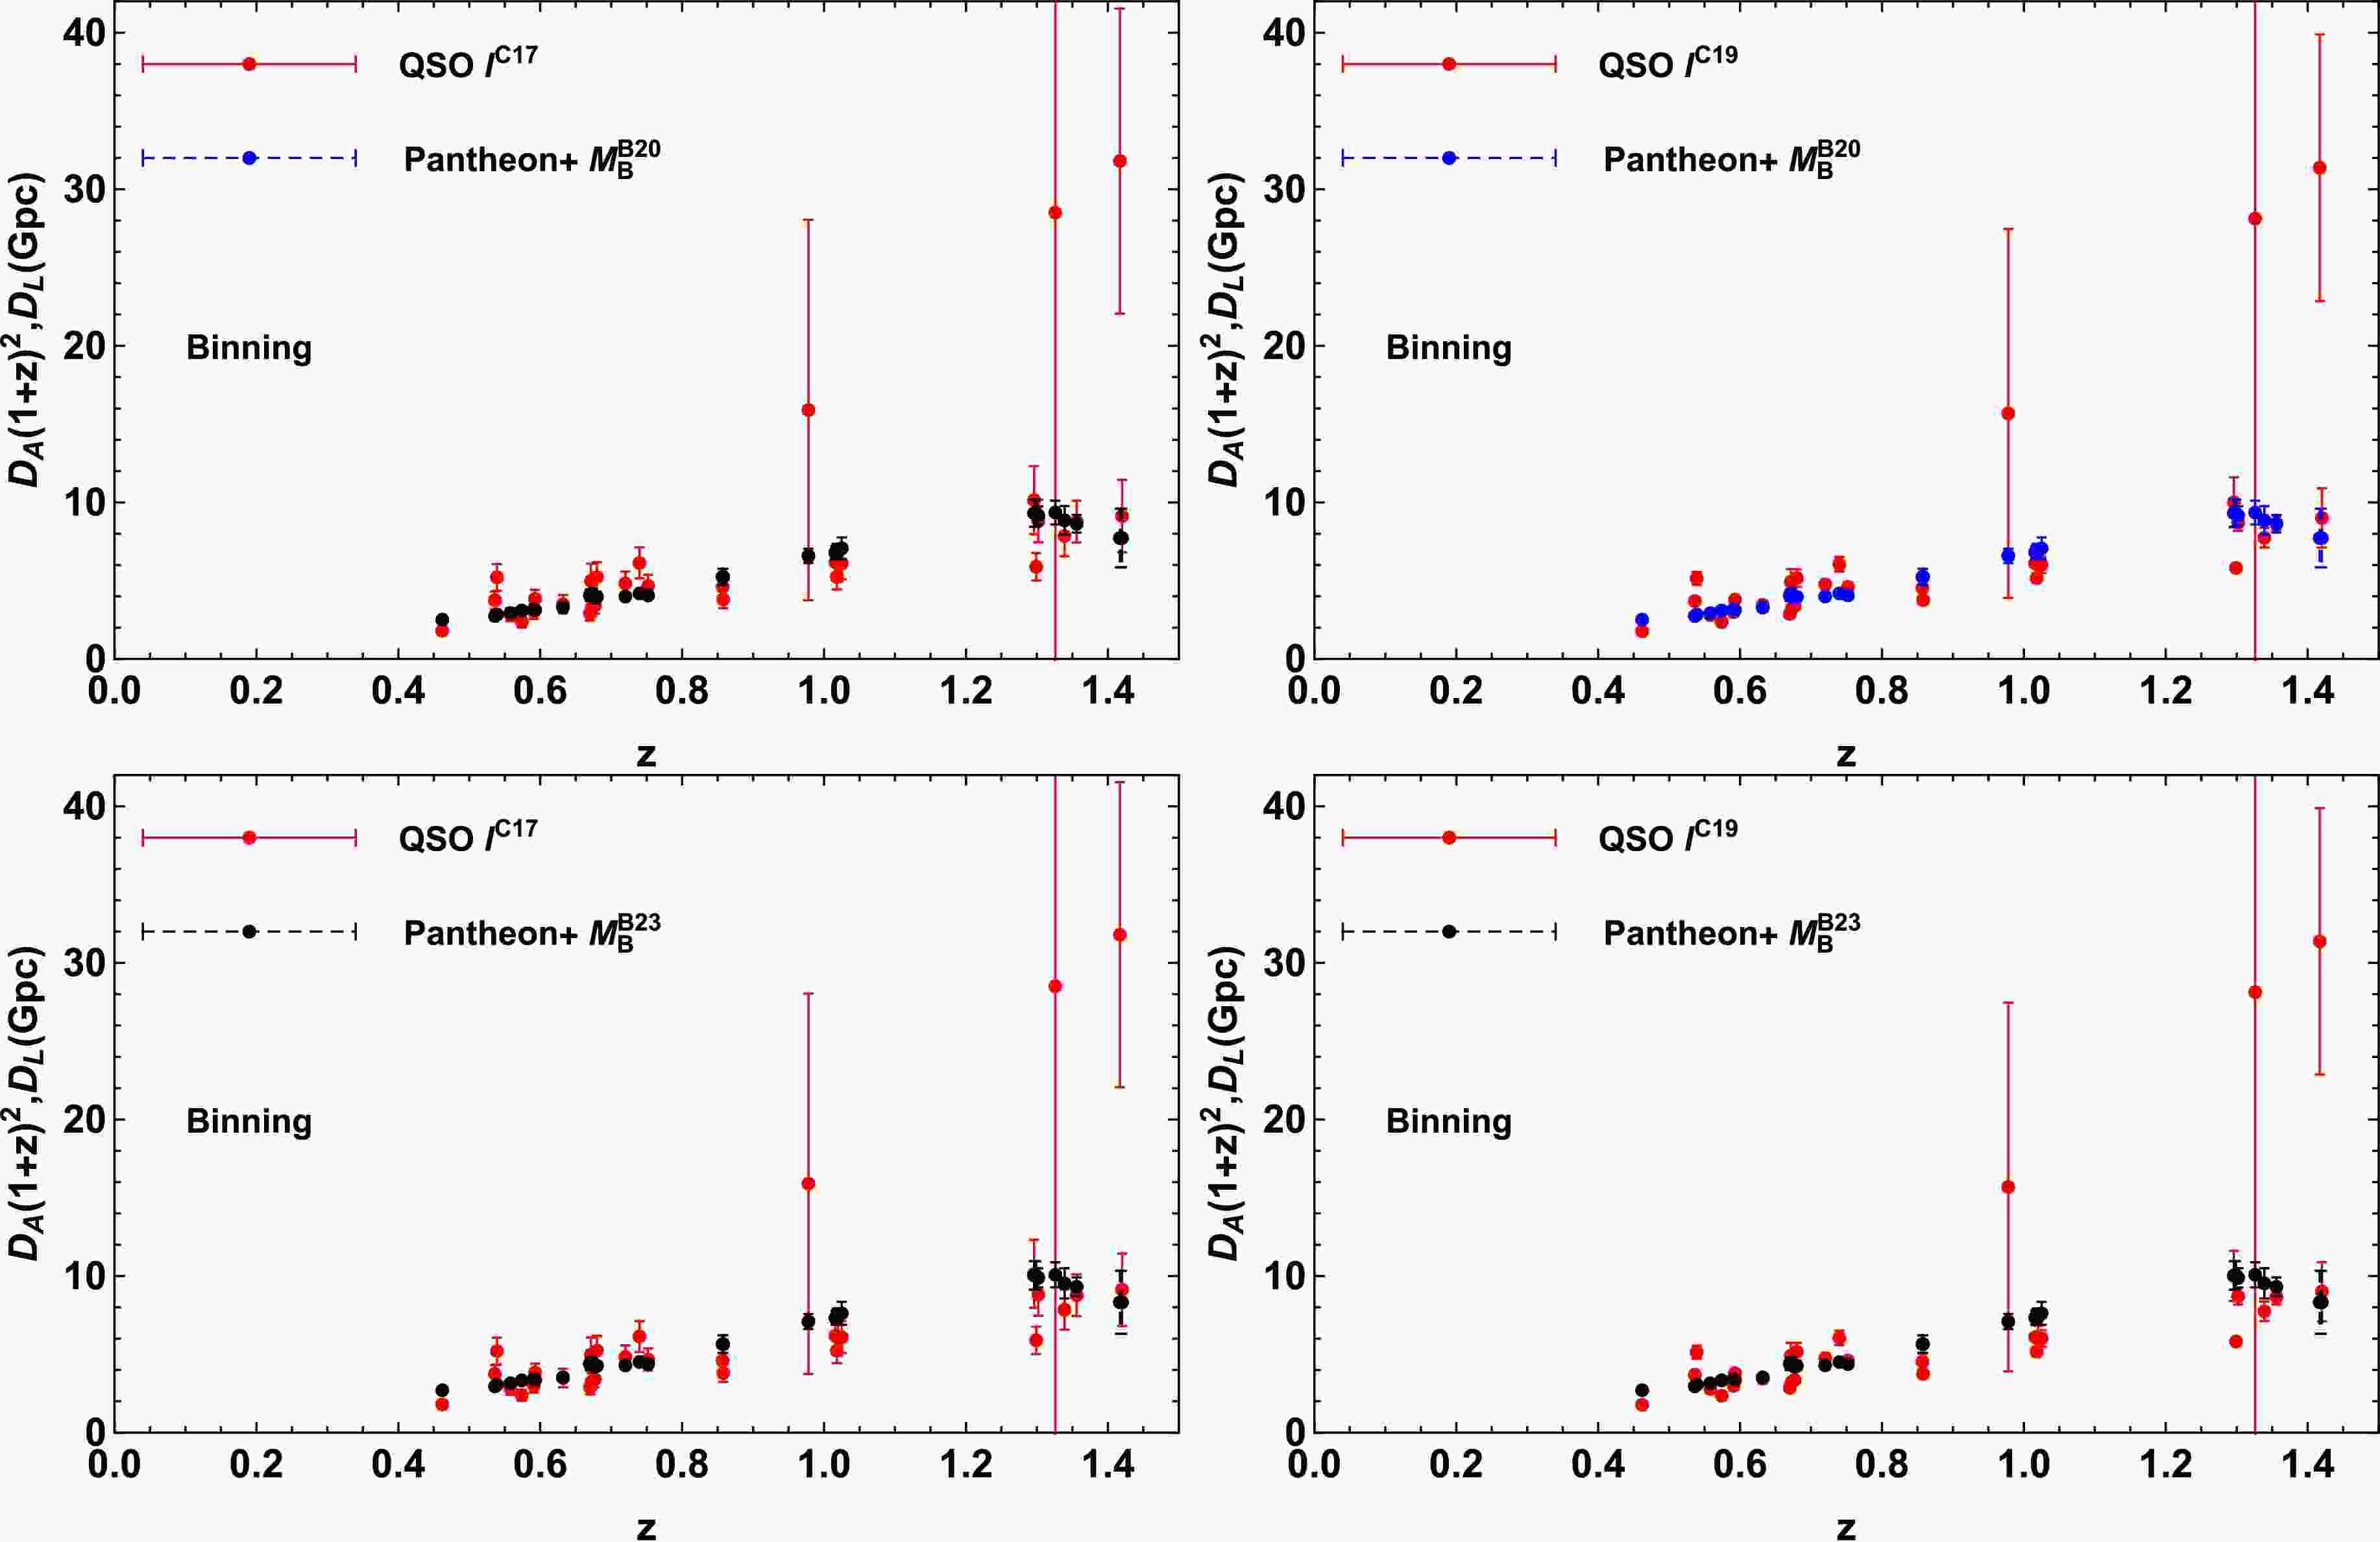
$ D_{{\rm{L}}i} $ and$ \sigma_{D_{{\rm{L}}i}} $ represent the ith appropriate LD data point and corresponding observational uncertainty, respectively.Only 31 QSO data points satisfy the selection criterion. The distributions of the QSO and SNIa data derived from different priors of l and
$ M_{\rm{B}} $ are shown in Fig. 1.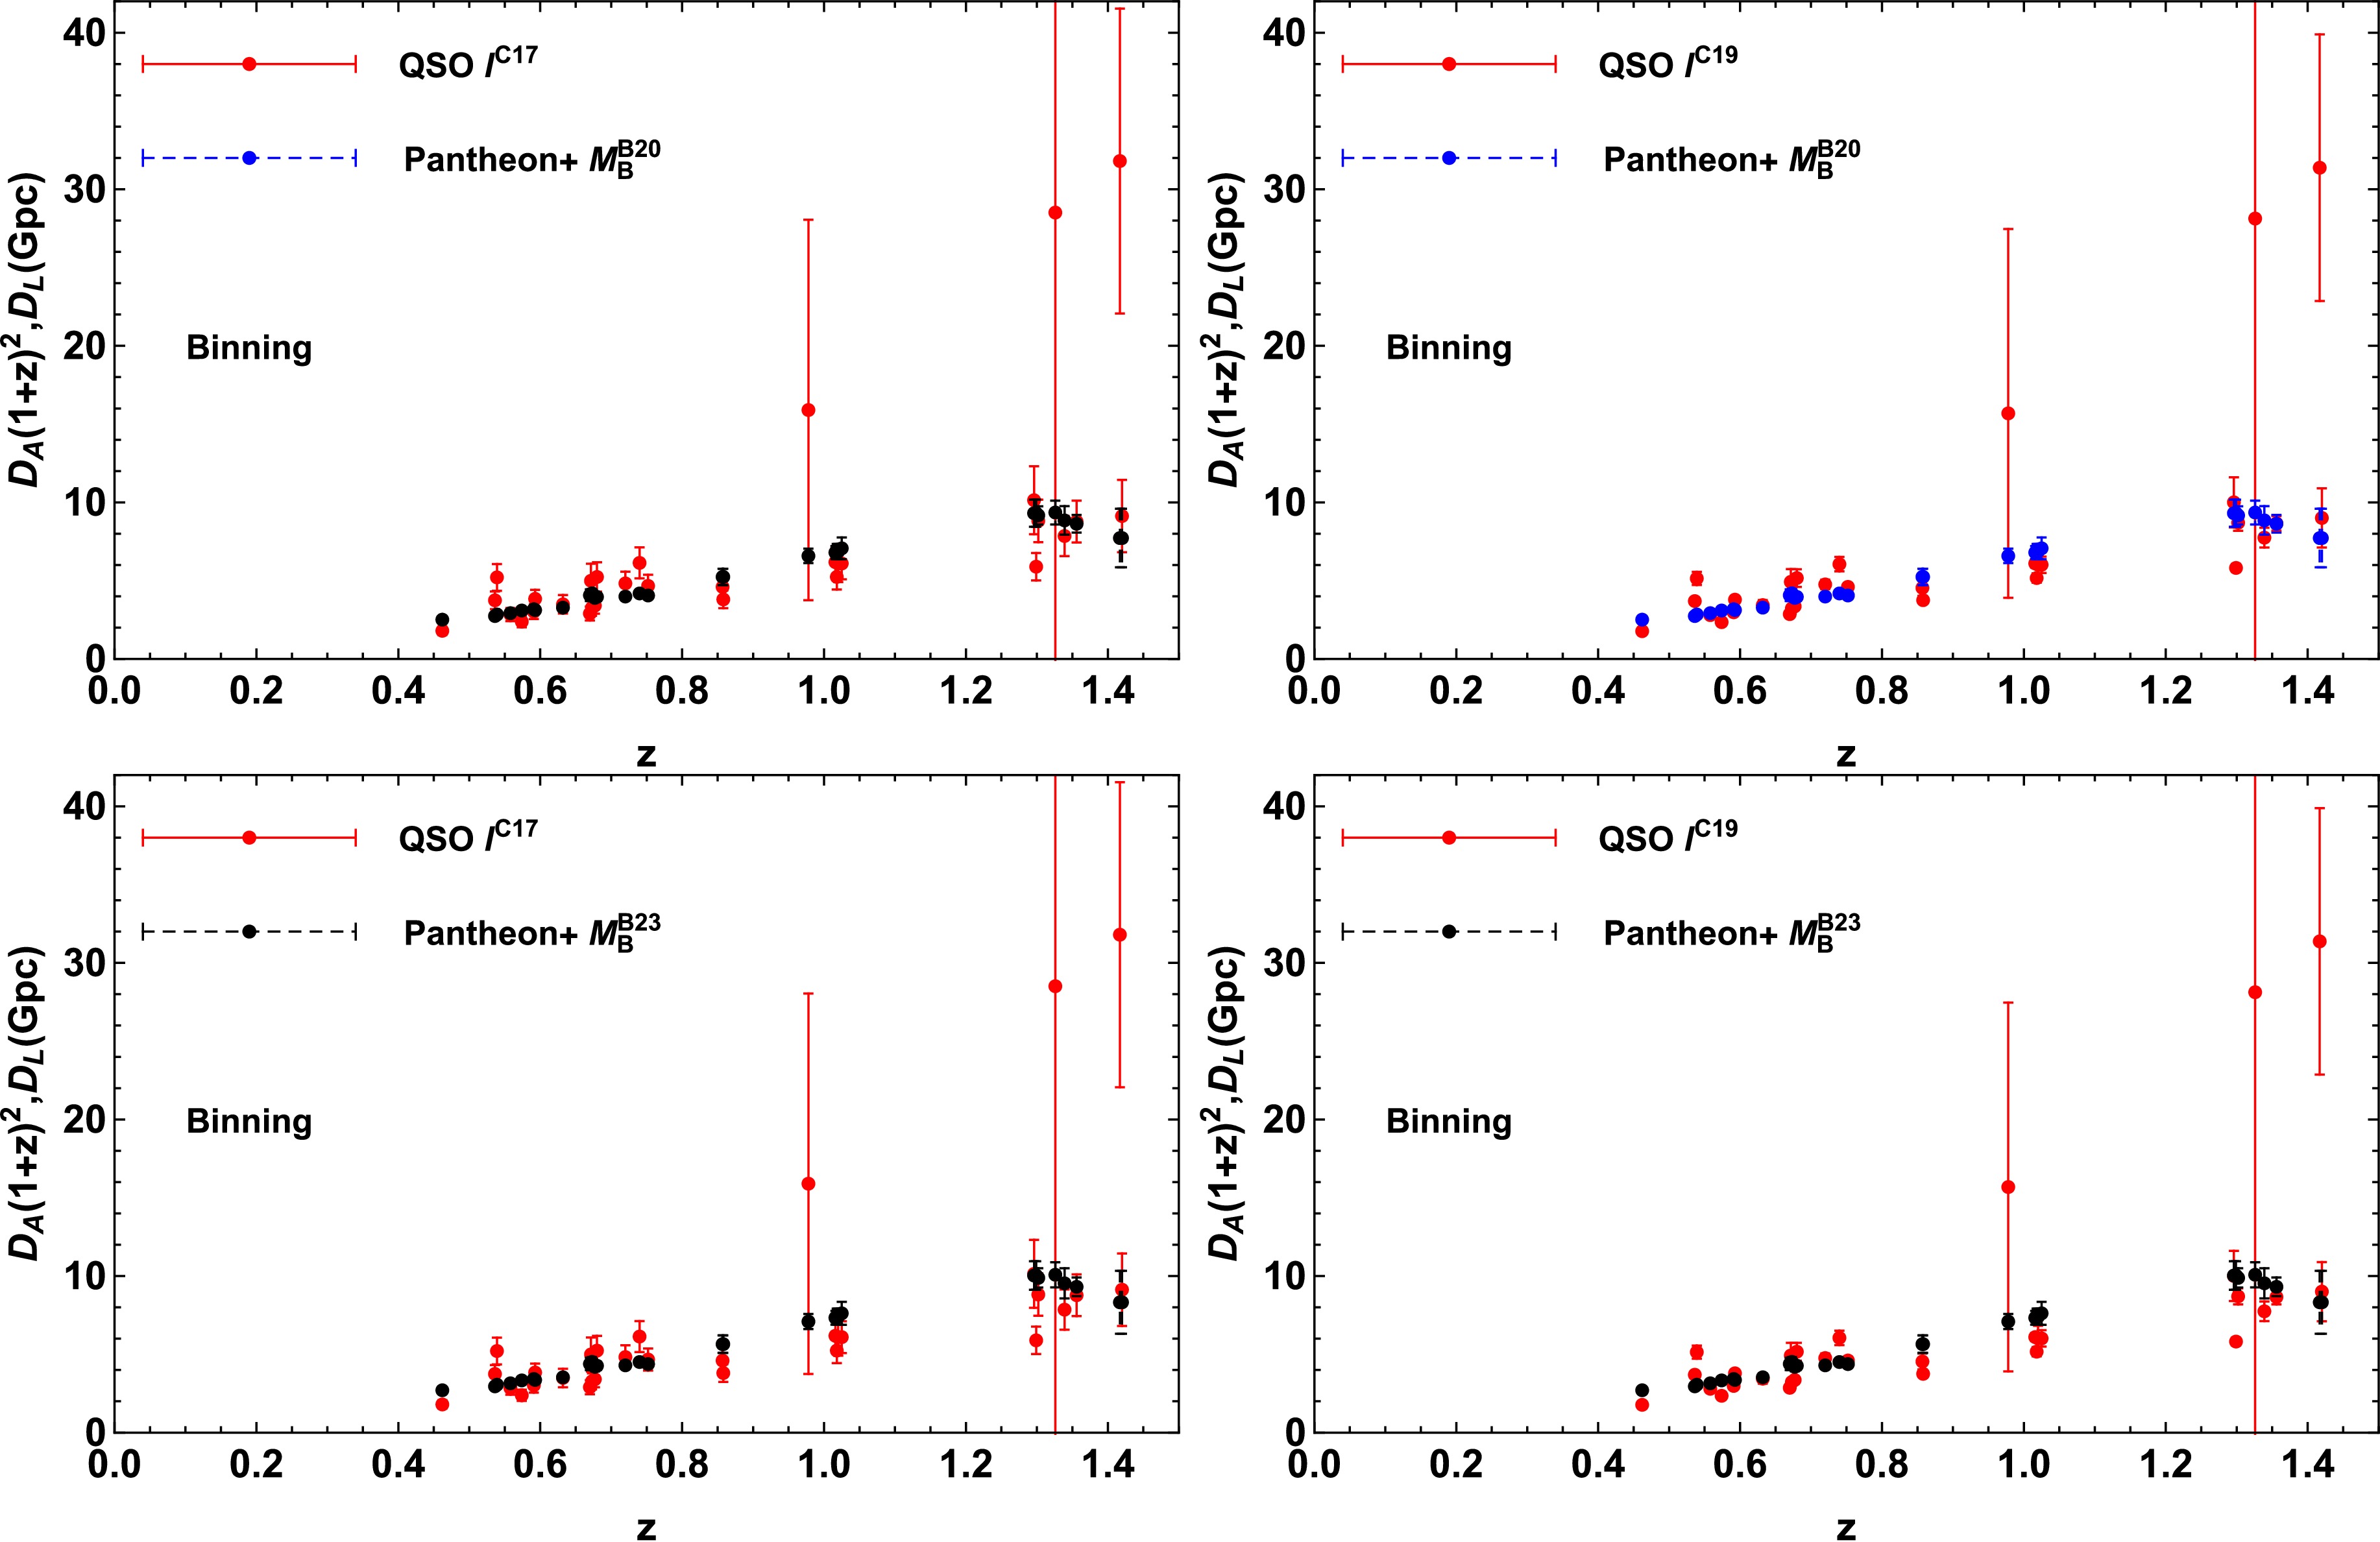
Figure 1. (color online) Sample catalogs of the observed
$ D_{\rm{A}}(1+z)^2 $ distribution from the QSO data points and corresponding LD$ D_{\rm{L}} $ from Pantheon+ data obtained with the priors of$ M_{\rm{B}}^{\rm{D20}} $ (upper panel),$ M_{\rm{B}}^{\rm{B23}} $ (bottom panel),$ l^{\rm{C17}} $ (left panel), and$ l^{\rm{C19}} $ (right panel), respectively, in the binning method. -
Errors caused by the mismatch between SNIa and QSO data points must be considered when using selection criteria. In addition, most available QSO data points need to be excluded because they do not meet the selection criteria given that the density distribution of SNIa data differs from that of the QSO data in certain redshift regions. To improve the robustness of QSO data when testing the CDDR, we employ the ANN to reconstruct the smoothing
$ m_{\rm{B}}(z) $ function from the Pantheon+ SNIa observations. Therefore, each ADD obtained from the QSO sample located within the redshift range of Pantheon+ SNIa has a corresponding LD of SNIa at the same redshift.An ANN is a deep learning algorithm that includes three layers: an input layer, a hidden layer, and an output layer. The input layer comprises n nodes, each of which corresponds to an independent variable, followed by m interconnected hidden layers and the output layer with activation function nodes in the basic architecture [77]. The ANN estimates the error gradient from observations in the training dataset, and then, it updates the model weights and bias estimates during the back propagation process to iterate toward an optimal solution through Adam optimization [78]. The ANN process can be described by vectorization representation, and more details are available in Refs. [79–81].
We use the publicly available code named reconstructing functions using artificial neural networks (ReFANN)
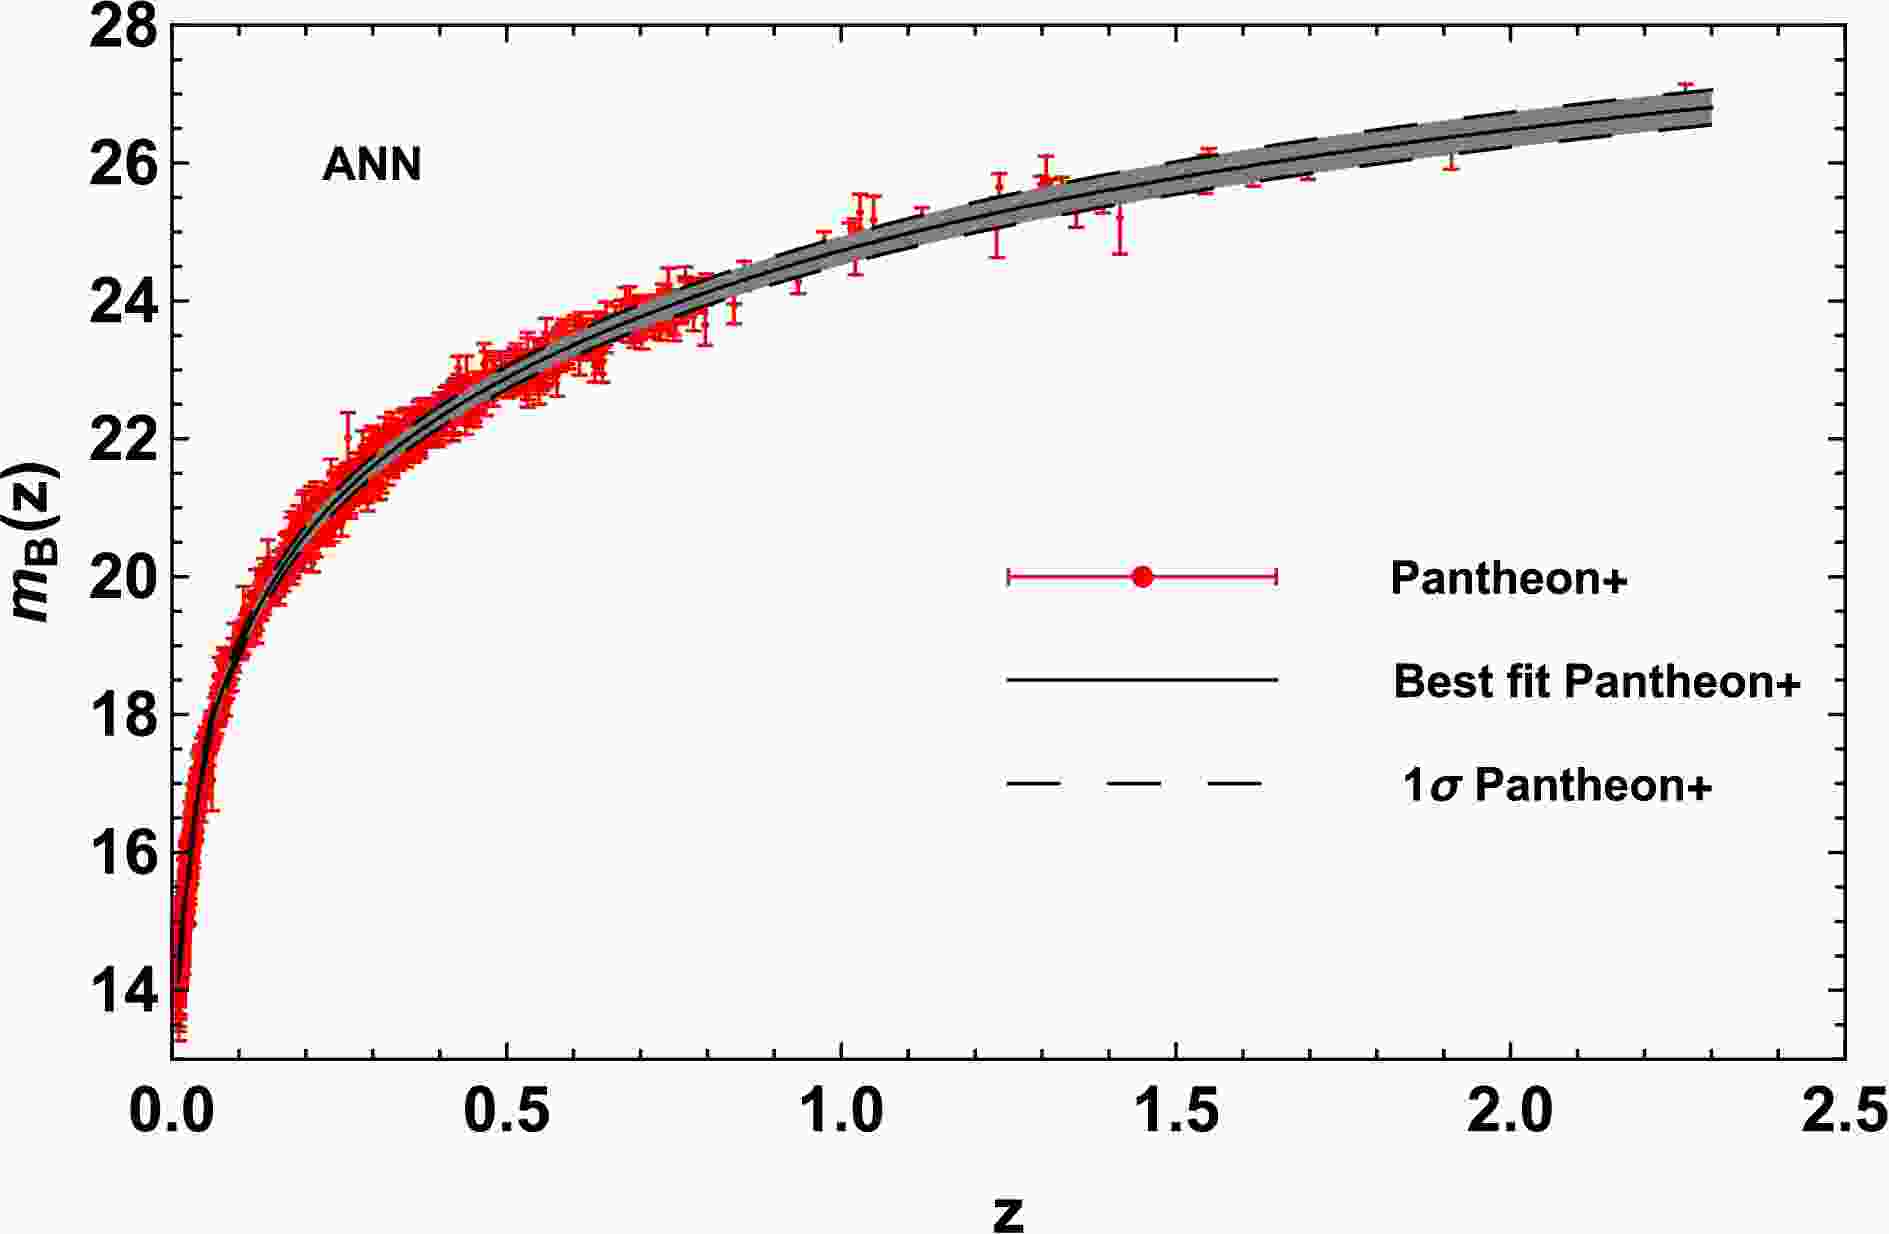
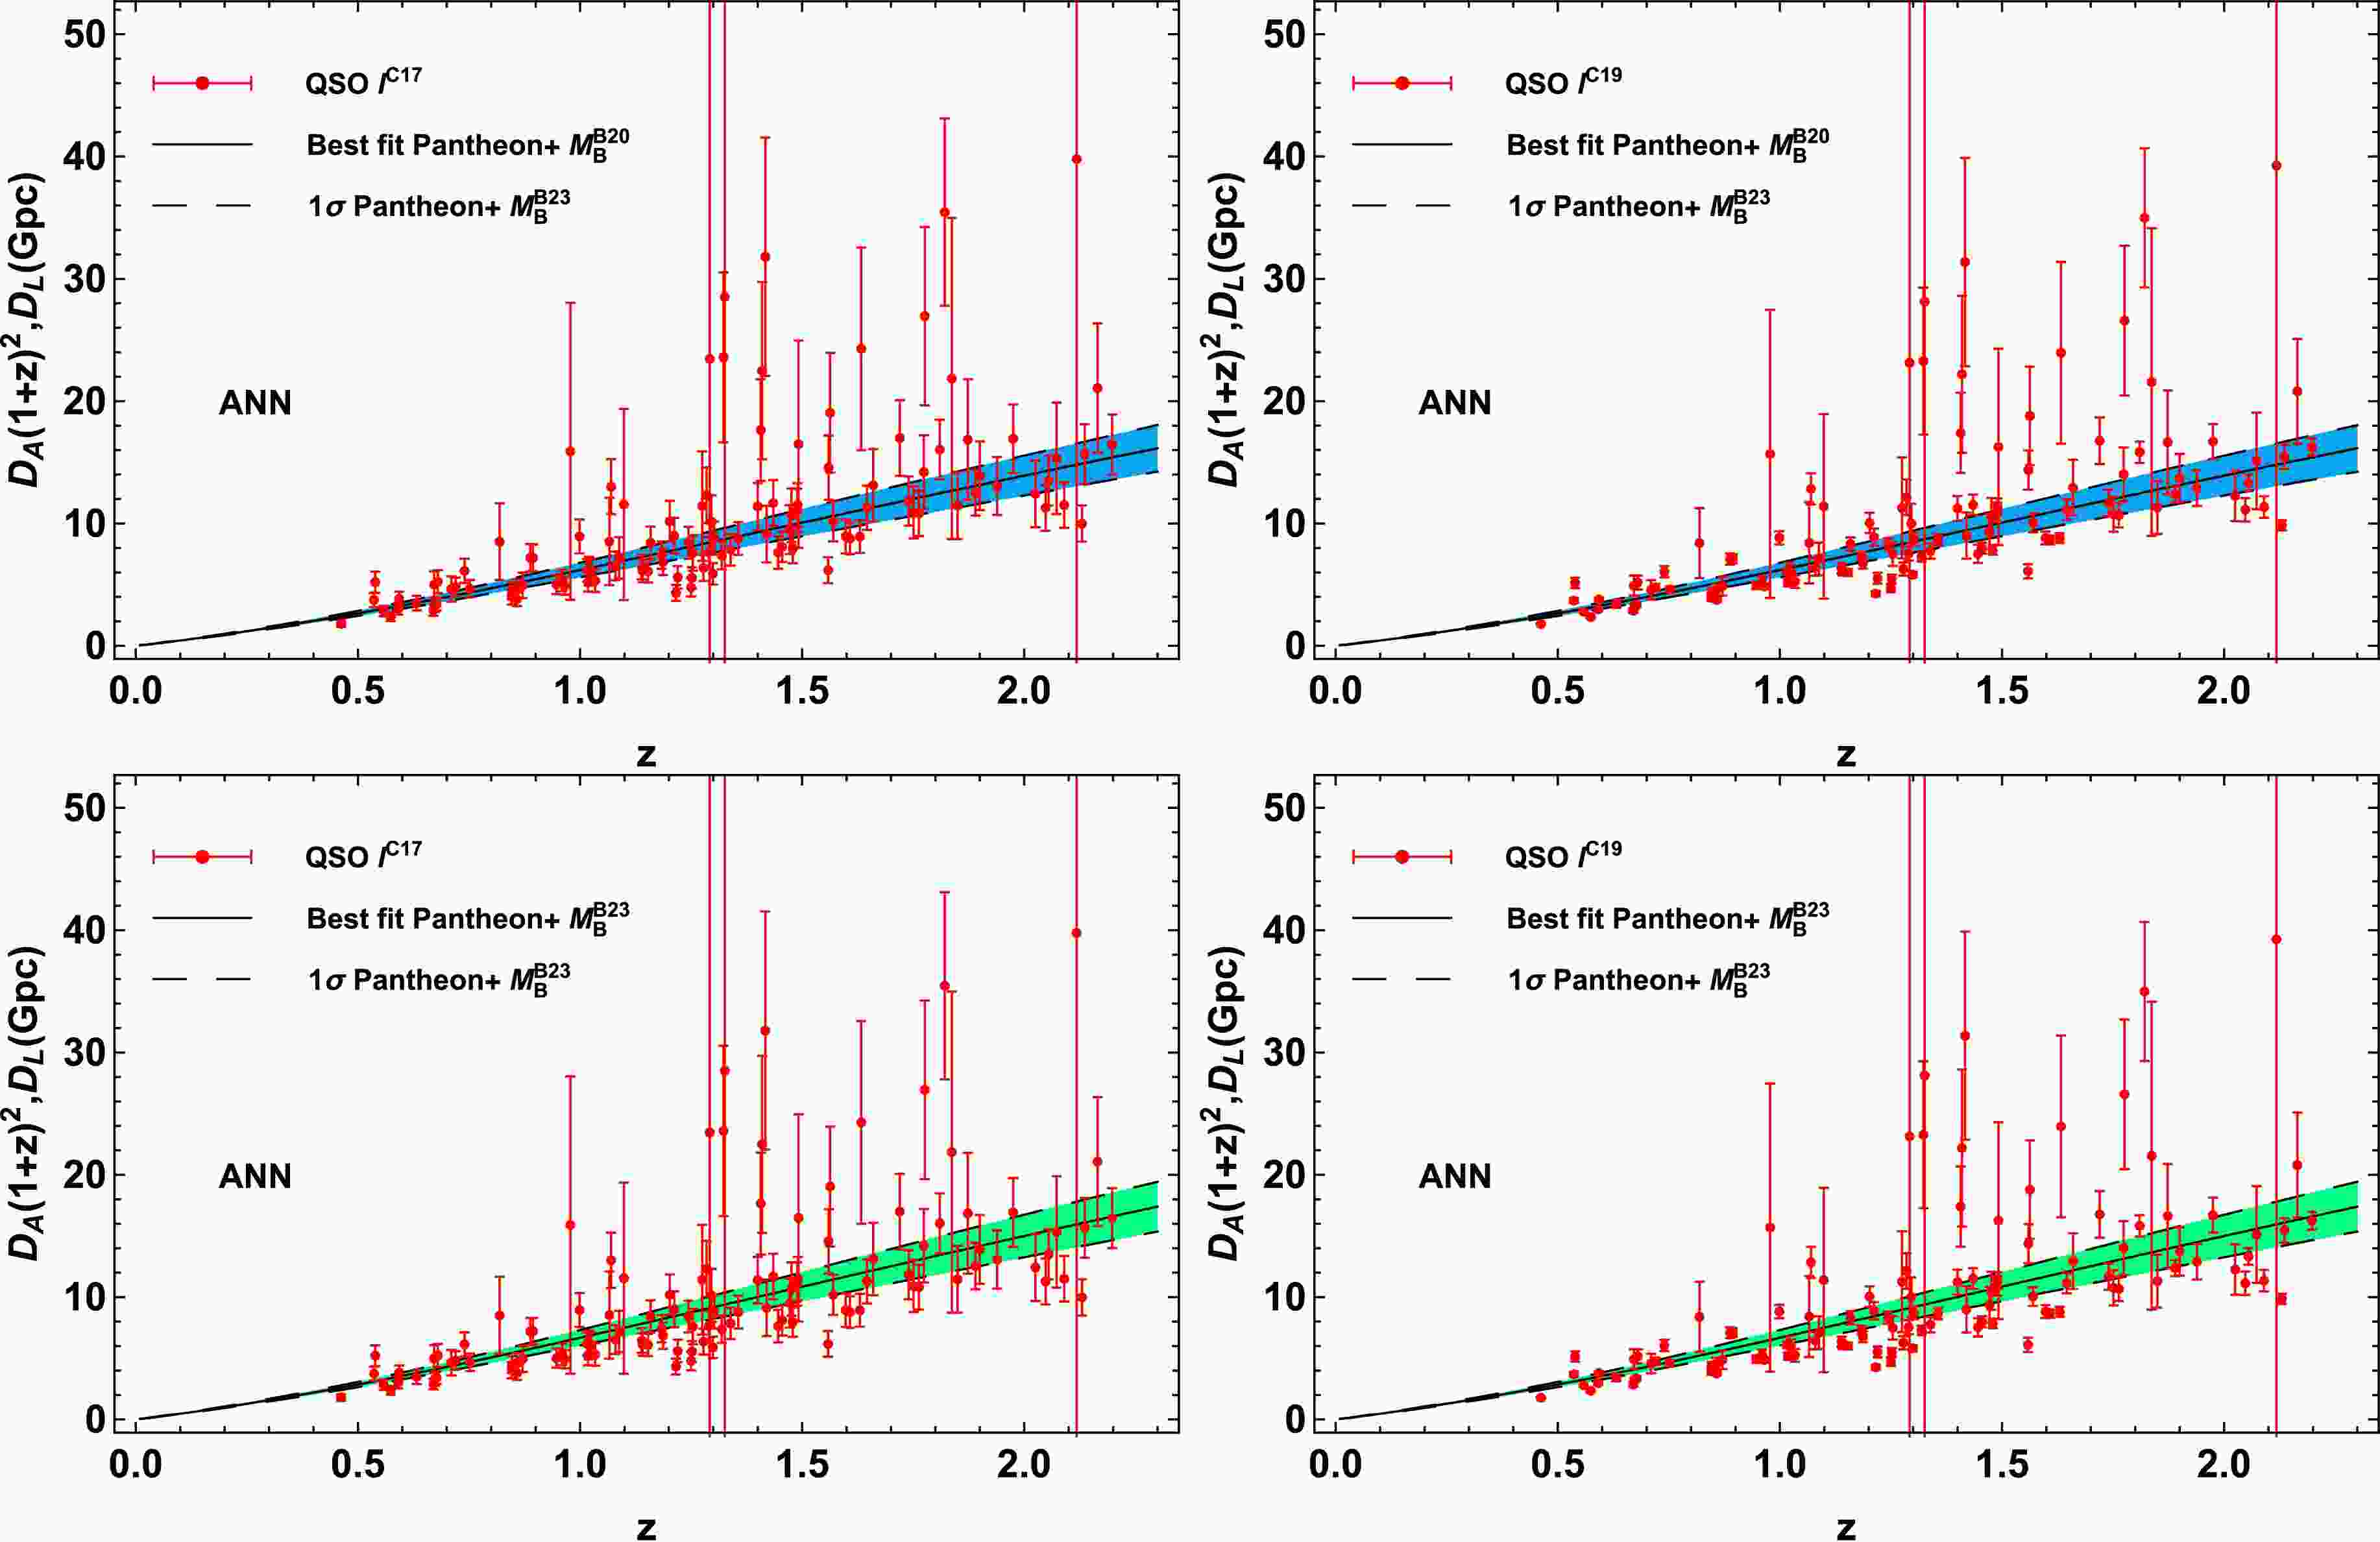
1 [79] to reconstruct the function of apparent magnitude$ m_{\rm{B}} $ versus redshift z, as shown in Fig. 2. Evidently, the uncertainty obtained from the ANN-reconstructed function are close to the observational uncertainty, and the reconstructed$ 1\sigma $ CL of the$ m_{\rm{B}} $ can be considered the average level of the observational error. The LD$ D_{\rm{L}} $ corresponding to ADD$ D_{\rm{A}} $ from the QSO data points can be obtained through the smoothing function$ m_{\rm{B}}(z) $ reconstructed by ANN. For the QSO samples, 116 QSO data points within the redshift range of the SNIa observation$ 0 < z < 2.26 $ can be matched with those from the SNIa observation at the same redshift. The remaining four QSO samples that are not within this redshift range are discarded. The distributions of the QSO data and reconstructed SNIa data derived from different priors of$ M_{\rm{B}} $ and l are shown in Fig. 3.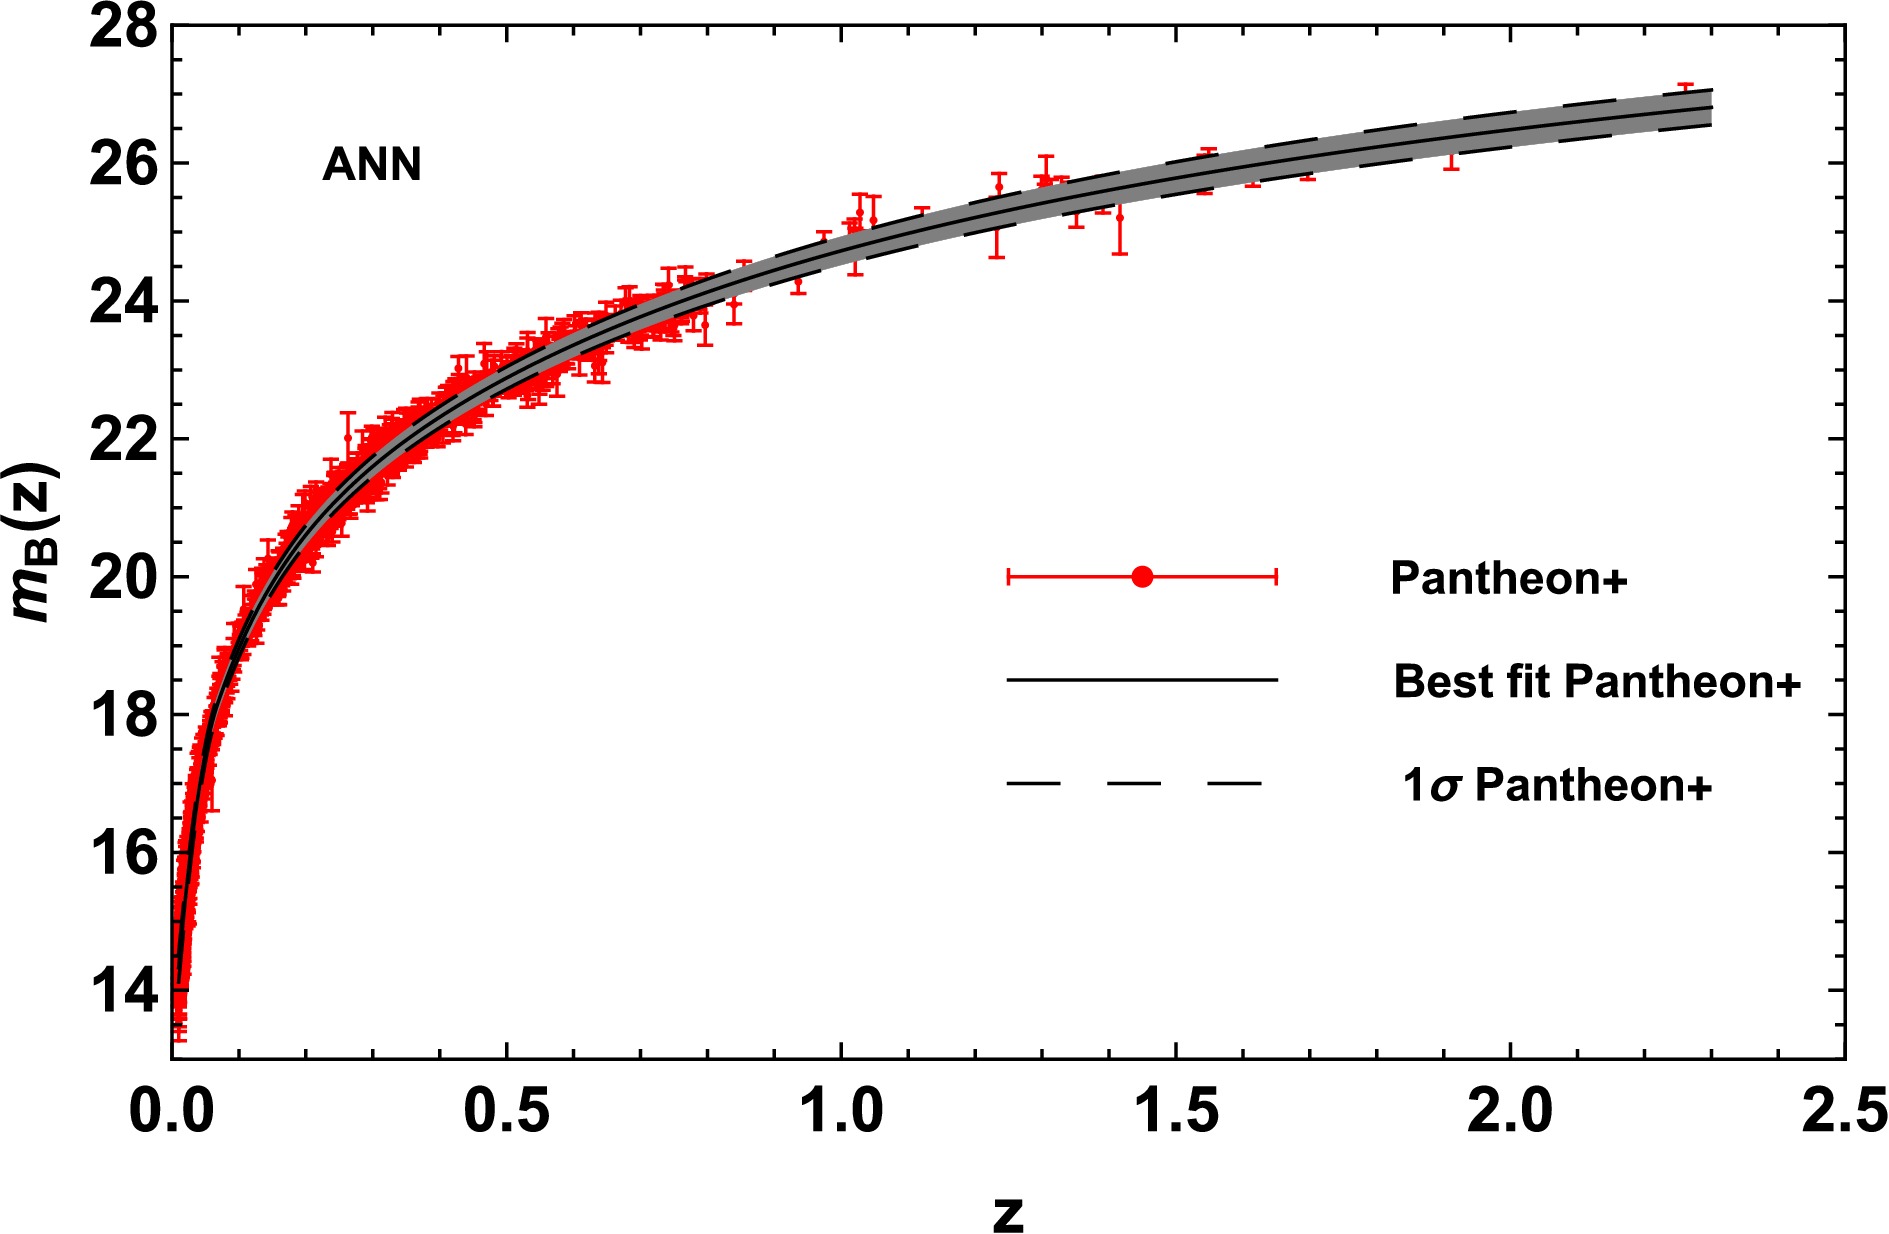
Figure 2. (color online) Distributions of the reconstructed
$ m_{\rm{B}}(z) $ function with the corresponding$ 1\sigma $ errors with the ANN (black line) and the measurements of the apparent magnitude from the Pantheon+ samples (red).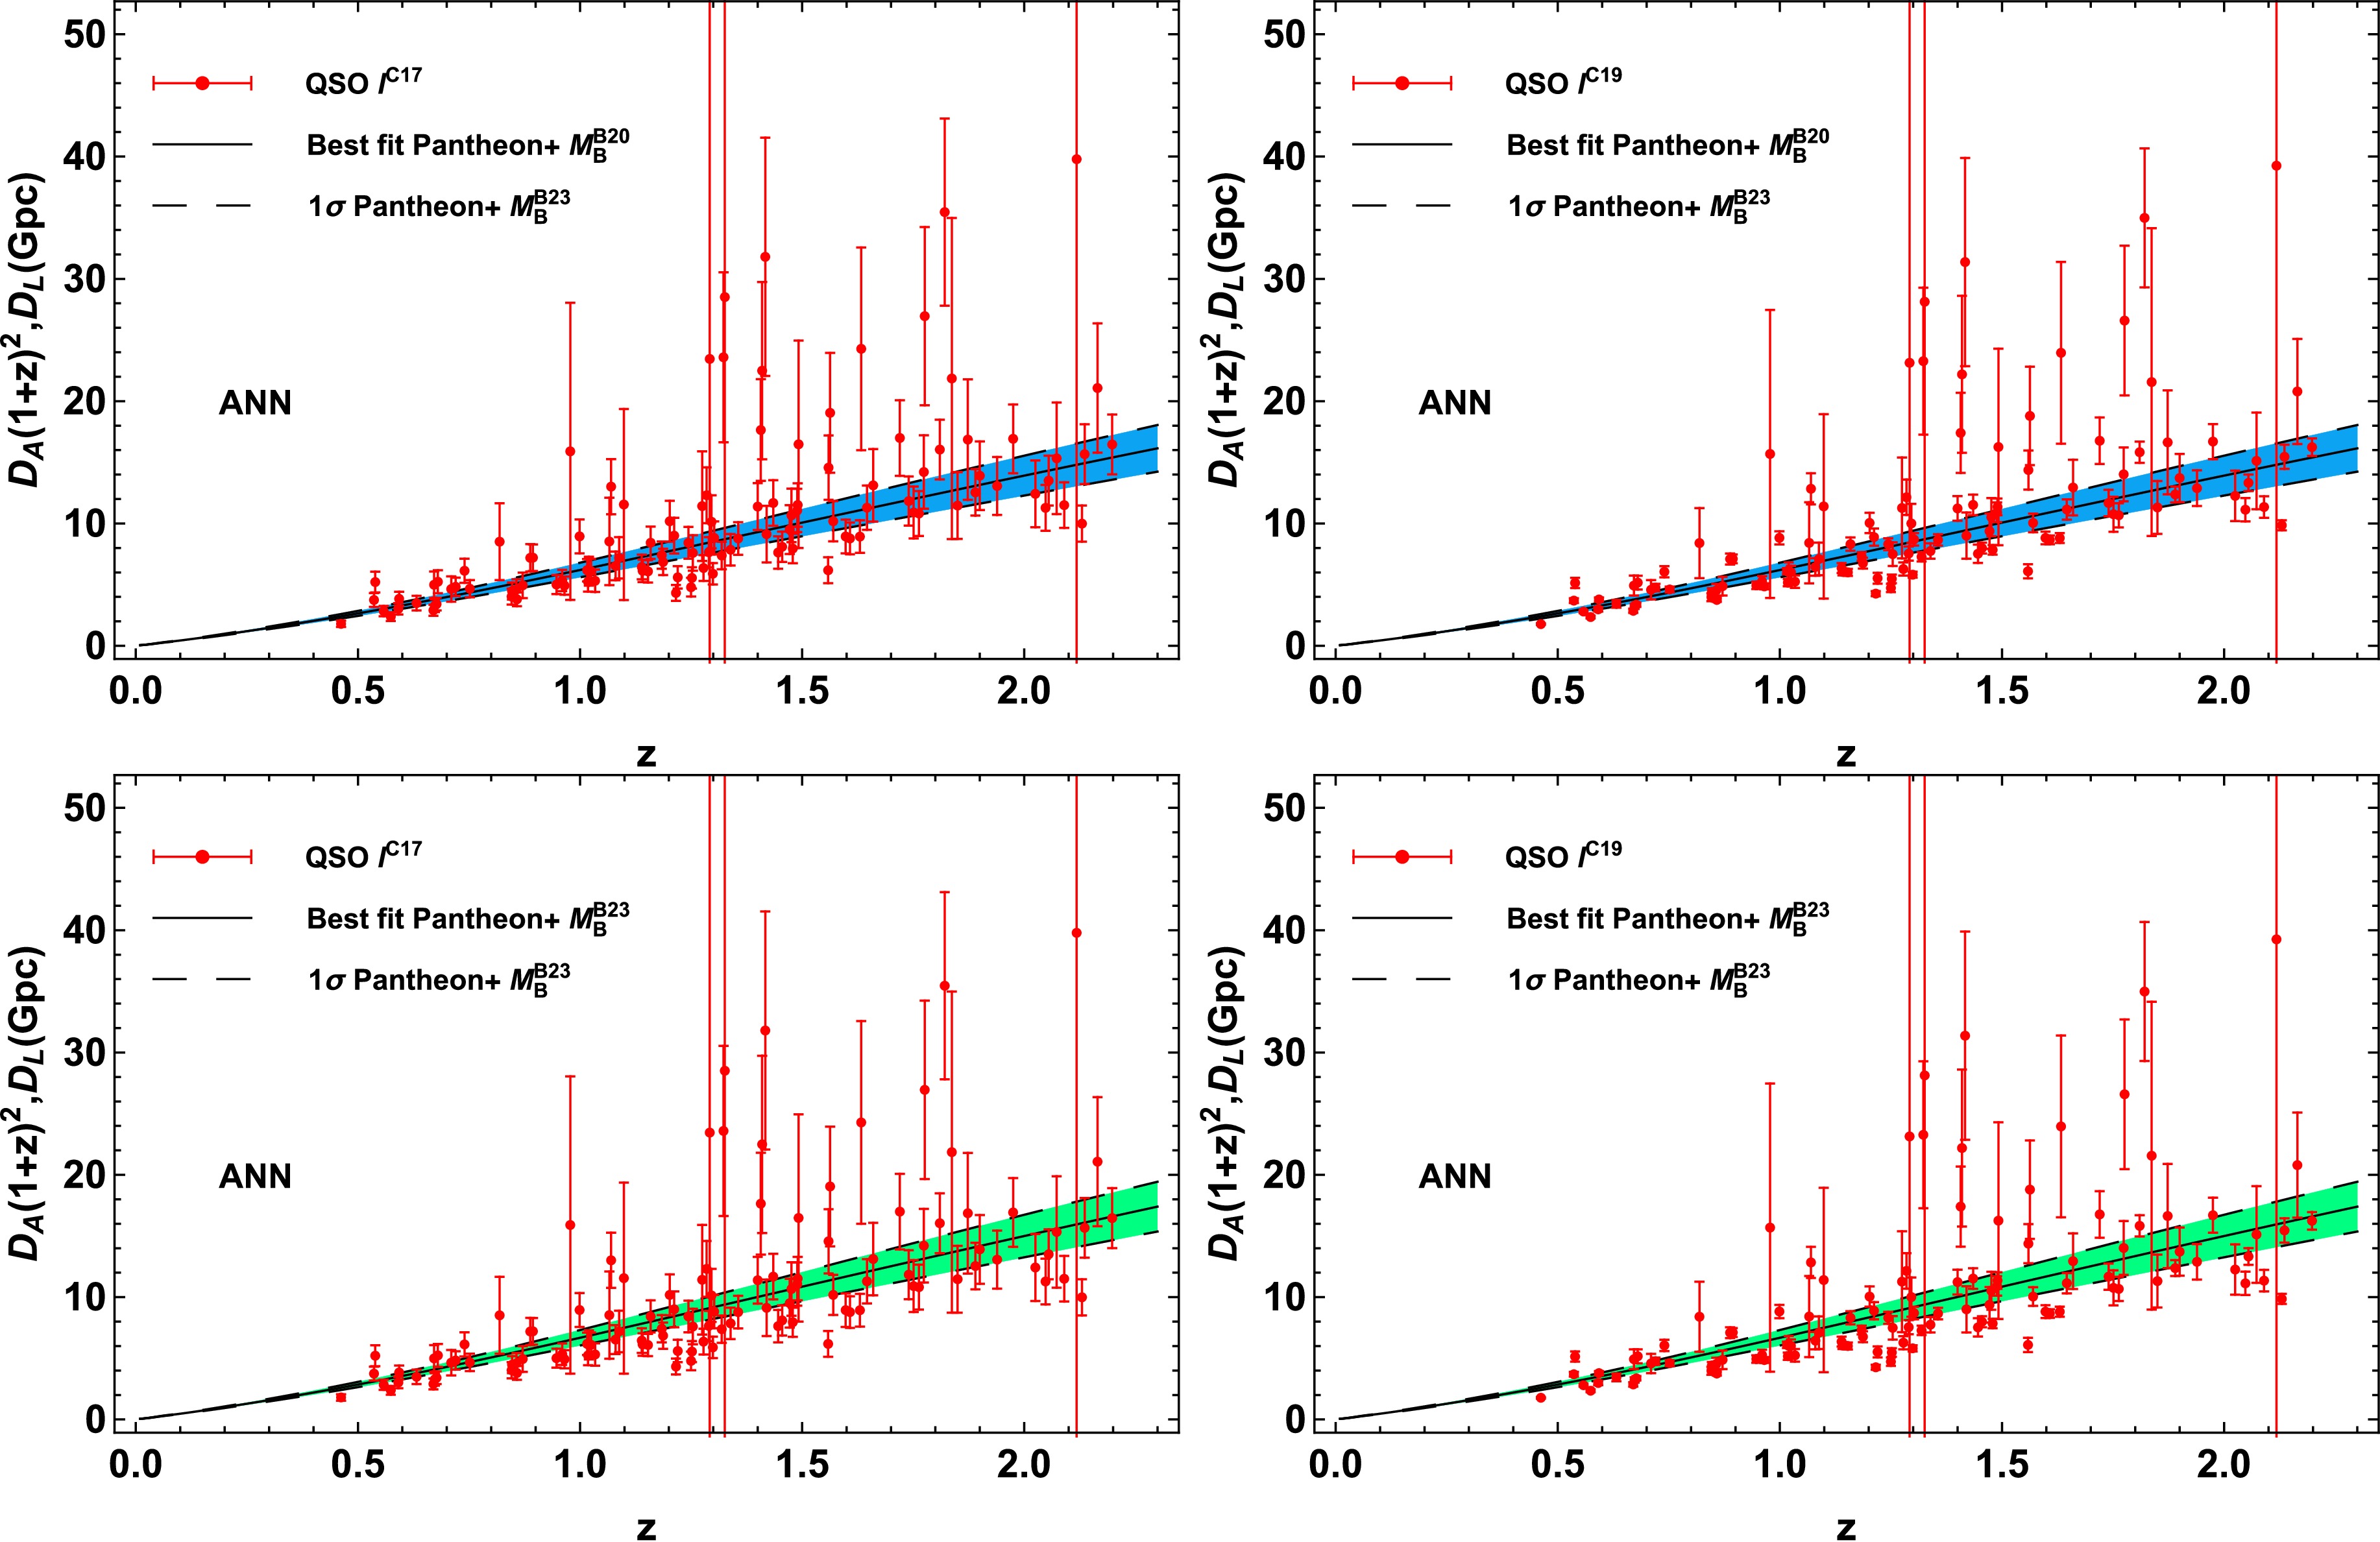
Figure 3. (color online) Sample catalogs of the observed
$ D_{\rm{A}}(1+z)^2 $ distribution from the QSO data points derived with the priors of$ l^{\rm{C17}} $ (left panel) and$ l^{\rm{C19}} $ (right panel) and the LD$ D_{\rm{L}} $ curves from the Pantheon+ data derived with the priors of$ M_{\rm{B}}^{\rm{D20}} $ (upper panel) and$ M_{\rm{B}}^{\rm{B23}} $ (bottom panel). -
We adopt the
$ \eta(z) $ function to verify any possible deviations from the CDDR at any redshift by comparing the$ D_{\rm{L}} $ from SNIa and the$ D_{\rm{A}} $ from the QSO measurements. The$ \eta(z) $ can be obtained through$ \eta(z)={D_{\rm{L}}\over D_{\rm{A}}}{(1+z)^{-2}}\,. $

(8) At any redshift,
$ \eta(z)\neq 1 $ indicates a deviation between the CDDR and astronomical observations.We adopt three types of parameterizations for
$ \eta(z) $ : the linear form P1,$ \eta(z)=1+\eta_0z $ , and two non-linear forms P2,$ \eta(z)=1+\eta_0z/(1+z) $ , and P3,$ \eta(z)=1+ \eta_0\ln(1+z) $ . The observed$ \eta_{\rm{obs}} (z) $ is obtained from Eq. (8), and the corresponding error can be written as$ \sigma^2_{\eta_{\rm{obs}}}=\eta^2_{\rm{obs}}\left[\left({\sigma_{D_{\rm{A}}(z)}\over{D_{\rm{A}}(z)}}\right)^2+\left(\sigma_{D_{\rm{L}}(z)} \over{D_{\rm{L}}(z)}\right)^2\right]\,. $

(9) Thus, we obtain
$ \chi^{2}(\eta_0)=\sum\limits_i^{N}\frac{{\left[\eta(z)-\eta_{{\rm{obs}},\,i}(z) \right] }^{2}}{\sigma^2_{\eta_{{\rm{obs}},i}}}\,. $

(10) where N represents the number of available QSO data points obtained the binning method or ANN. The constraint results on
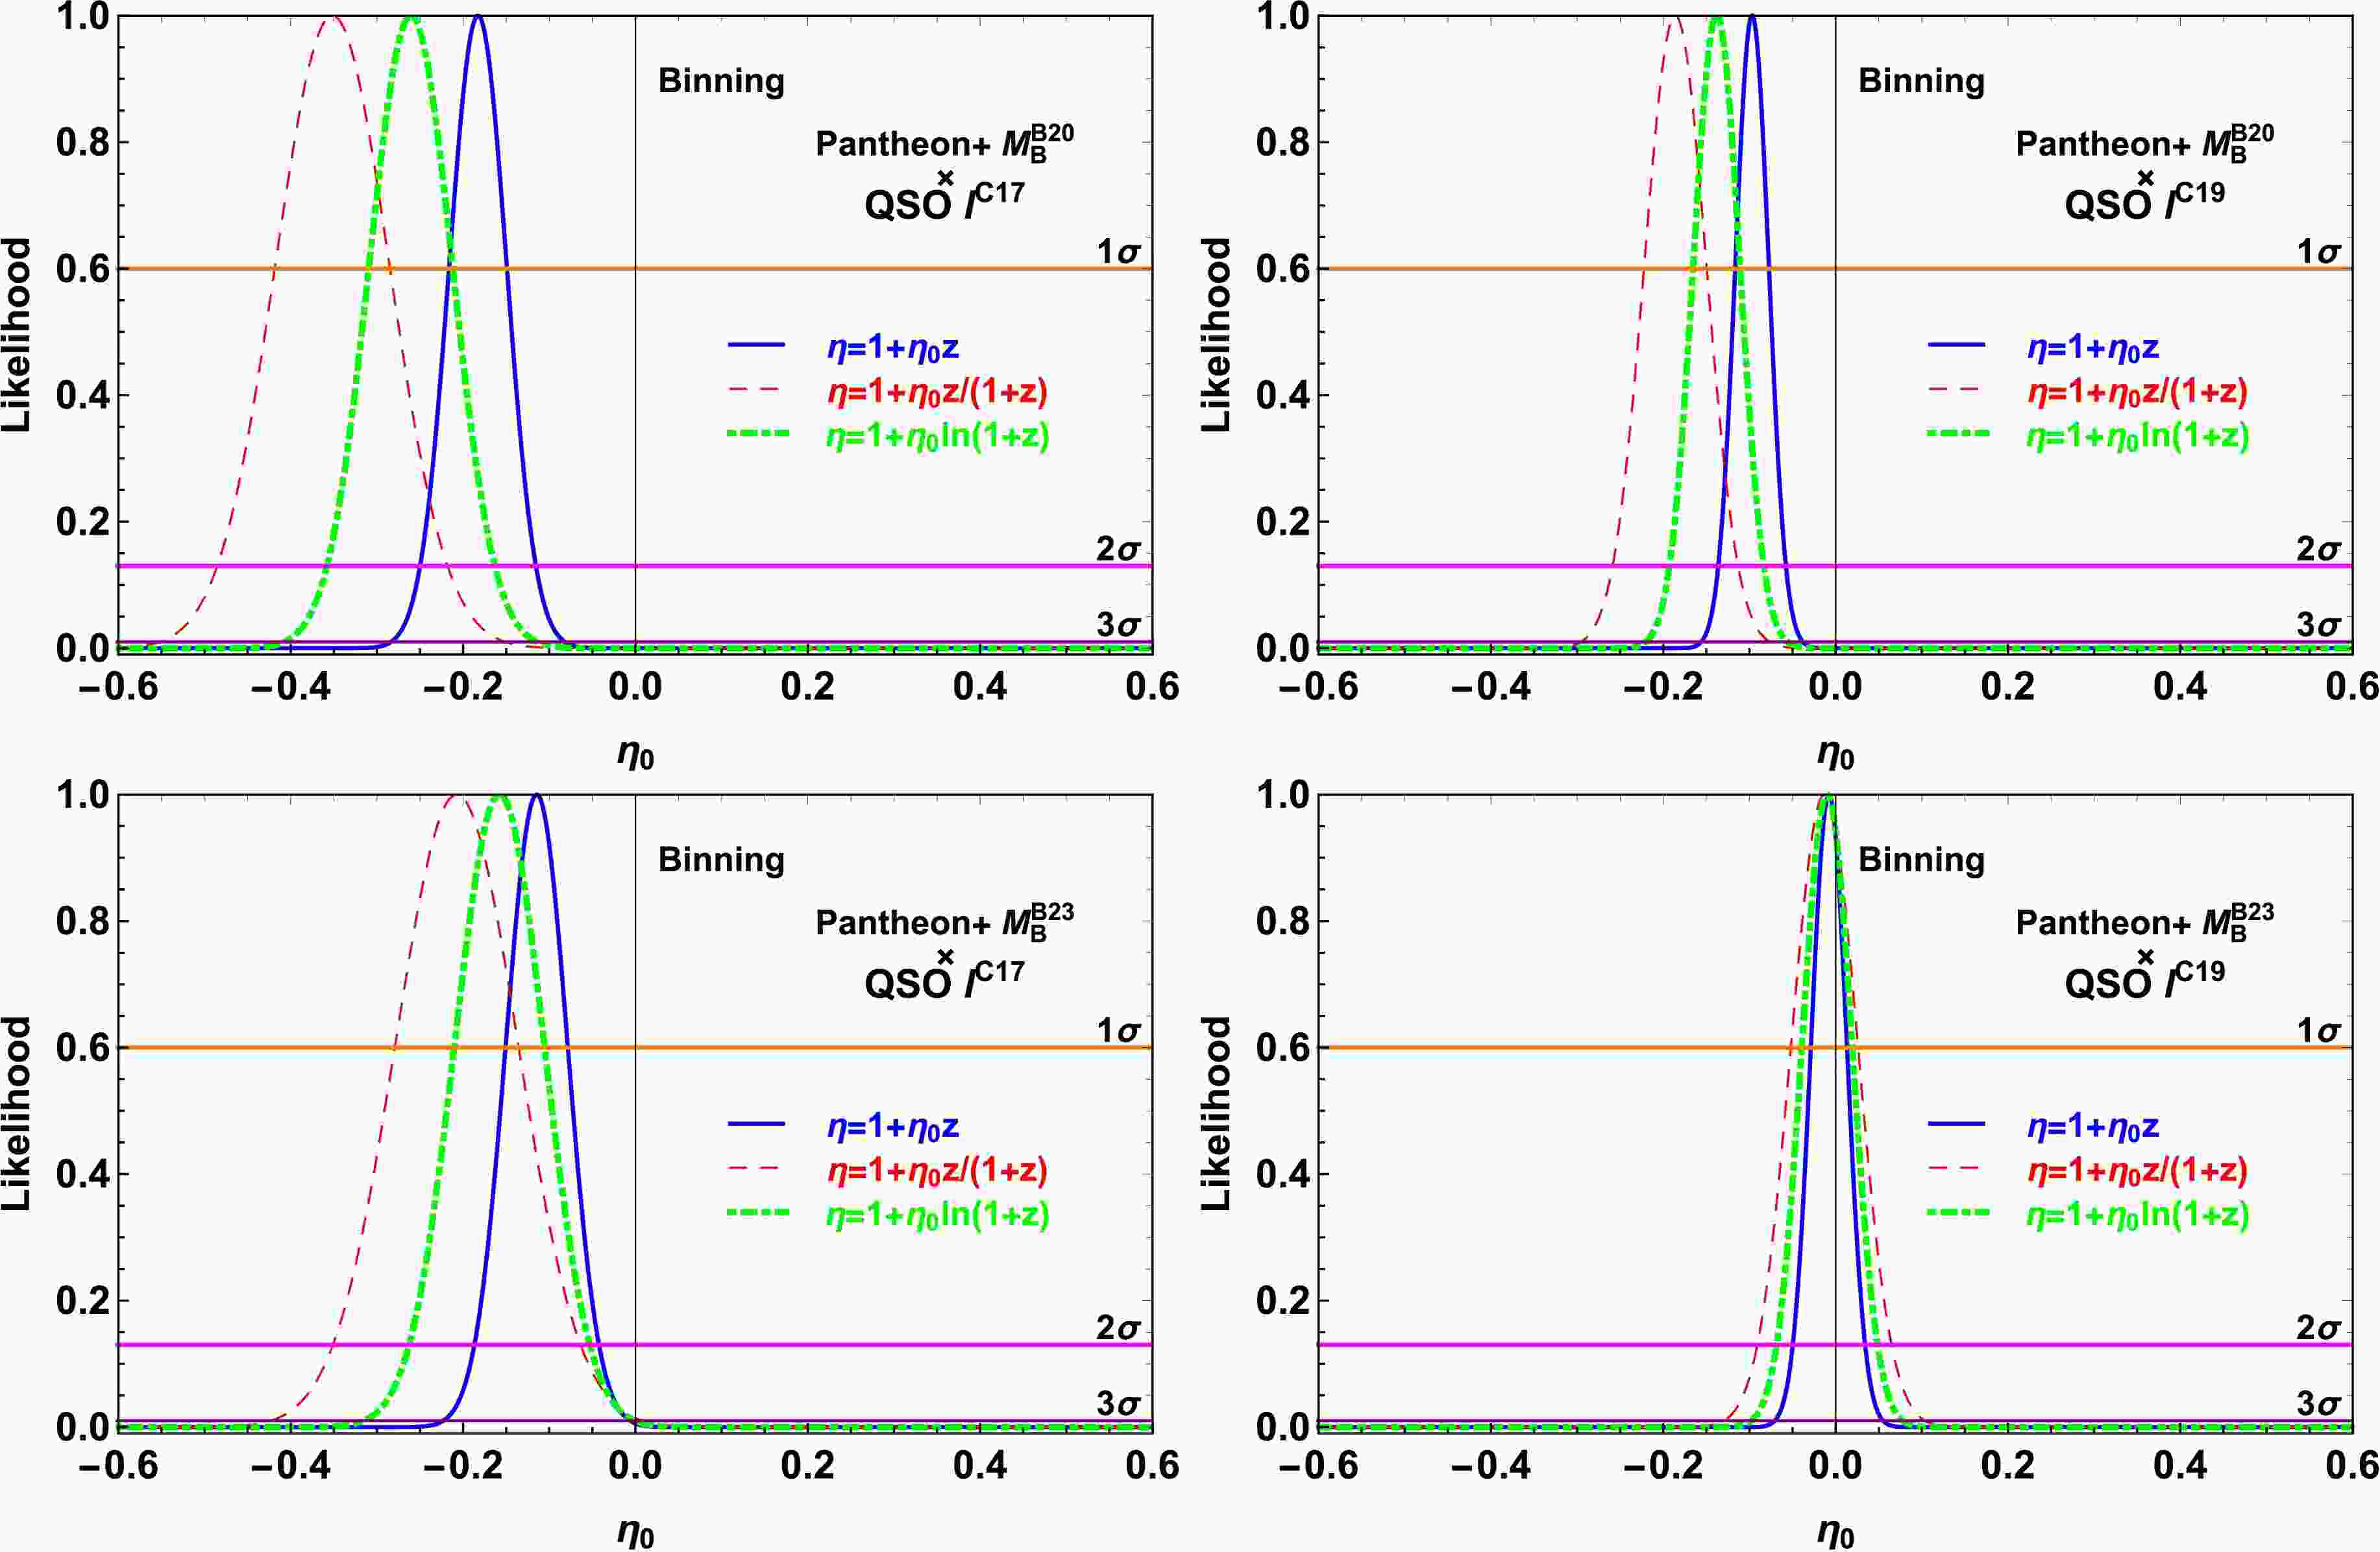
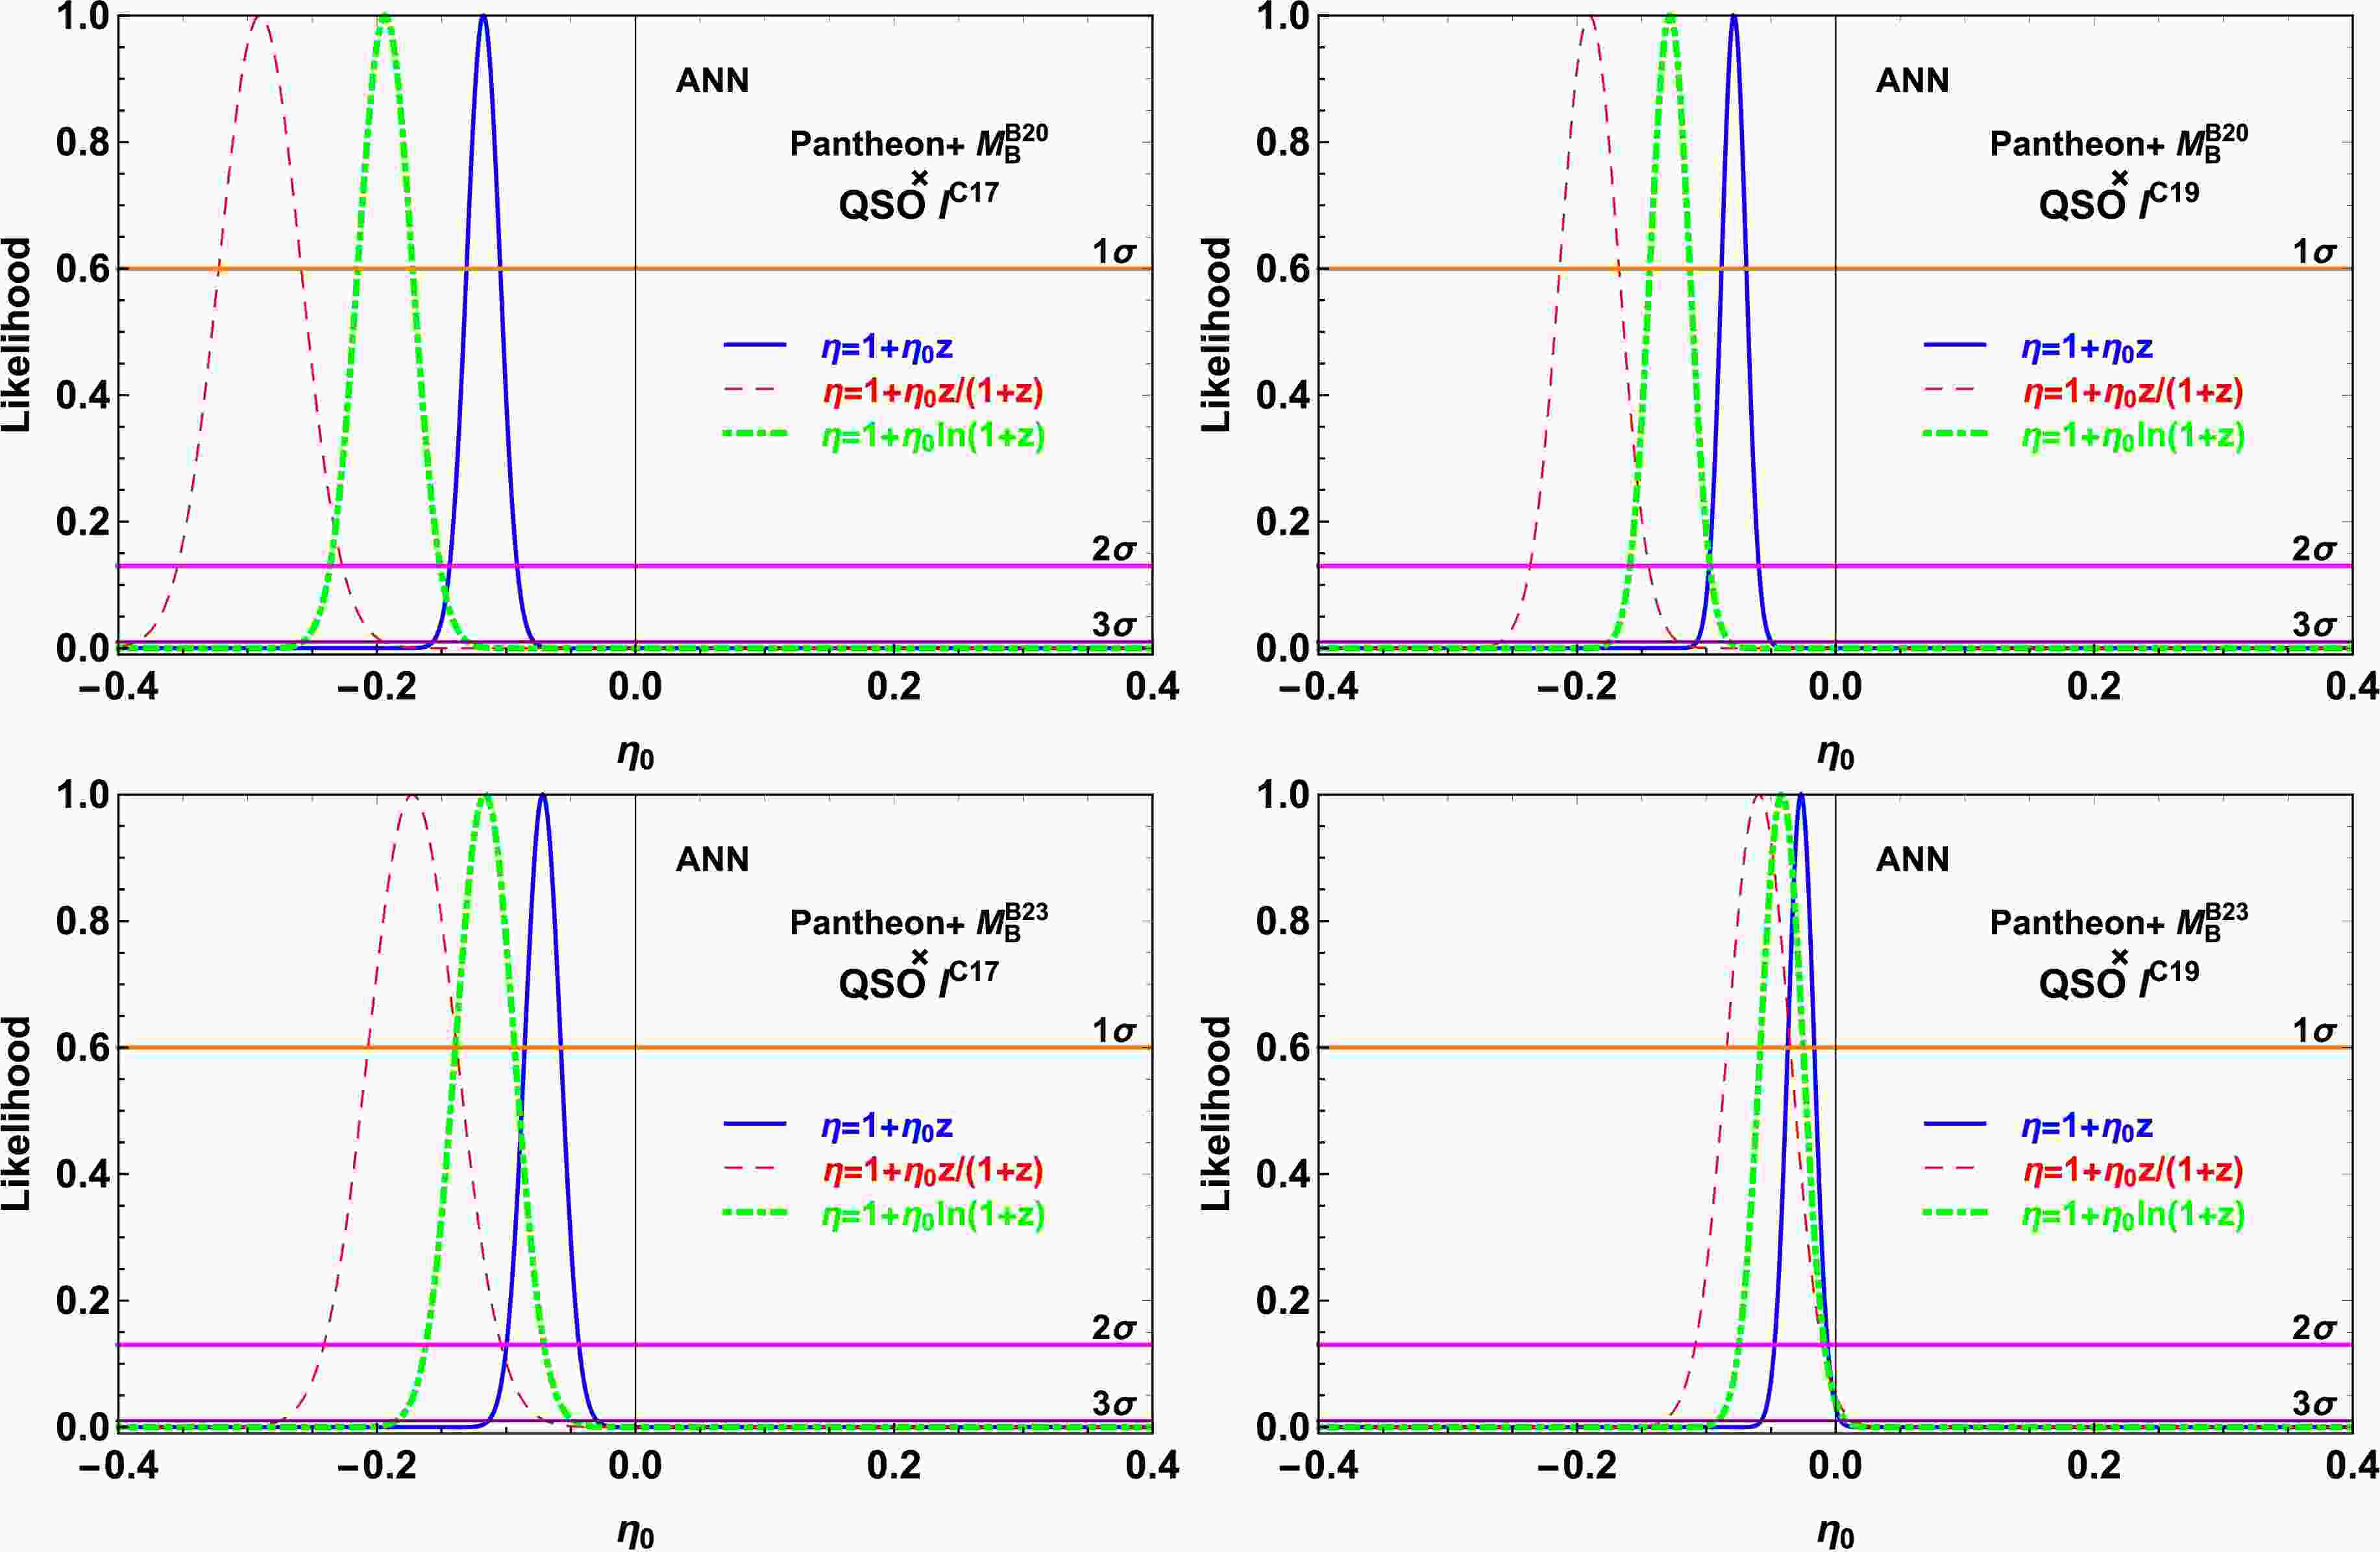
$ \eta_0 $ are shown in Fig. 4, Fig. 5, and Table 1. The results obtained from the parametric method depend on the prior values of$ M_{\rm{B}} $ or l. Thus, specific prior values of$ M_{\rm{B}} $ or l cause biases in the CDDR test if their true values are not determined by astronomic observations.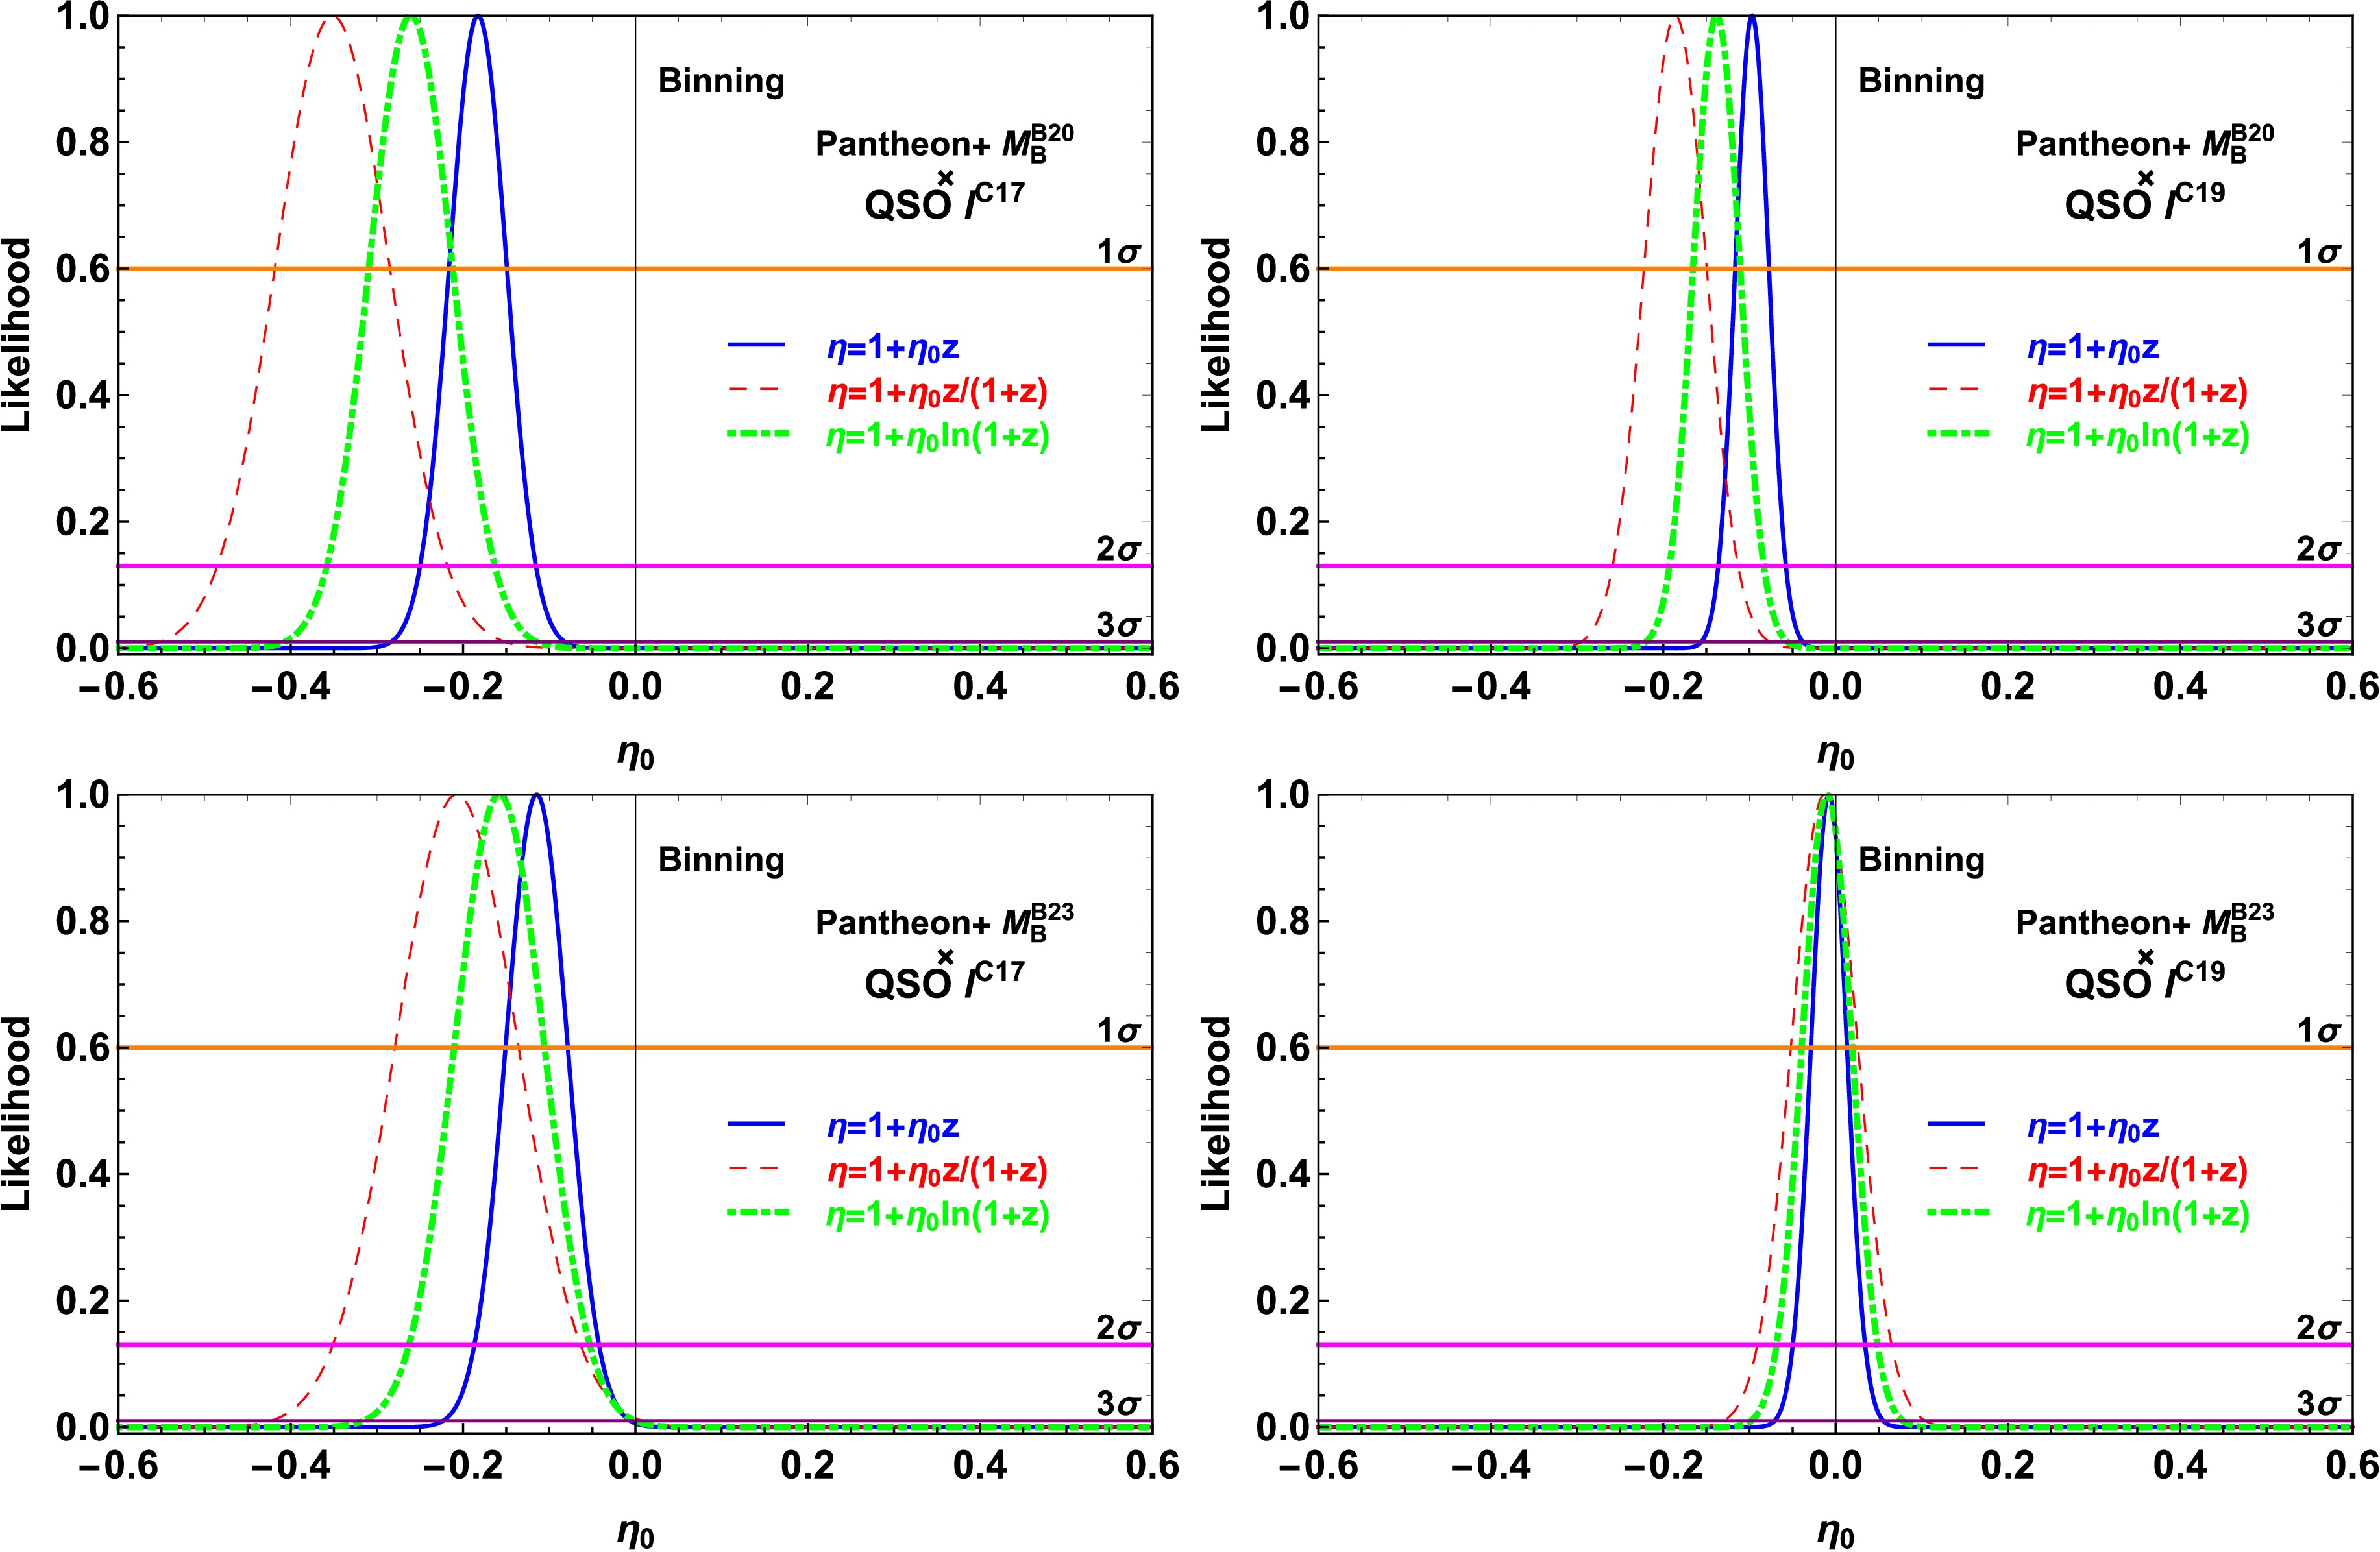
Figure 4. (color online) Likelihood distribution functions obtained with the priors of
$ M_{\rm{B}}^{\rm{D20}} $ (upper panel),$ M_{\rm{B}}^{\rm{B23}} $ (bottom panel),$ l^{\rm{C17}} $ (left panel), and$ l^{\rm{C19}} $ (right panel) in the binning method.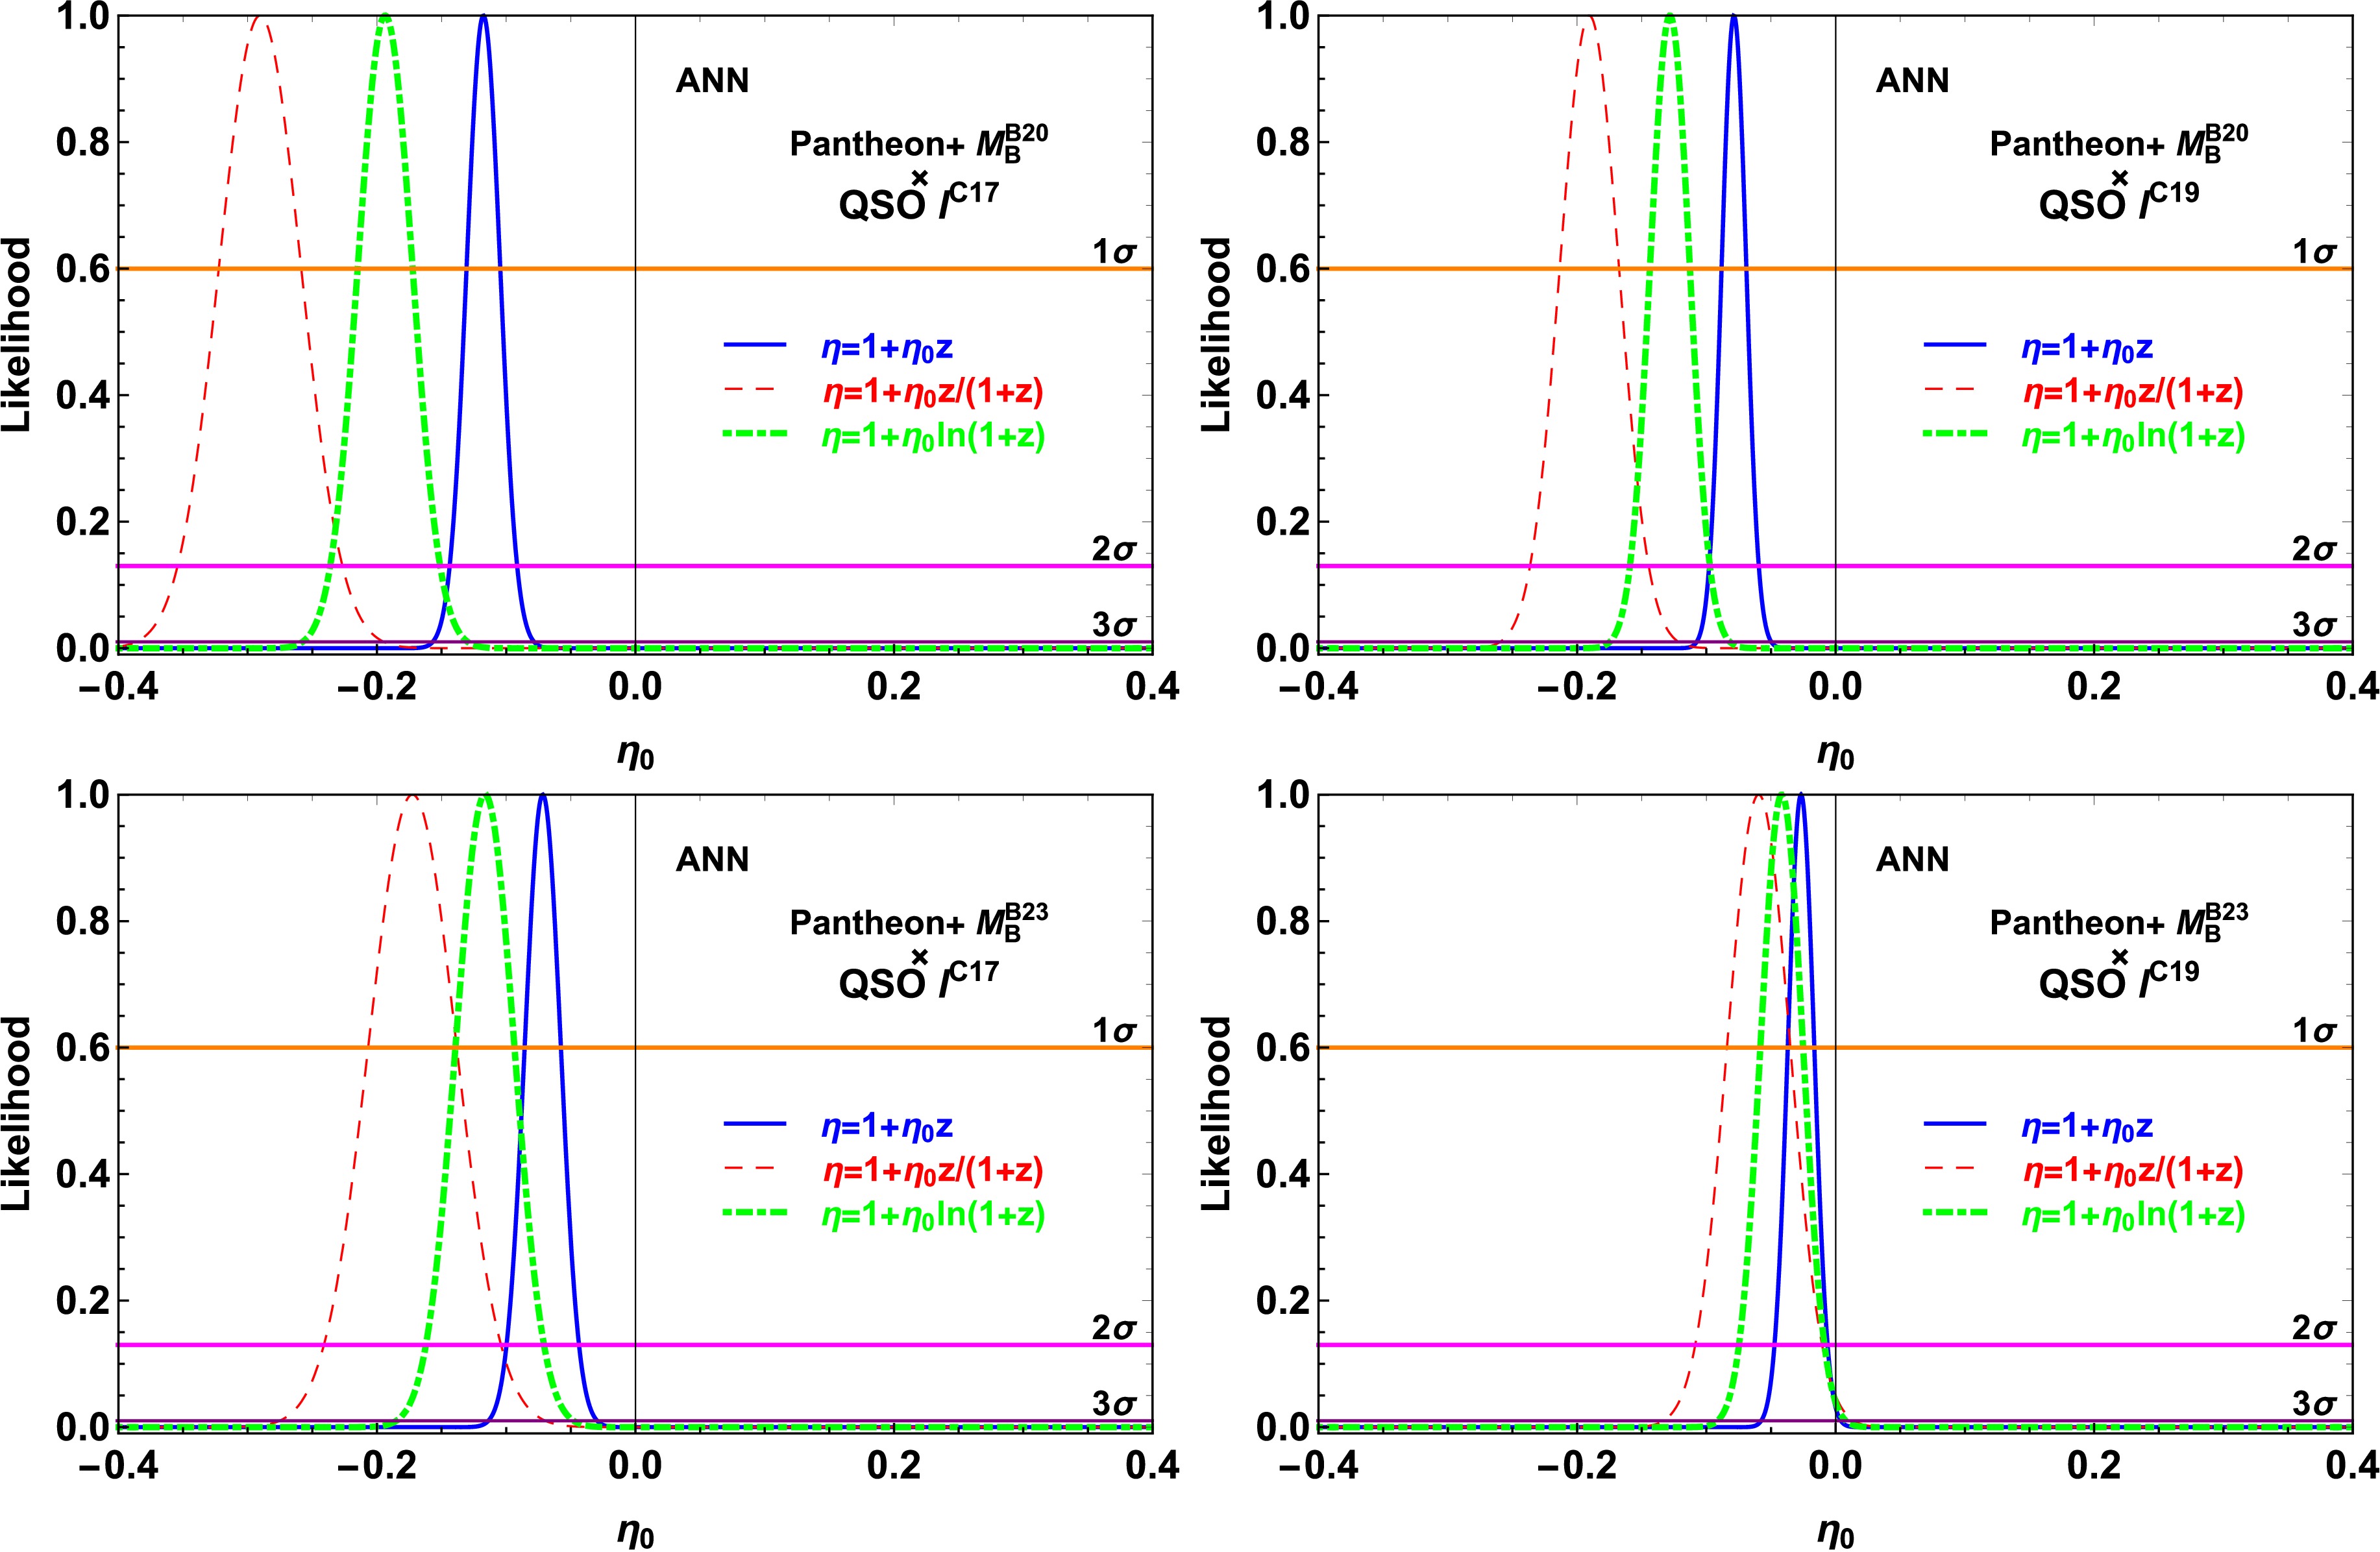
Figure 5. (color online) Likelihood distribution functions obtained with the priors of
$ M_{\rm{B}}^{\rm{D20}} $ (upper panel),$ M_{\rm{B}}^{\rm{B23}} $ (bottom panel),$ l^{\rm{C17}} $ (left panel), and$ l^{\rm{C19}} $ (right panel) in the ANN.parmetrization P1: $ 1+\eta_0 {z} $ 

P2: $ 1+\eta_0 {z\over(1+z)} $ 

P3: $ 1+\eta_0 {\ln(1+z)} $ 

$ \eta_0^{\rm {A\,C}\dagger} $ 

$ {-0.183\pm0.034\pm0.067\pm0.101} $ 

$ {-0.352\pm0.067\pm0.134\pm0.201} $ 

$ {-0.261\pm0.049\pm0.097\pm0.146} $ 

$ \eta_0^{\rm {A\,C}\ddagger} $ 

$ {-0.118\pm0.013\pm0.026\pm0.039} $ 

$ {-0.290\pm0.032\pm0.064\pm0.096} $ 

$ {-0.194\pm0.021\pm0.043\pm0.064} $ 

$ \eta_0^{\rm {B\,C}\dagger} $ 

$ {-0.115\pm0.036\pm0.072\pm0.109} $ 

$ {-0.207\pm0.072\pm0.144\pm0.216} $ 

$ {-0.158\pm0.052\pm0.105\pm0.158} $ 

$ \eta_0^{\rm {B\,C}\ddagger} $ 

$ {-0.072\pm0.014\pm0.028\pm0.042} $ 

$ {-0.173\pm0.034\pm0.069\pm0.103} $ 

$ {-0.116\pm0.023\pm0.046\pm0.069} $ 

$ \eta_0^{\rm {A\,D}\dagger} $ 

$ {-0.097\pm0.020\pm0.039\pm0.059} $ 

$ {-0.186\pm0.036\pm0.073\pm0.109} $ 

$ {-0.138\pm0.027\pm0.055\pm0.082} $ 

$ \eta_0^{\rm {A\,D}\ddagger} $ 

$ {-0.079\pm0.010\pm0.019\pm0.029} $ 

$ {-0.190\pm0.023\pm0.046\pm0.069} $ 

$ {-0.128\pm0.015\pm0.031\pm0.046} $ 

$ \eta_0^{\rm {B\,D}\dagger} $ 

$ {-0.008\pm0.021\pm0.042\pm0.063} $ 

$ {-0.013\pm0.039\pm0.078\pm0.117} $ 

$ {-0.010\pm0.029\pm0.059\pm0.088} $ 

$ \eta_0^{\rm {B\,D}\ddagger} $ 

$ {-0.027\pm0.010\pm0.021\pm0.031} $ 

$ {-0.060\pm0.025\pm0.049\pm0.074} $ 

$ {-0.042\pm0.017\pm0.033\pm0.050} $ 

$ {\eta_0}^{\star\dagger} $ 

$ {-0.100\pm^{0.047}_{0.044}\pm^{0.098}_{0.085}\pm^{0.152}_{0.124}} $ 

$ {-0.380\pm^{0.138}_{0.122}\pm^{0.294}_{0.231}\pm^{0.475}_{0.330}} $ 

$ {-0.197\pm^{0.083}_{0.076}\pm^{0.174}_{0.145}\pm^{0.275}_{0.210}} $ 

$ {\eta_0}^{\star\ddagger} $ 

$ {-0.042\pm^{0.026}_{0.025}\pm^{0.054}_{0.048}\pm^{0.084}_{0.069}} $ 

$ {-0.171\pm^{0.112}_{0.099}\pm^{0.238}_{0.188}\pm^{0.384}_{0.268}} $ 

$ {-0.088\pm^{0.055}_{0.051}\pm^{0.115}_{0.097}\pm^{0.182}_{0.141}} $ 

Table 1. Maximum likelihood estimation results for the parameterizations with the binning method and ANN.
$ \eta_0 $ is represented by the best fit value$ \eta_{0,{\rm{best}}} \pm 1\sigma \pm 2\sigma \pm 3\sigma $ for each dataset. Superscripts A, B, C, and D represent the cases obtained from$ M_{\rm{B}}^{\rm{D20}} $ ,$ M_{\rm{B}}^{\rm{B23}} $ ,$ l^{\rm{C17}} $ , and$ l^{\rm{C19}} $ , respectively. Superscript$ \star $ represents results obtained from the flat marginalization for$ M_{\rm{B}} $ and l, and$ \dagger $ and$ \ddagger $ represent the results obtained from the binning method and ANN, respectively.Recently, Liu et al. [82] used the fraction division
$ \eta(z_{i})/\eta(z_{j}) $ to eliminate the effects of$ M_{\rm{B}} $ and l on CDDR test, and the results indicated an agreement between the CDDR and observations. More recently, using the latest five BAO measurements and the Pantheon SNIa sample, Xu et al. [28] performed the CDDR test independent of the peak absolute magnitude$ M_{\rm{B}} $ and sound horizon scale$ r_{\rm{s}} $ through transverse BAO measurements by analytically marginalizing the likelihood function over the combination of$ M_{\rm{B}} $ and$ r_{\rm{s}} $ .The uncertainty in an individual SNIa or QSO measurement is independent of$ M_{\rm{B}} $ or l, and therefore, these parameters can be removed from the fits by analytically marginalizing over them in the analysis. Following the process in Ref. [28], we treat the fiducial values of$ M_{\rm{B}} $ and l as nuisance parameters to determine the LD$ D_{\rm{L}} $ and ADD$ D_{\rm{A}} $ , and then, we marginalize their effect by using a flat prior in the statistic analysis. The likelihood distribution$ \chi^{\prime\,2} $ can be rewritten as$ \chi^{\prime\,2}(\eta_0, \kappa)= \sum\limits_i^{N}\dfrac{{{\alpha_i^2 \over \beta_i^2}{\kappa}^2- 2 {\alpha_i \over \beta_i}{\kappa}+1 }}{\sigma^{\prime\,2}_{{\eta_{{\rm{obs}},i}}}}\,, $

(11) where
$ \alpha_i=\eta(z_i) $ ,$ \beta_i=10^{({m_{{\rm{B}},i}\over 5}-5)}\theta_{{\rm{QSO}},i}(1+z_i)^{-2} $ ,$ \kappa=(10^{M_{\rm{B}} \over 5}l) $ , and$ \sigma_{\eta_{\rm{obs}},i}^{\prime\,2}=\left({\ln{10}\over {5}}{\sigma_{m_{{\rm{B}},i}}}\right)^2+\left({\sigma_{\theta_{{\rm{QSO}},i}}\over{\theta_{{\rm{QSO}},i}}}\right)^2\,. $

(12) Thus, following the approach described in Refs. [28, 83, 84], the marginalized
$ \chi^{\prime\,2} $ in Eq. (11) can be rewritten as$ \chi_{\rm{M}}^{\prime\,2}(\eta_0)= C-{B^2\over {A}}+\ln{A\over 2\pi}\,, $

(13) where
$ A=\sum \alpha_i^2/(\beta_i^2{\sigma^{\prime\,2}_{{\eta_{{\rm{obs}},i}}}}) $ ,$ B=\sum \alpha_i/(\beta_i{\sigma^{\prime\,2}_{{\eta_{{\rm{obs}},i}}}}) $ , and$ C=\sum 1/{\sigma^{\prime\,2}_{{\eta_{{\rm{obs}},i}}}} $ .All quantities used in the CDDR test originate from observations, and
$ \chi_{\rm{M}}^{\prime\,2} $ in Eq. (13) is independent of parameters such as$ M_{\rm{B}} $ and l. Thus, we can remove$ M_{\rm{B}} $ and l from the fit by analytically marginalizing them in Eq. (11). This test is based on observed data and does not require any assumptions about cosmological models; therefore, the parametric method used to test the CDDR is independent of the cosmological model. The results are shown in Fig. 6 and Table 1. To compare the capability of QSO data with that of other astronomic observational data when testing the CDDR, we list the results of the constraints on$ \eta_0 $ obtained from different observational datasets in Table 2.
Figure 6. (color online) Likelihood distribution obtained with flat priors on κ using the binning method (left) and ANN (right).
Dataset used P1: $ 1+\eta_0 {z} $ 

P2: $ 1+\eta_0 {z\over(1+z)} $ 

P3: $ 1+\eta_0 {\ln(1+z)} $ 

$ {\rm {Y_{SZ}}}-{\rm {Y_{X}}}\, {\rm {ratio}}+H(z)(\rm Prior) $ [17]

$ {0.008{\pm{0.05}}} $ 

$ {0.019{\pm{0.11}}} $ 

$ {0.013{\pm{0.07}}} $ 

$ {\rm {SNIa }}+{\rm {BAO}(\rm Prior)} $ [85]

$ {-0.038{\pm{0.037}}} $ 

$ {-0.059{\pm{0.055}}} $ 

$ {-0.048{\pm{0.046}}} $ 

$ {\rm {GMF}}+{\rm {SNIa}}+{T_{\rm{CMB}}}(\rm Prior) $ [86]

$ {-0.020{\pm{0.027}}} $ 

$ {-0.041{\pm{0.042}}} $ 

$ {\rm {SNIa }}+{\rm {BAO}(Marg)} $ [87]

$ {-0.07{\pm{0.12}}} $ 

$ {-0.20{\pm{0.27}}} $ 

$ {-0.12{\pm{0.18}}} $ 

$ {\rm {SNIa }}+{\rm {BAO}(Marg)} $ [85]

$ {0.041{\pm^{0.123}_{0.109}}} $ 

$ {0.082{\pm^{0.246}_{0.214}}} $ 

$ {0.059{\pm^{0.174}_{0.159}}} $ 

$ {\rm {SNIa }}+{\rm {BAO}(Marg)} $ [28]

$ {-0.037{\pm^{0.110}_{0.097}}} $ 

$ {-0.101{\pm^{0.269}_{0.225}}} $ 

$ {-0.061{\pm^{0.173}_{0.149}}} $ 

Table 2. Constraints on parameter
$\eta_0$ with different data sets. "Prior" represents the results obtained using certain parameters with specific priors, and "Marg" represents the results obtained by marginalizing certain parameters with a flat prior.Qi et al. used QSO to measure ADD and combined them with simulated gravitational wave data from the future Einstein Telescope as a source of LD to test the CDDR [30]. Compared to their work, our main research focuses on investigating potential biases in CDDR tests caused by specific priors on
$ M_{\rm{B}} $ from SNIa and l from QSO measurements. We quantitatively demonstrate how different choices of these priors impact CDDR constraints. Although Qi et al. used calibrated values of l to test the CDDR, our principal contribution lies in developing and implementing a method that decouples the constraints from specific priors on both$ M_{\rm{B}} $ of SNIa and l of QSO. We essentially construct a composite parameter$ \kappa\equiv 10^{M_{\rm{B}} \over 5}\,l $ and establish a prior-independent CDDR testing framework through Bayesian marginalization by adopting flat priors on κ, eliminating the calibration dependence on both$ M_{\rm{B}} $ and l. -
Fig. 4 and Table 1 show that, through the binning method, CDDR is found to be consistent with the observed data at various confidence levels (CLs) depending on the combination of
$ M_{\rm{B}} $ and l. Specifically, it is consistent at$ 1\sigma $ CL with the combination of$ M_{\rm{B}}^{\rm{B23}} $ and$ l^{\rm{C19}} $ . However, when considering other combinations of$ M_{\rm{B}} $ and l values, specifically$ M_{\rm{B}}^{\rm{B23}} $ and$ l^{\rm{C17}} $ ,$ M_{\rm{B}}^{\rm{D20}} $ and$ l^{\rm{C17}} $ , as well as$ M_{\rm{B}}^{\rm{D20}} $ and$ l^{\rm{C19}} $ , the CDDR is not consistent with the observed data at$ 3\sigma $ CL. Similarly, Fig. 5 and Table 1 show that, through the ANN method, CDDR is only consistent with the observed data at$ 3\sigma $ CL with the combination of$ M_{\rm{B}}^{\rm{B23}} $ and$ l^{\rm{C19}} $ . However, CDDR is not consistent with the observed data at$ 3\sigma $ CL with the other three combinations. For the binning method with P1 parameterization, the results detailed in Table 1 and illustrated in Fig. 4 show that the choice of$ M_{\rm{B}} $ or l priors significantly shifts the best-fit$ \eta_0 $ . Systematic comparisons, fixing one prior while varying the other, reveal shifts in$ \eta_0 $ ranging from 0.068 to 0.107. These shifts correspond to statistical significance between$ 1.4\sigma $ and$ 3.1\sigma $ , demonstrating a significant dependence of the$ \eta_0 $ constraints on the chosen priors. However, marginalizing over the combined parameter κ effectively removes this dependence on the$ M_{\rm{B}} $ and l priors. The marginalized result is independent of the$ M_{\rm{B}} $ and l prior choice, thus isolating the calibration uncertainty. However, this increases statistical uncertainties.Fig. 4, Fig. 5, and Table 1show that parameterization P1 imposes the most rigorous constraints on testing the CDDR. However, the result of the CDDR test is nearly independent of the parameterization of
$ \eta(z) $ . We compare the capability of QSO measurements to constrain parameter$ \eta_0 $ with that of other astronomical observations obtained under specific prior conditions of cosmological variables. With the binning method, the QSO measurements improved the accuracy of$ \eta_0 $ by approximately 60% at$ 1\sigma $ CL when compared with the results obtained from the South Pole Telescope-SZ clusters and X-ray measurements from Multi-mirror Mission-Newton [17], where the priors of$ M_{\rm{B}} $ and$ H_0 $ are utilized; and approximately 45% at$ 1\sigma $ CL when compared with the results obtained from Pantheon samples with transverse BAO measurements [85], where the CDDR tests were conducted with specific priors of$ M_{\rm{B}} $ or$ r_{\rm{s}} $ . Our results are approximately 25% more stringent than the result from the X-ray GMF of galaxy clusters jointly with SNIa and CMB temperature [86], where$ M_{\rm{B}} $ was fixed to derive the LD. Using the ANN to test the CDDR with more available QSO measurements revealed that the uncertainties of$ \eta_0 $ at$ 1\sigma $ CL are improved by approximately 50% when compared with the results obtained from the binning method.Testing the CDDR using a flat prior of
$ \kappa\equiv 10^{M_{\rm{B}}\over 5}l $ revealed that it was consistent with the observed data at$ 3\sigma $ CL with the binning method and at$ 2\sigma $ CL with the ANN method. The constraints on$ \eta_0 $ obtained from the flat prior of κ are considerably weaker than those obtained from the specific priors of$ M_{\rm{B}} $ and l because of marginalizing κ with a flat prior in our analysis. The methods with specific priors in the binning and ANN methods provide 55% and 60% tighter constraints on$ \eta_0 $ , respectively, compared with the marginalization method. To assess the ability of testing the CDDR from QSO measurements, it would be valuable to compare our results with previous constraints on$ \eta_0 $ from other observational data by marginalizing certain parameters with a flat prior. With the binning method, the QSO measurements improved the accuracy of$ \eta_0 $ by approximately 60% at$ 1\sigma $ CL when compared with the results obtained from the Pantheon samples and BOSS DR12 BAO measurements within the redshift range$ 0.31\leq{z}\leq0.72 $ [87] and from the Pantheon samples with transverse BAO measurements [85], where$ M_{\rm{B}} $ and$ r_{\rm{s}} $ were marginalized. The constraints on$ \eta_0 $ are approximately 55% more stringent than the result from five BAO measurements utilizing the extended Baryon Oscillation Spectroscopic Survey data release 16 quasar samples in conjunction with the Pantheon SNIa samples [28], where$ M_{\rm{B}} $ and$ r_{\rm{s}} $ were marginalized. For the results obtained from the ANN method, the uncertainties of$ \eta_0 $ at$ 1\sigma $ CL are reduced by approximately 40% when compared with the results obtained from the binning method. Therefore, the capability of QSO measurements in testing the CDDR is superior to that of BAO observations, which have been recognized as powerful tools for testing the CDDR [75, 87]. -
The CDDR plays an important role in astronomical observations and modern cosmology, and any deviation from the CDDR may indicate new physical signals. The SNIa and QSO measurements can be considered effective observational data for testing the CDDR. However, because of the uncertainty in the absolute magnitude
$ M_{\rm{B}} $ and linear size scaling factor l, which are constrained by different astronomical observations and cosmological models, it is necessary to investigate the impact of the prior values of$ M_{\rm{B}} $ and l on the CDDR test and verify the validity of the CDDR using new methods.In this work, we test the CDDR by comparing the LD derived from the Pantheon+ SNIa compilation with ADD from QSO measurements, using parametric methods. We employ the binning method and ANN to match the SNIa data with the QSO measurements at the same redshift, and adopt the function
$ \eta(z)=D_{\rm{L}}(z)/D_{\rm{A}}(z)(1 + z)^{-2} $ to probe the possible deviations from the CDDR at any redshift. Two specific prior values of$ M_{\rm{B}} $ and l are used to obtain the LDs from the SNIa observations and the ADDs from QSO measurements, respectively. The results show that the specific prior values of$ M_{\rm{B}} $ and l cause significant biases in the CDDR test if the astronomical observations do not provide accurate values for$ M_{\rm{B}} $ and l.To avoid the bias in the CDDR test caused by the prior values of
$ M_{\rm{B}} $ and l, we treated the fiducial values of$ M_{\rm{B}} $ and l as nuisance parameters to determine the LD$ {D_{\rm{L}}} $ and ADD$ {D_{\rm{A}}} $ . Then, we marginalized their impacts on the CDDR test by applying a flat prior on the new variable κ$ \equiv $ $ 10^{M_{\rm{B}}\over 5}l $ in the statistical analysis. This marginalization approach eliminated the need to calibrate the$ M_{\rm{B}} $ and l values. Thus, the method for testing the CDDR remains independent of the underlying cosmological model assumptions. The ANN method includes more QSO data points, and therefore, it provides 50% and 40% tighter constraints on$ \eta_0 $ compared with the Binning method when using specific priors on$ M_{\rm{B}} $ and l and the marginalization method, respectively. Our results indicate no violation of the CDDR; however, the capability of the QSO measurements to test the CDDR is reduced compared with the results obtained from specific values of$ M_{\rm{B}} $ and l becuase of marginalizing κ with a flat prior in our analysis. Considering previous results, the capability of QSO measurements to test the CDDR is considerably stronger than that of other previous astronomic observations regardless of whether the method used is dependent on$ M_{\rm{B}} $ and l . The proposed method for testing the CDDR in this study is not only independent of the cosmological model but also independent of the prior values of the absolute magnitude$ M_{\rm{B}} $ and linear size scaling factor l. Therefore, QSO measurement can serve as a powerful tool for testing the CDDR independently of the cosmological model.
Testing the cosmic distance duality relation using Type Ia supernovae and radio quasars through model-independent methods
- Received Date: 2024-10-22
- Available Online: 2025-10-15
Abstract: In this study, we perform a cosmological-model-independent test on the cosmic distance duality relation (CDDR) by comparing the angular diameter distance (ADD) obtained from the compact radio quasars (QSOs) with the luminosity distance (LD) obtained from the Pantheon+ Type Ia supernovae (SNIa) sample. The binning method and artificial neural network are employed to match ADD data with LD data at the same redshift, and three different parameterizations are adopted to quantify possible deviations from the CDDR. We initially investigate the effects of specific prior values for the absolute magnitude


 Abstract
 HTML
HTML Reference
 Related
 PDF
PDF




 DownLoad:
