


 Abstract
 HTML
HTML Reference
 Related
 PDF
PDF


-
Alpha decay has long played a pivotal role in the investigation of nuclear structure and the exploration of the limits of nuclear stability. As a dominant decay mode for medium-heavy and superheavy nuclei, α decay serves not only as a direct tool for identifying new nuclides but also as a vital probe for characterizing the structural properties of these unstable nuclei [1−10]. The underlying mechanism of α decay is a type of quantum tunneling within the nuclear system, a concept whose origins date back to the foundational works of Gamow, Condon, and Gurney in the early days of quantum mechanics [11, 12]. Based on this physical picture, numerous theoretical models have been established to address specific details of the α-decay mechanisms [13−27]. These phenomenological and microscopic models have yielded excellent descriptions of α-decay half-lives and even fine-structure branching ratios. In systematic calculations across a vast range of nuclides, the agreement between theoretical and experimental half-lives has, on average, been improved to within a factor of 2−3 [13, 22, 25]. Consequently, the accurate reproduction of experimental data enables α-decay models to be used to investigate structural variations among nuclei and the evolution of different interactions during the decay process.
In recent years, studies of cluster structures in heavy nuclei have attracted considerable attention due to the substantial progress in understanding clustering mechanisms in light nuclei. Significant progress was made by Tanaka et al., who utilized the
$ (p, p\alpha) $ reaction to directly knock out α particles from the surface of Sn isotopes and confirmed the dependence of the α-clustering probability on neutron skin thickness [28]. These findings provide direct evidence for the existence of α clusters in heavy nuclei. Studies of the$ ^{212}\text{Po} $ excitation spectrum have shown that reproducing specific excitation levels theoretically requires the assumption of α-cluster configurations [29]. These configurations, linked to shell-model states via$ E1 $ transitions, reveal the coexistence of single-particle motion and cluster motion in heavy nuclei. As a spontaneous cluster emission process, α decay is naturally regarded as a key indicator of cluster structures in heavy nuclei. Starting from cluster-model concepts, extensive research has focused on properties intimately related to clustering in the decay mechanism, such as the α preformation factor ($ P_\alpha $ ) [23, 25−27, 30−33], the α-core excitation spectrum [34−38], and the geometry of the α-nucleus potential [39−42]. In particular, the discovery of the superallowed α decay of$ ^{104}\text{Te} $ , with an exceptionally large reduced width, suggests the potential existence of pronounced α clustering in the ground states of heavy nuclei [7]. Furthermore, the ongoing refinements of α-decay models make it possible to investigate clustering effects on the α-decay mechanism, such as the impact of Pauli blocking on α cluster formation [39, 43−45], the evolution of formation probability with different nucleon correlations [30−33], and the modification of the α-nucleus potential shape by cluster dynamics [39−41]. These studies have shed light on the formation mechanism of α clusters, thereby facilitating the understanding of cluster structures in heavy nuclei.To pursue deeper insights into the microscopic mechanism of α decay, we recently developed the dynamical double-folding potential (DDFP) model. By integrating the medium effects of the α cluster derived from microscopic many-body calculations with the density-dependent cluster model (DDCM), this approach provides a more accurate description of α-decay half-lives and preformation factors [25, 33]. To elucidate the correlation between clustering effects and the α-nucleus potential, we subsequently formulated a pocket-type DDFP based on the Migdal interaction, as an alternative to the previous deep-well DDFP utilizing the CDM3Y6 nucleon-nucleon (NN) interaction. While reasonably reproducing experimental half-lives, this model offers a physical explanation for the formation of the pocket geometry in the surface region of the potential, a feature intimately linked to clustering effects [41]. Recently, the pocket-type DDFP has been applied to extract the charge radii of daughter nuclei and to investigate the effect of deformation on α preformation probabilities [46, 47]. In the present work, we aim to further explore the applicability of the DDFP model. First, we directly compare the DDFPs based on the CDM3Y6 and Migdal interactions, highlighting their differences in half-life calculations. Second, we extend our investigation from the previous favored decays of even-even nuclei to both favored and unfavored decays of odd-A nuclei. Through an analysis of the systematics of
$ P_\alpha $ factors, we demonstrate how the differences in potential shape influence the magnitude of the preformation probability.This paper is organized as follows. Section II outlines the theoretical framework of the DDFP and explains the determination of α-nucleus potentials with the two NN interactions. Section III focuses on the α decay of odd-A nuclei in the region
$ 78 \le Z \le 90 $ , where we discuss the discrepancies between the two potentials in half-life calculations and preformation factor evaluations. In particular, the variation of$ P_\alpha $ factors in unfavored decays is analyzed along the typical$ N=125 $ and 127 isotonic chains, and its correlation with the strength of proton pairing around the$ Z=82 $ region is discussed. Finally, a summary is provided in the last section. -
Alpha decay has long played a pivotal role in the investigation of nuclear structure and the exploration of the limits of nuclear stability. As a dominant decay mode for medium-heavy and superheavy nuclei, α decay serves not only as a direct tool for identifying new nuclides but also as a vital probe for characterizing the structural properties of these unstable nuclei [1−10]. The underlying mechanism of α decay is a type of quantum tunneling within the nuclear system, a concept whose origins date back to the foundational works of Gamow, Condon, and Gurney in the early days of quantum mechanics [11, 12]. Based on this physical picture, numerous theoretical models have been established to address specific details of the α-decay mechanisms [13−27]. These phenomenological and microscopic models have yielded excellent descriptions of α-decay half-lives and even fine-structure branching ratios. In systematic calculations across a vast range of nuclides, the agreement between theoretical and experimental half-lives has, on average, been improved to within a factor of 2−3 [13, 22, 25]. Consequently, the accurate reproduction of experimental data enables α-decay models to be used to investigate structural variations among nuclei and the evolution of different interactions during the decay process.
In recent years, studies of cluster structures in heavy nuclei have attracted considerable attention due to the substantial progress in understanding clustering mechanisms in light nuclei. Significant progress was made by Tanaka et al., who utilized the
$ (p, p\alpha) $ reaction to directly knock out α particles from the surface of Sn isotopes and confirmed the dependence of the α-clustering probability on neutron skin thickness [28]. These findings provide direct evidence for the existence of α clusters in heavy nuclei. Studies of the$ ^{212}\text{Po} $ excitation spectrum have shown that reproducing specific excitation levels theoretically requires the assumption of α-cluster configurations [29]. These configurations, linked to shell-model states via$ E1 $ transitions, reveal the coexistence of single-particle motion and cluster motion in heavy nuclei. As a spontaneous cluster emission process, α decay is naturally regarded as a key indicator of cluster structures in heavy nuclei. Starting from cluster-model concepts, extensive research has focused on properties intimately related to clustering in the decay mechanism, such as the α preformation factor ($ P_\alpha $ ) [23, 25−27, 30−33], the α-core excitation spectrum [34−38], and the geometry of the α-nucleus potential [39−42]. In particular, the discovery of the superallowed α decay of$ ^{104}\text{Te} $ , with an exceptionally large reduced width, suggests the potential existence of pronounced α clustering in the ground states of heavy nuclei [7]. Furthermore, the ongoing refinements of α-decay models make it possible to investigate clustering effects on the α-decay mechanism, such as the impact of Pauli blocking on α cluster formation [39, 43−45], the evolution of formation probability with different nucleon correlations [30−33], and the modification of the α-nucleus potential shape by cluster dynamics [39−41]. These studies have shed light on the formation mechanism of α clusters, thereby facilitating the understanding of cluster structures in heavy nuclei.To pursue deeper insights into the microscopic mechanism of α decay, we recently developed the dynamical double-folding potential (DDFP) model. By integrating the medium effects of the α cluster derived from microscopic many-body calculations with the density-dependent cluster model (DDCM), this approach provides a more accurate description of α-decay half-lives and preformation factors [25, 33]. To elucidate the correlation between clustering effects and the α-nucleus potential, we subsequently formulated a pocket-type DDFP based on the Migdal interaction, as an alternative to the previous deep-well DDFP utilizing the CDM3Y6 nucleon-nucleon (NN) interaction. While reasonably reproducing experimental half-lives, this model offers a physical explanation for the formation of the pocket geometry in the surface region of the potential, a feature intimately linked to clustering effects [41]. Recently, the pocket-type DDFP has been applied to extract the charge radii of daughter nuclei and to investigate the effect of deformation on α preformation probabilities [46, 47]. In the present work, we aim to further explore the applicability of the DDFP model. First, we directly compare the DDFPs based on the CDM3Y6 and Migdal interactions, highlighting their differences in half-life calculations. Second, we extend our investigation from the previous favored decays of even-even nuclei to both favored and unfavored decays of odd-A nuclei. Through an analysis of the systematics of
$ P_\alpha $ factors, we demonstrate how the differences in potential shape influence the magnitude of the preformation probability.This paper is organized as follows. Section II outlines the theoretical framework of the DDFP and explains the determination of α-nucleus potentials with the two NN interactions. Section III focuses on the α decay of odd-A nuclei in the region
$ 78 \le Z \le 90 $ , where we discuss the discrepancies between the two potentials in half-life calculations and preformation factor evaluations. In particular, the variation of$ P_\alpha $ factors in unfavored decays is analyzed along the typical$ N=125 $ and 127 isotonic chains, and its correlation with the strength of proton pairing around the$ Z=82 $ region is discussed. Finally, a summary is provided in the last section. -
Alpha decay has long played a pivotal role in the investigation of nuclear structure and the exploration of the limits of nuclear stability. As a dominant decay mode for medium-heavy and superheavy nuclei, α decay serves not only as a direct tool for identifying new nuclides but also as a vital probe for characterizing the structural properties of these unstable nuclei [1−10]. The underlying mechanism of α decay is a type of quantum tunneling within the nuclear system, a concept whose origins date back to the foundational works of Gamow, Condon, and Gurney in the early days of quantum mechanics [11, 12]. Based on this physical picture, numerous theoretical models have been established to address specific details of the α-decay mechanisms [13−27]. These phenomenological and microscopic models have yielded excellent descriptions of α-decay half-lives and even fine-structure branching ratios. In systematic calculations across a vast range of nuclides, the agreement between theoretical and experimental half-lives has, on average, been improved to within a factor of 2−3 [13, 22, 25]. Consequently, the accurate reproduction of experimental data enables α-decay models to be used to investigate structural variations among nuclei and the evolution of different interactions during the decay process.
In recent years, studies of cluster structures in heavy nuclei have attracted considerable attention due to the substantial progress in understanding clustering mechanisms in light nuclei. Significant progress was made by Tanaka et al., who utilized the
$ (p, p\alpha) $ reaction to directly knock out α particles from the surface of Sn isotopes and confirmed the dependence of the α-clustering probability on neutron skin thickness [28]. These findings provide direct evidence for the existence of α clusters in heavy nuclei. Studies of the$ ^{212}\text{Po} $ excitation spectrum have shown that reproducing specific excitation levels theoretically requires the assumption of α-cluster configurations [29]. These configurations, linked to shell-model states via$ E1 $ transitions, reveal the coexistence of single-particle motion and cluster motion in heavy nuclei. As a spontaneous cluster emission process, α decay is naturally regarded as a key indicator of cluster structures in heavy nuclei. Starting from cluster-model concepts, extensive research has focused on properties intimately related to clustering in the decay mechanism, such as the α preformation factor ($ P_\alpha $ ) [23, 25−27, 30−33], the α-core excitation spectrum [34−38], and the geometry of the α-nucleus potential [39−42]. In particular, the discovery of the superallowed α decay of$ ^{104}\text{Te} $ , with an exceptionally large reduced width, suggests the potential existence of pronounced α clustering in the ground states of heavy nuclei [7]. Furthermore, the ongoing refinements of α-decay models make it possible to investigate clustering effects on the α-decay mechanism, such as the impact of Pauli blocking on α cluster formation [39, 43−45], the evolution of formation probability with different nucleon correlations [30−33], and the modification of the α-nucleus potential shape by cluster dynamics [39−41]. These studies have shed light on the formation mechanism of α clusters, thereby facilitating the understanding of cluster structures in heavy nuclei.To pursue deeper insights into the microscopic mechanism of α decay, we recently developed the dynamical double-folding potential (DDFP) model. By integrating the medium effects of the α cluster derived from microscopic many-body calculations with the density-dependent cluster model (DDCM), this approach provides a more accurate description of α-decay half-lives and preformation factors [25, 33]. To elucidate the correlation between clustering effects and the α-nucleus potential, we subsequently formulated a pocket-type DDFP based on the Migdal interaction, as an alternative to the previous deep-well DDFP utilizing the CDM3Y6 nucleon-nucleon (NN) interaction. While reasonably reproducing experimental half-lives, this model offers a physical explanation for the formation of the pocket geometry in the surface region of the potential, a feature intimately linked to clustering effects [41]. Recently, the pocket-type DDFP has been applied to extract the charge radii of daughter nuclei and to investigate the effect of deformation on α preformation probabilities [46, 47]. In the present work, we aim to further explore the applicability of the DDFP model. First, we directly compare the DDFPs based on the CDM3Y6 and Migdal interactions, highlighting their differences in half-life calculations. Second, we extend our investigation from the previous favored decays of even-even nuclei to both favored and unfavored decays of odd-A nuclei. Through an analysis of the systematics of
$ P_\alpha $ factors, we demonstrate how the differences in potential shape influence the magnitude of the preformation probability.This paper is organized as follows. Section II outlines the theoretical framework of the DDFP and explains the determination of α-nucleus potentials with the two NN interactions. Section III focuses on the α decay of odd-A nuclei in the region
$ 78 \le Z \le 90 $ , where we discuss the discrepancies between the two potentials in half-life calculations and preformation factor evaluations. In particular, the variation of$ P_\alpha $ factors in unfavored decays is analyzed along the typical$ N=125 $ and 127 isotonic chains, and its correlation with the strength of proton pairing around the$ Z=82 $ region is discussed. Finally, a summary is provided in the last section. -
Alpha decay has long played a pivotal role in the investigation of nuclear structure and the exploration of the limits of nuclear stability. As a dominant decay mode for medium-heavy and superheavy nuclei, α decay serves not only as a direct tool for identifying new nuclides but also as a vital probe for characterizing the structural properties of these unstable nuclei [1−10]. The underlying mechanism of α decay is a type of quantum tunneling within the nuclear system, a concept whose origins date back to the foundational works of Gamow, Condon, and Gurney in the early days of quantum mechanics [11, 12]. Based on this physical picture, numerous theoretical models have been established to address specific details of the α-decay mechanisms [13−27]. These phenomenological and microscopic models have yielded excellent descriptions of α-decay half-lives and even fine-structure branching ratios. In systematic calculations across a vast range of nuclides, the agreement between theoretical and experimental half-lives has, on average, been improved to within a factor of 2−3 [13, 22, 25]. Consequently, the accurate reproduction of experimental data enables α-decay models to be used to investigate structural variations among nuclei and the evolution of different interactions during the decay process.
In recent years, studies of cluster structures in heavy nuclei have attracted considerable attention due to the substantial progress in understanding clustering mechanisms in light nuclei. Significant progress was made by Tanaka et al., who utilized the
$ (p, p\alpha) $ reaction to directly knock out α particles from the surface of Sn isotopes and confirmed the dependence of the α-clustering probability on neutron skin thickness [28]. These findings provide direct evidence for the existence of α clusters in heavy nuclei. Studies of the$ ^{212}\text{Po} $ excitation spectrum have shown that reproducing specific excitation levels theoretically requires the assumption of α-cluster configurations [29]. These configurations, linked to shell-model states via$ E1 $ transitions, reveal the coexistence of single-particle motion and cluster motion in heavy nuclei. As a spontaneous cluster emission process, α decay is naturally regarded as a key indicator of cluster structures in heavy nuclei. Starting from cluster-model concepts, extensive research has focused on properties intimately related to clustering in the decay mechanism, such as the α preformation factor ($ P_\alpha $ ) [23, 25−27, 30−33], the α-core excitation spectrum [34−38], and the geometry of the α-nucleus potential [39−42]. In particular, the discovery of the superallowed α decay of$ ^{104}\text{Te} $ , with an exceptionally large reduced width, suggests the potential existence of pronounced α clustering in the ground states of heavy nuclei [7]. Furthermore, the ongoing refinements of α-decay models make it possible to investigate clustering effects on the α-decay mechanism, such as the impact of Pauli blocking on α cluster formation [39, 43−45], the evolution of formation probability with different nucleon correlations [30−33], and the modification of the α-nucleus potential shape by cluster dynamics [39−41]. These studies have shed light on the formation mechanism of α clusters, thereby facilitating the understanding of cluster structures in heavy nuclei.To pursue deeper insights into the microscopic mechanism of α decay, we recently developed the dynamical double-folding potential (DDFP) model. By integrating the medium effects of the α cluster derived from microscopic many-body calculations with the density-dependent cluster model (DDCM), this approach provides a more accurate description of α-decay half-lives and preformation factors [25, 33]. To elucidate the correlation between clustering effects and the α-nucleus potential, we subsequently formulated a pocket-type DDFP based on the Migdal interaction, as an alternative to the previous deep-well DDFP utilizing the CDM3Y6 nucleon-nucleon (NN) interaction. While reasonably reproducing experimental half-lives, this model offers a physical explanation for the formation of the pocket geometry in the surface region of the potential, a feature intimately linked to clustering effects [41]. Recently, the pocket-type DDFP has been applied to extract the charge radii of daughter nuclei and to investigate the effect of deformation on α preformation probabilities [46, 47]. In the present work, we aim to further explore the applicability of the DDFP model. First, we directly compare the DDFPs based on the CDM3Y6 and Migdal interactions, highlighting their differences in half-life calculations. Second, we extend our investigation from the previous favored decays of even-even nuclei to both favored and unfavored decays of odd-A nuclei. Through an analysis of the systematics of
$ P_\alpha $ factors, we demonstrate how the differences in potential shape influence the magnitude of the preformation probability.This paper is organized as follows. Section II outlines the theoretical framework of the DDFP and explains the determination of α-nucleus potentials with the two NN interactions. Section III focuses on the α decay of odd-A nuclei in the region
$ 78 \le Z \le 90 $ , where we discuss the discrepancies between the two potentials in half-life calculations and preformation factor evaluations. In particular, the variation of$ P_\alpha $ factors in unfavored decays is analyzed along the typical$ N=125 $ and 127 isotonic chains, and its correlation with the strength of proton pairing around the$ Z=82 $ region is discussed. Finally, a summary is provided in the last section. -
In the cluster model of α decay, the α-nucleus potential
$ V({\boldsymbol{R}}) $ is composed of three parts: the nuclear potential$ V_N $ , the Coulomb potential$ V_C $ , and the centrifugal potential$ V_{l}(R)=\dfrac{\hbar^{2} L(L+1)}{2 m R^{2}} $ .$ V(R, \xi)=V_{N}(R, \xi)+V_{C}(R, \xi)+V_{l}(R). $
(1) In this study, the nuclear potential
$ V_N $ and the Coulomb potential$ V_C $ are determined within the framework of the dynamical double-folding potential [25, 41]. The dynamical double-folding potential, used with specific nucleon-nucleon (NN) interactions, reliably describes the α-nucleus interaction through a double-folding integration over the density distributions of the α cluster and the daughter nucleus.$ V_{N, C}(R, \xi)=\lambda(\xi) \iint {\mathrm{d}} {\boldsymbol{r}}_{\bf{1}} {\mathrm{d}} {\boldsymbol{r}}_{\mathbf{2}} \rho_{1}\left({\boldsymbol{r}}_{\bf{1}}\right) \rho_{2}\left({\boldsymbol{r}}_{\mathbf{2}}, {\boldsymbol{R}}\right)v_{N, C}(s), $
(2) where s denotes the distance between the two interacting nucleons (one from each nucleus), i.e.,
$ s=|{\boldsymbol{R}}+{\boldsymbol{r}}_2-{\boldsymbol{r}}_1| $ .$ \rho_1 $ is the density distribution of the daughter nucleus, which takes a Fermi form. An angle ξ is introduced to account for its axial symmetry:$ \rho_{1}\left(r_{1}, \theta\right)=\frac{\rho_{1 s}}{1+\exp \left(\dfrac{r_{1}-R_{d}(\theta)}{a_0}\right)}, $
(3) where
$ R_{d}=1.125 A_{d}^{1 / 3}\left[1+\beta_{2} Y_{2}^{0}(\theta)+\beta_{4} Y_{4}^{0}(\theta)\right] $ fm and$ a_0= 0.54 $ fm [46, 47]. The density distribution of the α cluster$ \rho_2 $ follows a Gaussian form. The width parameter β determines the size of the α cluster. To account for the medium effect, this width parameter depends on the nuclear medium density$ \rho_1({\boldsymbol{R}}) $ at the position$ {\boldsymbol{R}} $ of the α cluster.$ \rho_{2}\left({\boldsymbol{r}}_{2}, {\boldsymbol{R}}\right)=\rho_{2 s} \exp \left[-\beta\left(\rho_{1}({\boldsymbol{R}})\right) r_{2}^{2}\right] . $
(4) The values of
$ \rho_{1s} $ and$ \rho_{2s} $ are determined by normalizing the density distributions to the corresponding mass (or charge) numbers. The dependence of β on density is constrained by the results of the many-body calculation in Ref. [39] and can be effectively described by the analytical expression [48].$ \beta\left(\rho_{1}\right)=\frac{0.7024}{1+a_{1} \rho_{1}}, $
(5) where the coefficient
$ a_{1} $ is given by$ a_1 $ =$ \dfrac{45}{16}\rho_{1s} $ . Here,$ \rho_{1s} $ denotes the central saturation density of the daughter nucleus. This expression ensures that the size of the α cluster changes smoothly from the interior to the exterior of the daughter nucleus.The NN interaction for the Coulomb potential is well understood, whereas the NN interaction for the nuclear potential should take a density-dependent form to account for medium effects [48]. In this study, we will compare the performance of DDFPs obtained with the CDM3Y6 interaction and the Migdal interaction. The CDM3Y6 interaction is one of the parameterized CDM3Y effective interactions, which incorporate in-medium density dependence into the finite-range M3Y interactions [49]. The CDM3Y interactions have been successfully employed to construct nucleus-nucleus potentials for describing α decay and nucleus-nucleus scattering [17, 25, 33, 41, 49, 50]. Furthermore, within the non-relativistic Hartree-Fock framework, the CDM3Y parameterizations have been systematically adopted to construct the equations of state (EOS) for asymmetric nuclear matter and pure neutron matter. They serve as a robust theoretical tool to investigate both the microscopic properties and macroscopic structural observables of neutron stars [51−56]. The CDM3Y6 interaction takes the following form,
$ v_{N}\left(E_{\alpha}, s, \rho_{1}, \rho_{2}\right)=v\left(s, E_{\alpha}\right)^{\text{M3Y}} f\left(\rho_{1}, \rho_{2}\right)g\left(E_{\alpha}\right), $
(6) where
$ v\left(s, E_{\alpha}\right)^{\text{M3Y}} $ is the standard M3Y-Reid potential [57]. The functions$ f(\rho_1, \rho_2) $ and$ g(E_\alpha) $ represent the density and energy dependence of the NN interaction, respectively.$ f(\rho_{1}, \rho_{2})= C_{1}[1+C_{2} \text{e}^{-C_{3}(\rho_{1}+\rho_{2})}-C_{4}(\rho_{1}+\rho_{2})], $
(7) $ g(E_{\alpha})= 1-0.002 E_{\alpha} / A_{\alpha}, $
(8) where the parameters
$ C_1, C_2, C_3 $ and$ C_4 $ are determined by reproducing the saturation properties of nuclear matter through Hartree-Fock calculations [49].The Migdal interaction is a phenomenological effective interaction proposed to describe the forces between quasiparticles in finite fermion systems [58]. In contrast to the finite-range CDM3Y6 interaction, the Migdal interaction is formulated as a zero-range interaction that depends on the local medium density. It has the following form [47]:
$ \begin{aligned}[b] v_{N}\left({\boldsymbol{r}}_{1}, {\boldsymbol{r}}_{2}, {\boldsymbol{R}}\right)= & C_{0}\left\{F_{{\mathrm{in}}} x\left({\boldsymbol{r}}_{1}, {\boldsymbol{r}}_{2}, {\boldsymbol{R}}\right)\right.\\ &\left.+F_{{\mathrm{e x}}}\left[1-x\left({\boldsymbol{r}}_{1}, {\boldsymbol{r}}_{2}, {\boldsymbol{R}}\right)\right]\right\}\delta(s), \end{aligned} $
(9) where
$ C_0 $ represents the inverse density of states at the Fermi surface. The parameters$ F_{{\mathrm{in}}} $ and$ F_{{\mathrm{ex}}} $ can be determined by fitting to experimental data, based on the theory of finite Fermi systems [59].$ x\left({\rho}_{1}, {\rho}_{2}\right) $ is a function that depends on the relative density, which changes with the overlap between the α cluster and the daughter nucleus. This relative density is determined by the density distributions of both nuclei.$ x\left({\boldsymbol{r}}_{1}, {\boldsymbol{r}}_{2}, {\boldsymbol{R}}\right)=\frac{\rho_{1}\left({\boldsymbol{r}}_{1}\right)+\rho_{2}\left({\boldsymbol{r}}_{2}, {\boldsymbol{R}}\right)}{\rho_{00}\left({\boldsymbol{R}}\right)}, $
(10) where
$ \rho_{00} $ is the average saturation density$ [\rho_{1s}+ \rho_{2s}\left({\boldsymbol{R}}\right)]/2 $ . Based on the above DDFP, this study utilizes the two-potential approach [60] to calculate the half-life of α decay. In this approach, the calculation of the decay width is decomposed into a bound-state problem and a scattering-state problem. The decay width$ \Gamma(\xi) $ can be determined from the bound-state wavefunction$ \varphi_0(R) $ , the scattering-state wavefunction$ \chi(R) $ , and its first derivative$ \chi'(R) $ , all evaluated at the separation radius$ R_t $ .$ \Gamma(\xi)=\frac{\hbar^{2}}{m k}\left|\varphi_{0}\left(R_{t}, \xi\right)\left[\alpha \chi\left(R_{t}, \xi\right)+\chi^{\prime}\left(R_{t}, \xi\right)\right]\right|^{2}, $
(11) $ R_t $ should be chosen in a region where the nuclear force is negligible and the Coulomb force dominates, but not too close to the outer classical turning point. Therefore, in this study,$ R_t $ was taken as the midpoint between the peak of the potential barrier and the third classical turning point. Here, m is the reduced mass of the α cluster and daughter nucleus. The quantities$ \alpha = \sqrt{2 m [V(R_t)- Q_\alpha] / \hbar^{2}} $ and$ k = \sqrt{2 m Q_\alpha / \hbar^{2}} $ are the wave numbers for the two different energies.To obtain the final α-nucleus potential, the nuclear potential depth λ in Eq. (2) must be determined. For both the CDM3Y6 and Migdal interactions, λ is determined by requiring that the eigenvalue of the corresponding bound state
$ \varphi_0 $ exactly matches the experimental decay energy within the two-potential approach. For the deep-well DDFP based on the CDM3Y6 interaction,$ \varphi_0 $ must also satisfy the Wildermuth condition [25] to account for Pauli blocking effects at large density overlaps [41, 46]. For deformed nuclei, the final decay width Γ must be averaged over all relative orientation angles ξ.$ \Gamma=\int_0^{\pi/2}\Gamma(\xi)\sin\xi\mathrm{d}\xi. $
(12) Finally, the α-decay half-life is calculated using the following formula:
$ T_{1 / 2}=\frac{\hbar \ln 2}{P_{\alpha} \Gamma}, $
(13) where
$ P_\alpha $ is the α-preformation factor, which represents the probability of forming an α cluster within the nucleus. Given experimental α-decay data, one can set$ P_\alpha=1 $ in Eq. (13) to extract the empirical value of$ P_\alpha $ indirectly.$ P_{\alpha}=\frac{\hbar \ln 2}{\Gamma} / T_{1 / 2}^{\exp } , $
(14) where
$ T_{1 / 2}^{\exp } $ is the experimental α-decay half-life. -
In the cluster model of α decay, the α-nucleus potential
$ V({\boldsymbol{R}}) $ is composed of three parts: the nuclear potential$ V_N $ , the Coulomb potential$ V_C $ , and the centrifugal potential$ V_{l}(R)=\dfrac{\hbar^{2} L(L+1)}{2 m R^{2}} $ .$ V(R, \xi)=V_{N}(R, \xi)+V_{C}(R, \xi)+V_{l}(R). $
(1) In this study, the nuclear potential
$ V_N $ and the Coulomb potential$ V_C $ are determined within the framework of the dynamical double-folding potential [25, 41]. The dynamical double-folding potential, used with specific nucleon-nucleon (NN) interactions, reliably describes the α-nucleus interaction through a double-folding integration over the density distributions of the α cluster and the daughter nucleus.$ V_{N, C}(R, \xi)=\lambda(\xi) \iint {\mathrm{d}} {\boldsymbol{r}}_{\bf{1}} {\mathrm{d}} {\boldsymbol{r}}_{\mathbf{2}} \rho_{1}\left({\boldsymbol{r}}_{\bf{1}}\right) \rho_{2}\left({\boldsymbol{r}}_{\mathbf{2}}, {\boldsymbol{R}}\right)v_{N, C}(s), $
(2) where s denotes the distance between the two interacting nucleons (one from each nucleus), i.e.,
$ s=|{\boldsymbol{R}}+{\boldsymbol{r}}_2-{\boldsymbol{r}}_1| $ .$ \rho_1 $ is the density distribution of the daughter nucleus, which takes a Fermi form. An angle ξ is introduced to account for its axial symmetry:$ \rho_{1}\left(r_{1}, \theta\right)=\frac{\rho_{1 s}}{1+\exp \left(\dfrac{r_{1}-R_{d}(\theta)}{a_0}\right)}, $
(3) where
$ R_{d}=1.125 A_{d}^{1 / 3}\left[1+\beta_{2} Y_{2}^{0}(\theta)+\beta_{4} Y_{4}^{0}(\theta)\right] $ fm and$ a_0= 0.54 $ fm [46, 47]. The density distribution of the α cluster$ \rho_2 $ follows a Gaussian form. The width parameter β determines the size of the α cluster. To account for the medium effect, this width parameter depends on the nuclear medium density$ \rho_1({\boldsymbol{R}}) $ at the position$ {\boldsymbol{R}} $ of the α cluster.$ \rho_{2}\left({\boldsymbol{r}}_{2}, {\boldsymbol{R}}\right)=\rho_{2 s} \exp \left[-\beta\left(\rho_{1}({\boldsymbol{R}})\right) r_{2}^{2}\right] . $
(4) The values of
$ \rho_{1s} $ and$ \rho_{2s} $ are determined by normalizing the density distributions to the corresponding mass (or charge) numbers. The dependence of β on density is constrained by the results of the many-body calculation in Ref. [39] and can be effectively described by the analytical expression [48].$ \beta\left(\rho_{1}\right)=\frac{0.7024}{1+a_{1} \rho_{1}}, $
(5) where the coefficient
$ a_{1} $ is given by$ a_1 $ =$ \dfrac{45}{16}\rho_{1s} $ . Here,$ \rho_{1s} $ denotes the central saturation density of the daughter nucleus. This expression ensures that the size of the α cluster changes smoothly from the interior to the exterior of the daughter nucleus.The NN interaction for the Coulomb potential is well understood, whereas the NN interaction for the nuclear potential should take a density-dependent form to account for medium effects [48]. In this study, we will compare the performance of DDFPs obtained with the CDM3Y6 interaction and the Migdal interaction. The CDM3Y6 interaction is one of the parameterized CDM3Y effective interactions, which incorporate in-medium density dependence into the finite-range M3Y interactions [49]. The CDM3Y interactions have been successfully employed to construct nucleus-nucleus potentials for describing α decay and nucleus-nucleus scattering [17, 25, 33, 41, 49, 50]. Furthermore, within the non-relativistic Hartree-Fock framework, the CDM3Y parameterizations have been systematically adopted to construct the equations of state (EOS) for asymmetric nuclear matter and pure neutron matter. They serve as a robust theoretical tool to investigate both the microscopic properties and macroscopic structural observables of neutron stars [51−56]. The CDM3Y6 interaction takes the following form,
$ v_{N}\left(E_{\alpha}, s, \rho_{1}, \rho_{2}\right)=v\left(s, E_{\alpha}\right)^{\text{M3Y}} f\left(\rho_{1}, \rho_{2}\right)g\left(E_{\alpha}\right), $
(6) where
$ v\left(s, E_{\alpha}\right)^{\text{M3Y}} $ is the standard M3Y-Reid potential [57]. The functions$ f(\rho_1, \rho_2) $ and$ g(E_\alpha) $ represent the density and energy dependence of the NN interaction, respectively.$ f(\rho_{1}, \rho_{2})= C_{1}[1+C_{2} \text{e}^{-C_{3}(\rho_{1}+\rho_{2})}-C_{4}(\rho_{1}+\rho_{2})], $
(7) $ g(E_{\alpha})= 1-0.002 E_{\alpha} / A_{\alpha}, $
(8) where the parameters
$ C_1, C_2, C_3 $ and$ C_4 $ are determined by reproducing the saturation properties of nuclear matter through Hartree-Fock calculations [49].The Migdal interaction is a phenomenological effective interaction proposed to describe the forces between quasiparticles in finite fermion systems [58]. In contrast to the finite-range CDM3Y6 interaction, the Migdal interaction is formulated as a zero-range interaction that depends on the local medium density. It has the following form [47]:
$ \begin{aligned}[b] v_{N}\left({\boldsymbol{r}}_{1}, {\boldsymbol{r}}_{2}, {\boldsymbol{R}}\right)= & C_{0}\left\{F_{{\mathrm{in}}} x\left({\boldsymbol{r}}_{1}, {\boldsymbol{r}}_{2}, {\boldsymbol{R}}\right)\right.\\ &\left.+F_{{\mathrm{e x}}}\left[1-x\left({\boldsymbol{r}}_{1}, {\boldsymbol{r}}_{2}, {\boldsymbol{R}}\right)\right]\right\}\delta(s), \end{aligned} $
(9) where
$ C_0 $ represents the inverse density of states at the Fermi surface. The parameters$ F_{{\mathrm{in}}} $ and$ F_{{\mathrm{ex}}} $ can be determined by fitting to experimental data, based on the theory of finite Fermi systems [59].$ x\left({\rho}_{1}, {\rho}_{2}\right) $ is a function that depends on the relative density, which changes with the overlap between the α cluster and the daughter nucleus. This relative density is determined by the density distributions of both nuclei.$ x\left({\boldsymbol{r}}_{1}, {\boldsymbol{r}}_{2}, {\boldsymbol{R}}\right)=\frac{\rho_{1}\left({\boldsymbol{r}}_{1}\right)+\rho_{2}\left({\boldsymbol{r}}_{2}, {\boldsymbol{R}}\right)}{\rho_{00}\left({\boldsymbol{R}}\right)}, $
(10) where
$ \rho_{00} $ is the average saturation density$ [\rho_{1s}+ \rho_{2s}\left({\boldsymbol{R}}\right)]/2 $ . Based on the above DDFP, this study utilizes the two-potential approach [60] to calculate the half-life of α decay. In this approach, the calculation of the decay width is decomposed into a bound-state problem and a scattering-state problem. The decay width$ \Gamma(\xi) $ can be determined from the bound-state wavefunction$ \varphi_0(R) $ , the scattering-state wavefunction$ \chi(R) $ , and its first derivative$ \chi'(R) $ , all evaluated at the separation radius$ R_t $ .$ \Gamma(\xi)=\frac{\hbar^{2}}{m k}\left|\varphi_{0}\left(R_{t}, \xi\right)\left[\alpha \chi\left(R_{t}, \xi\right)+\chi^{\prime}\left(R_{t}, \xi\right)\right]\right|^{2}, $
(11) $ R_t $ should be chosen in a region where the nuclear force is negligible and the Coulomb force dominates, but not too close to the outer classical turning point. Therefore, in this study,$ R_t $ was taken as the midpoint between the peak of the potential barrier and the third classical turning point. Here, m is the reduced mass of the α cluster and daughter nucleus. The quantities$ \alpha = \sqrt{2 m [V(R_t)- Q_\alpha] / \hbar^{2}} $ and$ k = \sqrt{2 m Q_\alpha / \hbar^{2}} $ are the wave numbers for the two different energies.To obtain the final α-nucleus potential, the nuclear potential depth λ in Eq. (2) must be determined. For both the CDM3Y6 and Migdal interactions, λ is determined by requiring that the eigenvalue of the corresponding bound state
$ \varphi_0 $ exactly matches the experimental decay energy within the two-potential approach. For the deep-well DDFP based on the CDM3Y6 interaction,$ \varphi_0 $ must also satisfy the Wildermuth condition [25] to account for Pauli blocking effects at large density overlaps [41, 46]. For deformed nuclei, the final decay width Γ must be averaged over all relative orientation angles ξ.$ \Gamma=\int_0^{\pi/2}\Gamma(\xi)\sin\xi\mathrm{d}\xi. $
(12) Finally, the α-decay half-life is calculated using the following formula:
$ T_{1 / 2}=\frac{\hbar \ln 2}{P_{\alpha} \Gamma}, $
(13) where
$ P_\alpha $ is the α-preformation factor, which represents the probability of forming an α cluster within the nucleus. Given experimental α-decay data, one can set$ P_\alpha=1 $ in Eq. (13) to extract the empirical value of$ P_\alpha $ indirectly.$ P_{\alpha}=\frac{\hbar \ln 2}{\Gamma} / T_{1 / 2}^{\exp } , $
(14) where
$ T_{1 / 2}^{\exp } $ is the experimental α-decay half-life. -
In the cluster model of α decay, the α-nucleus potential
$ V({\boldsymbol{R}}) $ is composed of three parts: the nuclear potential$ V_N $ , the Coulomb potential$ V_C $ , and the centrifugal potential$ V_{l}(R)=\dfrac{\hbar^{2} L(L+1)}{2 m R^{2}} $ .$ V(R, \xi)=V_{N}(R, \xi)+V_{C}(R, \xi)+V_{l}(R). $
(1) In this study, the nuclear potential
$ V_N $ and the Coulomb potential$ V_C $ are determined within the framework of the dynamical double-folding potential [25, 41]. The dynamical double-folding potential, used with specific nucleon-nucleon (NN) interactions, reliably describes the α-nucleus interaction through a double-folding integration over the density distributions of the α cluster and the daughter nucleus.$ V_{N, C}(R, \xi)=\lambda(\xi) \iint {\mathrm{d}} {\boldsymbol{r}}_{\bf{1}} {\mathrm{d}} {\boldsymbol{r}}_{\mathbf{2}} \rho_{1}\left({\boldsymbol{r}}_{\bf{1}}\right) \rho_{2}\left({\boldsymbol{r}}_{\mathbf{2}}, {\boldsymbol{R}}\right)v_{N, C}(s), $
(2) where s denotes the distance between the two interacting nucleons (one from each nucleus), i.e.,
$ s=|{\boldsymbol{R}}+{\boldsymbol{r}}_2-{\boldsymbol{r}}_1| $ .$ \rho_1 $ is the density distribution of the daughter nucleus, which takes a Fermi form. An angle ξ is introduced to account for its axial symmetry:$ \rho_{1}\left(r_{1}, \theta\right)=\frac{\rho_{1 s}}{1+\exp \left(\dfrac{r_{1}-R_{d}(\theta)}{a_0}\right)}, $
(3) where
$ R_{d}=1.125 A_{d}^{1 / 3}\left[1+\beta_{2} Y_{2}^{0}(\theta)+\beta_{4} Y_{4}^{0}(\theta)\right] $ fm and$ a_0= 0.54 $ fm [46, 47]. The density distribution of the α cluster$ \rho_2 $ follows a Gaussian form. The width parameter β determines the size of the α cluster. To account for the medium effect, this width parameter depends on the nuclear medium density$ \rho_1({\boldsymbol{R}}) $ at the position$ {\boldsymbol{R}} $ of the α cluster.$ \rho_{2}\left({\boldsymbol{r}}_{2}, {\boldsymbol{R}}\right)=\rho_{2 s} \exp \left[-\beta\left(\rho_{1}({\boldsymbol{R}})\right) r_{2}^{2}\right] . $
(4) The values of
$ \rho_{1s} $ and$ \rho_{2s} $ are determined by normalizing the density distributions to the corresponding mass (or charge) numbers. The dependence of β on density is constrained by the results of the many-body calculation in Ref. [39] and can be effectively described by the analytical expression [48].$ \beta\left(\rho_{1}\right)=\frac{0.7024}{1+a_{1} \rho_{1}}, $
(5) where the coefficient
$ a_{1} $ is given by$ a_1 $ =$ \dfrac{45}{16}\rho_{1s} $ . Here,$ \rho_{1s} $ denotes the central saturation density of the daughter nucleus. This expression ensures that the size of the α cluster changes smoothly from the interior to the exterior of the daughter nucleus.The NN interaction for the Coulomb potential is well understood, whereas the NN interaction for the nuclear potential should take a density-dependent form to account for medium effects [48]. In this study, we will compare the performance of DDFPs obtained with the CDM3Y6 interaction and the Migdal interaction. The CDM3Y6 interaction is one of the parameterized CDM3Y effective interactions, which incorporate in-medium density dependence into the finite-range M3Y interactions [49]. The CDM3Y interactions have been successfully employed to construct nucleus-nucleus potentials for describing α decay and nucleus-nucleus scattering [17, 25, 33, 41, 49, 50]. Furthermore, within the non-relativistic Hartree-Fock framework, the CDM3Y parameterizations have been systematically adopted to construct the equations of state (EOS) for asymmetric nuclear matter and pure neutron matter. They serve as a robust theoretical tool to investigate both the microscopic properties and macroscopic structural observables of neutron stars [51−56]. The CDM3Y6 interaction takes the following form,
$ v_{N}\left(E_{\alpha}, s, \rho_{1}, \rho_{2}\right)=v\left(s, E_{\alpha}\right)^{\text{M3Y}} f\left(\rho_{1}, \rho_{2}\right)g\left(E_{\alpha}\right), $
(6) where
$ v\left(s, E_{\alpha}\right)^{\text{M3Y}} $ is the standard M3Y-Reid potential [57]. The functions$ f(\rho_1, \rho_2) $ and$ g(E_\alpha) $ represent the density and energy dependence of the NN interaction, respectively.$ f(\rho_{1}, \rho_{2})= C_{1}[1+C_{2} \text{e}^{-C_{3}(\rho_{1}+\rho_{2})}-C_{4}(\rho_{1}+\rho_{2})], $
(7) $ g(E_{\alpha})= 1-0.002 E_{\alpha} / A_{\alpha}, $
(8) where the parameters
$ C_1, C_2, C_3 $ and$ C_4 $ are determined by reproducing the saturation properties of nuclear matter through Hartree-Fock calculations [49].The Migdal interaction is a phenomenological effective interaction proposed to describe the forces between quasiparticles in finite fermion systems [58]. In contrast to the finite-range CDM3Y6 interaction, the Migdal interaction is formulated as a zero-range interaction that depends on the local medium density. It has the following form [47]:
$ \begin{aligned}[b] v_{N}\left({\boldsymbol{r}}_{1}, {\boldsymbol{r}}_{2}, {\boldsymbol{R}}\right)= & C_{0}\left\{F_{{\mathrm{in}}} x\left({\boldsymbol{r}}_{1}, {\boldsymbol{r}}_{2}, {\boldsymbol{R}}\right)\right.\\ &\left.+F_{{\mathrm{e x}}}\left[1-x\left({\boldsymbol{r}}_{1}, {\boldsymbol{r}}_{2}, {\boldsymbol{R}}\right)\right]\right\}\delta(s), \end{aligned} $
(9) where
$ C_0 $ represents the inverse density of states at the Fermi surface. The parameters$ F_{{\mathrm{in}}} $ and$ F_{{\mathrm{ex}}} $ can be determined by fitting to experimental data, based on the theory of finite Fermi systems [59].$ x\left({\rho}_{1}, {\rho}_{2}\right) $ is a function that depends on the relative density, which changes with the overlap between the α cluster and the daughter nucleus. This relative density is determined by the density distributions of both nuclei.$ x\left({\boldsymbol{r}}_{1}, {\boldsymbol{r}}_{2}, {\boldsymbol{R}}\right)=\frac{\rho_{1}\left({\boldsymbol{r}}_{1}\right)+\rho_{2}\left({\boldsymbol{r}}_{2}, {\boldsymbol{R}}\right)}{\rho_{00}\left({\boldsymbol{R}}\right)}, $
(10) where
$ \rho_{00} $ is the average saturation density$ [\rho_{1s}+ \rho_{2s}\left({\boldsymbol{R}}\right)]/2 $ . Based on the above DDFP, this study utilizes the two-potential approach [60] to calculate the half-life of α decay. In this approach, the calculation of the decay width is decomposed into a bound-state problem and a scattering-state problem. The decay width$ \Gamma(\xi) $ can be determined from the bound-state wavefunction$ \varphi_0(R) $ , the scattering-state wavefunction$ \chi(R) $ , and its first derivative$ \chi'(R) $ , all evaluated at the separation radius$ R_t $ .$ \Gamma(\xi)=\frac{\hbar^{2}}{m k}\left|\varphi_{0}\left(R_{t}, \xi\right)\left[\alpha \chi\left(R_{t}, \xi\right)+\chi^{\prime}\left(R_{t}, \xi\right)\right]\right|^{2}, $
(11) $ R_t $ should be chosen in a region where the nuclear force is negligible and the Coulomb force dominates, but not too close to the outer classical turning point. Therefore, in this study,$ R_t $ was taken as the midpoint between the peak of the potential barrier and the third classical turning point. Here, m is the reduced mass of the α cluster and daughter nucleus. The quantities$ \alpha = \sqrt{2 m [V(R_t)- Q_\alpha] / \hbar^{2}} $ and$ k = \sqrt{2 m Q_\alpha / \hbar^{2}} $ are the wave numbers for the two different energies.To obtain the final α-nucleus potential, the nuclear potential depth λ in Eq. (2) must be determined. For both the CDM3Y6 and Migdal interactions, λ is determined by requiring that the eigenvalue of the corresponding bound state
$ \varphi_0 $ exactly matches the experimental decay energy within the two-potential approach. For the deep-well DDFP based on the CDM3Y6 interaction,$ \varphi_0 $ must also satisfy the Wildermuth condition [25] to account for Pauli blocking effects at large density overlaps [41, 46]. For deformed nuclei, the final decay width Γ must be averaged over all relative orientation angles ξ.$ \Gamma=\int_0^{\pi/2}\Gamma(\xi)\sin\xi\mathrm{d}\xi. $
(12) Finally, the α-decay half-life is calculated using the following formula:
$ T_{1 / 2}=\frac{\hbar \ln 2}{P_{\alpha} \Gamma}, $
(13) where
$ P_\alpha $ is the α-preformation factor, which represents the probability of forming an α cluster within the nucleus. Given experimental α-decay data, one can set$ P_\alpha=1 $ in Eq. (13) to extract the empirical value of$ P_\alpha $ indirectly.$ P_{\alpha}=\frac{\hbar \ln 2}{\Gamma} / T_{1 / 2}^{\exp } , $
(14) where
$ T_{1 / 2}^{\exp } $ is the experimental α-decay half-life. -
In the cluster model of α decay, the α-nucleus potential
$ V({\boldsymbol{R}}) $ is composed of three parts: the nuclear potential$ V_N $ , the Coulomb potential$ V_C $ , and the centrifugal potential$ V_{l}(R)=\dfrac{\hbar^{2} L(L+1)}{2 m R^{2}} $ .$ V(R, \xi)=V_{N}(R, \xi)+V_{C}(R, \xi)+V_{l}(R). $
(1) In this study, the nuclear potential
$ V_N $ and the Coulomb potential$ V_C $ are determined within the framework of the dynamical double-folding potential [25, 41]. The dynamical double-folding potential, used with specific nucleon-nucleon (NN) interactions, reliably describes the α-nucleus interaction through a double-folding integration over the density distributions of the α cluster and the daughter nucleus.$ V_{N, C}(R, \xi)=\lambda(\xi) \iint {\mathrm{d}} {\boldsymbol{r}}_{\bf{1}} {\mathrm{d}} {\boldsymbol{r}}_{\mathbf{2}} \rho_{1}\left({\boldsymbol{r}}_{\bf{1}}\right) \rho_{2}\left({\boldsymbol{r}}_{\mathbf{2}}, {\boldsymbol{R}}\right)v_{N, C}(s), $
(2) where s denotes the distance between the two interacting nucleons (one from each nucleus), i.e.,
$ s=|{\boldsymbol{R}}+{\boldsymbol{r}}_2-{\boldsymbol{r}}_1| $ .$ \rho_1 $ is the density distribution of the daughter nucleus, which takes a Fermi form. An angle ξ is introduced to account for its axial symmetry:$ \rho_{1}\left(r_{1}, \theta\right)=\frac{\rho_{1 s}}{1+\exp \left(\dfrac{r_{1}-R_{d}(\theta)}{a_0}\right)}, $
(3) where
$ R_{d}=1.125 A_{d}^{1 / 3}\left[1+\beta_{2} Y_{2}^{0}(\theta)+\beta_{4} Y_{4}^{0}(\theta)\right] $ fm and$ a_0= 0.54 $ fm [46, 47]. The density distribution of the α cluster$ \rho_2 $ follows a Gaussian form. The width parameter β determines the size of the α cluster. To account for the medium effect, this width parameter depends on the nuclear medium density$ \rho_1({\boldsymbol{R}}) $ at the position$ {\boldsymbol{R}} $ of the α cluster.$ \rho_{2}\left({\boldsymbol{r}}_{2}, {\boldsymbol{R}}\right)=\rho_{2 s} \exp \left[-\beta\left(\rho_{1}({\boldsymbol{R}})\right) r_{2}^{2}\right] . $
(4) The values of
$ \rho_{1s} $ and$ \rho_{2s} $ are determined by normalizing the density distributions to the corresponding mass (or charge) numbers. The dependence of β on density is constrained by the results of the many-body calculation in Ref. [39] and can be effectively described by the analytical expression [48].$ \beta\left(\rho_{1}\right)=\frac{0.7024}{1+a_{1} \rho_{1}}, $
(5) where the coefficient
$ a_{1} $ is given by$ a_1 $ =$ \dfrac{45}{16}\rho_{1s} $ . Here,$ \rho_{1s} $ denotes the central saturation density of the daughter nucleus. This expression ensures that the size of the α cluster changes smoothly from the interior to the exterior of the daughter nucleus.The NN interaction for the Coulomb potential is well understood, whereas the NN interaction for the nuclear potential should take a density-dependent form to account for medium effects [48]. In this study, we will compare the performance of DDFPs obtained with the CDM3Y6 interaction and the Migdal interaction. The CDM3Y6 interaction is one of the parameterized CDM3Y effective interactions, which incorporate in-medium density dependence into the finite-range M3Y interactions [49]. The CDM3Y interactions have been successfully employed to construct nucleus-nucleus potentials for describing α decay and nucleus-nucleus scattering [17, 25, 33, 41, 49, 50]. Furthermore, within the non-relativistic Hartree-Fock framework, the CDM3Y parameterizations have been systematically adopted to construct the equations of state (EOS) for asymmetric nuclear matter and pure neutron matter. They serve as a robust theoretical tool to investigate both the microscopic properties and macroscopic structural observables of neutron stars [51−56]. The CDM3Y6 interaction takes the following form,
$ v_{N}\left(E_{\alpha}, s, \rho_{1}, \rho_{2}\right)=v\left(s, E_{\alpha}\right)^{\text{M3Y}} f\left(\rho_{1}, \rho_{2}\right)g\left(E_{\alpha}\right), $
(6) where
$ v\left(s, E_{\alpha}\right)^{\text{M3Y}} $ is the standard M3Y-Reid potential [57]. The functions$ f(\rho_1, \rho_2) $ and$ g(E_\alpha) $ represent the density and energy dependence of the NN interaction, respectively.$ f(\rho_{1}, \rho_{2})= C_{1}[1+C_{2} \text{e}^{-C_{3}(\rho_{1}+\rho_{2})}-C_{4}(\rho_{1}+\rho_{2})], $
(7) $ g(E_{\alpha})= 1-0.002 E_{\alpha} / A_{\alpha}, $
(8) where the parameters
$ C_1, C_2, C_3 $ and$ C_4 $ are determined by reproducing the saturation properties of nuclear matter through Hartree-Fock calculations [49].The Migdal interaction is a phenomenological effective interaction proposed to describe the forces between quasiparticles in finite fermion systems [58]. In contrast to the finite-range CDM3Y6 interaction, the Migdal interaction is formulated as a zero-range interaction that depends on the local medium density. It has the following form [47]:
$ \begin{aligned}[b] v_{N}\left({\boldsymbol{r}}_{1}, {\boldsymbol{r}}_{2}, {\boldsymbol{R}}\right)= & C_{0}\left\{F_{{\mathrm{in}}} x\left({\boldsymbol{r}}_{1}, {\boldsymbol{r}}_{2}, {\boldsymbol{R}}\right)\right.\\ &\left.+F_{{\mathrm{e x}}}\left[1-x\left({\boldsymbol{r}}_{1}, {\boldsymbol{r}}_{2}, {\boldsymbol{R}}\right)\right]\right\}\delta(s), \end{aligned} $
(9) where
$ C_0 $ represents the inverse density of states at the Fermi surface. The parameters$ F_{{\mathrm{in}}} $ and$ F_{{\mathrm{ex}}} $ can be determined by fitting to experimental data, based on the theory of finite Fermi systems [59].$ x\left({\rho}_{1}, {\rho}_{2}\right) $ is a function that depends on the relative density, which changes with the overlap between the α cluster and the daughter nucleus. This relative density is determined by the density distributions of both nuclei.$ x\left({\boldsymbol{r}}_{1}, {\boldsymbol{r}}_{2}, {\boldsymbol{R}}\right)=\frac{\rho_{1}\left({\boldsymbol{r}}_{1}\right)+\rho_{2}\left({\boldsymbol{r}}_{2}, {\boldsymbol{R}}\right)}{\rho_{00}\left({\boldsymbol{R}}\right)}, $
(10) where
$ \rho_{00} $ is the average saturation density$ [\rho_{1s}+ \rho_{2s}\left({\boldsymbol{R}}\right)]/2 $ . Based on the above DDFP, this study utilizes the two-potential approach [60] to calculate the half-life of α decay. In this approach, the calculation of the decay width is decomposed into a bound-state problem and a scattering-state problem. The decay width$ \Gamma(\xi) $ can be determined from the bound-state wavefunction$ \varphi_0(R) $ , the scattering-state wavefunction$ \chi(R) $ , and its first derivative$ \chi'(R) $ , all evaluated at the separation radius$ R_t $ .$ \Gamma(\xi)=\frac{\hbar^{2}}{m k}\left|\varphi_{0}\left(R_{t}, \xi\right)\left[\alpha \chi\left(R_{t}, \xi\right)+\chi^{\prime}\left(R_{t}, \xi\right)\right]\right|^{2}, $
(11) $ R_t $ should be chosen in a region where the nuclear force is negligible and the Coulomb force dominates, but not too close to the outer classical turning point. Therefore, in this study,$ R_t $ was taken as the midpoint between the peak of the potential barrier and the third classical turning point. Here, m is the reduced mass of the α cluster and daughter nucleus. The quantities$ \alpha = \sqrt{2 m [V(R_t)- Q_\alpha] / \hbar^{2}} $ and$ k = \sqrt{2 m Q_\alpha / \hbar^{2}} $ are the wave numbers for the two different energies.To obtain the final α-nucleus potential, the nuclear potential depth λ in Eq. (2) must be determined. For both the CDM3Y6 and Migdal interactions, λ is determined by requiring that the eigenvalue of the corresponding bound state
$ \varphi_0 $ exactly matches the experimental decay energy within the two-potential approach. For the deep-well DDFP based on the CDM3Y6 interaction,$ \varphi_0 $ must also satisfy the Wildermuth condition [25] to account for Pauli blocking effects at large density overlaps [41, 46]. For deformed nuclei, the final decay width Γ must be averaged over all relative orientation angles ξ.$ \Gamma=\int_0^{\pi/2}\Gamma(\xi)\sin\xi\mathrm{d}\xi. $
(12) Finally, the α-decay half-life is calculated using the following formula:
$ T_{1 / 2}=\frac{\hbar \ln 2}{P_{\alpha} \Gamma}, $
(13) where
$ P_\alpha $ is the α-preformation factor, which represents the probability of forming an α cluster within the nucleus. Given experimental α-decay data, one can set$ P_\alpha=1 $ in Eq. (13) to extract the empirical value of$ P_\alpha $ indirectly.$ P_{\alpha}=\frac{\hbar \ln 2}{\Gamma} / T_{1 / 2}^{\exp } , $
(14) where
$ T_{1 / 2}^{\exp } $ is the experimental α-decay half-life. -
To evaluate the performance of the DDFPs using the CDM3Y6 and Migdal interactions, we focus on the α-decay properties of odd-A nuclei in the range
$ 78 \le Z \le 90 $ . We note that only ground-state to ground-state (g.s. to g.s.) transitions are considered in this study. This restriction arises because the current DDFP model requires deformation parameters as input for the daughter nuclei, and systematic theoretical descriptions of nuclear deformation—such as the adopted FRDM calculations [61]—are currently only available for ground states. In total, 87 nuclei in this region are investigated. Among these, 79 nuclei—excluding those in the$ N=125 $ and$ N=127 $ isotonic chains—exhibit favored decays from ground-state to ground-state, whereas the remaining 8 nuclei in these chains display unfavored decays.We first compare the
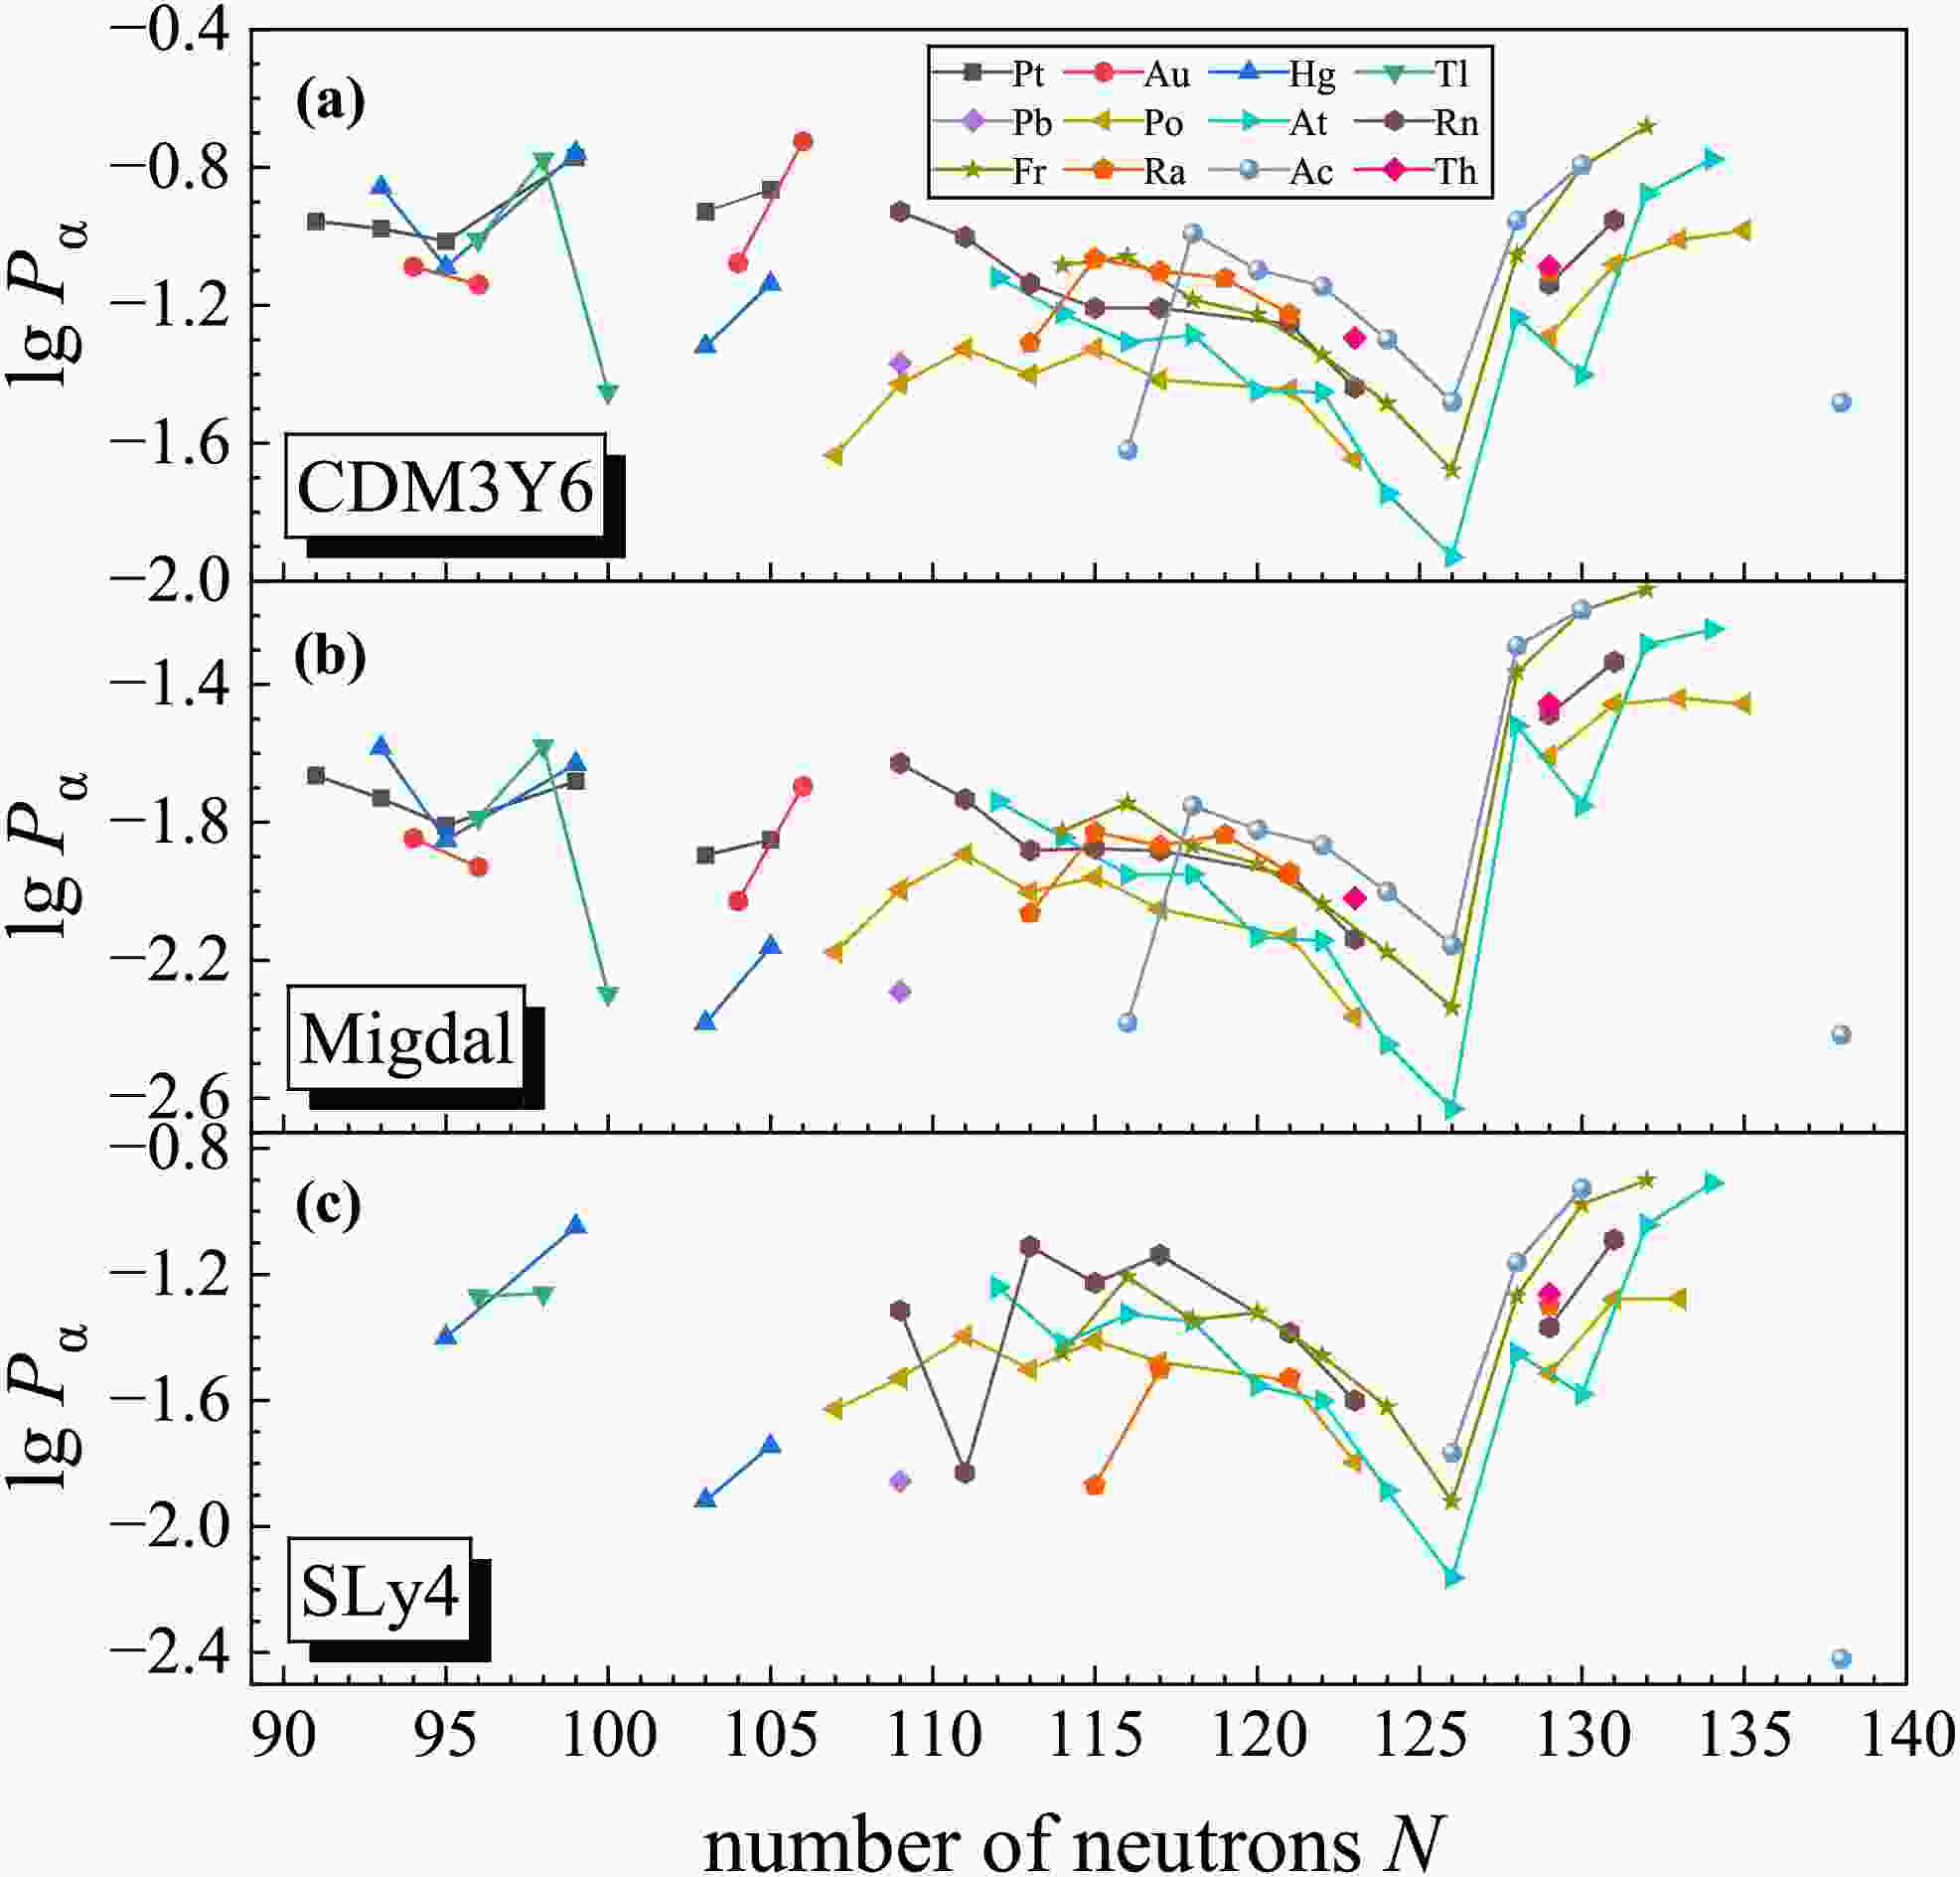
$ P_\alpha $ factors calculated using Eq. (14) for the two interactions. For reference, the results from the Hamiltonian energy-density approach based on the SLy4 Skyrme interaction [62] are also included for comparison. As shown in Fig. 1 and Table 1, the values of$ \lg P_\alpha $ obtained with the CDM3Y6 interaction range from –2.0 to –0.6, while those obtained with the Migdal interaction range from –2.7 to –1.1. The CDM3Y6 values are systematically larger, with an average ratio of 5 and individual ratios ranging from 1.9 to 11.6. Notably, the magnitudes of$ P_\alpha $ derived from the SLy4 Skyrme interaction generally fall between those of the other two interactions. They align more closely with the CDM3Y6 results, with differences below a factor of 2 for most nuclei.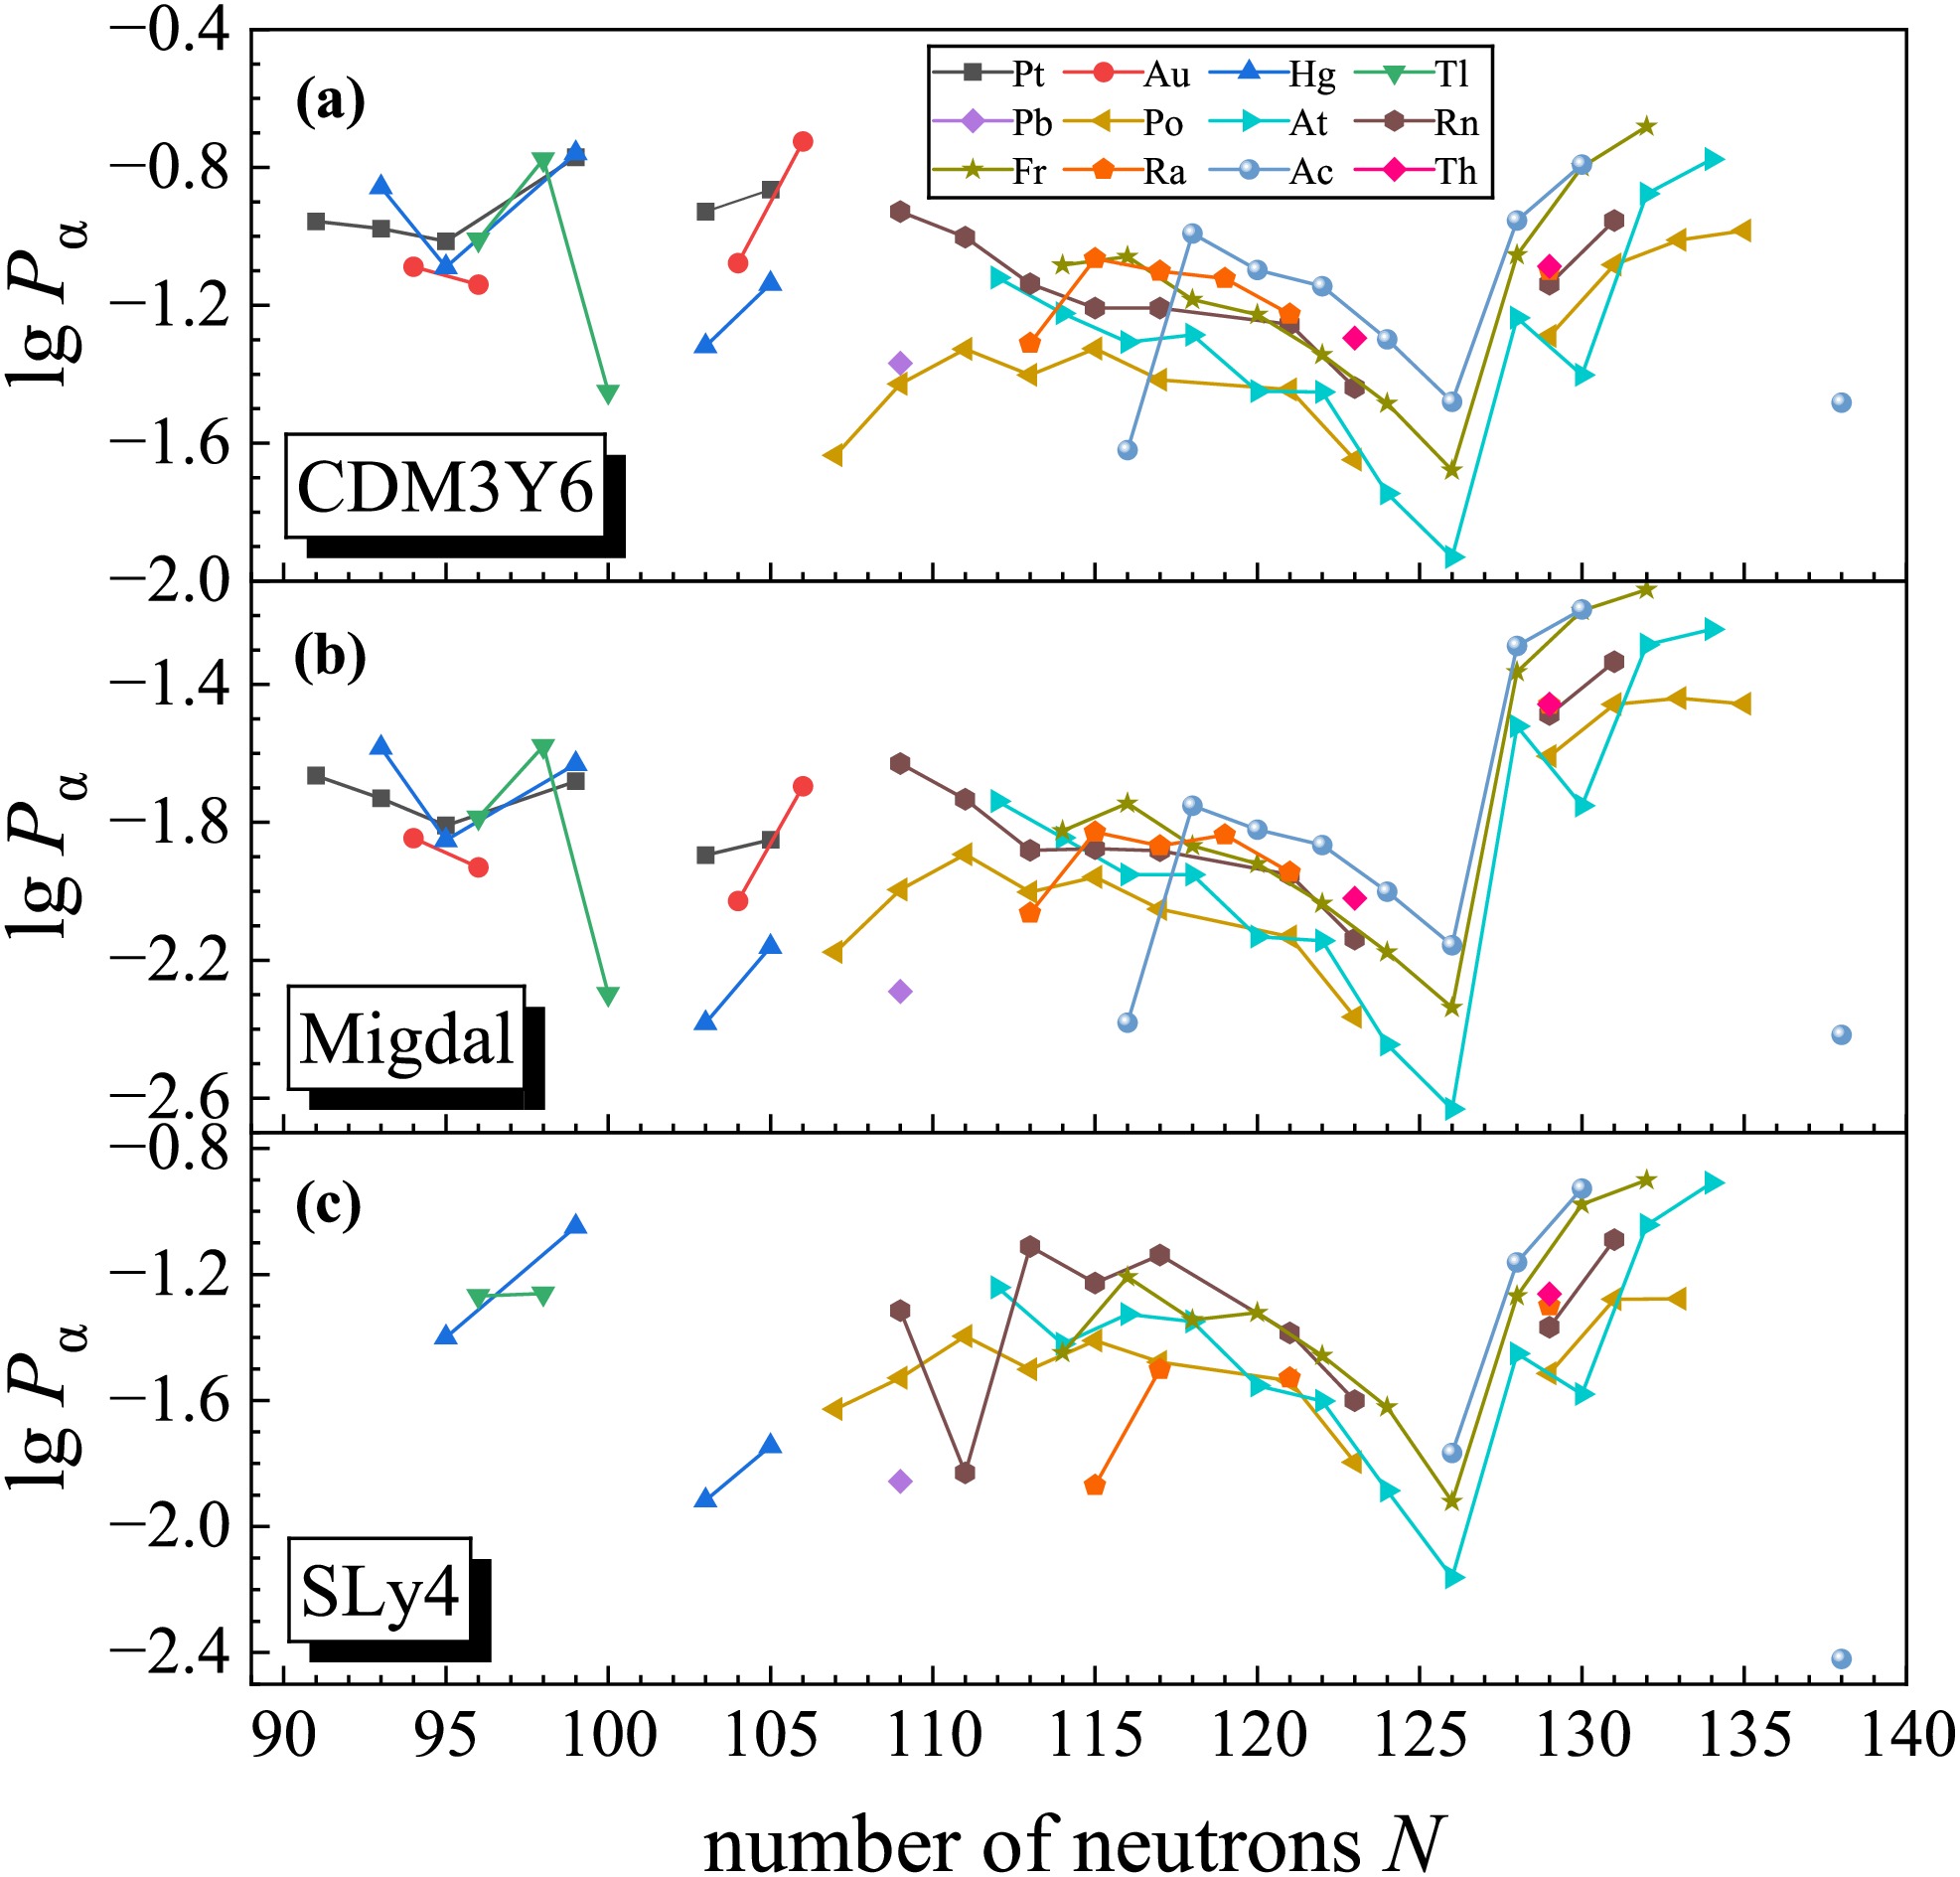
Figure 1. (color online)
$ P_\alpha $ variation versus neutron number. The$ P_\alpha $ factors for panels (a) and (b) are extracted using DDFPs based on the CDM3Y6 and Migdal interactions, respectively. The$ P_\alpha $ factors in (c) are extracted using the Hamiltonian energy-density approach with the SLy4 Skyrme interaction [62].Nuclide $ Q_\alpha $ /MeV$ \beta_2 $ $ \beta_4 $ $ T_{1/2}^{\text{exp}} $ $ T_{1/2}^{\text{cal}}{\rm{(Migdal)}} $ $ T_{1/2}^{\text{cal}}{\rm{(CDM3Y6)}} $ $ P_\alpha $ (Migdal)$ P_\alpha $ (CDM3Y6)$ ^{169}\text{Pt} $ 6.858 0.140 −0.005 6.99×10⁻³ 4.84×10⁻³ 7.41×10⁻³ 2.17×10⁻² 1.11×10⁻¹ $ ^{171}\text{Pt} $ 6.607 0.162 −0.015 5.06×10⁻² 3.17×10⁻² 5.27×10⁻² 1.86×10⁻² 1.05×10⁻¹ $ ^{173}\text{Pt} $ 6.350 0.173 −0.013 4.63×10⁻¹ 2.56×10⁻¹ 4.60×10⁻¹ 1.55×10⁻² 9.69×10⁻² $ ^{177}\text{Pt} $ 5.643 0.206 −0.009 2.10×10² 1.76×10² 3.93×10² 2.08×10⁻² 1.69×10⁻¹ $ ^{181}\text{Pt} $ 5.150 0.218 −0.019 7.30×10⁴ 4.30×10⁴ 1.03×10⁵ 1.27×10⁻² 1.18×10⁻¹ $ ^{183}\text{Pt} $ 4.823 0.219 −0.031 4.06×10⁶ 2.87×10⁶ 6.91×10⁶ 1.41×10⁻² 1.36×10⁻¹ $ ^{173}\text{Au} $ 6.836 0.151 −0.003 2.66×10⁻² 1.31×10⁻² 2.19×10⁻² 1.42×10⁻² 8.17×10⁻² $ ^{175}\text{Au} $ 6.583 0.162 −0.015 2.23×10⁻¹ 9.62×10⁻² 1.69×10⁻¹ 1.17×10⁻² 7.42×10⁻² $ ^{183}\text{Au} $ 5.466 0.207 −0.021 7.88×10³ 3.54×10³ 8.05×10³ 9.36×10⁻³ 8.37×10⁻² $ ^{185}\text{Au} $ 5.180 0.207 −0.033 9.81×10⁴ 1.03×10⁵ 2.35×10⁵ 2.02×10⁻² 1.88×10⁻¹ $ ^{173}\text{Hg} $ 7.380 0.129 0.007 7.00×10⁻⁴ 6.15×10⁻⁴ 9.61×10⁻⁴ 2.61×10⁻² 1.39×10⁻¹ $ ^{175}\text{Hg} $ 7.072 0.140 0.007 1.08×10⁻² 5.41×10⁻³ 9.02×10⁻³ 1.41×10⁻² 8.14×10⁻² $ ^{179}\text{Hg} $ 6.340 0.173 −0.001 1.98×100 1.87×100 3.81×100 2.34×10⁻² 1.74×10⁻¹ $ ^{183}\text{Hg} $ 6.039 0.250 0.011 8.83×101 1.69×101 5.06×101 4.14×10⁻³ 4.79×10⁻² $ ^{185}\text{Hg} $ 5.774 0.240 −0.016 8.52×10² 2.94×10² 7.73×10² 6.89×10⁻³ 7.27×10⁻² $ ^{177}\text{Tl} $ 7.067 0.129 −0.006 2.47×10⁻² 1.48×10⁻² 2.52×10⁻² 1.64×10⁻² 9.79×10⁻² $ ^{179}\text{Tl} $ 6.718 0.129 −0.006 2.30×10⁻¹ 2.37×10⁻¹ 4.16×10⁻¹ 2.64×10⁻² 1.67×10⁻¹ $ ^{181}\text{Tl} $ 6.322 0.140 −0.005 3.37×101 7.07×100 1.34×101 5.04×10⁻³ 3.54×10⁻² $ ^{191}\text{Pb} $ 5.450 −0.146 −0.015 6.14×10⁵ 1.87×10⁵ 3.59×10⁵ 5.13×10⁻³ 4.28×10⁻² $ ^{191}\text{Po} $ 7.501 0.011 0.000 2.89×10⁻² 1.04×10⁻² 8.71×10⁻³ 6.65×10⁻³ 2.32×10⁻² $ ^{193}\text{Po} $ 7.094 0.000 0.000 3.91×10⁻¹ 2.36×10⁻¹ 1.99×10⁻¹ 1.01×10⁻² 3.73×10⁻² $ ^{195}\text{Po} $ 6.750 0.000 0.000 4.96×100 4.17×100 3.35×100 1.28×10⁻² 4.71×10⁻² $ ^{197}\text{Po} $ 6.412 0.021 0.000 1.22×10² 8.92×101 7.27×101 9.94×10⁻³ 3.69×10⁻² $ ^{199}\text{Po} $ 6.074 0.032 0.000 2.74×10³ 2.51×10³ 2.05×10³ 1.10×10⁻² 4.72×10⁻² $ ^{201}\text{Po} $ 5.799 0.011 0.000 5.85×10⁴ 5.02×10⁴ 3.78×10⁴ 8.88×10⁻³ 3.83×10⁻² $ ^{205}\text{Po} $ 5.325 0.000 0.000 1.57×10⁷ 1.62×10⁷ 1.07×10⁷ 7.38×10⁻³ 3.59×10⁻² $ ^{207}\text{Po} $ 5.216 0.000 0.000 9.94×10⁷ 7.75×10⁷ 4.55×10⁷ 4.32×10⁻³ 2.25×10⁻² $ ^{213}\text{Po} $ 8.536 −0.011 0.000 3.72×10⁻⁶ 2.54×10⁻⁶ 1.66×10⁻⁶ 2.47×10⁻² 5.13×10⁻² $ ^{215}\text{Po} $ 7.526 0.000 0.000 1.78×10⁻³ 1.80×10⁻³ 1.32×10⁻³ 3.49×10⁻² 8.28×10⁻² $ ^{217}\text{Po} $ 6.662 0.000 0.000 1.57×100 1.74×100 1.42×100 3.64×10⁻² 9.77×10⁻² $ ^{219}\text{Po} $ 5.910 0.000 0.000 2.20×10³ 2.46×10³ 2.18×10³ 3.50×10⁻² 1.04×10⁻¹ $ ^{197}\text{At} $ 7.104 0.075 0.014 3.96×10⁻¹ 5.03×10⁻¹ 4.41×10⁻¹ 1.82×10⁻² 7.58×10⁻² $ ^{199}\text{At} $ 6.777 −0.052 0.013 7.69×100 8.61×100 7.11×100 1.43×10⁻² 5.97×10⁻² $ ^{201}\text{At} $ 6.473 −0.052 0.013 1.41×10² 1.41×10² 1.13×10² 1.12×10⁻² 4.93×10⁻² $ ^{203}\text{At} $ 6.210 −0.052 0.013 1.64×10³ 1.92×10³ 1.47×10³ 1.12×10⁻² 5.18×10⁻² $ ^{205}\text{At} $ 6.020 −0.052 0.013 1.61×10⁴ 1.50×10⁴ 1.06×10⁴ 7.38×10⁻³ 3.55×10⁻² $ ^{207}\text{At} $ 5.872 −0.042 0.001 7.58×10⁴ 8.60×10⁴ 5.27×10⁴ 7.20×10⁻³ 3.54×10⁻² $ ^{209}\text{At} $ 5.757 −0.042 0.001 5.01×10⁵ 3.80×10⁵ 1.90×10⁵ 3.59×10⁻³ 1.80×10⁻² $ ^{211}\text{At} $ 5.982 −0.021 0.000 6.21×10⁴ 4.65×10⁴ 1.66×10⁴ 2.34×10⁻³ 1.17×10⁻² $ ^{213}\text{At} $ 9.254 −0.011 0.000 1.26×10⁻⁷ 1.03×10⁻⁷ 6.28×10⁻⁸ 3.01×10⁻² 5.79×10⁻² $ ^{215}\text{At} $ 8.178 −0.010 0.012 1.00×10⁻⁴ 5.03×10⁻⁵ 3.50×10⁻⁵ 1.77×10⁻² 3.96×10⁻² $ ^{217}\text{At} $ 7.201 −0.010 0.012 3.26×10⁻² 5.03×10⁻² 3.96×10⁻² 5.19×10⁻² 1.33×10⁻¹ $ ^{219}\text{At} $ 6.324 −0.021 0.012 5.77×101 1.04×10² 9.09×101 5.76×10⁻² 1.67×10⁻¹ $ ^{195}\text{Rn} $ 7.690 −0.217 0.017 6.00×10⁻³ 8.39×10⁻³ 9.65×10⁻³ 2.35×10⁻² 1.18×10⁻¹ $ ^{197}\text{Rn} $ 7.411 −0.217 0.017 5.50×10⁻² 6.70×10⁻² 7.83×10⁻² 1.85×10⁻² 9.94×10⁻² $ ^{199}\text{Rn} $ 7.140 −0.207 0.015 6.28×10⁻¹ 6.07×10⁻¹ 6.88×10⁻¹ 1.31×10⁻² 7.28×10⁻² $ ^{201}\text{Rn} $ 6.861 0.085 0.003 9.15×100 1.02×101 9.00×100 1.33×10⁻² 6.19×10⁻² $ ^{203}\text{Rn} $ 6.630 0.075 0.002 6.87×101 8.69×101 7.17×101 1.31×10⁻² 6.20×10⁻² $ ^{207}\text{Rn} $ 6.251 −0.063 0.001 2.66×10³ 4.17×10³ 2.82×10³ 1.12×10⁻² 5.56×10⁻² $ ^{209}\text{Rn} $ 6.155 −0.052 0.001 1.02×10⁴ 1.34×10⁴ 7.56×10³ 7.26×10⁻³ 3.64×10⁻² $ ^{215}\text{Rn} $ 8.839 −0.011 0.000 2.30×10⁻⁶ 2.08×10⁻⁶ 1.45×10⁻⁶ 3.26×10⁻² 7.26×10⁻² $ ^{217}\text{Rn} $ 7.887 0.000 0.000 5.90×10⁻⁴ 7.93×10⁻⁴ 5.89×10⁻⁴ 4.63×10⁻² 1.11×10⁻¹ $ ^{201}\text{Fr} $ 7.516 −0.207 0.015 6.90×10⁻² 8.09×10⁻² 8.80×10⁻² 1.50×10⁻² 8.24×10⁻² $ ^{203}\text{Fr} $ 7.260 0.096 0.003 5.78×10⁻¹ 9.32×10⁻¹ 8.25×10⁻¹ 1.80×10⁻² 8.73×10⁻² $ ^{205}\text{Fr} $ 7.055 0.086 −0.009 3.96×100 5.61×100 4.50×100 1.35×10⁻² 6.55×10⁻² $ ^{207}\text{Fr} $ 6.900 −0.083 0.014 1.56×101 2.36×101 1.70×101 1.20×10⁻² 5.92×10⁻² $ ^{209}\text{Fr} $ 6.778 −0.073 0.002 5.67×101 8.25×101 5.07×101 9.22×10⁻³ 4.54×10⁻² $ ^{211}\text{Fr} $ 6.663 −0.053 −0.011 2.14×10² 3.01×10² 1.48×10² 6.66×10⁻³ 3.28×10⁻² $ ^{213}\text{Fr} $ 6.905 0.011 0.000 3.49×101 5.12×101 1.67×101 4.59×10⁻³ 2.10×10⁻² $ ^{215}\text{Fr} $ 9.540 0.000 0.000 8.60×10⁻⁸ 1.01×10⁻⁷ 6.51×10⁻⁸ 4.34×10⁻² 8.82×10⁻² $ ^{217}\text{Fr} $ 8.469 −0.011 0.000 2.20×10⁻⁵ 4.07×10⁻⁵ 3.09×10⁻⁵ 6.52×10⁻² 1.59×10⁻¹ $ ^{219}\text{Fr} $ 7.449 0.011 0.000 2.02×10⁻² 4.51×10⁻² 3.84×10⁻² 7.50×10⁻² 2.08×10⁻¹ $ ^{201}\text{Ra} $ 8.002 −0.227 0.019 8.00×10⁻³ 5.09×10⁻³ 5.90×10⁻³ 8.64×10⁻³ 4.89×10⁻² $ ^{203}\text{Ra} $ 7.730 −0.217 0.017 3.10×10⁻² 3.85×10⁻² 4.24×10⁻² 1.49×10⁻² 8.61×10⁻² $ ^{205}\text{Ra} $ 7.486 −0.207 0.004 2.10×10⁻¹ 2.75×10⁻¹ 2.80×10⁻¹ 1.36×10⁻² 7.93×10⁻² $ ^{207}\text{Ra} $ 7.270 −0.115 0.017 1.40×100 2.32×100 1.88×100 1.46×10⁻² 7.55×10⁻² $ ^{209}\text{Ra} $ 7.143 −0.104 0.016 4.83×100 7.69×100 5.47×100 1.14×10⁻² 5.95×10⁻² $ ^{217}\text{Ra} $ 9.161 −0.010 0.012 1.60×10⁻⁶ 1.55×10⁻⁶ 1.11×10⁻⁶ 3.48×10⁻² 7.96×10⁻² $ ^{205}\text{Ac} $ 8.090 −0.217 0.006 2.00×10⁻² 7.44×10⁻³ 7.85×10⁻³ 4.16×10⁻³ 2.40×10⁻² $ ^{207}\text{Ac} $ 7.840 −0.207 −0.007 2.70×10⁻² 5.00×10⁻² 4.77×10⁻² 1.77×10⁻² 1.02×10⁻¹ $ ^{209}\text{Ac} $ 7.730 −0.125 0.018 8.70×10⁻² 1.65×10⁻¹ 1.28×10⁻¹ 1.51×10⁻² 7.98×10⁻² $ ^{211}\text{Ac} $ 7.620 −0.115 0.017 2.10×10⁻¹ 4.52×10⁻¹ 2.96×10⁻¹ 1.36×10⁻² 7.16×10⁻² $ ^{213}\text{Ac} $ 7.501 −0.084 0.002 7.38×10⁻¹ 1.56×100 7.83×10⁻¹ 9.97×10⁻³ 5.03×10⁻² $ ^{215}\text{Ac} $ 7.746 0.011 0.000 1.71×10⁻¹ 3.82×10⁻¹ 1.29×10⁻¹ 6.98×10⁻³ 3.31×10⁻² $ ^{217}\text{Ac} $ 9.832 0.000 0.000 6.90×10⁻⁸ 9.64×10⁻⁸ 6.59×10⁻⁸ 5.15×10⁻² 1.11×10⁻¹ $ ^{219}\text{Ac} $ 8.830 0.000 0.000 1.18×10⁻⁵ 2.20×10⁻⁵ 1.69×10⁻⁵ 6.57×10⁻² 1.62×10⁻¹ $ ^{227}\text{Ac} $ 5.042 0.132 0.083 1.04×10¹¹ 1.39×10¹⁰ 3.46×10¹⁰ 3.83×10⁻³ 3.29×10⁻² $ ^{213}\text{Th} $ 7.837 −0.104 0.004 1.44×10⁻¹ 2.49×10⁻¹ 1.49×10⁻¹ 9.56×10⁻³ 5.07×10⁻² $ ^{219}\text{Th} $ 9.510 −0.021 0.012 1.05×10⁻⁶ 1.01×10⁻⁶ 7.49×10⁻⁷ 3.48×10⁻² 8.19×10⁻² Table 1. Calculated α-decay half-lives (in seconds) and α-preformation factors of isotopic chains with
$ 78 \le Z \le 90 $ . The α-decay energies$ Q_\alpha $ , the quadrupole and hexadecapole deformation parameters$ \beta_2 $ and$ \beta_4 $ of the daughter nucleus, and the experimental partial α-decay half-lives$ T_{1/2}^{\text{exp}} $ of the favored transitions are listed in the second to fifth columns. The α-decay half-lives calculated with the DDFPs using the Migdal and CDM3Y6 interactions are presented in the sixth and seventh columns. The last two columns show the$ P_\alpha $ factors calculated with Eq. (14) from both interactions.Despite the differences in absolute magnitudes, the systematic trends of
$ P_\alpha $ obtained with all three α-nucleus potentials are highly consistent. Typically, a sharp increase is observed beyond$ N = 126 $ , reflecting pronounced neutron shell effects. Furthermore, for the isotopic chains on both sides of$ N = 126 $ , the$ P_\alpha $ values approximately follow a linear trend with neutron number. This linear trend is particularly prominent in the region where N is slightly less than 126. However, in the SLy4 results, noticeable fluctuations appear for specific nuclei, such as 197Rn ($ N=111 $ ) and 205Rn ($ N=117 $ ), within their respective isotopic chains. For$ N \gt 126 $ , the$ P_\alpha $ values from the CDM3Y6 interaction exhibit a more linear variation with N than those from the Migdal interaction. The latter tends to saturate more rapidly as N increases. These characteristics are consistent with the$ P_\alpha $ systematics observed in our previous studies of even-even nuclei [41, 48]. Overall, the successful reproduction of the known$ P_\alpha $ systematics for odd-A nuclei demonstrates the reliability of these theoretical approaches across different NN interactions.We then compare the accuracy of the DDFPs in calculating the α-decay half-lives using the two NN interactions. When performing half-life calculations,
$ P_\alpha $ must be appropriately assumed in the decay model as a theoretical input. Since the$ P_\alpha $ factor near shell closures varies approximately linearly with the valence nucleon number, we adopted the simple treatment described in Ref. [46]. The$ P_\alpha $ value is approximated by the following expression, which depends on the valence neutron number:$ P_{\alpha}^{{\rm{inp}}}=a\left(N-N_{0}\right)+b . $
(15) In the above expression,
$ N_0 $ is the nearest neutron magic number less than N. The parameters a and b are determined by fitting the expression to the empirical$ P_\alpha $ factors extracted using Eq. (14). For the α-nucleus potential under the CDM3Y6 interaction, we obtain$ a= (-1.73\pm0.302)\times10^{-3} $ ,$ b=(1.20\pm0.0844)\times10^{-1} $ , along with the covariance matrix,$M_{c}^{\text{CDM3Y6}}=10^{-7} \times\left[\begin{array}{*{20}{c}} {0.912} & {-22.2} \\ {-22.2} & {712} \end{array}\right]. $
For the α-nucleus potential under the Migdal interaction, we obtain
$ a=(-8.04\pm0.893)\times10^{-4} $ ,$ b=(3.85\pm 0.250)\times10^{-2} $ , along with the covariance matrix,$M_{c}^{\text{Migdal}}=10^{-8} \times\left[\begin{array}{*{20}{c}} {0.798} & {-19.4} \\{-19.4 }& {624 } \end{array}\right].$
Figure 2 illustrates the empirical
$ P_\alpha $ values described by Eq. (15). As shown, Eq. (15) approximately captures the overall trend of$ P_\alpha $ as a function of the valence neutron number. This simple treatment provides a useful basis for evaluating the accuracy of the α-nucleus potential in half-life calculations. However, to accurately describe$ P_\alpha $ for a specific nuclide, the empirical formula often requires additional terms that account for other structural effects, such as the dependence on the valence proton number [63−65], the angular momentum of the α particle [65, 66], and nuclear deformation [67, 68].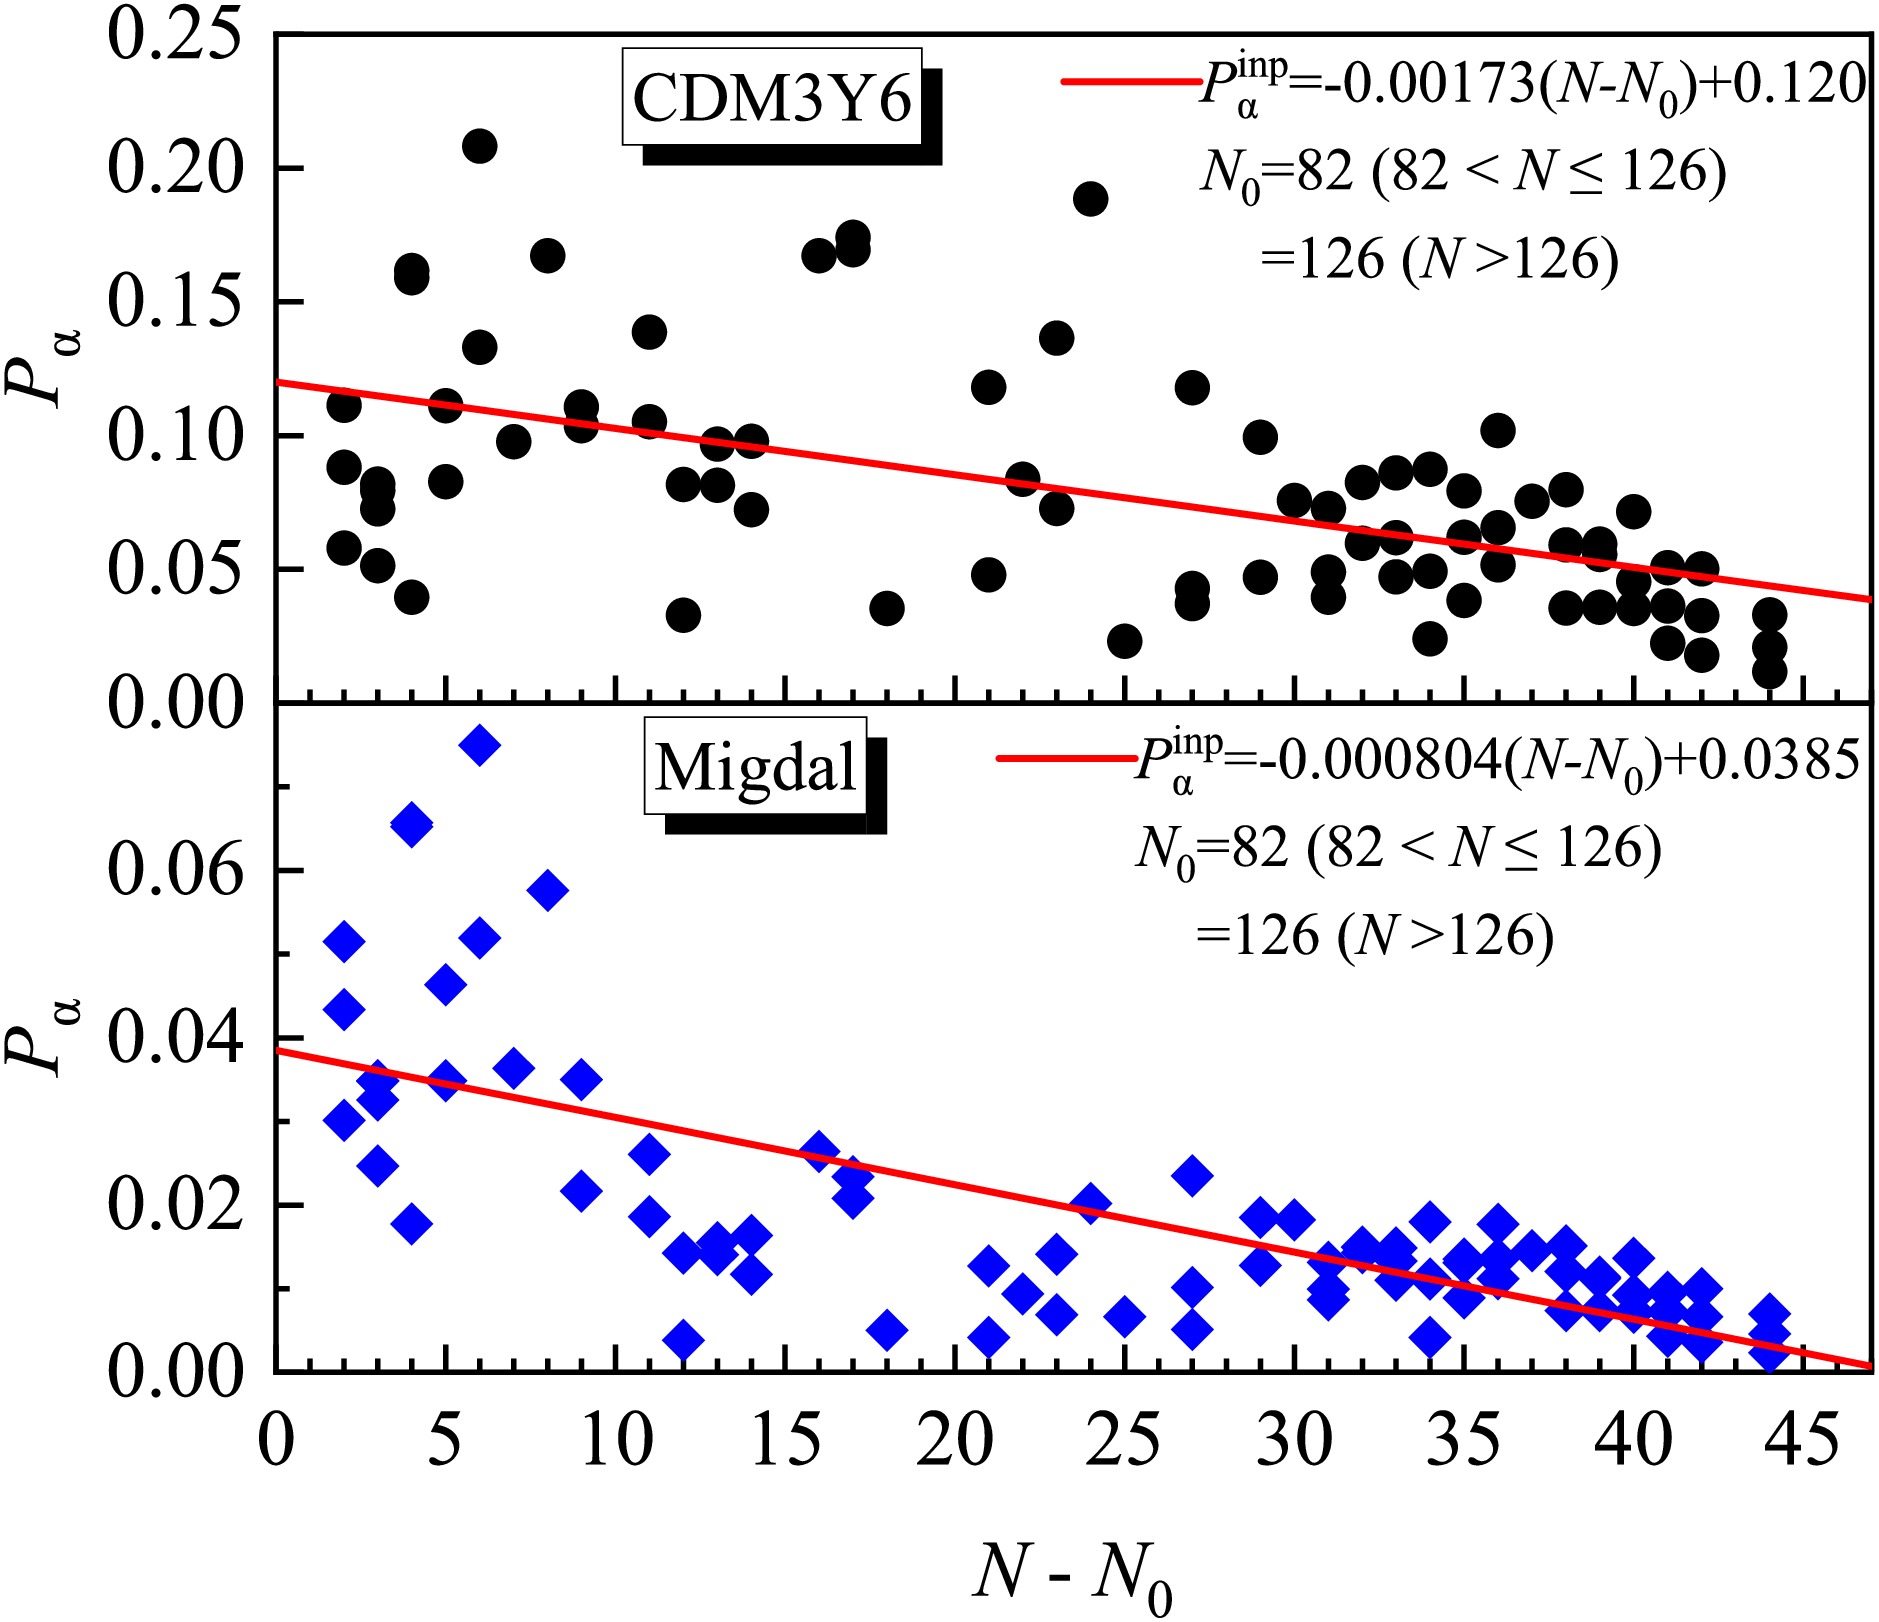
Figure 2. (color online) The distribution of
$ P_\alpha $ extracted using the DDFPs based on the CDM3Y6 and the Migdal interactions. The red line shows$ P_\alpha^{\text{inp}} $ from Eq. (15) fitted to the data.Using the results of Eq. (15) as input for the half-life calculations, we obtain the deviations between the theoretical and experimental α-decay half-lives for the CDM3Y6 and Migdal interactions, as shown in Fig. 3. On a logarithmic scale, the deviations are generally confined between –0.5 and 0.5, corresponding to a theoretical-to-experimental ratio predominately in the range 0.31 to 3.16. This indicates that the α-nucleus potentials derived from both interactions can reasonably reproduce the α-decay half-lives of these odd-A nuclei. To quantify the overall accuracy, we compute the root-mean-square (RMS) deviation factor
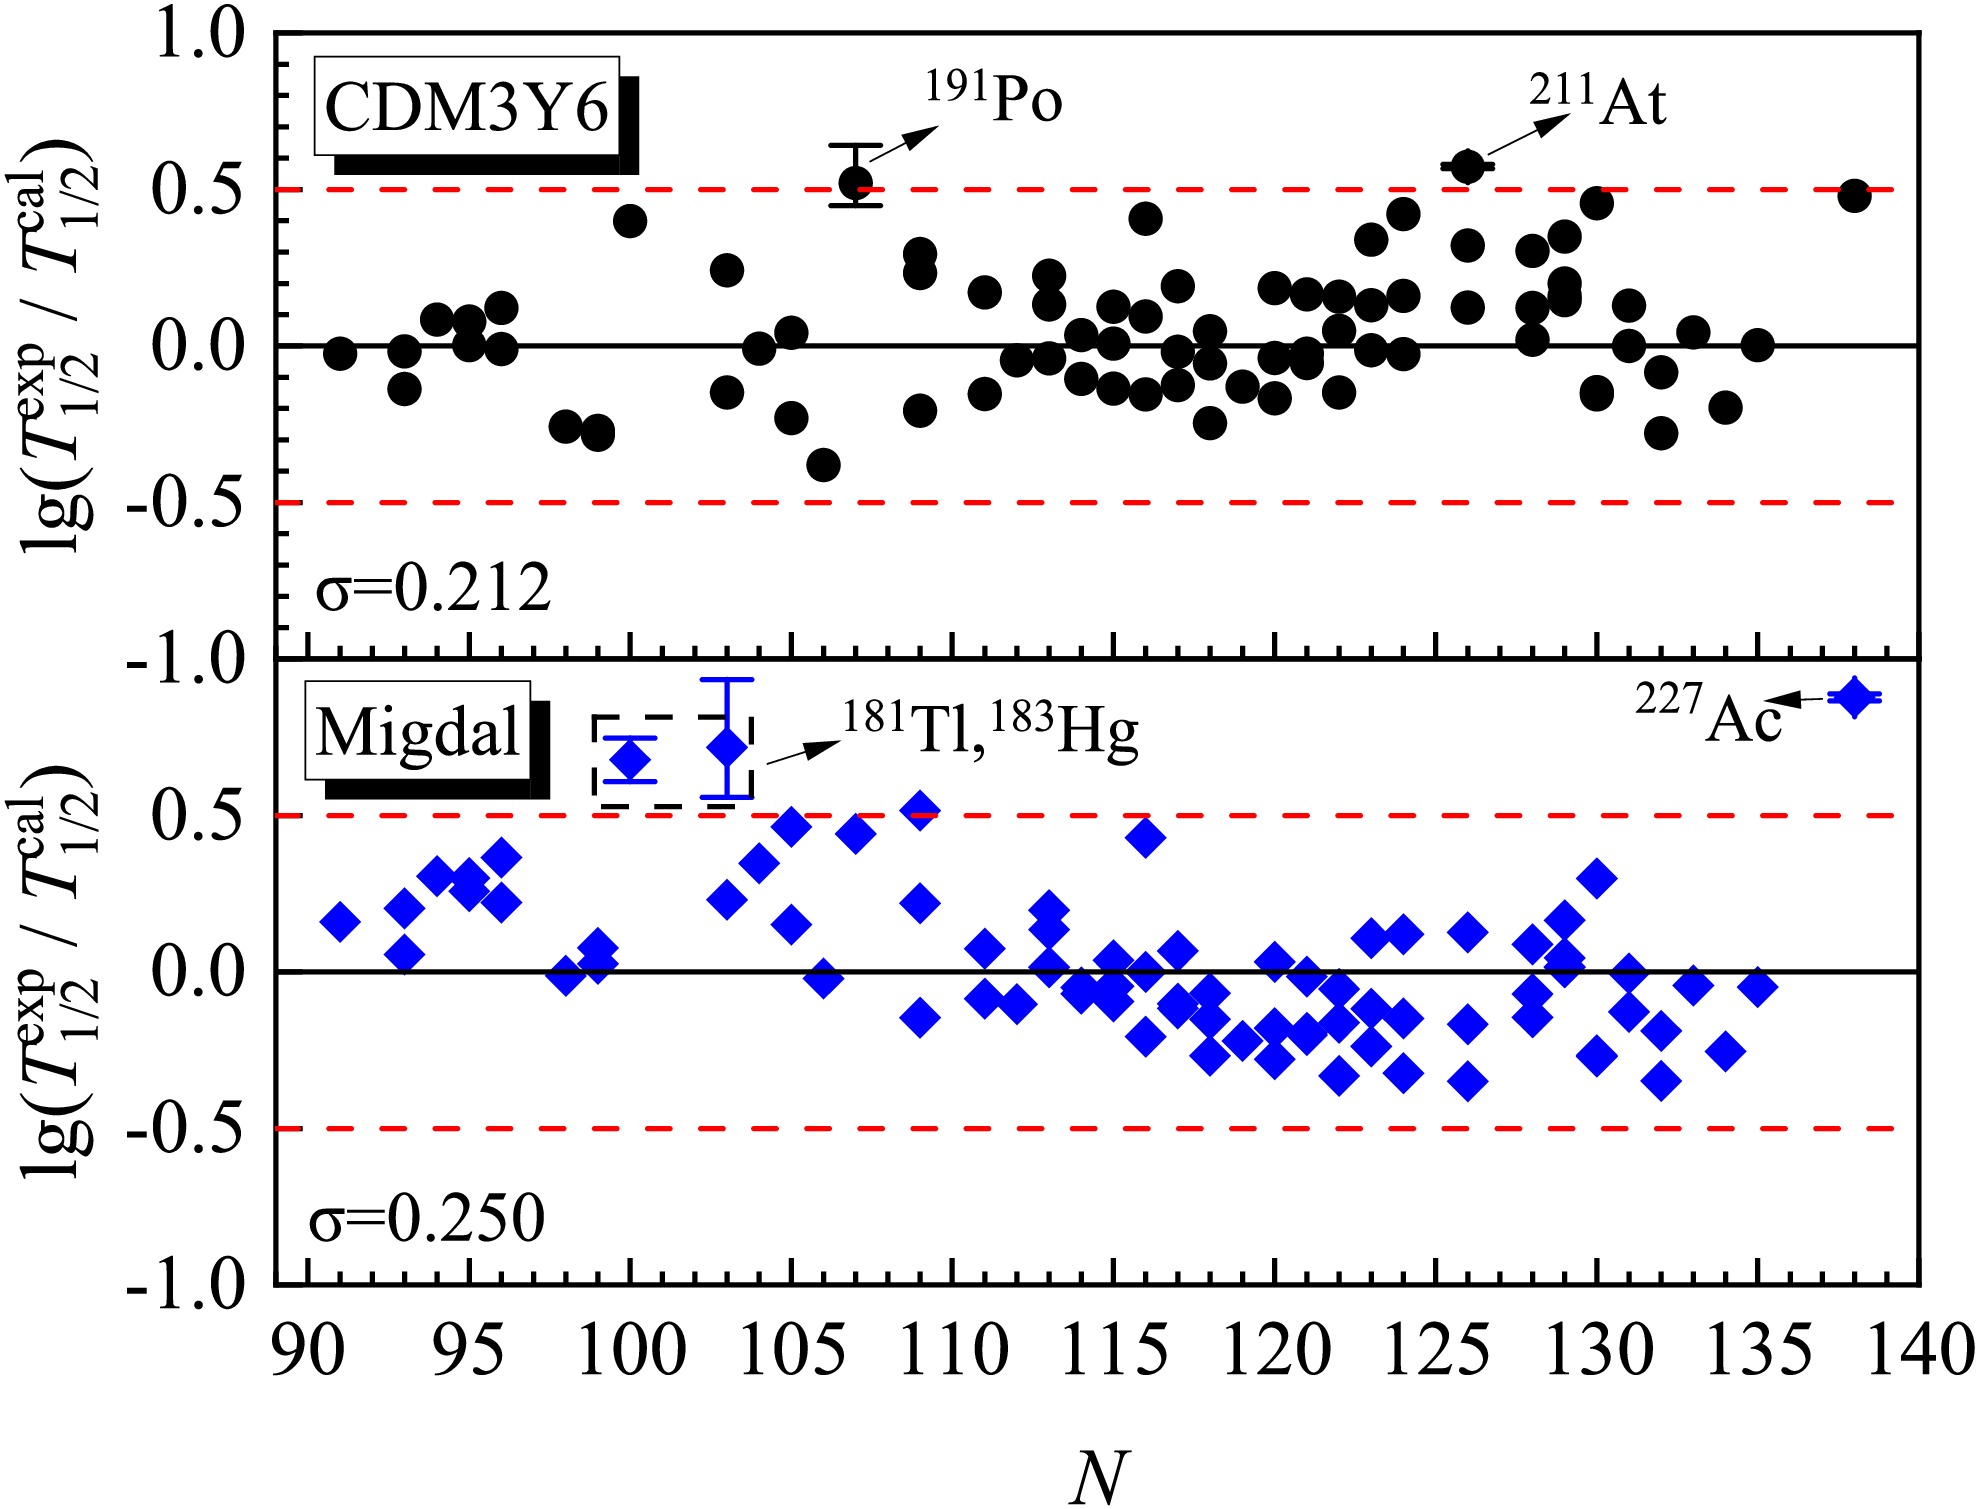
Figure 3. (color online) Deviations between experimental and theoretical α-decay half-lives calculated using the DDFPs based on the CDM3Y6 and the Migdal interactions. For most nuclei, the theoretical results agree with the experimental data within a factor of 0.31−3.16.
$ \sigma=\sqrt{\frac{1}{n} \sum\limits_{i=1}^{n}\left({\lg T_{{1 / 2}, i}^{\exp }}-{\lg T_{{1 / 2}, i}^{{\rm{cal}}}}\right)^{2}}, $
where n is the total number of nuclides considered.
The σ values for the CDM3Y6 and Migdal interactions are 0.212 and 0.250, respectively. This indicates that the two potentials achieve comparable accuracy in half-life calculations, with the CDM3Y6 potential showing only a slight advantage. Compared to the previous result
$ \sigma=0.1820 $ for favored decays of even-even nuclei [46], the σ value for odd-A nuclei obtained with the Migdal interaction is 37.4% larger. This increase is reasonable because the decay schemes of odd-A nuclei are more complex and their experimental measurements generally carry larger uncertainties than those of even-even nuclei. Moreover, the deviations for 181Tl, 183Hg, and 227Ac using the Migdal interaction significantly exceed 0.5, while only two nuclei (191Po and 211At) in the CDM3Y6 case slightly surpass this threshold. To account for the experimental uncertainties in α-decay energy, half-life, and branching ratio (Table 2), we include error bars for these specific nuclei in Fig. 3. Even after considering these uncertainties, the half-life deviations remain larger than 0.5 for all nuclei except 191Po. Since the sets of nuclei with large deviations differ between the two interactions, it suggests that these discrepancies mainly arise from the approximation of the empirical$ P_\alpha $ formula and from intrinsic model uncertainties.Nuclide $ Q_\alpha $ /keV$ T_{1/2} $ $ B_1 $ $ B_2 $ $ T_{1/2}^{\text{exp}} $ $ ^{191} \text{Po} $ $ 7501 ^ {+ 11} _ {-11} $ $ 22 ^ {+ 1} _ {- 1}\text{ ms} $ $ 0.99 ^ {+ 0.01} _ {- 0.1} $ $ 0.77 ^ {+ 0.025} _ {- 0.025} $ $ 28.86 ^ {+ 5.83} _ {- 2.45}\text{ ms} $ $ ^{211} \text{At} $ $ 5982.4 ^ {+ 1.3} _ {-1.3} $ $ 7.214 ^ {+ 0.007} _ {- 0.007}\text{ h} $ $ 0.4180 ^ {+ 0.0008} _ {- 0.0008} $ 1 $ 17.26 ^ {+ 0.05} _ {- 0.05}\text{ h} $ $ ^{181} \text{Tl} $ $ 6322 ^ {+ 6} _ {-6} $ $ 2.9 ^ {+ 0.1} _ {- 0.1}\text{ s} $ $ 0.086 ^ {+ 0.006} _ {- 0.006} $ 1 $ 33.72 ^ {+ 3.78} _ {- 3.29}\text{ s} $ $ ^{183} \text{Hg} $ $ 6039 ^ {+ 4} _ {-4} $ $ 9.4 ^ {+ 0.7} _ {- 0.7}\text{ s} $ $ 0.117 ^ {+ 0.02} _ {- 0.02} $ $ 0.91 ^ {+ 0.09} _ {- 0.17} $ $ 88.29 ^ {+ 52.42} _ {- 24.79}\text{ s} $ $ ^{227} \text{Ac} $ $ 5042.19 ^ {+ 0.14} _ {-0.14} $ $ 21.772 ^ {+ 0.003} _ {- 0.003}\text{ y} $ $ 0.01380 ^ {+ 0.00004} _ {- 0.00004} $ $ 0.477 ^ {+ 0.01} _ {- 0.01} $ $ 3307.51 ^ {+ 81.11} _ {- 77.73}\text{ y} $ Table 2. Uncertainties in the experimental α-decay energies
$ Q_\alpha $ , total half-lives$ T_{1/2} $ , branching ratio for α decay among the various decay modes$ B_1 $ , branching ratio for the ground-state to ground-state α transition$ B_2 $ , and derived experimental partial α-decay half-lives$ T_{1/2}^{\text{exp}} $ [69].After discussing the favored α-decay properties, we attempt to analyze the reliability of the DDFP in the unfavored α decays of odd-A nuclei. A typical example is the α decays of the
$ N=127 $ isotonic chain near$ Z=82 $ [70]. Xu et al. previously investigated their half-lives using the cluster model with a phenomenological cosh-type nuclear potential. They found that the ground-state to ground-state α decays of these nuclei all correspond to the same kind of unfavored transitions with an angular momentum transfer of$ L=5 $ . In these cases, the$ P_\alpha $ values show a clear linear increase with the valence proton number. Therefore, they adopted the following Z-dependent formula to describe the$ P_\alpha $ factor.$ P_{\alpha} \approx c \times(Z-82) , $
(16) where c is a constant. Instead of treating
$ P_\alpha $ as a nucleus-independent constant, the use of this expression yields better agreement between calculated and experimental α-decay half-lives. This improved agreement demonstrates that shell effects are significant not only in the$ P_\alpha $ systematics of favored transitions, but also in unfavored transitions.As a test, we first attempt to reproduce the above conclusion using the DDFP model. Fig. 4 shows the variation of
$ P_\alpha $ for unfavored decays of odd-A nuclei as a function of proton number. For the$ N=127 $ isotonic chains, the$ P_\alpha $ values from both NN interactions follow an approximately linear trend with the valence proton number, consistent with the conclusion of Ref. [70]. The most significant difference between the two potentials is that the$ P_\alpha $ values from the Migdal interaction are systematically smaller than the CDM3Y6 results by a factor of about 5. In addition to the$ N=127 $ isotonic chain, we discover that the$ N=125 $ isotonic chain also has similar decay properties. Specifically, experimental data show that the ground-state to ground-state α decays of the$ N=125 $ chain share the same unfavored character ($ L=2 $ ). In parallel, our calculations indicate that the$ P_\alpha $ factors along this$ N=125 $ chain also exhibit a linear increase with the valence proton number, as shown in Fig. 4.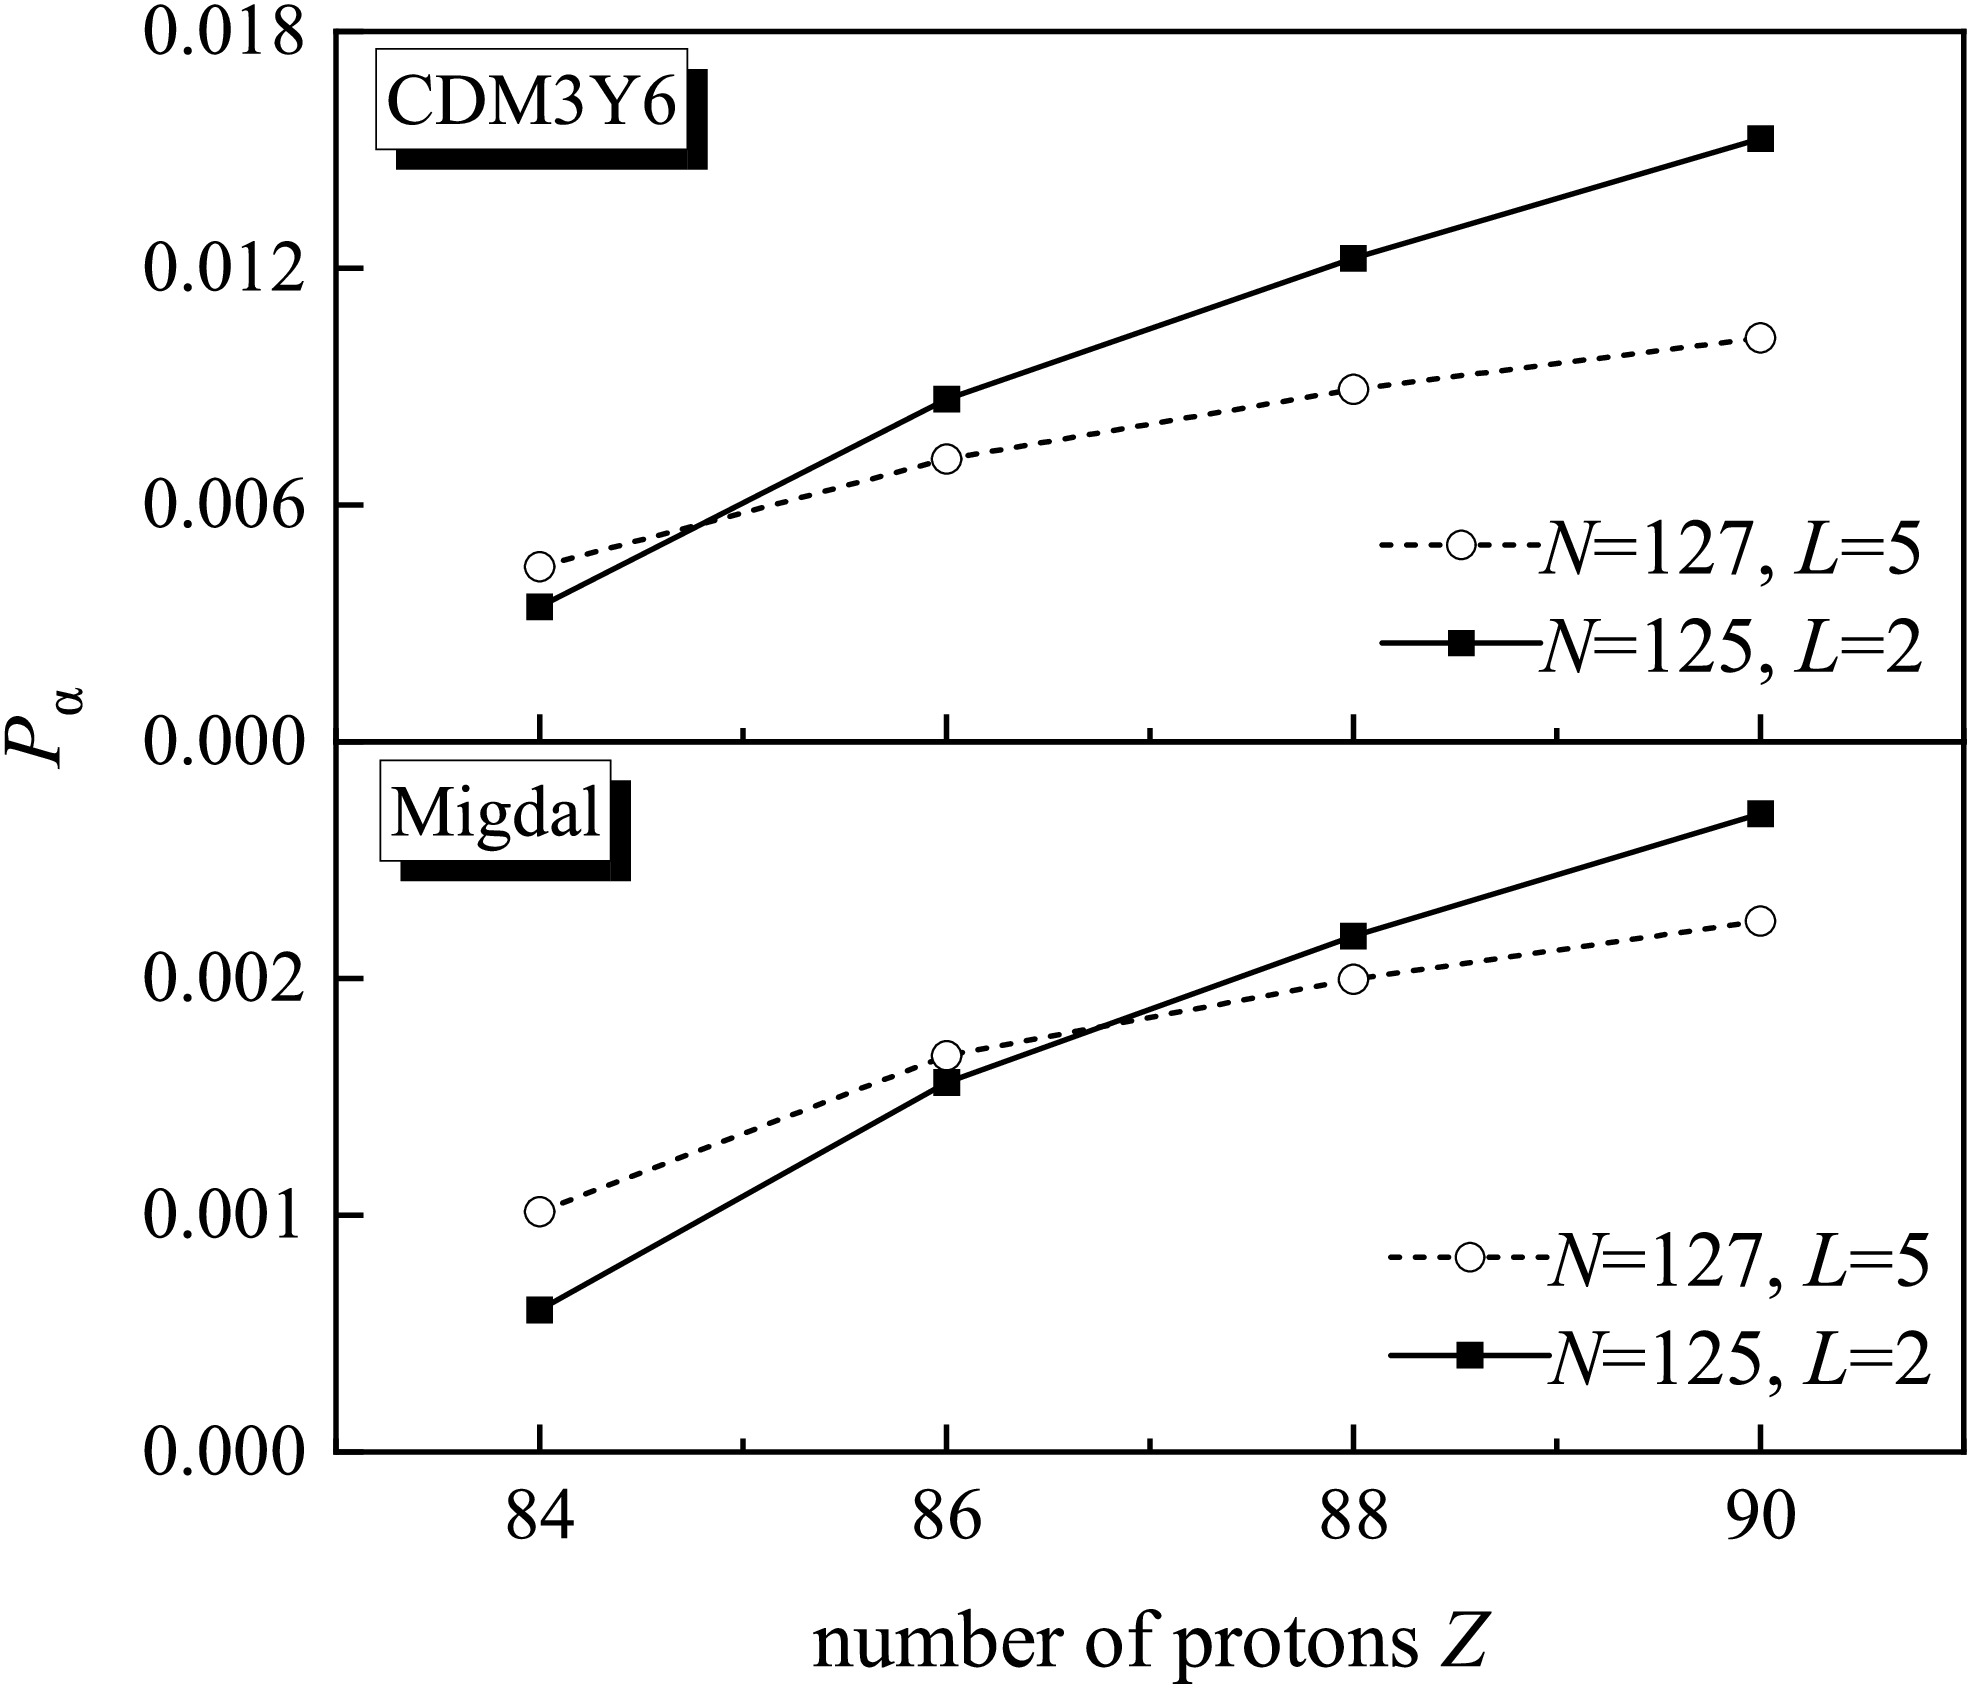
Figure 4.
$ P_\alpha $ in unfavored decays of the$ N=125 $ and$ N=127 $ isotonic chains. The upper and lower subfigures show results obtained with the CDM3Y6 and the Migdal interactions, respectively.Our previous study on the
$ P_\alpha $ systematics of even-even nuclei demonstrated that near the$ Z=82 $ and$ N=126 $ doubly magic shell closures, the$ P_\alpha $ variation in favored transitions is mainly dominated by changes in pairing interactions [33]. To understand the results of the unfavored decays shown in Fig. 4, we also investigated the correlation between$ P_\alpha $ and the proton pairing gap$ \Delta_{p} $ in this region.$ \Delta_{p} $ can be calculated using the empirical three-point formula [71],$\begin{aligned}[b] \Delta_{p}(Z, N)=\frac{(-1)^{Z}}{2}\times[B(Z, N)-2 B(Z-1, N)+B(Z-2, N)] \end{aligned} .$
(17) We extracted the
$ \Delta_p $ values from the experimental binding energies, and the results are listed in Table 3. Figs. 5 and 6 display$ P_\alpha $ as a function of$ \Delta_p $ for unfavored and favored decays along the$ N=125,127 $ and$ N=124,126,128 $ isotonic chains, respectively. It can be seen that$ P_\alpha $ increases approximately linearly with$ \Delta_p $ along all these isotonic chains, indicating a strong positive correlation between these two quantities.$ \Delta_p $ reflects the strength of the proton pairing correlation within nuclei, which, together with neutron pairing and proton–neutron (PN) correlations, contributes to the formation of α clusters. When the spatial overlap between proton and neutron orbitals is small, such as in the vicinity of the$ Z=82 $ ,$ N=126 $ shell closures, the variation of PN correlations is suppressed. Consequently, the change in the pairing interaction strength dominates the variation of$ P_\alpha $ . The findings in Figs. 5 and 6 confirm that this interpretation holds for both favored and unfavored decays, thereby explaining the behavior observed in Fig. 4. Thus, Fig. 4 demonstrates the interplay between shell effects from the mean field and the proton pairing correlation. The$ P_\alpha $ factor attains a local minimum at the shell closure as a manifestation of shell effects; meanwhile, it increases almost linearly above the closure as the number of valence proton pairs increases. This indicates that the$ P_\alpha $ empirical formula, which depends on the valence nucleon number, provides a relatively good approximation for half-life calculations near shell closures. The DDFP models with the CDM3Y6 and Migdal interactions both reasonably reproduce this structural pattern of$ P_\alpha $ near$ Z=82 $ .Nuclide $ Q_\alpha $ /MeV$ \beta_2 $ $ \beta_4 $ $ T_{1/2}^{\text{exp}} $ L $ P_\alpha $ (Migdal)$ P_\alpha $ (CDM3Y6)$ \Delta_p $ /MeV211Po 7.595 0.000 0.000 5.22×10⁻¹ 5 1.02×10⁻³ 4.43×10⁻³ 0.232 213Rn 8.244 0.000 0.000 1.99×10⁻² 5 1.67×10⁻³ 7.17×10⁻³ 0.436 215Ra 8.864 0.000 0.000 1.73×10⁻³ 5 2.00×10⁻³ 8.93×10⁻³ 0.623 217Th 9.435 0.000 0.000 2.66×10⁻⁴ 5 2.24×10⁻³ 1.02×10⁻² 0.780 209Po 4.979 −0.010 −0.012 2.71×10¹⁰ 2 6.01×10⁻⁴ 3.42×10⁻³ 0.539 211Rn 5.965 0.021 0.000 5.64×10⁵ 2 1.56×10⁻³ 8.67×10⁻³ 0.589 213Ra 6.861 −0.063 −0.010 4.50×101 2 2.18×10⁻³ 1.23×10⁻² 0.688 215Th 7.665 −0.073 −0.010 3.03×100 2 2.70×10⁻³ 1.53×10⁻² 0.799 Table 3. The α-preformation factors and proton pairing gaps for the
$ N=125,127 $ isotonic chains in unfavored α decays are presented. Columns 2–6 list the experimental α-decay energy$ Q_\alpha $ , the quadrupole deformation parameter$ \beta_2 $ of the daughter nucleus, the hexadecapole deformation parameter$ \beta_4 $ , the experimental partial α-decay half-life$ {T}_{1/2}^{\text{exp}} $ (in seconds), and the angular momentum L of the α cluster, respectively. Columns 7 and 8 present the$ P_\alpha $ factors extracted from the DDFPs using the Migdal and CDM3Y6 interactions, respectively. Column 9 lists the proton pairing gap$ \Delta_p $ calculated from Eq. (17).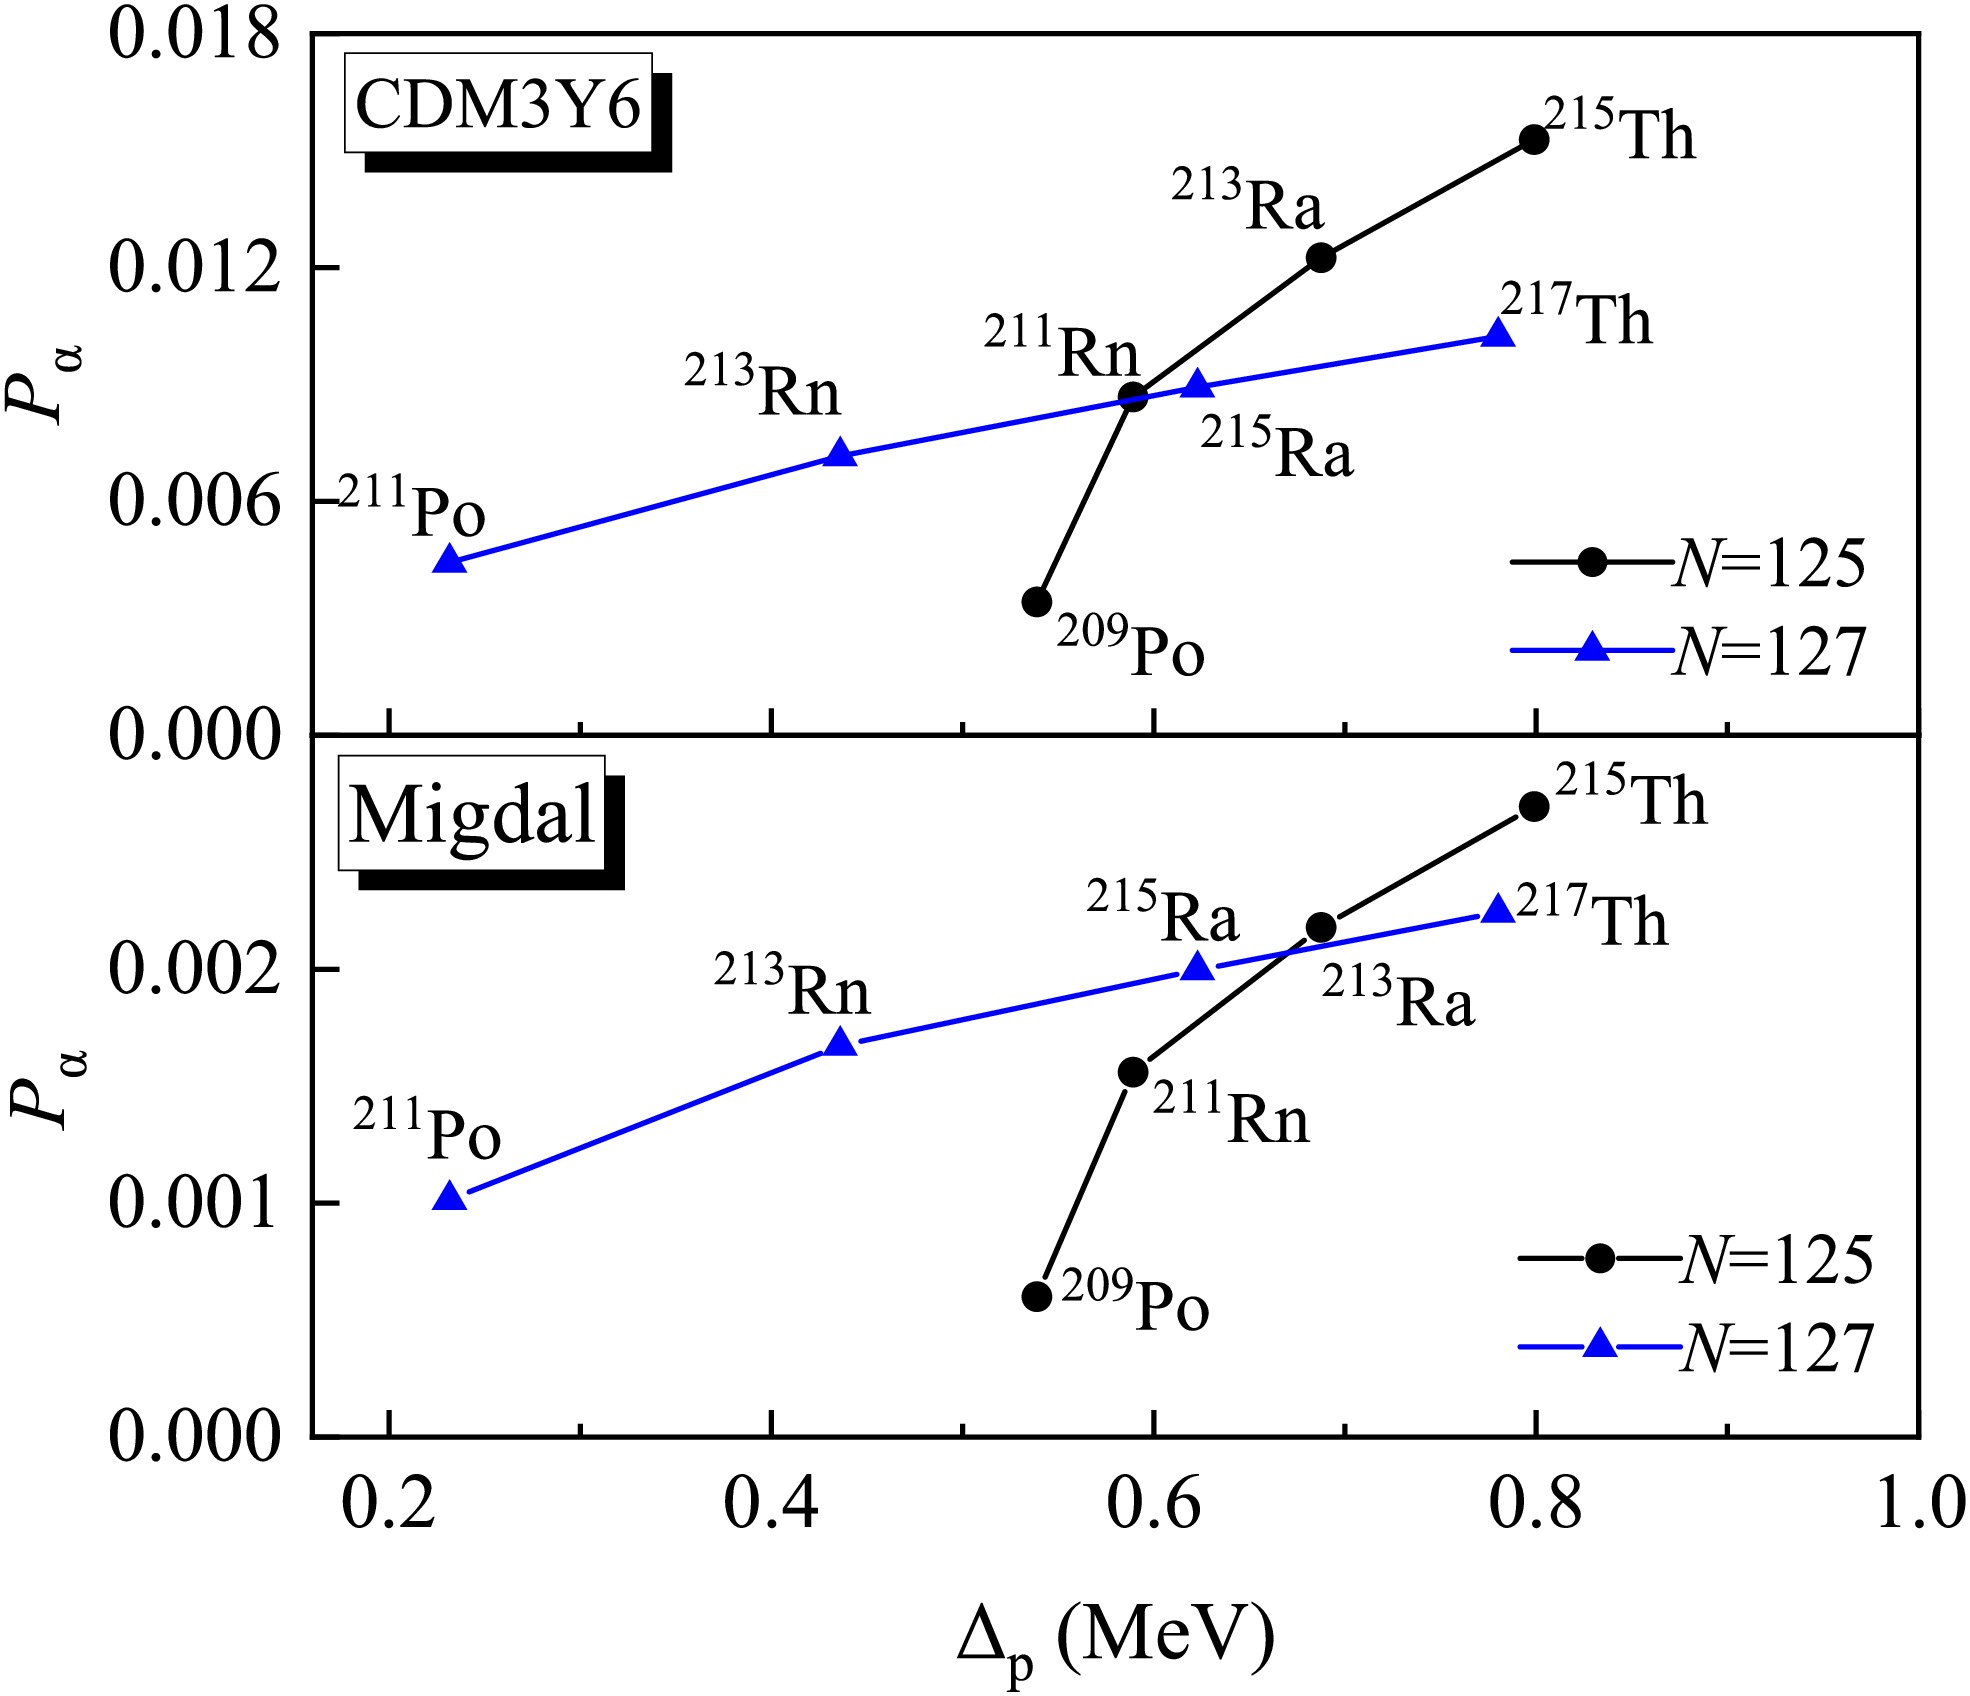
Figure 5. (color online)
$ P_\alpha $ in unfavored decays of the$ N= $ $ 125,127 $ isotonic chains, as a function of the proton pairing gap$ \Delta_p $ . The upper and lower subfigures show results obtained with the CDM3Y6 and the Migdal interactions, respectively.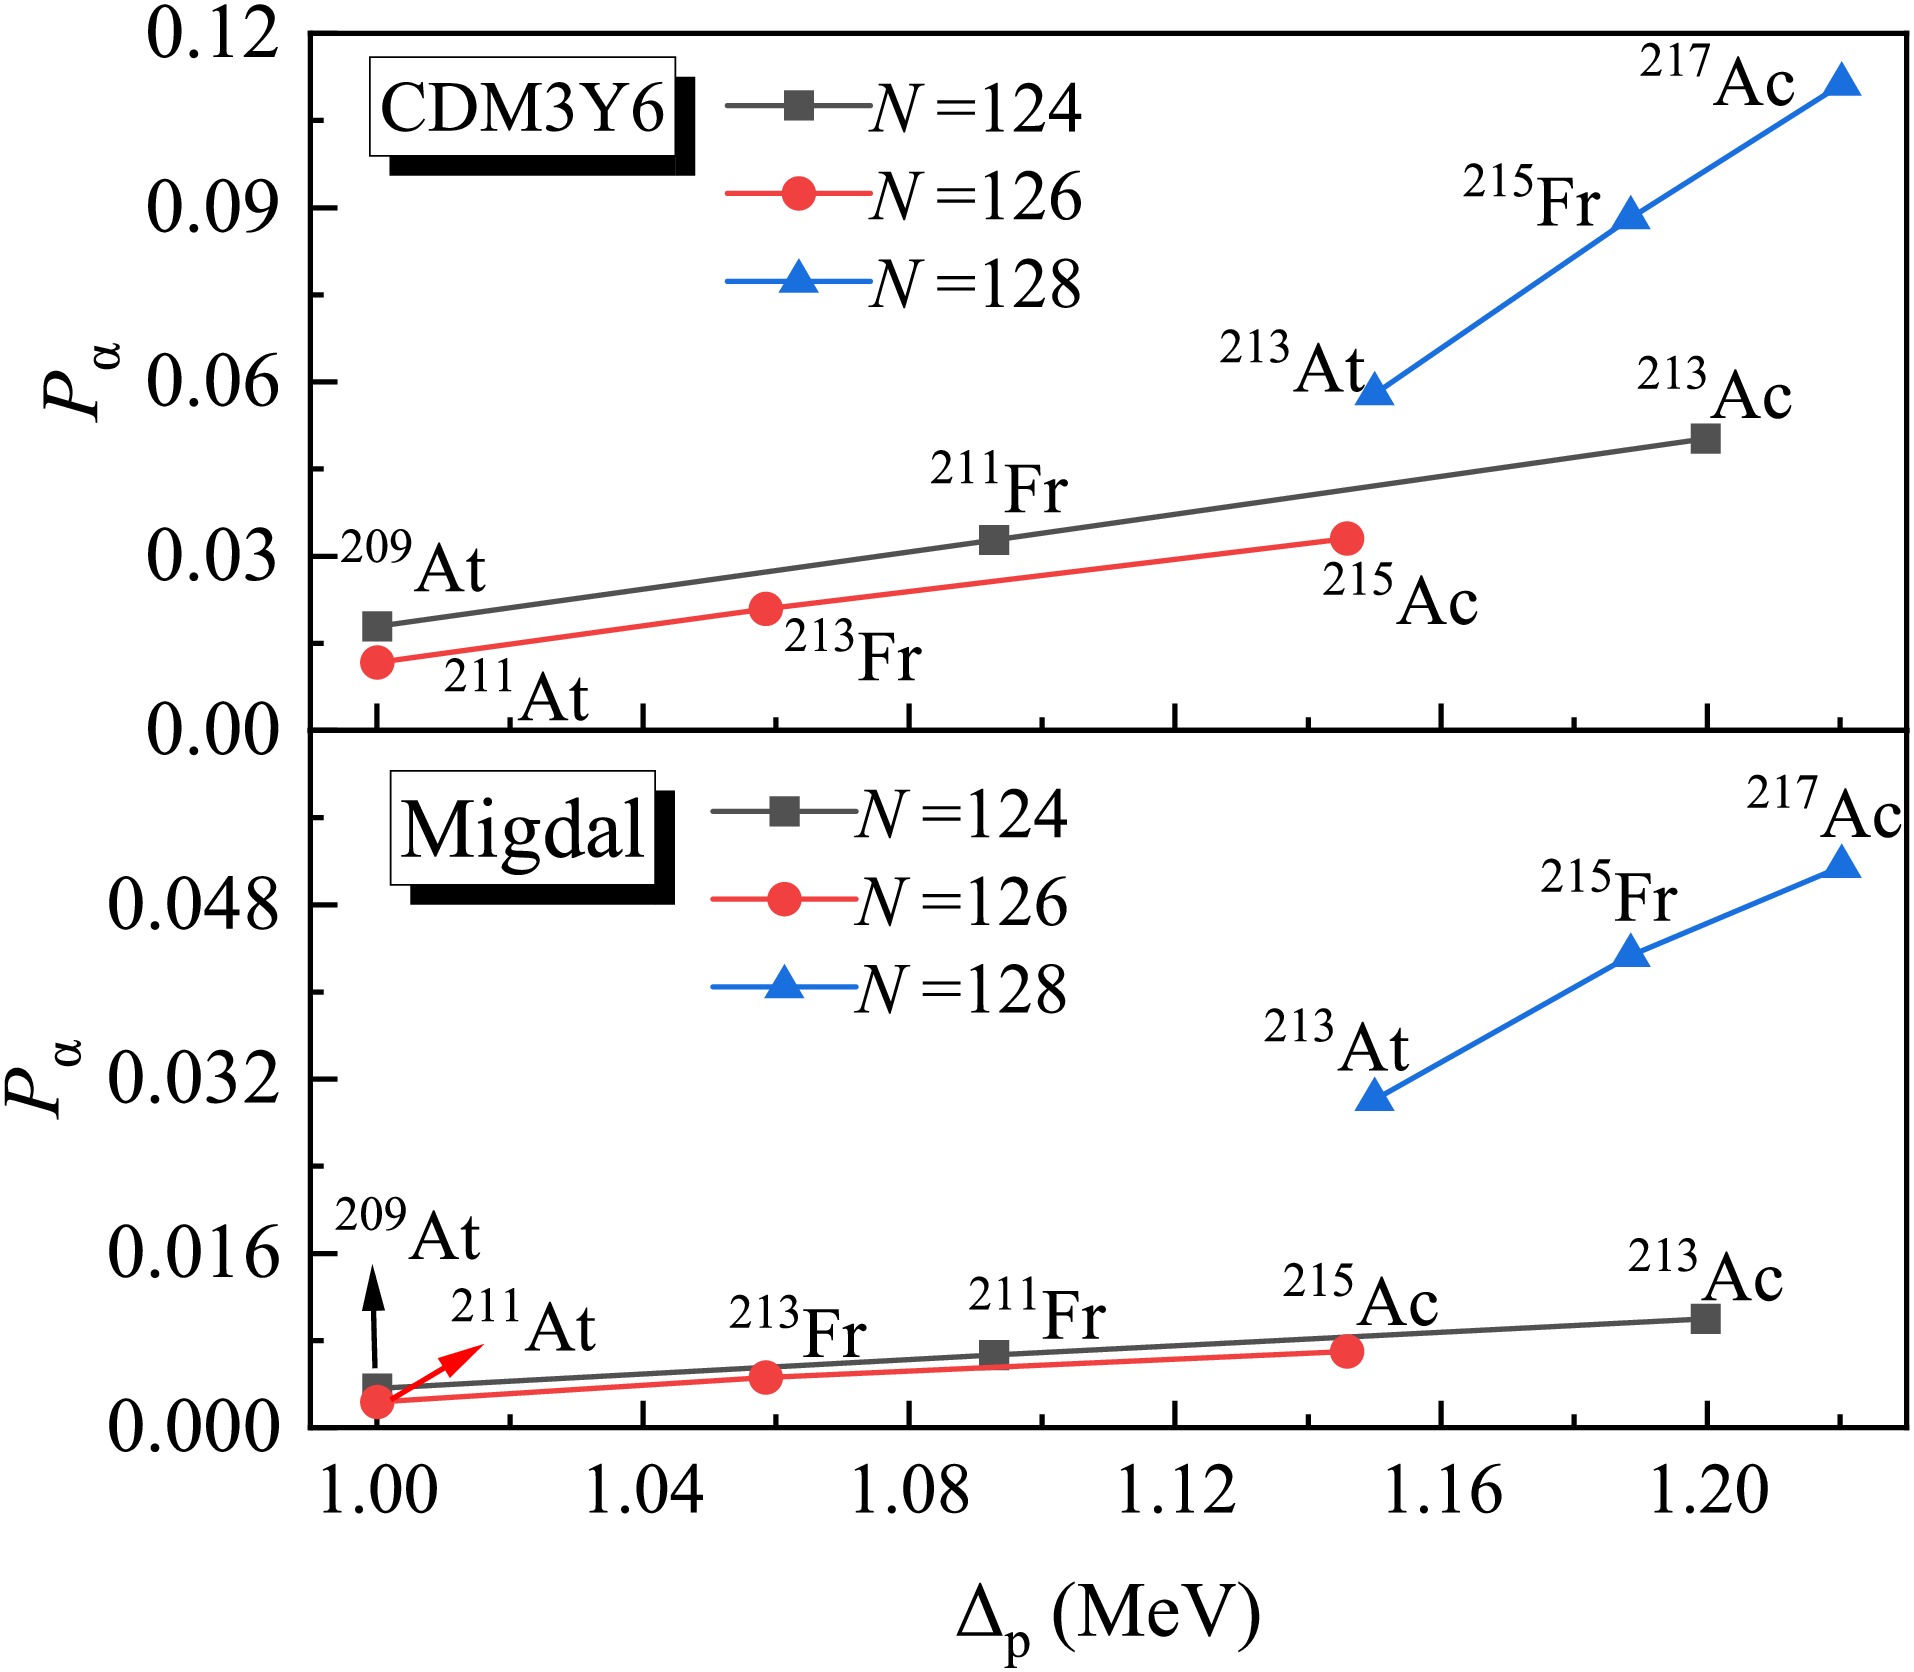
Figure 6. (color online)
$ P_\alpha $ in favored decays of the$ N=124, $ $ 126,128 $ isotonic chains, as a function of the proton pairing gap$ \Delta_p $ . The upper and lower subfigures show results obtained with the CDM3Y6 and the Migdal interactions, respectively.In order to understand the systematic difference in the magnitude of
$ P_\alpha $ derived from the CDM3Y6 and Migdal interactions, we take the 207Po ($ L=0 $ ) and 211Po ($ L=5 $ ) systems as examples and compare their α-nucleus potentials as well as the corresponding α-cluster bound state wavefunctions$ \varphi_0 $ from the two types of NN interactions. As shown in Fig. 7, one can observe that outside the Coulomb barrier, the curves of the two α-nucleus potentials almost overlap. The discrepancies in the α-nucleus potentials mainly appear near the location of the second classical turning point$ R_{2} $ and inside the core region. The position of$ R_{2} $ has a more pronounced effect on the calculation of empirical$ P_\alpha $ . It can be seen from Fig. 7 that, for the same decay system, the α-nucleus potentials obtained with the CDM3Y6 interaction have a smaller$ R_{2} $ than those obtained with the Migdal interaction. Since the barrier heights are nearly equal, the systematic difference in$ R_2 $ leads to a higher tunneling probability for the α cluster in the Migdal case, consequently resulting in a smaller$ P_\alpha $ according to Eq. (14). This feature is observed in both favored and unfavored α decays, reflecting the systematic influence of different NN interactions. As a result of the potential geometry, the α-cluster wavefunction from the CDM3Y6 interaction exhibits a distinct oscillation. It displays multiple peaks and nodes, with the largest peak located near the nuclear surface. In contrast, the wavefunction derived from the Migdal interaction exhibits nearly zero amplitude inside the nucleus, and only a single peak appears at the nuclear surface.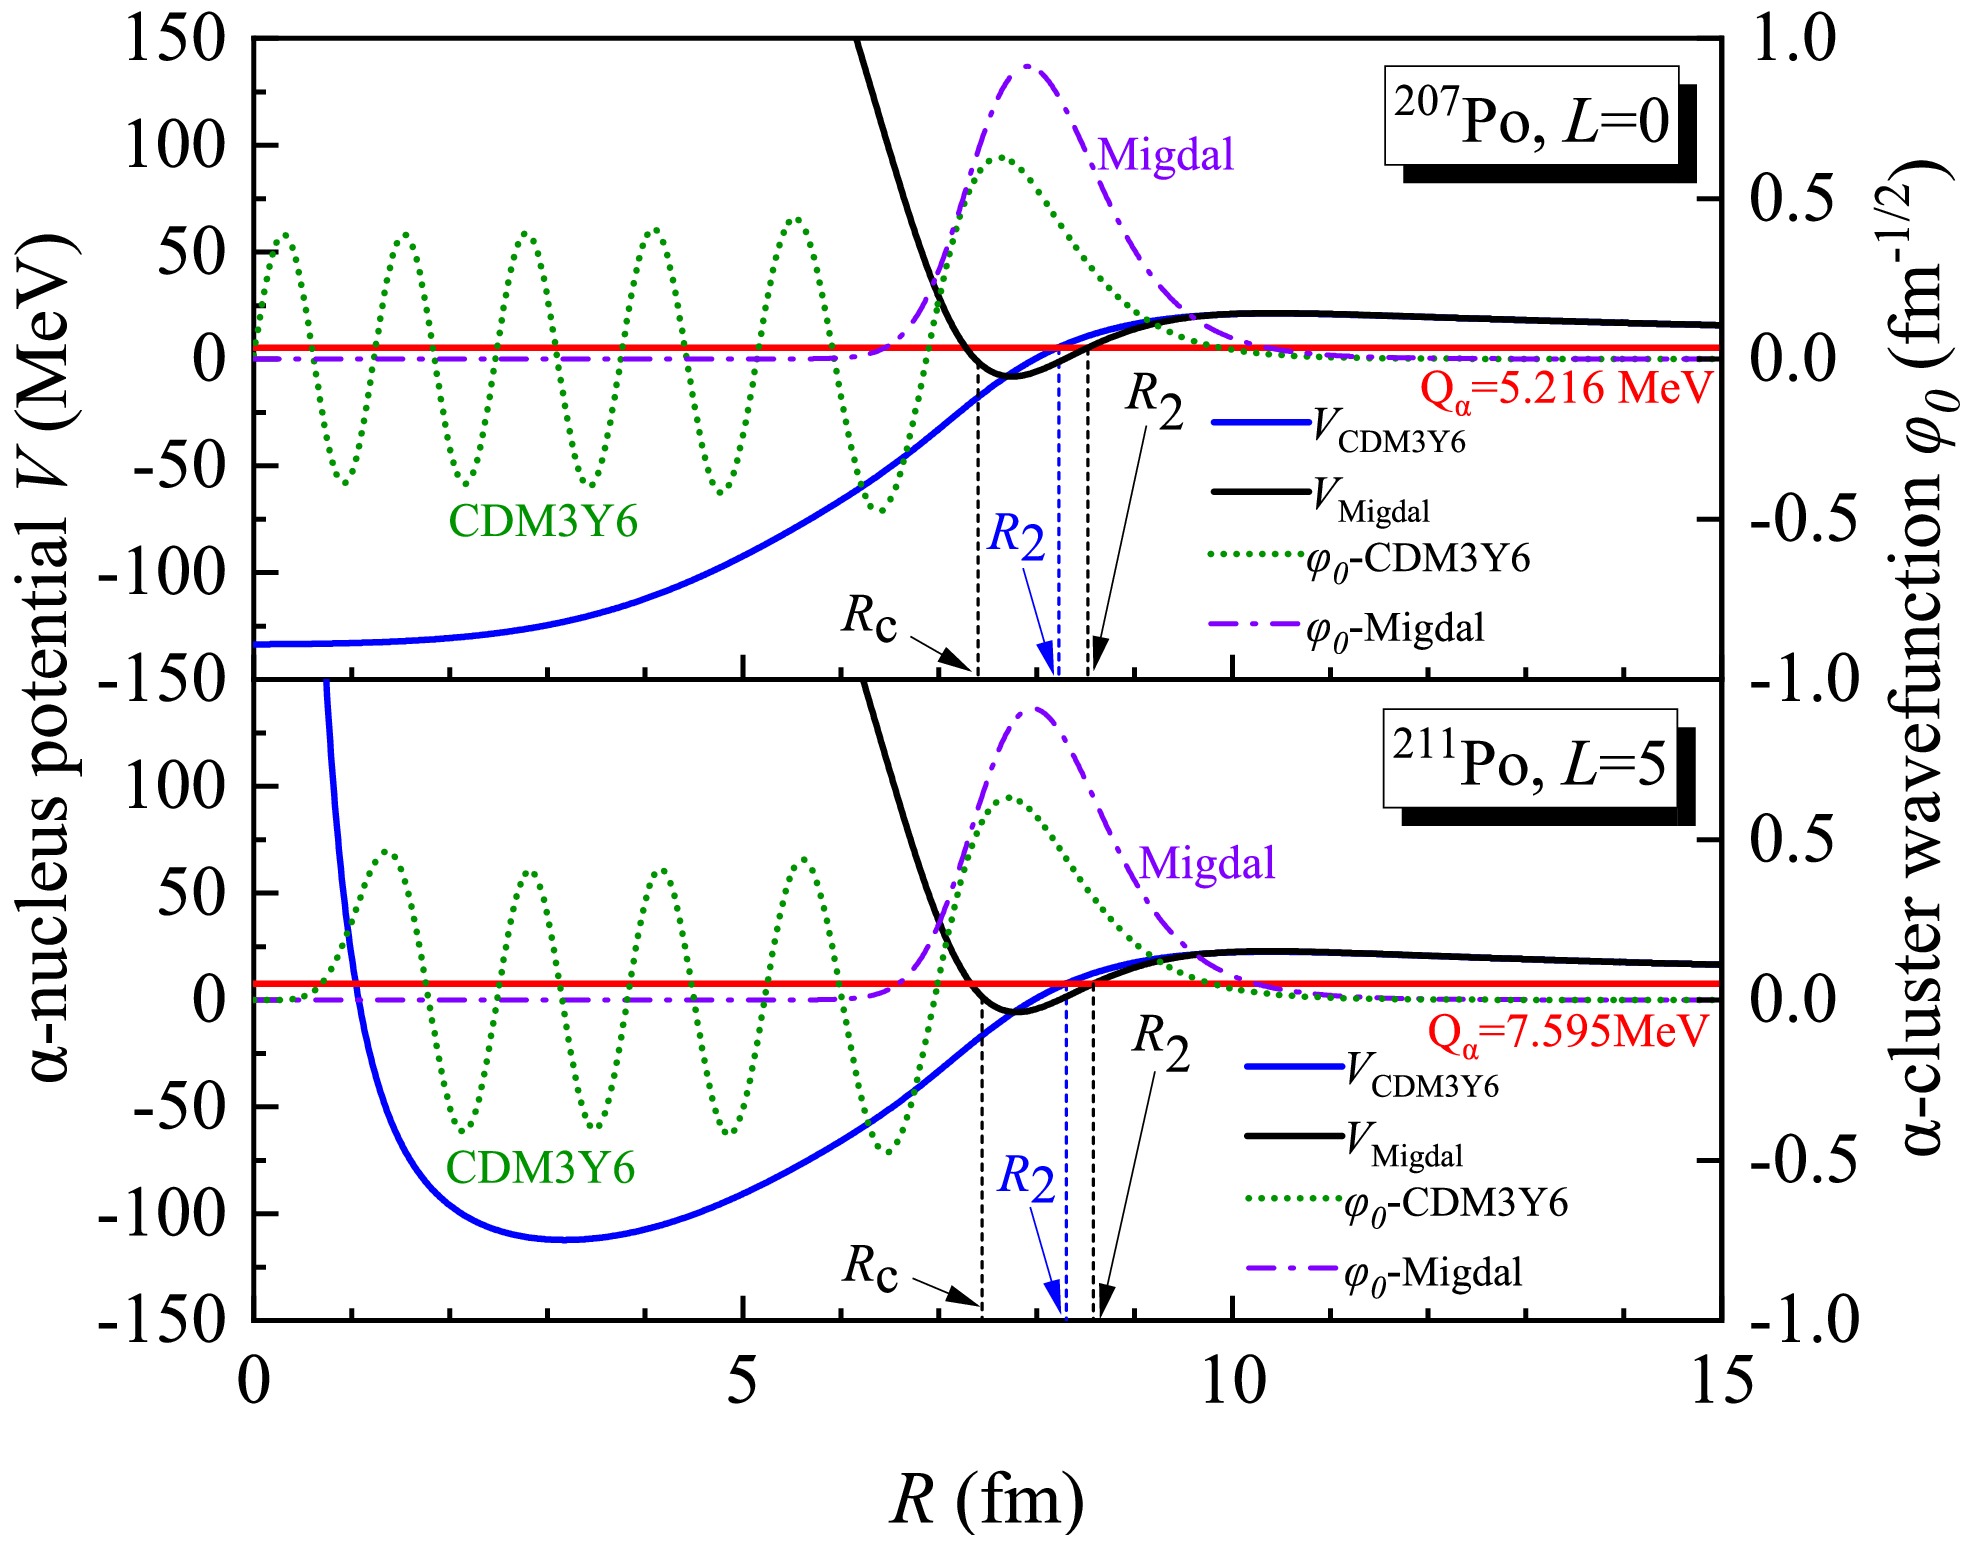
Figure 7. (color online) α-nucleus potentials and α-cluster wavefunctions for the 207Po (
$ L=0 $ ) and 211Po ($ L=5 $ ) systems. The DDFPs with the CDM3Y6 and the Migdal interactions have similar barrier heights, whereas their geometries differ markedly. The Migdal interaction yields a larger second classical turning point$ R_2 $ , which accounts for the significant difference in the$ P_\alpha $ values between the two potentials.The different behaviors of
$ \varphi_0 $ are attributed to the different treatments of Pauli blocking in the two potentials. For the DDFP with the CDM3Y6 interaction, the Pauli blocking effect is mainly introduced by applying the Wildermuth condition [72]. This condition imposes a constraint on the total harmonic oscillator quanta carried by the nucleons constituting the α cluster and the daughter nucleus, such that nucleons from the α cluster can only occupy the orbitals above those filled by the core nucleons. Consequently, the wavefunction has multiple nodes inside the nucleus, and the largest peak at the surface indicates that the nucleons near the Fermi surface play a dominant role in the formation of the α cluster. For the DDFP with the Migdal interaction, because the Pauli blocking effect manifests as a significant repulsive potential barrier within the nucleus, the determination of the α-nucleus potential does not rely on the Wildermuth condition. As shown in Fig. 7, due to the medium effect, this repulsive potential begins to rise sharply from the critical radius$ R_{c} $ towards the interior of the nucleus. It therefore prevents the formation of α clusters in regions above the critical density. Specifically, the α-cluster wavefunction exhibits a nearly vanishing amplitude in the inner region of the nucleus.In order to further understand the differences between the two DDFPs, we also investigate how the input density distribution of the daughter nucleus influences the potential geometry and the resulting
$ P_\alpha $ factor. Taking 207Po as an example, instead of adopting the same half-density radius$ R_d $ = 6.61 fm and diffuseness a = 0.54 fm for both the proton and neutron density distributions of the daughter nucleus, we now distinguish these two parameters ($ R_{d, \tau=p, n} $ and$ a_{\tau=p, n} $ ) for proton and neutron distributions, respectively. These parameters can be calculated using empirical formulas fitted to the density profiles from self-consistent Skyrme Hartree-Fock calculations [73], which yield$ R_{d, p} $ = 6.67 fm,$ R_{d, n} $ = 6.77 fm,$ a_p $ = 0.50 fm, and$ a_n $ = 0.55 fm.Figure 8 presents a comparison of the DDFPs generated using the refined and the original density profiles. It can be seen that the refined density profiles result in only minor differences in the α-nucleus potentials and the corresponding α-cluster wavefunctions for both the CDM3Y6 and Migdal interactions. While the Coulomb barrier heights remain almost unchanged, the second turning point
$ R_2 $ increases by 0.04 fm for the DDFP-CDM3Y6 and by 0.05 fm for the DDFP-Migdal, which results in reductions of only 13% and 16% in the extracted$ P_\alpha $ factors, respectively. These results demonstrate that the sensitivity to the input density distribution parameters is comparable for both DDFPs. As a further validation, the results shown in Fig. 8 justify the traditional treatment of$ R_d $ and a, implying that the original parameters serve as a robust approximation for the density distributions of the involved nuclei.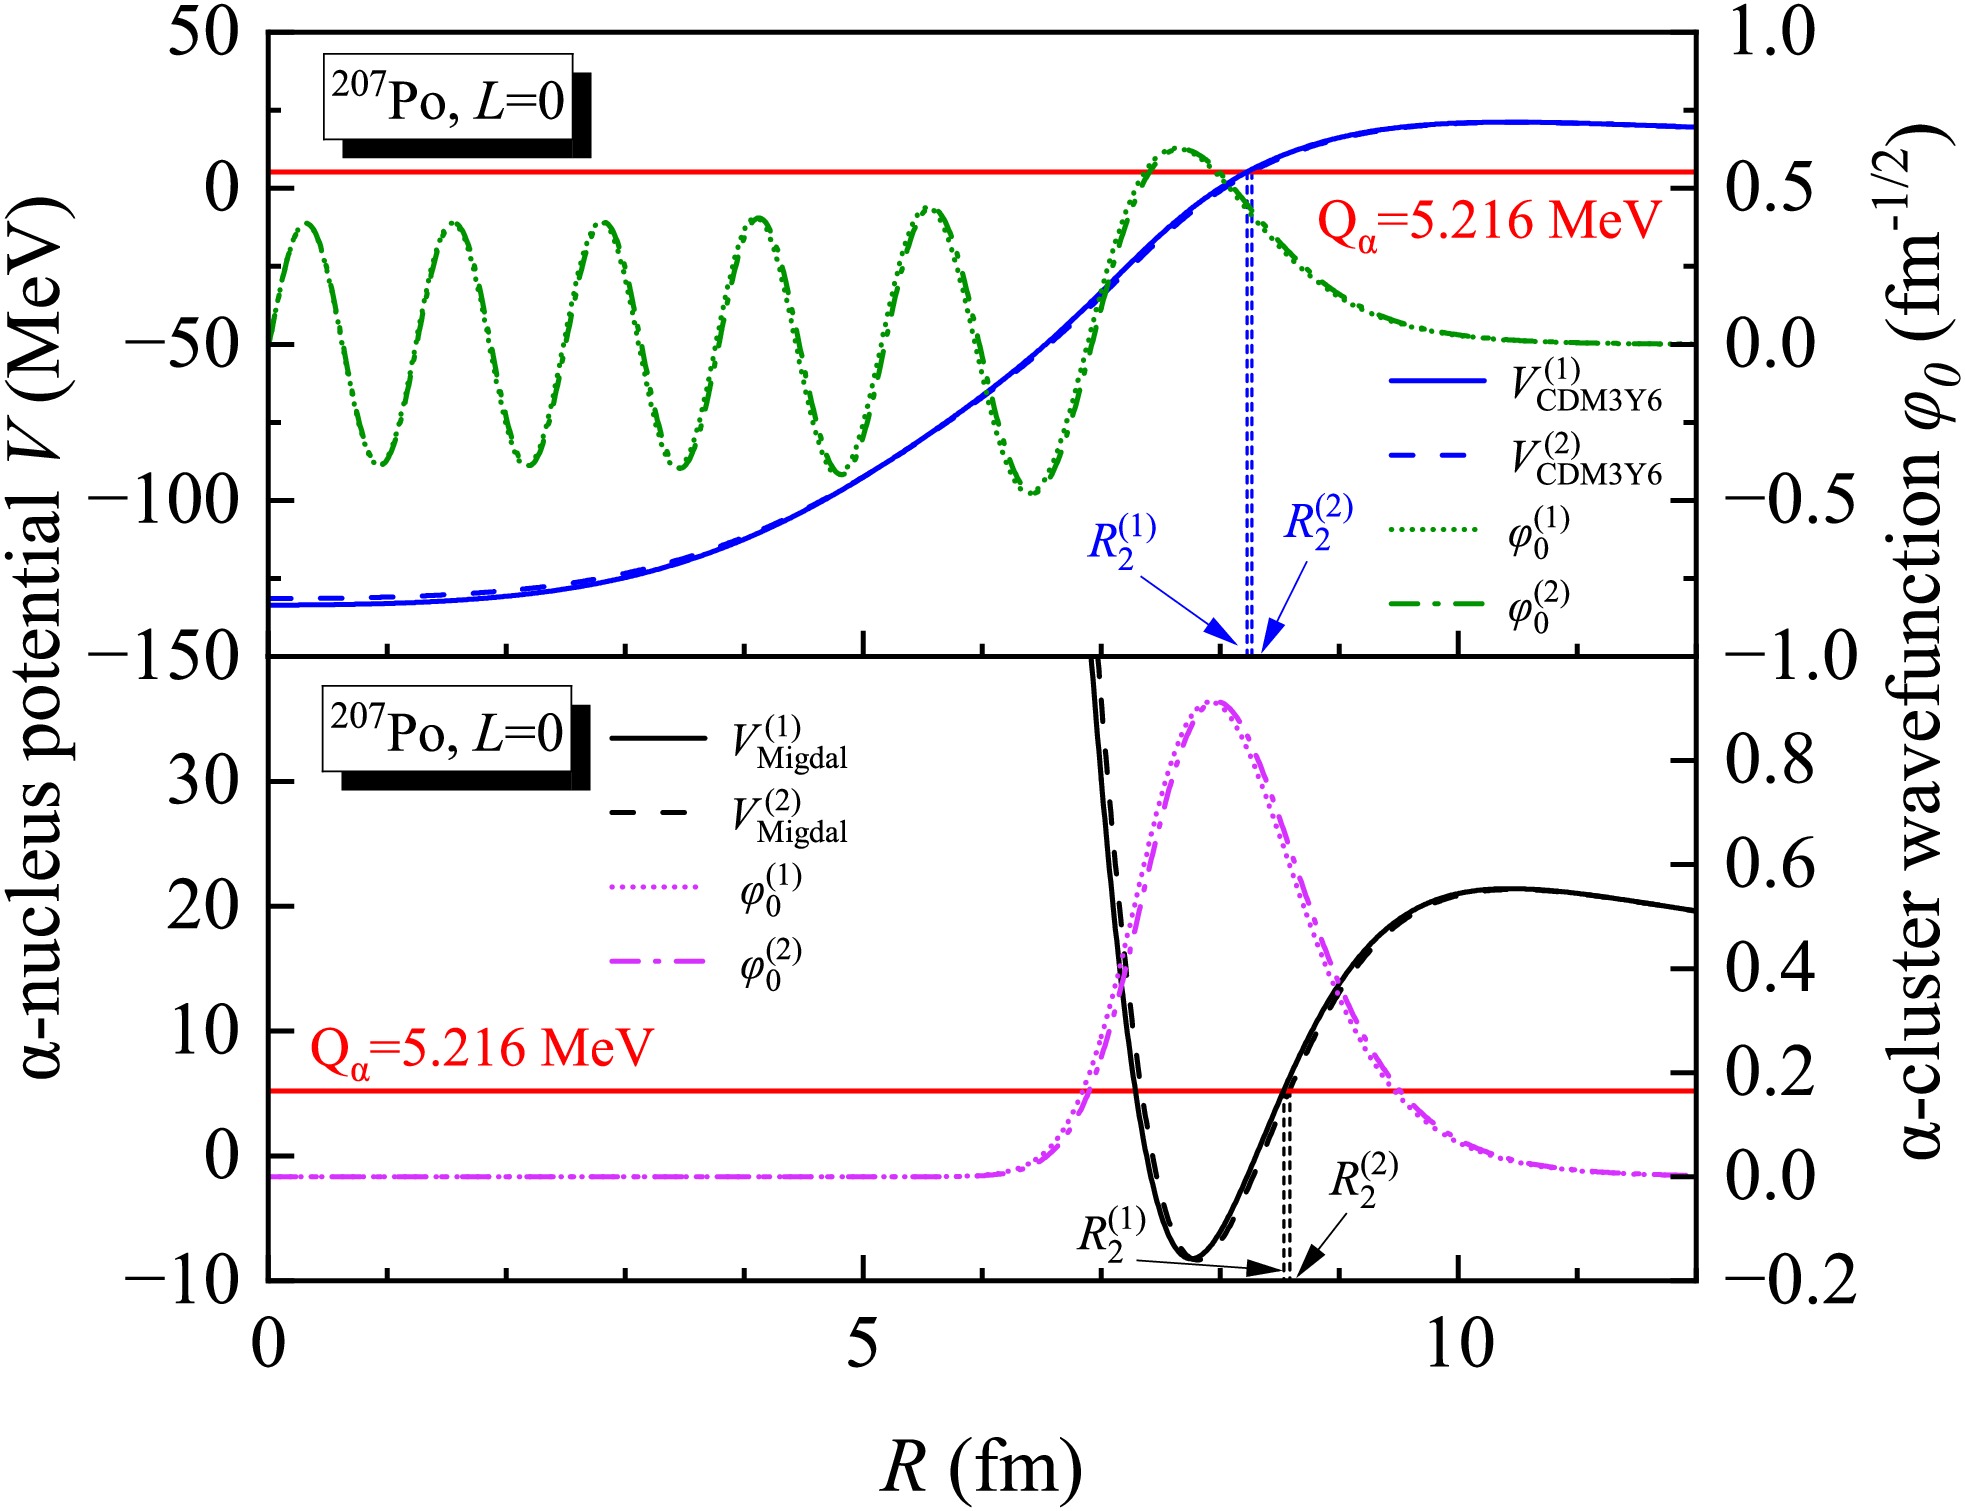
Figure 8. (color online) Sensitivity of the α-nucleus potentials to the input parameters of the density distributions of the daughter nucleus. The potential V, the second classical turning point
$ R_2 $ , and the α-cluster wavefunction$ \varphi_0 $ denoted by the superscript (1) are obtained by assuming the same half-density radius$ R_d $ and diffuseness a for both the proton and neutron density distributions. In contrast, the superscript (2) denotes the results obtained using distinct parameters for the proton and neutron distributions ($ R_{d, \tau=p, n} $ and$ a_{\tau=p, n} $ ). -
To evaluate the performance of the DDFPs using the CDM3Y6 and Migdal interactions, we focus on the α-decay properties of odd-A nuclei in the range
$ 78 \le Z \le 90 $ . We note that only ground-state to ground-state (g.s. to g.s.) transitions are considered in this study. This restriction arises because the current DDFP model requires deformation parameters as input for the daughter nuclei, and systematic theoretical descriptions of nuclear deformation—such as the adopted FRDM calculations [61]—are currently only available for ground states. In total, 87 nuclei in this region are investigated. Among these, 79 nuclei—excluding those in the$ N=125 $ and$ N=127 $ isotonic chains—exhibit favored decays from ground-state to ground-state, whereas the remaining 8 nuclei in these chains display unfavored decays.We first compare the
$ P_\alpha $ factors calculated using Eq. (14) for the two interactions. For reference, the results from the Hamiltonian energy-density approach based on the SLy4 Skyrme interaction [62] are also included for comparison. As shown in Fig. 1 and Table 1, the values of$ \lg P_\alpha $ obtained with the CDM3Y6 interaction range from –2.0 to –0.6, while those obtained with the Migdal interaction range from –2.7 to –1.1. The CDM3Y6 values are systematically larger, with an average ratio of 5 and individual ratios ranging from 1.9 to 11.6. Notably, the magnitudes of$ P_\alpha $ derived from the SLy4 Skyrme interaction generally fall between those of the other two interactions. They align more closely with the CDM3Y6 results, with differences below a factor of 2 for most nuclei.
Figure 1. (color online)
$ P_\alpha $ variation versus neutron number. The$ P_\alpha $ factors for panels (a) and (b) are extracted using DDFPs based on the CDM3Y6 and Migdal interactions, respectively. The$ P_\alpha $ factors in (c) are extracted using the Hamiltonian energy-density approach with the SLy4 Skyrme interaction [62].Nuclide $ Q_\alpha $ /MeV$ \beta_2 $ $ \beta_4 $ $ T_{1/2}^{\text{exp}} $ $ T_{1/2}^{\text{cal}}{\rm{(Migdal)}} $ $ T_{1/2}^{\text{cal}}{\rm{(CDM3Y6)}} $ $ P_\alpha $ (Migdal)$ P_\alpha $ (CDM3Y6)$ ^{169}\text{Pt} $ 6.858 0.140 −0.005 6.99×10⁻³ 4.84×10⁻³ 7.41×10⁻³ 2.17×10⁻² 1.11×10⁻¹ $ ^{171}\text{Pt} $ 6.607 0.162 −0.015 5.06×10⁻² 3.17×10⁻² 5.27×10⁻² 1.86×10⁻² 1.05×10⁻¹ $ ^{173}\text{Pt} $ 6.350 0.173 −0.013 4.63×10⁻¹ 2.56×10⁻¹ 4.60×10⁻¹ 1.55×10⁻² 9.69×10⁻² $ ^{177}\text{Pt} $ 5.643 0.206 −0.009 2.10×10² 1.76×10² 3.93×10² 2.08×10⁻² 1.69×10⁻¹ $ ^{181}\text{Pt} $ 5.150 0.218 −0.019 7.30×10⁴ 4.30×10⁴ 1.03×10⁵ 1.27×10⁻² 1.18×10⁻¹ $ ^{183}\text{Pt} $ 4.823 0.219 −0.031 4.06×10⁶ 2.87×10⁶ 6.91×10⁶ 1.41×10⁻² 1.36×10⁻¹ $ ^{173}\text{Au} $ 6.836 0.151 −0.003 2.66×10⁻² 1.31×10⁻² 2.19×10⁻² 1.42×10⁻² 8.17×10⁻² $ ^{175}\text{Au} $ 6.583 0.162 −0.015 2.23×10⁻¹ 9.62×10⁻² 1.69×10⁻¹ 1.17×10⁻² 7.42×10⁻² $ ^{183}\text{Au} $ 5.466 0.207 −0.021 7.88×10³ 3.54×10³ 8.05×10³ 9.36×10⁻³ 8.37×10⁻² $ ^{185}\text{Au} $ 5.180 0.207 −0.033 9.81×10⁴ 1.03×10⁵ 2.35×10⁵ 2.02×10⁻² 1.88×10⁻¹ $ ^{173}\text{Hg} $ 7.380 0.129 0.007 7.00×10⁻⁴ 6.15×10⁻⁴ 9.61×10⁻⁴ 2.61×10⁻² 1.39×10⁻¹ $ ^{175}\text{Hg} $ 7.072 0.140 0.007 1.08×10⁻² 5.41×10⁻³ 9.02×10⁻³ 1.41×10⁻² 8.14×10⁻² $ ^{179}\text{Hg} $ 6.340 0.173 −0.001 1.98×100 1.87×100 3.81×100 2.34×10⁻² 1.74×10⁻¹ $ ^{183}\text{Hg} $ 6.039 0.250 0.011 8.83×101 1.69×101 5.06×101 4.14×10⁻³ 4.79×10⁻² $ ^{185}\text{Hg} $ 5.774 0.240 −0.016 8.52×10² 2.94×10² 7.73×10² 6.89×10⁻³ 7.27×10⁻² $ ^{177}\text{Tl} $ 7.067 0.129 −0.006 2.47×10⁻² 1.48×10⁻² 2.52×10⁻² 1.64×10⁻² 9.79×10⁻² $ ^{179}\text{Tl} $ 6.718 0.129 −0.006 2.30×10⁻¹ 2.37×10⁻¹ 4.16×10⁻¹ 2.64×10⁻² 1.67×10⁻¹ $ ^{181}\text{Tl} $ 6.322 0.140 −0.005 3.37×101 7.07×100 1.34×101 5.04×10⁻³ 3.54×10⁻² $ ^{191}\text{Pb} $ 5.450 −0.146 −0.015 6.14×10⁵ 1.87×10⁵ 3.59×10⁵ 5.13×10⁻³ 4.28×10⁻² $ ^{191}\text{Po} $ 7.501 0.011 0.000 2.89×10⁻² 1.04×10⁻² 8.71×10⁻³ 6.65×10⁻³ 2.32×10⁻² $ ^{193}\text{Po} $ 7.094 0.000 0.000 3.91×10⁻¹ 2.36×10⁻¹ 1.99×10⁻¹ 1.01×10⁻² 3.73×10⁻² $ ^{195}\text{Po} $ 6.750 0.000 0.000 4.96×100 4.17×100 3.35×100 1.28×10⁻² 4.71×10⁻² $ ^{197}\text{Po} $ 6.412 0.021 0.000 1.22×10² 8.92×101 7.27×101 9.94×10⁻³ 3.69×10⁻² $ ^{199}\text{Po} $ 6.074 0.032 0.000 2.74×10³ 2.51×10³ 2.05×10³ 1.10×10⁻² 4.72×10⁻² $ ^{201}\text{Po} $ 5.799 0.011 0.000 5.85×10⁴ 5.02×10⁴ 3.78×10⁴ 8.88×10⁻³ 3.83×10⁻² $ ^{205}\text{Po} $ 5.325 0.000 0.000 1.57×10⁷ 1.62×10⁷ 1.07×10⁷ 7.38×10⁻³ 3.59×10⁻² $ ^{207}\text{Po} $ 5.216 0.000 0.000 9.94×10⁷ 7.75×10⁷ 4.55×10⁷ 4.32×10⁻³ 2.25×10⁻² $ ^{213}\text{Po} $ 8.536 −0.011 0.000 3.72×10⁻⁶ 2.54×10⁻⁶ 1.66×10⁻⁶ 2.47×10⁻² 5.13×10⁻² $ ^{215}\text{Po} $ 7.526 0.000 0.000 1.78×10⁻³ 1.80×10⁻³ 1.32×10⁻³ 3.49×10⁻² 8.28×10⁻² $ ^{217}\text{Po} $ 6.662 0.000 0.000 1.57×100 1.74×100 1.42×100 3.64×10⁻² 9.77×10⁻² $ ^{219}\text{Po} $ 5.910 0.000 0.000 2.20×10³ 2.46×10³ 2.18×10³ 3.50×10⁻² 1.04×10⁻¹ $ ^{197}\text{At} $ 7.104 0.075 0.014 3.96×10⁻¹ 5.03×10⁻¹ 4.41×10⁻¹ 1.82×10⁻² 7.58×10⁻² $ ^{199}\text{At} $ 6.777 −0.052 0.013 7.69×100 8.61×100 7.11×100 1.43×10⁻² 5.97×10⁻² $ ^{201}\text{At} $ 6.473 −0.052 0.013 1.41×10² 1.41×10² 1.13×10² 1.12×10⁻² 4.93×10⁻² $ ^{203}\text{At} $ 6.210 −0.052 0.013 1.64×10³ 1.92×10³ 1.47×10³ 1.12×10⁻² 5.18×10⁻² $ ^{205}\text{At} $ 6.020 −0.052 0.013 1.61×10⁴ 1.50×10⁴ 1.06×10⁴ 7.38×10⁻³ 3.55×10⁻² $ ^{207}\text{At} $ 5.872 −0.042 0.001 7.58×10⁴ 8.60×10⁴ 5.27×10⁴ 7.20×10⁻³ 3.54×10⁻² $ ^{209}\text{At} $ 5.757 −0.042 0.001 5.01×10⁵ 3.80×10⁵ 1.90×10⁵ 3.59×10⁻³ 1.80×10⁻² $ ^{211}\text{At} $ 5.982 −0.021 0.000 6.21×10⁴ 4.65×10⁴ 1.66×10⁴ 2.34×10⁻³ 1.17×10⁻² $ ^{213}\text{At} $ 9.254 −0.011 0.000 1.26×10⁻⁷ 1.03×10⁻⁷ 6.28×10⁻⁸ 3.01×10⁻² 5.79×10⁻² $ ^{215}\text{At} $ 8.178 −0.010 0.012 1.00×10⁻⁴ 5.03×10⁻⁵ 3.50×10⁻⁵ 1.77×10⁻² 3.96×10⁻² $ ^{217}\text{At} $ 7.201 −0.010 0.012 3.26×10⁻² 5.03×10⁻² 3.96×10⁻² 5.19×10⁻² 1.33×10⁻¹ $ ^{219}\text{At} $ 6.324 −0.021 0.012 5.77×101 1.04×10² 9.09×101 5.76×10⁻² 1.67×10⁻¹ $ ^{195}\text{Rn} $ 7.690 −0.217 0.017 6.00×10⁻³ 8.39×10⁻³ 9.65×10⁻³ 2.35×10⁻² 1.18×10⁻¹ $ ^{197}\text{Rn} $ 7.411 −0.217 0.017 5.50×10⁻² 6.70×10⁻² 7.83×10⁻² 1.85×10⁻² 9.94×10⁻² $ ^{199}\text{Rn} $ 7.140 −0.207 0.015 6.28×10⁻¹ 6.07×10⁻¹ 6.88×10⁻¹ 1.31×10⁻² 7.28×10⁻² $ ^{201}\text{Rn} $ 6.861 0.085 0.003 9.15×100 1.02×101 9.00×100 1.33×10⁻² 6.19×10⁻² $ ^{203}\text{Rn} $ 6.630 0.075 0.002 6.87×101 8.69×101 7.17×101 1.31×10⁻² 6.20×10⁻² $ ^{207}\text{Rn} $ 6.251 −0.063 0.001 2.66×10³ 4.17×10³ 2.82×10³ 1.12×10⁻² 5.56×10⁻² $ ^{209}\text{Rn} $ 6.155 −0.052 0.001 1.02×10⁴ 1.34×10⁴ 7.56×10³ 7.26×10⁻³ 3.64×10⁻² $ ^{215}\text{Rn} $ 8.839 −0.011 0.000 2.30×10⁻⁶ 2.08×10⁻⁶ 1.45×10⁻⁶ 3.26×10⁻² 7.26×10⁻² $ ^{217}\text{Rn} $ 7.887 0.000 0.000 5.90×10⁻⁴ 7.93×10⁻⁴ 5.89×10⁻⁴ 4.63×10⁻² 1.11×10⁻¹ $ ^{201}\text{Fr} $ 7.516 −0.207 0.015 6.90×10⁻² 8.09×10⁻² 8.80×10⁻² 1.50×10⁻² 8.24×10⁻² $ ^{203}\text{Fr} $ 7.260 0.096 0.003 5.78×10⁻¹ 9.32×10⁻¹ 8.25×10⁻¹ 1.80×10⁻² 8.73×10⁻² $ ^{205}\text{Fr} $ 7.055 0.086 −0.009 3.96×100 5.61×100 4.50×100 1.35×10⁻² 6.55×10⁻² $ ^{207}\text{Fr} $ 6.900 −0.083 0.014 1.56×101 2.36×101 1.70×101 1.20×10⁻² 5.92×10⁻² $ ^{209}\text{Fr} $ 6.778 −0.073 0.002 5.67×101 8.25×101 5.07×101 9.22×10⁻³ 4.54×10⁻² $ ^{211}\text{Fr} $ 6.663 −0.053 −0.011 2.14×10² 3.01×10² 1.48×10² 6.66×10⁻³ 3.28×10⁻² $ ^{213}\text{Fr} $ 6.905 0.011 0.000 3.49×101 5.12×101 1.67×101 4.59×10⁻³ 2.10×10⁻² $ ^{215}\text{Fr} $ 9.540 0.000 0.000 8.60×10⁻⁸ 1.01×10⁻⁷ 6.51×10⁻⁸ 4.34×10⁻² 8.82×10⁻² $ ^{217}\text{Fr} $ 8.469 −0.011 0.000 2.20×10⁻⁵ 4.07×10⁻⁵ 3.09×10⁻⁵ 6.52×10⁻² 1.59×10⁻¹ $ ^{219}\text{Fr} $ 7.449 0.011 0.000 2.02×10⁻² 4.51×10⁻² 3.84×10⁻² 7.50×10⁻² 2.08×10⁻¹ $ ^{201}\text{Ra} $ 8.002 −0.227 0.019 8.00×10⁻³ 5.09×10⁻³ 5.90×10⁻³ 8.64×10⁻³ 4.89×10⁻² $ ^{203}\text{Ra} $ 7.730 −0.217 0.017 3.10×10⁻² 3.85×10⁻² 4.24×10⁻² 1.49×10⁻² 8.61×10⁻² $ ^{205}\text{Ra} $ 7.486 −0.207 0.004 2.10×10⁻¹ 2.75×10⁻¹ 2.80×10⁻¹ 1.36×10⁻² 7.93×10⁻² $ ^{207}\text{Ra} $ 7.270 −0.115 0.017 1.40×100 2.32×100 1.88×100 1.46×10⁻² 7.55×10⁻² $ ^{209}\text{Ra} $ 7.143 −0.104 0.016 4.83×100 7.69×100 5.47×100 1.14×10⁻² 5.95×10⁻² $ ^{217}\text{Ra} $ 9.161 −0.010 0.012 1.60×10⁻⁶ 1.55×10⁻⁶ 1.11×10⁻⁶ 3.48×10⁻² 7.96×10⁻² $ ^{205}\text{Ac} $ 8.090 −0.217 0.006 2.00×10⁻² 7.44×10⁻³ 7.85×10⁻³ 4.16×10⁻³ 2.40×10⁻² $ ^{207}\text{Ac} $ 7.840 −0.207 −0.007 2.70×10⁻² 5.00×10⁻² 4.77×10⁻² 1.77×10⁻² 1.02×10⁻¹ $ ^{209}\text{Ac} $ 7.730 −0.125 0.018 8.70×10⁻² 1.65×10⁻¹ 1.28×10⁻¹ 1.51×10⁻² 7.98×10⁻² $ ^{211}\text{Ac} $ 7.620 −0.115 0.017 2.10×10⁻¹ 4.52×10⁻¹ 2.96×10⁻¹ 1.36×10⁻² 7.16×10⁻² $ ^{213}\text{Ac} $ 7.501 −0.084 0.002 7.38×10⁻¹ 1.56×100 7.83×10⁻¹ 9.97×10⁻³ 5.03×10⁻² $ ^{215}\text{Ac} $ 7.746 0.011 0.000 1.71×10⁻¹ 3.82×10⁻¹ 1.29×10⁻¹ 6.98×10⁻³ 3.31×10⁻² $ ^{217}\text{Ac} $ 9.832 0.000 0.000 6.90×10⁻⁸ 9.64×10⁻⁸ 6.59×10⁻⁸ 5.15×10⁻² 1.11×10⁻¹ $ ^{219}\text{Ac} $ 8.830 0.000 0.000 1.18×10⁻⁵ 2.20×10⁻⁵ 1.69×10⁻⁵ 6.57×10⁻² 1.62×10⁻¹ $ ^{227}\text{Ac} $ 5.042 0.132 0.083 1.04×10¹¹ 1.39×10¹⁰ 3.46×10¹⁰ 3.83×10⁻³ 3.29×10⁻² $ ^{213}\text{Th} $ 7.837 −0.104 0.004 1.44×10⁻¹ 2.49×10⁻¹ 1.49×10⁻¹ 9.56×10⁻³ 5.07×10⁻² $ ^{219}\text{Th} $ 9.510 −0.021 0.012 1.05×10⁻⁶ 1.01×10⁻⁶ 7.49×10⁻⁷ 3.48×10⁻² 8.19×10⁻² Table 1. Calculated α-decay half-lives (in seconds) and α-preformation factors of isotopic chains with
$ 78 \le Z \le 90 $ . The α-decay energies$ Q_\alpha $ , the quadrupole and hexadecapole deformation parameters$ \beta_2 $ and$ \beta_4 $ of the daughter nucleus, and the experimental partial α-decay half-lives$ T_{1/2}^{\text{exp}} $ of the favored transitions are listed in the second to fifth columns. The α-decay half-lives calculated with the DDFPs using the Migdal and CDM3Y6 interactions are presented in the sixth and seventh columns. The last two columns show the$ P_\alpha $ factors calculated with Eq. (14) from both interactions.Despite the differences in absolute magnitudes, the systematic trends of
$ P_\alpha $ obtained with all three α-nucleus potentials are highly consistent. Typically, a sharp increase is observed beyond$ N = 126 $ , reflecting pronounced neutron shell effects. Furthermore, for the isotopic chains on both sides of$ N = 126 $ , the$ P_\alpha $ values approximately follow a linear trend with neutron number. This linear trend is particularly prominent in the region where N is slightly less than 126. However, in the SLy4 results, noticeable fluctuations appear for specific nuclei, such as 197Rn ($ N=111 $ ) and 205Rn ($ N=117 $ ), within their respective isotopic chains. For$ N \gt 126 $ , the$ P_\alpha $ values from the CDM3Y6 interaction exhibit a more linear variation with N than those from the Migdal interaction. The latter tends to saturate more rapidly as N increases. These characteristics are consistent with the$ P_\alpha $ systematics observed in our previous studies of even-even nuclei [41, 48]. Overall, the successful reproduction of the known$ P_\alpha $ systematics for odd-A nuclei demonstrates the reliability of these theoretical approaches across different NN interactions.We then compare the accuracy of the DDFPs in calculating the α-decay half-lives using the two NN interactions. When performing half-life calculations,
$ P_\alpha $ must be appropriately assumed in the decay model as a theoretical input. Since the$ P_\alpha $ factor near shell closures varies approximately linearly with the valence nucleon number, we adopted the simple treatment described in Ref. [46]. The$ P_\alpha $ value is approximated by the following expression, which depends on the valence neutron number:$ P_{\alpha}^{{\rm{inp}}}=a\left(N-N_{0}\right)+b . $
(15) In the above expression,
$ N_0 $ is the nearest neutron magic number less than N. The parameters a and b are determined by fitting the expression to the empirical$ P_\alpha $ factors extracted using Eq. (14). For the α-nucleus potential under the CDM3Y6 interaction, we obtain$ a= (-1.73\pm0.302)\times10^{-3} $ ,$ b=(1.20\pm0.0844)\times10^{-1} $ , along with the covariance matrix,$M_{c}^{\text{CDM3Y6}}=10^{-7} \times\left[\begin{array}{*{20}{c}} {0.912} & {-22.2} \\ {-22.2} & {712} \end{array}\right]. $
For the α-nucleus potential under the Migdal interaction, we obtain
$ a=(-8.04\pm0.893)\times10^{-4} $ ,$ b=(3.85\pm 0.250)\times10^{-2} $ , along with the covariance matrix,$M_{c}^{\text{Migdal}}=10^{-8} \times\left[\begin{array}{*{20}{c}} {0.798} & {-19.4} \\{-19.4 }& {624 } \end{array}\right].$
Figure 2 illustrates the empirical
$ P_\alpha $ values described by Eq. (15). As shown, Eq. (15) approximately captures the overall trend of$ P_\alpha $ as a function of the valence neutron number. This simple treatment provides a useful basis for evaluating the accuracy of the α-nucleus potential in half-life calculations. However, to accurately describe$ P_\alpha $ for a specific nuclide, the empirical formula often requires additional terms that account for other structural effects, such as the dependence on the valence proton number [63−65], the angular momentum of the α particle [65, 66], and nuclear deformation [67, 68].
Figure 2. (color online) The distribution of
$ P_\alpha $ extracted using the DDFPs based on the CDM3Y6 and the Migdal interactions. The red line shows$ P_\alpha^{\text{inp}} $ from Eq. (15) fitted to the data.Using the results of Eq. (15) as input for the half-life calculations, we obtain the deviations between the theoretical and experimental α-decay half-lives for the CDM3Y6 and Migdal interactions, as shown in Fig. 3. On a logarithmic scale, the deviations are generally confined between –0.5 and 0.5, corresponding to a theoretical-to-experimental ratio predominately in the range 0.31 to 3.16. This indicates that the α-nucleus potentials derived from both interactions can reasonably reproduce the α-decay half-lives of these odd-A nuclei. To quantify the overall accuracy, we compute the root-mean-square (RMS) deviation factor
Figure 3. (color online) Deviations between experimental and theoretical α-decay half-lives calculated using the DDFPs based on the CDM3Y6 and the Migdal interactions. For most nuclei, the theoretical results agree with the experimental data within a factor of 0.31−3.16.
$ \sigma=\sqrt{\frac{1}{n} \sum\limits_{i=1}^{n}\left({\lg T_{{1 / 2}, i}^{\exp }}-{\lg T_{{1 / 2}, i}^{{\rm{cal}}}}\right)^{2}}, $
where n is the total number of nuclides considered.
The σ values for the CDM3Y6 and Migdal interactions are 0.212 and 0.250, respectively. This indicates that the two potentials achieve comparable accuracy in half-life calculations, with the CDM3Y6 potential showing only a slight advantage. Compared to the previous result
$ \sigma=0.1820 $ for favored decays of even-even nuclei [46], the σ value for odd-A nuclei obtained with the Migdal interaction is 37.4% larger. This increase is reasonable because the decay schemes of odd-A nuclei are more complex and their experimental measurements generally carry larger uncertainties than those of even-even nuclei. Moreover, the deviations for 181Tl, 183Hg, and 227Ac using the Migdal interaction significantly exceed 0.5, while only two nuclei (191Po and 211At) in the CDM3Y6 case slightly surpass this threshold. To account for the experimental uncertainties in α-decay energy, half-life, and branching ratio (Table 2), we include error bars for these specific nuclei in Fig. 3. Even after considering these uncertainties, the half-life deviations remain larger than 0.5 for all nuclei except 191Po. Since the sets of nuclei with large deviations differ between the two interactions, it suggests that these discrepancies mainly arise from the approximation of the empirical$ P_\alpha $ formula and from intrinsic model uncertainties.Nuclide $ Q_\alpha $ /keV$ T_{1/2} $ $ B_1 $ $ B_2 $ $ T_{1/2}^{\text{exp}} $ $ ^{191} \text{Po} $ $ 7501 ^ {+ 11} _ {-11} $ $ 22 ^ {+ 1} _ {- 1}\text{ ms} $ $ 0.99 ^ {+ 0.01} _ {- 0.1} $ $ 0.77 ^ {+ 0.025} _ {- 0.025} $ $ 28.86 ^ {+ 5.83} _ {- 2.45}\text{ ms} $ $ ^{211} \text{At} $ $ 5982.4 ^ {+ 1.3} _ {-1.3} $ $ 7.214 ^ {+ 0.007} _ {- 0.007}\text{ h} $ $ 0.4180 ^ {+ 0.0008} _ {- 0.0008} $ 1 $ 17.26 ^ {+ 0.05} _ {- 0.05}\text{ h} $ $ ^{181} \text{Tl} $ $ 6322 ^ {+ 6} _ {-6} $ $ 2.9 ^ {+ 0.1} _ {- 0.1}\text{ s} $ $ 0.086 ^ {+ 0.006} _ {- 0.006} $ 1 $ 33.72 ^ {+ 3.78} _ {- 3.29}\text{ s} $ $ ^{183} \text{Hg} $ $ 6039 ^ {+ 4} _ {-4} $ $ 9.4 ^ {+ 0.7} _ {- 0.7}\text{ s} $ $ 0.117 ^ {+ 0.02} _ {- 0.02} $ $ 0.91 ^ {+ 0.09} _ {- 0.17} $ $ 88.29 ^ {+ 52.42} _ {- 24.79}\text{ s} $ $ ^{227} \text{Ac} $ $ 5042.19 ^ {+ 0.14} _ {-0.14} $ $ 21.772 ^ {+ 0.003} _ {- 0.003}\text{ y} $ $ 0.01380 ^ {+ 0.00004} _ {- 0.00004} $ $ 0.477 ^ {+ 0.01} _ {- 0.01} $ $ 3307.51 ^ {+ 81.11} _ {- 77.73}\text{ y} $ Table 2. Uncertainties in the experimental α-decay energies
$ Q_\alpha $ , total half-lives$ T_{1/2} $ , branching ratio for α decay among the various decay modes$ B_1 $ , branching ratio for the ground-state to ground-state α transition$ B_2 $ , and derived experimental partial α-decay half-lives$ T_{1/2}^{\text{exp}} $ [69].After discussing the favored α-decay properties, we attempt to analyze the reliability of the DDFP in the unfavored α decays of odd-A nuclei. A typical example is the α decays of the
$ N=127 $ isotonic chain near$ Z=82 $ [70]. Xu et al. previously investigated their half-lives using the cluster model with a phenomenological cosh-type nuclear potential. They found that the ground-state to ground-state α decays of these nuclei all correspond to the same kind of unfavored transitions with an angular momentum transfer of$ L=5 $ . In these cases, the$ P_\alpha $ values show a clear linear increase with the valence proton number. Therefore, they adopted the following Z-dependent formula to describe the$ P_\alpha $ factor.$ P_{\alpha} \approx c \times(Z-82) , $
(16) where c is a constant. Instead of treating
$ P_\alpha $ as a nucleus-independent constant, the use of this expression yields better agreement between calculated and experimental α-decay half-lives. This improved agreement demonstrates that shell effects are significant not only in the$ P_\alpha $ systematics of favored transitions, but also in unfavored transitions.As a test, we first attempt to reproduce the above conclusion using the DDFP model. Fig. 4 shows the variation of
$ P_\alpha $ for unfavored decays of odd-A nuclei as a function of proton number. For the$ N=127 $ isotonic chains, the$ P_\alpha $ values from both NN interactions follow an approximately linear trend with the valence proton number, consistent with the conclusion of Ref. [70]. The most significant difference between the two potentials is that the$ P_\alpha $ values from the Migdal interaction are systematically smaller than the CDM3Y6 results by a factor of about 5. In addition to the$ N=127 $ isotonic chain, we discover that the$ N=125 $ isotonic chain also has similar decay properties. Specifically, experimental data show that the ground-state to ground-state α decays of the$ N=125 $ chain share the same unfavored character ($ L=2 $ ). In parallel, our calculations indicate that the$ P_\alpha $ factors along this$ N=125 $ chain also exhibit a linear increase with the valence proton number, as shown in Fig. 4.
Figure 4.
$ P_\alpha $ in unfavored decays of the$ N=125 $ and$ N=127 $ isotonic chains. The upper and lower subfigures show results obtained with the CDM3Y6 and the Migdal interactions, respectively.Our previous study on the
$ P_\alpha $ systematics of even-even nuclei demonstrated that near the$ Z=82 $ and$ N=126 $ doubly magic shell closures, the$ P_\alpha $ variation in favored transitions is mainly dominated by changes in pairing interactions [33]. To understand the results of the unfavored decays shown in Fig. 4, we also investigated the correlation between$ P_\alpha $ and the proton pairing gap$ \Delta_{p} $ in this region.$ \Delta_{p} $ can be calculated using the empirical three-point formula [71],$\begin{aligned}[b] \Delta_{p}(Z, N)=\frac{(-1)^{Z}}{2}\times[B(Z, N)-2 B(Z-1, N)+B(Z-2, N)] \end{aligned} .$
(17) We extracted the
$ \Delta_p $ values from the experimental binding energies, and the results are listed in Table 3. Figs. 5 and 6 display$ P_\alpha $ as a function of$ \Delta_p $ for unfavored and favored decays along the$ N=125,127 $ and$ N=124,126,128 $ isotonic chains, respectively. It can be seen that$ P_\alpha $ increases approximately linearly with$ \Delta_p $ along all these isotonic chains, indicating a strong positive correlation between these two quantities.$ \Delta_p $ reflects the strength of the proton pairing correlation within nuclei, which, together with neutron pairing and proton–neutron (PN) correlations, contributes to the formation of α clusters. When the spatial overlap between proton and neutron orbitals is small, such as in the vicinity of the$ Z=82 $ ,$ N=126 $ shell closures, the variation of PN correlations is suppressed. Consequently, the change in the pairing interaction strength dominates the variation of$ P_\alpha $ . The findings in Figs. 5 and 6 confirm that this interpretation holds for both favored and unfavored decays, thereby explaining the behavior observed in Fig. 4. Thus, Fig. 4 demonstrates the interplay between shell effects from the mean field and the proton pairing correlation. The$ P_\alpha $ factor attains a local minimum at the shell closure as a manifestation of shell effects; meanwhile, it increases almost linearly above the closure as the number of valence proton pairs increases. This indicates that the$ P_\alpha $ empirical formula, which depends on the valence nucleon number, provides a relatively good approximation for half-life calculations near shell closures. The DDFP models with the CDM3Y6 and Migdal interactions both reasonably reproduce this structural pattern of$ P_\alpha $ near$ Z=82 $ .Nuclide $ Q_\alpha $ /MeV$ \beta_2 $ $ \beta_4 $ $ T_{1/2}^{\text{exp}} $ L $ P_\alpha $ (Migdal)$ P_\alpha $ (CDM3Y6)$ \Delta_p $ /MeV211Po 7.595 0.000 0.000 5.22×10⁻¹ 5 1.02×10⁻³ 4.43×10⁻³ 0.232 213Rn 8.244 0.000 0.000 1.99×10⁻² 5 1.67×10⁻³ 7.17×10⁻³ 0.436 215Ra 8.864 0.000 0.000 1.73×10⁻³ 5 2.00×10⁻³ 8.93×10⁻³ 0.623 217Th 9.435 0.000 0.000 2.66×10⁻⁴ 5 2.24×10⁻³ 1.02×10⁻² 0.780 209Po 4.979 −0.010 −0.012 2.71×10¹⁰ 2 6.01×10⁻⁴ 3.42×10⁻³ 0.539 211Rn 5.965 0.021 0.000 5.64×10⁵ 2 1.56×10⁻³ 8.67×10⁻³ 0.589 213Ra 6.861 −0.063 −0.010 4.50×101 2 2.18×10⁻³ 1.23×10⁻² 0.688 215Th 7.665 −0.073 −0.010 3.03×100 2 2.70×10⁻³ 1.53×10⁻² 0.799 Table 3. The α-preformation factors and proton pairing gaps for the
$ N=125,127 $ isotonic chains in unfavored α decays are presented. Columns 2–6 list the experimental α-decay energy$ Q_\alpha $ , the quadrupole deformation parameter$ \beta_2 $ of the daughter nucleus, the hexadecapole deformation parameter$ \beta_4 $ , the experimental partial α-decay half-life$ {T}_{1/2}^{\text{exp}} $ (in seconds), and the angular momentum L of the α cluster, respectively. Columns 7 and 8 present the$ P_\alpha $ factors extracted from the DDFPs using the Migdal and CDM3Y6 interactions, respectively. Column 9 lists the proton pairing gap$ \Delta_p $ calculated from Eq. (17).
Figure 5. (color online)
$ P_\alpha $ in unfavored decays of the$ N= $ $ 125,127 $ isotonic chains, as a function of the proton pairing gap$ \Delta_p $ . The upper and lower subfigures show results obtained with the CDM3Y6 and the Migdal interactions, respectively.
Figure 6. (color online)
$ P_\alpha $ in favored decays of the$ N=124, $ $ 126,128 $ isotonic chains, as a function of the proton pairing gap$ \Delta_p $ . The upper and lower subfigures show results obtained with the CDM3Y6 and the Migdal interactions, respectively.In order to understand the systematic difference in the magnitude of
$ P_\alpha $ derived from the CDM3Y6 and Migdal interactions, we take the 207Po ($ L=0 $ ) and 211Po ($ L=5 $ ) systems as examples and compare their α-nucleus potentials as well as the corresponding α-cluster bound state wavefunctions$ \varphi_0 $ from the two types of NN interactions. As shown in Fig. 7, one can observe that outside the Coulomb barrier, the curves of the two α-nucleus potentials almost overlap. The discrepancies in the α-nucleus potentials mainly appear near the location of the second classical turning point$ R_{2} $ and inside the core region. The position of$ R_{2} $ has a more pronounced effect on the calculation of empirical$ P_\alpha $ . It can be seen from Fig. 7 that, for the same decay system, the α-nucleus potentials obtained with the CDM3Y6 interaction have a smaller$ R_{2} $ than those obtained with the Migdal interaction. Since the barrier heights are nearly equal, the systematic difference in$ R_2 $ leads to a higher tunneling probability for the α cluster in the Migdal case, consequently resulting in a smaller$ P_\alpha $ according to Eq. (14). This feature is observed in both favored and unfavored α decays, reflecting the systematic influence of different NN interactions. As a result of the potential geometry, the α-cluster wavefunction from the CDM3Y6 interaction exhibits a distinct oscillation. It displays multiple peaks and nodes, with the largest peak located near the nuclear surface. In contrast, the wavefunction derived from the Migdal interaction exhibits nearly zero amplitude inside the nucleus, and only a single peak appears at the nuclear surface.
Figure 7. (color online) α-nucleus potentials and α-cluster wavefunctions for the 207Po (
$ L=0 $ ) and 211Po ($ L=5 $ ) systems. The DDFPs with the CDM3Y6 and the Migdal interactions have similar barrier heights, whereas their geometries differ markedly. The Migdal interaction yields a larger second classical turning point$ R_2 $ , which accounts for the significant difference in the$ P_\alpha $ values between the two potentials.The different behaviors of
$ \varphi_0 $ are attributed to the different treatments of Pauli blocking in the two potentials. For the DDFP with the CDM3Y6 interaction, the Pauli blocking effect is mainly introduced by applying the Wildermuth condition [72]. This condition imposes a constraint on the total harmonic oscillator quanta carried by the nucleons constituting the α cluster and the daughter nucleus, such that nucleons from the α cluster can only occupy the orbitals above those filled by the core nucleons. Consequently, the wavefunction has multiple nodes inside the nucleus, and the largest peak at the surface indicates that the nucleons near the Fermi surface play a dominant role in the formation of the α cluster. For the DDFP with the Migdal interaction, because the Pauli blocking effect manifests as a significant repulsive potential barrier within the nucleus, the determination of the α-nucleus potential does not rely on the Wildermuth condition. As shown in Fig. 7, due to the medium effect, this repulsive potential begins to rise sharply from the critical radius$ R_{c} $ towards the interior of the nucleus. It therefore prevents the formation of α clusters in regions above the critical density. Specifically, the α-cluster wavefunction exhibits a nearly vanishing amplitude in the inner region of the nucleus.In order to further understand the differences between the two DDFPs, we also investigate how the input density distribution of the daughter nucleus influences the potential geometry and the resulting
$ P_\alpha $ factor. Taking 207Po as an example, instead of adopting the same half-density radius$ R_d $ = 6.61 fm and diffuseness a = 0.54 fm for both the proton and neutron density distributions of the daughter nucleus, we now distinguish these two parameters ($ R_{d, \tau=p, n} $ and$ a_{\tau=p, n} $ ) for proton and neutron distributions, respectively. These parameters can be calculated using empirical formulas fitted to the density profiles from self-consistent Skyrme Hartree-Fock calculations [73], which yield$ R_{d, p} $ = 6.67 fm,$ R_{d, n} $ = 6.77 fm,$ a_p $ = 0.50 fm, and$ a_n $ = 0.55 fm.Figure 8 presents a comparison of the DDFPs generated using the refined and the original density profiles. It can be seen that the refined density profiles result in only minor differences in the α-nucleus potentials and the corresponding α-cluster wavefunctions for both the CDM3Y6 and Migdal interactions. While the Coulomb barrier heights remain almost unchanged, the second turning point
$ R_2 $ increases by 0.04 fm for the DDFP-CDM3Y6 and by 0.05 fm for the DDFP-Migdal, which results in reductions of only 13% and 16% in the extracted$ P_\alpha $ factors, respectively. These results demonstrate that the sensitivity to the input density distribution parameters is comparable for both DDFPs. As a further validation, the results shown in Fig. 8 justify the traditional treatment of$ R_d $ and a, implying that the original parameters serve as a robust approximation for the density distributions of the involved nuclei.
Figure 8. (color online) Sensitivity of the α-nucleus potentials to the input parameters of the density distributions of the daughter nucleus. The potential V, the second classical turning point
$ R_2 $ , and the α-cluster wavefunction$ \varphi_0 $ denoted by the superscript (1) are obtained by assuming the same half-density radius$ R_d $ and diffuseness a for both the proton and neutron density distributions. In contrast, the superscript (2) denotes the results obtained using distinct parameters for the proton and neutron distributions ($ R_{d, \tau=p, n} $ and$ a_{\tau=p, n} $ ). -
To evaluate the performance of the DDFPs using the CDM3Y6 and Migdal interactions, we focus on the α-decay properties of odd-A nuclei in the range
$ 78 \le Z \le 90 $ . We note that only ground-state to ground-state (g.s. to g.s.) transitions are considered in this study. This restriction arises because the current DDFP model requires deformation parameters as input for the daughter nuclei, and systematic theoretical descriptions of nuclear deformation—such as the adopted FRDM calculations [61]—are currently only available for ground states. In total, 87 nuclei in this region are investigated. Among these, 79 nuclei—excluding those in the$ N=125 $ and$ N=127 $ isotonic chains—exhibit favored decays from ground-state to ground-state, whereas the remaining 8 nuclei in these chains display unfavored decays.We first compare the
$ P_\alpha $ factors calculated using Eq. (14) for the two interactions. For reference, the results from the Hamiltonian energy-density approach based on the SLy4 Skyrme interaction [62] are also included for comparison. As shown in Fig. 1 and Table 1, the values of$ \lg P_\alpha $ obtained with the CDM3Y6 interaction range from –2.0 to –0.6, while those obtained with the Migdal interaction range from –2.7 to –1.1. The CDM3Y6 values are systematically larger, with an average ratio of 5 and individual ratios ranging from 1.9 to 11.6. Notably, the magnitudes of$ P_\alpha $ derived from the SLy4 Skyrme interaction generally fall between those of the other two interactions. They align more closely with the CDM3Y6 results, with differences below a factor of 2 for most nuclei.
Figure 1. (color online)
$ P_\alpha $ variation versus neutron number. The$ P_\alpha $ factors for panels (a) and (b) are extracted using DDFPs based on the CDM3Y6 and Migdal interactions, respectively. The$ P_\alpha $ factors in (c) are extracted using the Hamiltonian energy-density approach with the SLy4 Skyrme interaction [62].Nuclide $ Q_\alpha $ /MeV$ \beta_2 $ $ \beta_4 $ $ T_{1/2}^{\text{exp}} $ $ T_{1/2}^{\text{cal}}{\rm{(Migdal)}} $ $ T_{1/2}^{\text{cal}}{\rm{(CDM3Y6)}} $ $ P_\alpha $ (Migdal)$ P_\alpha $ (CDM3Y6)$ ^{169}\text{Pt} $ 6.858 0.140 −0.005 6.99×10⁻³ 4.84×10⁻³ 7.41×10⁻³ 2.17×10⁻² 1.11×10⁻¹ $ ^{171}\text{Pt} $ 6.607 0.162 −0.015 5.06×10⁻² 3.17×10⁻² 5.27×10⁻² 1.86×10⁻² 1.05×10⁻¹ $ ^{173}\text{Pt} $ 6.350 0.173 −0.013 4.63×10⁻¹ 2.56×10⁻¹ 4.60×10⁻¹ 1.55×10⁻² 9.69×10⁻² $ ^{177}\text{Pt} $ 5.643 0.206 −0.009 2.10×10² 1.76×10² 3.93×10² 2.08×10⁻² 1.69×10⁻¹ $ ^{181}\text{Pt} $ 5.150 0.218 −0.019 7.30×10⁴ 4.30×10⁴ 1.03×10⁵ 1.27×10⁻² 1.18×10⁻¹ $ ^{183}\text{Pt} $ 4.823 0.219 −0.031 4.06×10⁶ 2.87×10⁶ 6.91×10⁶ 1.41×10⁻² 1.36×10⁻¹ $ ^{173}\text{Au} $ 6.836 0.151 −0.003 2.66×10⁻² 1.31×10⁻² 2.19×10⁻² 1.42×10⁻² 8.17×10⁻² $ ^{175}\text{Au} $ 6.583 0.162 −0.015 2.23×10⁻¹ 9.62×10⁻² 1.69×10⁻¹ 1.17×10⁻² 7.42×10⁻² $ ^{183}\text{Au} $ 5.466 0.207 −0.021 7.88×10³ 3.54×10³ 8.05×10³ 9.36×10⁻³ 8.37×10⁻² $ ^{185}\text{Au} $ 5.180 0.207 −0.033 9.81×10⁴ 1.03×10⁵ 2.35×10⁵ 2.02×10⁻² 1.88×10⁻¹ $ ^{173}\text{Hg} $ 7.380 0.129 0.007 7.00×10⁻⁴ 6.15×10⁻⁴ 9.61×10⁻⁴ 2.61×10⁻² 1.39×10⁻¹ $ ^{175}\text{Hg} $ 7.072 0.140 0.007 1.08×10⁻² 5.41×10⁻³ 9.02×10⁻³ 1.41×10⁻² 8.14×10⁻² $ ^{179}\text{Hg} $ 6.340 0.173 −0.001 1.98×100 1.87×100 3.81×100 2.34×10⁻² 1.74×10⁻¹ $ ^{183}\text{Hg} $ 6.039 0.250 0.011 8.83×101 1.69×101 5.06×101 4.14×10⁻³ 4.79×10⁻² $ ^{185}\text{Hg} $ 5.774 0.240 −0.016 8.52×10² 2.94×10² 7.73×10² 6.89×10⁻³ 7.27×10⁻² $ ^{177}\text{Tl} $ 7.067 0.129 −0.006 2.47×10⁻² 1.48×10⁻² 2.52×10⁻² 1.64×10⁻² 9.79×10⁻² $ ^{179}\text{Tl} $ 6.718 0.129 −0.006 2.30×10⁻¹ 2.37×10⁻¹ 4.16×10⁻¹ 2.64×10⁻² 1.67×10⁻¹ $ ^{181}\text{Tl} $ 6.322 0.140 −0.005 3.37×101 7.07×100 1.34×101 5.04×10⁻³ 3.54×10⁻² $ ^{191}\text{Pb} $ 5.450 −0.146 −0.015 6.14×10⁵ 1.87×10⁵ 3.59×10⁵ 5.13×10⁻³ 4.28×10⁻² $ ^{191}\text{Po} $ 7.501 0.011 0.000 2.89×10⁻² 1.04×10⁻² 8.71×10⁻³ 6.65×10⁻³ 2.32×10⁻² $ ^{193}\text{Po} $ 7.094 0.000 0.000 3.91×10⁻¹ 2.36×10⁻¹ 1.99×10⁻¹ 1.01×10⁻² 3.73×10⁻² $ ^{195}\text{Po} $ 6.750 0.000 0.000 4.96×100 4.17×100 3.35×100 1.28×10⁻² 4.71×10⁻² $ ^{197}\text{Po} $ 6.412 0.021 0.000 1.22×10² 8.92×101 7.27×101 9.94×10⁻³ 3.69×10⁻² $ ^{199}\text{Po} $ 6.074 0.032 0.000 2.74×10³ 2.51×10³ 2.05×10³ 1.10×10⁻² 4.72×10⁻² $ ^{201}\text{Po} $ 5.799 0.011 0.000 5.85×10⁴ 5.02×10⁴ 3.78×10⁴ 8.88×10⁻³ 3.83×10⁻² $ ^{205}\text{Po} $ 5.325 0.000 0.000 1.57×10⁷ 1.62×10⁷ 1.07×10⁷ 7.38×10⁻³ 3.59×10⁻² $ ^{207}\text{Po} $ 5.216 0.000 0.000 9.94×10⁷ 7.75×10⁷ 4.55×10⁷ 4.32×10⁻³ 2.25×10⁻² $ ^{213}\text{Po} $ 8.536 −0.011 0.000 3.72×10⁻⁶ 2.54×10⁻⁶ 1.66×10⁻⁶ 2.47×10⁻² 5.13×10⁻² $ ^{215}\text{Po} $ 7.526 0.000 0.000 1.78×10⁻³ 1.80×10⁻³ 1.32×10⁻³ 3.49×10⁻² 8.28×10⁻² $ ^{217}\text{Po} $ 6.662 0.000 0.000 1.57×100 1.74×100 1.42×100 3.64×10⁻² 9.77×10⁻² $ ^{219}\text{Po} $ 5.910 0.000 0.000 2.20×10³ 2.46×10³ 2.18×10³ 3.50×10⁻² 1.04×10⁻¹ $ ^{197}\text{At} $ 7.104 0.075 0.014 3.96×10⁻¹ 5.03×10⁻¹ 4.41×10⁻¹ 1.82×10⁻² 7.58×10⁻² $ ^{199}\text{At} $ 6.777 −0.052 0.013 7.69×100 8.61×100 7.11×100 1.43×10⁻² 5.97×10⁻² $ ^{201}\text{At} $ 6.473 −0.052 0.013 1.41×10² 1.41×10² 1.13×10² 1.12×10⁻² 4.93×10⁻² $ ^{203}\text{At} $ 6.210 −0.052 0.013 1.64×10³ 1.92×10³ 1.47×10³ 1.12×10⁻² 5.18×10⁻² $ ^{205}\text{At} $ 6.020 −0.052 0.013 1.61×10⁴ 1.50×10⁴ 1.06×10⁴ 7.38×10⁻³ 3.55×10⁻² $ ^{207}\text{At} $ 5.872 −0.042 0.001 7.58×10⁴ 8.60×10⁴ 5.27×10⁴ 7.20×10⁻³ 3.54×10⁻² $ ^{209}\text{At} $ 5.757 −0.042 0.001 5.01×10⁵ 3.80×10⁵ 1.90×10⁵ 3.59×10⁻³ 1.80×10⁻² $ ^{211}\text{At} $ 5.982 −0.021 0.000 6.21×10⁴ 4.65×10⁴ 1.66×10⁴ 2.34×10⁻³ 1.17×10⁻² $ ^{213}\text{At} $ 9.254 −0.011 0.000 1.26×10⁻⁷ 1.03×10⁻⁷ 6.28×10⁻⁸ 3.01×10⁻² 5.79×10⁻² $ ^{215}\text{At} $ 8.178 −0.010 0.012 1.00×10⁻⁴ 5.03×10⁻⁵ 3.50×10⁻⁵ 1.77×10⁻² 3.96×10⁻² $ ^{217}\text{At} $ 7.201 −0.010 0.012 3.26×10⁻² 5.03×10⁻² 3.96×10⁻² 5.19×10⁻² 1.33×10⁻¹ $ ^{219}\text{At} $ 6.324 −0.021 0.012 5.77×101 1.04×10² 9.09×101 5.76×10⁻² 1.67×10⁻¹ $ ^{195}\text{Rn} $ 7.690 −0.217 0.017 6.00×10⁻³ 8.39×10⁻³ 9.65×10⁻³ 2.35×10⁻² 1.18×10⁻¹ $ ^{197}\text{Rn} $ 7.411 −0.217 0.017 5.50×10⁻² 6.70×10⁻² 7.83×10⁻² 1.85×10⁻² 9.94×10⁻² $ ^{199}\text{Rn} $ 7.140 −0.207 0.015 6.28×10⁻¹ 6.07×10⁻¹ 6.88×10⁻¹ 1.31×10⁻² 7.28×10⁻² $ ^{201}\text{Rn} $ 6.861 0.085 0.003 9.15×100 1.02×101 9.00×100 1.33×10⁻² 6.19×10⁻² $ ^{203}\text{Rn} $ 6.630 0.075 0.002 6.87×101 8.69×101 7.17×101 1.31×10⁻² 6.20×10⁻² $ ^{207}\text{Rn} $ 6.251 −0.063 0.001 2.66×10³ 4.17×10³ 2.82×10³ 1.12×10⁻² 5.56×10⁻² $ ^{209}\text{Rn} $ 6.155 −0.052 0.001 1.02×10⁴ 1.34×10⁴ 7.56×10³ 7.26×10⁻³ 3.64×10⁻² $ ^{215}\text{Rn} $ 8.839 −0.011 0.000 2.30×10⁻⁶ 2.08×10⁻⁶ 1.45×10⁻⁶ 3.26×10⁻² 7.26×10⁻² $ ^{217}\text{Rn} $ 7.887 0.000 0.000 5.90×10⁻⁴ 7.93×10⁻⁴ 5.89×10⁻⁴ 4.63×10⁻² 1.11×10⁻¹ $ ^{201}\text{Fr} $ 7.516 −0.207 0.015 6.90×10⁻² 8.09×10⁻² 8.80×10⁻² 1.50×10⁻² 8.24×10⁻² $ ^{203}\text{Fr} $ 7.260 0.096 0.003 5.78×10⁻¹ 9.32×10⁻¹ 8.25×10⁻¹ 1.80×10⁻² 8.73×10⁻² $ ^{205}\text{Fr} $ 7.055 0.086 −0.009 3.96×100 5.61×100 4.50×100 1.35×10⁻² 6.55×10⁻² $ ^{207}\text{Fr} $ 6.900 −0.083 0.014 1.56×101 2.36×101 1.70×101 1.20×10⁻² 5.92×10⁻² $ ^{209}\text{Fr} $ 6.778 −0.073 0.002 5.67×101 8.25×101 5.07×101 9.22×10⁻³ 4.54×10⁻² $ ^{211}\text{Fr} $ 6.663 −0.053 −0.011 2.14×10² 3.01×10² 1.48×10² 6.66×10⁻³ 3.28×10⁻² $ ^{213}\text{Fr} $ 6.905 0.011 0.000 3.49×101 5.12×101 1.67×101 4.59×10⁻³ 2.10×10⁻² $ ^{215}\text{Fr} $ 9.540 0.000 0.000 8.60×10⁻⁸ 1.01×10⁻⁷ 6.51×10⁻⁸ 4.34×10⁻² 8.82×10⁻² $ ^{217}\text{Fr} $ 8.469 −0.011 0.000 2.20×10⁻⁵ 4.07×10⁻⁵ 3.09×10⁻⁵ 6.52×10⁻² 1.59×10⁻¹ $ ^{219}\text{Fr} $ 7.449 0.011 0.000 2.02×10⁻² 4.51×10⁻² 3.84×10⁻² 7.50×10⁻² 2.08×10⁻¹ $ ^{201}\text{Ra} $ 8.002 −0.227 0.019 8.00×10⁻³ 5.09×10⁻³ 5.90×10⁻³ 8.64×10⁻³ 4.89×10⁻² $ ^{203}\text{Ra} $ 7.730 −0.217 0.017 3.10×10⁻² 3.85×10⁻² 4.24×10⁻² 1.49×10⁻² 8.61×10⁻² $ ^{205}\text{Ra} $ 7.486 −0.207 0.004 2.10×10⁻¹ 2.75×10⁻¹ 2.80×10⁻¹ 1.36×10⁻² 7.93×10⁻² $ ^{207}\text{Ra} $ 7.270 −0.115 0.017 1.40×100 2.32×100 1.88×100 1.46×10⁻² 7.55×10⁻² $ ^{209}\text{Ra} $ 7.143 −0.104 0.016 4.83×100 7.69×100 5.47×100 1.14×10⁻² 5.95×10⁻² $ ^{217}\text{Ra} $ 9.161 −0.010 0.012 1.60×10⁻⁶ 1.55×10⁻⁶ 1.11×10⁻⁶ 3.48×10⁻² 7.96×10⁻² $ ^{205}\text{Ac} $ 8.090 −0.217 0.006 2.00×10⁻² 7.44×10⁻³ 7.85×10⁻³ 4.16×10⁻³ 2.40×10⁻² $ ^{207}\text{Ac} $ 7.840 −0.207 −0.007 2.70×10⁻² 5.00×10⁻² 4.77×10⁻² 1.77×10⁻² 1.02×10⁻¹ $ ^{209}\text{Ac} $ 7.730 −0.125 0.018 8.70×10⁻² 1.65×10⁻¹ 1.28×10⁻¹ 1.51×10⁻² 7.98×10⁻² $ ^{211}\text{Ac} $ 7.620 −0.115 0.017 2.10×10⁻¹ 4.52×10⁻¹ 2.96×10⁻¹ 1.36×10⁻² 7.16×10⁻² $ ^{213}\text{Ac} $ 7.501 −0.084 0.002 7.38×10⁻¹ 1.56×100 7.83×10⁻¹ 9.97×10⁻³ 5.03×10⁻² $ ^{215}\text{Ac} $ 7.746 0.011 0.000 1.71×10⁻¹ 3.82×10⁻¹ 1.29×10⁻¹ 6.98×10⁻³ 3.31×10⁻² $ ^{217}\text{Ac} $ 9.832 0.000 0.000 6.90×10⁻⁸ 9.64×10⁻⁸ 6.59×10⁻⁸ 5.15×10⁻² 1.11×10⁻¹ $ ^{219}\text{Ac} $ 8.830 0.000 0.000 1.18×10⁻⁵ 2.20×10⁻⁵ 1.69×10⁻⁵ 6.57×10⁻² 1.62×10⁻¹ $ ^{227}\text{Ac} $ 5.042 0.132 0.083 1.04×10¹¹ 1.39×10¹⁰ 3.46×10¹⁰ 3.83×10⁻³ 3.29×10⁻² $ ^{213}\text{Th} $ 7.837 −0.104 0.004 1.44×10⁻¹ 2.49×10⁻¹ 1.49×10⁻¹ 9.56×10⁻³ 5.07×10⁻² $ ^{219}\text{Th} $ 9.510 −0.021 0.012 1.05×10⁻⁶ 1.01×10⁻⁶ 7.49×10⁻⁷ 3.48×10⁻² 8.19×10⁻² Table 1. Calculated α-decay half-lives (in seconds) and α-preformation factors of isotopic chains with
$ 78 \le Z \le 90 $ . The α-decay energies$ Q_\alpha $ , the quadrupole and hexadecapole deformation parameters$ \beta_2 $ and$ \beta_4 $ of the daughter nucleus, and the experimental partial α-decay half-lives$ T_{1/2}^{\text{exp}} $ of the favored transitions are listed in the second to fifth columns. The α-decay half-lives calculated with the DDFPs using the Migdal and CDM3Y6 interactions are presented in the sixth and seventh columns. The last two columns show the$ P_\alpha $ factors calculated with Eq. (14) from both interactions.Despite the differences in absolute magnitudes, the systematic trends of
$ P_\alpha $ obtained with all three α-nucleus potentials are highly consistent. Typically, a sharp increase is observed beyond$ N = 126 $ , reflecting pronounced neutron shell effects. Furthermore, for the isotopic chains on both sides of$ N = 126 $ , the$ P_\alpha $ values approximately follow a linear trend with neutron number. This linear trend is particularly prominent in the region where N is slightly less than 126. However, in the SLy4 results, noticeable fluctuations appear for specific nuclei, such as 197Rn ($ N=111 $ ) and 205Rn ($ N=117 $ ), within their respective isotopic chains. For$ N \gt 126 $ , the$ P_\alpha $ values from the CDM3Y6 interaction exhibit a more linear variation with N than those from the Migdal interaction. The latter tends to saturate more rapidly as N increases. These characteristics are consistent with the$ P_\alpha $ systematics observed in our previous studies of even-even nuclei [41, 48]. Overall, the successful reproduction of the known$ P_\alpha $ systematics for odd-A nuclei demonstrates the reliability of these theoretical approaches across different NN interactions.We then compare the accuracy of the DDFPs in calculating the α-decay half-lives using the two NN interactions. When performing half-life calculations,
$ P_\alpha $ must be appropriately assumed in the decay model as a theoretical input. Since the$ P_\alpha $ factor near shell closures varies approximately linearly with the valence nucleon number, we adopted the simple treatment described in Ref. [46]. The$ P_\alpha $ value is approximated by the following expression, which depends on the valence neutron number:$ P_{\alpha}^{{\rm{inp}}}=a\left(N-N_{0}\right)+b . $
(15) In the above expression,
$ N_0 $ is the nearest neutron magic number less than N. The parameters a and b are determined by fitting the expression to the empirical$ P_\alpha $ factors extracted using Eq. (14). For the α-nucleus potential under the CDM3Y6 interaction, we obtain$ a= (-1.73\pm0.302)\times10^{-3} $ ,$ b=(1.20\pm0.0844)\times10^{-1} $ , along with the covariance matrix,$M_{c}^{\text{CDM3Y6}}=10^{-7} \times\left[\begin{array}{*{20}{c}} {0.912} & {-22.2} \\ {-22.2} & {712} \end{array}\right]. $
For the α-nucleus potential under the Migdal interaction, we obtain
$ a=(-8.04\pm0.893)\times10^{-4} $ ,$ b=(3.85\pm 0.250)\times10^{-2} $ , along with the covariance matrix,$M_{c}^{\text{Migdal}}=10^{-8} \times\left[\begin{array}{*{20}{c}} {0.798} & {-19.4} \\{-19.4 }& {624 } \end{array}\right].$
Figure 2 illustrates the empirical
$ P_\alpha $ values described by Eq. (15). As shown, Eq. (15) approximately captures the overall trend of$ P_\alpha $ as a function of the valence neutron number. This simple treatment provides a useful basis for evaluating the accuracy of the α-nucleus potential in half-life calculations. However, to accurately describe$ P_\alpha $ for a specific nuclide, the empirical formula often requires additional terms that account for other structural effects, such as the dependence on the valence proton number [63−65], the angular momentum of the α particle [65, 66], and nuclear deformation [67, 68].
Figure 2. (color online) The distribution of
$ P_\alpha $ extracted using the DDFPs based on the CDM3Y6 and the Migdal interactions. The red line shows$ P_\alpha^{\text{inp}} $ from Eq. (15) fitted to the data.Using the results of Eq. (15) as input for the half-life calculations, we obtain the deviations between the theoretical and experimental α-decay half-lives for the CDM3Y6 and Migdal interactions, as shown in Fig. 3. On a logarithmic scale, the deviations are generally confined between –0.5 and 0.5, corresponding to a theoretical-to-experimental ratio predominately in the range 0.31 to 3.16. This indicates that the α-nucleus potentials derived from both interactions can reasonably reproduce the α-decay half-lives of these odd-A nuclei. To quantify the overall accuracy, we compute the root-mean-square (RMS) deviation factor
Figure 3. (color online) Deviations between experimental and theoretical α-decay half-lives calculated using the DDFPs based on the CDM3Y6 and the Migdal interactions. For most nuclei, the theoretical results agree with the experimental data within a factor of 0.31−3.16.
$ \sigma=\sqrt{\frac{1}{n} \sum\limits_{i=1}^{n}\left({\lg T_{{1 / 2}, i}^{\exp }}-{\lg T_{{1 / 2}, i}^{{\rm{cal}}}}\right)^{2}}, $
where n is the total number of nuclides considered.
The σ values for the CDM3Y6 and Migdal interactions are 0.212 and 0.250, respectively. This indicates that the two potentials achieve comparable accuracy in half-life calculations, with the CDM3Y6 potential showing only a slight advantage. Compared to the previous result
$ \sigma=0.1820 $ for favored decays of even-even nuclei [46], the σ value for odd-A nuclei obtained with the Migdal interaction is 37.4% larger. This increase is reasonable because the decay schemes of odd-A nuclei are more complex and their experimental measurements generally carry larger uncertainties than those of even-even nuclei. Moreover, the deviations for 181Tl, 183Hg, and 227Ac using the Migdal interaction significantly exceed 0.5, while only two nuclei (191Po and 211At) in the CDM3Y6 case slightly surpass this threshold. To account for the experimental uncertainties in α-decay energy, half-life, and branching ratio (Table 2), we include error bars for these specific nuclei in Fig. 3. Even after considering these uncertainties, the half-life deviations remain larger than 0.5 for all nuclei except 191Po. Since the sets of nuclei with large deviations differ between the two interactions, it suggests that these discrepancies mainly arise from the approximation of the empirical$ P_\alpha $ formula and from intrinsic model uncertainties.Nuclide $ Q_\alpha $ /keV$ T_{1/2} $ $ B_1 $ $ B_2 $ $ T_{1/2}^{\text{exp}} $ $ ^{191} \text{Po} $ $ 7501 ^ {+ 11} _ {-11} $ $ 22 ^ {+ 1} _ {- 1}\text{ ms} $ $ 0.99 ^ {+ 0.01} _ {- 0.1} $ $ 0.77 ^ {+ 0.025} _ {- 0.025} $ $ 28.86 ^ {+ 5.83} _ {- 2.45}\text{ ms} $ $ ^{211} \text{At} $ $ 5982.4 ^ {+ 1.3} _ {-1.3} $ $ 7.214 ^ {+ 0.007} _ {- 0.007}\text{ h} $ $ 0.4180 ^ {+ 0.0008} _ {- 0.0008} $ 1 $ 17.26 ^ {+ 0.05} _ {- 0.05}\text{ h} $ $ ^{181} \text{Tl} $ $ 6322 ^ {+ 6} _ {-6} $ $ 2.9 ^ {+ 0.1} _ {- 0.1}\text{ s} $ $ 0.086 ^ {+ 0.006} _ {- 0.006} $ 1 $ 33.72 ^ {+ 3.78} _ {- 3.29}\text{ s} $ $ ^{183} \text{Hg} $ $ 6039 ^ {+ 4} _ {-4} $ $ 9.4 ^ {+ 0.7} _ {- 0.7}\text{ s} $ $ 0.117 ^ {+ 0.02} _ {- 0.02} $ $ 0.91 ^ {+ 0.09} _ {- 0.17} $ $ 88.29 ^ {+ 52.42} _ {- 24.79}\text{ s} $ $ ^{227} \text{Ac} $ $ 5042.19 ^ {+ 0.14} _ {-0.14} $ $ 21.772 ^ {+ 0.003} _ {- 0.003}\text{ y} $ $ 0.01380 ^ {+ 0.00004} _ {- 0.00004} $ $ 0.477 ^ {+ 0.01} _ {- 0.01} $ $ 3307.51 ^ {+ 81.11} _ {- 77.73}\text{ y} $ Table 2. Uncertainties in the experimental α-decay energies
$ Q_\alpha $ , total half-lives$ T_{1/2} $ , branching ratio for α decay among the various decay modes$ B_1 $ , branching ratio for the ground-state to ground-state α transition$ B_2 $ , and derived experimental partial α-decay half-lives$ T_{1/2}^{\text{exp}} $ [69].After discussing the favored α-decay properties, we attempt to analyze the reliability of the DDFP in the unfavored α decays of odd-A nuclei. A typical example is the α decays of the
$ N=127 $ isotonic chain near$ Z=82 $ [70]. Xu et al. previously investigated their half-lives using the cluster model with a phenomenological cosh-type nuclear potential. They found that the ground-state to ground-state α decays of these nuclei all correspond to the same kind of unfavored transitions with an angular momentum transfer of$ L=5 $ . In these cases, the$ P_\alpha $ values show a clear linear increase with the valence proton number. Therefore, they adopted the following Z-dependent formula to describe the$ P_\alpha $ factor.$ P_{\alpha} \approx c \times(Z-82) , $
(16) where c is a constant. Instead of treating
$ P_\alpha $ as a nucleus-independent constant, the use of this expression yields better agreement between calculated and experimental α-decay half-lives. This improved agreement demonstrates that shell effects are significant not only in the$ P_\alpha $ systematics of favored transitions, but also in unfavored transitions.As a test, we first attempt to reproduce the above conclusion using the DDFP model. Fig. 4 shows the variation of
$ P_\alpha $ for unfavored decays of odd-A nuclei as a function of proton number. For the$ N=127 $ isotonic chains, the$ P_\alpha $ values from both NN interactions follow an approximately linear trend with the valence proton number, consistent with the conclusion of Ref. [70]. The most significant difference between the two potentials is that the$ P_\alpha $ values from the Migdal interaction are systematically smaller than the CDM3Y6 results by a factor of about 5. In addition to the$ N=127 $ isotonic chain, we discover that the$ N=125 $ isotonic chain also has similar decay properties. Specifically, experimental data show that the ground-state to ground-state α decays of the$ N=125 $ chain share the same unfavored character ($ L=2 $ ). In parallel, our calculations indicate that the$ P_\alpha $ factors along this$ N=125 $ chain also exhibit a linear increase with the valence proton number, as shown in Fig. 4.
Figure 4.
$ P_\alpha $ in unfavored decays of the$ N=125 $ and$ N=127 $ isotonic chains. The upper and lower subfigures show results obtained with the CDM3Y6 and the Migdal interactions, respectively.Our previous study on the
$ P_\alpha $ systematics of even-even nuclei demonstrated that near the$ Z=82 $ and$ N=126 $ doubly magic shell closures, the$ P_\alpha $ variation in favored transitions is mainly dominated by changes in pairing interactions [33]. To understand the results of the unfavored decays shown in Fig. 4, we also investigated the correlation between$ P_\alpha $ and the proton pairing gap$ \Delta_{p} $ in this region.$ \Delta_{p} $ can be calculated using the empirical three-point formula [71],$\begin{aligned}[b] \Delta_{p}(Z, N)=\frac{(-1)^{Z}}{2}\times[B(Z, N)-2 B(Z-1, N)+B(Z-2, N)] \end{aligned} .$
(17) We extracted the
$ \Delta_p $ values from the experimental binding energies, and the results are listed in Table 3. Figs. 5 and 6 display$ P_\alpha $ as a function of$ \Delta_p $ for unfavored and favored decays along the$ N=125,127 $ and$ N=124,126,128 $ isotonic chains, respectively. It can be seen that$ P_\alpha $ increases approximately linearly with$ \Delta_p $ along all these isotonic chains, indicating a strong positive correlation between these two quantities.$ \Delta_p $ reflects the strength of the proton pairing correlation within nuclei, which, together with neutron pairing and proton–neutron (PN) correlations, contributes to the formation of α clusters. When the spatial overlap between proton and neutron orbitals is small, such as in the vicinity of the$ Z=82 $ ,$ N=126 $ shell closures, the variation of PN correlations is suppressed. Consequently, the change in the pairing interaction strength dominates the variation of$ P_\alpha $ . The findings in Figs. 5 and 6 confirm that this interpretation holds for both favored and unfavored decays, thereby explaining the behavior observed in Fig. 4. Thus, Fig. 4 demonstrates the interplay between shell effects from the mean field and the proton pairing correlation. The$ P_\alpha $ factor attains a local minimum at the shell closure as a manifestation of shell effects; meanwhile, it increases almost linearly above the closure as the number of valence proton pairs increases. This indicates that the$ P_\alpha $ empirical formula, which depends on the valence nucleon number, provides a relatively good approximation for half-life calculations near shell closures. The DDFP models with the CDM3Y6 and Migdal interactions both reasonably reproduce this structural pattern of$ P_\alpha $ near$ Z=82 $ .Nuclide $ Q_\alpha $ /MeV$ \beta_2 $ $ \beta_4 $ $ T_{1/2}^{\text{exp}} $ L $ P_\alpha $ (Migdal)$ P_\alpha $ (CDM3Y6)$ \Delta_p $ /MeV211Po 7.595 0.000 0.000 5.22×10⁻¹ 5 1.02×10⁻³ 4.43×10⁻³ 0.232 213Rn 8.244 0.000 0.000 1.99×10⁻² 5 1.67×10⁻³ 7.17×10⁻³ 0.436 215Ra 8.864 0.000 0.000 1.73×10⁻³ 5 2.00×10⁻³ 8.93×10⁻³ 0.623 217Th 9.435 0.000 0.000 2.66×10⁻⁴ 5 2.24×10⁻³ 1.02×10⁻² 0.780 209Po 4.979 −0.010 −0.012 2.71×10¹⁰ 2 6.01×10⁻⁴ 3.42×10⁻³ 0.539 211Rn 5.965 0.021 0.000 5.64×10⁵ 2 1.56×10⁻³ 8.67×10⁻³ 0.589 213Ra 6.861 −0.063 −0.010 4.50×101 2 2.18×10⁻³ 1.23×10⁻² 0.688 215Th 7.665 −0.073 −0.010 3.03×100 2 2.70×10⁻³ 1.53×10⁻² 0.799 Table 3. The α-preformation factors and proton pairing gaps for the
$ N=125,127 $ isotonic chains in unfavored α decays are presented. Columns 2–6 list the experimental α-decay energy$ Q_\alpha $ , the quadrupole deformation parameter$ \beta_2 $ of the daughter nucleus, the hexadecapole deformation parameter$ \beta_4 $ , the experimental partial α-decay half-life$ {T}_{1/2}^{\text{exp}} $ (in seconds), and the angular momentum L of the α cluster, respectively. Columns 7 and 8 present the$ P_\alpha $ factors extracted from the DDFPs using the Migdal and CDM3Y6 interactions, respectively. Column 9 lists the proton pairing gap$ \Delta_p $ calculated from Eq. (17).
Figure 5. (color online)
$ P_\alpha $ in unfavored decays of the$ N= $ $ 125,127 $ isotonic chains, as a function of the proton pairing gap$ \Delta_p $ . The upper and lower subfigures show results obtained with the CDM3Y6 and the Migdal interactions, respectively.
Figure 6. (color online)
$ P_\alpha $ in favored decays of the$ N=124, $ $ 126,128 $ isotonic chains, as a function of the proton pairing gap$ \Delta_p $ . The upper and lower subfigures show results obtained with the CDM3Y6 and the Migdal interactions, respectively.In order to understand the systematic difference in the magnitude of
$ P_\alpha $ derived from the CDM3Y6 and Migdal interactions, we take the 207Po ($ L=0 $ ) and 211Po ($ L=5 $ ) systems as examples and compare their α-nucleus potentials as well as the corresponding α-cluster bound state wavefunctions$ \varphi_0 $ from the two types of NN interactions. As shown in Fig. 7, one can observe that outside the Coulomb barrier, the curves of the two α-nucleus potentials almost overlap. The discrepancies in the α-nucleus potentials mainly appear near the location of the second classical turning point$ R_{2} $ and inside the core region. The position of$ R_{2} $ has a more pronounced effect on the calculation of empirical$ P_\alpha $ . It can be seen from Fig. 7 that, for the same decay system, the α-nucleus potentials obtained with the CDM3Y6 interaction have a smaller$ R_{2} $ than those obtained with the Migdal interaction. Since the barrier heights are nearly equal, the systematic difference in$ R_2 $ leads to a higher tunneling probability for the α cluster in the Migdal case, consequently resulting in a smaller$ P_\alpha $ according to Eq. (14). This feature is observed in both favored and unfavored α decays, reflecting the systematic influence of different NN interactions. As a result of the potential geometry, the α-cluster wavefunction from the CDM3Y6 interaction exhibits a distinct oscillation. It displays multiple peaks and nodes, with the largest peak located near the nuclear surface. In contrast, the wavefunction derived from the Migdal interaction exhibits nearly zero amplitude inside the nucleus, and only a single peak appears at the nuclear surface.
Figure 7. (color online) α-nucleus potentials and α-cluster wavefunctions for the 207Po (
$ L=0 $ ) and 211Po ($ L=5 $ ) systems. The DDFPs with the CDM3Y6 and the Migdal interactions have similar barrier heights, whereas their geometries differ markedly. The Migdal interaction yields a larger second classical turning point$ R_2 $ , which accounts for the significant difference in the$ P_\alpha $ values between the two potentials.The different behaviors of
$ \varphi_0 $ are attributed to the different treatments of Pauli blocking in the two potentials. For the DDFP with the CDM3Y6 interaction, the Pauli blocking effect is mainly introduced by applying the Wildermuth condition [72]. This condition imposes a constraint on the total harmonic oscillator quanta carried by the nucleons constituting the α cluster and the daughter nucleus, such that nucleons from the α cluster can only occupy the orbitals above those filled by the core nucleons. Consequently, the wavefunction has multiple nodes inside the nucleus, and the largest peak at the surface indicates that the nucleons near the Fermi surface play a dominant role in the formation of the α cluster. For the DDFP with the Migdal interaction, because the Pauli blocking effect manifests as a significant repulsive potential barrier within the nucleus, the determination of the α-nucleus potential does not rely on the Wildermuth condition. As shown in Fig. 7, due to the medium effect, this repulsive potential begins to rise sharply from the critical radius$ R_{c} $ towards the interior of the nucleus. It therefore prevents the formation of α clusters in regions above the critical density. Specifically, the α-cluster wavefunction exhibits a nearly vanishing amplitude in the inner region of the nucleus.In order to further understand the differences between the two DDFPs, we also investigate how the input density distribution of the daughter nucleus influences the potential geometry and the resulting
$ P_\alpha $ factor. Taking 207Po as an example, instead of adopting the same half-density radius$ R_d $ = 6.61 fm and diffuseness a = 0.54 fm for both the proton and neutron density distributions of the daughter nucleus, we now distinguish these two parameters ($ R_{d, \tau=p, n} $ and$ a_{\tau=p, n} $ ) for proton and neutron distributions, respectively. These parameters can be calculated using empirical formulas fitted to the density profiles from self-consistent Skyrme Hartree-Fock calculations [73], which yield$ R_{d, p} $ = 6.67 fm,$ R_{d, n} $ = 6.77 fm,$ a_p $ = 0.50 fm, and$ a_n $ = 0.55 fm.Figure 8 presents a comparison of the DDFPs generated using the refined and the original density profiles. It can be seen that the refined density profiles result in only minor differences in the α-nucleus potentials and the corresponding α-cluster wavefunctions for both the CDM3Y6 and Migdal interactions. While the Coulomb barrier heights remain almost unchanged, the second turning point
$ R_2 $ increases by 0.04 fm for the DDFP-CDM3Y6 and by 0.05 fm for the DDFP-Migdal, which results in reductions of only 13% and 16% in the extracted$ P_\alpha $ factors, respectively. These results demonstrate that the sensitivity to the input density distribution parameters is comparable for both DDFPs. As a further validation, the results shown in Fig. 8 justify the traditional treatment of$ R_d $ and a, implying that the original parameters serve as a robust approximation for the density distributions of the involved nuclei.
Figure 8. (color online) Sensitivity of the α-nucleus potentials to the input parameters of the density distributions of the daughter nucleus. The potential V, the second classical turning point
$ R_2 $ , and the α-cluster wavefunction$ \varphi_0 $ denoted by the superscript (1) are obtained by assuming the same half-density radius$ R_d $ and diffuseness a for both the proton and neutron density distributions. In contrast, the superscript (2) denotes the results obtained using distinct parameters for the proton and neutron distributions ($ R_{d, \tau=p, n} $ and$ a_{\tau=p, n} $ ). -
To evaluate the performance of the DDFPs using the CDM3Y6 and Migdal interactions, we focus on the α-decay properties of odd-A nuclei in the range
$ 78 \le Z \le 90 $ . We note that only ground-state to ground-state (g.s. to g.s.) transitions are considered in this study. This restriction arises because the current DDFP model requires deformation parameters as input for the daughter nuclei, and systematic theoretical descriptions of nuclear deformation—such as the adopted FRDM calculations [61]—are currently only available for ground states. In total, 87 nuclei in this region are investigated. Among these, 79 nuclei—excluding those in the$ N=125 $ and$ N=127 $ isotonic chains—exhibit favored decays from ground-state to ground-state, whereas the remaining 8 nuclei in these chains display unfavored decays.We first compare the
$ P_\alpha $ factors calculated using Eq. (14) for the two interactions. For reference, the results from the Hamiltonian energy-density approach based on the SLy4 Skyrme interaction [62] are also included for comparison. As shown in Fig. 1 and Table 1, the values of$ \lg P_\alpha $ obtained with the CDM3Y6 interaction range from –2.0 to –0.6, while those obtained with the Migdal interaction range from –2.7 to –1.1. The CDM3Y6 values are systematically larger, with an average ratio of 5 and individual ratios ranging from 1.9 to 11.6. Notably, the magnitudes of$ P_\alpha $ derived from the SLy4 Skyrme interaction generally fall between those of the other two interactions. They align more closely with the CDM3Y6 results, with differences below a factor of 2 for most nuclei.
Figure 1. (color online)
$ P_\alpha $ variation versus neutron number. The$ P_\alpha $ factors for panels (a) and (b) are extracted using DDFPs based on the CDM3Y6 and Migdal interactions, respectively. The$ P_\alpha $ factors in (c) are extracted using the Hamiltonian energy-density approach with the SLy4 Skyrme interaction [62].Nuclide $ Q_\alpha $ /MeV$ \beta_2 $ $ \beta_4 $ $ T_{1/2}^{\text{exp}} $ $ T_{1/2}^{\text{cal}}{\rm{(Migdal)}} $ $ T_{1/2}^{\text{cal}}{\rm{(CDM3Y6)}} $ $ P_\alpha $ (Migdal)$ P_\alpha $ (CDM3Y6)$ ^{169}\text{Pt} $ 6.858 0.140 −0.005 6.99×10⁻³ 4.84×10⁻³ 7.41×10⁻³ 2.17×10⁻² 1.11×10⁻¹ $ ^{171}\text{Pt} $ 6.607 0.162 −0.015 5.06×10⁻² 3.17×10⁻² 5.27×10⁻² 1.86×10⁻² 1.05×10⁻¹ $ ^{173}\text{Pt} $ 6.350 0.173 −0.013 4.63×10⁻¹ 2.56×10⁻¹ 4.60×10⁻¹ 1.55×10⁻² 9.69×10⁻² $ ^{177}\text{Pt} $ 5.643 0.206 −0.009 2.10×10² 1.76×10² 3.93×10² 2.08×10⁻² 1.69×10⁻¹ $ ^{181}\text{Pt} $ 5.150 0.218 −0.019 7.30×10⁴ 4.30×10⁴ 1.03×10⁵ 1.27×10⁻² 1.18×10⁻¹ $ ^{183}\text{Pt} $ 4.823 0.219 −0.031 4.06×10⁶ 2.87×10⁶ 6.91×10⁶ 1.41×10⁻² 1.36×10⁻¹ $ ^{173}\text{Au} $ 6.836 0.151 −0.003 2.66×10⁻² 1.31×10⁻² 2.19×10⁻² 1.42×10⁻² 8.17×10⁻² $ ^{175}\text{Au} $ 6.583 0.162 −0.015 2.23×10⁻¹ 9.62×10⁻² 1.69×10⁻¹ 1.17×10⁻² 7.42×10⁻² $ ^{183}\text{Au} $ 5.466 0.207 −0.021 7.88×10³ 3.54×10³ 8.05×10³ 9.36×10⁻³ 8.37×10⁻² $ ^{185}\text{Au} $ 5.180 0.207 −0.033 9.81×10⁴ 1.03×10⁵ 2.35×10⁵ 2.02×10⁻² 1.88×10⁻¹ $ ^{173}\text{Hg} $ 7.380 0.129 0.007 7.00×10⁻⁴ 6.15×10⁻⁴ 9.61×10⁻⁴ 2.61×10⁻² 1.39×10⁻¹ $ ^{175}\text{Hg} $ 7.072 0.140 0.007 1.08×10⁻² 5.41×10⁻³ 9.02×10⁻³ 1.41×10⁻² 8.14×10⁻² $ ^{179}\text{Hg} $ 6.340 0.173 −0.001 1.98×100 1.87×100 3.81×100 2.34×10⁻² 1.74×10⁻¹ $ ^{183}\text{Hg} $ 6.039 0.250 0.011 8.83×101 1.69×101 5.06×101 4.14×10⁻³ 4.79×10⁻² $ ^{185}\text{Hg} $ 5.774 0.240 −0.016 8.52×10² 2.94×10² 7.73×10² 6.89×10⁻³ 7.27×10⁻² $ ^{177}\text{Tl} $ 7.067 0.129 −0.006 2.47×10⁻² 1.48×10⁻² 2.52×10⁻² 1.64×10⁻² 9.79×10⁻² $ ^{179}\text{Tl} $ 6.718 0.129 −0.006 2.30×10⁻¹ 2.37×10⁻¹ 4.16×10⁻¹ 2.64×10⁻² 1.67×10⁻¹ $ ^{181}\text{Tl} $ 6.322 0.140 −0.005 3.37×101 7.07×100 1.34×101 5.04×10⁻³ 3.54×10⁻² $ ^{191}\text{Pb} $ 5.450 −0.146 −0.015 6.14×10⁵ 1.87×10⁵ 3.59×10⁵ 5.13×10⁻³ 4.28×10⁻² $ ^{191}\text{Po} $ 7.501 0.011 0.000 2.89×10⁻² 1.04×10⁻² 8.71×10⁻³ 6.65×10⁻³ 2.32×10⁻² $ ^{193}\text{Po} $ 7.094 0.000 0.000 3.91×10⁻¹ 2.36×10⁻¹ 1.99×10⁻¹ 1.01×10⁻² 3.73×10⁻² $ ^{195}\text{Po} $ 6.750 0.000 0.000 4.96×100 4.17×100 3.35×100 1.28×10⁻² 4.71×10⁻² $ ^{197}\text{Po} $ 6.412 0.021 0.000 1.22×10² 8.92×101 7.27×101 9.94×10⁻³ 3.69×10⁻² $ ^{199}\text{Po} $ 6.074 0.032 0.000 2.74×10³ 2.51×10³ 2.05×10³ 1.10×10⁻² 4.72×10⁻² $ ^{201}\text{Po} $ 5.799 0.011 0.000 5.85×10⁴ 5.02×10⁴ 3.78×10⁴ 8.88×10⁻³ 3.83×10⁻² $ ^{205}\text{Po} $ 5.325 0.000 0.000 1.57×10⁷ 1.62×10⁷ 1.07×10⁷ 7.38×10⁻³ 3.59×10⁻² $ ^{207}\text{Po} $ 5.216 0.000 0.000 9.94×10⁷ 7.75×10⁷ 4.55×10⁷ 4.32×10⁻³ 2.25×10⁻² $ ^{213}\text{Po} $ 8.536 −0.011 0.000 3.72×10⁻⁶ 2.54×10⁻⁶ 1.66×10⁻⁶ 2.47×10⁻² 5.13×10⁻² $ ^{215}\text{Po} $ 7.526 0.000 0.000 1.78×10⁻³ 1.80×10⁻³ 1.32×10⁻³ 3.49×10⁻² 8.28×10⁻² $ ^{217}\text{Po} $ 6.662 0.000 0.000 1.57×100 1.74×100 1.42×100 3.64×10⁻² 9.77×10⁻² $ ^{219}\text{Po} $ 5.910 0.000 0.000 2.20×10³ 2.46×10³ 2.18×10³ 3.50×10⁻² 1.04×10⁻¹ $ ^{197}\text{At} $ 7.104 0.075 0.014 3.96×10⁻¹ 5.03×10⁻¹ 4.41×10⁻¹ 1.82×10⁻² 7.58×10⁻² $ ^{199}\text{At} $ 6.777 −0.052 0.013 7.69×100 8.61×100 7.11×100 1.43×10⁻² 5.97×10⁻² $ ^{201}\text{At} $ 6.473 −0.052 0.013 1.41×10² 1.41×10² 1.13×10² 1.12×10⁻² 4.93×10⁻² $ ^{203}\text{At} $ 6.210 −0.052 0.013 1.64×10³ 1.92×10³ 1.47×10³ 1.12×10⁻² 5.18×10⁻² $ ^{205}\text{At} $ 6.020 −0.052 0.013 1.61×10⁴ 1.50×10⁴ 1.06×10⁴ 7.38×10⁻³ 3.55×10⁻² $ ^{207}\text{At} $ 5.872 −0.042 0.001 7.58×10⁴ 8.60×10⁴ 5.27×10⁴ 7.20×10⁻³ 3.54×10⁻² $ ^{209}\text{At} $ 5.757 −0.042 0.001 5.01×10⁵ 3.80×10⁵ 1.90×10⁵ 3.59×10⁻³ 1.80×10⁻² $ ^{211}\text{At} $ 5.982 −0.021 0.000 6.21×10⁴ 4.65×10⁴ 1.66×10⁴ 2.34×10⁻³ 1.17×10⁻² $ ^{213}\text{At} $ 9.254 −0.011 0.000 1.26×10⁻⁷ 1.03×10⁻⁷ 6.28×10⁻⁸ 3.01×10⁻² 5.79×10⁻² $ ^{215}\text{At} $ 8.178 −0.010 0.012 1.00×10⁻⁴ 5.03×10⁻⁵ 3.50×10⁻⁵ 1.77×10⁻² 3.96×10⁻² $ ^{217}\text{At} $ 7.201 −0.010 0.012 3.26×10⁻² 5.03×10⁻² 3.96×10⁻² 5.19×10⁻² 1.33×10⁻¹ $ ^{219}\text{At} $ 6.324 −0.021 0.012 5.77×101 1.04×10² 9.09×101 5.76×10⁻² 1.67×10⁻¹ $ ^{195}\text{Rn} $ 7.690 −0.217 0.017 6.00×10⁻³ 8.39×10⁻³ 9.65×10⁻³ 2.35×10⁻² 1.18×10⁻¹ $ ^{197}\text{Rn} $ 7.411 −0.217 0.017 5.50×10⁻² 6.70×10⁻² 7.83×10⁻² 1.85×10⁻² 9.94×10⁻² $ ^{199}\text{Rn} $ 7.140 −0.207 0.015 6.28×10⁻¹ 6.07×10⁻¹ 6.88×10⁻¹ 1.31×10⁻² 7.28×10⁻² $ ^{201}\text{Rn} $ 6.861 0.085 0.003 9.15×100 1.02×101 9.00×100 1.33×10⁻² 6.19×10⁻² $ ^{203}\text{Rn} $ 6.630 0.075 0.002 6.87×101 8.69×101 7.17×101 1.31×10⁻² 6.20×10⁻² $ ^{207}\text{Rn} $ 6.251 −0.063 0.001 2.66×10³ 4.17×10³ 2.82×10³ 1.12×10⁻² 5.56×10⁻² $ ^{209}\text{Rn} $ 6.155 −0.052 0.001 1.02×10⁴ 1.34×10⁴ 7.56×10³ 7.26×10⁻³ 3.64×10⁻² $ ^{215}\text{Rn} $ 8.839 −0.011 0.000 2.30×10⁻⁶ 2.08×10⁻⁶ 1.45×10⁻⁶ 3.26×10⁻² 7.26×10⁻² $ ^{217}\text{Rn} $ 7.887 0.000 0.000 5.90×10⁻⁴ 7.93×10⁻⁴ 5.89×10⁻⁴ 4.63×10⁻² 1.11×10⁻¹ $ ^{201}\text{Fr} $ 7.516 −0.207 0.015 6.90×10⁻² 8.09×10⁻² 8.80×10⁻² 1.50×10⁻² 8.24×10⁻² $ ^{203}\text{Fr} $ 7.260 0.096 0.003 5.78×10⁻¹ 9.32×10⁻¹ 8.25×10⁻¹ 1.80×10⁻² 8.73×10⁻² $ ^{205}\text{Fr} $ 7.055 0.086 −0.009 3.96×100 5.61×100 4.50×100 1.35×10⁻² 6.55×10⁻² $ ^{207}\text{Fr} $ 6.900 −0.083 0.014 1.56×101 2.36×101 1.70×101 1.20×10⁻² 5.92×10⁻² $ ^{209}\text{Fr} $ 6.778 −0.073 0.002 5.67×101 8.25×101 5.07×101 9.22×10⁻³ 4.54×10⁻² $ ^{211}\text{Fr} $ 6.663 −0.053 −0.011 2.14×10² 3.01×10² 1.48×10² 6.66×10⁻³ 3.28×10⁻² $ ^{213}\text{Fr} $ 6.905 0.011 0.000 3.49×101 5.12×101 1.67×101 4.59×10⁻³ 2.10×10⁻² $ ^{215}\text{Fr} $ 9.540 0.000 0.000 8.60×10⁻⁸ 1.01×10⁻⁷ 6.51×10⁻⁸ 4.34×10⁻² 8.82×10⁻² $ ^{217}\text{Fr} $ 8.469 −0.011 0.000 2.20×10⁻⁵ 4.07×10⁻⁵ 3.09×10⁻⁵ 6.52×10⁻² 1.59×10⁻¹ $ ^{219}\text{Fr} $ 7.449 0.011 0.000 2.02×10⁻² 4.51×10⁻² 3.84×10⁻² 7.50×10⁻² 2.08×10⁻¹ $ ^{201}\text{Ra} $ 8.002 −0.227 0.019 8.00×10⁻³ 5.09×10⁻³ 5.90×10⁻³ 8.64×10⁻³ 4.89×10⁻² $ ^{203}\text{Ra} $ 7.730 −0.217 0.017 3.10×10⁻² 3.85×10⁻² 4.24×10⁻² 1.49×10⁻² 8.61×10⁻² $ ^{205}\text{Ra} $ 7.486 −0.207 0.004 2.10×10⁻¹ 2.75×10⁻¹ 2.80×10⁻¹ 1.36×10⁻² 7.93×10⁻² $ ^{207}\text{Ra} $ 7.270 −0.115 0.017 1.40×100 2.32×100 1.88×100 1.46×10⁻² 7.55×10⁻² $ ^{209}\text{Ra} $ 7.143 −0.104 0.016 4.83×100 7.69×100 5.47×100 1.14×10⁻² 5.95×10⁻² $ ^{217}\text{Ra} $ 9.161 −0.010 0.012 1.60×10⁻⁶ 1.55×10⁻⁶ 1.11×10⁻⁶ 3.48×10⁻² 7.96×10⁻² $ ^{205}\text{Ac} $ 8.090 −0.217 0.006 2.00×10⁻² 7.44×10⁻³ 7.85×10⁻³ 4.16×10⁻³ 2.40×10⁻² $ ^{207}\text{Ac} $ 7.840 −0.207 −0.007 2.70×10⁻² 5.00×10⁻² 4.77×10⁻² 1.77×10⁻² 1.02×10⁻¹ $ ^{209}\text{Ac} $ 7.730 −0.125 0.018 8.70×10⁻² 1.65×10⁻¹ 1.28×10⁻¹ 1.51×10⁻² 7.98×10⁻² $ ^{211}\text{Ac} $ 7.620 −0.115 0.017 2.10×10⁻¹ 4.52×10⁻¹ 2.96×10⁻¹ 1.36×10⁻² 7.16×10⁻² $ ^{213}\text{Ac} $ 7.501 −0.084 0.002 7.38×10⁻¹ 1.56×100 7.83×10⁻¹ 9.97×10⁻³ 5.03×10⁻² $ ^{215}\text{Ac} $ 7.746 0.011 0.000 1.71×10⁻¹ 3.82×10⁻¹ 1.29×10⁻¹ 6.98×10⁻³ 3.31×10⁻² $ ^{217}\text{Ac} $ 9.832 0.000 0.000 6.90×10⁻⁸ 9.64×10⁻⁸ 6.59×10⁻⁸ 5.15×10⁻² 1.11×10⁻¹ $ ^{219}\text{Ac} $ 8.830 0.000 0.000 1.18×10⁻⁵ 2.20×10⁻⁵ 1.69×10⁻⁵ 6.57×10⁻² 1.62×10⁻¹ $ ^{227}\text{Ac} $ 5.042 0.132 0.083 1.04×10¹¹ 1.39×10¹⁰ 3.46×10¹⁰ 3.83×10⁻³ 3.29×10⁻² $ ^{213}\text{Th} $ 7.837 −0.104 0.004 1.44×10⁻¹ 2.49×10⁻¹ 1.49×10⁻¹ 9.56×10⁻³ 5.07×10⁻² $ ^{219}\text{Th} $ 9.510 −0.021 0.012 1.05×10⁻⁶ 1.01×10⁻⁶ 7.49×10⁻⁷ 3.48×10⁻² 8.19×10⁻² Table 1. Calculated α-decay half-lives (in seconds) and α-preformation factors of isotopic chains with
$ 78 \le Z \le 90 $ . The α-decay energies$ Q_\alpha $ , the quadrupole and hexadecapole deformation parameters$ \beta_2 $ and$ \beta_4 $ of the daughter nucleus, and the experimental partial α-decay half-lives$ T_{1/2}^{\text{exp}} $ of the favored transitions are listed in the second to fifth columns. The α-decay half-lives calculated with the DDFPs using the Migdal and CDM3Y6 interactions are presented in the sixth and seventh columns. The last two columns show the$ P_\alpha $ factors calculated with Eq. (14) from both interactions.Despite the differences in absolute magnitudes, the systematic trends of
$ P_\alpha $ obtained with all three α-nucleus potentials are highly consistent. Typically, a sharp increase is observed beyond$ N = 126 $ , reflecting pronounced neutron shell effects. Furthermore, for the isotopic chains on both sides of$ N = 126 $ , the$ P_\alpha $ values approximately follow a linear trend with neutron number. This linear trend is particularly prominent in the region where N is slightly less than 126. However, in the SLy4 results, noticeable fluctuations appear for specific nuclei, such as 197Rn ($ N=111 $ ) and 205Rn ($ N=117 $ ), within their respective isotopic chains. For$ N \gt 126 $ , the$ P_\alpha $ values from the CDM3Y6 interaction exhibit a more linear variation with N than those from the Migdal interaction. The latter tends to saturate more rapidly as N increases. These characteristics are consistent with the$ P_\alpha $ systematics observed in our previous studies of even-even nuclei [41, 48]. Overall, the successful reproduction of the known$ P_\alpha $ systematics for odd-A nuclei demonstrates the reliability of these theoretical approaches across different NN interactions.We then compare the accuracy of the DDFPs in calculating the α-decay half-lives using the two NN interactions. When performing half-life calculations,
$ P_\alpha $ must be appropriately assumed in the decay model as a theoretical input. Since the$ P_\alpha $ factor near shell closures varies approximately linearly with the valence nucleon number, we adopted the simple treatment described in Ref. [46]. The$ P_\alpha $ value is approximated by the following expression, which depends on the valence neutron number:$ P_{\alpha}^{{\rm{inp}}}=a\left(N-N_{0}\right)+b . $
(15) In the above expression,
$ N_0 $ is the nearest neutron magic number less than N. The parameters a and b are determined by fitting the expression to the empirical$ P_\alpha $ factors extracted using Eq. (14). For the α-nucleus potential under the CDM3Y6 interaction, we obtain$ a= (-1.73\pm0.302)\times10^{-3} $ ,$ b=(1.20\pm0.0844)\times10^{-1} $ , along with the covariance matrix,$M_{c}^{\text{CDM3Y6}}=10^{-7} \times\left[\begin{array}{*{20}{c}} {0.912} & {-22.2} \\ {-22.2} & {712} \end{array}\right]. $
For the α-nucleus potential under the Migdal interaction, we obtain
$ a=(-8.04\pm0.893)\times10^{-4} $ ,$ b=(3.85\pm 0.250)\times10^{-2} $ , along with the covariance matrix,$M_{c}^{\text{Migdal}}=10^{-8} \times\left[\begin{array}{*{20}{c}} {0.798} & {-19.4} \\{-19.4 }& {624 } \end{array}\right].$
Figure 2 illustrates the empirical
$ P_\alpha $ values described by Eq. (15). As shown, Eq. (15) approximately captures the overall trend of$ P_\alpha $ as a function of the valence neutron number. This simple treatment provides a useful basis for evaluating the accuracy of the α-nucleus potential in half-life calculations. However, to accurately describe$ P_\alpha $ for a specific nuclide, the empirical formula often requires additional terms that account for other structural effects, such as the dependence on the valence proton number [63−65], the angular momentum of the α particle [65, 66], and nuclear deformation [67, 68].
Figure 2. (color online) The distribution of
$ P_\alpha $ extracted using the DDFPs based on the CDM3Y6 and the Migdal interactions. The red line shows$ P_\alpha^{\text{inp}} $ from Eq. (15) fitted to the data.Using the results of Eq. (15) as input for the half-life calculations, we obtain the deviations between the theoretical and experimental α-decay half-lives for the CDM3Y6 and Migdal interactions, as shown in Fig. 3. On a logarithmic scale, the deviations are generally confined between –0.5 and 0.5, corresponding to a theoretical-to-experimental ratio predominately in the range 0.31 to 3.16. This indicates that the α-nucleus potentials derived from both interactions can reasonably reproduce the α-decay half-lives of these odd-A nuclei. To quantify the overall accuracy, we compute the root-mean-square (RMS) deviation factor
Figure 3. (color online) Deviations between experimental and theoretical α-decay half-lives calculated using the DDFPs based on the CDM3Y6 and the Migdal interactions. For most nuclei, the theoretical results agree with the experimental data within a factor of 0.31−3.16.
$ \sigma=\sqrt{\frac{1}{n} \sum\limits_{i=1}^{n}\left({\lg T_{{1 / 2}, i}^{\exp }}-{\lg T_{{1 / 2}, i}^{{\rm{cal}}}}\right)^{2}}, $
where n is the total number of nuclides considered.
The σ values for the CDM3Y6 and Migdal interactions are 0.212 and 0.250, respectively. This indicates that the two potentials achieve comparable accuracy in half-life calculations, with the CDM3Y6 potential showing only a slight advantage. Compared to the previous result
$ \sigma=0.1820 $ for favored decays of even-even nuclei [46], the σ value for odd-A nuclei obtained with the Migdal interaction is 37.4% larger. This increase is reasonable because the decay schemes of odd-A nuclei are more complex and their experimental measurements generally carry larger uncertainties than those of even-even nuclei. Moreover, the deviations for 181Tl, 183Hg, and 227Ac using the Migdal interaction significantly exceed 0.5, while only two nuclei (191Po and 211At) in the CDM3Y6 case slightly surpass this threshold. To account for the experimental uncertainties in α-decay energy, half-life, and branching ratio (Table 2), we include error bars for these specific nuclei in Fig. 3. Even after considering these uncertainties, the half-life deviations remain larger than 0.5 for all nuclei except 191Po. Since the sets of nuclei with large deviations differ between the two interactions, it suggests that these discrepancies mainly arise from the approximation of the empirical$ P_\alpha $ formula and from intrinsic model uncertainties.Nuclide $ Q_\alpha $ /keV$ T_{1/2} $ $ B_1 $ $ B_2 $ $ T_{1/2}^{\text{exp}} $ $ ^{191} \text{Po} $ $ 7501 ^ {+ 11} _ {-11} $ $ 22 ^ {+ 1} _ {- 1}\text{ ms} $ $ 0.99 ^ {+ 0.01} _ {- 0.1} $ $ 0.77 ^ {+ 0.025} _ {- 0.025} $ $ 28.86 ^ {+ 5.83} _ {- 2.45}\text{ ms} $ $ ^{211} \text{At} $ $ 5982.4 ^ {+ 1.3} _ {-1.3} $ $ 7.214 ^ {+ 0.007} _ {- 0.007}\text{ h} $ $ 0.4180 ^ {+ 0.0008} _ {- 0.0008} $ 1 $ 17.26 ^ {+ 0.05} _ {- 0.05}\text{ h} $ $ ^{181} \text{Tl} $ $ 6322 ^ {+ 6} _ {-6} $ $ 2.9 ^ {+ 0.1} _ {- 0.1}\text{ s} $ $ 0.086 ^ {+ 0.006} _ {- 0.006} $ 1 $ 33.72 ^ {+ 3.78} _ {- 3.29}\text{ s} $ $ ^{183} \text{Hg} $ $ 6039 ^ {+ 4} _ {-4} $ $ 9.4 ^ {+ 0.7} _ {- 0.7}\text{ s} $ $ 0.117 ^ {+ 0.02} _ {- 0.02} $ $ 0.91 ^ {+ 0.09} _ {- 0.17} $ $ 88.29 ^ {+ 52.42} _ {- 24.79}\text{ s} $ $ ^{227} \text{Ac} $ $ 5042.19 ^ {+ 0.14} _ {-0.14} $ $ 21.772 ^ {+ 0.003} _ {- 0.003}\text{ y} $ $ 0.01380 ^ {+ 0.00004} _ {- 0.00004} $ $ 0.477 ^ {+ 0.01} _ {- 0.01} $ $ 3307.51 ^ {+ 81.11} _ {- 77.73}\text{ y} $ Table 2. Uncertainties in the experimental α-decay energies
$ Q_\alpha $ , total half-lives$ T_{1/2} $ , branching ratio for α decay among the various decay modes$ B_1 $ , branching ratio for the ground-state to ground-state α transition$ B_2 $ , and derived experimental partial α-decay half-lives$ T_{1/2}^{\text{exp}} $ [69].After discussing the favored α-decay properties, we attempt to analyze the reliability of the DDFP in the unfavored α decays of odd-A nuclei. A typical example is the α decays of the
$ N=127 $ isotonic chain near$ Z=82 $ [70]. Xu et al. previously investigated their half-lives using the cluster model with a phenomenological cosh-type nuclear potential. They found that the ground-state to ground-state α decays of these nuclei all correspond to the same kind of unfavored transitions with an angular momentum transfer of$ L=5 $ . In these cases, the$ P_\alpha $ values show a clear linear increase with the valence proton number. Therefore, they adopted the following Z-dependent formula to describe the$ P_\alpha $ factor.$ P_{\alpha} \approx c \times(Z-82) , $
(16) where c is a constant. Instead of treating
$ P_\alpha $ as a nucleus-independent constant, the use of this expression yields better agreement between calculated and experimental α-decay half-lives. This improved agreement demonstrates that shell effects are significant not only in the$ P_\alpha $ systematics of favored transitions, but also in unfavored transitions.As a test, we first attempt to reproduce the above conclusion using the DDFP model. Fig. 4 shows the variation of
$ P_\alpha $ for unfavored decays of odd-A nuclei as a function of proton number. For the$ N=127 $ isotonic chains, the$ P_\alpha $ values from both NN interactions follow an approximately linear trend with the valence proton number, consistent with the conclusion of Ref. [70]. The most significant difference between the two potentials is that the$ P_\alpha $ values from the Migdal interaction are systematically smaller than the CDM3Y6 results by a factor of about 5. In addition to the$ N=127 $ isotonic chain, we discover that the$ N=125 $ isotonic chain also has similar decay properties. Specifically, experimental data show that the ground-state to ground-state α decays of the$ N=125 $ chain share the same unfavored character ($ L=2 $ ). In parallel, our calculations indicate that the$ P_\alpha $ factors along this$ N=125 $ chain also exhibit a linear increase with the valence proton number, as shown in Fig. 4.
Figure 4.
$ P_\alpha $ in unfavored decays of the$ N=125 $ and$ N=127 $ isotonic chains. The upper and lower subfigures show results obtained with the CDM3Y6 and the Migdal interactions, respectively.Our previous study on the
$ P_\alpha $ systematics of even-even nuclei demonstrated that near the$ Z=82 $ and$ N=126 $ doubly magic shell closures, the$ P_\alpha $ variation in favored transitions is mainly dominated by changes in pairing interactions [33]. To understand the results of the unfavored decays shown in Fig. 4, we also investigated the correlation between$ P_\alpha $ and the proton pairing gap$ \Delta_{p} $ in this region.$ \Delta_{p} $ can be calculated using the empirical three-point formula [71],$\begin{aligned}[b] \Delta_{p}(Z, N)=\frac{(-1)^{Z}}{2}\times[B(Z, N)-2 B(Z-1, N)+B(Z-2, N)] \end{aligned} .$
(17) We extracted the
$ \Delta_p $ values from the experimental binding energies, and the results are listed in Table 3. Figs. 5 and 6 display$ P_\alpha $ as a function of$ \Delta_p $ for unfavored and favored decays along the$ N=125,127 $ and$ N=124,126,128 $ isotonic chains, respectively. It can be seen that$ P_\alpha $ increases approximately linearly with$ \Delta_p $ along all these isotonic chains, indicating a strong positive correlation between these two quantities.$ \Delta_p $ reflects the strength of the proton pairing correlation within nuclei, which, together with neutron pairing and proton–neutron (PN) correlations, contributes to the formation of α clusters. When the spatial overlap between proton and neutron orbitals is small, such as in the vicinity of the$ Z=82 $ ,$ N=126 $ shell closures, the variation of PN correlations is suppressed. Consequently, the change in the pairing interaction strength dominates the variation of$ P_\alpha $ . The findings in Figs. 5 and 6 confirm that this interpretation holds for both favored and unfavored decays, thereby explaining the behavior observed in Fig. 4. Thus, Fig. 4 demonstrates the interplay between shell effects from the mean field and the proton pairing correlation. The$ P_\alpha $ factor attains a local minimum at the shell closure as a manifestation of shell effects; meanwhile, it increases almost linearly above the closure as the number of valence proton pairs increases. This indicates that the$ P_\alpha $ empirical formula, which depends on the valence nucleon number, provides a relatively good approximation for half-life calculations near shell closures. The DDFP models with the CDM3Y6 and Migdal interactions both reasonably reproduce this structural pattern of$ P_\alpha $ near$ Z=82 $ .Nuclide $ Q_\alpha $ /MeV$ \beta_2 $ $ \beta_4 $ $ T_{1/2}^{\text{exp}} $ L $ P_\alpha $ (Migdal)$ P_\alpha $ (CDM3Y6)$ \Delta_p $ /MeV211Po 7.595 0.000 0.000 5.22×10⁻¹ 5 1.02×10⁻³ 4.43×10⁻³ 0.232 213Rn 8.244 0.000 0.000 1.99×10⁻² 5 1.67×10⁻³ 7.17×10⁻³ 0.436 215Ra 8.864 0.000 0.000 1.73×10⁻³ 5 2.00×10⁻³ 8.93×10⁻³ 0.623 217Th 9.435 0.000 0.000 2.66×10⁻⁴ 5 2.24×10⁻³ 1.02×10⁻² 0.780 209Po 4.979 −0.010 −0.012 2.71×10¹⁰ 2 6.01×10⁻⁴ 3.42×10⁻³ 0.539 211Rn 5.965 0.021 0.000 5.64×10⁵ 2 1.56×10⁻³ 8.67×10⁻³ 0.589 213Ra 6.861 −0.063 −0.010 4.50×101 2 2.18×10⁻³ 1.23×10⁻² 0.688 215Th 7.665 −0.073 −0.010 3.03×100 2 2.70×10⁻³ 1.53×10⁻² 0.799 Table 3. The α-preformation factors and proton pairing gaps for the
$ N=125,127 $ isotonic chains in unfavored α decays are presented. Columns 2–6 list the experimental α-decay energy$ Q_\alpha $ , the quadrupole deformation parameter$ \beta_2 $ of the daughter nucleus, the hexadecapole deformation parameter$ \beta_4 $ , the experimental partial α-decay half-life$ {T}_{1/2}^{\text{exp}} $ (in seconds), and the angular momentum L of the α cluster, respectively. Columns 7 and 8 present the$ P_\alpha $ factors extracted from the DDFPs using the Migdal and CDM3Y6 interactions, respectively. Column 9 lists the proton pairing gap$ \Delta_p $ calculated from Eq. (17).
Figure 5. (color online)
$ P_\alpha $ in unfavored decays of the$ N= $ $ 125,127 $ isotonic chains, as a function of the proton pairing gap$ \Delta_p $ . The upper and lower subfigures show results obtained with the CDM3Y6 and the Migdal interactions, respectively.
Figure 6. (color online)
$ P_\alpha $ in favored decays of the$ N=124, $ $ 126,128 $ isotonic chains, as a function of the proton pairing gap$ \Delta_p $ . The upper and lower subfigures show results obtained with the CDM3Y6 and the Migdal interactions, respectively.In order to understand the systematic difference in the magnitude of
$ P_\alpha $ derived from the CDM3Y6 and Migdal interactions, we take the 207Po ($ L=0 $ ) and 211Po ($ L=5 $ ) systems as examples and compare their α-nucleus potentials as well as the corresponding α-cluster bound state wavefunctions$ \varphi_0 $ from the two types of NN interactions. As shown in Fig. 7, one can observe that outside the Coulomb barrier, the curves of the two α-nucleus potentials almost overlap. The discrepancies in the α-nucleus potentials mainly appear near the location of the second classical turning point$ R_{2} $ and inside the core region. The position of$ R_{2} $ has a more pronounced effect on the calculation of empirical$ P_\alpha $ . It can be seen from Fig. 7 that, for the same decay system, the α-nucleus potentials obtained with the CDM3Y6 interaction have a smaller$ R_{2} $ than those obtained with the Migdal interaction. Since the barrier heights are nearly equal, the systematic difference in$ R_2 $ leads to a higher tunneling probability for the α cluster in the Migdal case, consequently resulting in a smaller$ P_\alpha $ according to Eq. (14). This feature is observed in both favored and unfavored α decays, reflecting the systematic influence of different NN interactions. As a result of the potential geometry, the α-cluster wavefunction from the CDM3Y6 interaction exhibits a distinct oscillation. It displays multiple peaks and nodes, with the largest peak located near the nuclear surface. In contrast, the wavefunction derived from the Migdal interaction exhibits nearly zero amplitude inside the nucleus, and only a single peak appears at the nuclear surface.
Figure 7. (color online) α-nucleus potentials and α-cluster wavefunctions for the 207Po (
$ L=0 $ ) and 211Po ($ L=5 $ ) systems. The DDFPs with the CDM3Y6 and the Migdal interactions have similar barrier heights, whereas their geometries differ markedly. The Migdal interaction yields a larger second classical turning point$ R_2 $ , which accounts for the significant difference in the$ P_\alpha $ values between the two potentials.The different behaviors of
$ \varphi_0 $ are attributed to the different treatments of Pauli blocking in the two potentials. For the DDFP with the CDM3Y6 interaction, the Pauli blocking effect is mainly introduced by applying the Wildermuth condition [72]. This condition imposes a constraint on the total harmonic oscillator quanta carried by the nucleons constituting the α cluster and the daughter nucleus, such that nucleons from the α cluster can only occupy the orbitals above those filled by the core nucleons. Consequently, the wavefunction has multiple nodes inside the nucleus, and the largest peak at the surface indicates that the nucleons near the Fermi surface play a dominant role in the formation of the α cluster. For the DDFP with the Migdal interaction, because the Pauli blocking effect manifests as a significant repulsive potential barrier within the nucleus, the determination of the α-nucleus potential does not rely on the Wildermuth condition. As shown in Fig. 7, due to the medium effect, this repulsive potential begins to rise sharply from the critical radius$ R_{c} $ towards the interior of the nucleus. It therefore prevents the formation of α clusters in regions above the critical density. Specifically, the α-cluster wavefunction exhibits a nearly vanishing amplitude in the inner region of the nucleus.In order to further understand the differences between the two DDFPs, we also investigate how the input density distribution of the daughter nucleus influences the potential geometry and the resulting
$ P_\alpha $ factor. Taking 207Po as an example, instead of adopting the same half-density radius$ R_d $ = 6.61 fm and diffuseness a = 0.54 fm for both the proton and neutron density distributions of the daughter nucleus, we now distinguish these two parameters ($ R_{d, \tau=p, n} $ and$ a_{\tau=p, n} $ ) for proton and neutron distributions, respectively. These parameters can be calculated using empirical formulas fitted to the density profiles from self-consistent Skyrme Hartree-Fock calculations [73], which yield$ R_{d, p} $ = 6.67 fm,$ R_{d, n} $ = 6.77 fm,$ a_p $ = 0.50 fm, and$ a_n $ = 0.55 fm.Figure 8 presents a comparison of the DDFPs generated using the refined and the original density profiles. It can be seen that the refined density profiles result in only minor differences in the α-nucleus potentials and the corresponding α-cluster wavefunctions for both the CDM3Y6 and Migdal interactions. While the Coulomb barrier heights remain almost unchanged, the second turning point
$ R_2 $ increases by 0.04 fm for the DDFP-CDM3Y6 and by 0.05 fm for the DDFP-Migdal, which results in reductions of only 13% and 16% in the extracted$ P_\alpha $ factors, respectively. These results demonstrate that the sensitivity to the input density distribution parameters is comparable for both DDFPs. As a further validation, the results shown in Fig. 8 justify the traditional treatment of$ R_d $ and a, implying that the original parameters serve as a robust approximation for the density distributions of the involved nuclei.
Figure 8. (color online) Sensitivity of the α-nucleus potentials to the input parameters of the density distributions of the daughter nucleus. The potential V, the second classical turning point
$ R_2 $ , and the α-cluster wavefunction$ \varphi_0 $ denoted by the superscript (1) are obtained by assuming the same half-density radius$ R_d $ and diffuseness a for both the proton and neutron density distributions. In contrast, the superscript (2) denotes the results obtained using distinct parameters for the proton and neutron distributions ($ R_{d, \tau=p, n} $ and$ a_{\tau=p, n} $ ). -
In this study, we extended the dynamical double-folding potential (DDFP) model to investigate both favored and unfavored α decays in odd-A nuclei. Focusing on nuclides in the range
$ 78\le Z \le90 $ , we performed a systematic comparison between the deep-well DDFP based on the CDM3Y6 NN interaction and the pocket-type DDFP derived from the Migdal interaction. The results show that both interactions reproduce the experimental α-decay half-lives of most odd-A nuclei in this region to within a factor of three. The RMS deviation for the DDFP-Migdal is 0.250, while the DDFP-CDM3Y6 yields a slightly lower value of 0.212.By extracting the α preformation factors from experimental half-lives, we found that both potentials yield similar systematic trends in
$ P_\alpha $ across favored and unfavored transitions. These trends clearly reveal the linear dependence of$ P_\alpha $ on both the valence neutron and proton numbers. Furthermore, this linear behavior of$ P_\alpha $ is also observed in the unfavored transitions of the$ N = 125 $ isotonic chain, analogous to the$ N = 127 $ chain previously reported in Ref. [70]. Such systematic behavior of$ P_\alpha $ is found to correlate with the increasing proton pairing gap above$ Z = 82 $ , indicating that the proton pairing correlation in this region significantly enhances the α preformation probability. Despite the similar trends, the absolute$ P_\alpha $ values obtained with the Migdal interaction are smaller than those from the CDM3Y6 interaction by an average factor of approximately 5. This systematic difference results from the distinct geometries of the two α-nucleus potentials. The different treatments of Pauli blocking in the two potentials account for the shift in the second classical turning point, and consequently, the magnitude of$ P_\alpha $ .The above findings reaffirm the effectiveness and accuracy of the DDFP framework in α-decay calculations. Since the calculations were performed only for α transitions between ground states, the model’s performance regarding transitions to excited states or fine structure was not evaluated in this study. These transitions are important for nuclear spectroscopy; therefore, it would be worthwhile to conduct further evaluations in the future through dedicated calculations for a few typical nuclei. Furthermore, as the current investigation mainly covers nuclei in the region
$ 78 \le Z \le 90 $ , the conclusions reached regarding the systematic differences between the two potentials also deserve further verification before the two potentials are applied to lighter and superheavy nuclei, where other structural effects, such as extreme isospin asymmetry or pronounced higher-order deformations, become dominant. In addition, it is evident that differences in NN interactions significantly influence both the α-nucleus potential and the decay properties. The current theoretical model presents opportunities for further refinement regarding the density dependence of the NN interactions. For instance, it would be interesting to incorporate variations in Pauli blocking and the NN interaction arising from neutron-proton density asymmetry. This would better reflect realistic nuclear density distributions in finite nuclei, thereby yielding a more accurate α-nucleus interaction, especially in the surface region, to which α decay is highly sensitive. -
In this study, we extended the dynamical double-folding potential (DDFP) model to investigate both favored and unfavored α decays in odd-A nuclei. Focusing on nuclides in the range
$ 78\le Z \le90 $ , we performed a systematic comparison between the deep-well DDFP based on the CDM3Y6 NN interaction and the pocket-type DDFP derived from the Migdal interaction. The results show that both interactions reproduce the experimental α-decay half-lives of most odd-A nuclei in this region to within a factor of three. The RMS deviation for the DDFP-Migdal is 0.250, while the DDFP-CDM3Y6 yields a slightly lower value of 0.212.By extracting the α preformation factors from experimental half-lives, we found that both potentials yield similar systematic trends in
$ P_\alpha $ across favored and unfavored transitions. These trends clearly reveal the linear dependence of$ P_\alpha $ on both the valence neutron and proton numbers. Furthermore, this linear behavior of$ P_\alpha $ is also observed in the unfavored transitions of the$ N = 125 $ isotonic chain, analogous to the$ N = 127 $ chain previously reported in Ref. [70]. Such systematic behavior of$ P_\alpha $ is found to correlate with the increasing proton pairing gap above$ Z = 82 $ , indicating that the proton pairing correlation in this region significantly enhances the α preformation probability. Despite the similar trends, the absolute$ P_\alpha $ values obtained with the Migdal interaction are smaller than those from the CDM3Y6 interaction by an average factor of approximately 5. This systematic difference results from the distinct geometries of the two α-nucleus potentials. The different treatments of Pauli blocking in the two potentials account for the shift in the second classical turning point, and consequently, the magnitude of$ P_\alpha $ .The above findings reaffirm the effectiveness and accuracy of the DDFP framework in α-decay calculations. Since the calculations were performed only for α transitions between ground states, the model’s performance regarding transitions to excited states or fine structure was not evaluated in this study. These transitions are important for nuclear spectroscopy; therefore, it would be worthwhile to conduct further evaluations in the future through dedicated calculations for a few typical nuclei. Furthermore, as the current investigation mainly covers nuclei in the region
$ 78 \le Z \le 90 $ , the conclusions reached regarding the systematic differences between the two potentials also deserve further verification before the two potentials are applied to lighter and superheavy nuclei, where other structural effects, such as extreme isospin asymmetry or pronounced higher-order deformations, become dominant. In addition, it is evident that differences in NN interactions significantly influence both the α-nucleus potential and the decay properties. The current theoretical model presents opportunities for further refinement regarding the density dependence of the NN interactions. For instance, it would be interesting to incorporate variations in Pauli blocking and the NN interaction arising from neutron-proton density asymmetry. This would better reflect realistic nuclear density distributions in finite nuclei, thereby yielding a more accurate α-nucleus interaction, especially in the surface region, to which α decay is highly sensitive. -
In this study, we extended the dynamical double-folding potential (DDFP) model to investigate both favored and unfavored α decays in odd-A nuclei. Focusing on nuclides in the range
$ 78\le Z \le90 $ , we performed a systematic comparison between the deep-well DDFP based on the CDM3Y6 NN interaction and the pocket-type DDFP derived from the Migdal interaction. The results show that both interactions reproduce the experimental α-decay half-lives of most odd-A nuclei in this region to within a factor of three. The RMS deviation for the DDFP-Migdal is 0.250, while the DDFP-CDM3Y6 yields a slightly lower value of 0.212.By extracting the α preformation factors from experimental half-lives, we found that both potentials yield similar systematic trends in
$ P_\alpha $ across favored and unfavored transitions. These trends clearly reveal the linear dependence of$ P_\alpha $ on both the valence neutron and proton numbers. Furthermore, this linear behavior of$ P_\alpha $ is also observed in the unfavored transitions of the$ N = 125 $ isotonic chain, analogous to the$ N = 127 $ chain previously reported in Ref. [70]. Such systematic behavior of$ P_\alpha $ is found to correlate with the increasing proton pairing gap above$ Z = 82 $ , indicating that the proton pairing correlation in this region significantly enhances the α preformation probability. Despite the similar trends, the absolute$ P_\alpha $ values obtained with the Migdal interaction are smaller than those from the CDM3Y6 interaction by an average factor of approximately 5. This systematic difference results from the distinct geometries of the two α-nucleus potentials. The different treatments of Pauli blocking in the two potentials account for the shift in the second classical turning point, and consequently, the magnitude of$ P_\alpha $ .The above findings reaffirm the effectiveness and accuracy of the DDFP framework in α-decay calculations. Since the calculations were performed only for α transitions between ground states, the model’s performance regarding transitions to excited states or fine structure was not evaluated in this study. These transitions are important for nuclear spectroscopy; therefore, it would be worthwhile to conduct further evaluations in the future through dedicated calculations for a few typical nuclei. Furthermore, as the current investigation mainly covers nuclei in the region
$ 78 \le Z \le 90 $ , the conclusions reached regarding the systematic differences between the two potentials also deserve further verification before the two potentials are applied to lighter and superheavy nuclei, where other structural effects, such as extreme isospin asymmetry or pronounced higher-order deformations, become dominant. In addition, it is evident that differences in NN interactions significantly influence both the α-nucleus potential and the decay properties. The current theoretical model presents opportunities for further refinement regarding the density dependence of the NN interactions. For instance, it would be interesting to incorporate variations in Pauli blocking and the NN interaction arising from neutron-proton density asymmetry. This would better reflect realistic nuclear density distributions in finite nuclei, thereby yielding a more accurate α-nucleus interaction, especially in the surface region, to which α decay is highly sensitive. -
In this study, we extended the dynamical double-folding potential (DDFP) model to investigate both favored and unfavored α decays in odd-A nuclei. Focusing on nuclides in the range
$ 78\le Z \le90 $ , we performed a systematic comparison between the deep-well DDFP based on the CDM3Y6 NN interaction and the pocket-type DDFP derived from the Migdal interaction. The results show that both interactions reproduce the experimental α-decay half-lives of most odd-A nuclei in this region to within a factor of three. The RMS deviation for the DDFP-Migdal is 0.250, while the DDFP-CDM3Y6 yields a slightly lower value of 0.212.By extracting the α preformation factors from experimental half-lives, we found that both potentials yield similar systematic trends in
$ P_\alpha $ across favored and unfavored transitions. These trends clearly reveal the linear dependence of$ P_\alpha $ on both the valence neutron and proton numbers. Furthermore, this linear behavior of$ P_\alpha $ is also observed in the unfavored transitions of the$ N = 125 $ isotonic chain, analogous to the$ N = 127 $ chain previously reported in Ref. [70]. Such systematic behavior of$ P_\alpha $ is found to correlate with the increasing proton pairing gap above$ Z = 82 $ , indicating that the proton pairing correlation in this region significantly enhances the α preformation probability. Despite the similar trends, the absolute$ P_\alpha $ values obtained with the Migdal interaction are smaller than those from the CDM3Y6 interaction by an average factor of approximately 5. This systematic difference results from the distinct geometries of the two α-nucleus potentials. The different treatments of Pauli blocking in the two potentials account for the shift in the second classical turning point, and consequently, the magnitude of$ P_\alpha $ .The above findings reaffirm the effectiveness and accuracy of the DDFP framework in α-decay calculations. Since the calculations were performed only for α transitions between ground states, the model’s performance regarding transitions to excited states or fine structure was not evaluated in this study. These transitions are important for nuclear spectroscopy; therefore, it would be worthwhile to conduct further evaluations in the future through dedicated calculations for a few typical nuclei. Furthermore, as the current investigation mainly covers nuclei in the region
$ 78 \le Z \le 90 $ , the conclusions reached regarding the systematic differences between the two potentials also deserve further verification before the two potentials are applied to lighter and superheavy nuclei, where other structural effects, such as extreme isospin asymmetry or pronounced higher-order deformations, become dominant. In addition, it is evident that differences in NN interactions significantly influence both the α-nucleus potential and the decay properties. The current theoretical model presents opportunities for further refinement regarding the density dependence of the NN interactions. For instance, it would be interesting to incorporate variations in Pauli blocking and the NN interaction arising from neutron-proton density asymmetry. This would better reflect realistic nuclear density distributions in finite nuclei, thereby yielding a more accurate α-nucleus interaction, especially in the surface region, to which α decay is highly sensitive.
Dynamical double-folding potentials for α decay in odd-A nuclei: Comparison between Migdal and CDM3Y6 interactions
- Received Date: 2026-03-07
- Available Online: 2026-09-15
Abstract: The dynamical double-folding potential (DDFP) model is extended to investigate the α decays of odd-A nuclei in the region $ 78 \le Z \le 90 $. We present a systematic comparison between the deep-well DDFP based on the CDM3Y6 nucleon-nucleon interaction and the pocket-type DDFP based on the Migdal interaction. Both potentials reproduce the experimental α-decay half-lives satisfactorily, with root-mean-square deviations of $ \sigma = 0.212 $ and 0.250, respectively. The two potentials also yield similar trends in α preformation factors ($ P_\alpha $) for both favored and unfavored transitions, reflecting the high sensitivity of $ P_\alpha $ to shell structure and the variation of the proton pairing gap. Furthermore, our analysis demonstrates that the significant difference in the $ P_\alpha $ magnitude between the two potentials stems fundamentally from their distinct treatments of Pauli blocking effects.



 DownLoad: