


 Abstract
 HTML
HTML Reference
 Related
 PDF
PDF


-
The origin of elements in the universe is a fundamental question in nuclear astrophysics. In nucleosynthesis processes, the formation of light nuclei (
$ Z\leq26 $ ) primarily occurs via nuclear fusion reactions in the core regions of stars. For elements heavier than iron ($ Z>26 $ ), the synthesis of these heavier elements predominantly occurs through the rapid neutron capture process (r process) [1] or the slow neutron capture process (s process) [2].In the r process, atomic nuclei capture neutrons faster than they can undergo β decay. It occurs in extreme astrophysical environments with very high neutron fluxes, such as supernova explosions and neutron star mergers. On the chart of nuclides, the r process path lies on the neutron-rich side, far from the valley of β stability. Many heavy elements such as Pt, Au, and U are believed to originate predominantly from the r process, although other nucleosynthetic processes may also contribute to their formation.
In contrast, the slow neutron capture process (s process) occurs under relatively low neutron flux conditions, where neutron capture proceeds more slowly than β decay. It follows the valley of β stability and plays a key role in producing many stable isotopes. The s process is typically categorized into a weak and a main component, corresponding to different stellar sites and neutron exposure environments. The weak s process occurs in massive stars (
$ M\ge8M_{\odot} $ ) during core helium burning and subsequent shell carbon burning stages, and is mainly responsible for synthesizing lighter heavy elements with Z = 26–40, e.g., Fe, Ni, Zn. The main s process takes place in low- to intermediate-mass asymptotic giant branch (AGB) stars during the thermal pulse phase, where neutrons are primarily released through the$ ^{13}{\rm{C}}(\alpha,{\rm{n}})^{16}{\rm{O}} $ reaction at temperatures around$ 9\times10^{7} $ K during the interpulse periods, and through the$ ^{22}{\rm{Ne}}(\alpha,{\rm{n}})^{25}{\rm{Mg}} $ reaction at approximately$ 3\times10^{8} $ K during convective thermal pulses.These conditions facilitate the formation of heavier elements with Z = 38–82, e.g., Sr, Ba, Pb.The main nucleosynthesis path for
$ ^{63}{\rm{Cu}} $ and$ ^{65}{\rm{Cu}} $ in massive stars is shown in Fig. 1. The neutron capture cross sections of$ ^{63,65}{\rm{Cu}} $ significantly affect s process abundances. The neutron capture cross sections of elements starting from Fe onwards affect the s process nuclide abundance distribution. As an element above Fe, the cross section data of copper can improve the precision of nucleosynthesis models.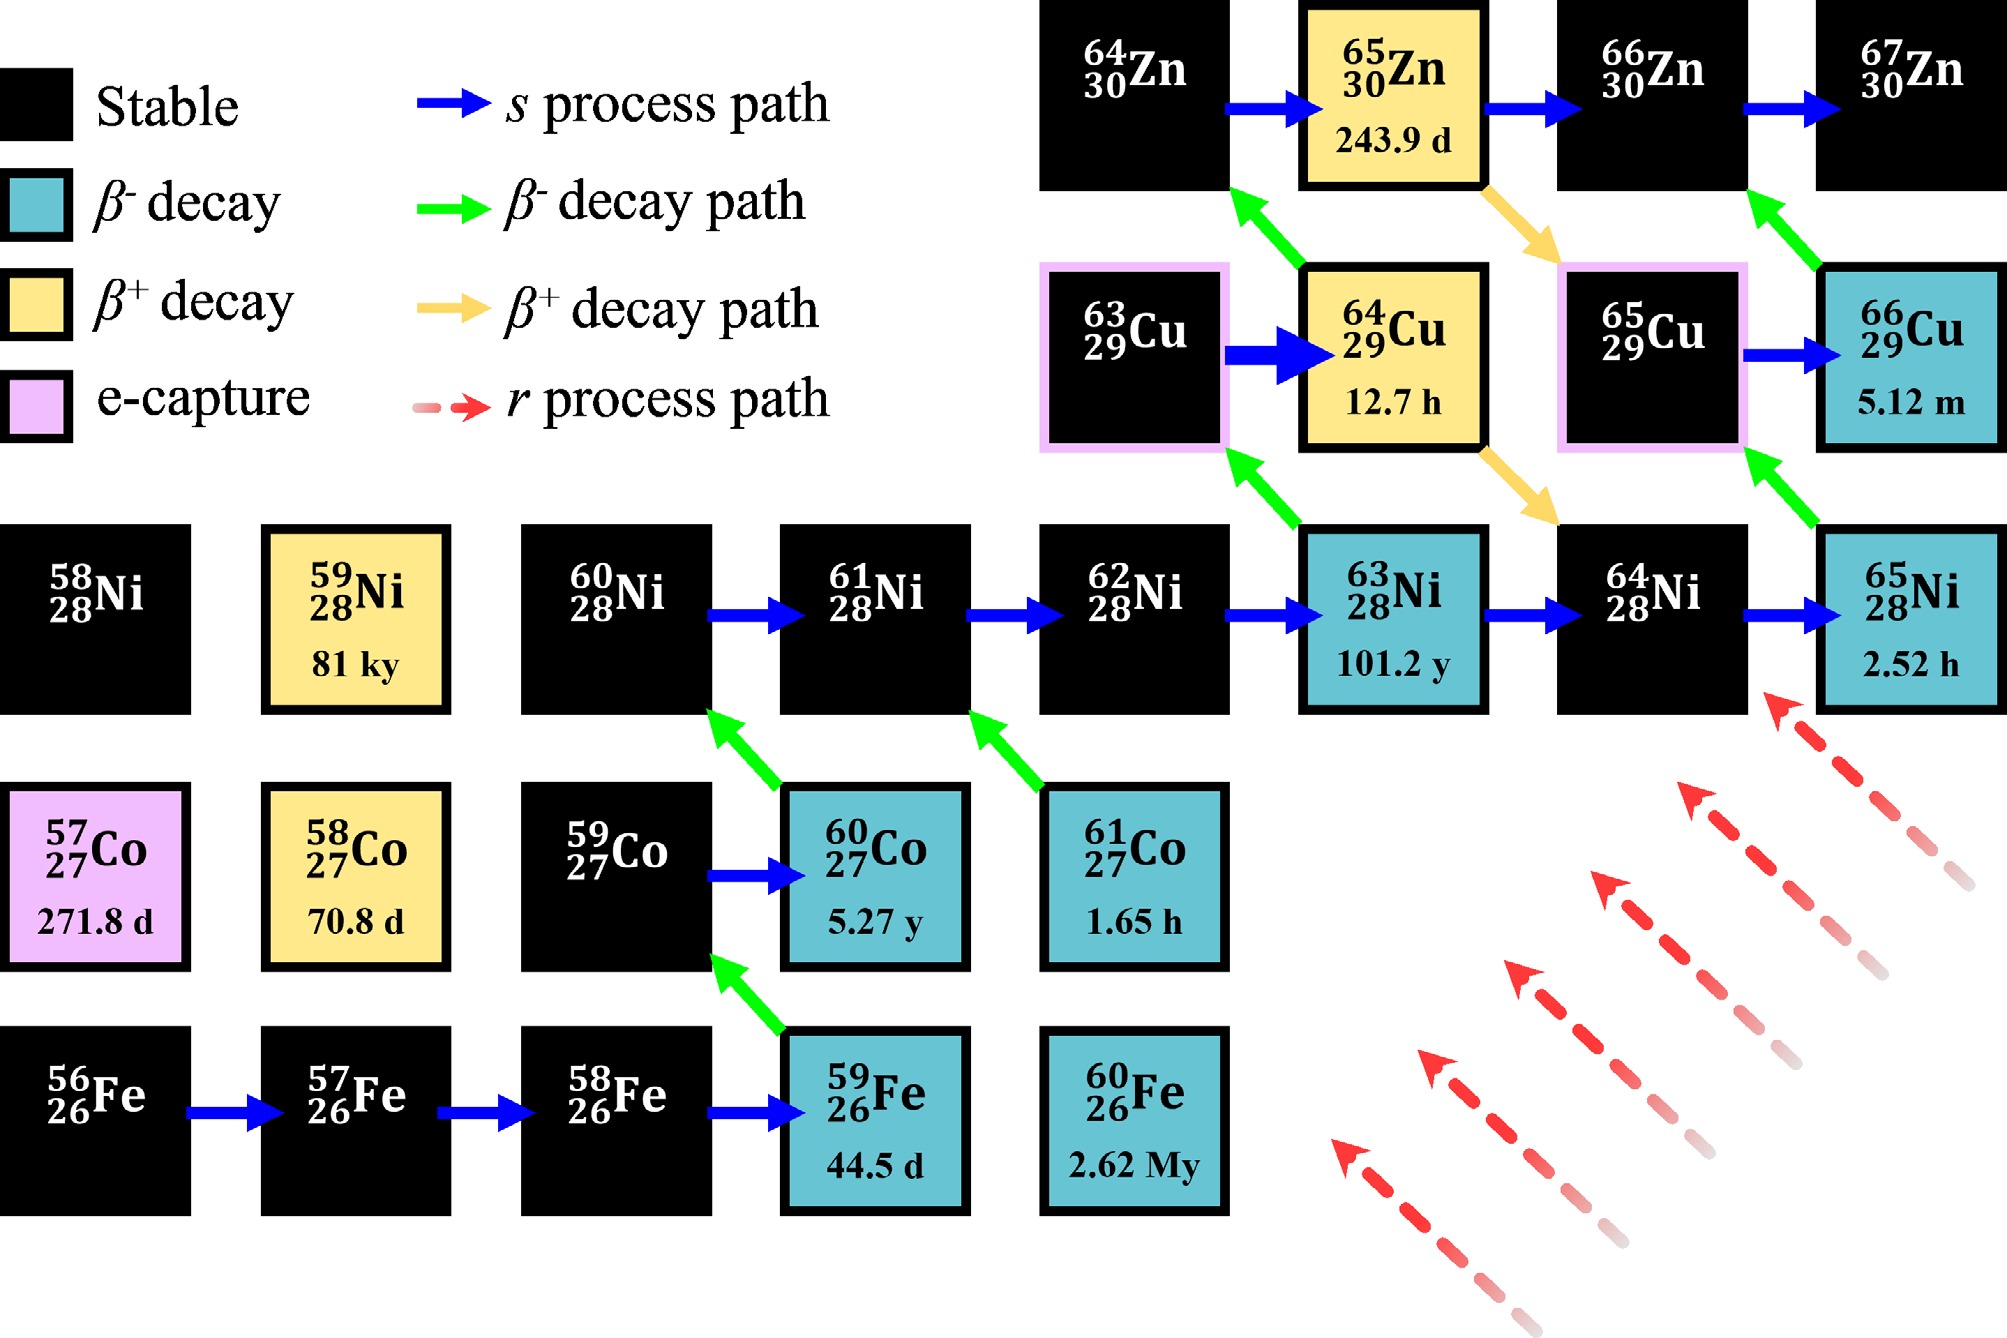
Figure 1. (color online) The main nucleosynthesis path for
$ ^{\rm{nat}}{\rm{Cu}} $ in massive stars. Black boxes represent stable isotopes; yellow, blue, and purple boxes represent unstable isotopes. Yellow indicates that the nucleus decays via$ \beta^{+} $ decay; blue indicates decays via$ \beta^{-} $ decay; while purple indicates that the nucleus decays via e−capture.Natural copper consists of 69.2%
$ ^{63}{\rm{Cu}} $ and 30.8%$ ^{65}{\rm{Cu}} $ . The daughter nucleus$ ^{64}{\rm{Cu}} $ is unstable, with a half-life of 12.7 h, decaying to the stable nucleus$ ^{64}{\rm{Ni}} $ (branching ratio 61.5%) via$ \beta^{+} $ decay and electron capture, or to$ ^{64}{{\rm{Zn}}} $ (branching ratio 38.5%) via$ \beta^{-} $ decay.$ ^{64}{\rm{Cu}} $ is a radioisotope with imaging and therapeutic capabilities and can be used for PET imaging and radiotherapy. The mixed field of neutrons and photons in a clinical 15 MeV electron linac offers dual reaction routes for the production of$ ^{64}{\rm{Cu}} $ , via the$ ^{63}{\rm{Cu}} $ (n,γ)$ ^{64}{{\rm{Cu}}}+ ^{65}{\rm{Cu}} $ (γ,n)$ ^{64}{\rm{Cu}} $ reactions from natural copper irradiation [3]. The$ ^{64}{\rm{Cu}} $ yield increased by 46% due to neutron moderation achieved by varying the thickness of a solid water phantom.The resonance structures of natural copper in neutron capture reaction cross sections are the basis of Neutron Resonance Capture Analysis (NRCA). NRCA is a powerful non-destructive method for determining the elemental and isotopic composition of archaeological and cultural heritage, such as the neutron analyses of eight bronze age swords from Austria [4], Roman bronze water taps [5], and a series of Geistingen-type socketed axes [6] at the time-of-flight neutron facility GELINA at the EC Joint Research Centre (JRC) in Geel (BE).
In addition, copper and its alloys (e.g., brass, bronze, cupronickel) are widely used in reactor condensers, cooling pipes, and heat transfer systems. Copper alloys enhance heat exchange efficiency in nuclear fuel rod assemblies, minimizing localized overheating risks.
In previous studies, the TOF method has been extensively applied to measure the neutron capture cross sections of copper: Weigmann et al. [7] conducted measurements on
$ ^{\rm{nat}}{\rm{Cu}} $ at the GELINA facility using plastic scintillator detectors, spanning the energy region of 0.2–16.5 keV; Pandey et al. [8] carried out measurements of the isolated isotopes$ ^{63}{\rm{Cu}} $ and$ ^{65}{\rm{Cu}} $ at the ORELA facility with$ {{\rm{C}}_{6}{\rm{F}}_{6}} $ detectors, spanning the 3–50 keV energy range. Recently, a new TOF measurement has been initiated at the CERN$ {{\rm{n}}}\_{\mathrm{TOF}} $ facility, which expands both the energy range and precision of copper neutron capture studies. Furthermore, at the SARAF facility, Weissman et al. [9] used a liquid-lithium target (LiLiT) to produce a high-power quasi-Maxwellian neutron source and determined the neutron capture cross sections of$ ^{63}{\rm{Cu}} $ and$ ^{65}{\rm{Cu}} $ via the activation method, yielding the Maxwellian-averaged cross sections (MACSs) at 30 keV.Fig. 2 presents the previous measurements of the
$ ^{\rm{nat}}{\rm{Cu}} $ (n,γ) cross sections. Kapchigashev et al. [10] measured cross sections between 18.7 eV and 47.8 eV, however, the neutron energy resolution was insufficient to resolve individual resonances. In addition, the measurements for the results obtained by Diven et al. [11], Stavisskii et al. [12], Poenitz et al. [13], Voignier et al. [14] were conducted predominantly between 1960 and 1992, covering an energy range of 0.019$ - $ 3 MeV. These early experiments provided foundational data for the neutron capture cross section of$ ^{\rm{nat}}{\rm{Cu}} $ . However, they were limited in terms of precision and energy range.
Figure 2. (color online) The previous measurements of the
$ ^{\rm{nat}}{\rm{Cu}} $ (n,γ) cross section and the evaluated data.In this work, we measured the neutron capture cross sections of
$ ^{\rm{nat}}{\rm{Cu}} $ from 1 eV to 700 keV, obtaining precise results that clarified the discrepancies among five major evaluated databases: ENDF/B-VIII.1, JEFF-3.3, JENDL-5, CENDL-3.2, and TENDL-2023. Using the SAMMY code, we extracted the resonance parameters for$ ^{\rm{nat}}{\rm{Cu}} $ , and subsequently derived the MACSs for$ ^{63,65}{\rm{Cu}} $ .The paper contents are arranged as below. Section I gives an introduction. Section II describes the experimental setup and conditions. Section III presents the data processing and analysis methods, including the pulse height weighting technique (PHWT), double-bunch mode analysis, and background subtraction procedures. Section IV presents the results of this work. Section V summarizes the key findings and discusses possible future research directions.
-
This work was conducted at the back-streaming white neutron facility (Back-n) of the Chinese Spallation Neutron Source (CSNS), which delivers a continuous neutron energy spectrum from 0.1 eV to 400 MeV, with a peak neutron flux of up to
$ 2\times10^{7}\; {{\rm{cm}}^{-2}{\rm{s}}^{-1}} $ [15].Hydrogen negative ions produced by the ion source are accelerated and stripped by the linear accelerator before injected into the proton synchrotron for further acceleration. The final proton energy reaches 1.6 GeV, with an accelerator operating frequency of 25 Hz during stable operation [16]. The spallation target for proton-induced reactions is composed of 11 tungsten plates of different thicknesses, each covered with 0.5 mm of tantalum, and separated by 1.5 mm layers of cooling water. Under proton beam bombardment, the neutron flux is expected to reach
$ 2.0 \times 10^{16} \, \text{cm}^{-2} \cdot \text{s}^{-1} $ . Surrounding the spallation target from the inside outward are Fe/Be reflector layers, a biological shield, and other complex reflector and moderator components, mainly intended to thermalize neutrons produced by the spallation reaction. The neutron beamline is then directed at a 15-degree angle opposite to the incident proton beam and delivered to ES#2 experimental station [17]. In this experiment, neutron capture cross sections were measured using a$ {{\rm{C}}_{6}{\rm{D}}_{6}} $ detector system based on the total energy detection principle, as shown in Fig. 3.
Figure 3. (color online) Photo of the
$ {{\rm{C}}_{6}{\rm{D}}_{6}} $ detector system at Back-n. The position angle of the detector and the target holder relative to the neutron beam is the same as that of Ref. [18].The
$ {{\rm{C}}_{6}{\rm{D}}_{6}} $ detector system consists of four$ {{\rm{C}}_{6}{\rm{D}}_{6}} $ detectors, an aluminum detector holder, and an aluminum sample holder [19]. The detectors primarily consist of scintillator probes, photomultiplier tubes (PMT), and signal output pins. The$ {{\rm{C}}_{6}{\rm{D}}_{6}} $ liquid scintillator used in the detectors is EJ315, produced by Eljen Technology Co. The scintillator is contained in an aluminum shell with a diameter of 130.00 mm, length of 76.2 mm, and thickness of 1.5 mm. The photomultiplier tube within the detector generates two output signals: one from the dynode and the other from the anode [17]. In this experiment, only the anode signal was utilized due to its significantly faster time response compared to the dynode signal. The anode signal exhibits a negative pulse with a rise time of 18 ns and a decay time of approximately 80 ns. During the experimental measurements, the amplitude of the anode signals ranged between 0.01 and 3.0 V. These signals were transmitted to a data acquisition system (DAQ) [16] in the probe system, which digitized the analog signals into full waveform data at a sampling rate of 1 GS/s and a resolution of 12 bits. Simultaneously, the timestamps of the proton pulse emission and detection of the de-excitation γ-rays from neutron capture were recorded and saved by the DAQ [20, 21]. This enabled the determination of the incident neutron energy responsible for radiative capture to be determined using the TOF method [22]. In the non-relativistic case, the neutron energy is derived from the kinetic energy expression:$ E_{\rm{n}}=\frac{1}{2}m_{\rm{n}}\left(\frac{L}{t_\text{n}}\right)^{2}=\left(\frac{72.30L}{t_\text{n}}\right)^{2}, $
(1) where
$ E_{\rm{n}} $ is the neutron energy,$ m_{\rm{n}} $ is the neutron mass with a value of 939.57$ {{\rm{MeV}}/{\rm{c}}^{2}} $ , L is the flight distance, and$ t_\text{n} $ is the flight time of the neutron. The numerical constant 72.30 has units of${{\rm{eV}}^2\cdot\mu {\rm{s}}/{\rm{m}}^2}$ . The flight distance was calibrated and determined using a$ ^{197}{\rm{Au}} $ standard sample. Based on the comparison and correction of the$ ^{197}{\rm{Au}} $ yield with the yield of the evaluated data, the flight distance$ L=77.15 $ m was determined.In this experiment, four target materials were utilized:
$ ^{\rm{nat}}{\rm{Cu}} $ ,$ ^{\rm{nat}}{\rm{C}} $ ,$ ^{\rm{nat}}{\rm{Pb}} $ , and$ ^{197}{\rm{Au}} $ . The$ ^{\rm{nat}}{\rm{C}} $ sample was used to subtract the scattered neutron background, while the$ ^{\rm{nat}}{\rm{Pb}} $ sample was used to subtract the in-beam gamma background. The empty target was used to subtract sample-independent background. The$ ^{197}{\rm{Au}} $ sample was primarily used to calibrate the neutron flight distance L and normalization. The specific parameters of the target are shown in Table 1.Material Diameter(mm) Thickness(mm) Mass(g) Purity $ \mathrm{^{nat}Cu} $ 40.0 ± 0.01 1.0 ± 0.01 10.82 ± 0.01 $>99.99$ %$ \mathrm{^{nat}C} $ 40.0 ± 0.01 1.0 ± 0.01 2.58 ± 0.01 $>99.9$ %$ \mathrm{^{197}Au} $ 40.0 ± 0.01 0.2 ± 0.01 4.77 ± 0.01 $>99.99$ %$ \mathrm{^{nat}Pb} $ 40.0 ± 0.01 1.0 ± 0.01 13.39 ± 0.01 $>99.9$ %empty — — — — Table 1. Specifications of the targets used in the experiment.
-
To obtain reliable pulse height spectra in the PHWT, energy calibration of the
$ {{\rm{C}}_{6}{\rm{D}}_{6}} $ detector was performed using multiple radioactive sources to cover a wide energy range. The sources used included$ ^{22}{\rm{Na}} $ for the low-energy region,$ ^{137}{\rm{Cs}} $ as a mid-energy reference, and a PuC source to constrain the high-energy response above several MeV [17].The optimal conditions for total energy type detectors require that, for a single neutron capture reaction, only one γ-ray from the cascade emissions is detected. Thus, low detection efficiency is preferred. The detection efficiency for the capture reaction is approximately equal to the sum of the detection efficiencies for the cascade γ-rays.
$ \varepsilon_c=1-\prod(1-\varepsilon_{\gamma i})\approx\sum\varepsilon_{\gamma_i}, $
(2) where
$ \varepsilon_c $ represents the detection efficiency of the capture reactions, and$ \varepsilon_{\gamma_i} $ denotes the detection efficiency of the i-th cascade γ-rays. Assuming the γ-ray detection efficiency is directly proportional to the γ-ray energy$ E_{\gamma} $ :$ \varepsilon_{\gamma}=\alpha E_{\gamma}, $
(3) thus,
$ \varepsilon_c=\alpha\sum E_{\gamma_i}. $
(4) To ensure that Eq. (4) is satisfied, the response function of the detection system must be mathematically adjusted to establish the relationship expressed in Eq. (3). A weighting function
$ W(E_{\rm{dep}}) $ is introduced such that Eq. (5) holds:$ \int_{E_L}^\infty R(E_{\rm{k,dep}},E_{\gamma_i})W(E_{\rm{dep}})dE_{\rm{dep}}=\alpha E_{\gamma_i}. $
(5) Where
$ E_L $ denotes the threshold of the pulse height spectrum;$ E_{\rm{k,dep}} $ represents an energy bin within the pulse height spectrum;$ E_{\rm{dep}} $ is deposited energy;$ W(E_{\rm{dep}}) $ is the weighting function corresponding to the pulse height at$ E_{\rm{dep}} $ ; and$ R(E_{\rm{k,dep}},E_{\gamma_i}) $ represents the counts in the pulse height spectrum at$ E_{\rm{dep}} $ after applying the energy response function. Twenty groups of mono-energetic γ-rays with an energy range from 0.15 MeV to 9.0 MeV were simulated, which covered the energy range (180 keV) from to the maximum deposition energy (7.0 MeV) in the current measurement.According to Taylor's formula,
$ W(E_{\rm{dep}}) $ can be expressed as a polynomial of the fourth or fifth degree,$ W(E_{\rm{dep}})=\sum\limits_{k=1}^4a_kE_{\rm{dep}}^k, $
(6) where
$ a_k $ represents the polynomial coefficients obtained by reformulating Eq. (5) into Eq. (7) and applying a fitting procedure.$ \chi^2=\sum[\alpha E_{\gamma_i}-\int_{E_L}^\infty R(E_{\rm{dep}},E_{\gamma_i})W(E_{\rm{dep}})dE_{\rm{dep}}]^2. $
(7) In this work,
$ W(E_{\rm{dep}}) $ was obtained from the response functions for monoenergetic γ-rays, which were calculated using detailed Monte-Carlo simulations of the experimental setup with the GEANT4 toolkit. The$ {{\rm{C}}_{6}{\rm{D}}_{6}} $ detection system at the Back-n beamline was modeled in detail in the simulation, including the scintillator cell, light guide, photomultiplier tube, and supporting structures. Monoenergetic γ rays were emitted from the sample position with an isotropic angular distribution. By analyzing the energy deposition spectra in the detector, the response functions$ R(E_{\rm{dep}}, E_\gamma) $ were obtained for different γ-ray energies. These response functions were then used to construct the weighting function for the PHWT. The detection efficiency of the$ {{\rm{C}}_{6}{\rm{D}}_{6}} $ detector and the weighting function are shown in Fig. 4. It can be clearly observed that there is no linear relationship between the original detection efficiency of the detector and the energy of γ-rays. After weighting, the relationship is approximately linear, with the coefficient remaining close to 1.
Figure 4. (color online) (a) The
$ {{\rm{C}}_{6}{\rm{D}}_{6}} $ original efficiency. (b) efficiency of the detector weighted by the WF. (c) The ratio of weighted efficiency to γ-ray energy. (d) Weight function of$ {{\rm{C}}_{6}{\rm{D}}_{6}} $ detector.The neutron capture reaction yield and the neutron capture cross section can be obtained by the following calculation based on the weighted pulse height count spectrum [23]:
$ Y_w(E_{\rm{n}})=\frac{N_w(E_{\rm{n}})}{I(E_{\rm{n}})\times(S_{\rm{n}}+E_{\rm{n}})}, $
(8) and,
$ \sigma_c(E_{\rm{n}})=Y_w(E_{\rm{n}})\frac{\sigma_t(E_{\rm{n}})}{1-e^-{N\sigma_t(E_{\rm{n}})t}{f_c(E_{\rm{n}}})}. $
(9) In these formulas,
$ Y_{w}(E) $ is the weighted neutron capture reaction yield;$ N_{w}(E_{\rm{n}}) $ is the weighted pulse height spectrum;$ S_{\rm{n}} $ is the target neutron binding energy;$ I(E_{\rm{n}}) $ is the neutron flux;$ \sigma_c(E_{\rm{n}}) $ is the neutron capture cross section;$ \sigma_{t}(E) $ indicates the total cross section at different neutron energies; N is the atomic density; t is the target thickness; and$ f_{c}(E_{\rm{n}}) $ is the energy dependent multiple scattering correction factor. -
In this experiment, the proton accelerator at CSNS was operated in the double-bunch mode. Two proton beams separated by 410 ns in a pulse result in the superposition of two events, which produces a higher neutron flux [24]. Therefore, the resolution of the neutron TOF deteriorates compared with that of a single beam cluster. In order to solve this problem, Yi et al. [25] have developed a double-bunch unfolding methods, which is based on Bayes’ theorem and an iterative algorithm, and successfully reduces the TOF/energy spectrum of a double-beam to that of a single-beam.
As shown in Fig. 5, the peak positions after spectrum resolution (red line) align more closely with the evaluated data compared to those before spectrum resolution (blue line), where the peak positions tend to be systematically lower. Furthermore, the post-resolution data successfully reconstructs additional resonant peaks, such as those near 5502, 6102, and 6572 eV. While the pre-resolution data struggles to distinguish single-peak or double-peak structures, the post-resolution data provide significantly more precise reconstructions.

Figure 5. (color online) (a) Comparison of cross section results before and after spectrum resolution in the energy range of 5200-8000 eV. (b) TENDL-2023 database of
$ ^{\rm{nat}}{\rm{Cu}} $ . -
The preprocessed and normalized original spectrum of different targets according to proton numbers are shown in Fig. 6(a). The
$ {{\rm{C}}_{6}{\rm{D}}_{6}} $ detectors have very low neutron sensitivity, making direct neutron detection negligible. There are two main types of backgrounds in this experiment, sample-dependent background$ B_\text{sample}(t_\text{n}) $ and sample-independent background$ B_\text{empty}(t_\text{n}) $ . The total background$ B(t_\text{n}) $ can be expressed as: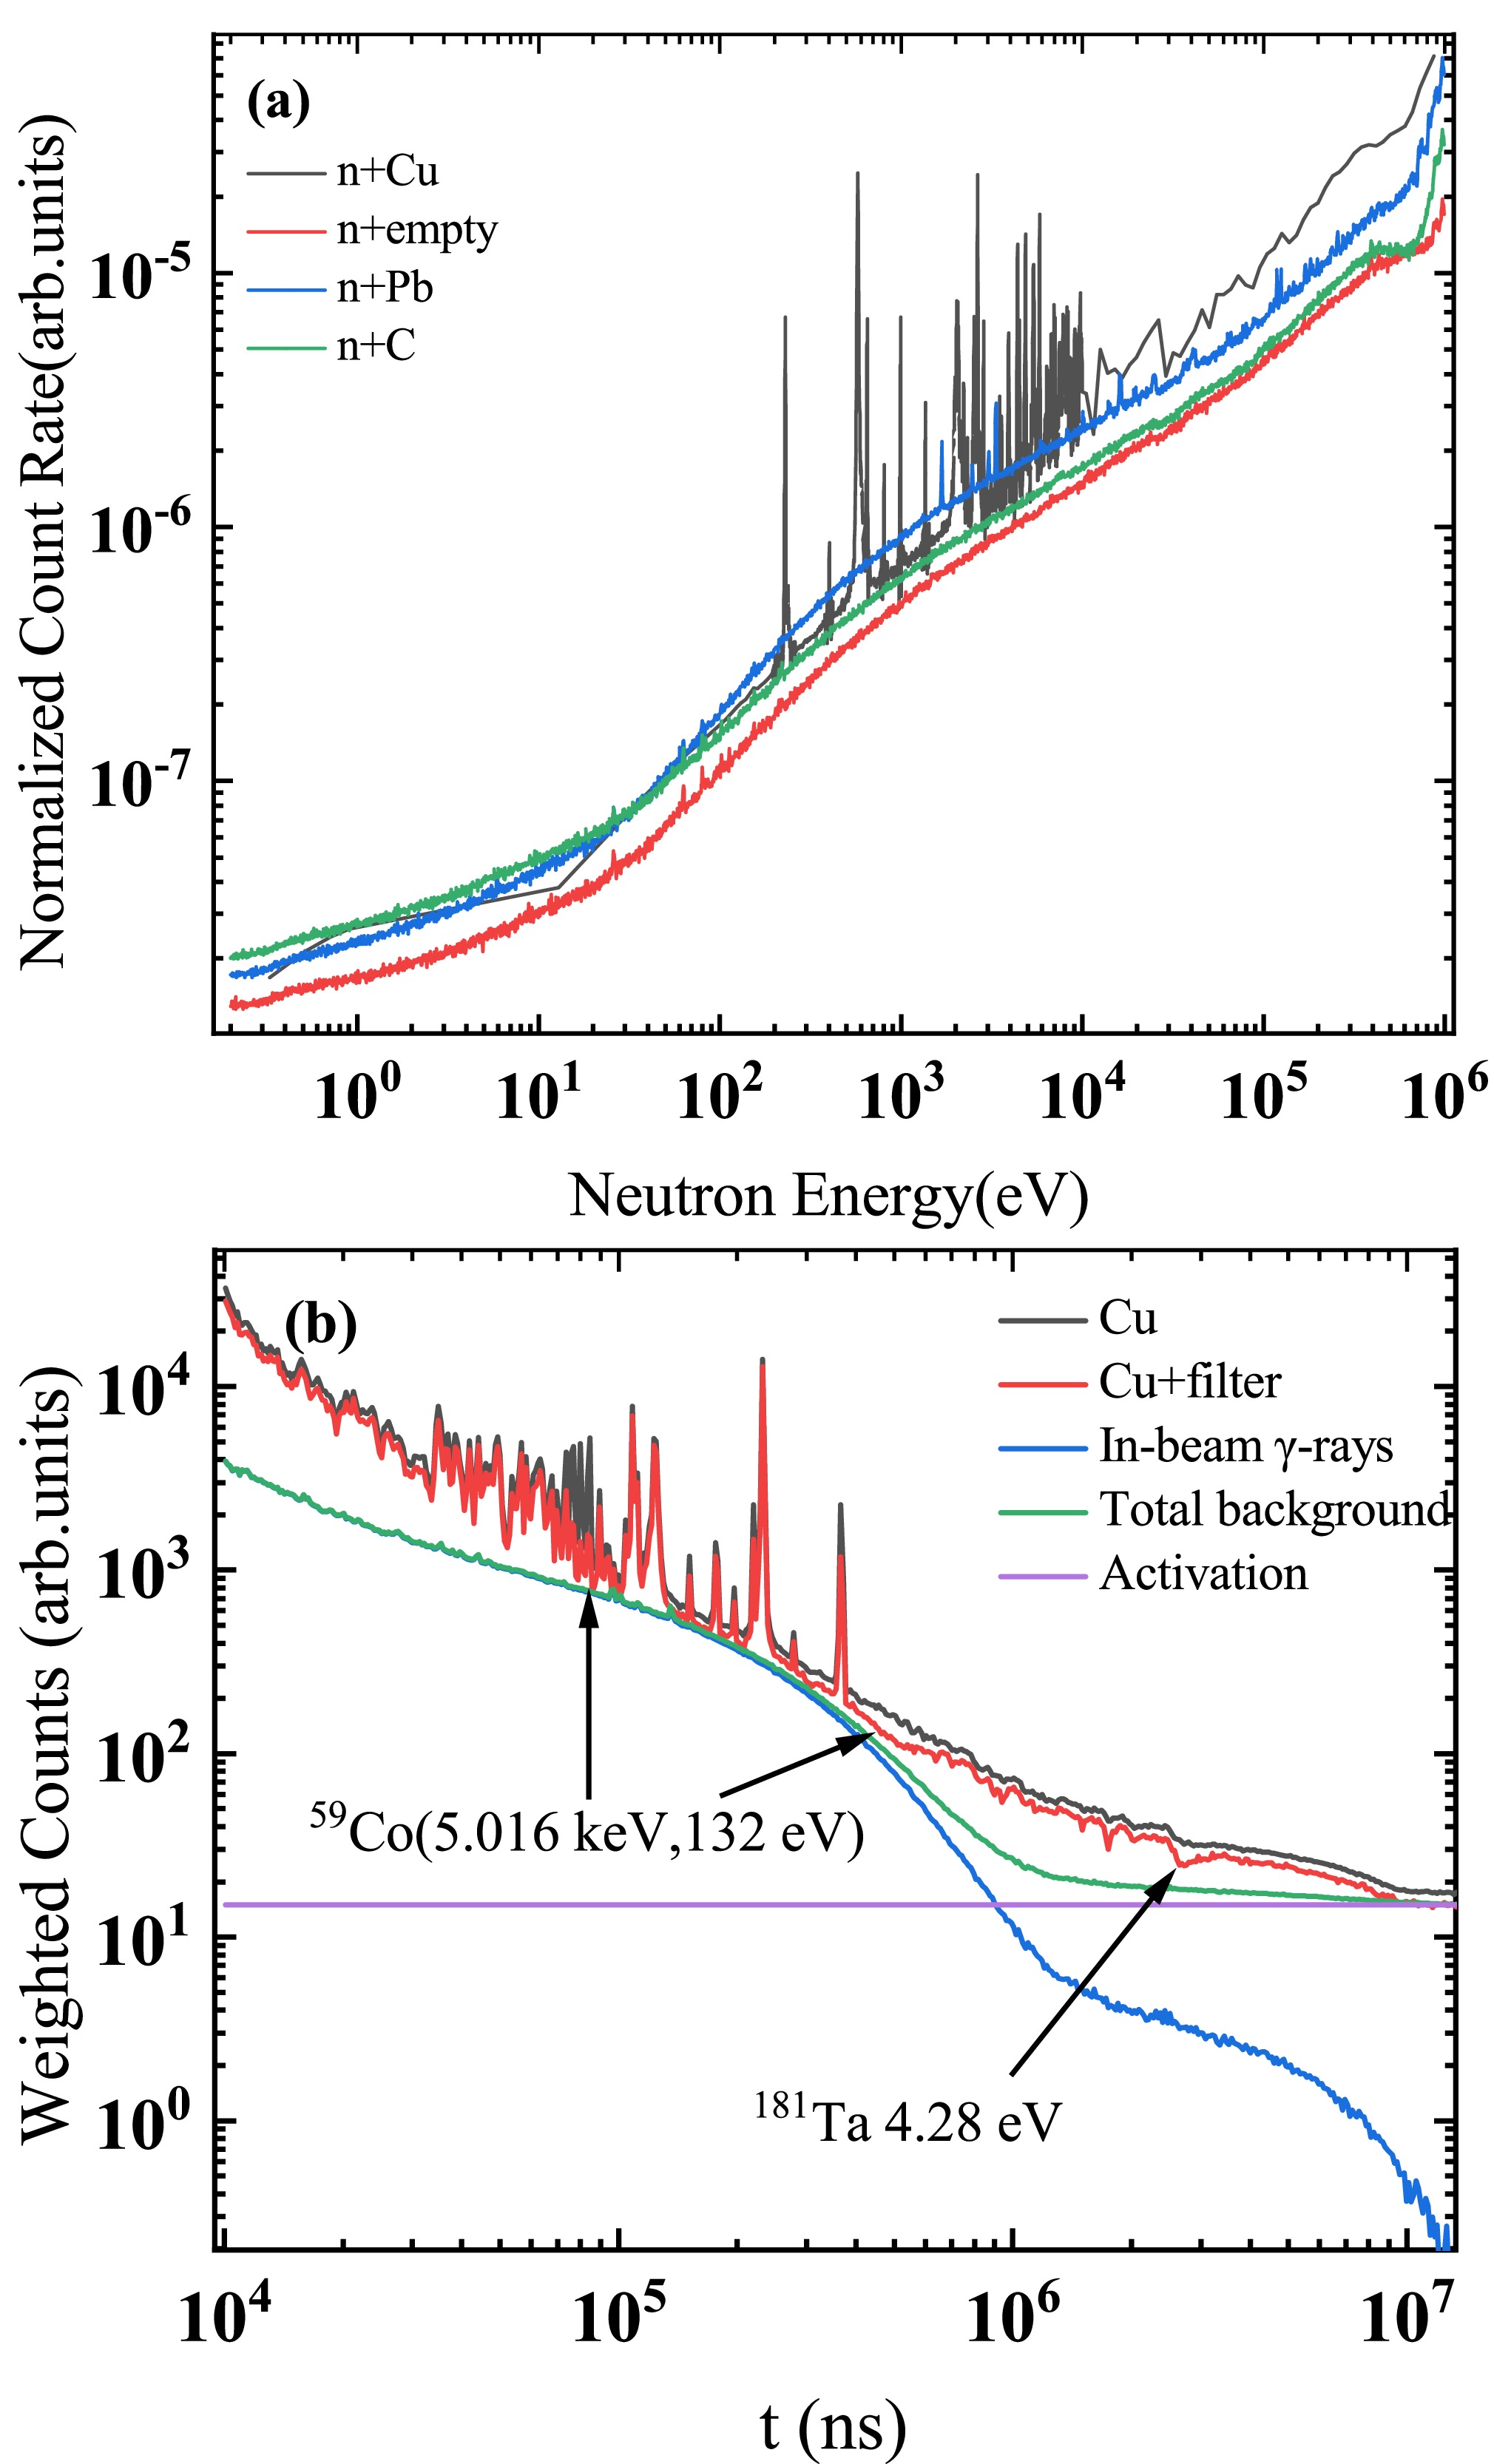
Figure 6. (color online) (a) Preprocessed and normalized original spectra of
$ ^{\rm{nat}}{\rm{Cu}} $ ,$ ^{\rm{nat}}{\rm{C}} $ ,$ ^{\rm{nat}}{\rm{Pb}} $ , and the empty target. (b) Residual spectrum of$ ^{\rm{nat}}{\rm{Cu}} $ sample with and without filter (red and gray line). The in-beam gamma background (blue line) is normalized to the levels at the energy of several black resonances. The total background (green line) includes$ B_\text{empty}(t_\text{n}) $ ,$ B_{\text{sn}}(t_\text{n}) $ ,$ B_{\text{s}\gamma}(t_\text{n}) $ and$ B_{\text{ac}}(t_\text{n}) $ .$ B(t_n)=B_\text{sample}(t_\text{n})+B_\text{empty}(t_\text{n}), $
(10) The contribution of
$ B_\text{empty}(t_\text{n}) $ was directly measured using an empty sample in the experiment. The sample-dependent background$ B_\text{sample}(t_\text{n}) $ is caused by interactions between the sample and all types of in-beam particles, including the background from scattered neutrons$ B_{\text{sn}}(t_\text{n}) $ , the background from scattered in-beam γ-rays$ B_{\text{s}\gamma}(t_\text{n}) $ , and the background from sample activation$ B_{\text{ac}}(t_\text{n}) $ . Therefore, the sample-dependent background can be expressed as:$ B_{\text{sample}}(t_\text{n})= B_{\text{sn}}(t_\text{n})+ B_{\text{s}\gamma}(t_\text{n})+ B_{\text{ac}}(t_\text{n}). $
(11) $ B_{\text{sn}}(t_\text{n}) $ represents the scattered-neutron background, which arises from neutrons scattered by the target and subsequently interacting with the surroundings to emit γ-rays. In the energy region of experimental interest (1 eV-700 keV), the neutron capture cross section of the carbon target is significantly smaller than its neutron elastic scattering cross section. To account for the varying neutron scattering capabilities of different targets, the scattered-neutron background$ B_{\text{sn}}(t_\text{n}) $ is determined using the following equation:$ B_{\rm{sn}}(t_\text{n})=\frac{Y_\text{Cu,el}(t_\text{n})}{Y_\text{C,el}(t_\text{n})}(C_\text{C}(t_\text{n})-C_{\text{empty}}(t_\text{n})). $
(12) Where
$ Y_\text{Cu,el}(t_\text{n}) $ and$ Y_\text{C,el}(t_\text{n}) $ are the theoretical yields calculated based on the elastic-scattering cross sections and total cross sections, with the cross section data obtained from the TENDL-2023 database.$ C_\text{C}(t_\text{n}) $ denotes the counts corresponding to the carbon target, while$ C_{\text{empty}}(t_\text{n}) $ represents the counts corresponding to the empty target.$ B_{\text{s}\gamma}(t_\text{n}) $ denotes the in-beam γ-ray background, which arises from the large number of γ-rays produced when the proton beam strikes the spallation target, either directly detected by the detectors or after undergoing Compton scattering by the surroundings and the target at ES#2. This component of the background was evaluated using measurements with a$ ^{\rm{nat}}{\rm{Pb}} $ target [26]. The$ ^{\rm{nat}}{\rm{Pb}} $ target is characterized by a low neutron capture-to-scattering ratio and a relatively high interaction cross section with γ-rays. Additionally, an experiment was conducted with a$ ^{\rm{nat}}{\rm{Cu}} $ target and filter. A 1.4-mm-thick$ ^{59}{\rm{Co}} $ and a 1.0-mm-thick$ ^{181}{\rm{Ta}} $ were used as the filter to eliminate neutrons near the energies of 5.016 keV, 132 eV, and 4.28 eV. This resulted in the formation of absorption dips in the TOF spectrum around these energy regions, and the counts at the bottom of these dips can be attributed to the background counts caused by in-beam γ-rays. By normalizing the in-beam γ background of$ ^{\rm{nat}}{\rm{Pb}} $ targets to the absorption dips formed by the Co-Ta filter, the background can be deduced using the normalization coefficient K [27]. Thus, the in-beam γ background can be calculated using the following formula:$ B_{\text{s}\gamma}(t_\text{n})=K(C_\text{Pb}(t_\text{n})-C_\text{empty}(t_\text{n})-B_\text{sn,Pb}(t_\text{n})). $
(13) Where
$ C_\text{Pb}(t_\text{n}) $ denotes the counts corresponding to the lead target,$ C_\text{empty}(t_\text{n}) $ denotes the counts corresponding to the empty target, and$ B_\text{sn,Pb}(t_\text{n}) $ is the neutron-scattering background for the lead target, which can be obtained in a manner similar to that described in Eq. (12).$ B_\text{ac} (t_\text{n}) $ represents the activation background. When neutrons strike the target, they induce excitation or transformation of the target into radioactive isotopes. These radioactive isotopes continuously emit energy, typically in the form of γ-rays, which remains relatively constant over a certain period. A 1.0-mm-thick cadmium absorber was placed at the front of the neutron shutter to absorb neutrons with an energy lower than 0.3 eV (TOF>$ 1.0 $ ×$ 10^7 $ ns). Consequently, the counts measured after$ 1.0 $ ×$ 10^7 $ ns are attributed to the activation background and are subsequently subtracted. The background components in this measurement are shown in Fig. 6(b). -
In the resolved resonance region (RRR), corrections have been incorporated into the SAMMY fit, including Doppler broadening and resolution broadening corrections, multiple scattering corrections for yield, self-shielding corrections for sample targets, normalization and background corrections, etc. In the URR, the self-shielding and multiple scattering effects were corrected through
$ f_{c}(E_{\rm{n}}) $ , which was obtained from Geant4 simulations [28] and applied in Eq. (9). The self-shielding effect involves a variation in the neutron beam intensity$ I(E_{\rm{n}}) $ with the target thickness, while the multiple scattering effect of neutron in the target may cause the actual moving path of particles in the target to be larger than the target thickness. The values of$ f_{c}(E_{\rm{n}}) $ are defined as the ratio of the average simulated neutron path length to the physical thickness of the target and are shown in Fig. 7.
Figure 7. The
$ f_{c} $ target thickness correction factor.The saturated resonance technique was applied to determine the normalization factor with high accuracy. In this work, the normalization was based on the widely adopted 4.9 eV resonance of the
$ ^{197} {\rm{Au}}$ (n,γ) reaction [29]. For this resonance, the radiative width is much larger than the neutron width ($ \Gamma_\gamma/\Gamma_n\approx8 $ ) [30]. For a sufficiently thick gold sample, nearly all neutrons traversing the sample within the resonance energy region undergo radiative capture, even if their first interaction is elastic scattering, leading to an almost 100% capture yield at 4.9 eV and providing an absolute normalization point that is insensitive to the detailed resonance parameters. -
Uncertainties primarily come from experimental conditions and data analyses [31, 32]. According to Chen et al. [33] analysis of the Back-n neutron beam energy spectrum, the uncertainty of the energy spectrum below 0.15 MeV is less than 8.0%, and the uncertainty of the energy spectrum above 0.15 MeV is 2.3%−4.5%. In addition, the experiment recorded an uncertainty of about 1.5% for the CSNS proton beam current. The uncertainties in the data analysis mainly come from the PHWT method [34]. For the
$ {{\rm{C}}_{6}{\rm{D}}_{6}} $ detector system on the Back-n of CSNS, the systematic uncertainty of the PHWT is approximately 1.1% [17]. To conservatively account for the potential systematic effect of the sample itself on the PHWT, this study estimates this uncertainty to be 2.0%. The normalization uncertainty is less than 1.5%. The total uncertainty of the experimental results is less than 9.25%. The entire uncertainty is provided in Table 2.Uncertainty source Value Experiment conditions Neutron energy spectrum ( $ \le0.15 $ MeV)<8.0% Neutron energy spectrum ( $ \ge0.15 $ MeV)<4.5% Proton beam power <1.5% Sample parameters <0.1% Data Analysis Uncertainty from PHWT <2.0% Double-bunch unfolding methods <2.0% Normalization <1.5% Background subtraction <2.0% Experimental corrections <1.0% Statistical error Statistic Uncertainty $< $ 2.0%Table 2. The statistic uncertainty and systematic uncertainty of this experiment.
-
For the RRR, we used the R-matrix SAMMY code [35] to analyze the resonances of
$ ^{\rm{nat}}{\rm{Cu}} $ in the range of 1 eV to 10 keV. The code accounts for all experimental effects including multiple scattering, self-shielding, Doppler broadening, and resolution broadening. The resonance broadening due to the neutron energy resolution function was also considered in the SAMMY fits through the implemented RPI parametrization [36]. The final fitting results, as shown in Fig. 8, demonstrate excellent agreement with the experimental data.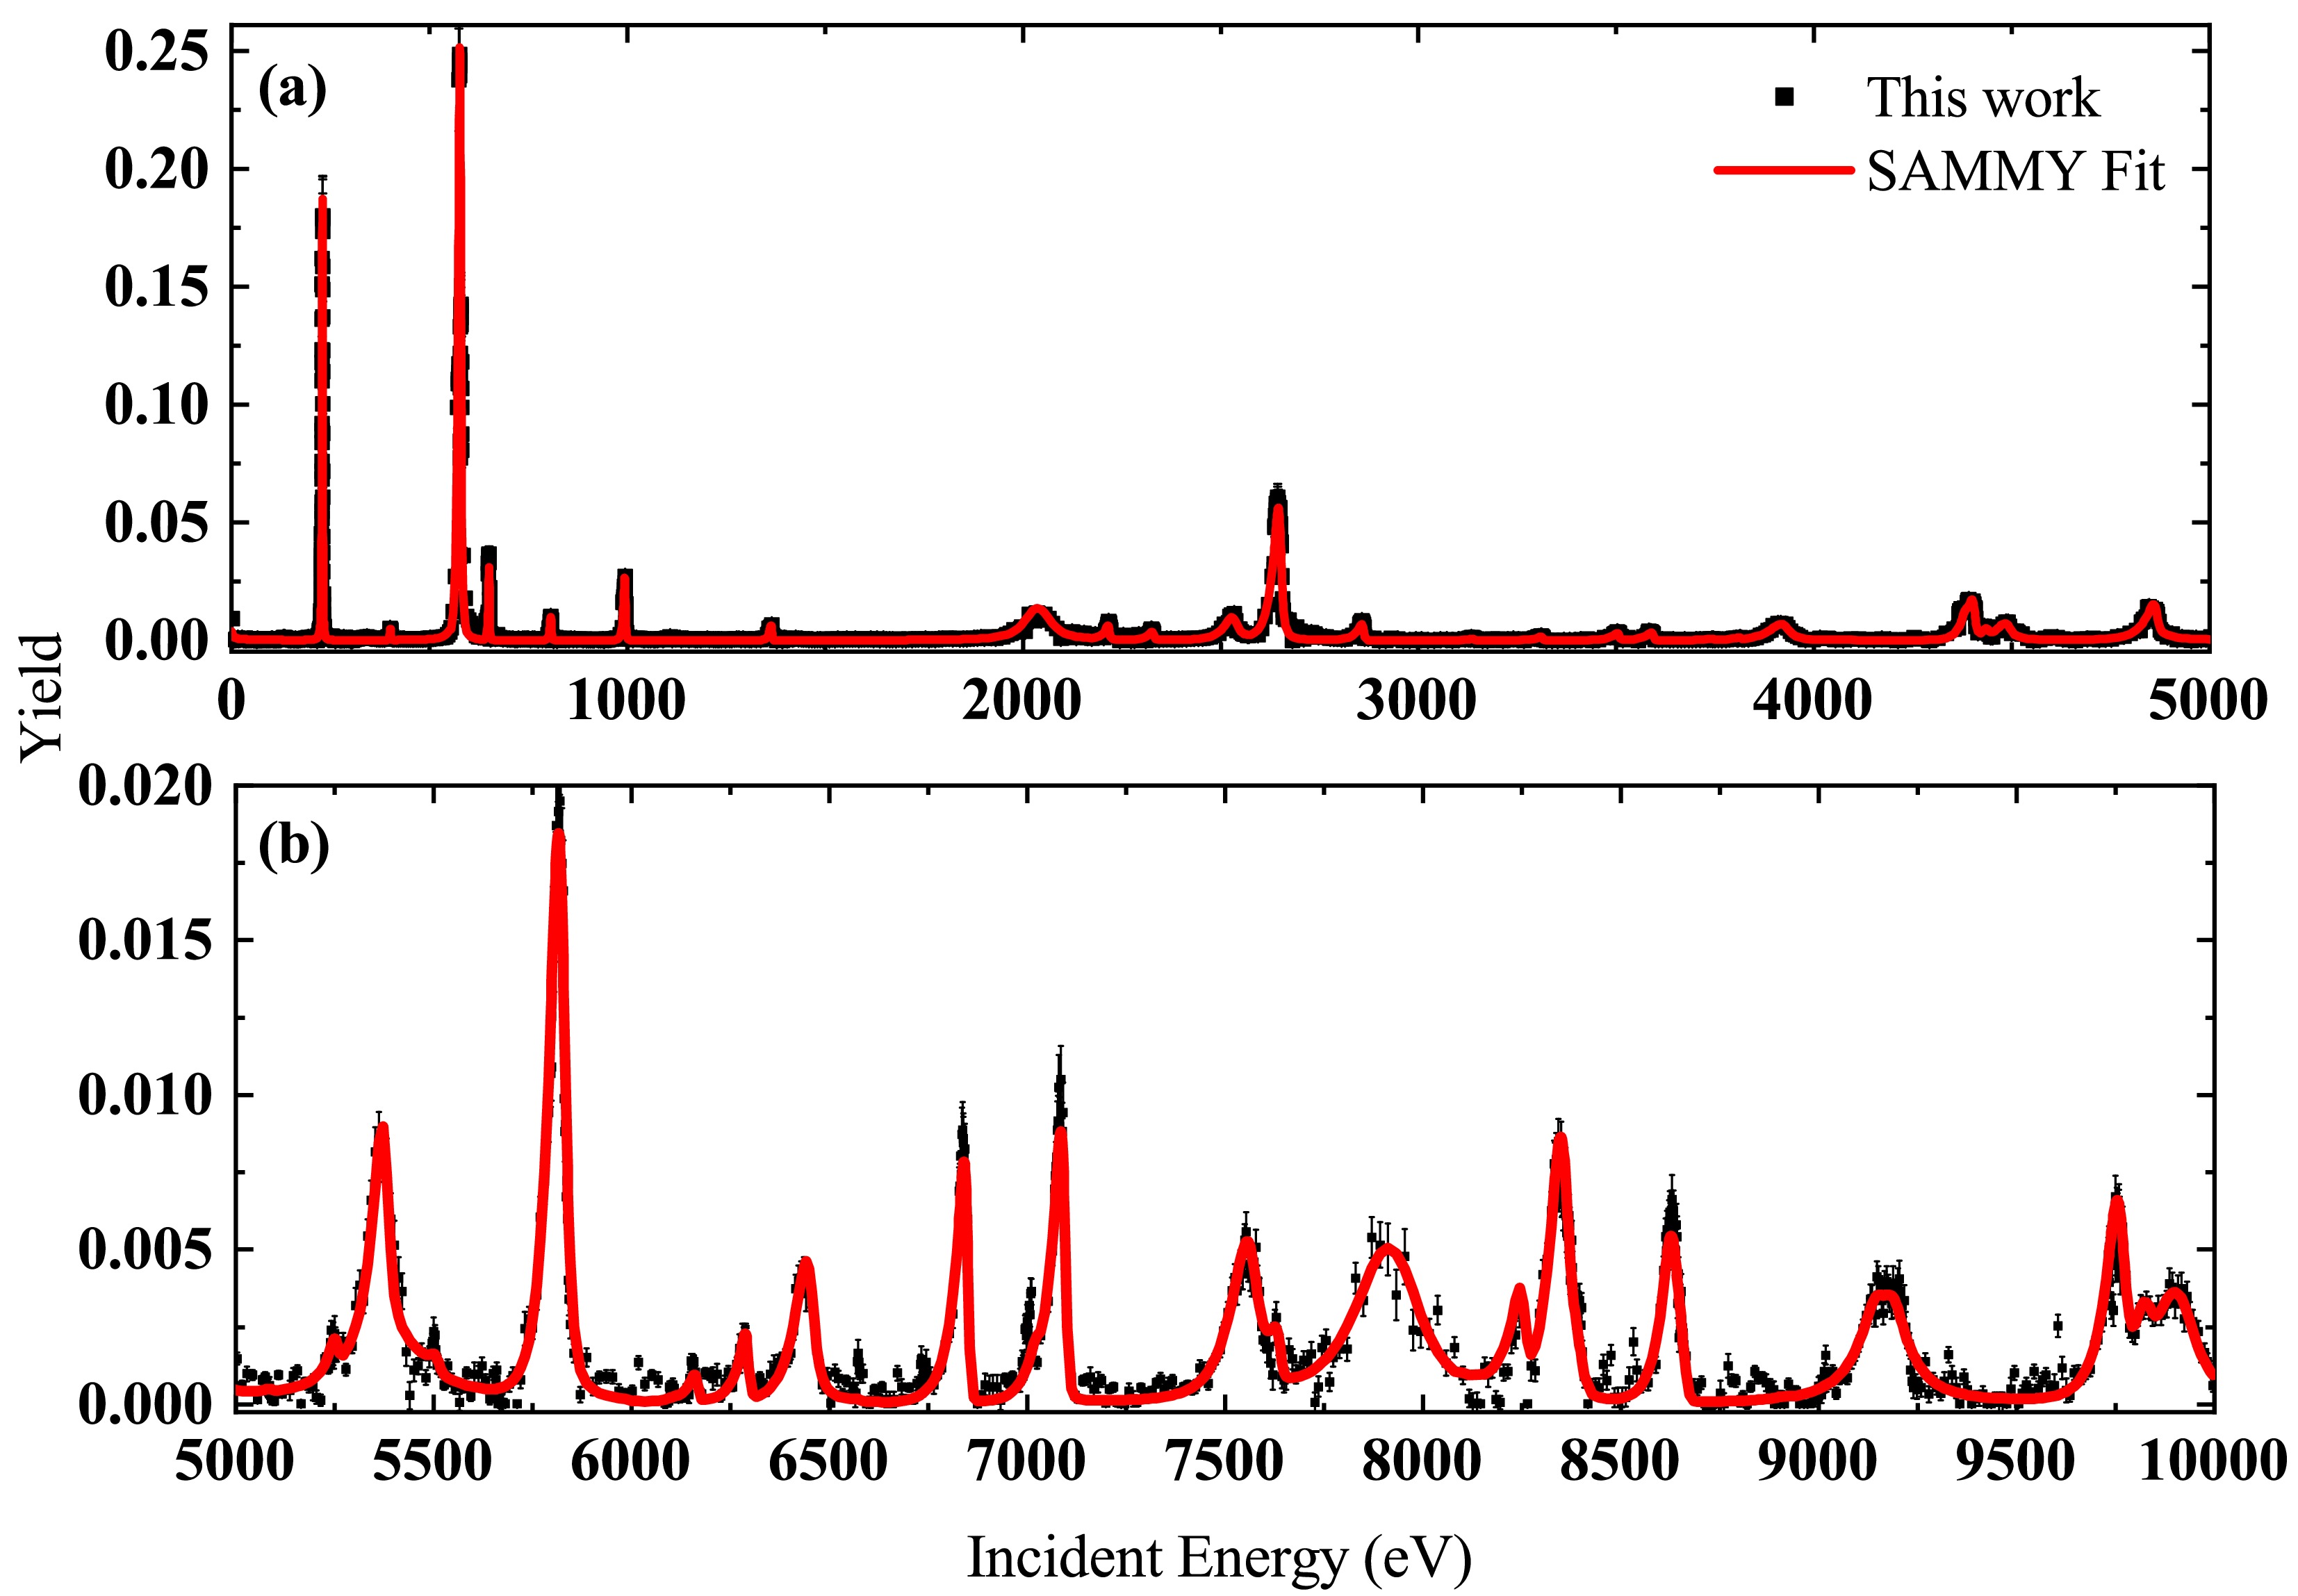
Figure 8. (color online) Experimental capture yields fitted by R-matrix code.
During the analytical fitting process, we extracted resonance parameters, including resonance energy, radiative width
$ \Gamma_\gamma $ , and neutron width$ \Gamma_\text{n} $ . The input parameters for the fitting procedure were primarily obtained from the evaluated data of TENDL-2023. We defined the radiative kernel k and the spin statistical factor g:$ k=g\frac{\Gamma_\text{n}\Gamma_\gamma}{\Gamma_\text{n}+\Gamma_\gamma}, $
(14) $ g=\frac{2J+1}{(2s+1)(2I+1)}, $
(15) where s is the spin of the neutron with a value of 1/2, I is the ground state spin of the target nucleus;
$ J=|L+S| $ ,$ S=s+I $ , and L is the orbital angular momentum. The fitted resonance parameters are openly available in the Science Data Bank repository (see Data availability statement).In the RRR, due to the low density of the resonance energy level of
$ ^{\rm{nat}}{\rm{Cu}} $ , some fluctuations caused by the influence of the neutron spectrum structure can be observed, such as many nonsmooth structures appearing at 132.83 eV, 342.56 eV, and 1109.02 eV, as shown in Fig. 9.
Figure 9. (color online) (a) This measurement of
$ ^{\rm{nat}}{\rm{Cu}} $ (n,γ) cross section (red dots). (b) Neutron spectrum of Back-n.Notably, the evaluated data of ENDF/B-VIII.1, CENDL-3.2, and TENDL-2023 exhibit resonances at about 2215, 2323, 2857, 3744, 5083, 5503, 6103, 8895, and 9007 eV, while JEFF-3.3 and JENDL-5 show no resonances at these energies. The evaluated data of CENDL-3.2 and TENDL-2023 show a clear resonance at about 8263 eV, while ENDF/B-VIII.1, JEFF-3.3, and JENDL-5 do not. The experimental data show resonance structures at about 2215, 2323, 2857, 3744, 5503, 6103, 8263, and 9007 eV, as shown in Fig. 10. However, the structures near 5083 and 8895 eV appear only as weak local fluctuations and cannot be clearly resolved under the present experimental conditions.
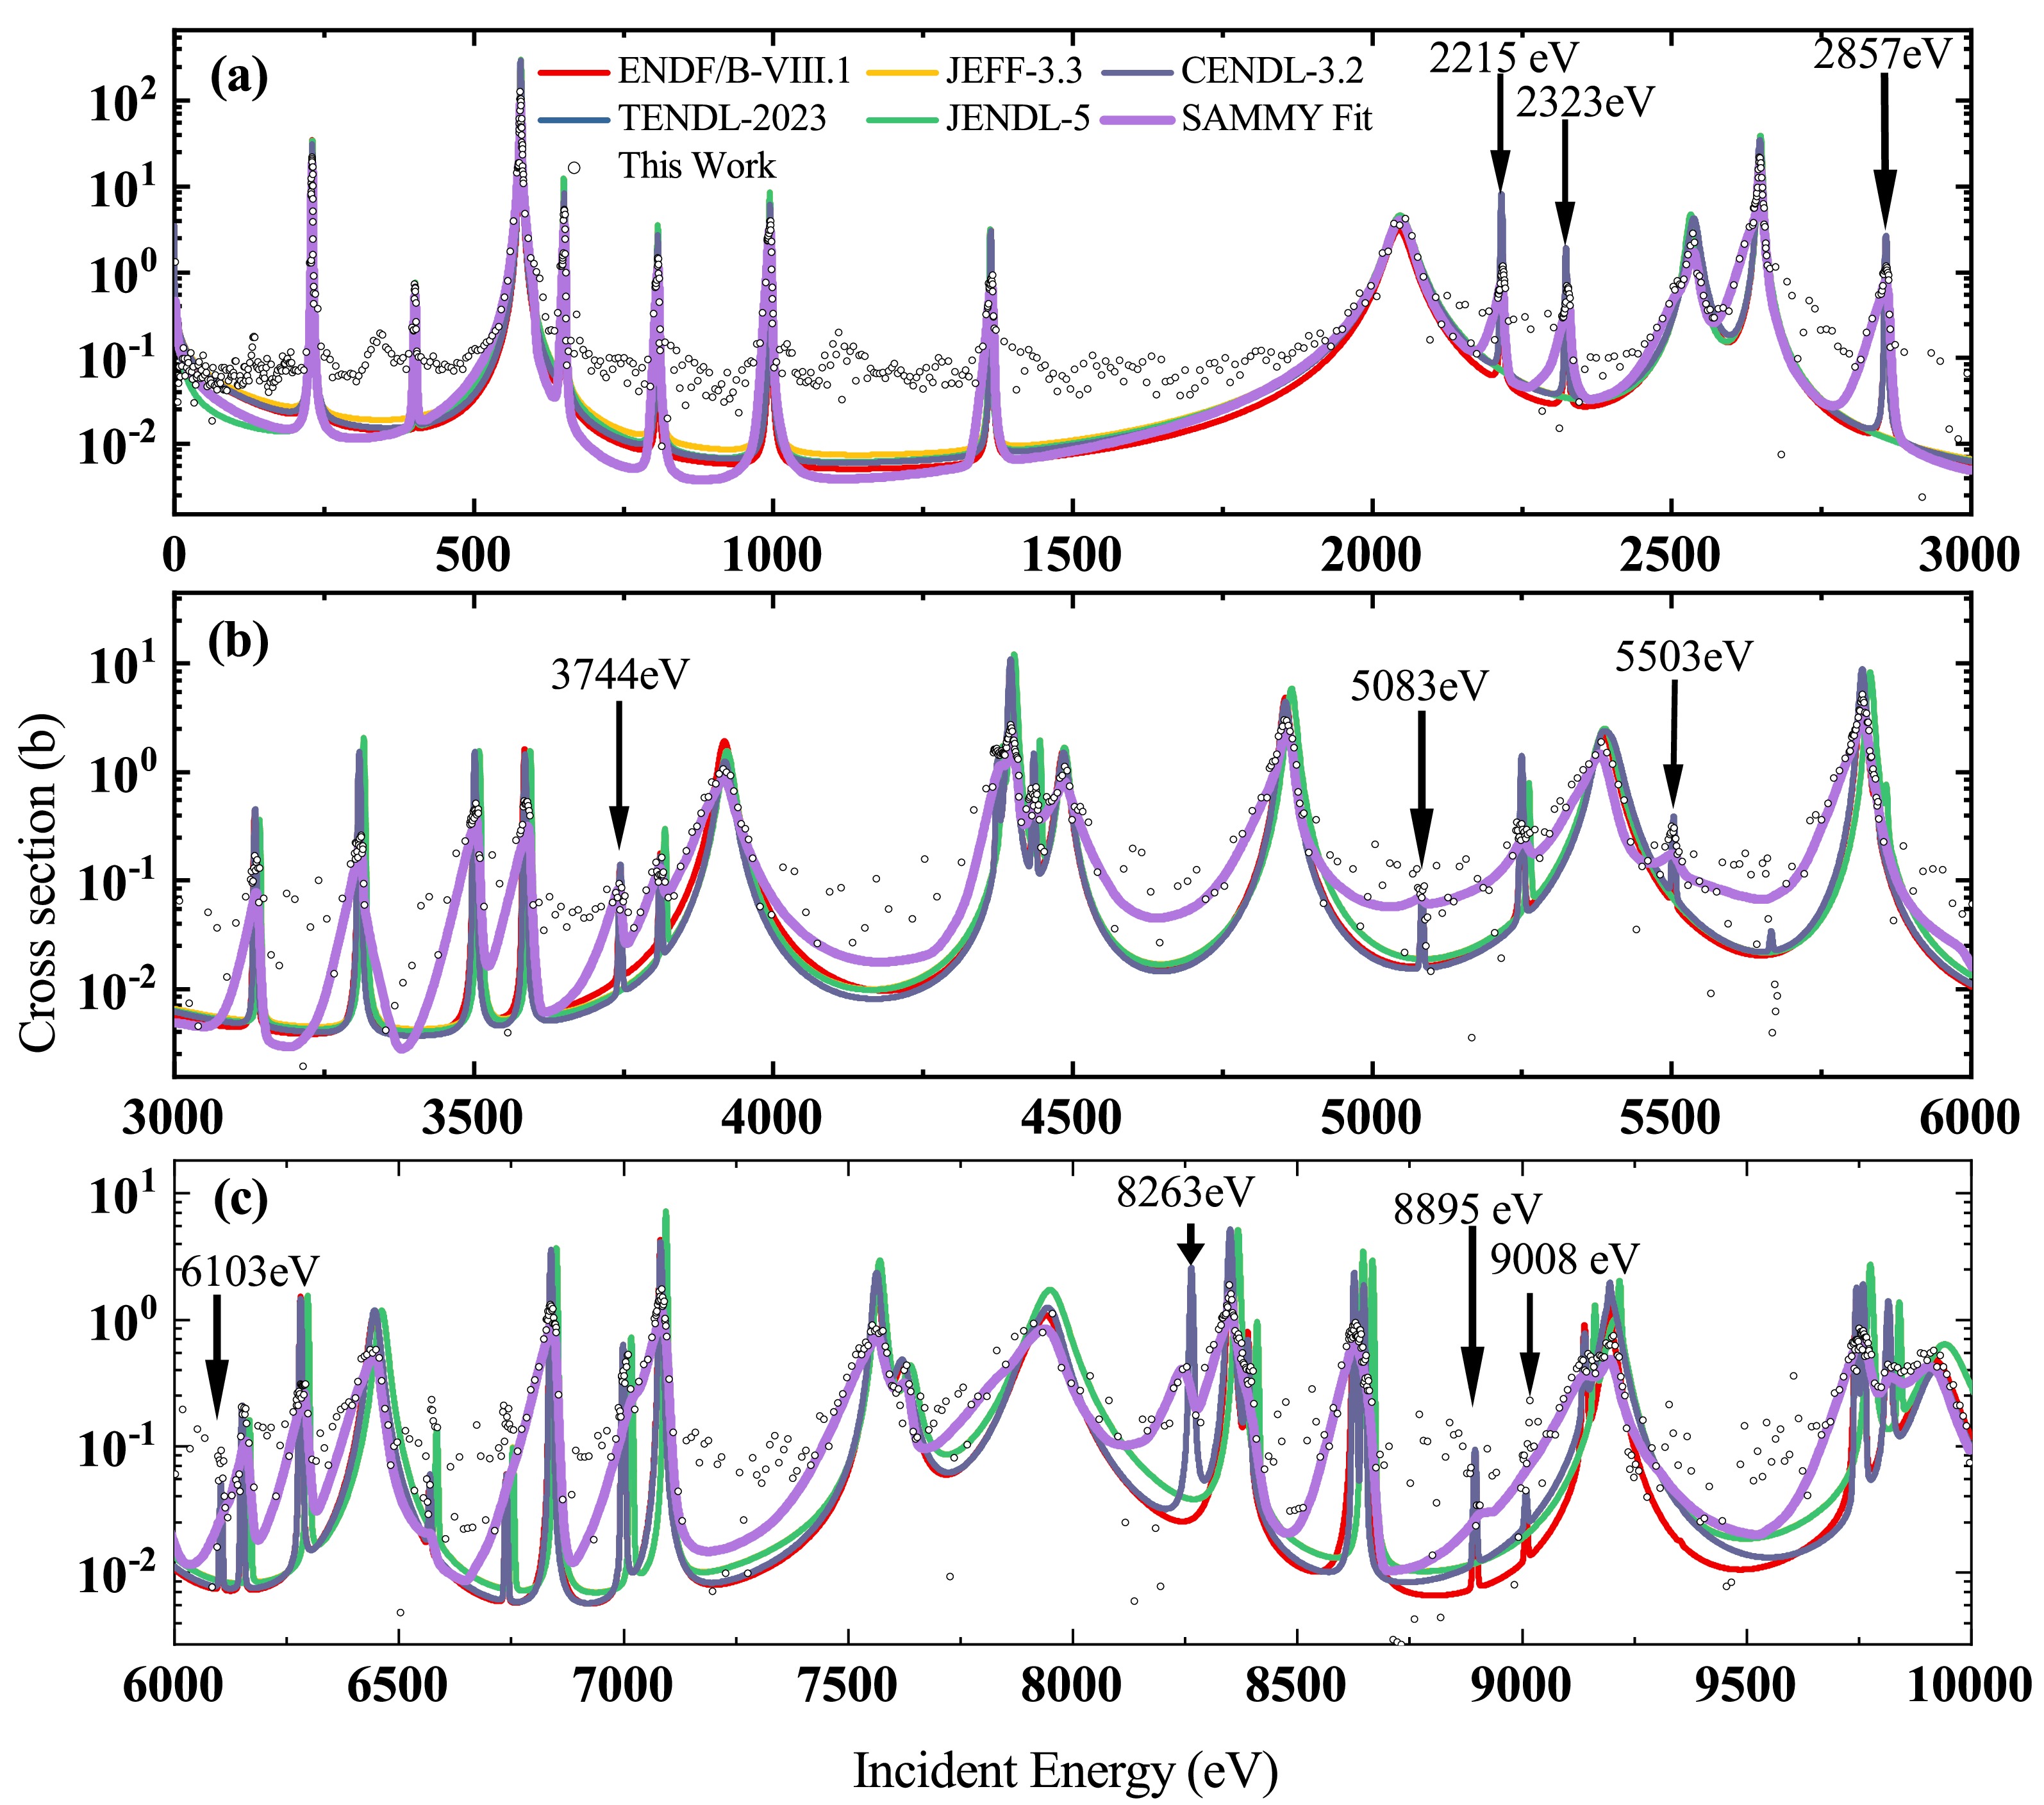
Figure 10. (color online) The neutron capture cross section for
$ ^{\rm{nat}}{\rm{Cu}} $ in the range of 1 eV to 10 keV. The hollow circle symbols are the results of this work. The purple line is the neutron capture cross section obtained from the calculation of SAMMY fitting results. The evaluated values of neutron capture cross sections from various evaluated libraries are represented by line with different colors. -
Fig. 11(a) shows the average experimental neutron capture cross sections of this work in the unresolved resonance region (URR) from 10 keV to 1000 keV, and compare them with four major evaluated databases and previous experimental data. In the energy region of 10–40 keV, the present results are overall higher than ENDF/B-VIII.1, TENDL-2023, and CENDL-3.2, but show good agreement with JEFF-3.3. Between 40 and 200 keV, the data exhibit a smooth decreasing trend, lying between the evaluated libraries. At energies above 200 keV, the results are in good agreement with TENDL-2023, JEFF-3.3, and CENDL-3.2. Compared with previous measurements, the results are generally higher than the early results of Staviskiy (1963) [12], but are in better consistency with the data of Poenitz et al. (1975) [13] and Diven et al. (1960) [11], which further supports the reliability of this work.
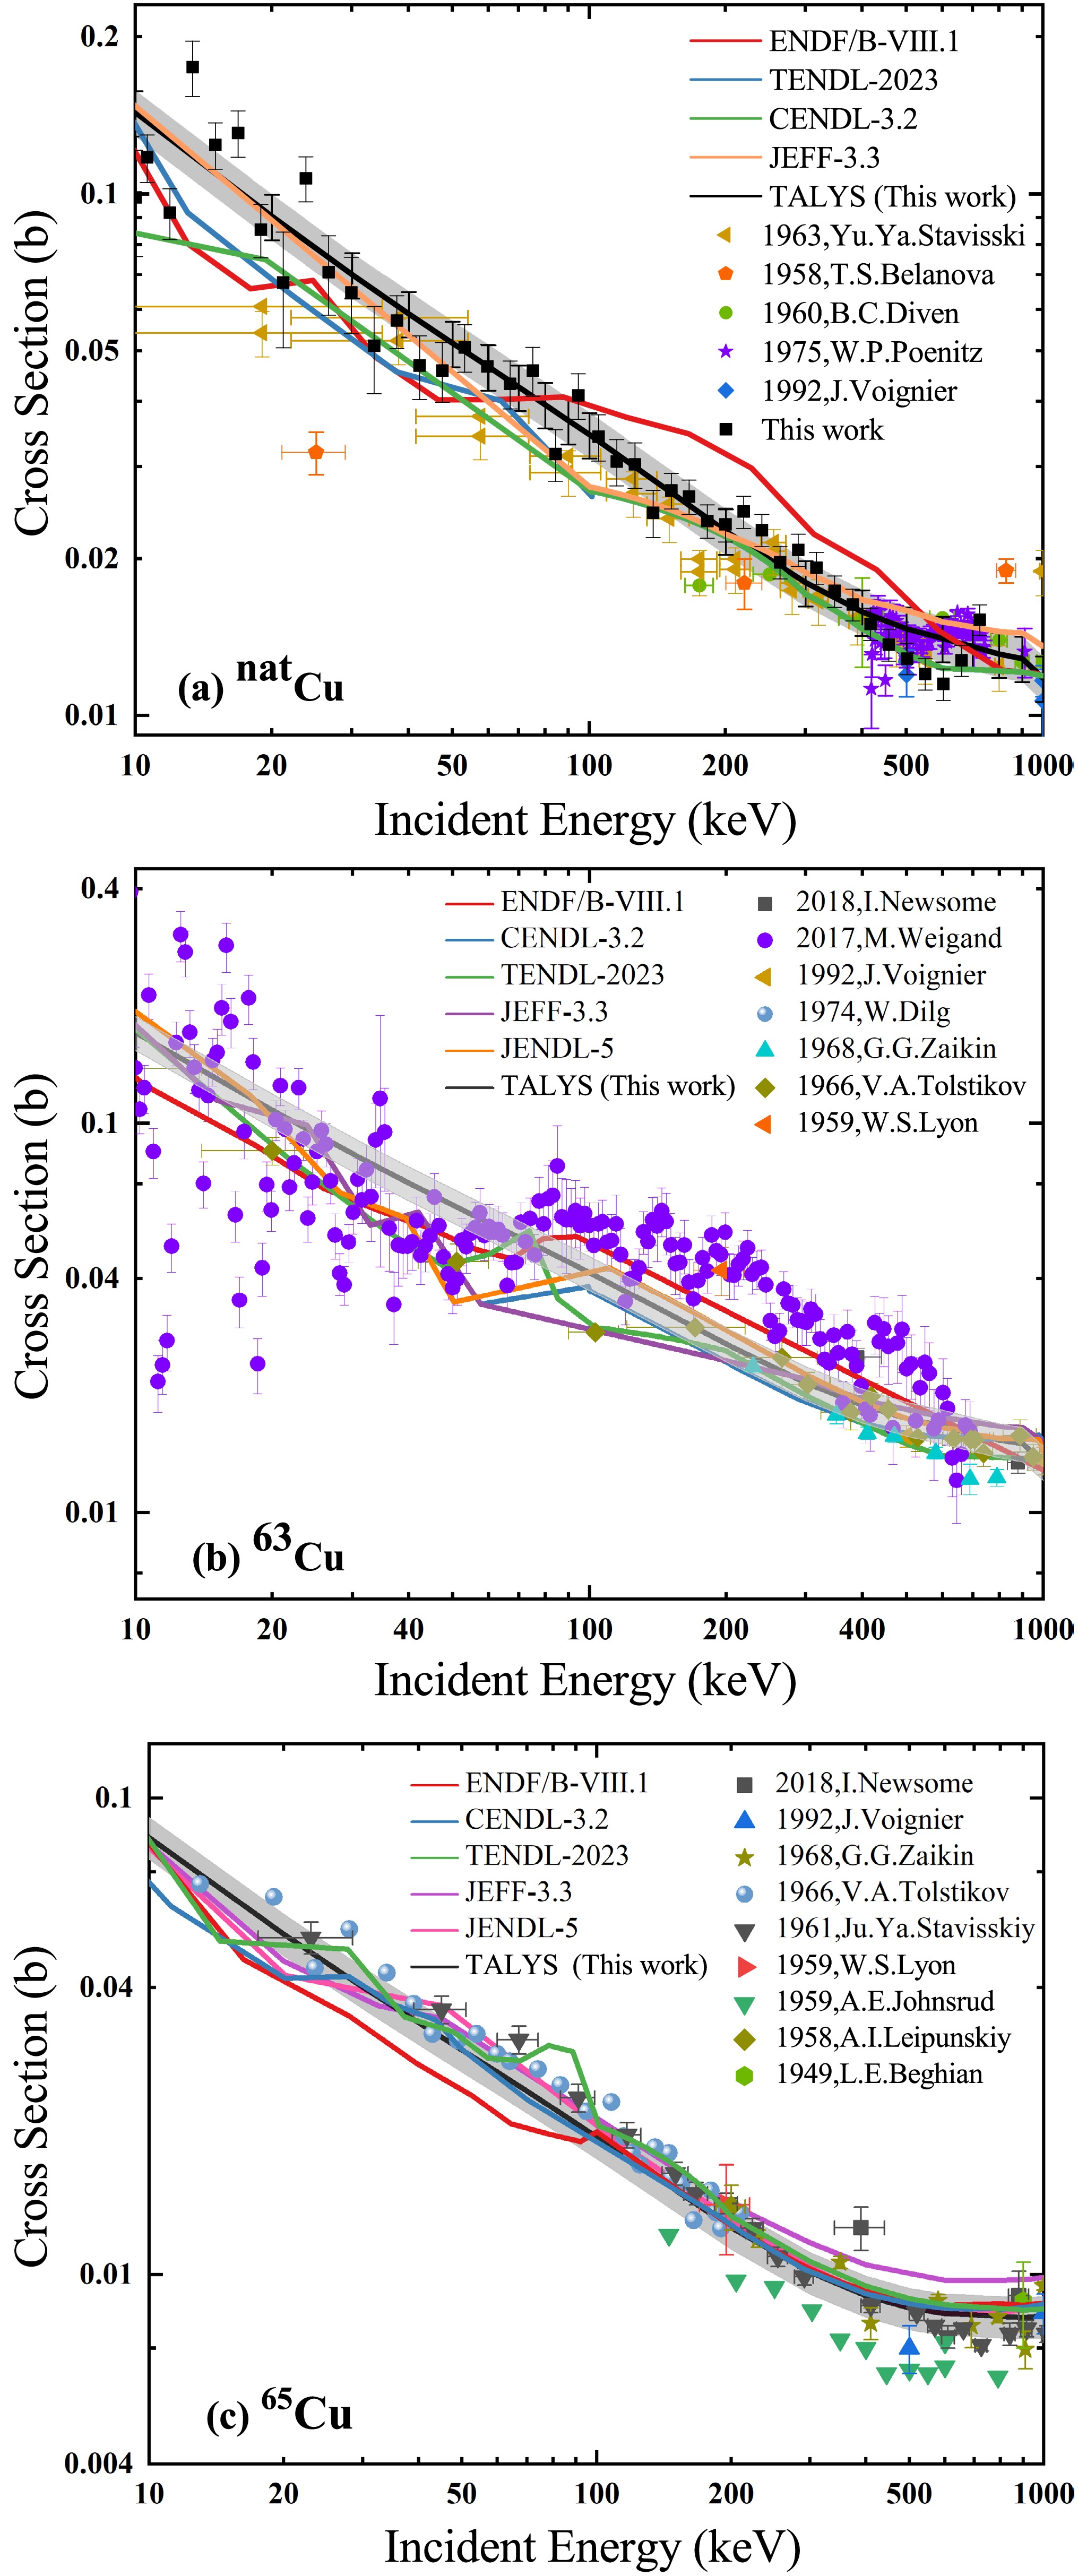
Figure 11. (color online) Averaged capture cross sections of
$ ^{\rm{nat}}{\rm{Cu}} $ and$ ^{63}{\rm{Cu}} $ and$ ^{65}{\rm{Cu}} $ in the URR from 10 to 1000 keV.The TALYS code [37, 38] helps us further describe the average cross-sections of isotopes in URR. The calculations are based on the Hauser-Feshbach statistical evaporation model, which assumes that the capture reaction occurs through a compound nucleus system in statistical equilibrium. The average level spacing
$ {{\rm{D}}}_{0} $ and$ \Gamma_{\gamma} $ values extracted from SAMMY fits were used as input parameters for the TALYS code to calculate the neutron capture cross sections in the URR. For$ ^{63}{\rm{Cu}} $ ,$ {{\rm{D}}}_{0} $ =35.71 eV,$ \Gamma_{\gamma} $ =526$ \pm $ 52.6 meV; For$ ^{65}{\rm{Cu}} $ ,$ {{\rm{D}}}_{0} $ =47.62 eV,$ \Gamma_{\gamma} $ =389$ \pm $ 38.9 meV. Additionally, the overall neutron optical potential from Ref. [39] was used in the calculations. Other parameters were determined using the method by Chen et al. [40]. The photon intensity function was adopted from Kopecky et al. [41], while the level density a and nuclear temperature T were derived from the adjusted parameters of the Gilbert-Cameron model. The TALYS code was used to calculate the average neutron capture cross sections of$ ^{63}{\rm{Cu}} $ and$ ^{65}{\rm{Cu}} $ separately. The calculated result for$ ^{\rm{nat}}{\rm{Cu}} $ was then obtained by weighting the average cross sections of the two isotopes according to their natural abundances. As shown in Fig. 11(b) and (c), the average cross sections obtained in this work for the URR were compared with previous experimental results and the evaluated data. -
For further application of the neutron capture cross section in s process, the relevant experimental data must be convoluted with the neutron velocity distribution in the stellar plasma to obtain the MACS [42]. The MACS is defined as:
$ \sigma_{\text{MACS}}(kT)=\frac{\langle\sigma\nu\rangle}{\nu_T}=\frac{2}{\sqrt{\pi}}\frac{\int_0^\infty\sigma(E_\text{n})E_\text{n}e^{-\frac{E_\text{n}}{kT}}dE_\text{n}}{(kT)^2}, $
(16) where
$ \nu_T=\sqrt{2\; kT/m} $ is the most probable thermal neutron velocity, determined from the star’s internal temperature, and$ kT $ = 30 keV is the reference temperature for s process.We calculated the MACS values for
$ ^{63}{\rm{Cu}} $ and$ ^{65}{\rm{Cu}} $ at$ kT=5-100 $ keV using the TALYS-calculated neutron capture cross sections of the two isotopes as input. Since the present experiment directly measured the capture cross section of$ ^{\rm{nat}}{\rm{Cu}} $ , these isotope dependent MACS values should be regarded as TALYS based results constrained by the present experimental data. Considering the total experimental uncertainty of the measured cross sections, a conservative relative uncertainty of 10% was adopted for the MACS values. The results, including key s process temperatures such as 8 keV, 23 keV, and 90 keV, are listed in Table 3. Fig. 12 shows the comparison of the present results with the values recommended for the Karlsruhe Astrophysical Database of Nucleosynthesis in Stars (KADoNiS) [43], the values in the recently published work of C. J. Prokop (2019) [44], M. Weigand (2017) [45], Z. Y. Bao et al. (2000) [46, 47] and the MACSs calculated using the ENDF/B-VIII.1, JEFF-3.3, JENDL-5, CENDL-3.2 and TENDL-2023 evaluated data: (a) The MACS values of$ ^{63}{\rm{Cu}} $ obtained in this work are slightly higher, with a decrease tendency with increasing energy values; (b) The MACS values obtained in this work for$ ^{65}{\rm{Cu}} $ are high in the$ 5-100 $ keV range, more consistent with the TENDL-2023 evaluated data, and higher than the values in the ENDF/B-VIII.1, CENDL-3.2, JEFF-3.3, JENDL-5 evaluated data, the recommended values of KADoNiS v1.0, and the values in the work of C. J. Prokop et al. (2019) [44] work's values. Fig. 13 shows the comparison of this work in the$ kT=30 $ keV range with previous measurements (blue squares), evaluated data (red circles) and theoretical calculations (black triangles).$ kT $ (keV)$ ^{63} {\rm{Cu}}$ (mb)$ ^{65} {\rm{Cu}}$ (mb)This work KADoNiS v1.0 This work KADoNiS v1.0 5 269.6 $ \pm $ 26.9213.7 128.1 $ \pm $ 12.898.2 8 202.4 $ \pm $ 20.296.8 $ \pm $ 9.610 176.0 $ \pm $ 17.5128.3 84.2 $ \pm $ 8.461.4 15 136.0 $ \pm $ 13.694.4 65.2 $ \pm $ 6.547.2 20 113.4 $ \pm $ 11.377.1 54.3 $ \pm $ 5.439.6 23 103.9 $ \pm $ 10.349.7 $ \pm $ 4.925 98.6 $ \pm $ 9.966.9 47.2 $ \pm $ 4.734.7 30 88.1 $ \pm $ 8.860.1 42.1 $ \pm $ 4.231.2 40 73.9 $ \pm $ 7.351.2 35.2 $ \pm $ 3.526.4 50 64.6 $ \pm $ 6.445.4 30.7 $ \pm $ 3.023.2 60 57.8 $ \pm $ 5.741.1 27.5 $ \pm $ 2.720.9 80 48.5 $ \pm $ 4.834.9 23.0 $ \pm $ 2.217.7 90 45.0 $ \pm $ 4.521.3 $ \pm $ 2.1100 42.0 $ \pm $ 4.230.6 19.9 $ \pm $ 1.915.6 Table 3. The MACS of this experiment is compared with that of KADoNiS.
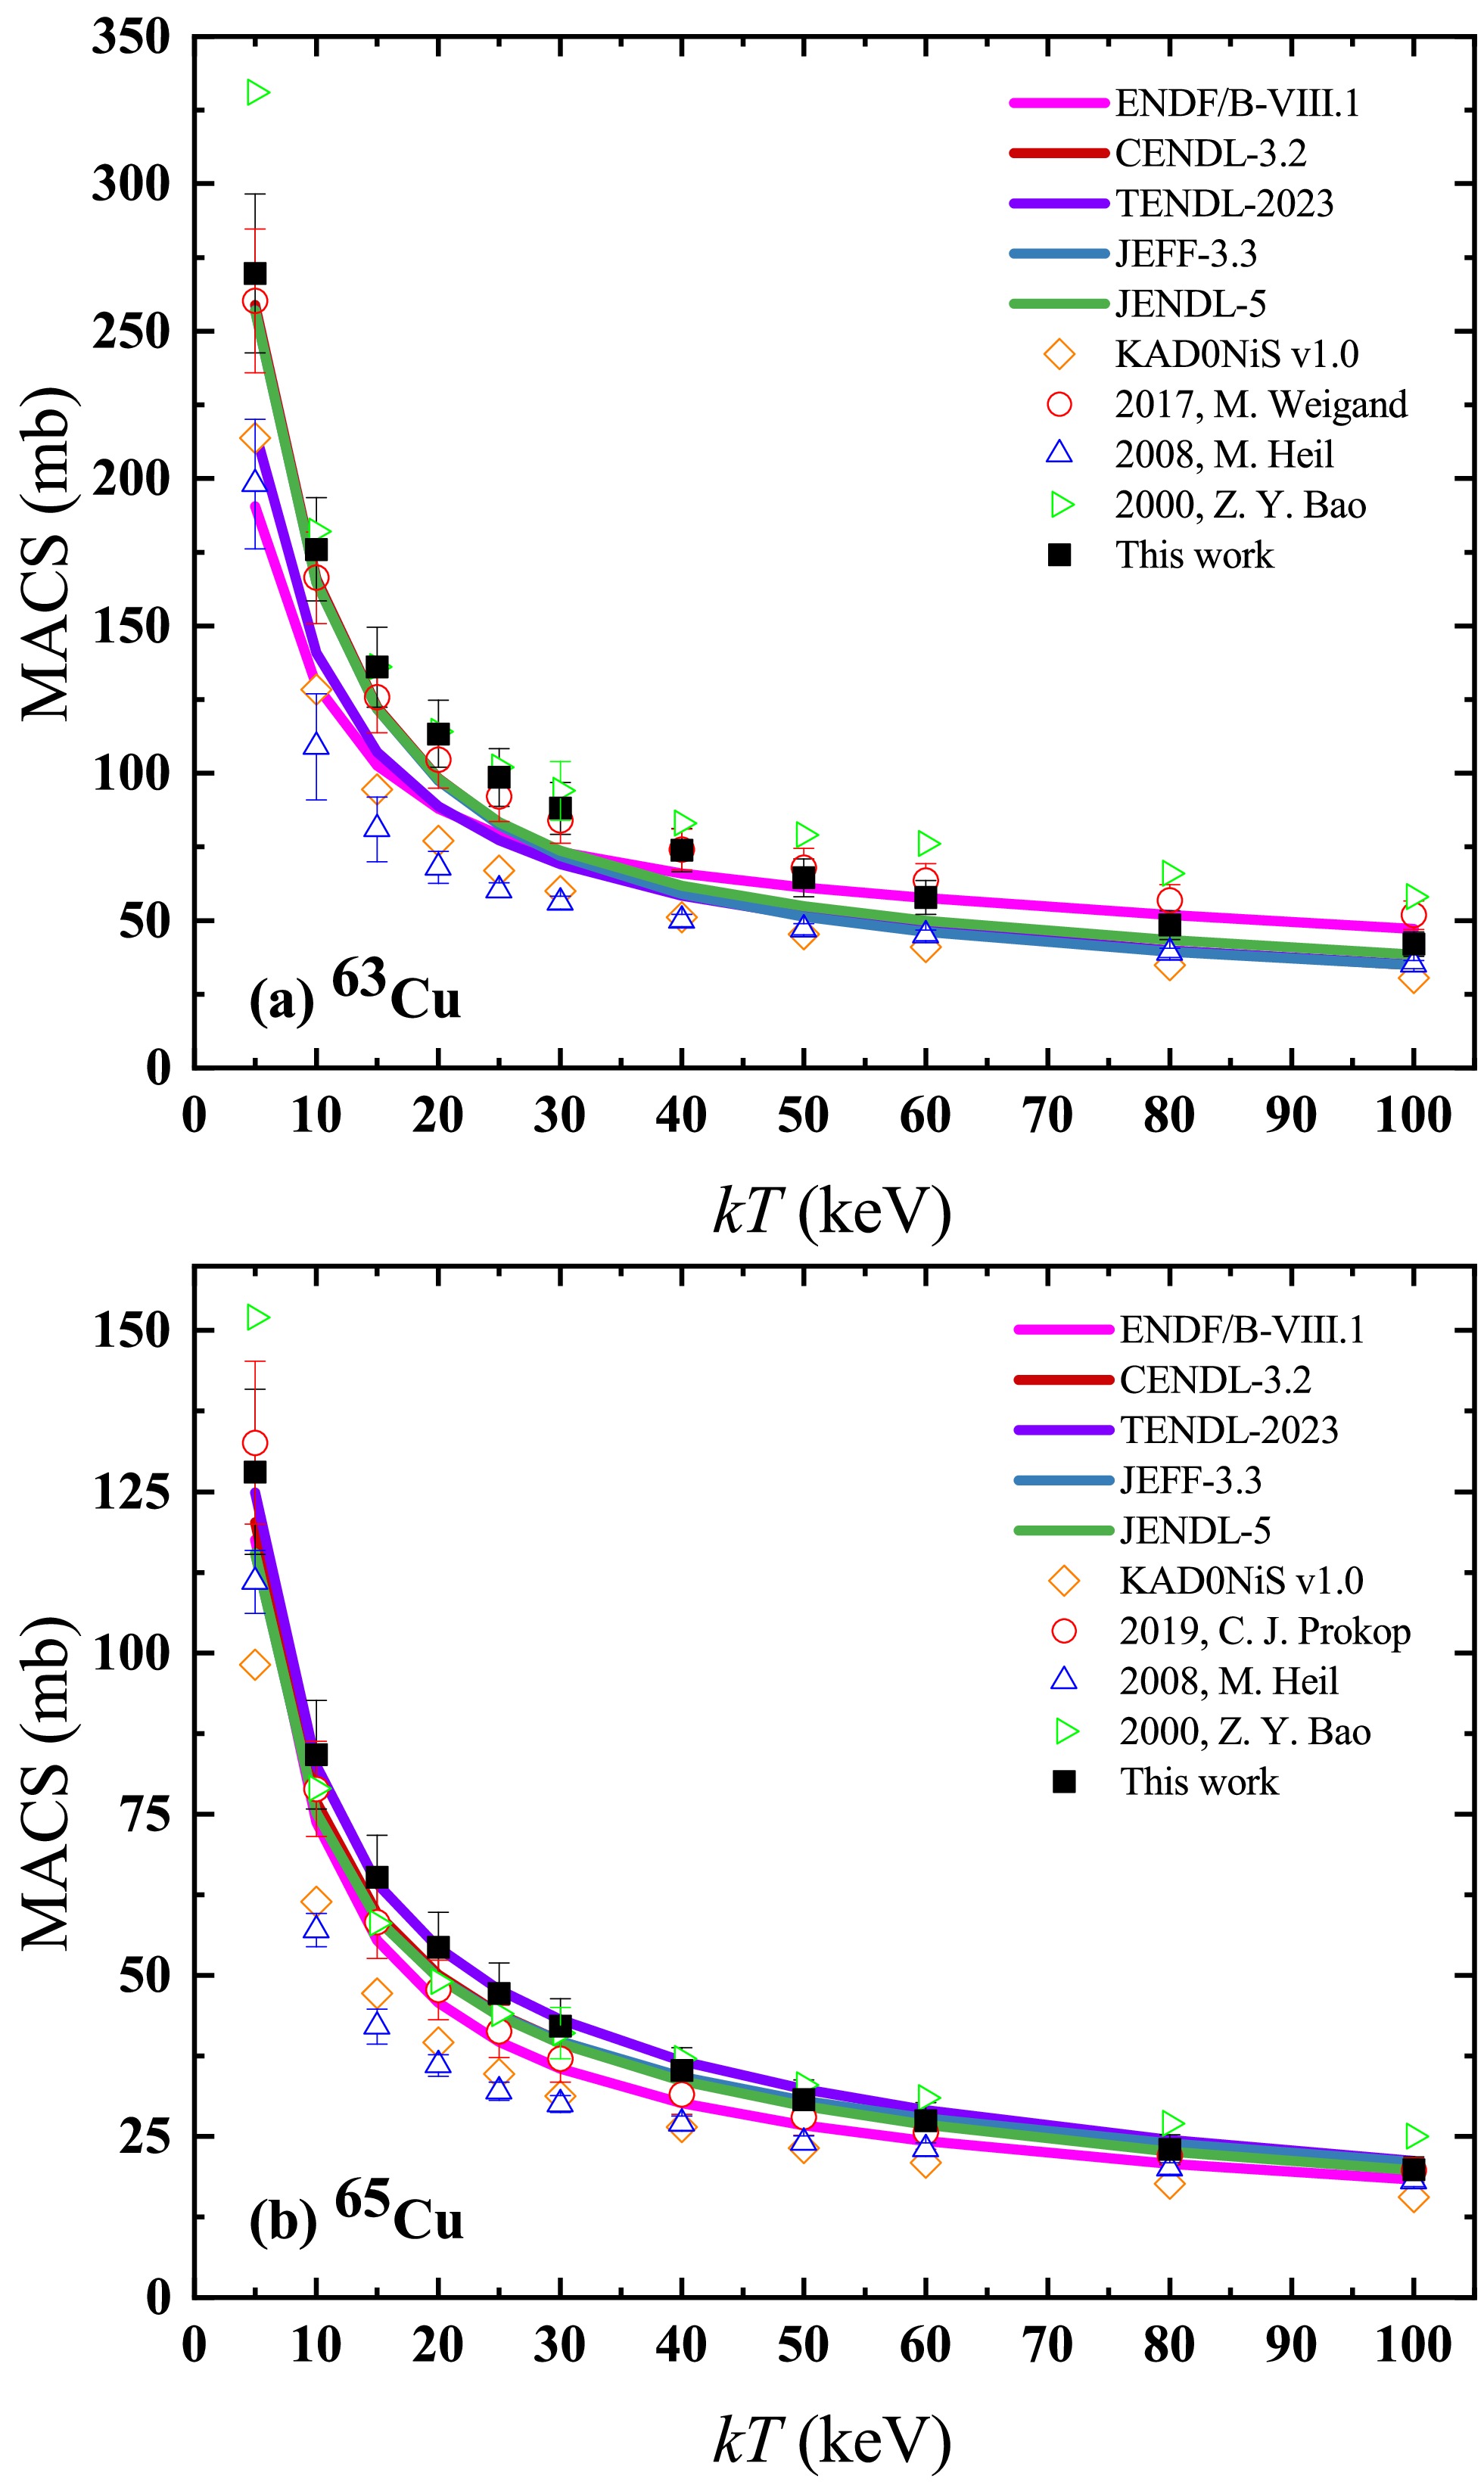
Figure 12. (color online) Comparison of the experimental MACS from
$ kT $ = 5–100 keV with evaluated data.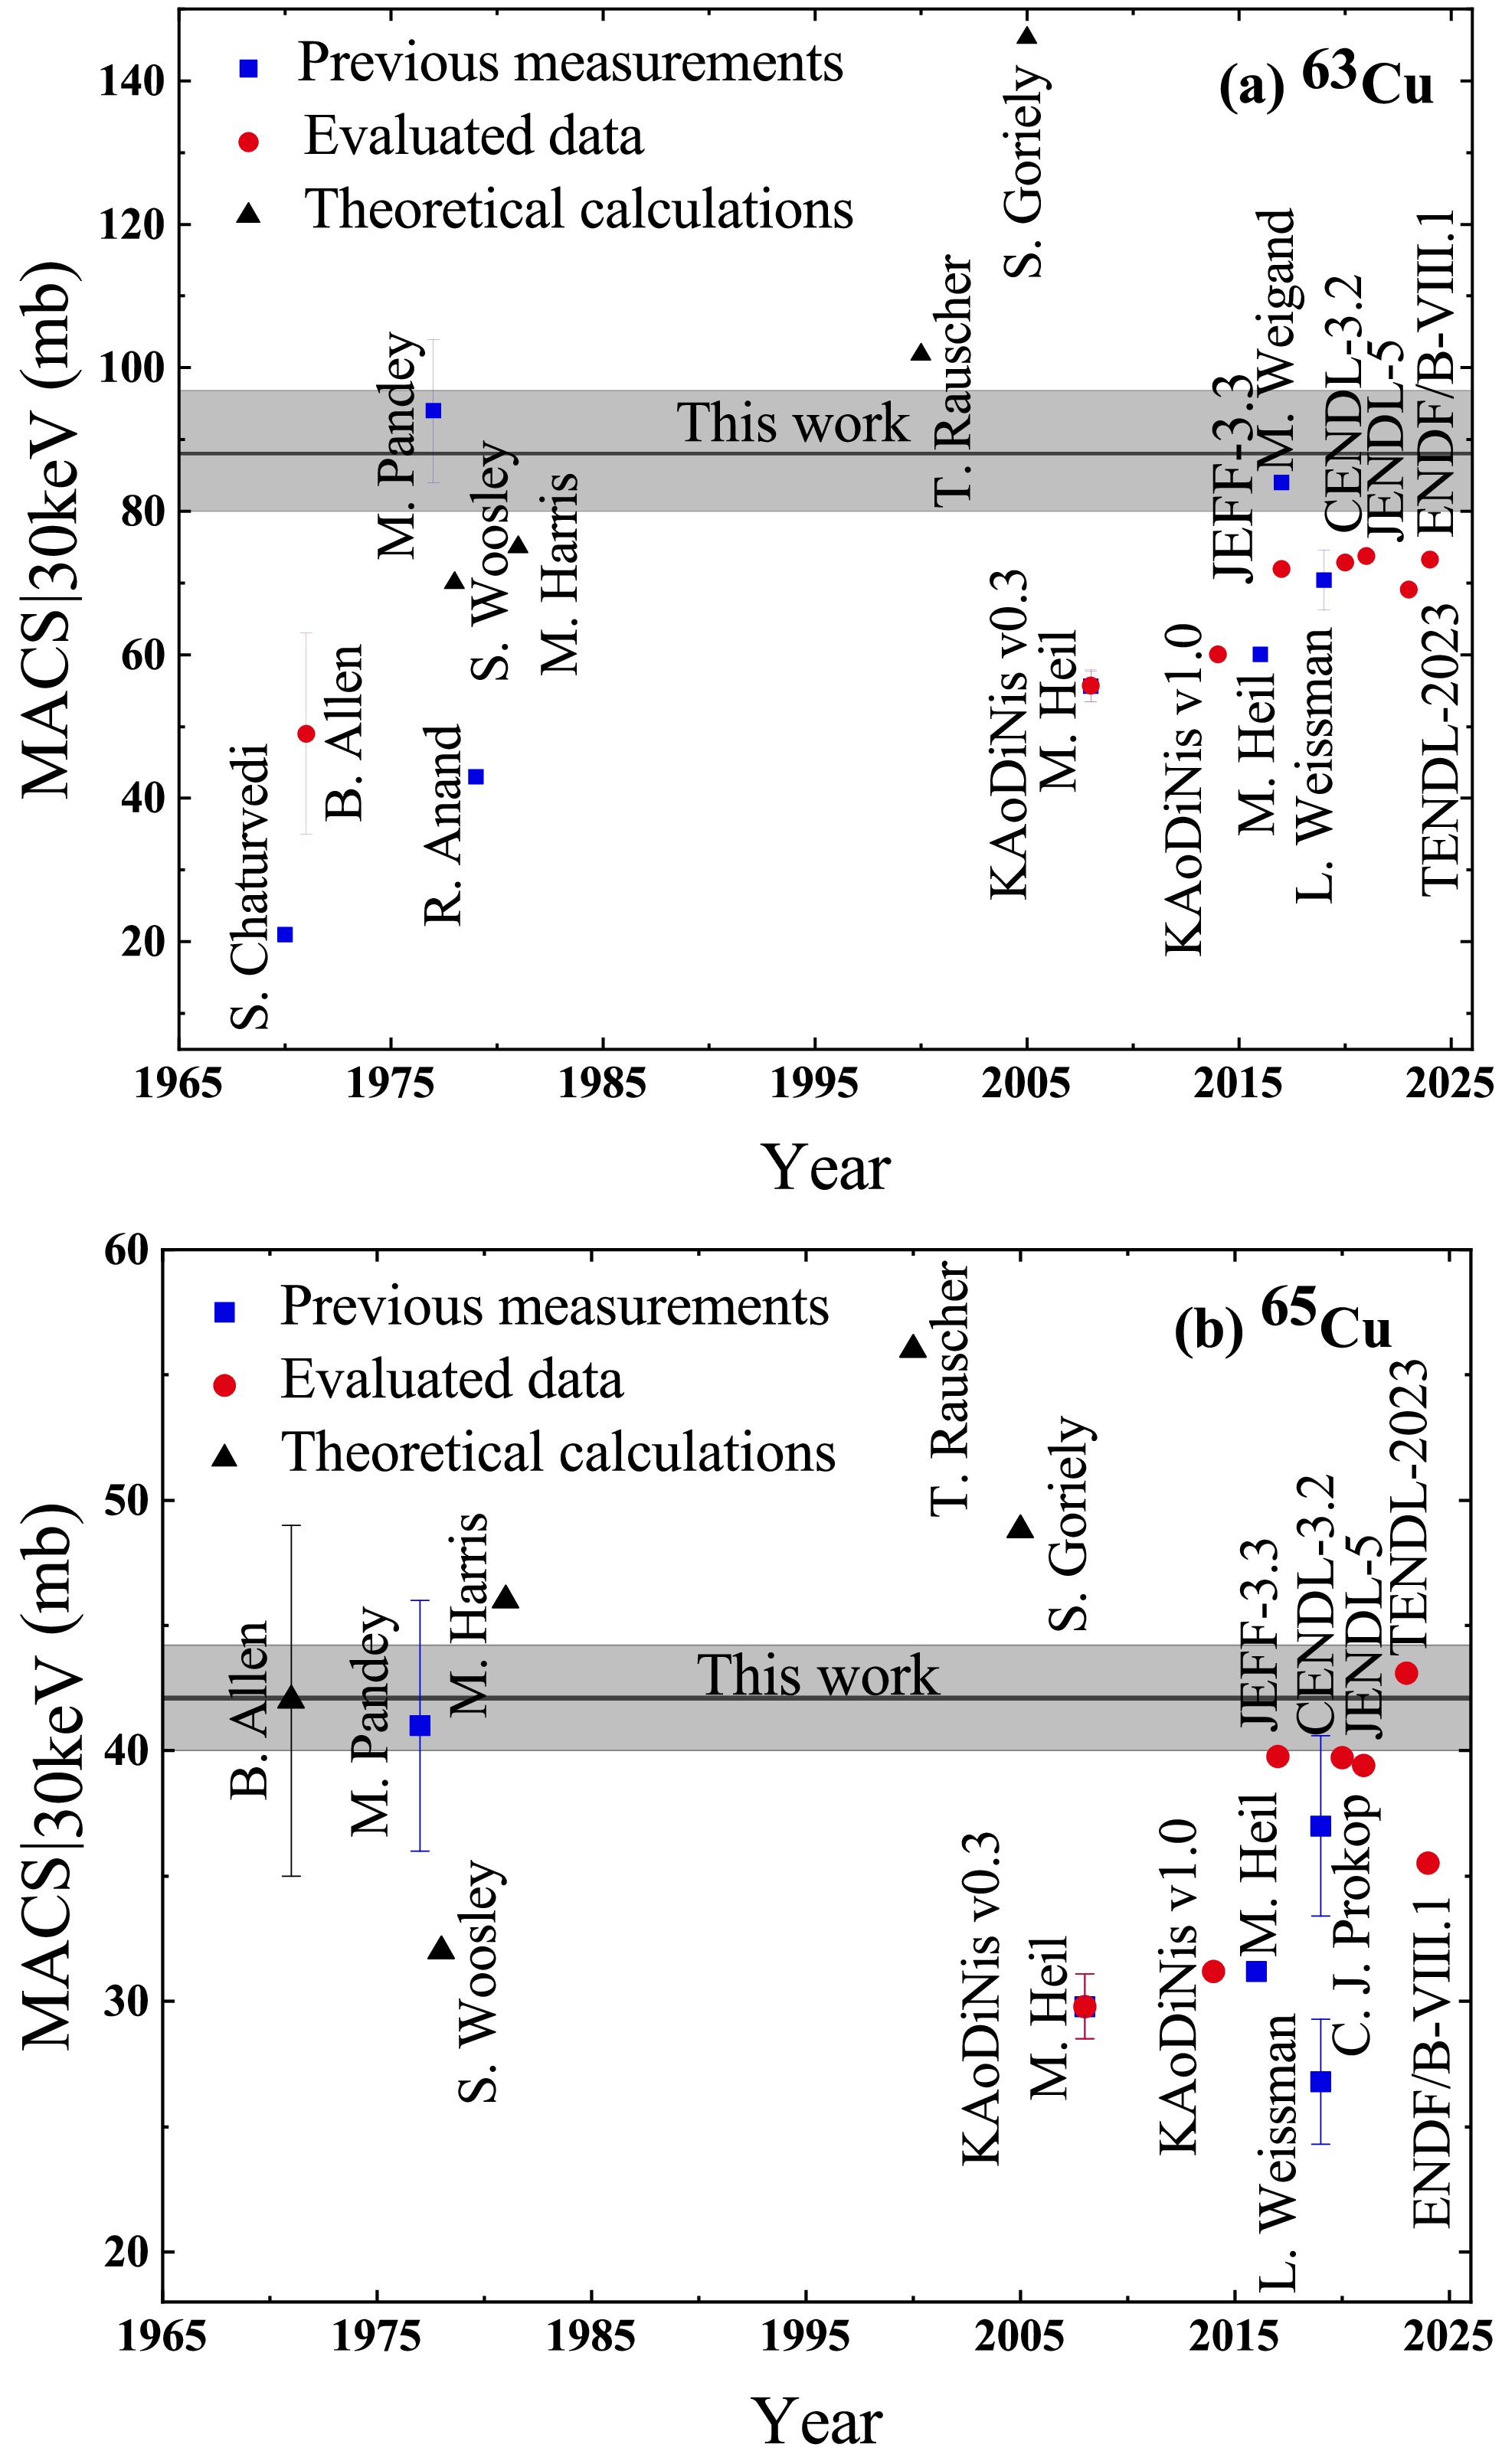
Figure 13. (color online) The 30 keV (n,γ) cross section of
$ ^{63}{\rm{Cu}} $ and$ ^{65}{\rm{Cu}} $ (shaded band) compared with previous measurements (blue squares), evaluated data (red circles), and theoretical calculations (black triangle). -
We measured the neutron capture cross section of
$ ^{\rm{nat}}{\rm{Cu}} $ between 1 eV and 700 keV using the$ {{\rm{C}}_{6}{\rm{D}}_{6}} $ detector system and the TOF method at the Back-n beam platform of CSNS. The experimental platform as well as the detector characteristics are briefly described, and the data analysis method is highlighted. We obtained results with high precision in the resonance region, which are in general agreement with the evaluated data, and we also observed some discrepancies and clarified the differences between the five mainstream databases. Resonance parameters were extracted through SAMMY code implementation for distinguishable resonances. For the URR, neutron capture cross sections of$ ^{63,65}{\rm{Cu}} $ were calculated using the TALYS code. Furthermore, MACSs were derived for stellar temperatures ($ kT=5-100 $ keV) relevant to s process nucleosynthesis modelling.
Measurement of neutron capture cross sections of copper from 1 eV to 700 keV at CSNS Back-n.
- Received Date: 2026-03-18
- Available Online: 2026-08-01
Abstract: The neutron capture cross sections of copper play a crucial role in the s process of stellar nucleosynthesis, the production of the medical isotope $^{64}{\rm{Cu}}$ for PET imaging and radiotherapy, and Neutron Resonance Capture Analysis for determining the elemental and isotopic compositions of archaeological and cultural heritage materials. The ${}{\rm{Cu}}({\rm{n}},\gamma)$ cross section was measured from 1 eV to 700 keV at the Back-n facility of the Chinese Spallation Neutron Source using the time-of-flight (TOF) method. Prompt γ-rays were detected by four ${{\rm{C}}_{6}{\rm{D}}_{6}}$ liquid scintillator detectors, and the data were analyzed using the pulse height weighting technique. The results are generally consistent with the evaluated data in the major library; however, some discrepancies were observed, offering valuable insights into the differences between five prominent evaluated data libraries. The R-matrix SAMMY code was used to extract the resonance parameters for $^{63,65}{\rm{Cu}}$ in the resolved resonance region. Maxwellian-averaged cross sections were calculated within the temperature range relevant to the s process nucleosynthesis model, spanning $kT=5\rm{-}100$ keV, based on the averaged cross sections in the unresolved resonance region. At $kT=30$ keV, the MACSs values for $^{63}{\rm{Cu}}$ (88.1±8.8 mb) and $^{65}{\rm{Cu}}$ (42.1±4.2 mb) were higher than the corresponding recommendations in the Karlsruhe Astrophysical Database of Nucleosynthesis in Stars.


 DownLoad: