


 Abstract
 HTML
HTML Reference
 Related
 PDF
PDF


-
The EMC (European Muon Collaboration) effect, firstly reported in 1983 through the deep-inelastic muon scattering on iron nuclei [1], reveals a fundamental modification of nucleon structure in the nuclear environment: the per-nucleon structure function
$ F_{2}^{A}(x,Q^{2}) $ at intermediate Bjorken-x (0.3≤x≤0.75) is suppressed by 10-20% relative to that for a free nucleon [2]. Shortly afterward, the EMC effect was confirmed by the deep-inelastic electron scattering on nuclei at Stanford Linear Accelerator Center (SLAC) [3, 4]. Since then, numerous experiments on various nuclear targets have been conducted to explore the EMC effect [5−17]. So far, the EMC effect remains a research area of great interest.Since the discovery of the EMC effect, numerous models have been proposed to explain it, such as the off-shell correction [18, 19], x-rescaling model [20−23],
$ Q^{2} $ -rescaling model [24−26], nucleon swelling model [24−31], quark cluster model [32−38], point-like configuration suppression model [39, 40], statistical model [41] and nuclear density model [42, 43]. However, to date no widely accepted model has been developed. The prevailing view in recent research suggests that the EMC effect arises primarily from the nucleon-nucleon short-range correlation (N-N SRC) modifying the quark distributions, as demonstrated by high-precision experiments at JLab [44, 45]. The N-N SRC pairs are the temporary close-proximity fluctuations of two strongly interacting nucleons [46, 47], which were identified experimentally as the nucleon pairs of a high relative momentum between nucleons and a small center-of-mass momentum of the pair [48, 49]. However, a recent work of Wang et al. suggested that there is not a causal connection between the N-N SRC and EMC effect [50]. Therefore, the study on the physical mechanism behind the EMC effect remains an open question. On the one hand, the relationship between the EMC effect and N-N SRC should be further examined within more models. On the other hand, it is worth further exploring the correlation between the EMC effect and other nuclear medium effects.The nucleon number density serves as an important nuclear environment. Early studies revealed that the EMC effect is proportional to the average nuclear density [15, 42, 43]. However, the measurement of very light nuclei 3He and 9Be suggested that the strength of the EMC effect depends on the local density instead of the average nuclear density [16]. In fact, the density distribution of nucleons inside a nucleus is not uniform. The nucleon density distribution exhibits a characteristic pattern of being dense in the interior and diffuse in the outer layer. So, it is necessary to explore the correlation between the EMC effect and the local nuclear density.
Usually, the nuclear density is described with a parametrized distribution, in which the diffusion parameter is a fundamental quantity that characterizes the thickness of the outer layer ranging from the edge of the saturated nuclear density area to the outer boundary of a nucleus with a vanishing density, that is the nuclear surface region. It is speculated that in the nuclear surface region the presence of nucleon density gradients may induce a delocalization effect on quark degrees of freedom, enabling the quarks to be shared among multiple nucleons. Furthermore, the delocalization can modify the structure of the nuclear surface and consequently affect the surface diffuseness [16, 26, 51]. Simultaneously, the delocalized quarks may alter the momentum distribution of partons in the nucleon, manifesting as anomalies in parton distribution functions within specific Bjorken-x ranges. This coupling implies an intrinsic connection between the diffusion parameter and non-perturbative QCD effect [16, 26, 51]. Therefore, it is interesting to investigate quantitatively the EMC effect caused by the nuclear surface diffuseness usually described by a diffusion parameter, which constitutes the motivation of this article.
Driven by the motivation, in this article we will discuss the correlation between the EMC effect and surface diffuseness of the nuclei with
$ A \geq 12 $ within the double$ Q^{2} $ -rescaling model [52, 53] and the soliton bag model proposed by T. D. Lee [54] by taking into account the local nucleon density distribution. This article is organized as follows. In Sec. II, the theoretical framework is presented. Sec. III shows the calculated results and discussions. And some conclusions are drawn in the last section. -
Generally, the EMC effect is measured by the following ratio
$ \begin{aligned} R^{A/D}(x, Q^{2}) = \frac{F_{2}^{A}(x, Q^{2})}{F_{2}^{D}(x, Q^{2})}, \end{aligned} $
(1) where
$ F_{2}^{A}(x,Q^{2}) $ and$ F_{2}^{D}(x,Q^{2}) $ are the average nucleon structure function of a nucleus and that of a deuteron, respectively.In the framework of the double
$ Q^{2} $ -rescaling model [52, 53],$ F_{2}^{A}(x,Q^{2}) $ is expressed as$ \begin{aligned}[b] F_{2}^{A}(x, Q^{2}) =\;& \sum_{i} e_{i}^{2} x \Big[ q_{Vi}^{N}(x, \xi_{V}Q^{2}) \\&+ q_{Si}^{N}(x, \xi_{S}Q^{2}) + \bar{q}_{Si}^{N}(x, \xi_{S}Q^{2}) \Big], \end{aligned} $
(2) where
$ q_{Vi}^{N}(x,\xi _{V}Q^{2}) $ ,$ q_{Si}^{N}(x,\xi _{S}Q^{2}) $ and$ \overline{\mathit{q}}_{Si}^{N}(x,\xi _{S}Q^{2}) $ represent the momentum distribution functions of the valence quarks, sea quarks and anti-sea quarks with flavor i in a bound nucleon.$ \xi _{V} $ and$ \xi _{S} $ are the rescaling parameters, which can be determined by the experimental EMC ratios$ R^{A/D} $ ($ x, Q^{2} $ ). Due to the high precision of the experimental measurements conducted by the SLAC-E139 [15], Jlab Hall C [16] and CLAS [17] collaborations, in this work the$ \xi _{V} $ and$ \xi _{S} $ values are determined by fitting these experimental$ R^{A/D} $ ($ x, Q^{2} $ ) values [15−17].The binding energy of a nucleus is an important source of the nuclear medium effects. So, the rescaling parameters
$ \xi _{V} $ and$ \xi _{S} $ must be correlated to the binding energy. In Ref. [53], the empirical formulas with respect to$ \xi _{V} $ ($ \xi _{S} $ ) and average binding energy E (without the average Coulomb energy$ E_{c} $ ,$ E_{c} $ =$ a_{c}Z^{2}A^{-4/3} $ , where$ a_{c} $ =0.72 MeV) were proposed considering that the contribution to the EMC effect from the strong interaction is dominant. Moreover, in Ref. [53] a clear linear correlation was observed between$ \xi _{V} $ ($ \xi _{S} $ ) and$ \ln A $ , where A is the mass number of a nucleus. Meanwhile, the rescaling parameters$ \xi _{V} $ and$ \xi _{S} $ exhibited good linear relationships with$ E^{1/2} $ and$ E^{-1/2} $ , respectively. In this work, the above mentioned linear correlations are also found. Therefore, on the basis of Ref. [53], the empirical formulas about$ \xi _{V} $ and$ \xi _{S} $ are modified slightly as$ \begin{aligned} \xi _{V} &=a_{1}E^{1/2}+b_{1}\ln A+c_{1}, \end{aligned} $
(3) $ \begin{aligned} \xi _{S} &=a_{2}E^{-1/2}+b_{2}\ln A+c_{2}, \end{aligned} $
(4) where the parameters
$ a_{1} $ ,$ b_{1} $ ,$ c_{1} $ ,$ a_{2} $ ,$ b_{2} $ and$ c_{2} $ are determined by fitting the experimental$ \xi _{V} $ and$ \xi _{S} $ values derived from the experimental$ R^{A/D} $ ($ x, Q^{2} $ ) values of the SLAC-E139 [15], Jlab Hall C [16] and CLAS [17] collaborations. In the linear fitting process, a constant ($ c_{1} $ in Eq. (3) or$ c_{2} $ in Eq. (4)) is derived naturally. From a physical perspective, Eqs. (3) and (4) are essentially no different from those in Ref. [53]. Besides, the average binding energy E used in Eqs. (3) and (4) refers to the experimental data without$ E_{c} $ [55]. Furthermore, the momentum conservation is taken into account, meaning that the nuclear momentum equals to the sum of the momenta of the valence quarks, sea quarks and gluons in a nucleus [52, 53]. The determined values of ($ a_{1} $ ,$ b_{1} $ ,$ c_{1} $ ) and ($ a_{2} $ ,$ b_{2} $ ,$ c_{2} $ ) are (0.6096, 0.0333, -0.2731) and (-0.2686, -0.0230, 0.2117), respectively. -
Within the MIT bag model, the relationship between the nucleon mass M and its radius R is expressed as [56]
$ \begin{aligned} M(R)=\frac{4\pi }{3}BR^{3}+\frac{D}{R}, \end{aligned} $
(5) where B is the bag constant. D is a constant that is correlated to the quark quantum numbers but is not dependent on R. Moreover, R is determined by the condition:
$ \dfrac{\partial M}{\partial R}=0 $ , therefore, the nucleon mass takes its minimum value. Using these conditions, we have$ \begin{aligned} B &=\frac{D}{4\pi R^{4}}, \end{aligned} $
(6) $ \begin{aligned} D &=\frac{3MR}{4}. \end{aligned} $
(7) For a free nucleon
$ \begin{aligned} B_{0} &=\frac{D}{4\pi R_{0}^{4}}, \end{aligned} $
(8) $ \begin{aligned} D &=\frac{3M_{0}R_{0}}{4}, \end{aligned} $
(9) where
$ M_{0} $ denotes the free-nucleon mass.For a bound nucleon
$ \begin{aligned} B_{A}=\frac{D}{4\pi R_{A}^{4}}. \end{aligned} $
(10) In Eqs. (8)–(10),
$ R_{0} $ and$ R_{A} $ are the radii of a free nucleon and a bound nucleon, respectively.When a free nucleon is embedded in a nucleus, the topological structure of the QCD vacuum surrounding an individual nucleon within the nucleus differs from that surrounding a free nucleon. As a result, the in-medium color dielectric constant κ in the nucleus becomes greater than zero. This reduces the physical vacuum pressure acting on the nucleon compared with that acting on a free nucleon, causing the bag to expand spatially and its radius to increase.
The energy variation caused by the expansion of the nucleon bag is
$ \begin{aligned}[b] \Delta E_{N_{1}} &=\left[ M(R_{A})-M(R_{0})\right] c^{2} \\ &=\left( \frac{4\pi }{3}B_{A}R_{A}^{3}+\frac{D}{R_{A}}-\frac{4\pi }{3} B_{0}R_{0}^{3}-\frac{D}{R_{0}}\right) c^{2} \\ &=-M_{0}c^{2}\left( 1-\frac{R_{0}}{R_{A}}\right). \end{aligned} $
(11) In addition, the energy expended by the nucleon in performing work on the nuclear medium during the swelling of the nucleon bag is
$ \begin{aligned}[b] \Delta E_{N_{2}} &=\int_{R_{0}}^{R_{A}}B(R)4\pi c^{2}R^{2}dR \\ &=\int_{R_{0}}^{R_{A}}\frac{D}{4\pi R^{4}}4\pi c^{2}R^{2}dR \\ &=\frac{3}{4}M_{0}c^{2}\left( 1-\frac{R_{0}}{R_{A}}\right). \end{aligned} $
(12) Thus, the average energy change per nucleon (equivalent to the average binding energy E) is given by
$ E =\left\vert \Delta E_{N_{1}}+\Delta E_{N_{2}}\right\vert =\frac{1}{4}M_{0}c^{2}\left( 1-\frac{R_{0}}{R_{A}}\right). $
(13) By substituting Eq. (13) into Eqs. (3) and (4), the expressions for
$ \xi _{V} $ and$ \xi _{S} $ are modified as follows:$ \begin{aligned} \xi _{V} &=\frac{a_{1}}{2}\left( M_{0}c^{2}\right) ^{1/2}\left( 1-\frac{ R_{0}}{R_{A}}\right) ^{1/2}+b_{1}\ln A+c_{1}, \end{aligned} $
(14) $ \begin{aligned} \xi _{S} &=2a_{2}\left( M_{0}c^{2}\right) ^{-1/2}\left( 1-\frac{R_{0}}{R_{A} }\right) ^{-1/2}+b_{2}\ln A+c_{2}. \end{aligned} $
(15) -
In fact, the MIT bag model is a phenomenological model that simply assumes that a fixed, infinitely high potential barrier confines the quarks inside, with the bag constant B serving as an external input parameter [56]. However, it cannot explain how the bag is dynamically generated. In contrast, the soliton bag model developed by T. D. Lee can precisely account for the dynamical generation of the bag [54].
In T. D. Lee's soliton bag model, it is assumed that there exists a phenomenological scalar field [54]
$ \begin{aligned} \sigma = \sigma_{{\rm{vac}}}(1 - \kappa), \end{aligned} $
(16) where, outside the nucleon bag, the color dielectric constant is
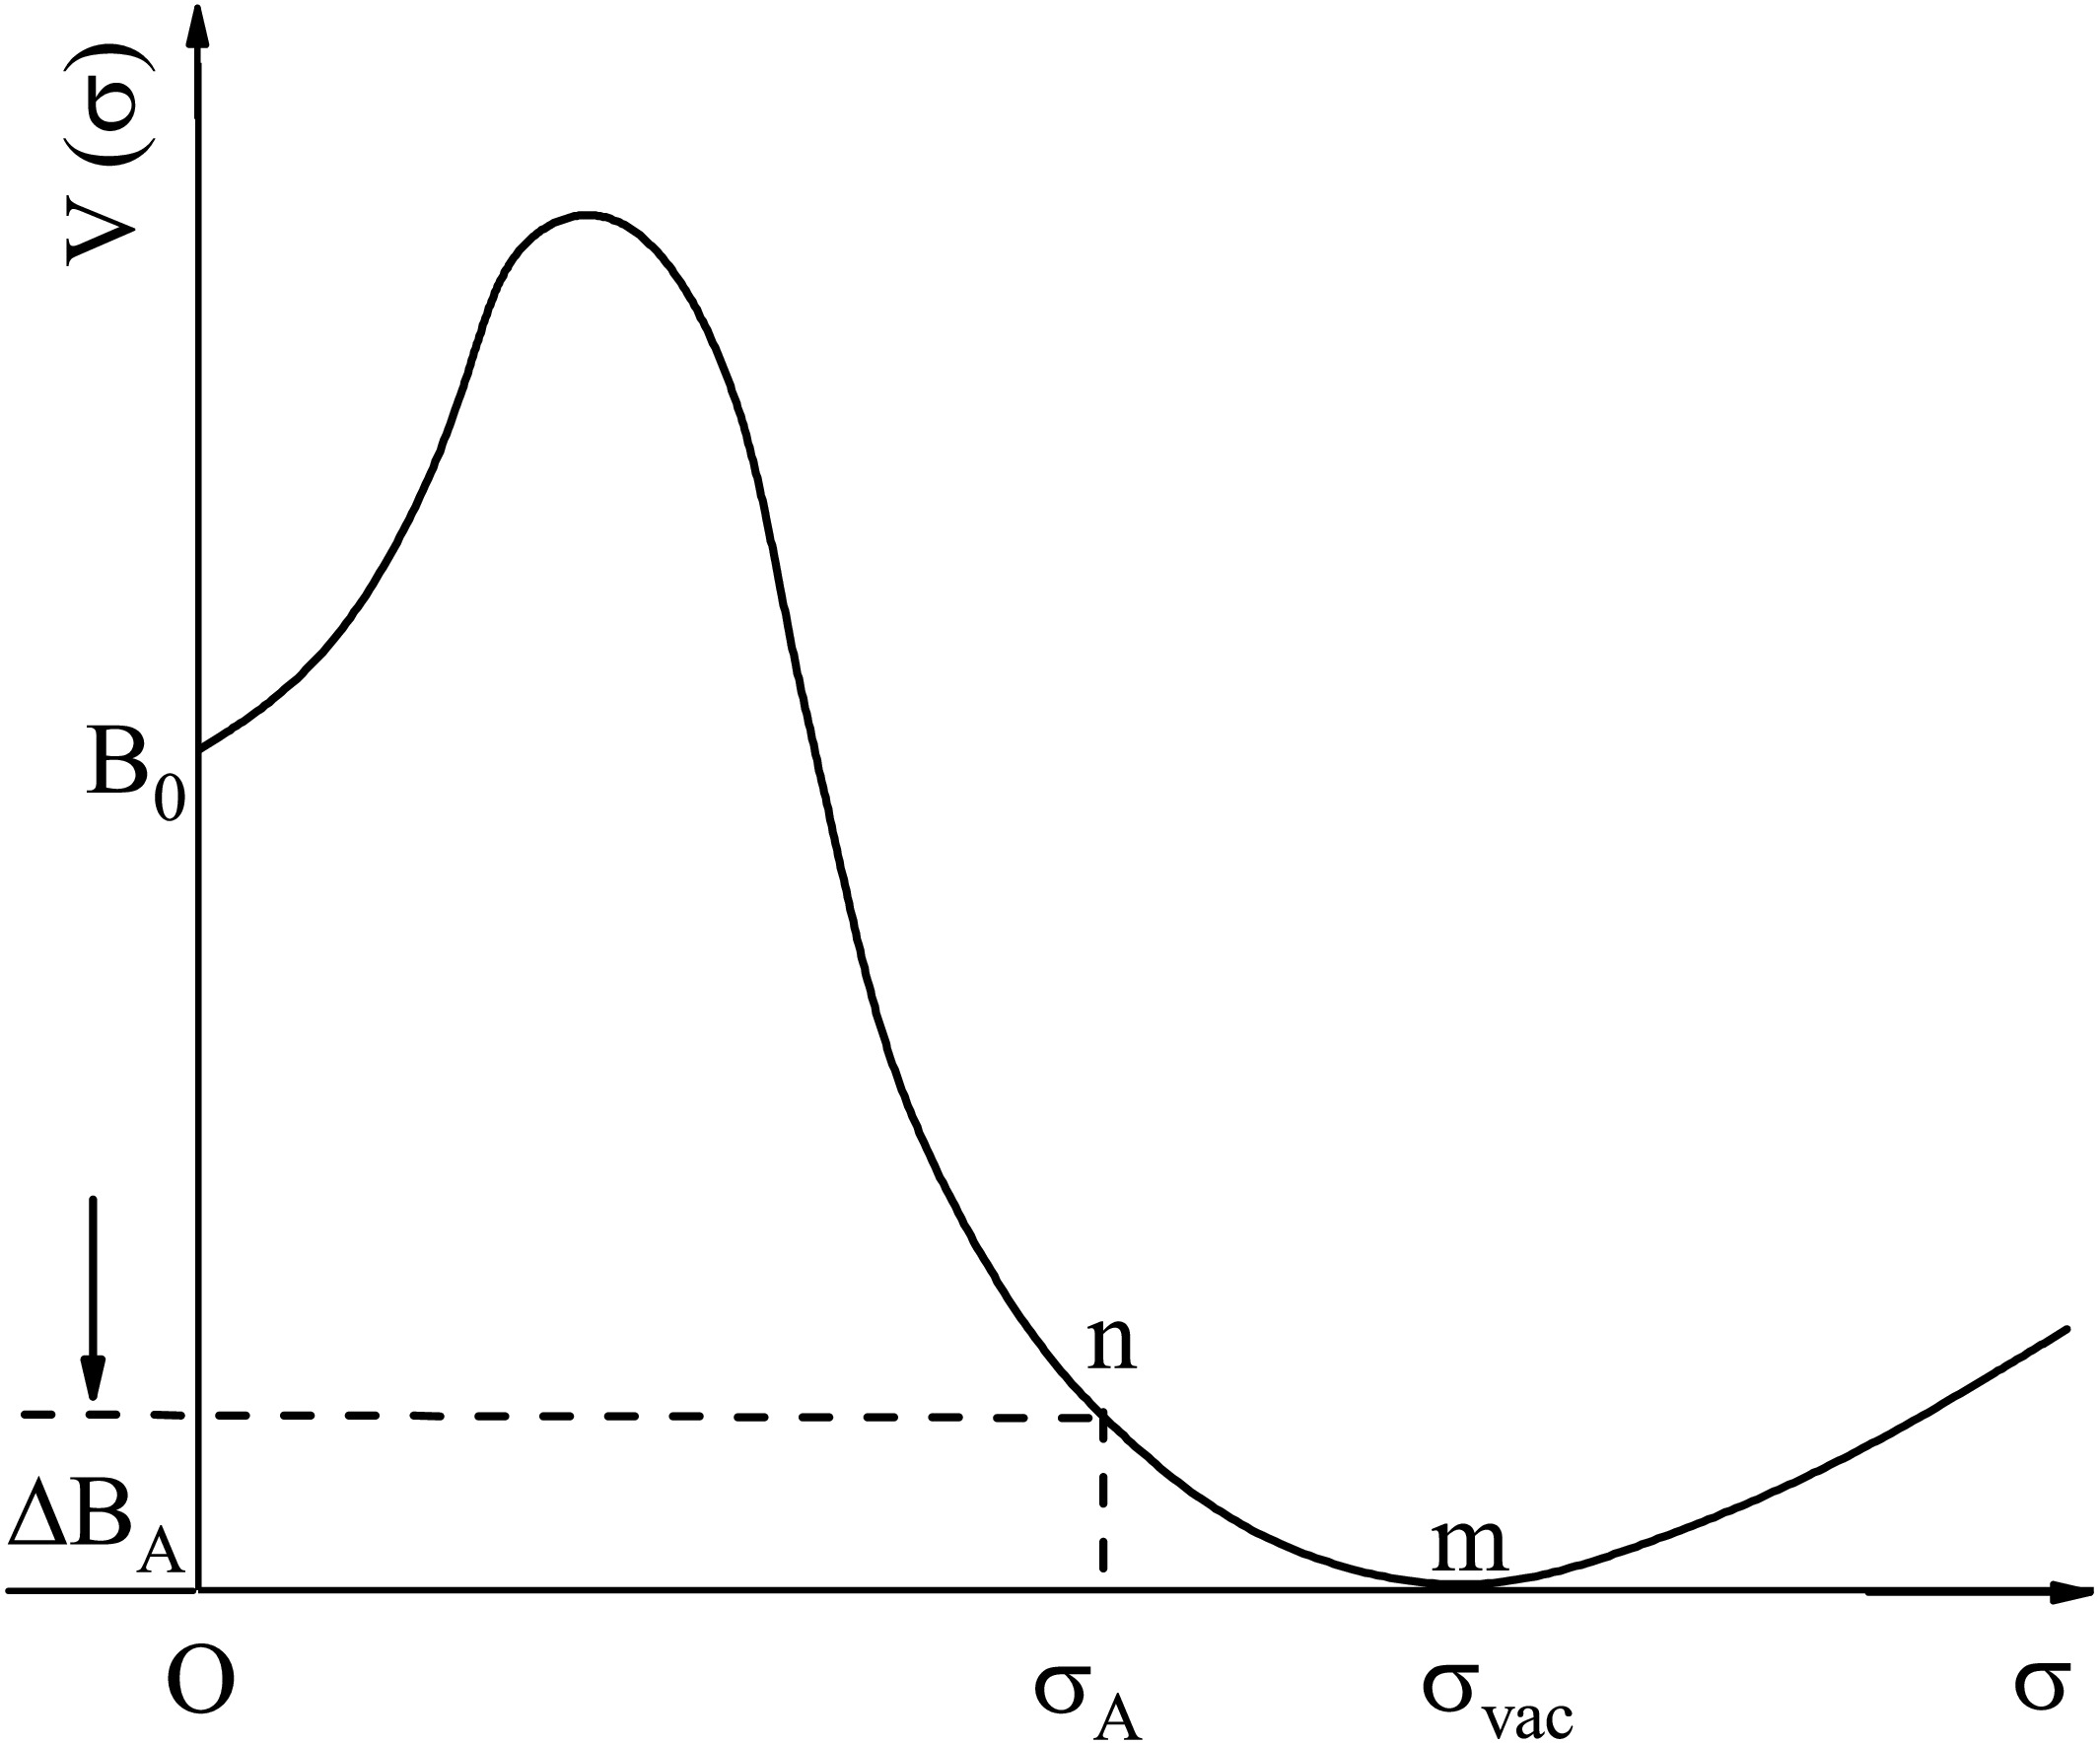
$ \kappa = 0 $ and$ \sigma = \sigma_{{\rm{vac}}} $ ; inside the bag,$ \kappa = 1 $ and$ \sigma = 0 $ . The potential energy of the σ field satisfies$ V(\sigma_{{\rm{vac}}}) = 0 $ and$ V(0) = B_0 $ [54], as shown in Fig. 1. The pressure difference,$ B_0 $ , between the interior and exterior balances the pressure exerted by the color field inside the bag, thereby determining the free nucleon bag radius.
Figure 1. The potential energy curve
$ V(\sigma) $ for the scalar field σ.In a nucleus, the color dielectric constant outside the nucleon bag under investigation is no longer
$ \kappa = 0 $ , but rather the volume-weighted average of the space occupied by the remaining (A-1) nucleon bags ($ \kappa = 1 $ ) and the space unoccupied by these nucleon bags ($ \kappa = 0 $ ). The effective color dielectric constant$ \kappa_A $ is determined by [57−59]$ \begin{aligned} \kappa _{A}=\frac{A^{\alpha }-1}{\dfrac{3A^{\alpha }}{4\pi \rho _{A}R_{A}^{3}} -1}, \end{aligned} $
(17) where
$ \rho _{A} $ is the average nucleon number density and α is a parameter less than 1.0.It is well known that the nucleon density distribution inside a nucleus is nonuniform, and the two-parameter Fermi-type distribution is one of the most frequently used models for nucleon distributions, expressed as
$ \begin{aligned} \rho _{A}(r)=\frac{\rho _{0}}{1+\exp (\dfrac{r-c}{a_{d}})}, \\ \end{aligned} $
(18) where
$ \rho_0 $ is the central density,$ a_{d} $ is the diffuseness parameter, and the half-density radius is c=1.07A1/3 [60].Moreover, the nuclear mass is conserved under the following condition:
$ \begin{aligned} 4\pi r^{2}\int_{0}^{+\infty }\rho _{A}(r)dr=A. \end{aligned} $
(19) Because of the saturation and short-range nature of the nuclear force, it is assumed that a nucleon at a distance r from the nuclear center is influenced only by the surrounding nucleons and the physical vacuum within a small spherical volume
$ \Delta V $ , as illustrated in Fig. 2. The value of$ \kappa_A $ outside this nucleon is the average of the$ \kappa = 1 $ and$ \kappa = 0 $ regions within$ \Delta V $ .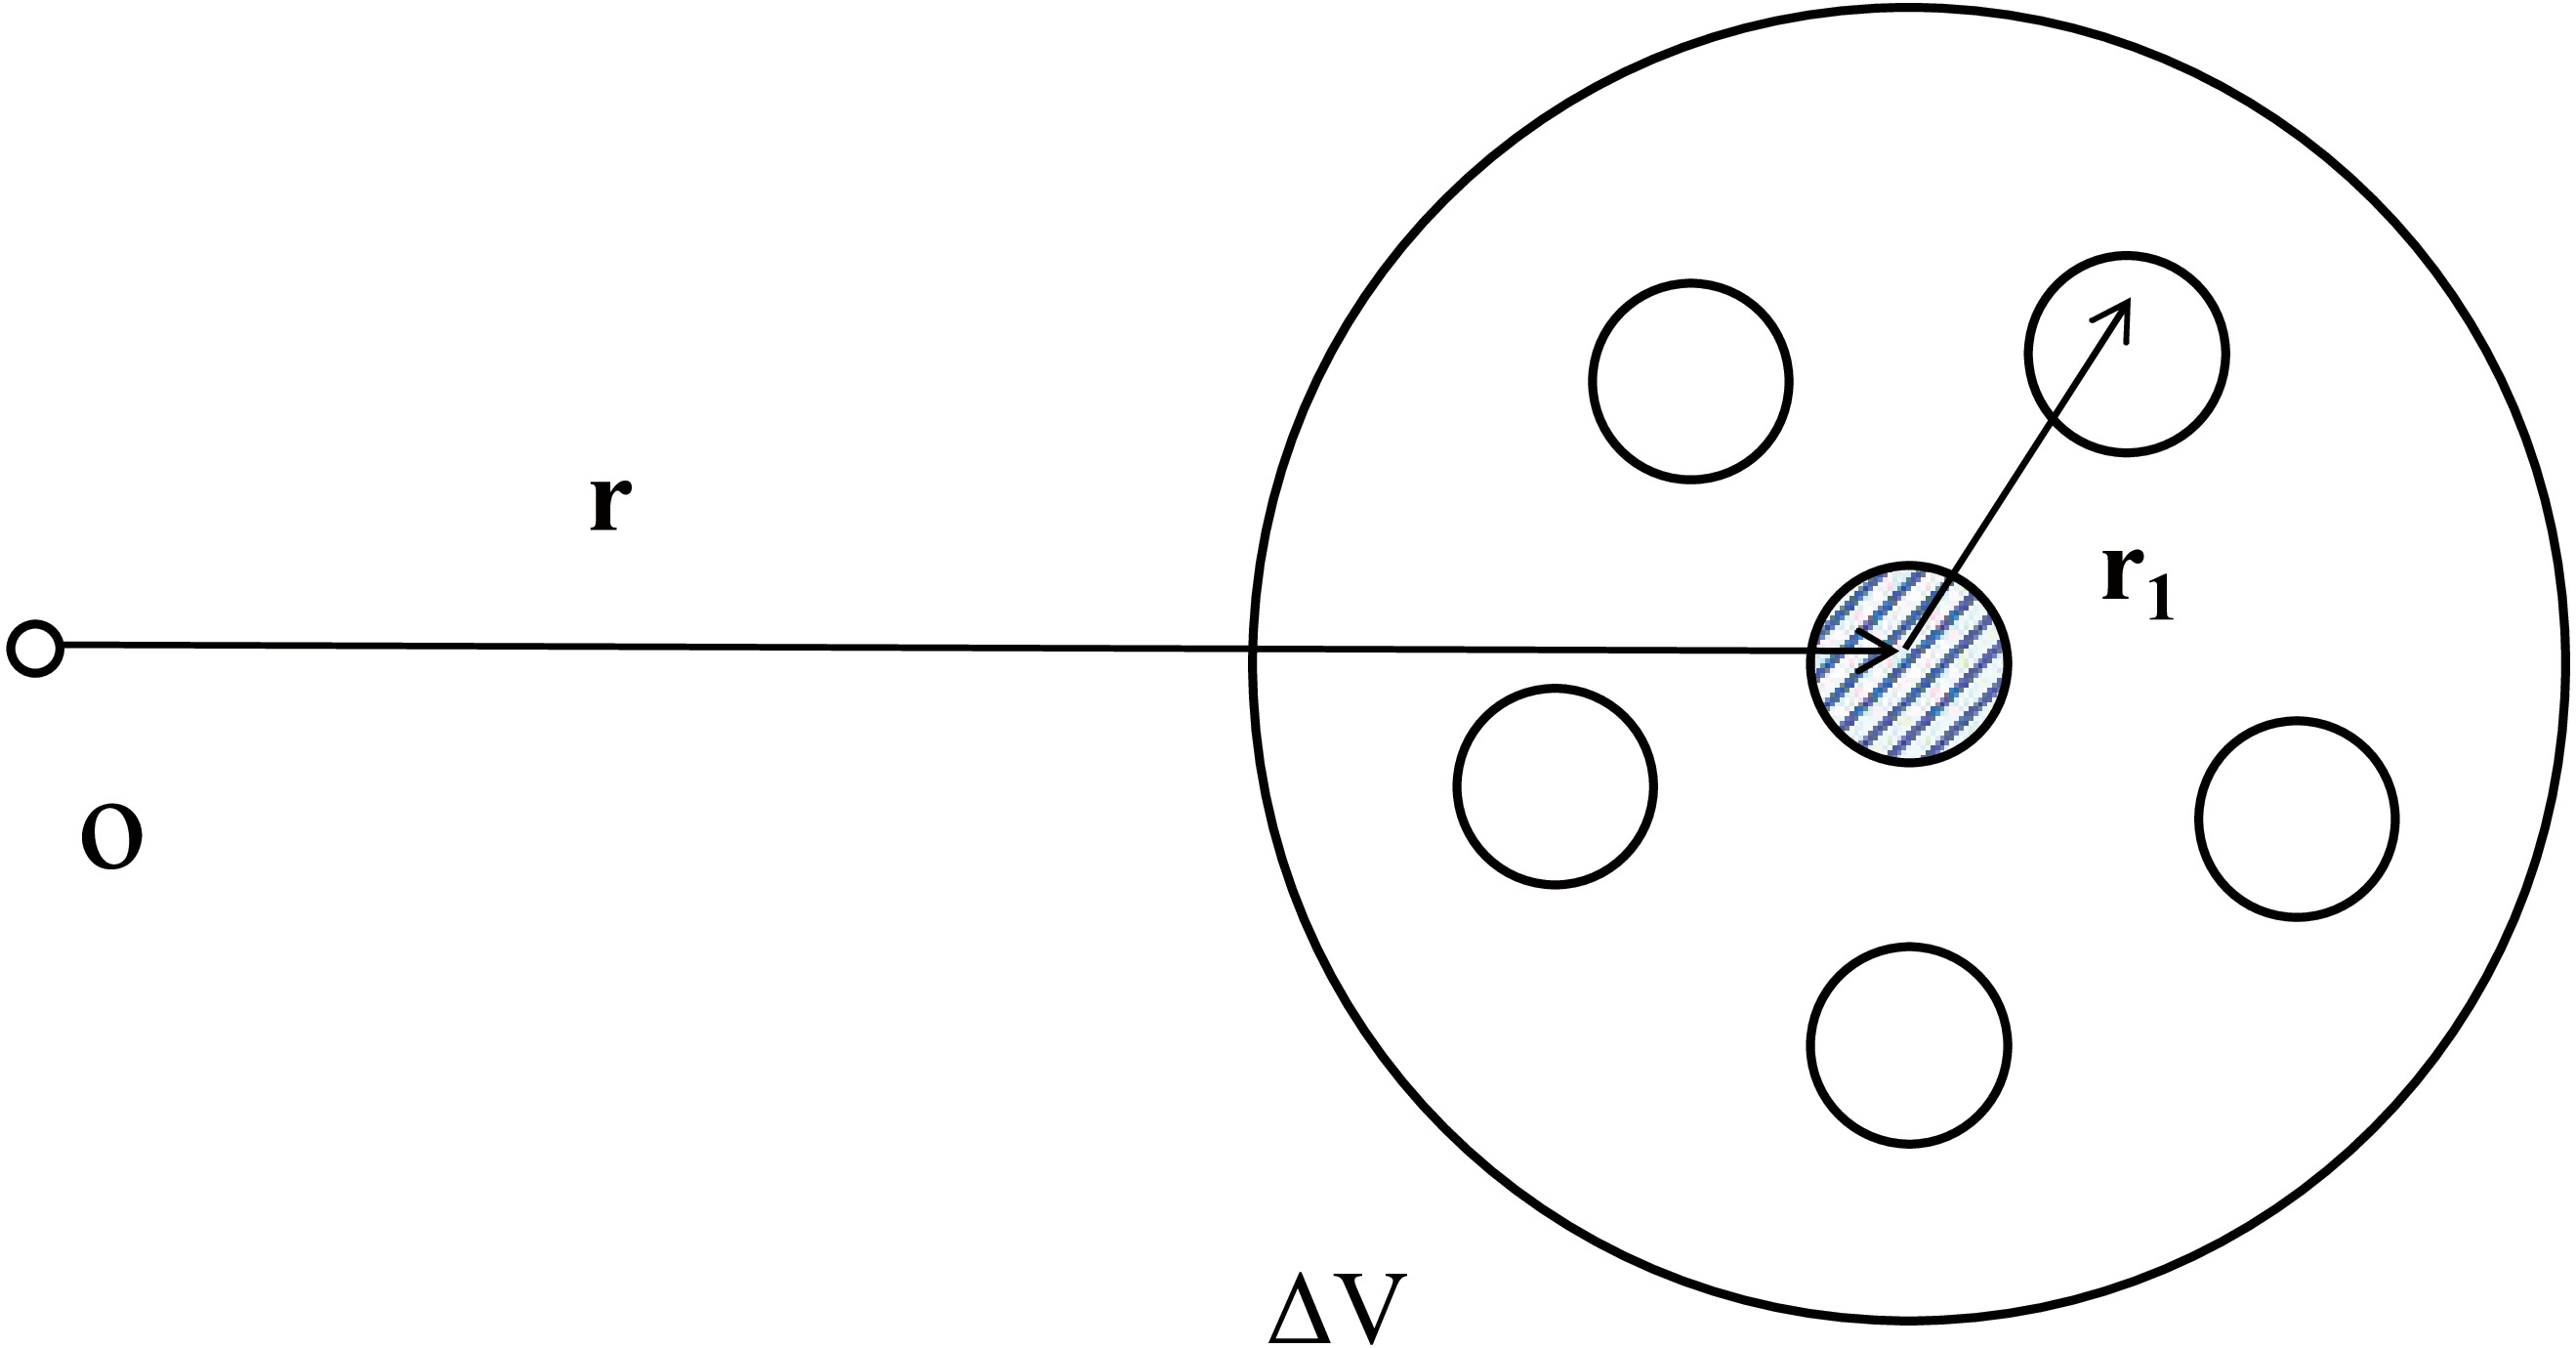
Figure 2. (color online) A nucleon at a distance r from the nuclear center is influenced by the surrounding nucleons within a small spherical volume
$ \Delta V $ .$ \begin{aligned}[b] \kappa _{A}(r) &=\frac{1}{\Delta V}\int_{\Delta V}\frac{4\pi }{3}R_{A}^{3}( {\bf{r}}+{\bf{r}}_{1})\rho _{A}({\bf{r}}+{\bf{r}}_{1})d\tau \\ &=\frac{4\pi }{3}R_{A}^{3}\rho _{A}(r). \end{aligned} $
(20) Thus,
$ \kappa_A(r) $ is proportional to the local nucleon density$ \rho_A(r) $ and the nucleon bag volume.In the nuclear interior, the effective scalar field outside the nucleon bag is reduced from
$ \sigma_{{\rm{vac}}} $ to$ \sigma_A $ [57−59], as shown in Fig. 1. Correspondingly, the V(σ) outside the bag changes from m to n. The difference between the value of V(σ) at$ \sigma = \sigma_A $ and that at$ \sigma =0 $ ($ B_{A} $ =$ B_{0} $ -$ \Delta B_{A} $ ) is the effective bag constant, which is smaller than that of a free nucleon by$ \Delta B_A $ . This reduction in external pressure causes the bag to expand.Expanding
$ V(\sigma_A) $ as a Taylor series around$ \sigma_{{\rm{vac}}} $ and retaining the first two non-zero terms yields$ \begin{aligned}[b] V(\sigma _{A}) &=\Delta B_{A} \\ &=b_{1}(\sigma _{A}-\sigma _{vac})^{2}+b_{2}(\sigma _{A}-\sigma _{vac})^{3} \\ &=G_{1}\kappa _{A}^{2}(r)-G_{2}\kappa _{A}^{3}(r). \end{aligned} $
(21) The pressure balance condition between the interior and the exterior of the bag is [57−59]
$ \begin{aligned} \Delta B_A = \frac{3M_0 R_0}{16\pi} \left(\frac{1}{R_0^4} - \frac{1}{R_A^4}\right). \end{aligned} $
(22) Using Eqs. (20)-(22), the following equation is derived:
$ \begin{aligned} \frac{1024\pi ^{4}}{81M_{0}}B_{2}\rho _{A}^{3}(r)a_{A}^{13}(r)-\frac{256\pi ^{3}}{27M_{0}}B_{1}\rho _{A}^{2}(r)a_{A}^{10}(r)+a_{A}^{4}(r)-1=0, \end{aligned} $
(23) where
$ B_{1} $ =$ G_{1} $ $ R_{0}^{9} $ = 0.0504 GeV fm6,$ B_{2} $ =$ G_{2} $ $ R_{0}^{12} $ = 0.0260 GeV fm9 [59], and$ a_A(r) = R_A(r)/R_0 $ is the nucleon swelling factor. Solving Eq. (23) yields$ a_{A}(r) $ .Furthermore, the average value of
$ a_{A}(r) $ is defined as$ \begin{aligned} \overline{a_{A}}=\frac{1}{A}\int_{0}^{\infty }4\pi r^{2}\rho _{A}(r)a_{A}(r)\,dr. \end{aligned} $
(24) In Ref. [54], T. D. Lee pointed out that his bag model reduces to the MIT bag model in the limit in which both the coupling strength between the quarks and the σ field and the bag surface tension approach zero. Both bag models lead to the same conclusion that the nucleon size changes in the nuclear environment, and the trends of these changes are consistent with each other.
The nuclear medium alters the background field of the QCD vacuum, manifesting as a global shift in the expectation value of the σ field in T. D. Lee's soliton bag model. This shift further reduces the strength of the vacuum condensate, which can equivalently be described as a change in the bag constant B in the MIT bag model. According to the equilibrium condition of the MIT bag model, a change in the bag constant induces an adjustment in the nucleon equilibrium radius R. Specifically, if B decreases, the nucleon radius increases to maintain energy minimization; this is the phenomenon referred to as nucleon swelling. This structural modification directly affects the internal wave function and energy-level distribution of the nucleon, ultimately leading to a systematic deviation in the parton distribution functions within specific Bjorken-x regions, which is experimentally observed as the EMC effect. Therefore, nucleon swelling and the EMC effect can be discussed by integrating the MIT bag model with Lee's soliton bag model.
Based on the above discussion, Eqs. (14) and (15) can be written as
$ \begin{aligned} \xi _{V} &=\frac{a_{1}}{2}\left( M_{0}c^{2}\right) ^{1/2}\left( 1-\frac{1}{ \overline{a_{A}}}\right) ^{1/2}+b_{1}\ln A+c_{1}, \end{aligned} $
(25) $ \begin{aligned} \xi _{S} &=2a_{2}\left( M_{0}c^{2}\right) ^{-1/2}\left( 1-\frac{1}{ \overline{a_{A}}}\right) ^{-1/2}+b_{2}\ln A+c_{2}. \end{aligned} $
(26) Then, substituting the values of (
$ a_{1} $ ,$ b_{1} $ ,$ c_{1} $ ) and ($ a_{2} $ ,$ b_{2} $ ,$ c_{2} $ ) into Eqs. (25) and (26), and taking$ M_{0}c^{2} $ as 938.9185 MeV, the two equations for$ \xi _{V} $ and$ \xi _{S} $ can be further expressed as$ \begin{aligned} \xi _{V} &=9.3393\left( 1-\frac{1}{\overline{a_{A}}}\right) ^{1/2}+0.0333\ln A-0.2731, \end{aligned} $
(27) $ \begin{aligned} \xi _{S} &=-0.0175\left( 1-\frac{1}{\overline{a_{A}}}\right) ^{-1/2}-0.0230\ln A+0.2117. \end{aligned} $
(28) From Eqs. (18)–(24), it is evident that the value of
$ \overline{a_{A}} $ changes as the diffusion parameter$ a_{d} $ varies. Consequently, the corresponding rescaling parameters$ \xi _{V} $ and$ \xi _{S} $ , as well as the EMC ratio, also change with$ a_{d} $ . -
First, using the double
$ Q^{2} $ -rescaling model and Eqs. (3) and (4), the EMC ratios$ R^{A/D} $ ($ x, Q^{2} $ ) for nuclei with$ A \geq 12 $ are calculated and plotted in Fig. 3, where the$ R^{A/D} $ ($ x, Q^{2} $ ) values calculated using the previous double$ Q^{2} $ -rescaling model [53] are also shown. From Fig. 3, it can be seen that our calculated$ R^{A/D} $ ($ x, Q^{2} $ ) values are in good agreement with the experimental data and are even closer to the experimental data than those given in Ref. [53]. This indicates that the predictive power of Eqs. (3) and (4) is stronger than that of the empirical formulas for$ \xi _{V} $ and$ \xi _{S} $ in Ref. [53]. In Ref. [53], the parameters of the empirical formulas for$ \xi _{V} $ and$ \xi _{S} $ were derived by fitting the experimental$ R^{A/D} $ ($ x, Q^{2} $ ) values from the last century. The precision of the earlier EMC-effect data might have been limited by the experimental facilities and detection technologies available at that time. Furthermore, the average binding energy E used in Ref. [53] included only the volume and surface energies. Thus, the accuracy of the E values in Ref. [53] is lower than that of the experimental E values [55] used in this work. Therefore, when we apply the empirical formulas for$ \xi _{V} $ and$ \xi _{S} $ from Ref. [53] to study the new high-precision experimental data on the EMC effect, it is natural that the calculated results exhibit some deviation from the new data. Because Eqs. (27) and (28) are obtained within T. D. Lee's soliton bag model based on Eqs. (3) and (4), we have sufficient confidence to discuss the ratio$ R^{A/D} $ ($ x, Q^{2} $ ) as affected by the diffusion parameter$ a_{d} $ .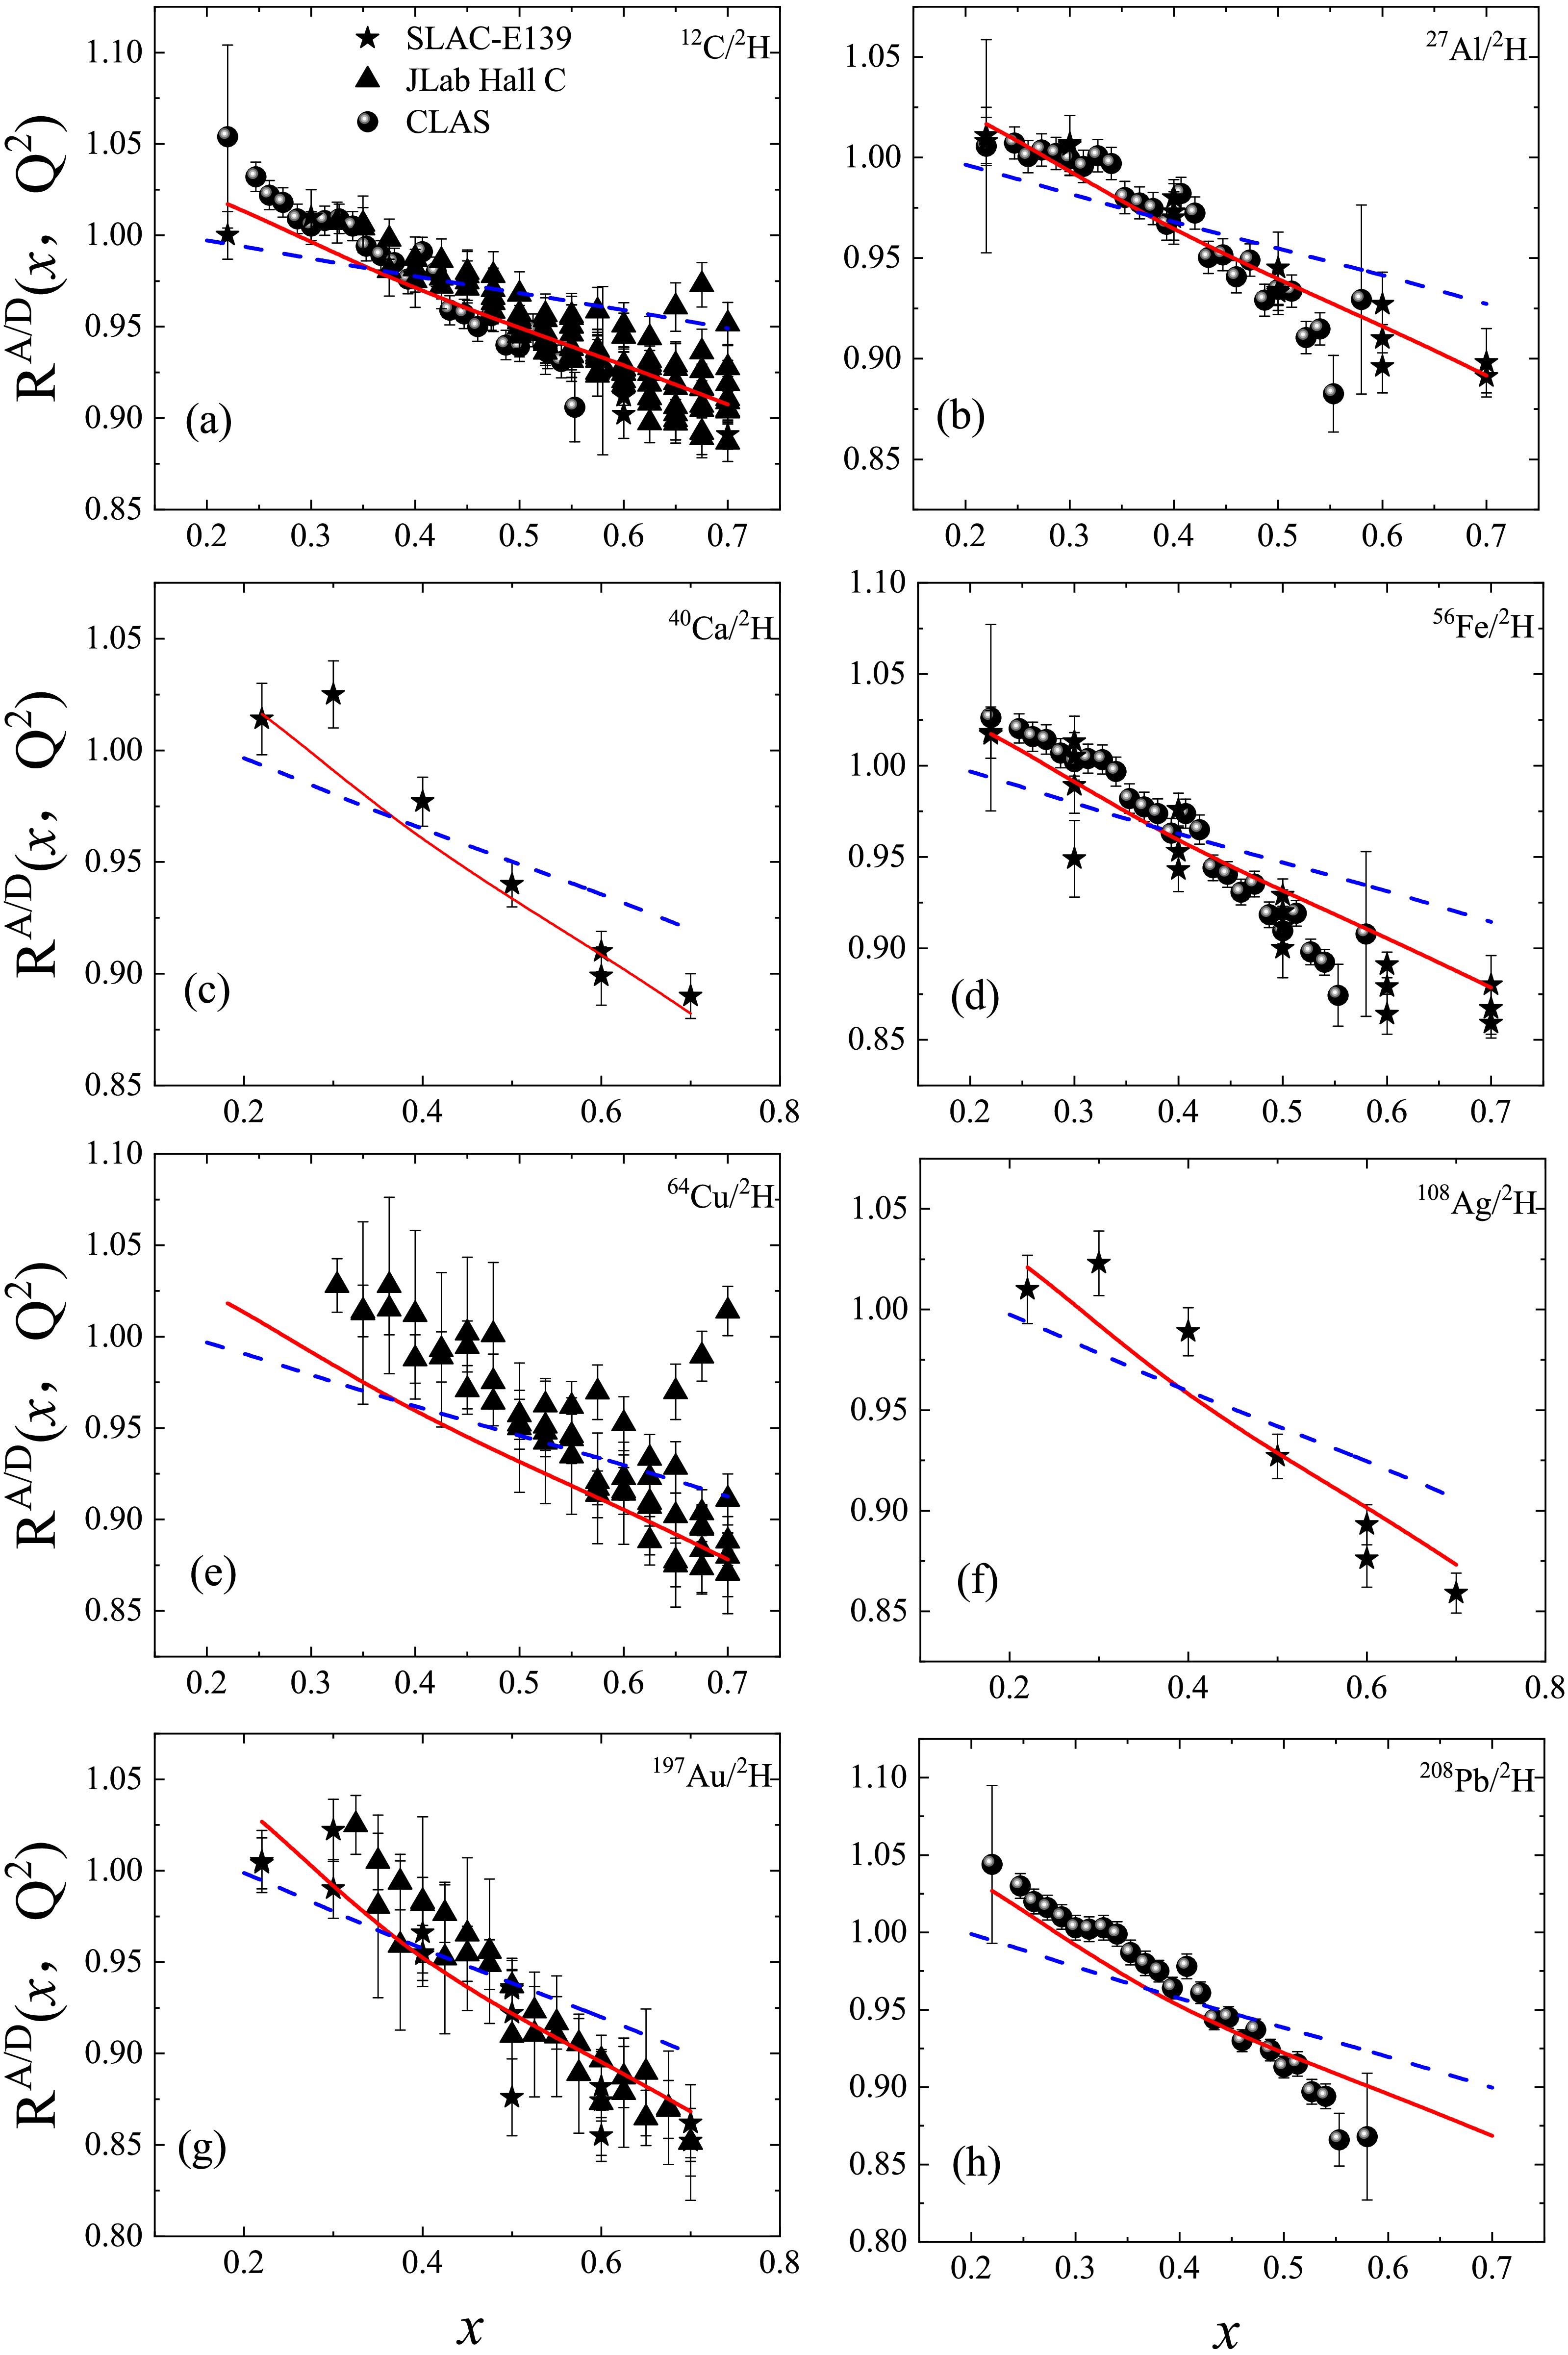
Figure 3. (Color online) Comparison of the experimental EMC ratios
$ R^{A/D} $ ($ x, Q^{2} $ ) with those extracted from the double$ Q^{2} $ -rescaling model for nuclei with$ A \geq 12 $ . The red solid and blue dashed curves represent the calculated$ R^{A/D} $ ($ x, Q^{2} $ ) values obtained using our modified double$ Q^{2} $ -rescaling model and the previous double$ Q^{2} $ -rescaling model [53], respectively. The solid stars, triangles, and circles represent the experimental data taken from the SLAC-E139 [15], JLab Hall C [16], and CLAS [17] collaborations, respectively.It is well known that 208Pb is a doubly magic nucleus (proton magic number Z=82, neutron magic number N=126). Because of its relatively simple structure and stability, it serves as an ideal testing ground for nuclear models. Therefore, we discuss the change in the ratio
$ R^{A/D} $ ($ x, Q^{2} $ ) caused by$ a_{d} $ by taking 208Pb as an example. Using Eqs. (18) and (19), we calculate its nucleon density distributions$ \rho_A(r) $ versus the radial distance r for different values of the diffusion parameter$ a_{d} $ . Moreover, using Eq. (23), we extract the distributions of the corresponding nucleon swelling factor$ a_{A}(r) $ for different$ a_{d} $ values. The distributions of$ \rho _{A}(r) $ and$ a_{A}(r) $ are plotted in Figs. 4(a) and 4(b), respectively. From Fig. 4, one can see that the distribution of$ a_{A}(r) $ is similar to that of$ \rho _{A}(r) $ . This indicates that nucleon swelling at the high density in the central region is more pronounced than that at the low density in the surface region. Moreover, it is seen that the central density gradually decreases with the enhancement of$ a_{d} $ because some nucleons around the central region are redistributed to the surface region under the constraint of Eq. (19). As a result, the$ a_{A}(r) $ value in the central region becomes smaller and smaller. When more nucleons are located on the nuclear surface, the nucleus as a whole becomes more loosely bound. Therefore, the$ \overline{a_{A}} $ value may gradually decrease with the increase of$ a_{d} $ . To test this speculation, we estimate the$ \overline{a_{A}} $ values with different$ a_{d} $ values for 12C, 27Al, 40Ca, 56Fe, 64Cu, 108Ag, 197Au, and 208Pb. These$ \overline{a_{A}} $ values are shown in Table 1. From Table 1, we can see that, for each nucleus, the$ \overline{a_{A}} $ value does indeed decrease with the increase of$ a_{d} $ . Moreover, for a given$ a_{d} $ value, the$ \overline{a_{A}} $ value increases with the enhancement of the mass number A.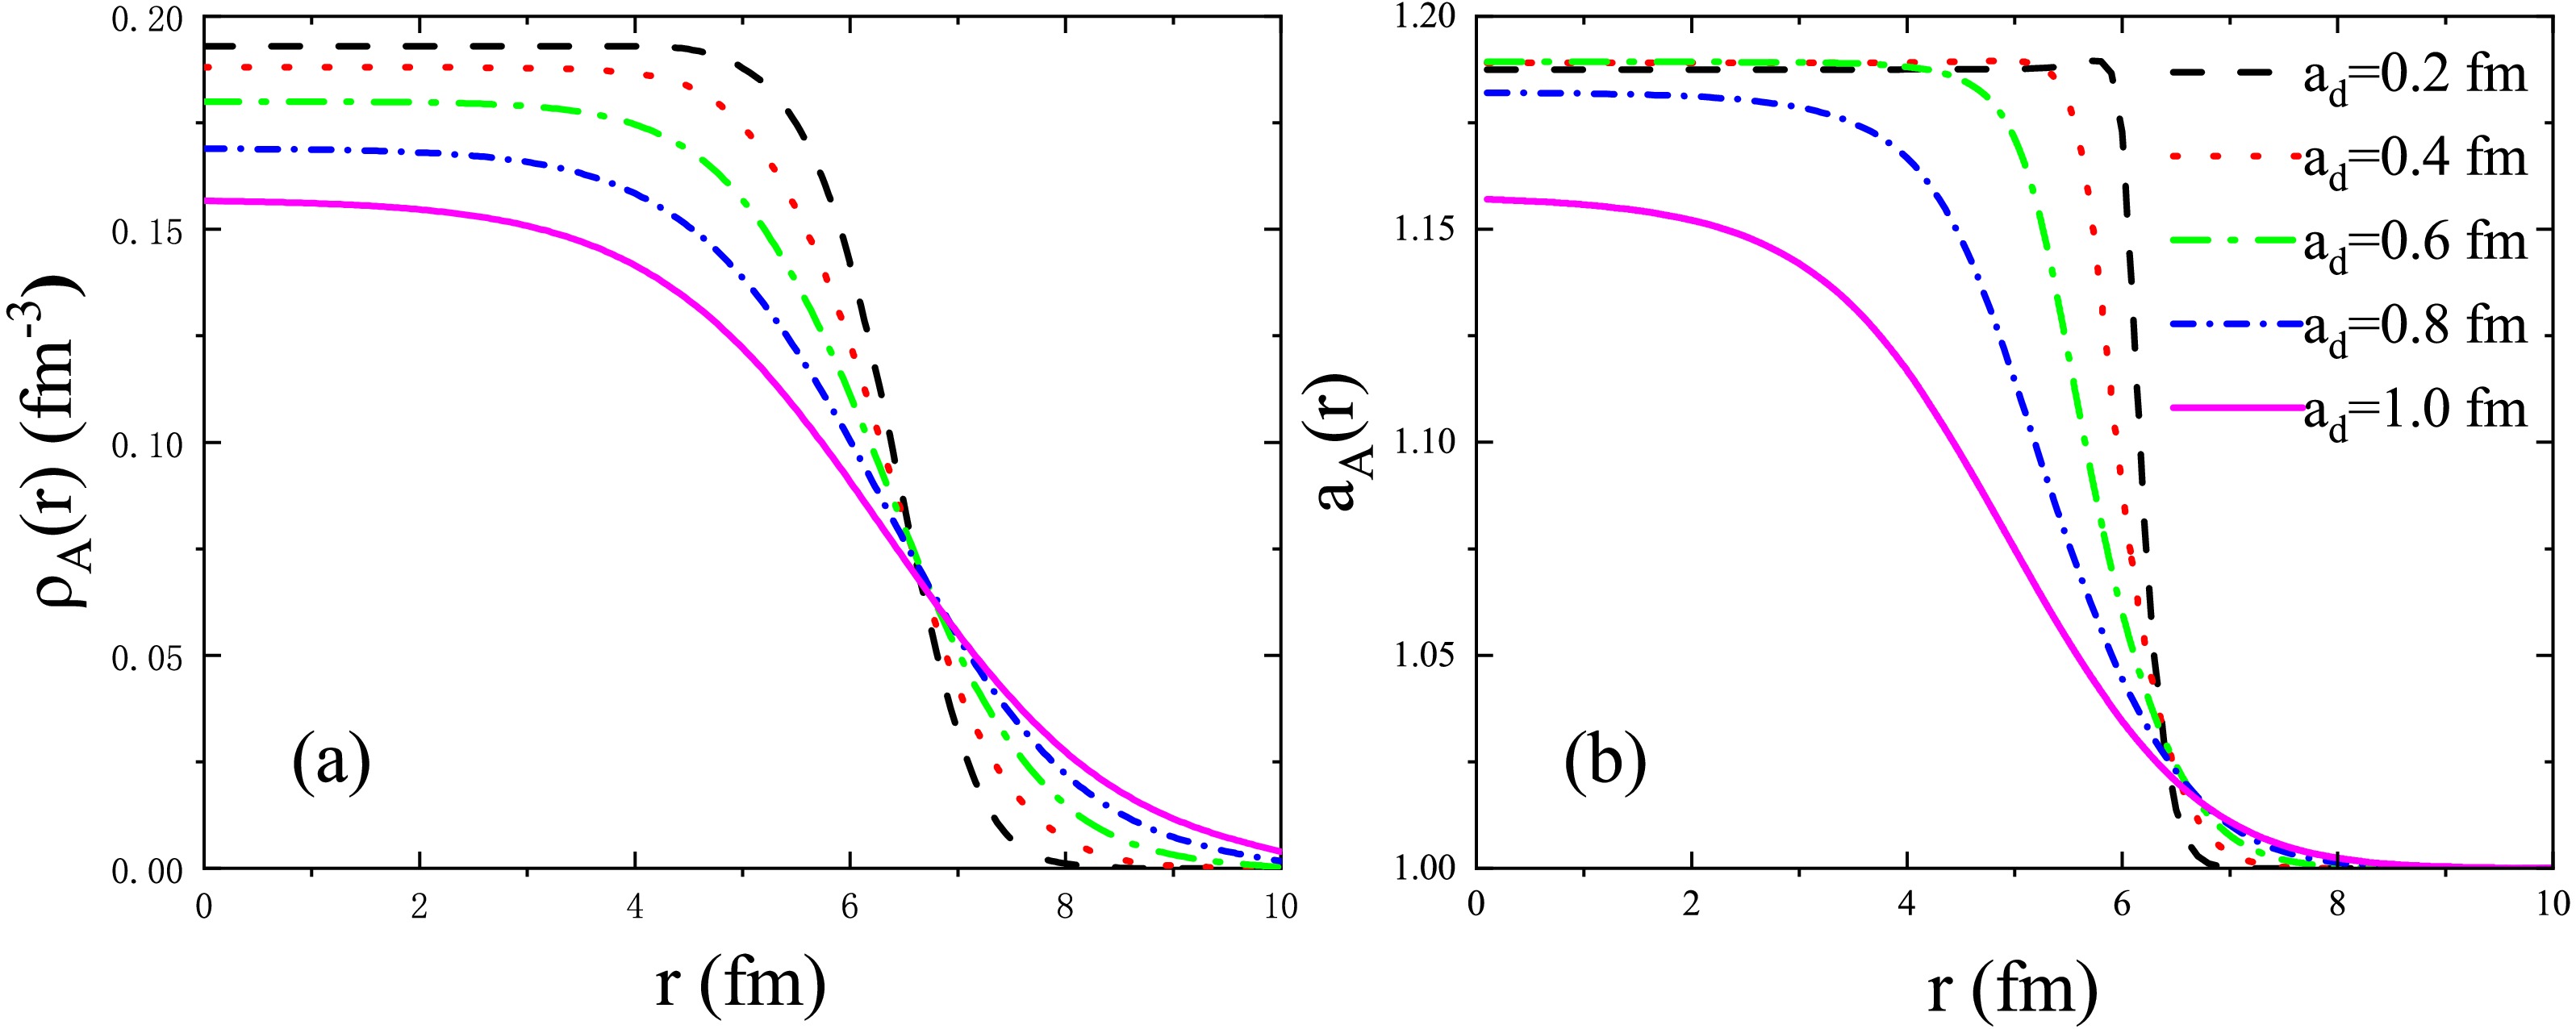
Figure 4. (Color online) (a) Nucleon density distributions of 208Pb as a function of the radial distance r for different values of the diffusion parameter
$ a_{d} $ ; (b) corresponding nucleon swelling factor distributions for different$ a_{d} $ values. The black dashed, red dotted, green dash-dotted, blue dash-dot-dotted, and magenta solid curves correspond to$ a_{d} $ = 0.2, 0.4, 0.6, 0.8, and 1.0 fm, respectively.Nuclei $ \overline{a_{A}} $ $ a_{d} $ =0.2 fm$ a_{d} $ =0.4 fm$ a_{d} $ =0.6 fm$ a_{d} $ =0.8 fm$ a_{d} $ =1.0 fm12C 1.130 1.059 1.024 1.012 1.007 27Al 1.147 1.088 1.039 1.020 1.017 40Ca 1.155 1.108 1.060 1.030 1.013 56Fe 1.159 1.121 1.068 1.038 1.022 64Cu 1.158 1.123 1.079 1.039 1.024 108Ag 1.162 1.134 1.099 1.060 1.040 197Au 1.167 1.148 1.119 1.087 1.060 208Pb 1.167 1.148 1.124 1.091 1.061 Table 1. The average nucleon swelling factor
$ \overline{a_{A}} $ for different$ a_{d} $ values in nuclei with$ A \geq 12 $ .Then, the rescaling parameters
$ \xi _{V} $ and$ \xi _{S} $ for various nuclei with different$ a_{d} $ values can be extracted using Eqs. (27) and (28) by inputting the$ \overline{a_{A}} $ values listed in Table 1. In Table 2, we present the$ \xi _{V} $ and$ \xi _{S} $ values for 208Pb with different$ a_{d} $ values. As shown in Table 2, the$ \xi _{V} $ value is much larger than the$ \xi _{S} $ value for any$ a_{d} $ value. This indicates that the contribution to the EMC effect from valence quarks is much more significant than that from sea quarks, a conclusion that has been widely accepted by researchers [51, 61, 62].$ a_{d} $ (fm)$ \xi _{V} $ $ \xi _{S} $ $- dR^{A/D}(x,Q^{2})/dx $ 0.2 3.4449 0.0427 0.4478 0.4 3.2608 0.0402 0.4358 0.6 3.0137 0.0363 0.4184 0.8 2.6059 0.0284 0.3857 1.0 2.1568 0.0163 0.3444 Table 2. The rescaling parameters
$ \xi _{V} $ and$ \xi _{S} $ , and the slope of the EMC ratio, -$ dR^{A/D}(x,Q^{2})/dx $ , for different$ a_{d} $ values for 208Pb.Next, within the double
$ Q^{2} $ -rescaling model, the$ R^{A/D} $ ($ x, Q^{2} $ ) values for various nuclei are calculated using different$ a_{d} $ values and the$ \xi _{V} $ and$ \xi _{S} $ values extracted from Eqs. (27) and (28), as shown in Fig. 5. As can be seen from Fig. 5, for each nucleus, the calculated$ R^{A/D} $ ($ x, Q^{2} $ ) gradually approaches the experimental data as$ a_{d} $ increases. However, the calculated slope of the EMC ratio, -$ dR^{A/D}(x,Q^{2})/dx $ , becomes progressively smaller as$ a_{d} $ increases, suggesting that nuclei with weaker surface binding exhibit a less pronounced EMC effect. Furthermore, taking 208Pb as an example, the value of -$ dR^{A/D}(x,Q^{2})/dx $ for each$ a_{d} $ value is calculated and listed in the last column of Table 2. The evolution of -$ dR^{A/D}(x,Q^{2})/dx $ with$ a_{d} $ is consistent with that shown in Fig. 5(h). This behavior is attributed to the decrease in the$ \xi _{V} $ and$ \xi _{S} $ values with increasing$ a_{d} $ , as can be clearly seen from Table 2. However, measurements by the CLAS Collaboration suggest that the -$ dR^{A/D}(x,Q^{2})/dx $ value for 208Pb is 0.539$ \pm 0.020 $ [17]. By comparing the calculated -$ dR^{A/D}(x,Q^{2})/dx $ values obtained with different$ a_{d} $ values with the corresponding experimental data, it is evident that larger$ a_{d} $ values lead to greater deviations between the calculated -$ dR^{A/D}(x,Q^{2})/dx $ and the experimental data. In other words, when the calculated$ R^{A/D} $ ($ x, Q^{2} $ ) best matches the experimental data, the corresponding -$ dR^{A/D}(x,Q^{2})/dx $ does not agree well with the experimental slope. Conversely, when the calculated -$ dR^{A/D}(x,Q^{2})/dx $ results agree well with the experimental measurements, the$ R^{A/D} $ ($ x, Q^{2} $ ) values deviate from the experimental data. Hence, we can conclude that adjusting only the$ a_{d} $ parameter is insufficient to reproduce the experimental$ R^{A/D} $ ($ x, Q^{2} $ ) values and the corresponding -$ dR^{A/D}(x,Q^{2})/dx $ values simultaneously; other nuclear medium effects should also be taken into account.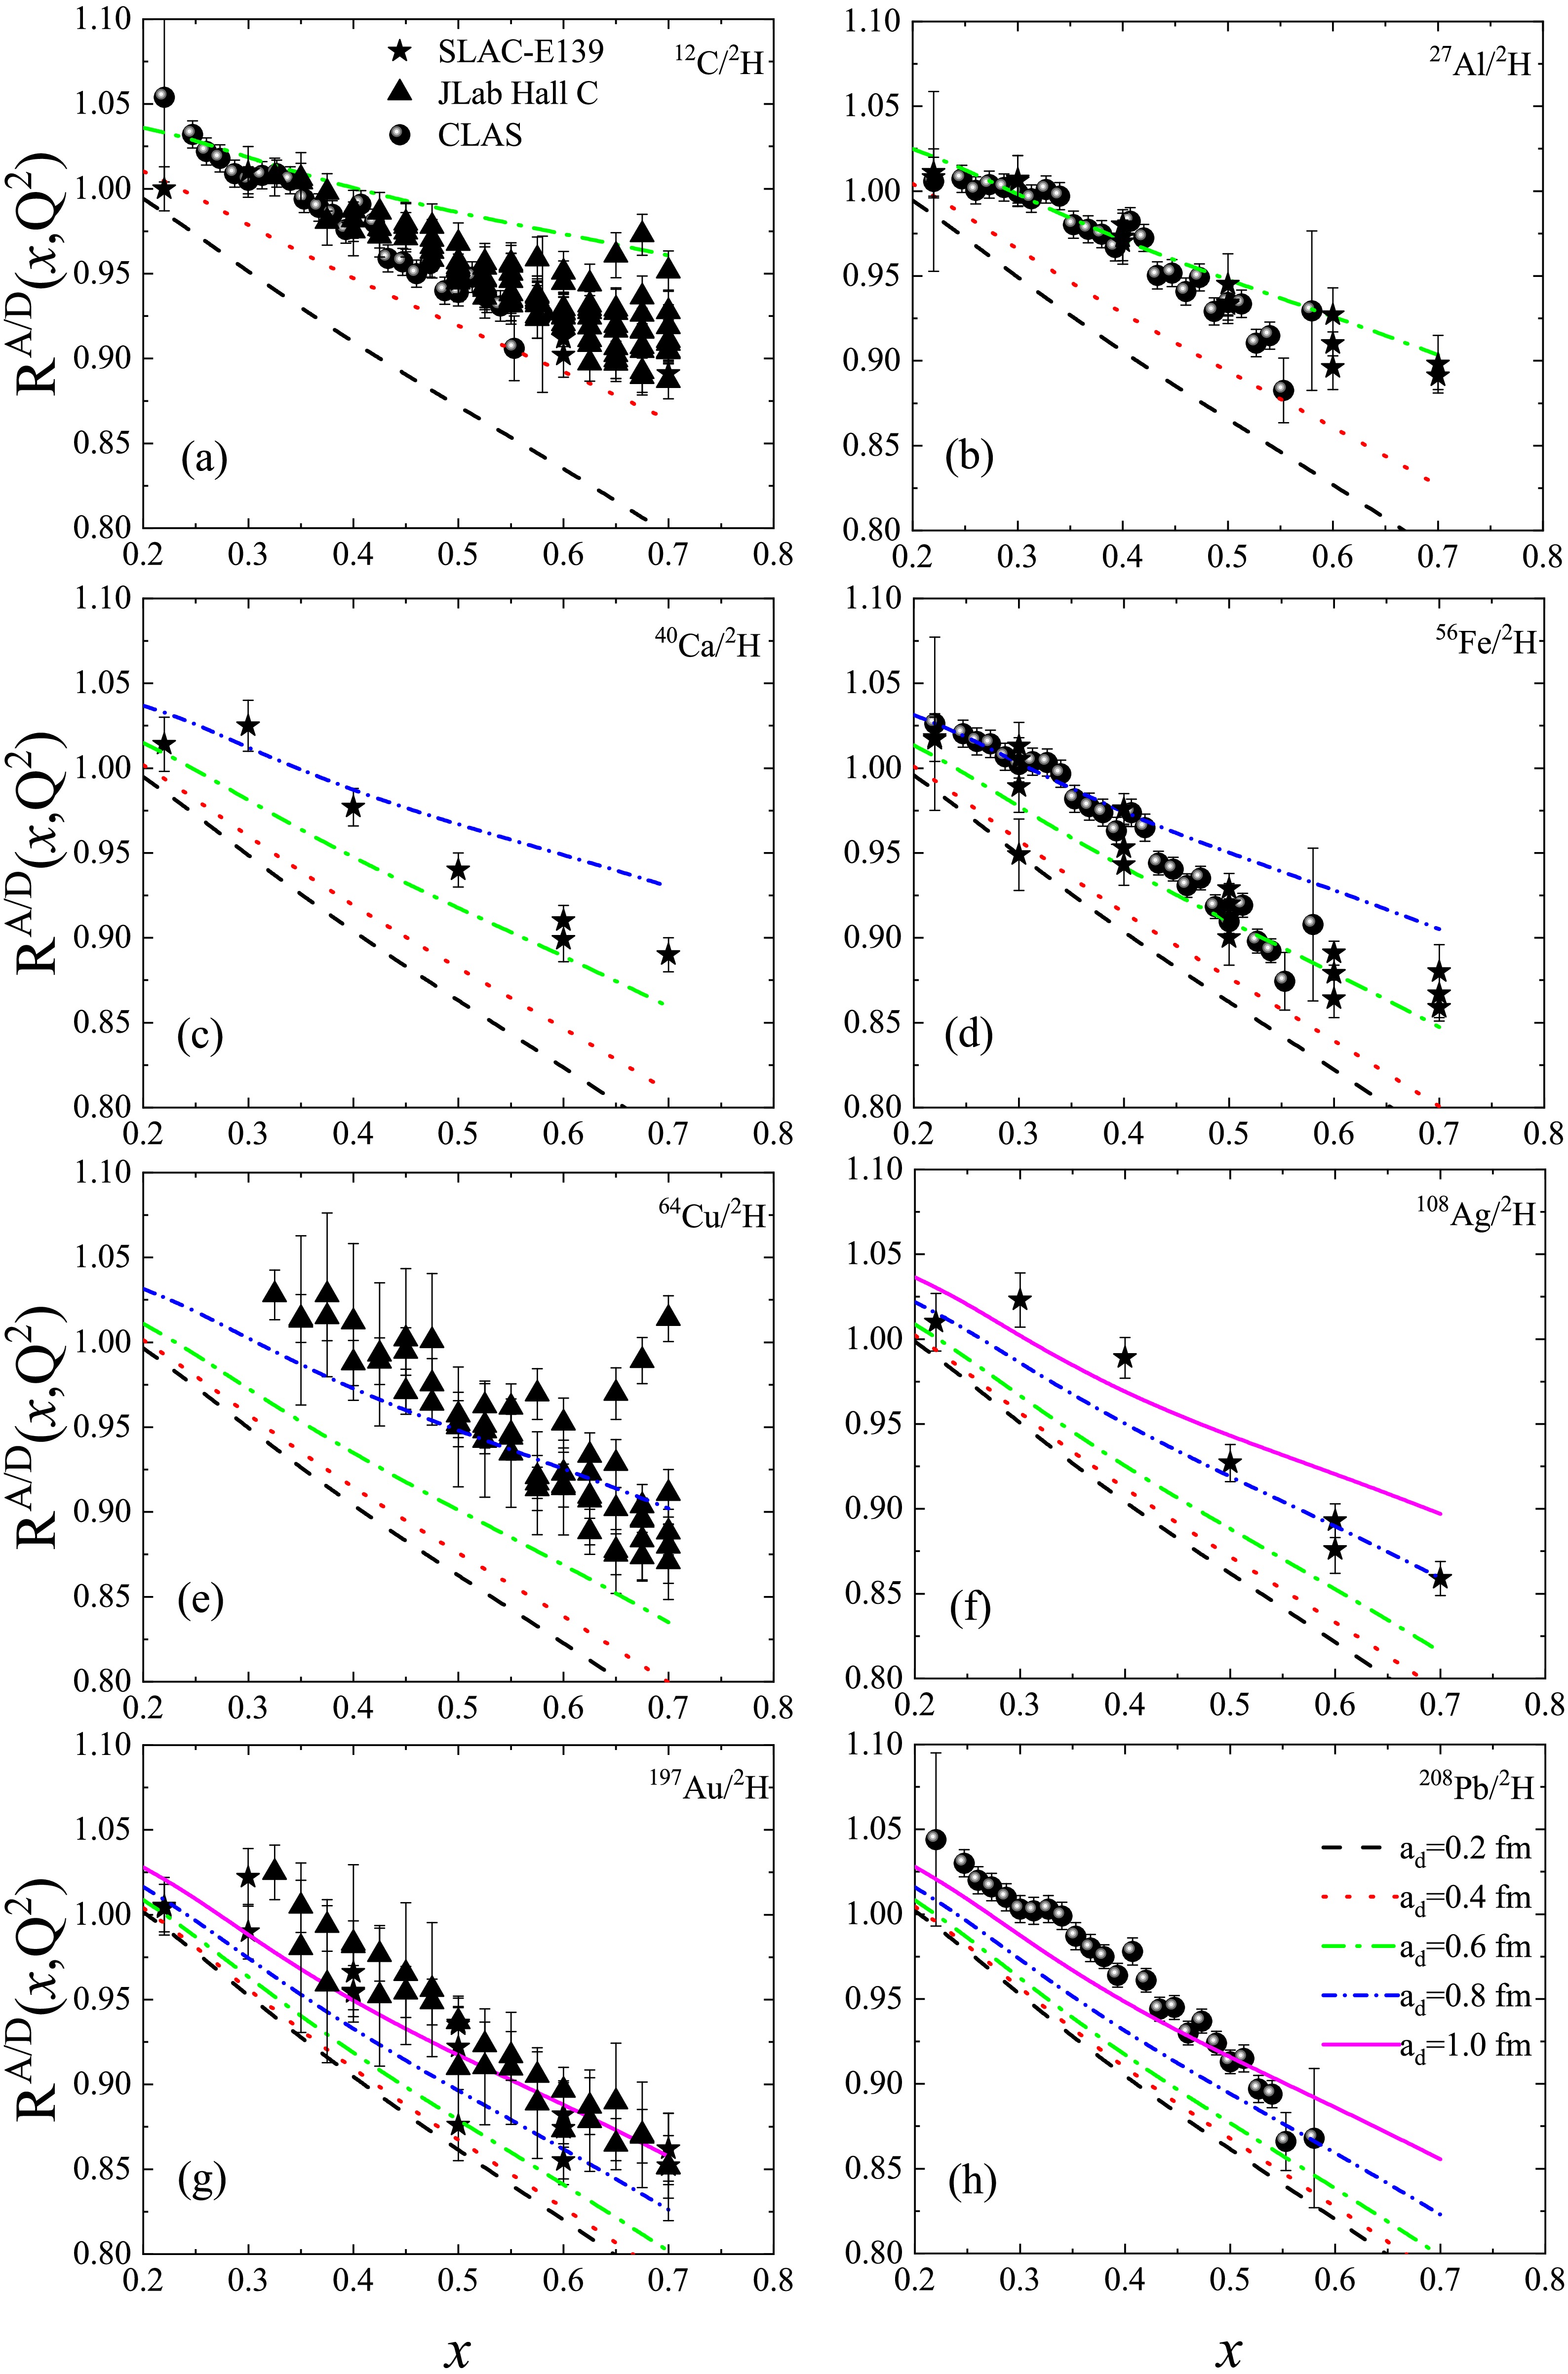
Figure 5. (Color online) Calculated
$ R^{A/D} $ ($ x, Q^{2} $ ) values for nuclei with$ A \geq 12 $ obtained using different values of the diffusion parameter$ a_{d} $ within our modified double-$ Q^{2} $ -rescaling model. The curves, from top to bottom at large x, correspond to$ a_{d} $ = 0.2, 0.4, 0.6, 0.8, and 1.0 fm, respectively, and are represented by black dashed, red dotted, green dash-dotted, blue dash-dot-dotted, and magenta solid lines.It should be noted that other nuclear medium effects, such as the α-cluster effect at the nuclear surface [16], off-shell corrections [18, 19], quark exchange [32−38], N-N SRC [44, 45], coupling between the isovector-vector mean field and quarks [63], and nucleon electromagnetic form factors [64], may also contribute to the EMC effect. In particular, the N-N SRC effect modifies the high-momentum tail of the nucleon momentum distribution, thereby influencing the slope of the EMC ratio. Future work will focus on incorporating these effects into the present framework, with the aim of simultaneously reproducing both the magnitude and the x-dependence of the EMC ratios.
By fitting the experimental
$ R^{A/D} $ ($ x, Q^{2} $ ) values from the SLAC-E139 [15], JLab Hall C [16], and CLAS [17] collaborations, the optimal$ a_{d} $ values for nuclei with$ A \geq 12 $ are determined. Note that these$ a_{d} $ values do not include the contribution from the Coulomb interaction. Meanwhile, the corresponding$ \overline{a_{A}} $ values can be extracted. The optimal$ a_{d} $ values and the corresponding$ \overline{a_{A}} $ values for these nuclei are listed in columns 2 and 3 of Table 3. Generally, the diffusion parameter$ a_{d} $ is taken as 0.54 fm. However, our calculations, listed in column 2 of Table 3, suggest that the$ a_{d} $ value for each nucleus is larger than 0.54 fm, except for that of 12C. To examine the fitting results obtained with the optimal$ a_{d} $ values, we recalculate the$ R^{A/D} $ ($ x, Q^{2} $ ) values of these nuclei using the optimal$ a_{d} $ values within our modified double$ Q^{2} $ -rescaling model, which combines Eqs. (27) and (28). The fitting results are satisfactory, as shown in Fig. 6. Then, by substituting the corresponding$ \overline{a_{A}} $ values into Eq. (27) and combining Eq. (3), the average binding energy of each nucleus can be extracted, as listed in column 4 of Table 3.Nuclei $ a_{d} $ (fm)$ \overline{a_{A}} $ $ E^{{\rm{cal.}}} $ (MeV)$ E^{{\rm{expt.}}} $ (MeV)Δ% 12C 0.47 1.036 8.157 8.623 5.41% 27Al 0.59 1.045 10.107 9.834 2.78% 40Ca 0.68 1.044 9.893 10.656 7.17% 56Fe 0.71 1.052 11.603 11.062 4.89% 64Cu 0.81 1.037 8.375 11.104 24.58% 108Ag 0.86 1.056 12.448 11.634 6.99% 197Au 1.02 1.060 13.287 11.836 12.26% 208Pb 1.07 1.056 12.448 11.796 5.52% Table 3. The optimized
$ a_{d} $ values and the corresponding$ \overline{a_{A}} $ values are given for nuclei with$ A \geq 12 $ . The calculated average binding energy,$ E^{{\rm{cal.}}} $ , is obtained from Eqs. (3) and (27).$ E^{{\rm{expt.}}} $ denotes the experimental average binding energy [55]. Δ% denotes the relative error between$ E^{{\rm{cal.}}} $ and$ E^{{\rm{expt.}}} $ .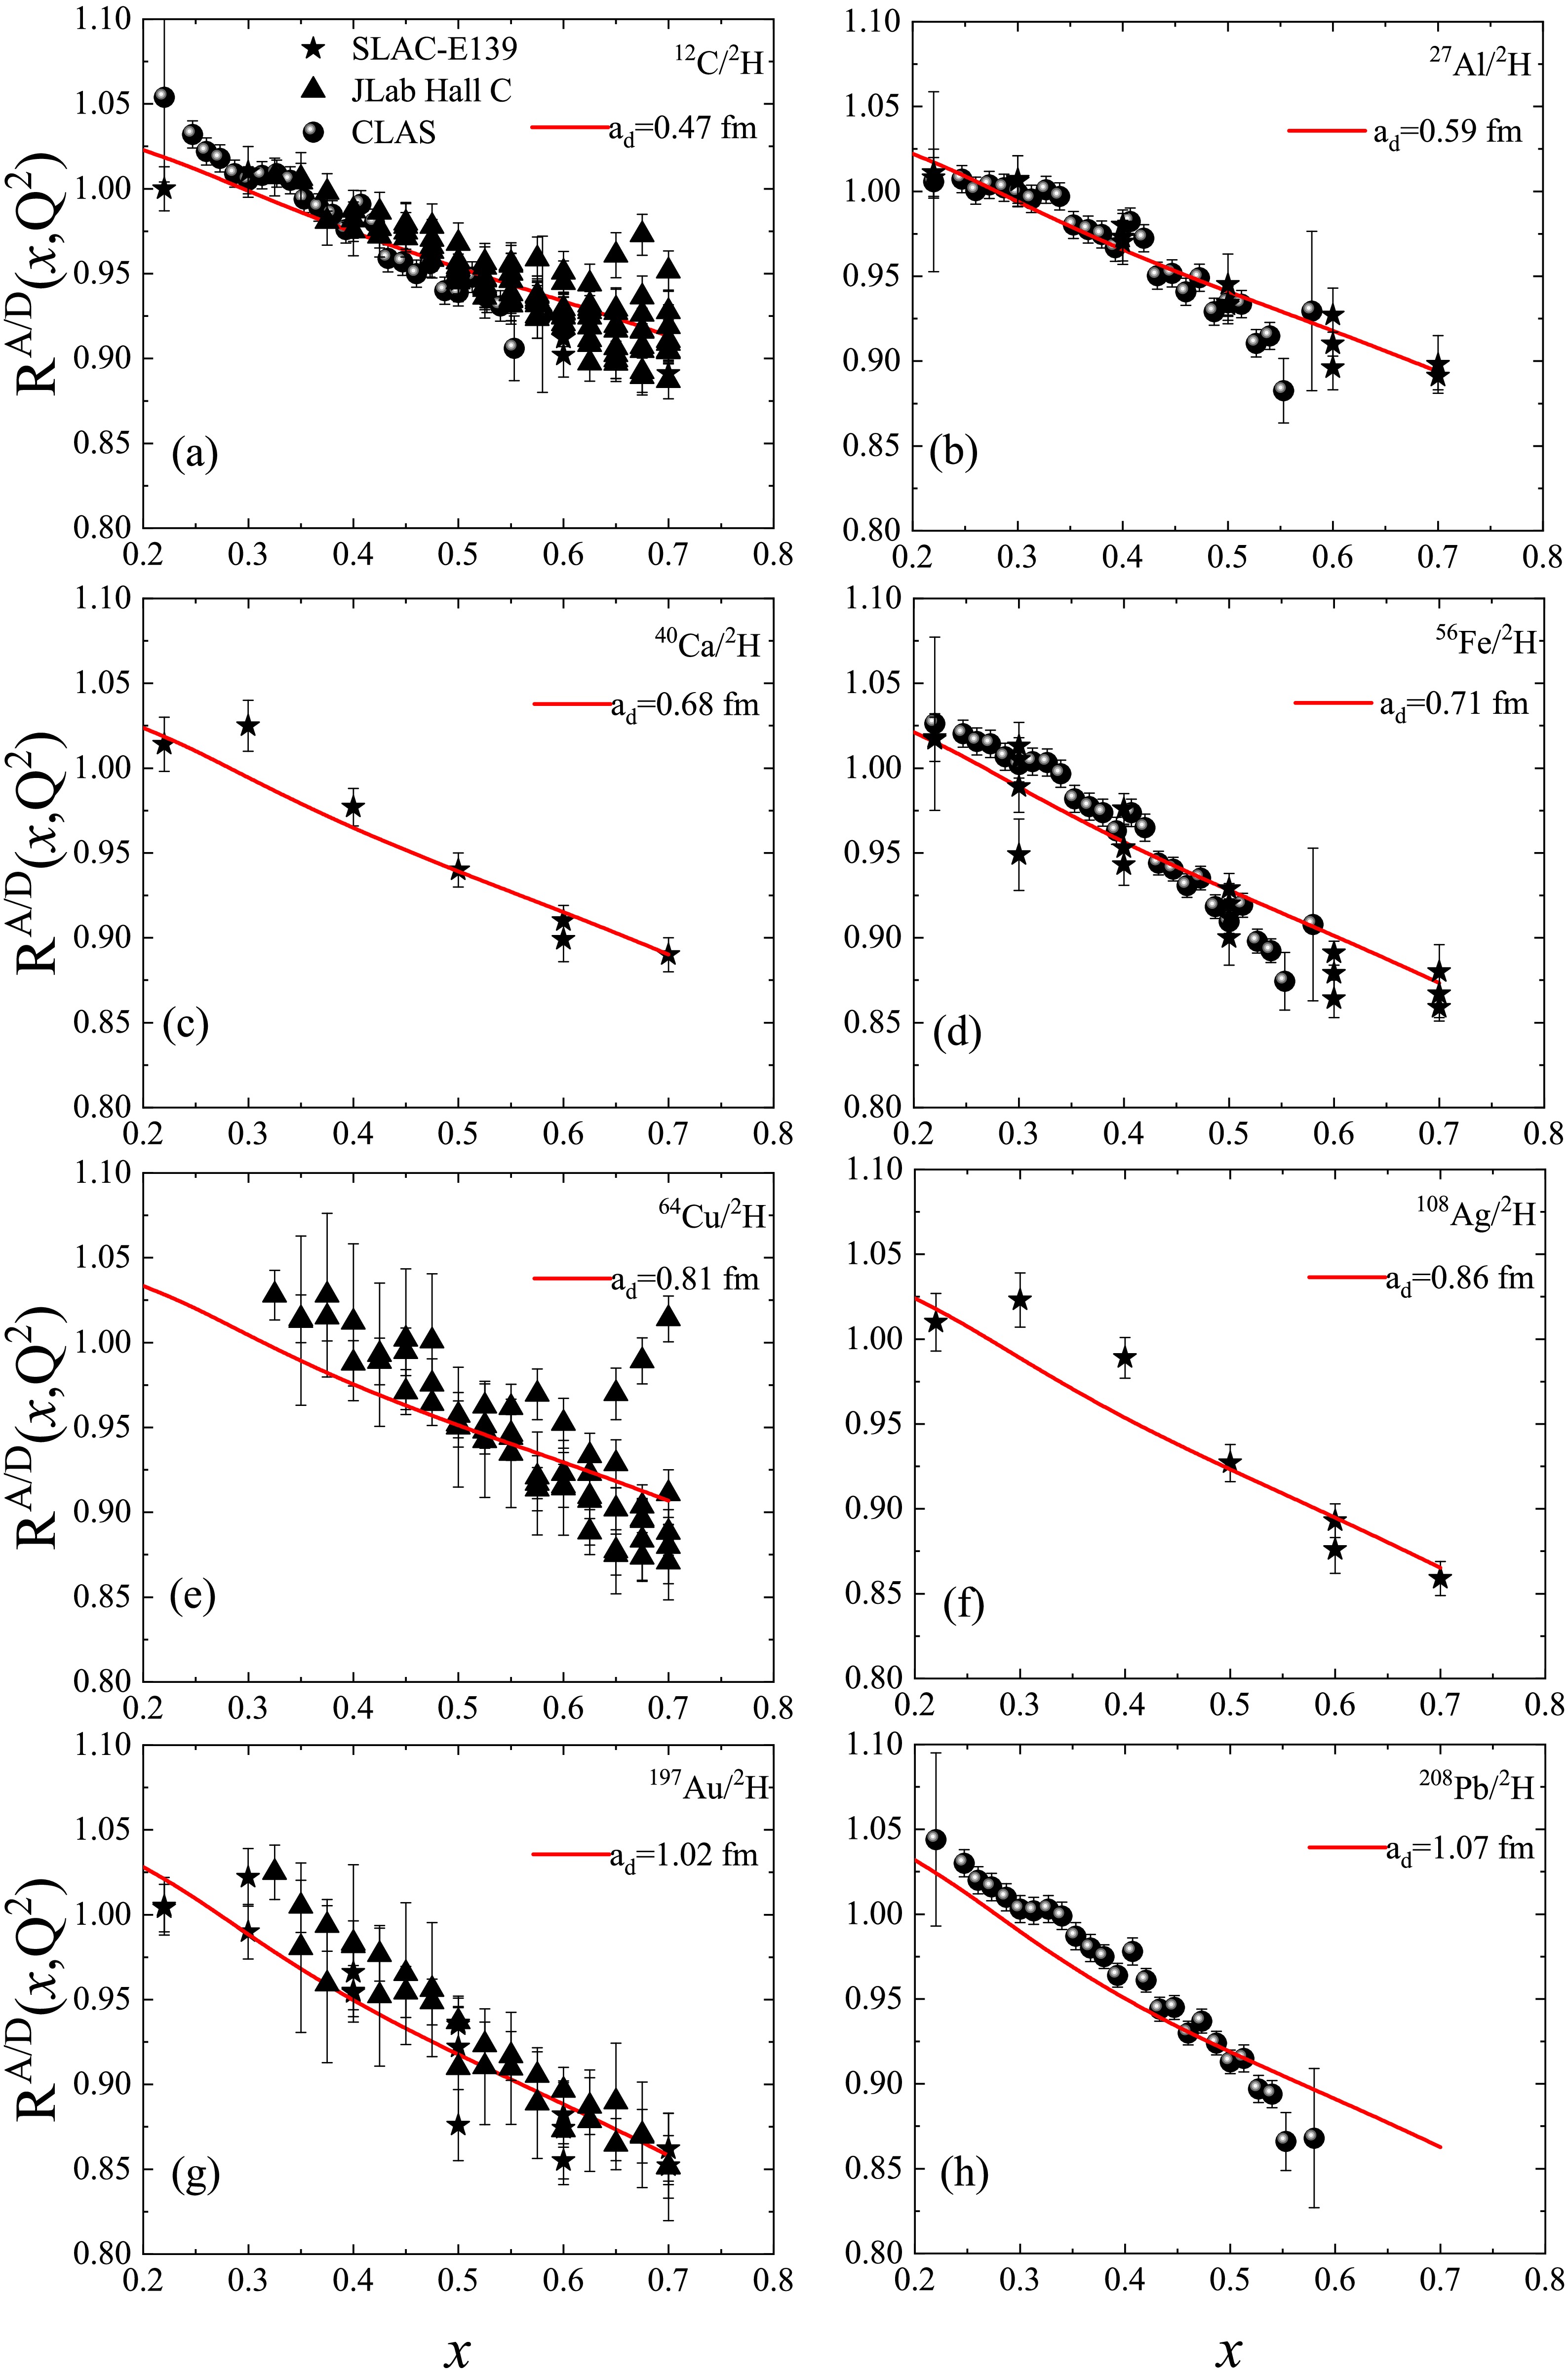
To test the accuracy of
$ E^{{\rm{cal.}}} $ , the experimental binding energy$ E^{{\rm{expt.}}} $ and the relative error Δ% between$ E^{{\rm{cal.}}} $ and$ E^{{\rm{expt.}}} $ are shown in columns 5 and 6, respectively. From the last column of Table 3, we can see that the$ E^{{\rm{cal.}}} $ values for most nuclei are in good agreement with the corresponding$ E^{{\rm{expt.}}} $ values, except for those of 64Cu and 197Au. For 64Cu and 197Au, the calculated binding energies deviate from the experimental values by 24.58% and 12.26%, respectively. This suggests that the simple two-parameter Fermi distribution (Eq. (18)) may be insufficient for these nuclei. Possible reasons include nuclear deformation, especially for 197Au, which is known to be oblate [65], or shell effects near Z=28 and N=28 for 64Cu. Future studies should employ more refined density distributions, such as the three-parameter Fermi distribution or microscopic densities from Hartree-Fock-Bogoliubov or relativistic mean-field calculations [66, 67], to better describe such exotic structures. Meanwhile, the Δ% values in the last column indicate that the obtained$ a_{d} $ values for most nuclei are reasonably reliable. Of course, the accuracy of all$ E^{{\rm{cal.}}} $ values in Table 3 may be further improved by including the above-mentioned additional nuclear medium effects [16, 44, 45, 63, 64].Nowadays, studies of the neutron skin thickness of 208Pb have become an active topic in nuclear physics because it is correlated with the equation of state of nuclear matter, neutron star properties, nucleon-nucleon interactions, heavy-ion collisions, and the structure of exotic nuclei [68−73]. Generally, the thickness of its surface layer is referred to as the neutron skin thickness (
$ \Delta R_{np} $ ). It is typically defined as the difference between the root-mean-square (rms) radii of the neutron and proton density distributions:$ \Delta R_{np}=R_{n}-R_{p} $ , where$ R_{n} $ and$ R_{p} $ are the rms radii of the neutron and proton density distributions, respectively. Since both$ \Delta R_{np} $ and$ a_{d} $ are physical quantities related to the nuclear surface, there must be a certain connection between them.Recently, the
$ \Delta R_{np} $ value of 208Pb was measured to be 0.283±0.071 fm by the parity-violating electron scattering (PREX-II) collaboration [74]. If the Coulomb interaction is neglected, this$ \Delta R_{np} $ value will be larger than 0.283±0.071 fm. Such a thick neutron skin implies that 208Pb has a large diffuseness. From Table 3, one can see that the determined relatively optimal$ a_{d} $ value of 208Pb is as large as 1.07 fm. This suggests that its diffuseness is much greater than previously believed, which is consistent with the measurement of the PREX-II collaboration [74]. Of course, if the experimental$ R^{A/D} $ ($ x, Q^{2} $ ) values and the corresponding -$ dR^{A/D}(x,Q^{2})/dx $ values are reproduced simultaneously within our model by taking into account more nuclear medium effects, the$ a_{d} $ value may be determined more accurately. However, the correlation between the EMC effect and$ \Delta R_{np} $ remains very interesting and should be further explored by researchers in the future. Moreover, although our extracted$ a_{d} $ value for 208Pb is consistent with the thick neutron skin reported by the PREX-II collaboration, there remains a tension with the CREX result for 48Ca, which favors a thinner skin [75]. This discrepancy may reflect the influence of other nuclear medium effects, such as the neutron-proton (n-p) SRC [44, 45, 48, 62, 76−79], or differences in the density dependence of the symmetry energy [70−73].It is worth noting that recent studies have highlighted the important role of n-p SRC in determining nuclear charge radii [48, 62, 76−79]. In other words, the neutron skin thickness may be influenced by the n-p SRC. Although our present model does not explicitly include the n-p SRC, the surface diffuseness effect could be related to the reduced probability of n-p SRC in the low-density surface region. Future extensions of this work may incorporate n-p SRC effects to further constrain the relationship between the EMC effect and neutron skin thickness. In summary, a unified understanding of both the PREX and CREX experimental results remains an open challenge, and our model provides a complementary perspective by linking the EMC effect to neutron skin thickness.
-
Within the double
$ Q^{2} $ -rescaling model and T. D. Lee's soliton bag model, and by taking into account the local nucleon density distribution, the correlation between the rescaling parameters for nuclei with$ A \geq 12 $ and the average nucleon swelling factor has been established. Within the bag model, the average nucleon swelling factors of these nuclei are calculated by continuously varying the diffusion parameter of the nucleon density distribution, and the rescaling parameters are obtained from the established correlation. Next, within the double$ Q^{2} $ -rescaling model, by inputting the rescaling parameters, the dependence of the EMC ratios of nuclei with$ A \geq 12 $ on the diffusion parameter has been studied. Then, using the experimental EMC ratios, the optimal diffusion parameters and the corresponding average nucleon swelling factors of these nuclei are determined. Moreover, to test the validity of our model, the average binding energies of these nuclei are extracted. The obtained results allow us to draw the following conclusions:(i) The calculated slope of the EMC ratio decreases progressively as the diffusion parameter increases, indicating that weaker nuclear surface binding leads to a smaller EMC effect.
(ii) When the calculated EMC ratios best match the experimental data, the corresponding slopes do not agree well with the experimental slopes. Therefore, simply adjusting the diffusion parameter is not sufficient to reproduce the experimental EMC ratios and the corresponding slopes simultaneously, indicating that additional nuclear medium effects should be taken into account.
(iii) The determined diffusion parameter of each nucleus is larger than 0.54 fm, except for that of 12C. In particular, for 208Pb, the diffusion parameter is as large as 1.07 fm. This suggests the existence of a thick neutron skin in 208Pb, which is consistent with the measurement of the PREX collaboration. However, the study of the correlation between the EMC effect and the neutron skin remains an open challenge, and our model provides a complementary perspective by linking the EMC effect to surface diffuseness.
(iv) For most nuclei, the calculated binding energies agree well with the experimental data, except for 64Cu and 197Au, suggesting that these two nuclei may possess exotic structures. This overall agreement indicates that the diffusion parameters adopted for the majority of nuclei are reasonably justified. However, the two-parameter nucleon density distribution appears insufficient to accurately describe the structures of 64Cu and 197Au. Therefore, a more refined nucleon density distribution should be investigated in future studies.
Finally, it is necessary to point out that the EMC effect for nuclei with
$ A<12 $ [16, 80] and the Drell-Yan process [81, 82] have also attracted considerable interest. Therefore, it is necessary to extend our approach to explore the nuclear diffusion effect on the EMC effect in light nuclei and on the Drell-Yan process, which is work in progress. -
This paper is dedicated to the memory of Professor Yonghua Gao and Professor Zhenmin He, who made outstanding contributions to research on the EMC effect. May their academic spirit continue to inspire us. We thank Professor Chungui Duan, Professor Xurong Chen, Professor Rong Wang, Professor Nana Ma, and the anonymous reviewers for their helpful suggestions and comments.
Correlation between diffuseness and EMC effect of nuclei with A≥ 12
- Received Date: 2026-01-30
- Available Online: 2026-08-01
Abstract: Within the double $ Q^{2} $-rescaling model and the T. D. Lee's soliton bag model, by taking into account the local nucleon density distribution, the EMC effect of the nuclei with $ A \geq 12 $ influenced by the nuclear diffuseness is explored. It is shown that the slope of EMC ratio for each nucleus is weakened with the increase of the diffuseness parameter. It implies that the weaker the surface binding in a nucleus, the less pronounced its EMC effect. Furthermore, we find that it is not enough to only adjust the diffusion parameter to reproduce the experimental EMC ratios and the corresponding slopes simultaneously, which indicates that other nuclear medium effects should be taken into account. Then, with the experimental EMC ratios, the relatively optimal diffusion parameter of each nucleus is determined. It is found that the determined diffusion parameter of each nucleus is larger than the commonly used value (0.54 fm) except for 12C. To test the accuracy of the determined diffusion parameters of these nuclei, the corresponding average binding energies are extracted. We find that the extracted binding energies of most nuclei are in good agreement with the corresponding experimental data. Finally, the correlation between the EMC effect of 208Pb and its neutron skin thickness is discussed briefly.


 DownLoad: