


 Abstract
 HTML
HTML Reference
 Related
 PDF
PDF


-
Gamma-Ray Bursts (GRBs) are among the most energetic transient phenomena in the Universe, characterized by an enormous release of gamma-ray energy over very short timescales, typically ranging from milliseconds to several hundred seconds [1]. Based on their duration and spectral hardness, GRBs are conventionally divided into two subclasses: long bursts (
$ T_{90} \gt $ 2 s) and short bursts ($ T_{90} \lt $ 2 s) [2]. The former are generally associated with the core collapse of massive stars and the ensuing supernovae [3, 4], whereas the latter are believed to originate from the mergers of compact binaries, such as neutron star-neutron star or neutron star-black hole systems [5, 6]. Owing to their extreme energetics and cosmological distances, GRBs serve not only as laboratories for studying relativistic astrophysical processes but also as valuable probes of the early Universe, star formation history, and the origin of the heavy elements [7].The intrinsic GRB population is defined by the true distributions of physical parameters in the cosmological rest frame, including burst rate, luminosity and energy functions, duration, spectral properties, and their possible redshift evolution. However, observed GRB samples are strongly shaped by observational biases, most notably instrumental selection effects—such as limited energy bandpass, energy-dependent effective area, off-axis response, background noise, and trigger algorithms [8−11]. As a result, the observed distributions of luminosity, duration, and spectral parameters cannot be directly interpreted as intrinsic population properties [8, 10].
A variety of approaches have been developed to mitigate these biases. Threshold-inversion methods infer luminosity functions and cosmic GRB rates by assuming empirical detection efficiencies [12, 13]. Forward-modeling studies simulate intrinsic GRB populations and propagate them through simplified instrumental response models to reproduce observed samples [14, 15]. Statistical techniques such as the Efron-Petrosian method address data truncation and remove spurious luminosity-redshift correlations [16, 17], while flux-complete subsamples reduce selection effects at the expense of sample size. Despite these efforts, existing methods often rely on simplified sensitivity models, neglect multi-parameter correlations, or suffer from limited statistical power.
In this study, we develop a forward-modeling framework based on the Swift/BAT long-GRB observational sample [8]. By simulating in detail the detector's response function and trigger criteria [11, 18], we generate a mock observed sample. Through systematic comparisons between the simulated and observed data [15, 19], we aim to more precisely constrain the intrinsic properties of the GRB population and quantitatively assess the impact of observational selection effects on their observed distributions.
-
Gamma-Ray Bursts (GRBs) are among the most energetic transient phenomena in the Universe, characterized by an enormous release of gamma-ray energy over very short timescales, typically ranging from milliseconds to several hundred seconds [1]. Based on their duration and spectral hardness, GRBs are conventionally divided into two subclasses: long bursts (
$ T_{90} \gt $ 2 s) and short bursts ($ T_{90} \lt $ 2 s) [2]. The former are generally associated with the core collapse of massive stars and the ensuing supernovae [3, 4], whereas the latter are believed to originate from the mergers of compact binaries, such as neutron star-neutron star or neutron star-black hole systems [5, 6]. Owing to their extreme energetics and cosmological distances, GRBs serve not only as laboratories for studying relativistic astrophysical processes but also as valuable probes of the early Universe, star formation history, and the origin of the heavy elements [7].The intrinsic GRB population is defined by the true distributions of physical parameters in the cosmological rest frame, including burst rate, luminosity and energy functions, duration, spectral properties, and their possible redshift evolution. However, observed GRB samples are strongly shaped by observational biases, most notably instrumental selection effects—such as limited energy bandpass, energy-dependent effective area, off-axis response, background noise, and trigger algorithms [8−11]. As a result, the observed distributions of luminosity, duration, and spectral parameters cannot be directly interpreted as intrinsic population properties [8, 10].
A variety of approaches have been developed to mitigate these biases. Threshold-inversion methods infer luminosity functions and cosmic GRB rates by assuming empirical detection efficiencies [12, 13]. Forward-modeling studies simulate intrinsic GRB populations and propagate them through simplified instrumental response models to reproduce observed samples [14, 15]. Statistical techniques such as the Efron-Petrosian method address data truncation and remove spurious luminosity-redshift correlations [16, 17], while flux-complete subsamples reduce selection effects at the expense of sample size. Despite these efforts, existing methods often rely on simplified sensitivity models, neglect multi-parameter correlations, or suffer from limited statistical power.
In this study, we develop a forward-modeling framework based on the Swift/BAT long-GRB observational sample [8]. By simulating in detail the detector's response function and trigger criteria [11, 18], we generate a mock observed sample. Through systematic comparisons between the simulated and observed data [15, 19], we aim to more precisely constrain the intrinsic properties of the GRB population and quantitatively assess the impact of observational selection effects on their observed distributions.
-
Gamma-Ray Bursts (GRBs) are among the most energetic transient phenomena in the Universe, characterized by an enormous release of gamma-ray energy over very short timescales, typically ranging from milliseconds to several hundred seconds [1]. Based on their duration and spectral hardness, GRBs are conventionally divided into two subclasses: long bursts (
$ T_{90} \gt $ 2 s) and short bursts ($ T_{90} \lt $ 2 s) [2]. The former are generally associated with the core collapse of massive stars and the ensuing supernovae [3, 4], whereas the latter are believed to originate from the mergers of compact binaries, such as neutron star-neutron star or neutron star-black hole systems [5, 6]. Owing to their extreme energetics and cosmological distances, GRBs serve not only as laboratories for studying relativistic astrophysical processes but also as valuable probes of the early Universe, star formation history, and the origin of the heavy elements [7].The intrinsic GRB population is defined by the true distributions of physical parameters in the cosmological rest frame, including burst rate, luminosity and energy functions, duration, spectral properties, and their possible redshift evolution. However, observed GRB samples are strongly shaped by observational biases, most notably instrumental selection effects—such as limited energy bandpass, energy-dependent effective area, off-axis response, background noise, and trigger algorithms [8−11]. As a result, the observed distributions of luminosity, duration, and spectral parameters cannot be directly interpreted as intrinsic population properties [8, 10].
A variety of approaches have been developed to mitigate these biases. Threshold-inversion methods infer luminosity functions and cosmic GRB rates by assuming empirical detection efficiencies [12, 13]. Forward-modeling studies simulate intrinsic GRB populations and propagate them through simplified instrumental response models to reproduce observed samples [14, 15]. Statistical techniques such as the Efron-Petrosian method address data truncation and remove spurious luminosity-redshift correlations [16, 17], while flux-complete subsamples reduce selection effects at the expense of sample size. Despite these efforts, existing methods often rely on simplified sensitivity models, neglect multi-parameter correlations, or suffer from limited statistical power.
In this study, we develop a forward-modeling framework based on the Swift/BAT long-GRB observational sample [8]. By simulating in detail the detector's response function and trigger criteria [11, 18], we generate a mock observed sample. Through systematic comparisons between the simulated and observed data [15, 19], we aim to more precisely constrain the intrinsic properties of the GRB population and quantitatively assess the impact of observational selection effects on their observed distributions.
-
Gamma-Ray Bursts (GRBs) are among the most energetic transient phenomena in the Universe, characterized by an enormous release of gamma-ray energy over very short timescales, typically ranging from milliseconds to several hundred seconds [1]. Based on their duration and spectral hardness, GRBs are conventionally divided into two subclasses: long bursts (
$ T_{90} \gt $ 2 s) and short bursts ($ T_{90} \lt $ 2 s) [2]. The former are generally associated with the core collapse of massive stars and the ensuing supernovae [3, 4], whereas the latter are believed to originate from the mergers of compact binaries, such as neutron star-neutron star or neutron star-black hole systems [5, 6]. Owing to their extreme energetics and cosmological distances, GRBs serve not only as laboratories for studying relativistic astrophysical processes but also as valuable probes of the early Universe, star formation history, and the origin of the heavy elements [7].The intrinsic GRB population is defined by the true distributions of physical parameters in the cosmological rest frame, including burst rate, luminosity and energy functions, duration, spectral properties, and their possible redshift evolution. However, observed GRB samples are strongly shaped by observational biases, most notably instrumental selection effects—such as limited energy bandpass, energy-dependent effective area, off-axis response, background noise, and trigger algorithms [8−11]. As a result, the observed distributions of luminosity, duration, and spectral parameters cannot be directly interpreted as intrinsic population properties [8, 10].
A variety of approaches have been developed to mitigate these biases. Threshold-inversion methods infer luminosity functions and cosmic GRB rates by assuming empirical detection efficiencies [12, 13]. Forward-modeling studies simulate intrinsic GRB populations and propagate them through simplified instrumental response models to reproduce observed samples [14, 15]. Statistical techniques such as the Efron-Petrosian method address data truncation and remove spurious luminosity-redshift correlations [16, 17], while flux-complete subsamples reduce selection effects at the expense of sample size. Despite these efforts, existing methods often rely on simplified sensitivity models, neglect multi-parameter correlations, or suffer from limited statistical power.
In this study, we develop a forward-modeling framework based on the Swift/BAT long-GRB observational sample [8]. By simulating in detail the detector's response function and trigger criteria [11, 18], we generate a mock observed sample. Through systematic comparisons between the simulated and observed data [15, 19], we aim to more precisely constrain the intrinsic properties of the GRB population and quantitatively assess the impact of observational selection effects on their observed distributions.
-
In this study, we developed a simulation framework named GodEyes to generate synthetic samples of GRBs [20, 21] and to model the instrumental response of the Swift/BAT detector. This section describes the overall simulation procedure, including GRB population synthesis, Swift/BAT response modeling, and the trigger selection process.
-
In this study, we developed a simulation framework named GodEyes to generate synthetic samples of GRBs [20, 21] and to model the instrumental response of the Swift/BAT detector. This section describes the overall simulation procedure, including GRB population synthesis, Swift/BAT response modeling, and the trigger selection process.
-
In this study, we developed a simulation framework named GodEyes to generate synthetic samples of GRBs [20, 21] and to model the instrumental response of the Swift/BAT detector. This section describes the overall simulation procedure, including GRB population synthesis, Swift/BAT response modeling, and the trigger selection process.
-
In this study, we developed a simulation framework named GodEyes to generate synthetic samples of GRBs [20, 21] and to model the instrumental response of the Swift/BAT detector. This section describes the overall simulation procedure, including GRB population synthesis, Swift/BAT response modeling, and the trigger selection process.
-
To explore the intrinsic distributions of GRB parameters and ensure consistency with Swift observations, a physically motivated, statistically representative sample of GRBs was constructed using Monte Carlo methods. The simulation incorporates prior information on the cosmic GRB formation rate, the luminosity function, and the distributions of spectral parameters.
-
To explore the intrinsic distributions of GRB parameters and ensure consistency with Swift observations, a physically motivated, statistically representative sample of GRBs was constructed using Monte Carlo methods. The simulation incorporates prior information on the cosmic GRB formation rate, the luminosity function, and the distributions of spectral parameters.
-
To explore the intrinsic distributions of GRB parameters and ensure consistency with Swift observations, a physically motivated, statistically representative sample of GRBs was constructed using Monte Carlo methods. The simulation incorporates prior information on the cosmic GRB formation rate, the luminosity function, and the distributions of spectral parameters.
-
To explore the intrinsic distributions of GRB parameters and ensure consistency with Swift observations, a physically motivated, statistically representative sample of GRBs was constructed using Monte Carlo methods. The simulation incorporates prior information on the cosmic GRB formation rate, the luminosity function, and the distributions of spectral parameters.
-
The spatial distribution of GRBs reflects their cosmological origins and evolutionary history. The observed event rate depends not only on the intrinsic GRB formation rate but also on cosmological expansion, comoving volume effects, and the detector's sensitivity threshold. The observed GRB rate per unit time within a redshift interval
$ [z,z+dz] $ and a luminosity interval$ [L,L+dL] $ can be expressed as [22]:$ \frac{d^3N}{dtdzdL} = \frac{\Delta\Omega}{4\pi} \frac{\Psi(z)}{1+z} \frac{dV(z)}{dz} \phi(L), $
(1) where
$ \Delta\Omega = 1.4\,\mathrm{sr} $ is the field of view of Swift/BAT,$ \Psi(z) $ denotes the comoving GRB formation rate (in units of Mpc−3 yr−1), which is usually assumed to trace the cosmic star formation rate, and$ (1+z)^{-1} $ accounts for cosmological time dilation.$ \phi(L) $ is the normalized luminosity function, and$ \dfrac{dV(z)}{dz} $ is the comoving volume element:$ \frac{dV(z)}{dz} = \frac{4 \pi c D_L^2(z)}{(1+z)^2 H(z)}, $
(2) where
$ D_L(z) $ denotes the luminosity distance and$ H(z) = H_0 \sqrt{\Omega_m (1+z)^3 + \Omega_\Lambda} $ . We adopt the cosmological parameters$ H_0 = 72\; \mathrm{km}\; \mathrm{s}^{-1}\; \mathrm{Mpc}^{-1} $ ,$ \Omega_m = 0.3 $ , and$ \Omega_\Lambda = 0.7 $ [23].The GRB formation rate
$ \Psi(z) $ follows the empirical broken power-law derived by Wanderman and Piran [12] from the redshift distribution of long GRBs:$ \Psi(z) \propto \begin{cases} (1+z)^{n_1}, & z \leqslant z_c,\\ (1+z_c)^{n_1-n_2} (1+z)^{n_2}, & z \gt z_c, \end{cases} $
(3) with
$ z_c = 3.3 $ ,$ n_1 = 1.9 $ , and$ n_2 = -0.4 $ . These values are slightly adjusted from the original fit by Wanderman et al. to better reproduce the redshift distribution of Swift/BAT long GRBs predicted by our simulation framework.We model the luminosity function
$ \phi(L_{\text{p}}) $ for the GRB peak luminosity$ L_{\text{p}} $ as a three-segment broken power law [14, 24]:$ \phi(L_{p}) = \frac{A}{L_{p}} \times \begin{cases} (L_{p}/L_{c1})^{a}, & L_{p} \lt L_{c1},\\ (L_{p}/L_{c1})^{b}, & L_{c1} \leqslant L_{p} \lt L_{c2},\\ (L_{c2}/L_{c1})^{b} (L_{p}/L_{c2})^{c}, & L_{p} \geqslant L_{c2}, \end{cases} $
(4) where A is the normalization constant;
$ L_{c1} = 10^{51} \text{ erg s}^{-1} $ and$ L_{c2} = 10^{52.5} \text{ erg s}^{-1} $ are the break luminosities; and$ a = -1.0 $ ,$ b = -0.5 $ , and$ c = -1.65 $ are the power-law indices for the respective segments. -
The spatial distribution of GRBs reflects their cosmological origins and evolutionary history. The observed event rate depends not only on the intrinsic GRB formation rate but also on cosmological expansion, comoving volume effects, and the detector's sensitivity threshold. The observed GRB rate per unit time within a redshift interval
$ [z,z+{\rm d}z] $ and a luminosity interval$ [L,L+{\rm d}L] $ can be expressed as [22]:$ \frac{{\rm d}^3N}{{\rm d}t{\rm d}z{\rm d}L} = \frac{\Delta\Omega}{4\pi} \frac{\Psi(z)}{1+z} \frac{{\rm d}V(z)}{{\rm d}z} \phi(L), $
(1) where
$ \Delta\Omega = 1.4\,\mathrm{sr} $ is the field of view of Swift/BAT,$ \Psi(z) $ denotes the comoving GRB formation rate (in units of Mpc−3 yr−1), which is usually assumed to trace the cosmic star formation rate, and$ (1+z)^{-1} $ accounts for cosmological time dilation.$ \phi(L) $ is the normalized luminosity function, and$\dfrac{{\rm d}V(z)}{{\rm d}z}$ is the comoving volume element:$ \frac{{\rm d}V(z)}{{\rm d}z} = \frac{4 \pi c D_L^2(z)}{(1+z)^2 H(z)}, $
(2) where
$ D_L(z) $ denotes the luminosity distance and$ H(z) = H_0 \sqrt{\Omega_{\rm m} (1+z)^3 + \Omega_\Lambda} $ . We adopt the cosmological parameters$ H_0 = 72\; \mathrm{km}\; \mathrm{s}^{-1}\; \mathrm{Mpc}^{-1} $ ,$ \Omega_{\rm m} = 0.3 $ , and$ \Omega_\Lambda = 0.7 $ [23].The GRB formation rate
$ \Psi(z) $ follows the empirical broken power-law derived by Wanderman and Piran [12] from the redshift distribution of long GRBs:$ \Psi(z) \propto \begin{cases} (1+z)^{n_1}, & z \leqslant z_c,\\ (1+z_c)^{n_1-n_2} (1+z)^{n_2}, & z \gt z_c, \end{cases} $
(3) with
$ z_c = 3.3 $ ,$ n_1 = 1.9 $ , and$ n_2 = -0.4 $ . These values are slightly adjusted from the original fit by Wanderman et al. to better reproduce the redshift distribution of Swift/BAT long GRBs predicted by our simulation framework.We model the luminosity function
$ \phi(L_{\text{p}}) $ for the GRB peak luminosity$ L_{\text{p}} $ as a three-segment broken power law [14, 24]:$ \phi(L_{p}) = \frac{A}{L_{p}} \times \begin{cases} (L_{p}/L_{c1})^{a}, & L_{p} \lt L_{c1},\\ (L_{p}/L_{c1})^{b}, & L_{c1} \leqslant L_{p} \lt L_{c2},\\ (L_{c2}/L_{c1})^{b} (L_{p}/L_{c2})^{c}, & L_{p} \geqslant L_{c2}, \end{cases} $
(4) where A is the normalization constant;
$ L_{c1} = 10^{51} \text{ erg s}^{-1} $ and$ L_{c2} = 10^{52.5} \text{ erg s}^{-1} $ are the break luminosities; and$ a = -1.0 $ ,$ b = -0.5 $ , and$ c = -1.65 $ are the power-law indices for the respective segments. -
The spatial distribution of GRBs reflects their cosmological origins and evolutionary history. The observed event rate depends not only on the intrinsic GRB formation rate but also on cosmological expansion, comoving volume effects, and the detector's sensitivity threshold. The observed GRB rate per unit time within a redshift interval
$ [z,z+{\rm d}z] $ and a luminosity interval$ [L,L+{\rm d}L] $ can be expressed as [22]:$ \frac{{\rm d}^3N}{{\rm d}t{\rm d}z{\rm d}L} = \frac{\Delta\Omega}{4\pi} \frac{\Psi(z)}{1+z} \frac{{\rm d}V(z)}{{\rm d}z} \phi(L), $
(1) where
$ \Delta\Omega = 1.4\,\mathrm{sr} $ is the field of view of Swift/BAT,$ \Psi(z) $ denotes the comoving GRB formation rate (in units of Mpc−3 yr−1), which is usually assumed to trace the cosmic star formation rate, and$ (1+z)^{-1} $ accounts for cosmological time dilation.$ \phi(L) $ is the normalized luminosity function, and$\dfrac{{\rm d}V(z)}{{\rm d}z}$ is the comoving volume element:$ \frac{{\rm d}V(z)}{{\rm d}z} = \frac{4 \pi c D_L^2(z)}{(1+z)^2 H(z)}, $
(2) where
$ D_L(z) $ denotes the luminosity distance and$ H(z) = H_0 \sqrt{\Omega_{\rm m} (1+z)^3 + \Omega_\Lambda} $ . We adopt the cosmological parameters$ H_0 = 72\; \mathrm{km}\; \mathrm{s}^{-1}\; \mathrm{Mpc}^{-1} $ ,$ \Omega_{\rm m} = 0.3 $ , and$ \Omega_\Lambda = 0.7 $ [23].The GRB formation rate
$ \Psi(z) $ follows the empirical broken power-law derived by Wanderman and Piran [12] from the redshift distribution of long GRBs:$ \Psi(z) \propto \begin{cases} (1+z)^{n_1}, & z \leqslant z_c,\\ (1+z_c)^{n_1-n_2} (1+z)^{n_2}, & z \gt z_c, \end{cases} $
(3) with
$ z_c = 3.3 $ ,$ n_1 = 1.9 $ , and$ n_2 = -0.4 $ . These values are slightly adjusted from the original fit by Wanderman et al. to better reproduce the redshift distribution of Swift/BAT long GRBs predicted by our simulation framework.We model the luminosity function
$ \phi(L_{\text{p}}) $ for the GRB peak luminosity$ L_{\text{p}} $ as a three-segment broken power law [14, 24]:$ \phi(L_{p}) = \frac{A}{L_{p}} \times \begin{cases} (L_{p}/L_{c1})^{a}, & L_{p} \lt L_{c1},\\ (L_{p}/L_{c1})^{b}, & L_{c1} \leqslant L_{p} \lt L_{c2},\\ (L_{c2}/L_{c1})^{b} (L_{p}/L_{c2})^{c}, & L_{p} \geqslant L_{c2}, \end{cases} $
(4) where A is the normalization constant;
$ L_{c1} = 10^{51} \text{ erg s}^{-1} $ and$ L_{c2} = 10^{52.5} \text{ erg s}^{-1} $ are the break luminosities; and$ a = -1.0 $ ,$ b = -0.5 $ , and$ c = -1.65 $ are the power-law indices for the respective segments. -
The spatial distribution of GRBs reflects their cosmological origins and evolutionary history. The observed event rate depends not only on the intrinsic GRB formation rate but also on cosmological expansion, comoving volume effects, and the detector's sensitivity threshold. The observed GRB rate per unit time within a redshift interval
$ [z,z+{\rm d}z] $ and a luminosity interval$ [L,L+{\rm d}L] $ can be expressed as [22]:$ \frac{{\rm d}^3N}{{\rm d}t{\rm d}z{\rm d}L} = \frac{\Delta\Omega}{4\pi} \frac{\Psi(z)}{1+z} \frac{{\rm d}V(z)}{{\rm d}z} \phi(L), $
(1) where
$ \Delta\Omega = 1.4\,\mathrm{sr} $ is the field of view of Swift/BAT,$ \Psi(z) $ denotes the comoving GRB formation rate (in units of Mpc−3 yr−1), which is usually assumed to trace the cosmic star formation rate, and$ (1+z)^{-1} $ accounts for cosmological time dilation.$ \phi(L) $ is the normalized luminosity function, and$\dfrac{{\rm d}V(z)}{{\rm d}z}$ is the comoving volume element:$ \frac{{\rm d}V(z)}{{\rm d}z} = \frac{4 \pi c D_L^2(z)}{(1+z)^2 H(z)}, $
(2) where
$ D_L(z) $ denotes the luminosity distance and$ H(z) = H_0 \sqrt{\Omega_{\rm m} (1+z)^3 + \Omega_\Lambda} $ . We adopt the cosmological parameters$ H_0 = 72\; \mathrm{km}\; \mathrm{s}^{-1}\; \mathrm{Mpc}^{-1} $ ,$ \Omega_{\rm m} = 0.3 $ , and$ \Omega_\Lambda = 0.7 $ [23].The GRB formation rate
$ \Psi(z) $ follows the empirical broken power-law derived by Wanderman and Piran [12] from the redshift distribution of long GRBs:$ \Psi(z) \propto \begin{cases} (1+z)^{n_1}, & z \leqslant z_c,\\ (1+z_c)^{n_1-n_2} (1+z)^{n_2}, & z \gt z_c, \end{cases} $
(3) with
$ z_c = 3.3 $ ,$ n_1 = 1.9 $ , and$ n_2 = -0.4 $ . These values are slightly adjusted from the original fit by Wanderman et al. to better reproduce the redshift distribution of Swift/BAT long GRBs predicted by our simulation framework.We model the luminosity function
$ \phi(L_{\text{p}}) $ for the GRB peak luminosity$ L_{\text{p}} $ as a three-segment broken power law [14, 24]:$ \phi(L_{p}) = \frac{A}{L_{p}} \times \begin{cases} (L_{p}/L_{c1})^{a}, & L_{p} \lt L_{c1},\\ (L_{p}/L_{c1})^{b}, & L_{c1} \leqslant L_{p} \lt L_{c2},\\ (L_{c2}/L_{c1})^{b} (L_{p}/L_{c2})^{c}, & L_{p} \geqslant L_{c2}, \end{cases} $
(4) where A is the normalization constant;
$ L_{c1} = 10^{51} \text{ erg s}^{-1} $ and$ L_{c2} = 10^{52.5} \text{ erg s}^{-1} $ are the break luminosities; and$ a = -1.0 $ ,$ b = -0.5 $ , and$ c = -1.65 $ are the power-law indices for the respective segments. -
The burst duration,
$ T_{90} $ , is defined as the time interval over which the cumulative photon count increases from 5% to 95% of the total. It can be expressed as:$ T_{90} = (1+z)\frac{E_{\rm{iso}}}{L_{\rm{ave}}}, $
(5) where
$ L_{\rm{ave}} $ is the average isotropic luminosity, i.e., the time-averaged power over$ T_{90} $ . Following previous studies,$ L_{\rm{ave}} = 0.31 L_{\rm{p}} $ [25]. The isotropic energy$E_{\mathrm{iso}}$ is obtained from the empirical$E_{\mathrm{iso}}-L_{\mathrm{p}}$ correlation. In this work, we adopt the following relation derived from the long-GRB sample [25−27]:$ \log_{10}(E_{\rm{iso}}) = 1.1 \cdot \log_{10}(L_{\rm{p}}) + 0.56, $
(6) where
$E_{\mathrm{iso}}$ has units of erg and$L_{\mathrm{p}}$ has units of erg s−1. This relation is consistent with previous studies and directly links the peak luminosity to the total energy release. -
The burst duration,
$ T_{90} $ , is defined as the time interval over which the cumulative photon count increases from 5% to 95% of the total. It can be expressed as:$ T_{90} = (1+z)\frac{E_{\rm{iso}}}{L_{\rm{ave}}}, $
(5) where
$ L_{\rm{ave}} $ is the average isotropic luminosity, i.e., the time-averaged power over$ T_{90} $ . Following previous studies,$ L_{\rm{ave}} = 0.31 L_{\rm{p}} $ [25]. The isotropic energy$E_{\mathrm{iso}}$ is obtained from the empirical$E_{\mathrm{iso}}-L_{\mathrm{p}}$ correlation. In this work, we adopt the following relation derived from the long-GRB sample [25−27]:$ \log_{10}(E_{\rm{iso}}) = 1.1 \cdot \log_{10}(L_{\rm{p}}) + 0.56, $
(6) where
$E_{\mathrm{iso}}$ has units of erg and$L_{\mathrm{p}}$ has units of erg s−1. This relation is consistent with previous studies and directly links the peak luminosity to the total energy release. -
The burst duration,
$ T_{90} $ , is defined as the time interval over which the cumulative photon count increases from 5% to 95% of the total. It can be expressed as:$ T_{90} = (1+z)\frac{E_{\rm{iso}}}{L_{\rm{ave}}}, $
(5) where
$ L_{\rm{ave}} $ is the average isotropic luminosity, i.e., the time-averaged power over$ T_{90} $ . Following previous studies,$ L_{\rm{ave}} = 0.31 L_{\rm{p}} $ [25]. The isotropic energy$E_{\mathrm{iso}}$ is obtained from the empirical$E_{\mathrm{iso}}-L_{\mathrm{p}}$ correlation. In this work, we adopt the following relation derived from the long-GRB sample [25−27]:$ \log_{10}(E_{\rm{iso}}) = 1.1 \cdot \log_{10}(L_{\rm{p}}) + 0.56, $
(6) where
$E_{\mathrm{iso}}$ has units of erg and$L_{\mathrm{p}}$ has units of erg s−1. This relation is consistent with previous studies and directly links the peak luminosity to the total energy release. -
The burst duration,
$ T_{90} $ , is defined as the time interval over which the cumulative photon count increases from 5% to 95% of the total. It can be expressed as:$ T_{90} = (1+z)\frac{E_{\rm{iso}}}{L_{\rm{ave}}}, $
(5) where
$ L_{\rm{ave}} $ is the average isotropic luminosity, i.e., the time-averaged power over$ T_{90} $ . Following previous studies,$ L_{\rm{ave}} = 0.31 L_{\rm{p}} $ [25]. The isotropic energy$E_{\mathrm{iso}}$ is obtained from the empirical$E_{\mathrm{iso}}-L_{\mathrm{p}}$ correlation. In this work, we adopt the following relation derived from the long-GRB sample [25−27]:$ \log_{10}(E_{\rm{iso}}) = 1.1 \cdot \log_{10}(L_{\rm{p}}) + 0.56, $
(6) where
$E_{\mathrm{iso}}$ has units of erg and$L_{\mathrm{p}}$ has units of erg s−1. This relation is consistent with previous studies and directly links the peak luminosity to the total energy release. -
Observationally, most GRB spectra exhibit a characteristic peak energy that corresponds to a spectral break. Within the Swift/BAT energy range (15–150 keV), GRB photon spectra are typically well described by either a power-law (PL) or a cutoff power-law (CPL) model [8]. In this work, we focus on the PL representation, given by
$ N(E) = J_0 \left(\frac{E}{50\; {\rm{keV}}}\right)^{\alpha^{\rm{PL}}}, $
(7) where
$ \alpha^{\rm{PL}} $ is the photon index and$ J_0 $ is the normalization at 50 keV, with units of$ {\rm{ ph}}\; {\rm{cm}}^{-2}\; {\rm{s}}^{-1}\; {\rm{keV}}^{-1} $ .In our simulation, the spectral parameters are generated as follows. The photon index
$\alpha^{\mathrm{PL}}$ is sampled from a Gaussian distribution with mean$\mu_{\alpha} = -1.55$ and standard deviation$\sigma_{\alpha} = 0.4$ , which approximates the intrinsic distribution inferred from observational studies [9]. The normalization constant$J_0$ is then determined from the intrinsic energetics of each burst. For a burst with redshift z, photon index$ \alpha^{\rm{PL}} $ , and average isotropic luminosity$ L_{\rm{ave}} $ , we compute$ J_0 $ by inverting the standard cosmological relation [7]:$ L_{\rm{ave}} = 4\pi D_L^2 \cdot k \cdot F_\gamma, $
(8) where k is the k-correction factor, defined as
$ k \equiv \frac{\displaystyle\int_{1/(1+z)}^{10^4/(1+z)} E N(E) {\rm d}E}{\displaystyle\int_{e_1}^{e_2} E N(E) {\rm d}E}, $
(9) where E is measured in keV.
$F_\gamma = \int_{e_1}^{e_2} E N(E) \, {\rm d}E$ is the observed energy flux in the BAT band, and$ e_1 $ and$ e_2 $ denote the detector's energy band limits (for Swift/BAT,$ e_1 = 15 $ keV and$ e_2 = 150 $ keV).$D_L$ is the luminosity distance. A similar approach has been adopted in previous studies [7, 20].In this study, we selected a subset of gamma-ray bursts (GRBs) with measured redshifts and best-fit power-law spectra to serve as the comparison sample for our simulations. The parameters of these GRBs were obtained from the Swift/BAT online catalog as of August 2025 [8, 28]. For each burst, this catalog provides the duration
$ T_{90} $ , redshift z, fluence, peak flux, and the spectral parameters ($ \alpha^{\mathrm{PL}} $ ,$ J_0 $ ), along with their uncertainties. The isotropic peak luminosity$ L_{\text{p}} $ and isotropic energy$ E_{\text{iso}} $ were then computed from these observables assuming a standard ΛCDM cosmology. -
Observationally, most GRB spectra exhibit a characteristic peak energy that corresponds to a spectral break. Within the Swift/BAT energy range (15–150 keV), GRB photon spectra are typically well described by either a power-law (PL) or a cutoff power-law (CPL) model [8]. In this work, we focus on the PL representation, given by
$ N(E) = J_0 \left(\frac{E}{50\; {\rm{keV}}}\right)^{\alpha^{\rm{PL}}}, $
(7) where
$ \alpha^{\rm{PL}} $ is the photon index and$ J_0 $ is the normalization at 50 keV, with units of$ {\rm{ ph}}\; {\rm{cm}}^{-2}\; {\rm{s}}^{-1}\; {\rm{keV}}^{-1} $ .In our simulation, the spectral parameters are generated as follows. The photon index
$\alpha^{\mathrm{PL}}$ is sampled from a Gaussian distribution with mean$\mu_{\alpha} = -1.55$ and standard deviation$\sigma_{\alpha} = 0.4$ , which approximates the intrinsic distribution inferred from observational studies [9]. The normalization constant$J_0$ is then determined from the intrinsic energetics of each burst. For a burst with redshift z, photon index$ \alpha^{\rm{PL}} $ , and average isotropic luminosity$ L_{\rm{ave}} $ , we compute$ J_0 $ by inverting the standard cosmological relation [7]:$ L_{\rm{ave}} = 4\pi D_L^2 \cdot k \cdot F_\gamma, $
(8) where k is the k-correction factor, defined as
$ k \equiv \frac{\int_{1/(1+z)}^{10^4/(1+z)} E N(E) dE}{\int_{e_1}^{e_2} E N(E) dE}, $
(9) where E is measured in keV.
$ F_\gamma = \int_{e_1}^{e_2} E N(E) \, dE $ is the observed energy flux in the BAT band, and$ e_1 $ and$ e_2 $ denote the detector's energy band limits (for Swift/BAT,$ e_1 = 15 $ keV and$ e_2 = 150 $ keV).$D_L$ is the luminosity distance. A similar approach has been adopted in previous studies [7, 20].In this study, we selected a subset of gamma-ray bursts (GRBs) with measured redshifts and best-fit power-law spectra to serve as the comparison sample for our simulations. The parameters of these GRBs were obtained from the Swift/BAT online catalog as of August 2025 [8, 28]. For each burst, this catalog provides the duration
$ T_{90} $ , redshift z, fluence, peak flux, and the spectral parameters ($ \alpha^{\mathrm{PL}} $ ,$ J_0 $ ), along with their uncertainties. The isotropic peak luminosity$ L_{\text{p}} $ and isotropic energy$ E_{\text{iso}} $ were then computed from these observables assuming a standard ΛCDM cosmology. -
Observationally, most GRB spectra exhibit a characteristic peak energy that corresponds to a spectral break. Within the Swift/BAT energy range (15–150 keV), GRB photon spectra are typically well described by either a power-law (PL) or a cutoff power-law (CPL) model [8]. In this work, we focus on the PL representation, given by
$ N(E) = J_0 \left(\frac{E}{50\; {\rm{keV}}}\right)^{\alpha^{\rm{PL}}}, $
(7) where
$ \alpha^{\rm{PL}} $ is the photon index and$ J_0 $ is the normalization at 50 keV, with units of$ {\rm{ ph}}\; {\rm{cm}}^{-2}\; {\rm{s}}^{-1}\; {\rm{keV}}^{-1} $ .In our simulation, the spectral parameters are generated as follows. The photon index
$\alpha^{\mathrm{PL}}$ is sampled from a Gaussian distribution with mean$\mu_{\alpha} = -1.55$ and standard deviation$\sigma_{\alpha} = 0.4$ , which approximates the intrinsic distribution inferred from observational studies [9]. The normalization constant$J_0$ is then determined from the intrinsic energetics of each burst. For a burst with redshift z, photon index$ \alpha^{\rm{PL}} $ , and average isotropic luminosity$ L_{\rm{ave}} $ , we compute$ J_0 $ by inverting the standard cosmological relation [7]:$ L_{\rm{ave}} = 4\pi D_L^2 \cdot k \cdot F_\gamma, $
(8) where k is the k-correction factor, defined as
$ k \equiv \frac{\displaystyle\int_{1/(1+z)}^{10^4/(1+z)} E N(E) {\rm d}E}{\displaystyle\int_{e_1}^{e_2} E N(E) {\rm d}E}, $
(9) where E is measured in keV.
$F_\gamma = \int_{e_1}^{e_2} E N(E) \, {\rm d}E$ is the observed energy flux in the BAT band, and$ e_1 $ and$ e_2 $ denote the detector's energy band limits (for Swift/BAT,$ e_1 = 15 $ keV and$ e_2 = 150 $ keV).$D_L$ is the luminosity distance. A similar approach has been adopted in previous studies [7, 20].In this study, we selected a subset of gamma-ray bursts (GRBs) with measured redshifts and best-fit power-law spectra to serve as the comparison sample for our simulations. The parameters of these GRBs were obtained from the Swift/BAT online catalog as of August 2025 [8, 28]. For each burst, this catalog provides the duration
$ T_{90} $ , redshift z, fluence, peak flux, and the spectral parameters ($ \alpha^{\mathrm{PL}} $ ,$ J_0 $ ), along with their uncertainties. The isotropic peak luminosity$ L_{\text{p}} $ and isotropic energy$ E_{\text{iso}} $ were then computed from these observables assuming a standard ΛCDM cosmology. -
Observationally, most GRB spectra exhibit a characteristic peak energy that corresponds to a spectral break. Within the Swift/BAT energy range (15–150 keV), GRB photon spectra are typically well described by either a power-law (PL) or a cutoff power-law (CPL) model [8]. In this work, we focus on the PL representation, given by
$ N(E) = J_0 \left(\frac{E}{50\; {\rm{keV}}}\right)^{\alpha^{\rm{PL}}}, $
(7) where
$ \alpha^{\rm{PL}} $ is the photon index and$ J_0 $ is the normalization at 50 keV, with units of$ {\rm{ ph}}\; {\rm{cm}}^{-2}\; {\rm{s}}^{-1}\; {\rm{keV}}^{-1} $ .In our simulation, the spectral parameters are generated as follows. The photon index
$\alpha^{\mathrm{PL}}$ is sampled from a Gaussian distribution with mean$\mu_{\alpha} = -1.55$ and standard deviation$\sigma_{\alpha} = 0.4$ , which approximates the intrinsic distribution inferred from observational studies [9]. The normalization constant$J_0$ is then determined from the intrinsic energetics of each burst. For a burst with redshift z, photon index$ \alpha^{\rm{PL}} $ , and average isotropic luminosity$ L_{\rm{ave}} $ , we compute$ J_0 $ by inverting the standard cosmological relation [7]:$ L_{\rm{ave}} = 4\pi D_L^2 \cdot k \cdot F_\gamma, $
(8) where k is the k-correction factor, defined as
$ k \equiv \frac{\displaystyle\int_{1/(1+z)}^{10^4/(1+z)} E N(E) {\rm d}E}{\displaystyle\int_{e_1}^{e_2} E N(E) {\rm d}E}, $
(9) where E is measured in keV.
$F_\gamma = \int_{e_1}^{e_2} E N(E) \, {\rm d}E$ is the observed energy flux in the BAT band, and$ e_1 $ and$ e_2 $ denote the detector's energy band limits (for Swift/BAT,$ e_1 = 15 $ keV and$ e_2 = 150 $ keV).$D_L$ is the luminosity distance. A similar approach has been adopted in previous studies [7, 20].In this study, we selected a subset of gamma-ray bursts (GRBs) with measured redshifts and best-fit power-law spectra to serve as the comparison sample for our simulations. The parameters of these GRBs were obtained from the Swift/BAT online catalog as of August 2025 [8, 28]. For each burst, this catalog provides the duration
$ T_{90} $ , redshift z, fluence, peak flux, and the spectral parameters ($ \alpha^{\mathrm{PL}} $ ,$ J_0 $ ), along with their uncertainties. The isotropic peak luminosity$ L_{\text{p}} $ and isotropic energy$ E_{\text{iso}} $ were then computed from these observables assuming a standard ΛCDM cosmology. -
The Swift/BAT is a coded-aperture imaging telescope operating in the 15–150 keV energy band, with an on-axis effective area of
$ \sim 5200\; \mathrm{cm}^2 $ and a wide, partially coded field of view of 1.4 sr. It performs real-time triggering and coarse localization within seconds of burst onset [18, 29, 30].To realistically reproduce observations, we built a full-chain detector-response model that accounts for effective area, energy response, and background noise. Using calibration data at
$ 0^\circ $ (on-axis) and$ 45^\circ $ (off-axis), we performed a two-dimensional interpolation to produce a continuous effective-area function$ A_{\text{eff}}(E, \theta) $ covering the full field of view (1.4 sr) and the instrument's energy range [30, 31]. This enables accurate photon-count estimation for GRBs from arbitrary directions. Realistic background noise, matching observed spectral properties, was added, with a total count rate in the standard trigger window of$ \sim 1.7 \times 10^4\; \mathrm{counts\; s}^{-1} $ [29, 30]. The background was distributed across energy channels according to the background spectrum and included Poisson fluctuations to simulate statistical noise. These components were integrated into the trigger-decision pipeline, yielding simulated GRB samples that closely reproduce the spectral and temporal properties of real Swift/BAT data [11, 14]. -
The Swift/BAT is a coded-aperture imaging telescope operating in the 15–150 keV energy band, with an on-axis effective area of
$ \sim 5200\; \mathrm{cm}^2 $ and a wide, partially coded field of view of 1.4 sr. It performs real-time triggering and coarse localization within seconds of burst onset [18, 29, 30].To realistically reproduce observations, we built a full-chain detector-response model that accounts for effective area, energy response, and background noise. Using calibration data at
$ 0^\circ $ (on-axis) and$ 45^\circ $ (off-axis), we performed a two-dimensional interpolation to produce a continuous effective-area function$ A_{\text{eff}}(E, \theta) $ covering the full field of view (1.4 sr) and the instrument's energy range [30, 31]. This enables accurate photon-count estimation for GRBs from arbitrary directions. Realistic background noise, matching observed spectral properties, was added, with a total count rate in the standard trigger window of$ \sim 1.7 \times 10^4\; \mathrm{counts\; s}^{-1} $ [29, 30]. The background was distributed across energy channels according to the background spectrum and included Poisson fluctuations to simulate statistical noise. These components were integrated into the trigger-decision pipeline, yielding simulated GRB samples that closely reproduce the spectral and temporal properties of real Swift/BAT data [11, 14]. -
The Swift/BAT is a coded-aperture imaging telescope operating in the 15–150 keV energy band, with an on-axis effective area of
$ \sim 5200\; \mathrm{cm}^2 $ and a wide, partially coded field of view of 1.4 sr. It performs real-time triggering and coarse localization within seconds of burst onset [18, 29, 30].To realistically reproduce observations, we built a full-chain detector-response model that accounts for effective area, energy response, and background noise. Using calibration data at
$ 0^\circ $ (on-axis) and$ 45^\circ $ (off-axis), we performed a two-dimensional interpolation to produce a continuous effective-area function$ A_{\text{eff}}(E, \theta) $ covering the full field of view (1.4 sr) and the instrument's energy range [30, 31]. This enables accurate photon-count estimation for GRBs from arbitrary directions. Realistic background noise, matching observed spectral properties, was added, with a total count rate in the standard trigger window of$ \sim 1.7 \times 10^4\; \mathrm{counts\; s}^{-1} $ [29, 30]. The background was distributed across energy channels according to the background spectrum and included Poisson fluctuations to simulate statistical noise. These components were integrated into the trigger-decision pipeline, yielding simulated GRB samples that closely reproduce the spectral and temporal properties of real Swift/BAT data [11, 14]. -
The Swift/BAT is a coded-aperture imaging telescope operating in the 15–150 keV energy band, with an on-axis effective area of
$ \sim 5200\; \mathrm{cm}^2 $ and a wide, partially coded field of view of 1.4 sr. It performs real-time triggering and coarse localization within seconds of burst onset [18, 29, 30].To realistically reproduce observations, we built a full-chain detector-response model that accounts for effective area, energy response, and background noise. Using calibration data at
$ 0^\circ $ (on-axis) and$ 45^\circ $ (off-axis), we performed a two-dimensional interpolation to produce a continuous effective-area function$ A_{\text{eff}}(E, \theta) $ covering the full field of view (1.4 sr) and the instrument's energy range [30, 31]. This enables accurate photon-count estimation for GRBs from arbitrary directions. Realistic background noise, matching observed spectral properties, was added, with a total count rate in the standard trigger window of$ \sim 1.7 \times 10^4\; \mathrm{counts\; s}^{-1} $ [29, 30]. The background was distributed across energy channels according to the background spectrum and included Poisson fluctuations to simulate statistical noise. These components were integrated into the trigger-decision pipeline, yielding simulated GRB samples that closely reproduce the spectral and temporal properties of real Swift/BAT data [11, 14]. -
Using the theoretical framework described above and Monte Carlo sampling, we generated a population of simulated GRBs characterized by the parameters (
$ z,\; T_{\mathrm{90}}, E_{\mathrm{iso}},\; Fluence,\; \alpha^{\rm{PL}},\; J_0 $ ). The detection significance for each event was evaluated as:$ \sigma = \frac{n_st_d}{\sqrt{n_b t_d}}, $
(10) where
$ n_b = 1.7 \times 10^4\; \mathrm{counts\; s^{-1}} $ is the background rate [30],$ t_d = T_{90} $ is the burst duration, and$ n_s $ is the expected number of detected signal photons:$ n_s = \int_{15\ \mathrm{keV}}^{150\ \mathrm{keV}} N(E)\, A_{\mathrm{eff}}(E, \theta)\, {\rm d}E, $
(11) where
$ N(E) $ is the incident photon spectrum and$ A_{\rm{eff}}(E, \theta) $ is the energy- and angle-dependent effective area of Swift/BAT. We adopted a detection threshold of 10σ for a GRB to be considered successfully triggered [18, 29]. This$10\sigma$ criterion defines the detector sensitivity threshold in our simulation. Its quantitative impact is illustrated in Fig. 1: as the peak flux approaches the detector threshold, the detection efficiency drops rapidly, leading to a significant underrepresentation of low-luminosity and high-redshift events in the observed sample.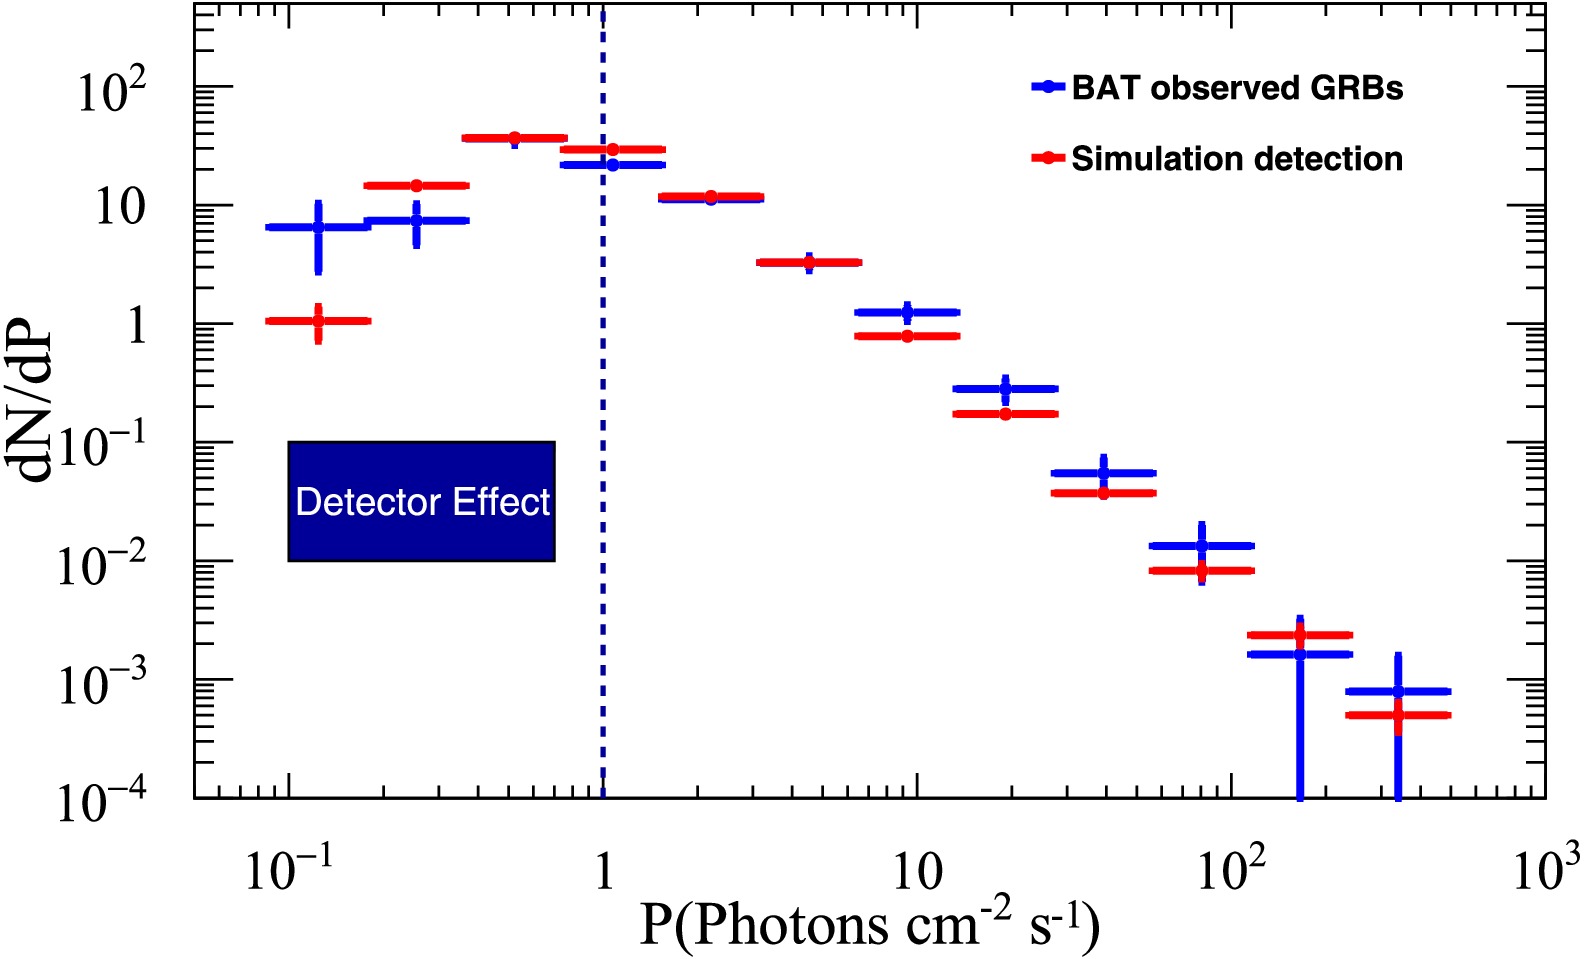
Figure 1. (color online) The photon peak-flux distribution for long-duration GRBs detected by Swift/BAT.
For each triggered event, we performed spectral fitting in the 15–150 keV band using 60 logarithmically spaced energy channels. Poisson noise was added to each channel to mimic realistic statistical fluctuations [32]. The observed counts in each channel were modeled as the sum of the signal and background contributions, each subject to Poisson fluctuations, with an expected value
$ C_{j} = P(N_{s,j}) + P(N_{b,j}). $
(12) The best-fit parameters,
$ \alpha^{\rm{PL}} $ and$ J_0 $ , are obtained by minimizing the least-squares statistic [33]:$ \chi^{2} = \sum\limits_{j} \frac{\left(\hat{N}_{s,j} + P(N_{b,j}) - C_{j} \right)^{2}} {\hat{N}_{s,j} + P(N_{b,j})}, $
(13) where j indexes the energy bins. The expected signal counts,
$ \hat{N}_{s,j} $ , are computed from the free spectral parameters. This fitting procedure has been validated in previous forward-modeling studies of Swift/BAT GRBs [11, 14]. -
Using the theoretical framework described above and Monte Carlo sampling, we generated a population of simulated GRBs characterized by the parameters (
$ z,\; T_{\mathrm{90}},\; E_{\mathrm{iso}},\; Fluence,\; \alpha^{\rm{PL}},\; J_0 $ ). The detection significance for each event was evaluated as:$ \sigma = \frac{n_st_d}{\sqrt{n_b t_d}}, $
(10) where
$ n_b = 1.7 \times 10^4\; \mathrm{counts\; s^{-1}} $ is the background rate [30],$ t_d = T_{90} $ is the burst duration, and$ n_s $ is the expected number of detected signal photons:$ n_s = \int_{15\ \mathrm{keV}}^{150\ \mathrm{keV}} N(E)\, A_{\mathrm{eff}}(E, \theta)\, dE, $
(11) where
$ N(E) $ is the incident photon spectrum and$ A_{\rm{eff}}(E, \theta) $ is the energy- and angle-dependent effective area of Swift/BAT. We adopted a detection threshold of 10σ for a GRB to be considered successfully triggered [18, 29]. This$10\sigma$ criterion defines the detector sensitivity threshold in our simulation. Its quantitative impact is illustrated in Figure 1: as the peak flux approaches the detector threshold, the detection efficiency drops rapidly, leading to a significant underrepresentation of low-luminosity and high-redshift events in the observed sample.
Figure 1. (color online) The photon peak-flux distribution for long-duration GRBs detected by Swift/BAT.
For each triggered event, we performed spectral fitting in the 15–150 keV band using 60 logarithmically spaced energy channels. Poisson noise was added to each channel to mimic realistic statistical fluctuations [32]. The observed counts in each channel were modeled as the sum of the signal and background contributions, each subject to Poisson fluctuations, with an expected value
$ C_{j} = P(N_{s,j}) + P(N_{b,j}). $
(12) The best-fit parameters,
$ \alpha^{\rm{PL}} $ and$ J_0 $ , are obtained by minimizing the least-squares statistic [33]:$ \chi^{2} = \sum\limits_{j} \frac{\left(\hat{N}_{s,j} + P(N_{b,j}) - C_{j} \right)^{2}} {\hat{N}_{s,j} + P(N_{b,j})}, $
(13) where j indexes the energy bins. The expected signal counts,
$ \hat{N}_{s,j} $ , are computed from the free spectral parameters. This fitting procedure has been validated in previous forward-modeling studies of Swift/BAT GRBs [11, 14]. -
Using the theoretical framework described above and Monte Carlo sampling, we generated a population of simulated GRBs characterized by the parameters (
$ z,\; T_{\mathrm{90}}, E_{\mathrm{iso}},\; Fluence,\; \alpha^{\rm{PL}},\; J_0 $ ). The detection significance for each event was evaluated as:$ \sigma = \frac{n_st_d}{\sqrt{n_b t_d}}, $
(10) where
$ n_b = 1.7 \times 10^4\; \mathrm{counts\; s^{-1}} $ is the background rate [30],$ t_d = T_{90} $ is the burst duration, and$ n_s $ is the expected number of detected signal photons:$ n_s = \int_{15\ \mathrm{keV}}^{150\ \mathrm{keV}} N(E)\, A_{\mathrm{eff}}(E, \theta)\, {\rm d}E, $
(11) where
$ N(E) $ is the incident photon spectrum and$ A_{\rm{eff}}(E, \theta) $ is the energy- and angle-dependent effective area of Swift/BAT. We adopted a detection threshold of 10σ for a GRB to be considered successfully triggered [18, 29]. This$10\sigma$ criterion defines the detector sensitivity threshold in our simulation. Its quantitative impact is illustrated in Fig. 1: as the peak flux approaches the detector threshold, the detection efficiency drops rapidly, leading to a significant underrepresentation of low-luminosity and high-redshift events in the observed sample.
Figure 1. (color online) The photon peak-flux distribution for long-duration GRBs detected by Swift/BAT.
For each triggered event, we performed spectral fitting in the 15–150 keV band using 60 logarithmically spaced energy channels. Poisson noise was added to each channel to mimic realistic statistical fluctuations [32]. The observed counts in each channel were modeled as the sum of the signal and background contributions, each subject to Poisson fluctuations, with an expected value
$ C_{j} = P(N_{s,j}) + P(N_{b,j}). $
(12) The best-fit parameters,
$ \alpha^{\rm{PL}} $ and$ J_0 $ , are obtained by minimizing the least-squares statistic [33]:$ \chi^{2} = \sum\limits_{j} \frac{\left(\hat{N}_{s,j} + P(N_{b,j}) - C_{j} \right)^{2}} {\hat{N}_{s,j} + P(N_{b,j})}, $
(13) where j indexes the energy bins. The expected signal counts,
$ \hat{N}_{s,j} $ , are computed from the free spectral parameters. This fitting procedure has been validated in previous forward-modeling studies of Swift/BAT GRBs [11, 14]. -
Using the theoretical framework described above and Monte Carlo sampling, we generated a population of simulated GRBs characterized by the parameters (
$ z,\; T_{\mathrm{90}}, E_{\mathrm{iso}},\; Fluence,\; \alpha^{\rm{PL}},\; J_0 $ ). The detection significance for each event was evaluated as:$ \sigma = \frac{n_st_d}{\sqrt{n_b t_d}}, $
(10) where
$ n_b = 1.7 \times 10^4\; \mathrm{counts\; s^{-1}} $ is the background rate [30],$ t_d = T_{90} $ is the burst duration, and$ n_s $ is the expected number of detected signal photons:$ n_s = \int_{15\ \mathrm{keV}}^{150\ \mathrm{keV}} N(E)\, A_{\mathrm{eff}}(E, \theta)\, {\rm d}E, $
(11) where
$ N(E) $ is the incident photon spectrum and$ A_{\rm{eff}}(E, \theta) $ is the energy- and angle-dependent effective area of Swift/BAT. We adopted a detection threshold of 10σ for a GRB to be considered successfully triggered [18, 29]. This$10\sigma$ criterion defines the detector sensitivity threshold in our simulation. Its quantitative impact is illustrated in Fig. 1: as the peak flux approaches the detector threshold, the detection efficiency drops rapidly, leading to a significant underrepresentation of low-luminosity and high-redshift events in the observed sample.
Figure 1. (color online) The photon peak-flux distribution for long-duration GRBs detected by Swift/BAT.
For each triggered event, we performed spectral fitting in the 15–150 keV band using 60 logarithmically spaced energy channels. Poisson noise was added to each channel to mimic realistic statistical fluctuations [32]. The observed counts in each channel were modeled as the sum of the signal and background contributions, each subject to Poisson fluctuations, with an expected value
$ C_{j} = P(N_{s,j}) + P(N_{b,j}). $
(12) The best-fit parameters,
$ \alpha^{\rm{PL}} $ and$ J_0 $ , are obtained by minimizing the least-squares statistic [33]:$ \chi^{2} = \sum\limits_{j} \frac{\left(\hat{N}_{s,j} + P(N_{b,j}) - C_{j} \right)^{2}} {\hat{N}_{s,j} + P(N_{b,j})}, $
(13) where j indexes the energy bins. The expected signal counts,
$ \hat{N}_{s,j} $ , are computed from the free spectral parameters. This fitting procedure has been validated in previous forward-modeling studies of Swift/BAT GRBs [11, 14]. -
The detection of GRBs by Swift is subject to incompleteness in the instrumental trigger. In particular, bursts with photon peak fluxes close to the trigger threshold (set by the background noise level) are significantly less likely to be detected than those with higher peak fluxes [8]. Consequently, the intrinsic population of faint GRBs is expected to be substantially larger than is observed.
It is well known that the flux distribution of transient sources typically follows a simple or broken power-law form. Figure 1 shows the photon peak-flux distribution of GRBs observed by Swift. As shown, for
$P \gtrsim 1 $ $ \mathrm{ph}\ \mathrm{cm}^{-2}\ \mathrm{s}^{-1} $ , the distribution is well described by a broken power-law model. Based on the analysis of 424 long GRBs, Lan et al. [24] derived the corresponding power-law indices for this regime. This suggests that GRBs above this flux level can be efficiently detected by the instrument. In contrast, for$ P \lesssim 1\ \mathrm{ph}\ \mathrm{cm}^{-2}\ \mathrm{s}^{-1} $ , the trigger efficiency drops rapidly, leading to significant observational incompleteness.In our simulations, we explicitly incorporate the detector trigger efficiency. The resulting photon peak-flux distribution is in good agreement with the observations, particularly in the low-flux regime (
$ P \lesssim 1\ \mathrm{ph}\ \mathrm{cm}^{-2}\ \mathrm{s}^{-1} $ ). This agreement indicates that the simulated instrument response successfully reproduces threshold effects, thus supporting the reliability of the synthetic GRB sample used in this work. This consistency provides important validation of our modeling of selection effects and enhances the robustness of the inferred GRB population properties. -
The detection of GRBs by Swift is subject to incompleteness in the instrumental trigger. In particular, bursts with photon peak fluxes close to the trigger threshold (set by the background noise level) are significantly less likely to be detected than those with higher peak fluxes [8]. Consequently, the intrinsic population of faint GRBs is expected to be substantially larger than is observed.
It is well known that the flux distribution of transient sources typically follows a simple or broken power-law form. Figure 1 shows the photon peak-flux distribution of GRBs observed by Swift. As shown, for
$ P \gtrsim 1\ \mathrm{ph}\ \mathrm{cm}^{-2}\ \mathrm{s}^{-1} $ , the distribution is well described by a broken power-law model. Based on the analysis of 424 long GRBs, Lan et al. [24] derived the corresponding power-law indices for this regime. This suggests that GRBs above this flux level can be efficiently detected by the instrument. In contrast, for$ P \lesssim 1\ \mathrm{ph}\ \mathrm{cm}^{-2}\ \mathrm{s}^{-1} $ , the trigger efficiency drops rapidly, leading to significant observational incompleteness.In our simulations, we explicitly incorporate the detector trigger efficiency. The resulting photon peak-flux distribution is in good agreement with the observations, particularly in the low-flux regime (
$ P \lesssim 1\ \mathrm{ph}\ \mathrm{cm}^{-2}\ \mathrm{s}^{-1} $ ). This agreement indicates that the simulated instrument response successfully reproduces threshold effects, thus supporting the reliability of the synthetic GRB sample used in this work. This consistency provides important validation of our modeling of selection effects and enhances the robustness of the inferred GRB population properties. -
The detection of GRBs by Swift is subject to incompleteness in the instrumental trigger. In particular, bursts with photon peak fluxes close to the trigger threshold (set by the background noise level) are significantly less likely to be detected than those with higher peak fluxes [8]. Consequently, the intrinsic population of faint GRBs is expected to be substantially larger than is observed.
It is well known that the flux distribution of transient sources typically follows a simple or broken power-law form. Figure 1 shows the photon peak-flux distribution of GRBs observed by Swift. As shown, for
$P \gtrsim 1 $ $ \mathrm{ph}\ \mathrm{cm}^{-2}\ \mathrm{s}^{-1} $ , the distribution is well described by a broken power-law model. Based on the analysis of 424 long GRBs, Lan et al. [24] derived the corresponding power-law indices for this regime. This suggests that GRBs above this flux level can be efficiently detected by the instrument. In contrast, for$ P \lesssim 1\ \mathrm{ph}\ \mathrm{cm}^{-2}\ \mathrm{s}^{-1} $ , the trigger efficiency drops rapidly, leading to significant observational incompleteness.In our simulations, we explicitly incorporate the detector trigger efficiency. The resulting photon peak-flux distribution is in good agreement with the observations, particularly in the low-flux regime (
$ P \lesssim 1\ \mathrm{ph}\ \mathrm{cm}^{-2}\ \mathrm{s}^{-1} $ ). This agreement indicates that the simulated instrument response successfully reproduces threshold effects, thus supporting the reliability of the synthetic GRB sample used in this work. This consistency provides important validation of our modeling of selection effects and enhances the robustness of the inferred GRB population properties. -
The detection of GRBs by Swift is subject to incompleteness in the instrumental trigger. In particular, bursts with photon peak fluxes close to the trigger threshold (set by the background noise level) are significantly less likely to be detected than those with higher peak fluxes [8]. Consequently, the intrinsic population of faint GRBs is expected to be substantially larger than is observed.
It is well known that the flux distribution of transient sources typically follows a simple or broken power-law form. Figure 1 shows the photon peak-flux distribution of GRBs observed by Swift. As shown, for
$P \gtrsim 1 $ $ \mathrm{ph}\ \mathrm{cm}^{-2}\ \mathrm{s}^{-1} $ , the distribution is well described by a broken power-law model. Based on the analysis of 424 long GRBs, Lan et al. [24] derived the corresponding power-law indices for this regime. This suggests that GRBs above this flux level can be efficiently detected by the instrument. In contrast, for$ P \lesssim 1\ \mathrm{ph}\ \mathrm{cm}^{-2}\ \mathrm{s}^{-1} $ , the trigger efficiency drops rapidly, leading to significant observational incompleteness.In our simulations, we explicitly incorporate the detector trigger efficiency. The resulting photon peak-flux distribution is in good agreement with the observations, particularly in the low-flux regime (
$ P \lesssim 1\ \mathrm{ph}\ \mathrm{cm}^{-2}\ \mathrm{s}^{-1} $ ). This agreement indicates that the simulated instrument response successfully reproduces threshold effects, thus supporting the reliability of the synthetic GRB sample used in this work. This consistency provides important validation of our modeling of selection effects and enhances the robustness of the inferred GRB population properties. -
Validating the simulated sample against observational data is crucial for assessing the reliability of the forward-modeling framework. All distributions in this section are presented as probability density functions; thus, the y-axis values represent event density per unit interval rather than raw counts. This normalization facilitates direct comparisons across samples of different sizes. Figure 2 shows the distributions of
$ \alpha^{\rm{PL}} $ ,$ J_0 $ , and their associated uncertainties, with the black solid line indicating the intrinsic distribution derived from the simulations.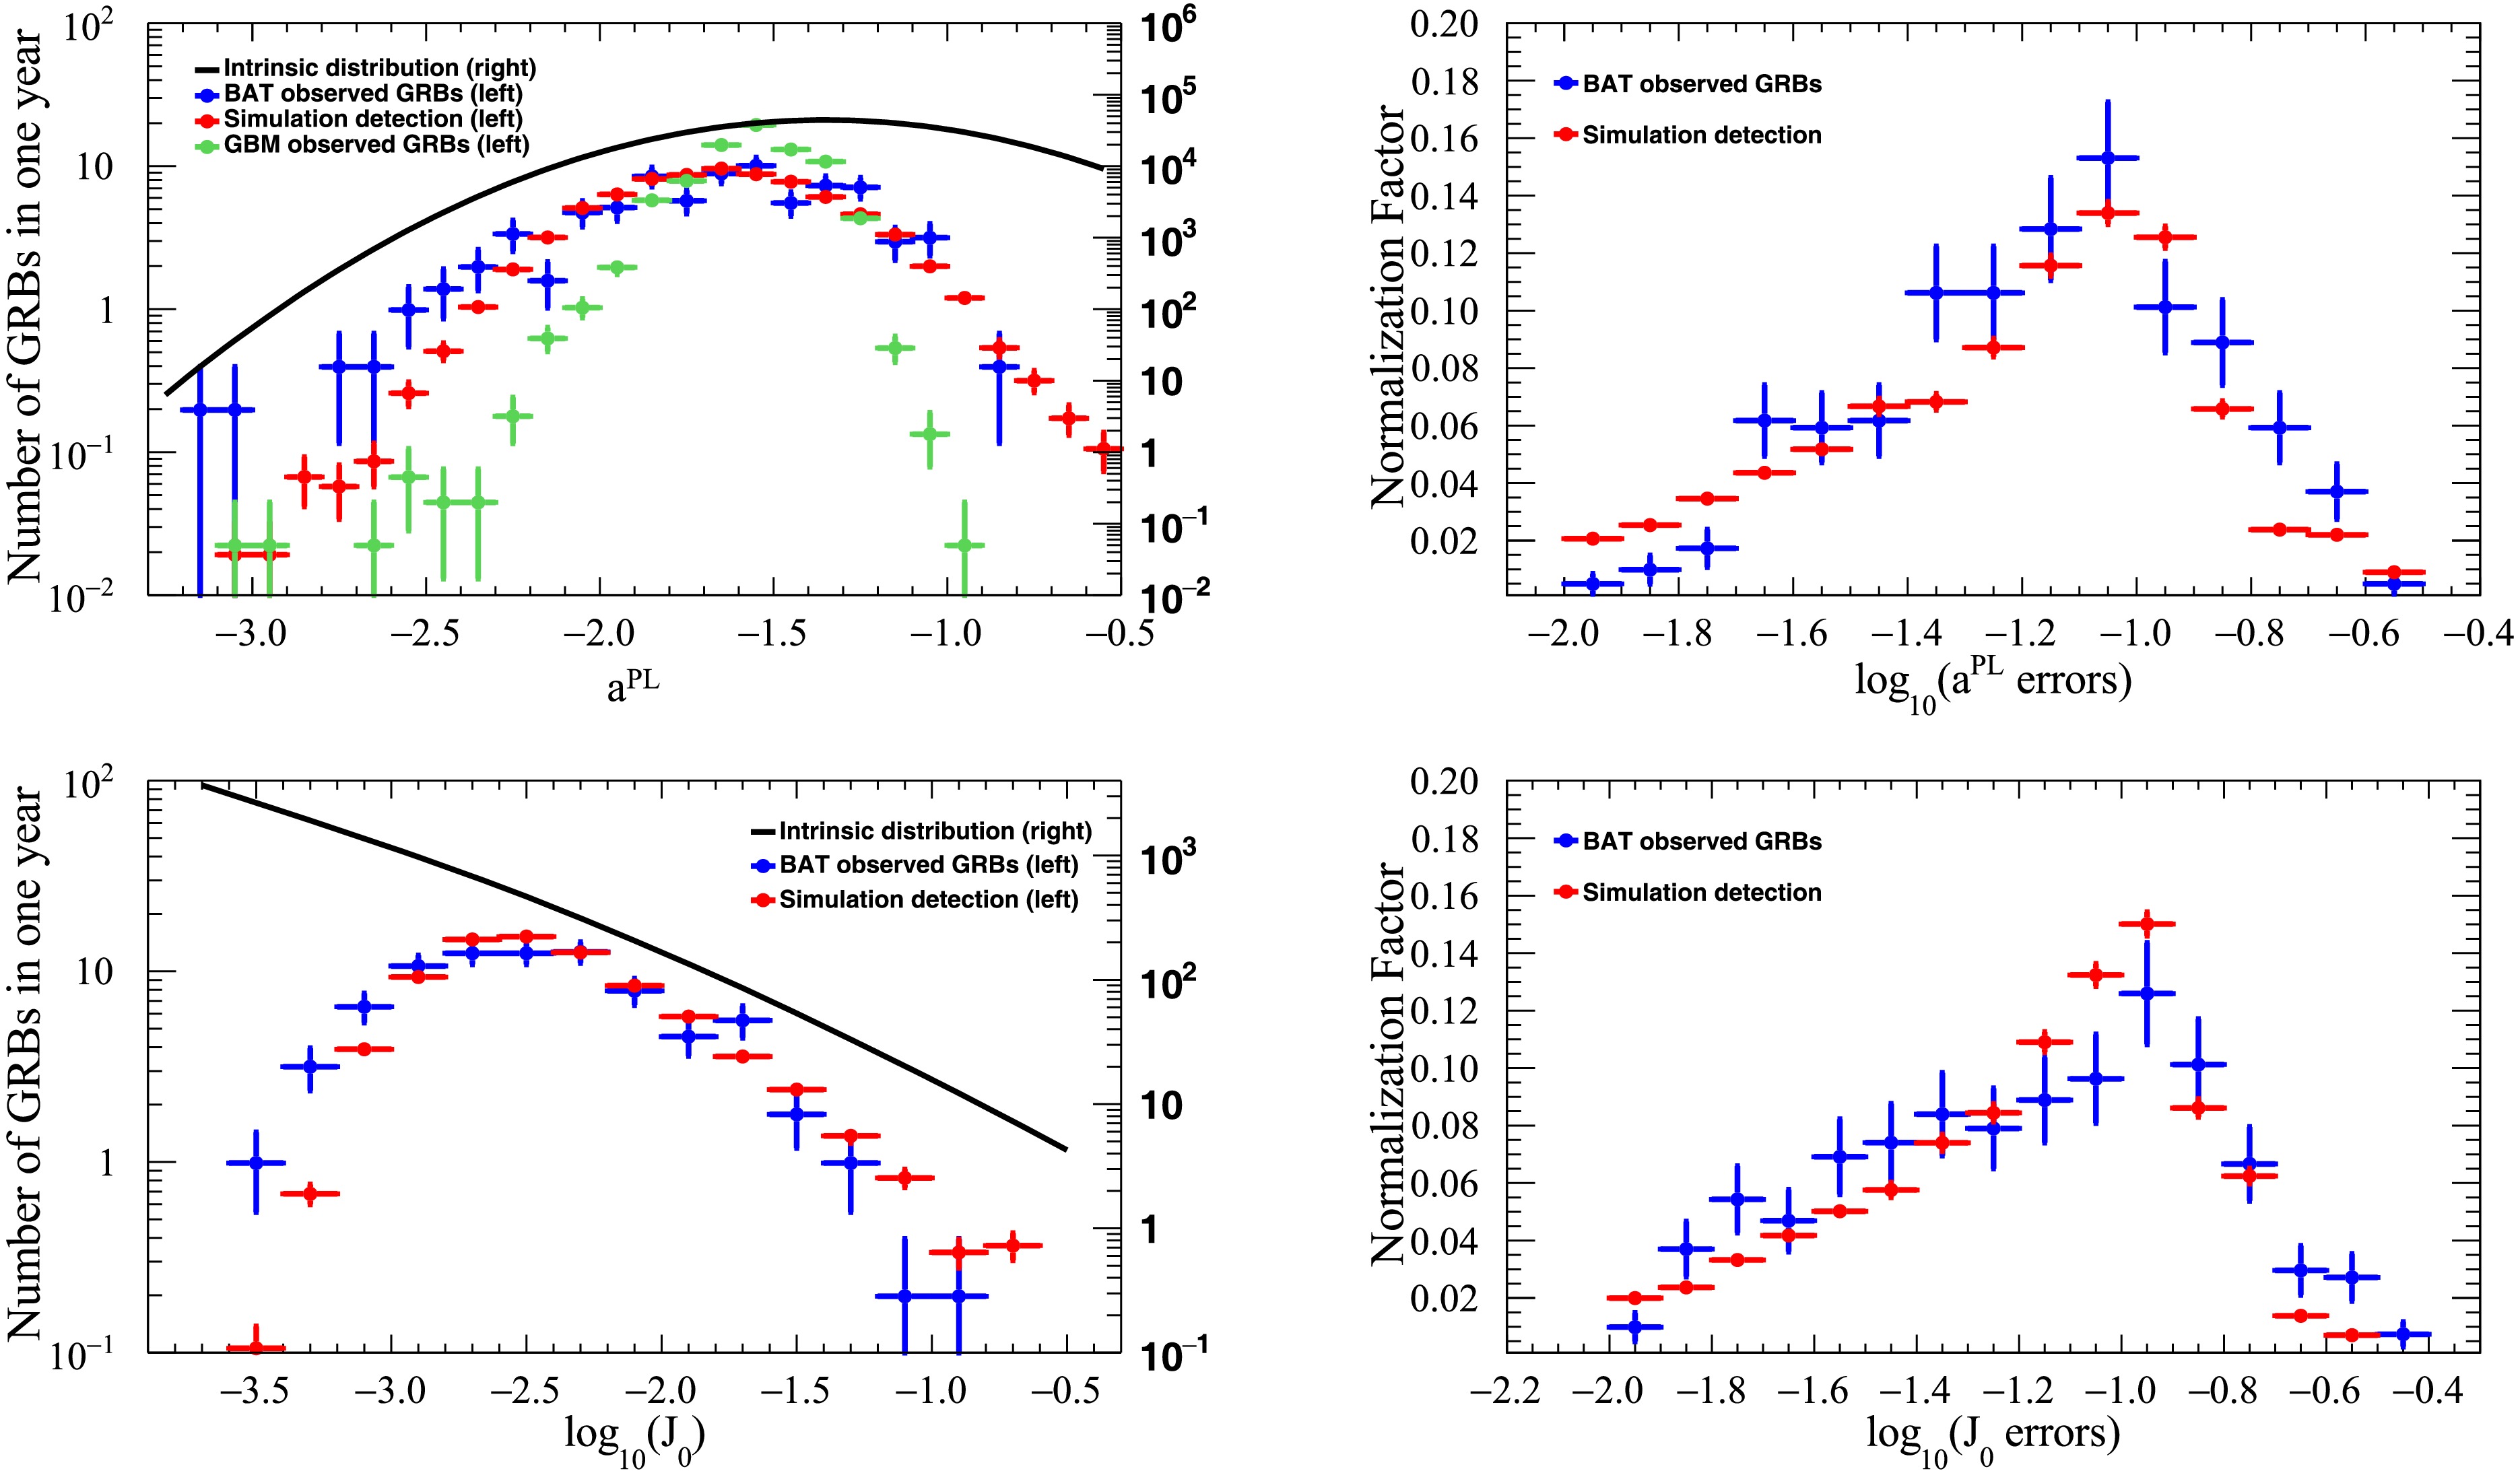
Figure 2. (color online) The simulated and observed distributions of the spectral parameters
$ \alpha^{\rm{PL}} $ ,$ J_0 $ , and their relative uncertainties are shown. The red curves denote the simulated distributions of detected GRBs, and the blue curves represent the observed distributions from Swift/BAT. The black curves correspond to the intrinsic parameter distributions prior to detection, and, in the upper-left panel, the green curves show the Fermi/GBM observational data. For clarity when comparing the intrinsic distributions with the observational samples, the intrinsic curves are plotted against the right-hand y-axis.Because Swift/BAT operates in a relatively narrow energy band (15–150 keV), the observed prompt spectra of most GRBs correspond to the low-energy portion of the spectral function (e.g., the Band model [34]) and are therefore well described by a single power-law. The observed
$ \alpha^{\rm{PL}} $ distribution is relatively narrow, with most events clustered in the range$ -2.5 \lt \alpha^{\rm{PL}} \lt -1.0 $ and peaking at$ \alpha^{\rm{PL}} \simeq -1.7 $ , consistent with non-thermal emission processes such as synchrotron or inverse-Compton radiation. The normalization factor$J_0$ spans several orders of magnitude and exhibits an approximately log-normal distribution. This shape arises from the combination of two key physical factors: (1) Intrinsic luminosity diversity: the isotropic peak luminosity$L_{\mathrm{p}}$ spans a wide range ($\sim10^{50}$ –$10^{54}$ erg s−1) and is directly coupled to$J_0$ via the relation given in Eq. (8) (see Section II.A.3). Since$J_0$ is proportional to$L_{\mathrm{p}}$ divided by a distance factor, the broad distribution of$L_{\mathrm{p}}$ naturally maps to a broad distribution of$J_0$ ; (2) Cosmological distance effects (i.e., redshift effects): redshift z affects the observed$J_0$ through the luminosity distance$D_L(z)$ —for the same intrinsic luminosity, a burst at higher redshift yields a systematically lower observed$J_0$ . The combination of these two factors gives rise to the log-normal shape of the$J_0$ distribution, with its width reflecting both the diversity of intrinsic luminosities and the redshift distribution of the burst population.The simulated-detected and observed distributions of
$ \alpha^{\rm{PL}} $ and$ J_{0} $ , as well as their uncertainties, show good agreement, confirming that the simulation reproduces the statistical properties of the Swift/BAT sample [8]. However, the intrinsic$ \alpha^{\rm{PL}} $ distribution peaks at systematically harder values than those of the observed and detected samples. This shift arises from instrumental selection effects: GRBs with softer spectra produce higher photon fluxes within the BAT energy band and are therefore more likely to trigger the detector, while harder bursts emit a substantial fraction of their photons above the BAT band, reducing their detection probability [9]. As a result, the observed$ \alpha^{\rm{PL}} $ distribution is biased toward softer values.Notably, even when the same power-law spectral model is applied, significant discrepancies persist between the observational results from GBM and Swift/BAT [11]. This further demonstrates that systematic deviations between observed and intrinsic distributions are common across different instruments, primarily driven by the inherent selection effects of each detector.Figure 3 presents the simulated and observed distributions of
$ T_{\mathrm{90}} $ , total fluence, isotropic energy$ E_{\rm{iso}} $ , and redshift z. Swift/BAT employs a multi-timescale trigger system, including short windows optimized for short GRBs and longer windows designed for extended emission. However, due to the highly concentrated nature of short GRB emission, even dedicated short windows may not perfectly align with the burst, causing signal loss; moreover, short windows require higher significance thresholds to avoid false triggers from short-timescale background fluctuations, thereby reducing their detection efficiency. In contrast, long GRBs benefit from longer integration times that robustly accumulate photons across various window alignments, yielding higher signal-to-noise ratios. Consequently, long GRBs dominate the detected sample, and this study focuses exclusively on long GRBs. The observed fluence distribution is unimodal and approximately log-normal, with most events concentrated between$ 10^{-7} $ and$ 10^{-4} $ erg cm−2. This shape reflects the combined effects of the detector sensitivity threshold, which suppresses low-fluence events, and the intrinsic rarity of extremely bright bursts. In contrast, the intrinsic distribution exhibits a larger population of low-fluence events that are partially missed in observations, as well as a mild deficit of very bright bursts in the observed sample due to the finite field of view of Swift/ BAT.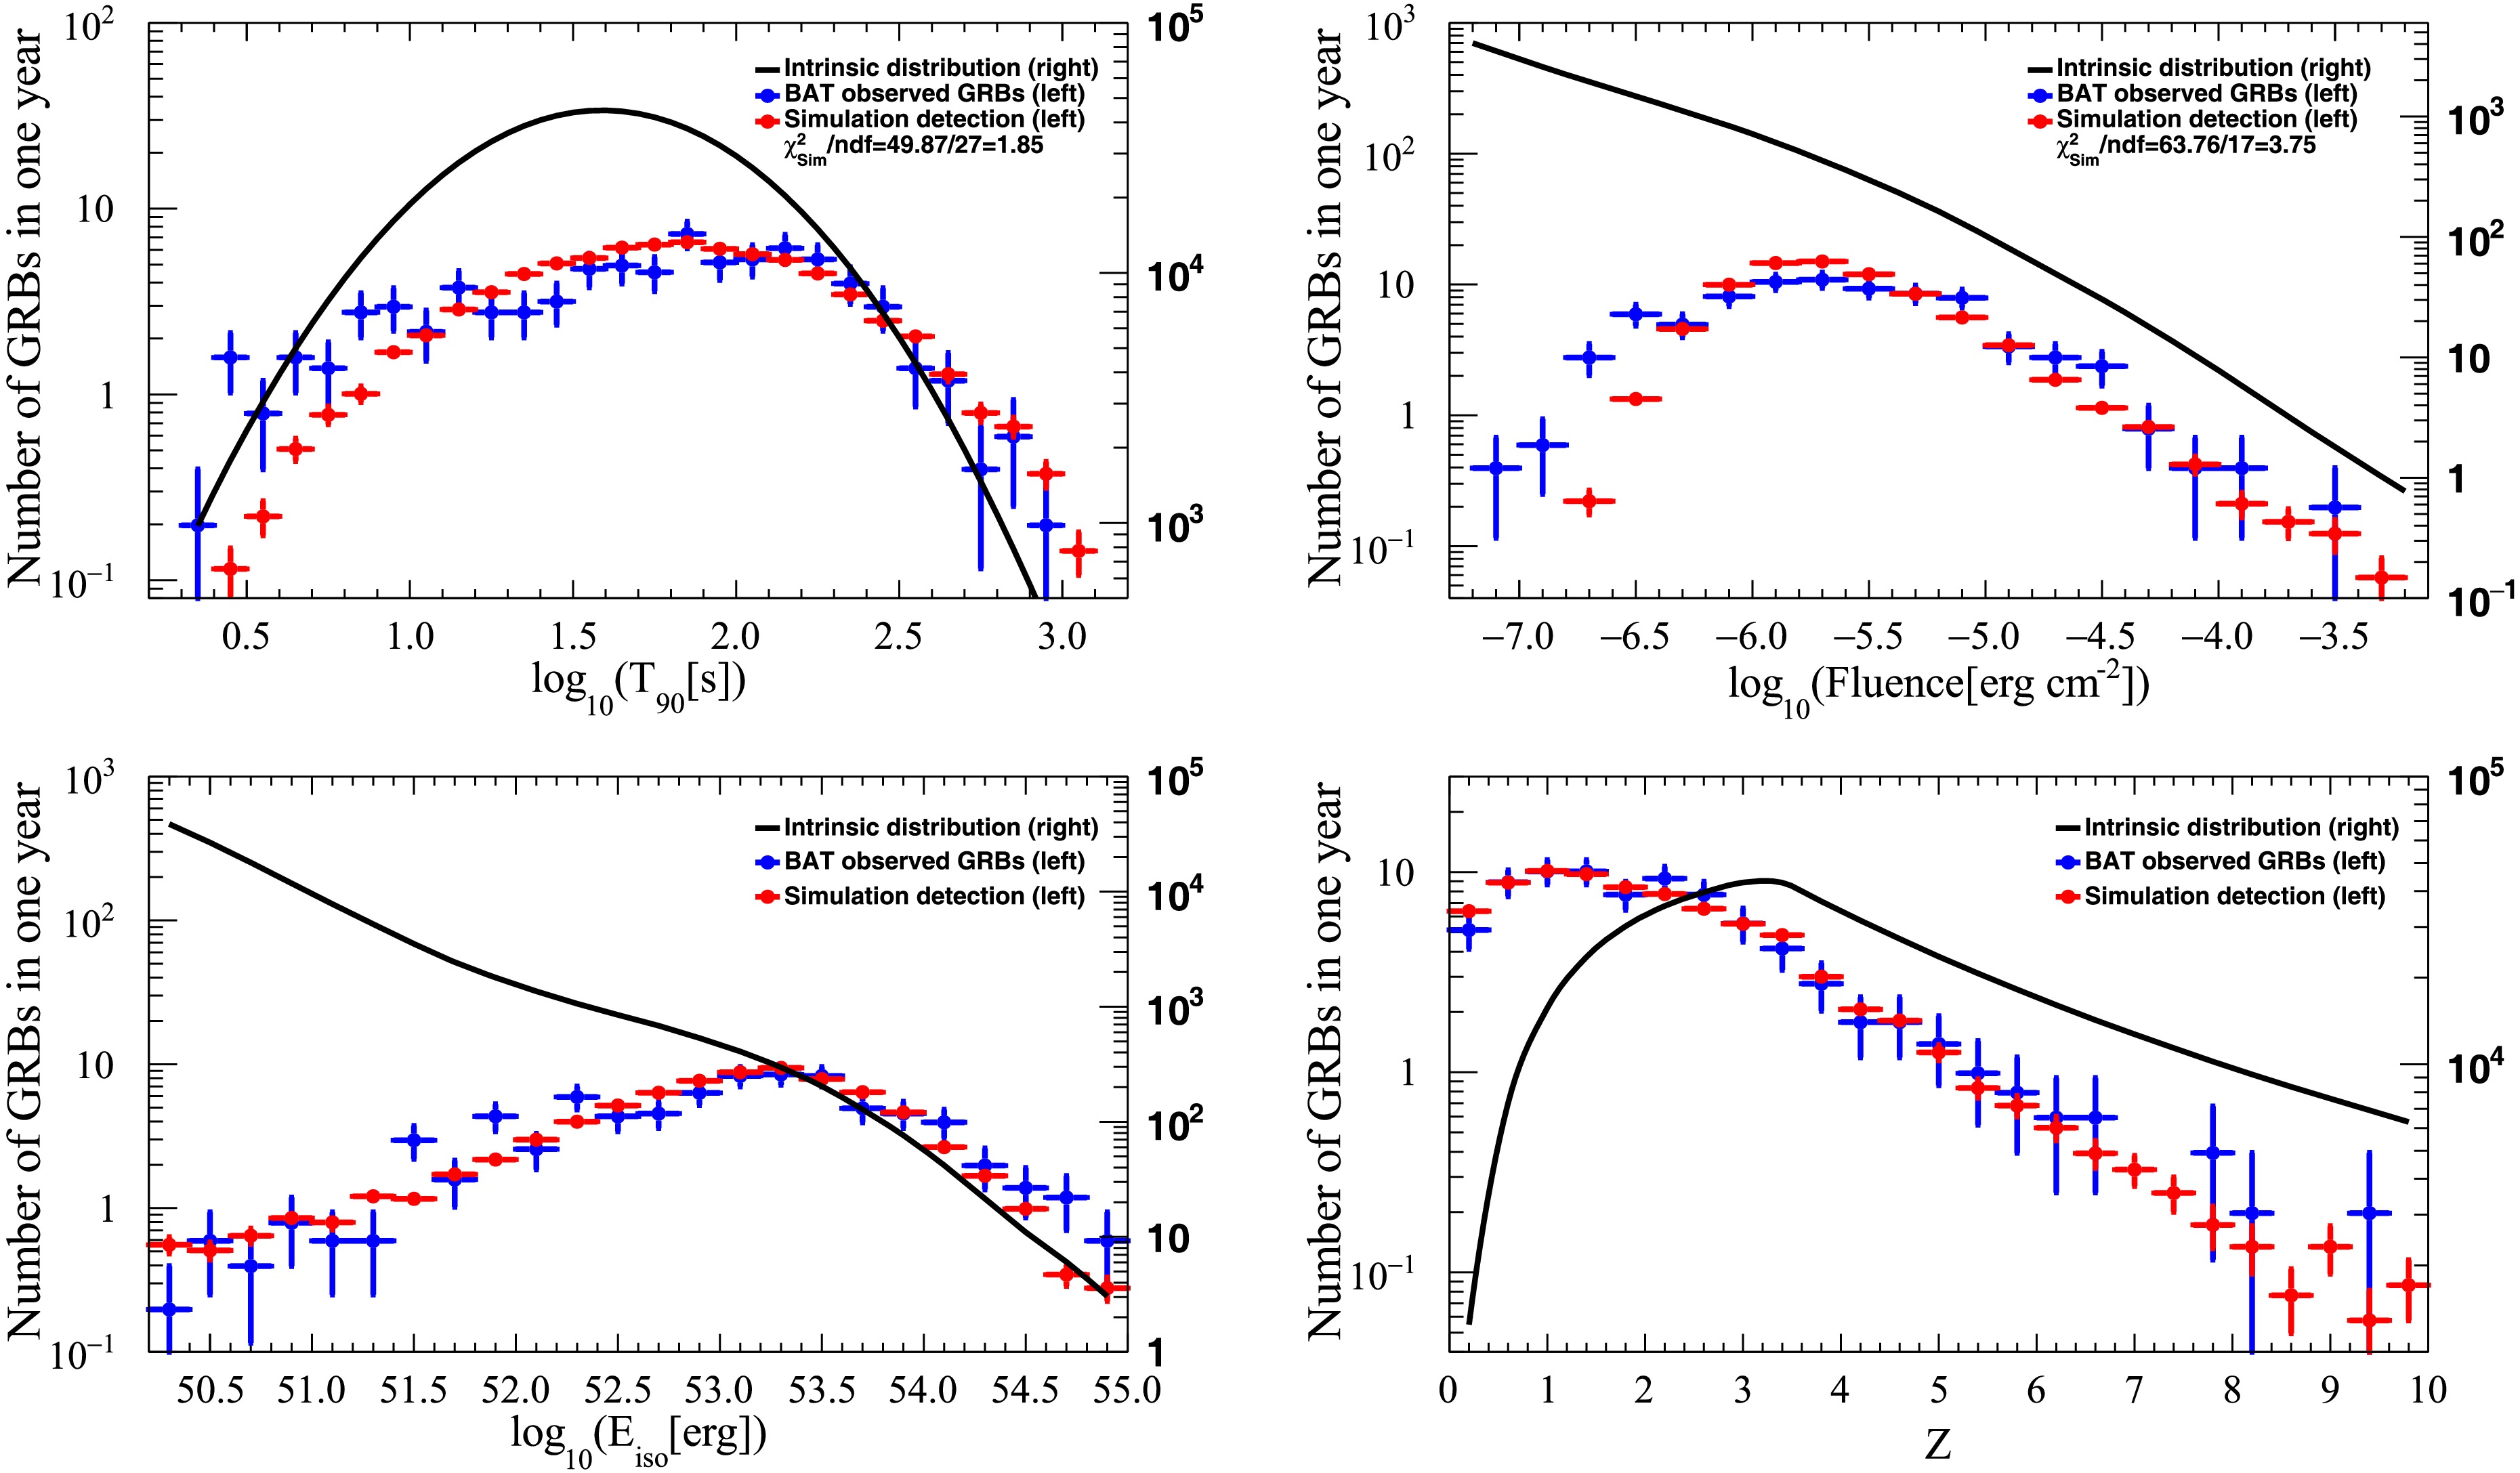
Figure 3. (color online) We compare the distributions of
$ T_{\mathrm{90}} $ , fluence,$ E_{\mathrm{iso}} $ , and redshift for the simulated GRB population with those obtained from observations. For clarity when comparing the intrinsic distributions with the observational samples, the intrinsic curves are plotted against the right-hand y-axis.Using the empirical
$E_{\mathrm{iso}}$ -$L_{\mathrm{p}}$ relation given in Eq. (6), which was derived from long GRB samples and already incorporates the K-correction that converts the observed energy band ($ 15 $ –$ 150 $ keV) to the rest-frame band ($ 1 $ –$ 10^4 $ keV), we obtain the isotropic energy$ E_{\rm{iso}} $ for bursts in our sample. The derived$E_{\mathrm{iso}}$ follows an approximately log-normal distribution, with typical values between$10^{51}$ and$10^{54}$ erg, consistent with previous studies. The redshift distribution of long GRBs peaks at$z\sim 1$ –$2$ and declines rapidly at higher redshifts in the observed sample. In the intrinsic distribution, the GRB formation rate rises up to a critical redshift$z_c\sim 3$ and declines more gradually at higher z, characterized by indices$n_1 = 1.9$ and$n_2 = -0.4$ (see Eq. (3)). The steeper decline in the observed high-z tail results from the combined effect of two factors: (i) the intrinsic GRB formation rate itself declines at$z \gt 3$ (with index$n_2 = -0.4$ ), and (ii) the Swift/BAT detector sensitivity threshold preferentially suppresses faint, distant bursts, causing an additional reduction in the observed fraction of high-redshift events. These two contributions can be quantitatively distinguished by comparing the intrinsic redshift distribution (black solid line in Fig. 3) with the simulated detected distribution (red line in Fig. 3). The difference between the intrinsic and detected distributions at high redshifts directly quantifies the impact of instrumental selection effects, while the intrinsic shape reflects the underlying formation rate evolution. In our simulation, the intrinsic formation rate declines relatively slowly at high redshifts ($n_2 = -0.4$ ), whereas the observed distribution exhibits a much steeper decline, demonstrating that the detector sensitivity is the dominant factor shaping the high-redshift tail. -
Validating the simulated sample against observational data is crucial for assessing the reliability of the forward-modeling framework. All distributions in this section are presented as probability density functions; thus, the y-axis values represent event density per unit interval rather than raw counts. This normalization facilitates direct comparisons across samples of different sizes. Figure 2 shows the distributions of
$ \alpha^{\rm{PL}} $ ,$ J_0 $ , and their associated uncertainties, with the black solid line indicating the intrinsic distribution derived from the simulations.
Figure 2. (color online) The simulated and observed distributions of the spectral parameters
$ \alpha^{\rm{PL}} $ ,$ J_0 $ , and their relative uncertainties are shown. The red curves denote the simulated distributions of detected GRBs, and the blue curves represent the observed distributions from Swift/BAT. The black curves correspond to the intrinsic parameter distributions prior to detection, and, in the upper-left panel, the green curves show the Fermi/GBM observational data. For clarity when comparing the intrinsic distributions with the observational samples, the intrinsic curves are plotted against the right-hand y-axis.Because Swift/BAT operates in a relatively narrow energy band (15–150 keV), the observed prompt spectra of most GRBs correspond to the low-energy portion of the spectral function (e.g., the Band model [34]) and are therefore well described by a single power-law. The observed
$ \alpha^{\rm{PL}} $ distribution is relatively narrow, with most events clustered in the range$ -2.5 \lt \alpha^{\rm{PL}} \lt -1.0 $ and peaking at$ \alpha^{\rm{PL}} \simeq -1.7 $ , consistent with non-thermal emission processes such as synchrotron or inverse-Compton radiation. The normalization factor$J_0$ spans several orders of magnitude and exhibits an approximately log-normal distribution. This shape arises from the combination of two key physical factors: (1) Intrinsic luminosity diversity: the isotropic peak luminosity$L_{\mathrm{p}}$ spans a wide range ($\sim10^{50}$ –$10^{54}$ erg s−1) and is directly coupled to$J_0$ via the relation given in Eq. (8) (see Section II.A.3). Since$J_0$ is proportional to$L_{\mathrm{p}}$ divided by a distance factor, the broad distribution of$L_{\mathrm{p}}$ naturally maps to a broad distribution of$J_0$ ; (2) Cosmological distance effects (i.e., redshift effects): redshift z affects the observed$J_0$ through the luminosity distance$D_L(z)$ —for the same intrinsic luminosity, a burst at higher redshift yields a systematically lower observed$J_0$ . The combination of these two factors gives rise to the log-normal shape of the$J_0$ distribution, with its width reflecting both the diversity of intrinsic luminosities and the redshift distribution of the burst population.The simulated-detected and observed distributions of
$ \alpha^{\rm{PL}} $ and$ J_{0} $ , as well as their uncertainties, show good agreement, confirming that the simulation reproduces the statistical properties of the Swift/BAT sample [8]. However, the intrinsic$ \alpha^{\rm{PL}} $ distribution peaks at systematically harder values than those of the observed and detected samples. This shift arises from instrumental selection effects: GRBs with softer spectra produce higher photon fluxes within the BAT energy band and are therefore more likely to trigger the detector, while harder bursts emit a substantial fraction of their photons above the BAT band, reducing their detection probability [9]. As a result, the observed$ \alpha^{\rm{PL}} $ distribution is biased toward softer values.Notably, even when the same power-law spectral model is applied, significant discrepancies persist between the observational results from GBM and Swift/BAT [11]. This further demonstrates that systematic deviations between observed and intrinsic distributions are common across different instruments, primarily driven by the inherent selection effects of each detector.Figure 3 presents the simulated and observed distributions of
$ T_{\mathrm{90}} $ , total fluence, isotropic energy$ E_{\rm{iso}} $ , and redshift z. Swift/BAT employs a multi-timescale trigger system, including short windows optimized for short GRBs and longer windows designed for extended emission. However, due to the highly concentrated nature of short GRB emission, even dedicated short windows may not perfectly align with the burst, causing signal loss; moreover, short windows require higher significance thresholds to avoid false triggers from short-timescale background fluctuations, thereby reducing their detection efficiency. In contrast, long GRBs benefit from longer integration times that robustly accumulate photons across various window alignments, yielding higher signal-to-noise ratios. Consequently, long GRBs dominate the detected sample, and this study focuses exclusively on long GRBs. The observed fluence distribution is unimodal and approximately log-normal, with most events concentrated between$ 10^{-7} $ and$ 10^{-4} $ erg cm−2. This shape reflects the combined effects of the detector sensitivity threshold, which suppresses low-fluence events, and the intrinsic rarity of extremely bright bursts. In contrast, the intrinsic distribution exhibits a larger population of low-fluence events that are partially missed in observations, as well as a mild deficit of very bright bursts in the observed sample due to the finite field of view of Swift/ BAT.
Figure 3. (color online) We compare the distributions of
$ T_{\mathrm{90}} $ , fluence,$ E_{\mathrm{iso}} $ , and redshift for the simulated GRB population with those obtained from observations. For clarity when comparing the intrinsic distributions with the observational samples, the intrinsic curves are plotted against the right-hand y-axis.Using the empirical
$E_{\mathrm{iso}}$ -$L_{\mathrm{p}}$ relation given in Eq. (6), which was derived from long GRB samples and already incorporates the K-correction that converts the observed energy band ($ 15 $ –$ 150 $ keV) to the rest-frame band ($ 1 $ –$ 10^4 $ keV), we obtain the isotropic energy$ E_{\rm{iso}} $ for bursts in our sample. The derived$E_{\mathrm{iso}}$ follows an approximately log-normal distribution, with typical values between$10^{51}$ and$10^{54}$ erg, consistent with previous studies. The redshift distribution of long GRBs peaks at$z\sim 1$ –$2$ and declines rapidly at higher redshifts in the observed sample. In the intrinsic distribution, the GRB formation rate rises up to a critical redshift$z_c\sim 3$ and declines more gradually at higher z, characterized by indices$n_1 = 1.9$ and$n_2 = -0.4$ (see Eq. (3)). The steeper decline in the observed high-z tail results from the combined effect of two factors: (i) the intrinsic GRB formation rate itself declines at$z \gt 3$ (with index$n_2 = -0.4$ ), and (ii) the Swift/BAT detector sensitivity threshold preferentially suppresses faint, distant bursts, causing an additional reduction in the observed fraction of high-redshift events. These two contributions can be quantitatively distinguished by comparing the intrinsic redshift distribution (black solid line in Fig. 3) with the simulated detected distribution (red line in Fig. 3). The difference between the intrinsic and detected distributions at high redshifts directly quantifies the impact of instrumental selection effects, while the intrinsic shape reflects the underlying formation rate evolution. In our simulation, the intrinsic formation rate declines relatively slowly at high redshifts ($n_2 = -0.4$ ), whereas the observed distribution exhibits a much steeper decline, demonstrating that the detector sensitivity is the dominant factor shaping the high-redshift tail. -
Validating the simulated sample against observational data is crucial for assessing the reliability of the forward-modeling framework. All distributions in this section are presented as probability density functions; thus, the y-axis values represent event density per unit interval rather than raw counts. This normalization facilitates direct comparisons across samples of different sizes. Figure 2 shows the distributions of
$ \alpha^{\rm{PL}} $ ,$ J_0 $ , and their associated uncertainties, with the black solid line indicating the intrinsic distribution derived from the simulations.
Figure 2. (color online) The simulated and observed distributions of the spectral parameters
$ \alpha^{\rm{PL}} $ ,$ J_0 $ , and their relative uncertainties are shown. The red curves denote the simulated distributions of detected GRBs, and the blue curves represent the observed distributions from Swift/BAT. The black curves correspond to the intrinsic parameter distributions prior to detection, and, in the upper-left panel, the green curves show the Fermi/GBM observational data. For clarity when comparing the intrinsic distributions with the observational samples, the intrinsic curves are plotted against the right-hand y-axis.Because Swift/BAT operates in a relatively narrow energy band (15–150 keV), the observed prompt spectra of most GRBs correspond to the low-energy portion of the spectral function (e.g., the Band model [34]) and are therefore well described by a single power-law. The observed
$ \alpha^{\rm{PL}} $ distribution is relatively narrow, with most events clustered in the range$ -2.5 \lt \alpha^{\rm{PL}} \lt -1.0 $ and peaking at$ \alpha^{\rm{PL}} \simeq -1.7 $ , consistent with non-thermal emission processes such as synchrotron or inverse-Compton radiation. The normalization factor$J_0$ spans several orders of magnitude and exhibits an approximately log-normal distribution. This shape arises from the combination of two key physical factors: (1) Intrinsic luminosity diversity: the isotropic peak luminosity$L_{\mathrm{p}}$ spans a wide range ($\sim10^{50}$ –$10^{54}$ erg s−1) and is directly coupled to$J_0$ via the relation given in Eq. (8) (see Section II.A.3). Since$J_0$ is proportional to$L_{\mathrm{p}}$ divided by a distance factor, the broad distribution of$L_{\mathrm{p}}$ naturally maps to a broad distribution of$J_0$ ; (2) Cosmological distance effects (i.e., redshift effects): redshift z affects the observed$J_0$ through the luminosity distance$D_L(z)$ —for the same intrinsic luminosity, a burst at higher redshift yields a systematically lower observed$J_0$ . The combination of these two factors gives rise to the log-normal shape of the$J_0$ distribution, with its width reflecting both the diversity of intrinsic luminosities and the redshift distribution of the burst population.The simulated-detected and observed distributions of
$ \alpha^{\rm{PL}} $ and$ J_{0} $ , as well as their uncertainties, show good agreement, confirming that the simulation reproduces the statistical properties of the Swift/BAT sample[8]. However, the intrinsic$ \alpha^{\rm{PL}} $ distribution peaks at systematically harder values than those of the observed and detected samples. This shift arises from instrumental selection effects: GRBs with softer spectra produce higher photon fluxes within the BAT energy band and are therefore more likely to trigger the detector, while harder bursts emit a substantial fraction of their photons above the BAT band, reducing their detection probability[9]. As a result, the observed$ \alpha^{\rm{PL}} $ distribution is biased toward softer values.Notably, even when the same power-law spectral model is applied, significant discrepancies persist between the observational results from GBM and Swift/BAT[11]. This further demonstrates that systematic deviations between observed and intrinsic distributions are common across different instruments, primarily driven by the inherent selection effects of each detector.Figure 3 presents the simulated and observed distributions of
$ T_{\mathrm{90}} $ , total fluence, isotropic energy$ E_{\rm{iso}} $ , and redshift z. Swift/BAT employs a multi-timescale trigger system, including short windows optimized for short GRBs and longer windows designed for extended emission. However, due to the highly concentrated nature of short GRB emission, even dedicated short windows may not perfectly align with the burst, causing signal loss; moreover, short windows require higher significance thresholds to avoid false triggers from short-timescale background fluctuations, thereby reducing their detection efficiency. In contrast, long GRBs benefit from longer integration times that robustly accumulate photons across various window alignments, yielding higher signal-to-noise ratios. Consequently, long GRBs dominate the detected sample, and this study focuses exclusively on long GRBs. The observed fluence distribution is unimodal and approximately log-normal, with most events concentrated between$ 10^{-7} $ and$ 10^{-4} $ erg cm−2. This shape reflects the combined effects of the detector sensitivity threshold, which suppresses low-fluence events, and the intrinsic rarity of extremely bright bursts. In contrast, the intrinsic distribution exhibits a larger population of low-fluence events that are partially missed in observations, as well as a mild deficit of very bright bursts in the observed sample due to the finite field of view of Swift/BAT.
Figure 3. (color online) We compare the distributions of
$ T_{\mathrm{90}} $ , fluence,$ E_{\mathrm{iso}} $ , and redshift for the simulated GRB population with those obtained from observations. For clarity when comparing the intrinsic distributions with the observational samples, the intrinsic curves are plotted against the right-hand y-axis.Using the empirical
$E_{\mathrm{iso}}$ -$L_{\mathrm{p}}$ relation given in Equation (6), which was derived from long GRB samples and already incorporates the K-correction that converts the observed energy band ($ 15 $ –$ 150 $ keV) to the rest-frame band ($ 1 $ –$ 10^4 $ keV), we obtain the isotropic energy$ E_{\rm{iso}} $ for bursts in our sample. The derived$E_{\mathrm{iso}}$ follows an approximately log-normal distribution, with typical values between$10^{51}$ and$10^{54}$ erg, consistent with previous studies. The redshift distribution of long GRBs peaks at$z\sim 1$ –$2$ and declines rapidly at higher redshifts in the observed sample. In the intrinsic distribution, the GRB formation rate rises up to a critical redshift$z_c\sim 3$ and declines more gradually at higher z, characterized by indices$n_1 = 1.9$ and$n_2 = -0.4$ (see Equation (3)). The steeper decline in the observed high-z tail results from the combined effect of two factors: (i) the intrinsic GRB formation rate itself declines at$z \gt 3$ (with index$n_2 = -0.4$ ), and (ii) the Swift/BAT detector sensitivity threshold preferentially suppresses faint, distant bursts, causing an additional reduction in the observed fraction of high-redshift events. These two contributions can be quantitatively distinguished by comparing the intrinsic redshift distribution (black solid line in Figure 3) with the simulated detected distribution (red line in Figure 3). The difference between the intrinsic and detected distributions at high redshifts directly quantifies the impact of instrumental selection effects, while the intrinsic shape reflects the underlying formation rate evolution. In our simulation, the intrinsic formation rate declines relatively slowly at high redshifts ($n_2 = -0.4$ ), whereas the observed distribution exhibits a much steeper decline, demonstrating that the detector sensitivity is the dominant factor shaping the high-redshift tail. -
Validating the simulated sample against observational data is crucial for assessing the reliability of the forward-modeling framework. All distributions in this section are presented as probability density functions; thus, the y-axis values represent event density per unit interval rather than raw counts. This normalization facilitates direct comparisons across samples of different sizes. Figure 2 shows the distributions of
$ \alpha^{\rm{PL}} $ ,$ J_0 $ , and their associated uncertainties, with the black solid line indicating the intrinsic distribution derived from the simulations.
Figure 2. (color online) The simulated and observed distributions of the spectral parameters
$ \alpha^{\rm{PL}} $ ,$ J_0 $ , and their relative uncertainties are shown. The red curves denote the simulated distributions of detected GRBs, and the blue curves represent the observed distributions from Swift/BAT. The black curves correspond to the intrinsic parameter distributions prior to detection, and, in the upper-left panel, the green curves show the Fermi/GBM observational data. For clarity when comparing the intrinsic distributions with the observational samples, the intrinsic curves are plotted against the right-hand y-axis.Because Swift/BAT operates in a relatively narrow energy band (15–150 keV), the observed prompt spectra of most GRBs correspond to the low-energy portion of the spectral function (e.g., the Band model [34]) and are therefore well described by a single power-law. The observed
$ \alpha^{\rm{PL}} $ distribution is relatively narrow, with most events clustered in the range$ -2.5 \lt \alpha^{\rm{PL}} \lt -1.0 $ and peaking at$ \alpha^{\rm{PL}} \simeq -1.7 $ , consistent with non-thermal emission processes such as synchrotron or inverse-Compton radiation. The normalization factor$J_0$ spans several orders of magnitude and exhibits an approximately log-normal distribution. This shape arises from the combination of two key physical factors: (1) Intrinsic luminosity diversity: the isotropic peak luminosity$L_{\mathrm{p}}$ spans a wide range ($\sim10^{50}$ –$10^{54}$ erg s−1) and is directly coupled to$J_0$ via the relation given in Eq. (8) (see Section II.A.3). Since$J_0$ is proportional to$L_{\mathrm{p}}$ divided by a distance factor, the broad distribution of$L_{\mathrm{p}}$ naturally maps to a broad distribution of$J_0$ ; (2) Cosmological distance effects (i.e., redshift effects): redshift z affects the observed$J_0$ through the luminosity distance$D_L(z)$ —for the same intrinsic luminosity, a burst at higher redshift yields a systematically lower observed$J_0$ . The combination of these two factors gives rise to the log-normal shape of the$J_0$ distribution, with its width reflecting both the diversity of intrinsic luminosities and the redshift distribution of the burst population.The simulated-detected and observed distributions of
$ \alpha^{\rm{PL}} $ and$ J_{0} $ , as well as their uncertainties, show good agreement, confirming that the simulation reproduces the statistical properties of the Swift/BAT sample [8]. However, the intrinsic$ \alpha^{\rm{PL}} $ distribution peaks at systematically harder values than those of the observed and detected samples. This shift arises from instrumental selection effects: GRBs with softer spectra produce higher photon fluxes within the BAT energy band and are therefore more likely to trigger the detector, while harder bursts emit a substantial fraction of their photons above the BAT band, reducing their detection probability [9]. As a result, the observed$ \alpha^{\rm{PL}} $ distribution is biased toward softer values.Notably, even when the same power-law spectral model is applied, significant discrepancies persist between the observational results from GBM and Swift/BAT [11]. This further demonstrates that systematic deviations between observed and intrinsic distributions are common across different instruments, primarily driven by the inherent selection effects of each detector.Figure 3 presents the simulated and observed distributions of
$ T_{\mathrm{90}} $ , total fluence, isotropic energy$ E_{\rm{iso}} $ , and redshift z. Swift/BAT employs a multi-timescale trigger system, including short windows optimized for short GRBs and longer windows designed for extended emission. However, due to the highly concentrated nature of short GRB emission, even dedicated short windows may not perfectly align with the burst, causing signal loss; moreover, short windows require higher significance thresholds to avoid false triggers from short-timescale background fluctuations, thereby reducing their detection efficiency. In contrast, long GRBs benefit from longer integration times that robustly accumulate photons across various window alignments, yielding higher signal-to-noise ratios. Consequently, long GRBs dominate the detected sample, and this study focuses exclusively on long GRBs. The observed fluence distribution is unimodal and approximately log-normal, with most events concentrated between$ 10^{-7} $ and$ 10^{-4} $ erg cm−2. This shape reflects the combined effects of the detector sensitivity threshold, which suppresses low-fluence events, and the intrinsic rarity of extremely bright bursts. In contrast, the intrinsic distribution exhibits a larger population of low-fluence events that are partially missed in observations, as well as a mild deficit of very bright bursts in the observed sample due to the finite field of view of Swift/ BAT.
Figure 3. (color online) We compare the distributions of
$ T_{\mathrm{90}} $ , fluence,$ E_{\mathrm{iso}} $ , and redshift for the simulated GRB population with those obtained from observations. For clarity when comparing the intrinsic distributions with the observational samples, the intrinsic curves are plotted against the right-hand y-axis.Using the empirical
$E_{\mathrm{iso}}$ -$L_{\mathrm{p}}$ relation given in Eq. (6), which was derived from long GRB samples and already incorporates the K-correction that converts the observed energy band ($ 15 $ –$ 150 $ keV) to the rest-frame band ($ 1 $ –$ 10^4 $ keV), we obtain the isotropic energy$ E_{\rm{iso}} $ for bursts in our sample. The derived$E_{\mathrm{iso}}$ follows an approximately log-normal distribution, with typical values between$10^{51}$ and$10^{54}$ erg, consistent with previous studies. The redshift distribution of long GRBs peaks at$z\sim 1$ –$2$ and declines rapidly at higher redshifts in the observed sample. In the intrinsic distribution, the GRB formation rate rises up to a critical redshift$z_c\sim 3$ and declines more gradually at higher z, characterized by indices$n_1 = 1.9$ and$n_2 = -0.4$ (see Eq. (3)). The steeper decline in the observed high-z tail results from the combined effect of two factors: (i) the intrinsic GRB formation rate itself declines at$z \gt 3$ (with index$n_2 = -0.4$ ), and (ii) the Swift/BAT detector sensitivity threshold preferentially suppresses faint, distant bursts, causing an additional reduction in the observed fraction of high-redshift events. These two contributions can be quantitatively distinguished by comparing the intrinsic redshift distribution (black solid line in Fig. 3) with the simulated detected distribution (red line in Fig. 3). The difference between the intrinsic and detected distributions at high redshifts directly quantifies the impact of instrumental selection effects, while the intrinsic shape reflects the underlying formation rate evolution. In our simulation, the intrinsic formation rate declines relatively slowly at high redshifts ($n_2 = -0.4$ ), whereas the observed distribution exhibits a much steeper decline, demonstrating that the detector sensitivity is the dominant factor shaping the high-redshift tail. -
The peak luminosity
$ L_{\rm{p}} $ of GRBs in the Swift/BAT sample spans the broad range$ \sim 10^{50} $ –$ 10^{54} $ erg s−1 and can be characterized by either a power-law-like or an approximately log-normal distribution. Because the BAT trigger threshold depends primarily on instantaneous peak photon flux, the number of detected GRBs with low$ L_{\rm{p}} $ is strongly suppressed, as illustrated by the intrinsic distribution in Fig. 4.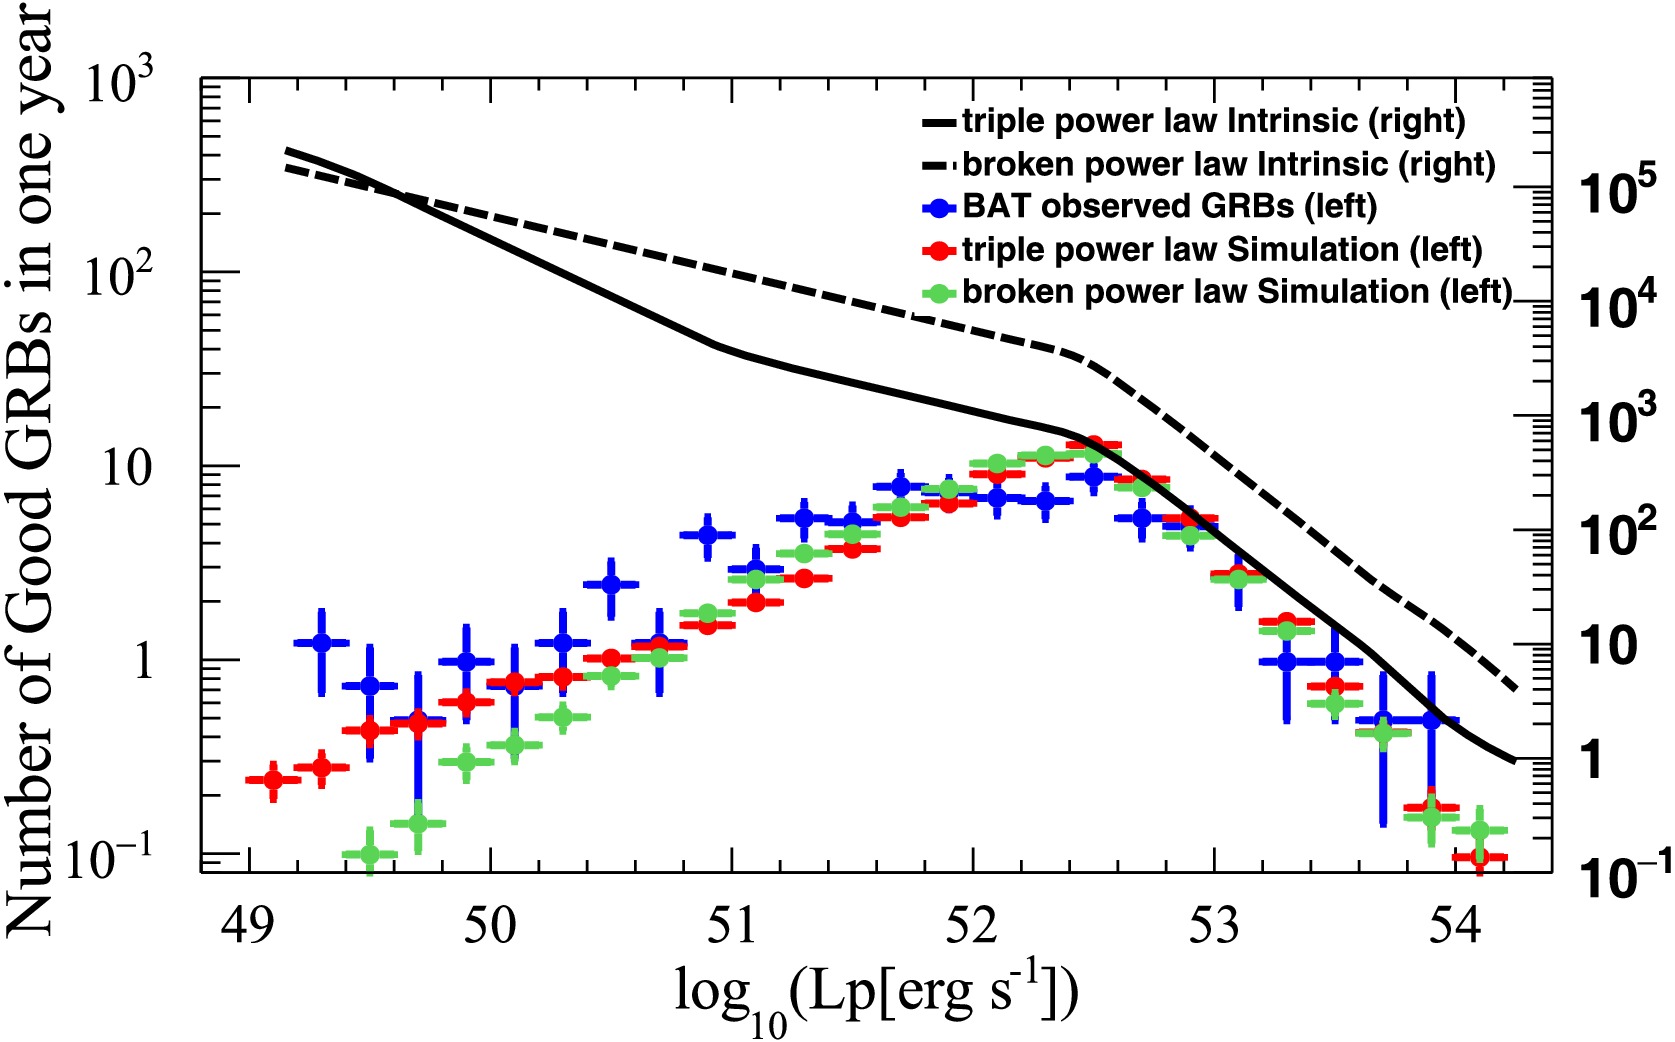
Figure 4. (color online) The distribution of the GRB peak luminosity,
$ L_{\rm{p}} $ , observed by Swift/BAT (blue points) is compared with simulated detections (red points) and with the assumed intrinsic distribution (black solid line) derived from a triple-power-law luminosity function. For comparison, we also show the simulated$ L_{\rm{p}} $ distribution (green points) and the corresponding intrinsic distribution (black dashed line) derived from a double-power-law luminosity function.For the Swift/BAT observations, a three-segment broken power-law luminosity function provides a substantially better fit than simpler functional forms. A notable feature is the apparent excess of low-luminosity events (
$ L_{\rm{p}} \lesssim 10^{50} $ erg s$ ^{-1} $ ), which can be attributed largely to instrumental selection effects. Swift/BAT is particularly sensitive to soft-spectrum, low-luminosity GRBs that are detectable only at relatively small distances. Owing to its lower trigger threshold compared with instruments such as Fermi/GBM, Swift preferentially detects nearby, intrinsically faint bursts, thereby elevating the low-luminosity end of the observed distribution.In addition, some low-luminosity GRBs may constitute a distinct population with an event rate that differs from that of classical high-luminosity GRBs [35−37]. These events are often characterized by longer durations and lower jet Lorentz factors; BAT's low-energy response (15–150 keV) further enhances its sensitivity to this population. Our simulations successfully reproduce the observed low-luminosity excess using the same three-segment broken power-law luminosity function, whereas a double-power-law model fails to capture the observed features, supporting the validity of our adopted luminosity function.
Notably, in the distributions of observed GRB parameters (e.g.,
$T_{90}$ , fluence,$L_p$ ), bursts with low$T_{90}$ , low fluence, and low luminosity exhibit clustering in parameter space. This may suggest the existence of a third class of bursts in addition to the traditional long and short GRBs, consistent with previous studies [38−41]. If such a third class exists, it could significantly improve the agreement between the simulation results and actual observations. This is primarily because these bursts generally have low fluxes and are detected mainly via weak signals near the detector threshold. Consequently, they would contribute more events in the flux regime close to the detector sensitivity, thereby modifying the statistical distribution of the simulated sample at the low-flux or near-threshold end and making it more consistent with actual observations. This possibility warrants further investigation in future work, combining more detailed detector-response models and more complete samples. -
The peak luminosity
$ L_{\rm{p}} $ of GRBs in the Swift/BAT sample spans the broad range$ \sim 10^{50} $ –$ 10^{54} $ erg s−1 and can be characterized by either a power-law-like or an approximately log-normal distribution. Because the BAT trigger threshold depends primarily on instantaneous peak photon flux, the number of detected GRBs with low$ L_{\rm{p}} $ is strongly suppressed, as illustrated by the intrinsic distribution in Fig. 4.
Figure 4. (color online) The distribution of the GRB peak luminosity,
$ L_{\rm{p}} $ , observed by Swift/BAT (blue points) is compared with simulated detections (red points) and with the assumed intrinsic distribution (black solid line) derived from a triple-power-law luminosity function. For comparison, we also show the simulated$ L_{\rm{p}} $ distribution (green points) and the corresponding intrinsic distribution (black dashed line) derived from a double-power-law luminosity function.For the Swift/BAT observations, a three-segment broken power-law luminosity function provides a substantially better fit than simpler functional forms. A notable feature is the apparent excess of low-luminosity events (
$ L_{\rm{p}} \lesssim 10^{50} $ erg s$ ^{-1} $ ), which can be attributed largely to instrumental selection effects. Swift/BAT is particularly sensitive to soft-spectrum, low-luminosity GRBs that are detectable only at relatively small distances. Owing to its lower trigger threshold compared with instruments such as Fermi/GBM, Swift preferentially detects nearby, intrinsically faint bursts, thereby elevating the low-luminosity end of the observed distribution.In addition, some low-luminosity GRBs may constitute a distinct population with an event rate that differs from that of classical high-luminosity GRBs [35−37]. These events are often characterized by longer durations and lower jet Lorentz factors; BAT's low-energy response (15–150 keV) further enhances its sensitivity to this population. Our simulations successfully reproduce the observed low-luminosity excess using the same three-segment broken power-law luminosity function, whereas a double-power-law model fails to capture the observed features, supporting the validity of our adopted luminosity function.
Notably, in the distributions of observed GRB parameters (e.g.,
$T_{90}$ , fluence,$L_p$ ), bursts with low$T_{90}$ , low fluence, and low luminosity exhibit clustering in parameter space. This may suggest the existence of a third class of bursts in addition to the traditional long and short GRBs, consistent with previous studies [38−41]. If such a third class exists, it could significantly improve the agreement between the simulation results and actual observations. This is primarily because these bursts generally have low fluxes and are detected mainly via weak signals near the detector threshold. Consequently, they would contribute more events in the flux regime close to the detector sensitivity, thereby modifying the statistical distribution of the simulated sample at the low-flux or near-threshold end and making it more consistent with actual observations. This possibility warrants further investigation in future work, combining more detailed detector-response models and more complete samples. -
The peak luminosity
$ L_{\rm{p}} $ of GRBs in the Swift/BAT sample spans the broad range$ \sim 10^{50} $ –$ 10^{54} $ erg s−1 and can be characterized by either a power-law-like or an approximately log-normal distribution. Because the BAT trigger threshold depends primarily on instantaneous peak photon flux, the number of detected GRBs with low$ L_{\rm{p}} $ is strongly suppressed, as illustrated by the intrinsic distribution in Fig. 4.
Figure 4. (color online) The distribution of the GRB peak luminosity,
$ L_{\rm{p}} $ , observed by Swift/BAT (blue points) is compared with simulated detections (red points) and with the assumed intrinsic distribution (black solid line) derived from a triple-power-law luminosity function. For comparison, we also show the simulated$ L_{\rm{p}} $ distribution (green points) and the corresponding intrinsic distribution (black dashed line) derived from a double-power-law luminosity function.For the Swift/BAT observations, a three-segment broken power-law luminosity function provides a substantially better fit than simpler functional forms. A notable feature is the apparent excess of low-luminosity events (
$ L_{\rm{p}} \lesssim 10^{50} $ erg s$ ^{-1} $ ), which can be attributed largely to instrumental selection effects. Swift/BAT is particularly sensitive to soft-spectrum, low-luminosity GRBs that are detectable only at relatively small distances. Owing to its lower trigger threshold compared with instruments such as Fermi/GBM, Swift preferentially detects nearby, intrinsically faint bursts, thereby elevating the low-luminosity end of the observed distribution.In addition, some low-luminosity GRBs may constitute a distinct population with an event rate that differs from that of classical high-luminosity GRBs [35−37]. These events are often characterized by longer durations and lower jet Lorentz factors; BAT's low-energy response (15–150 keV) further enhances its sensitivity to this population. Our simulations successfully reproduce the observed low-luminosity excess using the same three-segment broken power-law luminosity function, whereas a double-power-law model fails to capture the observed features, supporting the validity of our adopted luminosity function.
Notably, in the distributions of observed GRB parameters (e.g.,
$T_{90}$ , fluence,$L_p$ ), bursts with low$T_{90}$ , low fluence, and low luminosity exhibit clustering in parameter space. This may suggest the existence of a third class of bursts in addition to the traditional long and short GRBs, consistent with previous studies [38−41]. If such a third class exists, it could significantly improve the agreement between the simulation results and actual observations. This is primarily because these bursts generally have low fluxes and are detected mainly via weak signals near the detector threshold. Consequently, they would contribute more events in the flux regime close to the detector sensitivity, thereby modifying the statistical distribution of the simulated sample at the low-flux or near-threshold end and making it more consistent with actual observations. This possibility warrants further investigation in future work, combining more detailed detector-response models and more complete samples. -
The peak luminosity
$ L_{\rm{p}} $ of GRBs in the Swift/BAT sample spans the broad range$ \sim 10^{50} $ –$ 10^{54} $ erg s−1 and can be characterized by either a power-law-like or an approximately log-normal distribution. Because the BAT trigger threshold depends primarily on instantaneous peak photon flux, the number of detected GRBs with low$ L_{\rm{p}} $ is strongly suppressed, as illustrated by the intrinsic distribution in Figure 4.
Figure 4. (color online) The distribution of the GRB peak luminosity,
$ L_{\rm{p}} $ , observed by Swift/BAT (blue points) is compared with simulated detections (red points) and with the assumed intrinsic distribution (black solid line) derived from a triple-power-law luminosity function. For comparison, we also show the simulated$ L_{\rm{p}} $ distribution (green points) and the corresponding intrinsic distribution (black dashed line) derived from a double-power-law luminosity function.For the Swift/BAT observations, a three-segment broken power-law luminosity function provides a substantially better fit than simpler functional forms. A notable feature is the apparent excess of low-luminosity events (
$ L_{\rm{p}} \lesssim 10^{50} $ erg s$ ^{-1} $ ), which can be attributed largely to instrumental selection effects. Swift/BAT is particularly sensitive to soft-spectrum, low-luminosity GRBs that are detectable only at relatively small distances. Owing to its lower trigger threshold compared with instruments such as Fermi/GBM, Swift preferentially detects nearby, intrinsically faint bursts, thereby elevating the low-luminosity end of the observed distribution.In addition, some low-luminosity GRBs may constitute a distinct population with an event rate that differs from that of classical high-luminosity GRBs [35−37]. These events are often characterized by longer durations and lower jet Lorentz factors; BAT's low-energy response (15–150 keV) further enhances its sensitivity to this population. Our simulations successfully reproduce the observed low-luminosity excess using the same three-segment broken power-law luminosity function, whereas a double-power-law model fails to capture the observed features, supporting the validity of our adopted luminosity function.
Notably, in the distributions of observed GRB parameters (e.g.,
$T_{90}$ , fluence,$L_p$ ), bursts with low$T_{90}$ , low fluence, and low luminosity exhibit clustering in parameter space. This may suggest the existence of a third class of bursts in addition to the traditional long and short GRBs, consistent with previous studies [38−41]. If such a third class exists, it could significantly improve the agreement between the simulation results and actual observations. This is primarily because these bursts generally have low fluxes and are detected mainly via weak signals near the detector threshold. Consequently, they would contribute more events in the flux regime close to the detector sensitivity, thereby modifying the statistical distribution of the simulated sample at the low-flux or near-threshold end and making it more consistent with actual observations. This possibility warrants further investigation in future work, combining more detailed detector-response models and more complete samples. -
Determining the intrinsic distributions of GRB parameters is essential for understanding their progenitors, jet physics, and cosmological evolution. In this work, we present a self-consistent forward-modeling analysis of the intrinsic properties of long GRBs based on Swift/BAT observations, implemented with the Monte Carlo simulation framework GodEyes. The pipeline explicitly models the Swift/BAT detector response and triggering process, allowing detection, spectral fitting, and selection effects to be treated in a manner that closely aligns with real observations.
Using a cosmological GRB population model that incorporates comoving volume effects, time dilation, and an empirically motivated broken power-law GRB formation rate, we generate synthetic GRB samples and validate them against multiple observed distributions, including photon peak flux,
$ T_{90} $ , fluence,$ E_{\rm{iso}} $ , redshift, spectral index$ \alpha_{\rm{PL}} $ , and peak luminosity. The intrinsic peak-luminosity function is best described by a three-segment broken power law, which naturally reproduces the observed low-luminosity excess in the Swift/BAT sample.Our results demonstrate that the observed Swift/BAT GRB distributions are strongly influenced by instrumental selection effects. In particular, the turnover of the photon peak-flux distribution at
$ P<1 $ ph cm−2 s−1 results from a combination of cosmological redshifting, declining detector sensitivity, and flux-dependent triggering probability. After correcting for these biases, the inferred intrinsic$ \alpha_{\rm{PL}} $ distribution is systematically harder than that derived directly from observations, indicating that Swift/BAT misses a significant fraction of hard-spectrum bursts. The presence of an intrinsic low-$ L_{\rm{p}} $ GRB population is further supported by the improved performance of the triple power-law luminosity function relative to simpler models.Overall, this work establishes a robust forward-modeling pipeline for recovering intrinsic GRB population properties and provides a reliable baseline for theoretical studies of GRB progenitors and jet dynamics. The framework can be readily extended to joint analyses of multiple instruments (e.g., Fermi/GBM and LAT), thereby offering improved constraints on faint, distant, or optically dark GRBs.
-
Determining the intrinsic distributions of GRB parameters is essential for understanding their progenitors, jet physics, and cosmological evolution. In this work, we present a self-consistent forward-modeling analysis of the intrinsic properties of long GRBs based on Swift/BAT observations, implemented with the Monte Carlo simulation framework GodEyes. The pipeline explicitly models the Swift/BAT detector response and triggering process, allowing detection, spectral fitting, and selection effects to be treated in a manner that closely aligns with real observations.
Using a cosmological GRB population model that incorporates comoving volume effects, time dilation, and an empirically motivated broken power-law GRB formation rate, we generate synthetic GRB samples and validate them against multiple observed distributions, including photon peak flux,
$ T_{90} $ , fluence,$ E_{\rm{iso}} $ , redshift, spectral index$ \alpha_{\rm{PL}} $ , and peak luminosity. The intrinsic peak-luminosity function is best described by a three-segment broken power law, which naturally reproduces the observed low-luminosity excess in the Swift/BAT sample.Our results demonstrate that the observed Swift/BAT GRB distributions are strongly influenced by instrumental selection effects. In particular, the turnover of the photon peak-flux distribution at
$ P<1 $ ph cm−2 s−1 results from a combination of cosmological redshifting, declining detector sensitivity, and flux-dependent triggering probability. After correcting for these biases, the inferred intrinsic$ \alpha_{\rm{PL}} $ distribution is systematically harder than that derived directly from observations, indicating that Swift/ BAT misses a significant fraction of hard-spectrum bursts. The presence of an intrinsic low-$ L_{\rm{p}} $ GRB population is further supported by the improved performance of the triple power-law luminosity function relative to simpler models.Overall, this work establishes a robust forward-modeling pipeline for recovering intrinsic GRB population properties and provides a reliable baseline for theoretical studies of GRB progenitors and jet dynamics. The framework can be readily extended to joint analyses of multiple instruments (e.g., Fermi/GBM and LAT), thereby offering improved constraints on faint, distant, or optically dark GRBs.
-
Determining the intrinsic distributions of GRB parameters is essential for understanding their progenitors, jet physics, and cosmological evolution. In this work, we present a self-consistent forward-modeling analysis of the intrinsic properties of long GRBs based on Swift/BAT observations, implemented with the Monte Carlo simulation framework GodEyes. The pipeline explicitly models the Swift/BAT detector response and triggering process, allowing detection, spectral fitting, and selection effects to be treated in a manner that closely aligns with real observations.
Using a cosmological GRB population model that incorporates comoving volume effects, time dilation, and an empirically motivated broken power-law GRB formation rate, we generate synthetic GRB samples and validate them against multiple observed distributions, including photon peak flux,
$ T_{90} $ , fluence,$ E_{\rm{iso}} $ , redshift, spectral index$ \alpha_{\rm{PL}} $ , and peak luminosity. The intrinsic peak-luminosity function is best described by a three-segment broken power law, which naturally reproduces the observed low-luminosity excess in the Swift/BAT sample.Our results demonstrate that the observed Swift/BAT GRB distributions are strongly influenced by instrumental selection effects. In particular, the turnover of the photon peak-flux distribution at
$ P<1 $ ph cm−2 s−1 results from a combination of cosmological redshifting, declining detector sensitivity, and flux-dependent triggering probability. After correcting for these biases, the inferred intrinsic$ \alpha_{\rm{PL}} $ distribution is systematically harder than that derived directly from observations, indicating that Swift/ BAT misses a significant fraction of hard-spectrum bursts. The presence of an intrinsic low-$ L_{\rm{p}} $ GRB population is further supported by the improved performance of the triple power-law luminosity function relative to simpler models.Overall, this work establishes a robust forward-modeling pipeline for recovering intrinsic GRB population properties and provides a reliable baseline for theoretical studies of GRB progenitors and jet dynamics. The framework can be readily extended to joint analyses of multiple instruments (e.g., Fermi/GBM and LAT), thereby offering improved constraints on faint, distant, or optically dark GRBs.
-
Determining the intrinsic distributions of GRB parameters is essential for understanding their progenitors, jet physics, and cosmological evolution. In this work, we present a self-consistent forward-modeling analysis of the intrinsic properties of long GRBs based on Swift/BAT observations, implemented with the Monte Carlo simulation framework GodEyes. The pipeline explicitly models the Swift/BAT detector response and triggering process, allowing detection, spectral fitting, and selection effects to be treated in a manner that closely aligns with real observations.
Using a cosmological GRB population model that incorporates comoving volume effects, time dilation, and an empirically motivated broken power-law GRB formation rate, we generate synthetic GRB samples and validate them against multiple observed distributions, including photon peak flux,
$ T_{90} $ , fluence,$ E_{\rm{iso}} $ , redshift, spectral index$ \alpha_{\rm{PL}} $ , and peak luminosity. The intrinsic peak-luminosity function is best described by a three-segment broken power law, which naturally reproduces the observed low-luminosity excess in the Swift/BAT sample.Our results demonstrate that the observed Swift/BAT GRB distributions are strongly influenced by instrumental selection effects. In particular, the turnover of the photon peak-flux distribution at
$ P<1 $ ph cm−2 s−1 results from a combination of cosmological redshifting, declining detector sensitivity, and flux-dependent triggering probability. After correcting for these biases, the inferred intrinsic$ \alpha_{\rm{PL}} $ distribution is systematically harder than that derived directly from observations, indicating that Swift/ BAT misses a significant fraction of hard-spectrum bursts. The presence of an intrinsic low-$ L_{\rm{p}} $ GRB population is further supported by the improved performance of the triple power-law luminosity function relative to simpler models.Overall, this work establishes a robust forward-modeling pipeline for recovering intrinsic GRB population properties and provides a reliable baseline for theoretical studies of GRB progenitors and jet dynamics. The framework can be readily extended to joint analyses of multiple instruments (e.g., Fermi/GBM and LAT), thereby offering improved constraints on faint, distant, or optically dark GRBs.
Intrinsic distribution of Gamma-Ray Bursts (II): insights from Swift/BAT observations
- Received Date: 2026-02-28
- Available Online: 2026-07-15
Abstract: We investigate the intrinsic distributions of key Gamma-Ray Burst (GRB) parameters that are essential to understanding the physics of their central engines, radiation mechanisms, and cosmological evolution. Using our independently developed GodEyes Monte Carlo framework, we generate synthetic long-GRB samples tailored to the Swift/BAT detector and explicitly incorporate instrumental selection effects. In particular, we account for the loss of low-peak-flux events due to the detector's sensitivity threshold, thereby enabling consistent comparisons between theoretical models and observations. Our results constrain the intrinsic distributions of several fundamental properties, including redshift, peak luminosity, isotropic energy, and related quantities. We find that the inferred intrinsic distribution of the spectral index $ \alpha^{\rm{PL}}$ deviates significantly from that derived from the observed sample. Moreover, we identify an excess of low-luminosity GRBs and show that a triple power-law luminosity function provides a substantially improved description of the data. By establishing a complete forward-modeling and validation pipeline, this work underscores the importance of accounting for observational biases and lays the groundwork for future tests with upcoming detections of faint and optically dark GRBs.



 DownLoad: