


 Abstract
 HTML
HTML Reference
 Related
 PDF
PDF


-
The neutron capture cross section is a physical parameter that describes the probability of capture reactions between neutrons and atomic nuclei [1]. In fundamental physics, the resonance structures of neutron capture cross sections are used to test the shell model [2] and statistical nuclear models. For neutron-rich nuclides far from the line of stability, studying these cross sections is vital for improving nuclear mass formulas and understanding nuclear forces [3]. In the field of nucleosynthesis, approximately half of the elements heavier than iron are produced via the slow neutron capture process (s-process) [4]. The capture cross section determines the equilibrium abundance of nuclides along the nucleosynthesis path. Therefore, accurate data are essential for stellar evolution models and for understanding heavy element production in extreme events such as neutron star mergers [5]. In nuclear energy applications, neutron capture data are critical for nuclear reactor criticality safety, neutron economy assessment, and fuel burn-up analysis. For Generation IV advanced nuclear systems, precise cross sections of minor actinides and long-lived fission products provide the physical basis for nuclear waste transmutation and reduction of long-term radiotoxicity [6].
In practice, many key nuclides have capture cross sections at the milli-barn scale or lower, posing significant measurement challenges. Signals from such small cross sections are extremely weak and are easily overwhelmed by background. These experiments require high-flux neutron sources to ensure sufficient statistics and an improved signal-to-background (S/B) ratio within a reasonable time frame.
$ \text{C}_6\text{D}_6 $ detectors are widely used for neutron capture cross section measurements owing to their excellent timing resolution and low neutron sensitivity [7]. At the n_TOF facility, these detectors have been successfully employed to measure a broad range of capture cross sections, from resonance-rich heavy isotopes to isotopes with low cross sections [8−11]. Currently, the Back-n white neutron facility of the China Spallation Neutron Source (CSNS) provides a high-flux beam for neutron capture experiments. The primary setups for capture measurements at Back-n are the$ \text{C}_6\text{D}_6 $ detectors and the Gamma Total Absorption Facility (GTAF). GTAF offers high detection efficiency and near-$ 4\pi $ solid angle coverage, but it faces challenges such as complex background analysis and difficulties in precise efficiency determination [12−14]. In contrast, the$ \text{C}_6\text{D}_6 $ detectors offer superior background suppression and a standardized analysis workflow [15]. However, previous studies at Back-n have mainly focused on nuclides with high cross sections ($ 0.1 $ to$ 10^4 $ barns) [16−21]. Measurements at the milli-barn scale have not yet been reported. Therefore, it is essential to investigate the feasibility of using$ \text{C}_6\text{D}_6 $ detectors for low neutron capture cross section measurements at Back-n.This study was performed at the Back-n white neutron facility of CSNS.
$ \text{C}_6\text{D}_6 $ detectors were used to measure neutron capture cross sections at the milli-barn scale.$ ^{209}\text{Bi} $ was selected as an ideal probe for low cross section measurements because it is monoisotopic, and high-purity targets are easy to prepare. The average capture cross section of$ ^{209}\text{Bi} $ ranges from the mb to b scales. In addition, measurements of its capture cross section provide essential support for nuclear reactor safety assessments and astrophysical s-process nucleosynthesis calculations near the termination point [22, 23]. The experimental data were analyzed using the time-of-flight (TOF) method and the pulse height weighting technique (PHWT). Systematic backgrounds were subtracted using measurements from a carbon sample and an empty sample holder. The influence of different energy binnings on the experimental results has also been investigated. -
The neutron capture cross section is a physical parameter describing the probability of capture reactions between neutrons and atomic nuclei[1]. In fundamental physics, the resonance structures of neutron capture cross sections are used to test the shell model [2] and statistical nuclear models. For neutron-rich nuclides far from the line of stability, studying these cross sections is vital for improving nuclear mass formulas and understanding nuclear forces [3]. In the field of nucleosynthesis, about half of the elements heavier than iron are produced via the slow neutron capture process (s-process) [4]. The capture cross section determines the equilibrium abundance of nuclides along the nucleosynthesis path. Therefore, accurate data are essential for stellar evolution models and for understanding heavy element production in extreme events such as neutron star mergers [5]. In nuclear energy applications, neutron capture data are critical for nuclear reactor criticality safety, neutron economy assessment, and fuel burn-up analysis. For Generation IV advanced nuclear systems, precise cross sections of minor actinides and long-lived fission products provide the physical basis for nuclear waste transmutation and the reduction of long-term radiotoxicity [6].
In practice, many key nuclides have capture cross sections at the milli-barn scale or lower, posing significant measurement challenges. Signals from such small cross sections are extremely weak and easily overwhelmed by background. These experiments require high-flux neutron sources to ensure sufficient statistics and an improved signal-to-background ratio within a reasonable timeframe.
$ \text{C}_6\text{D}_6 $ detectors are widely used for neutron capture cross section measurements due to their excellent timing resolution and low neutron sensitivity[7]. At the n_TOF facility, these detectors have been successfully employed to measure a broad range of capture cross sections, from resonance-rich heavy isotopes to low cross section isotopes[8−11]. Currently, the Back-n white neutron facility of the China Spallation Neutron Source (CSNS) provides a high-flux beam for neutron capture experiments. The primary setups for capture measurements at Back-n are the$ \text{C}_6\text{D}_6 $ detectors and the Gamma Total Absorption Facility (GTAF). GTAF offers high detection efficiency and near-$ 4\pi $ solid angle coverage, while it faces challenges such as complex background analysis and difficulties in precise efficiency determination[12−14]. In contrast, the$ \text{C}_6\text{D}_6 $ detectors offers superior background suppression and a standardized analysis workflow[15]. However, previous studies at Back-n mainly focused on nuclides with high cross sections ($ 0.1 $ to$ 10^4 $ barns)[16−21]. Measurements at the milli-barn scale have not yet been reported. Therefore, it is essential to investigate the possibility of using$ \text{C}_6\text{D}_6 $ detectors for low capture cross section measurements at Back-n.This study was performed on the Back-n white neutron facility at CSNS.
$ \text{C}_6\text{D}_6 $ detectors were used to measure neutron capture cross sections at the milli-barn scale.$ ^{209}\text{Bi} $ was selected as an ideal probe for low cross section measurements because it is monoisotopic and high-purity targets are easy to be prepared. The average capture cross section of$ ^{209}\text{Bi} $ ranges from mb to b scale. Besides, measurement of the capture data provides essential support for nuclear reactor safety assessments and astrophysical s-process nucleosynthesis calculations near the termination point[22, 23]. The experimental data were analyzed using the time-of-flight (TOF) method and the pulse height weighting technique (PHWT). Systematic backgrounds were subtracted using measurements from a carbon sample and an empty sample holder. The influence of different energy binning on the experimental results has also been investigated. -
Neutrons were produced by bombarding a tungsten-tantalum (W-Ta) target with 1.6 GeV pulsed protons at a repetition rate of 25 Hz. The proton beam operated in a double-bunch mode, with a single bunch width of 41 ns and a bunch interval of 410 ns. The resulting neutron energy covered a range from 0.1 eV to 200 MeV [24].
Back-n is located in the backward direction of the proton beam and consists of two experimental stations: ES#1 (55 m from the target) and ES#2 (77 m from the target). This experiment was performed at ES#2. A combination of neutron shutters and two collimators with inner diameters of Φ50+Φ15+Φ40 mm was used to form a circular spot with a diameter of approximately 40 mm at the sample position. To suppress the overlap of adjacent neutron pulses, a cadmium (Cd) absorber was placed at the front end of the shutter to remove neutrons with energies below 0.3 eV [25−27]. The neutron flux at the experimental position was approximately
$ 10^{6}\,\text{n}\,\text{cm}^{-2}\,\text{s}^{-1} $ [28]. -
Neutrons were produced by bombarding a tungsten-tantalum (W–Ta) target with 1.6 GeV pulsed protons at a repetition rate of 25 Hz. The proton beam operated in a double-bunch mode, with a single bunch width of 41 ns and a bunch interval of 410 ns. The resulting neutron energy covers a range from 0.1 eV to 200 MeV[24].
The Back-n is located in the backward direction of the proton beam and consists of two experimental stations: ES#1 (55 m from the target) and ES#2 (77 m from the target). This experiment was performed at ES#2. A combination of neutron shutters and two collimators with inner diameters of Φ50+Φ15+Φ40 mm was used to form a circular spot with a diameter of approximately 40 mm at the sample position. To suppress the overlapping of adjacent neutron pulses, a cadmium (Cd) absorber was placed at the front end of the shutter to remove neutrons with energies below 0.3 eV[25−27]. The neutron flux at the experimental position was approximately
$ 10^{6}\,\text{n}\,\text{cm}^{-2}\,\text{s}^{-1} $ [28]. -
The measurements were performed using
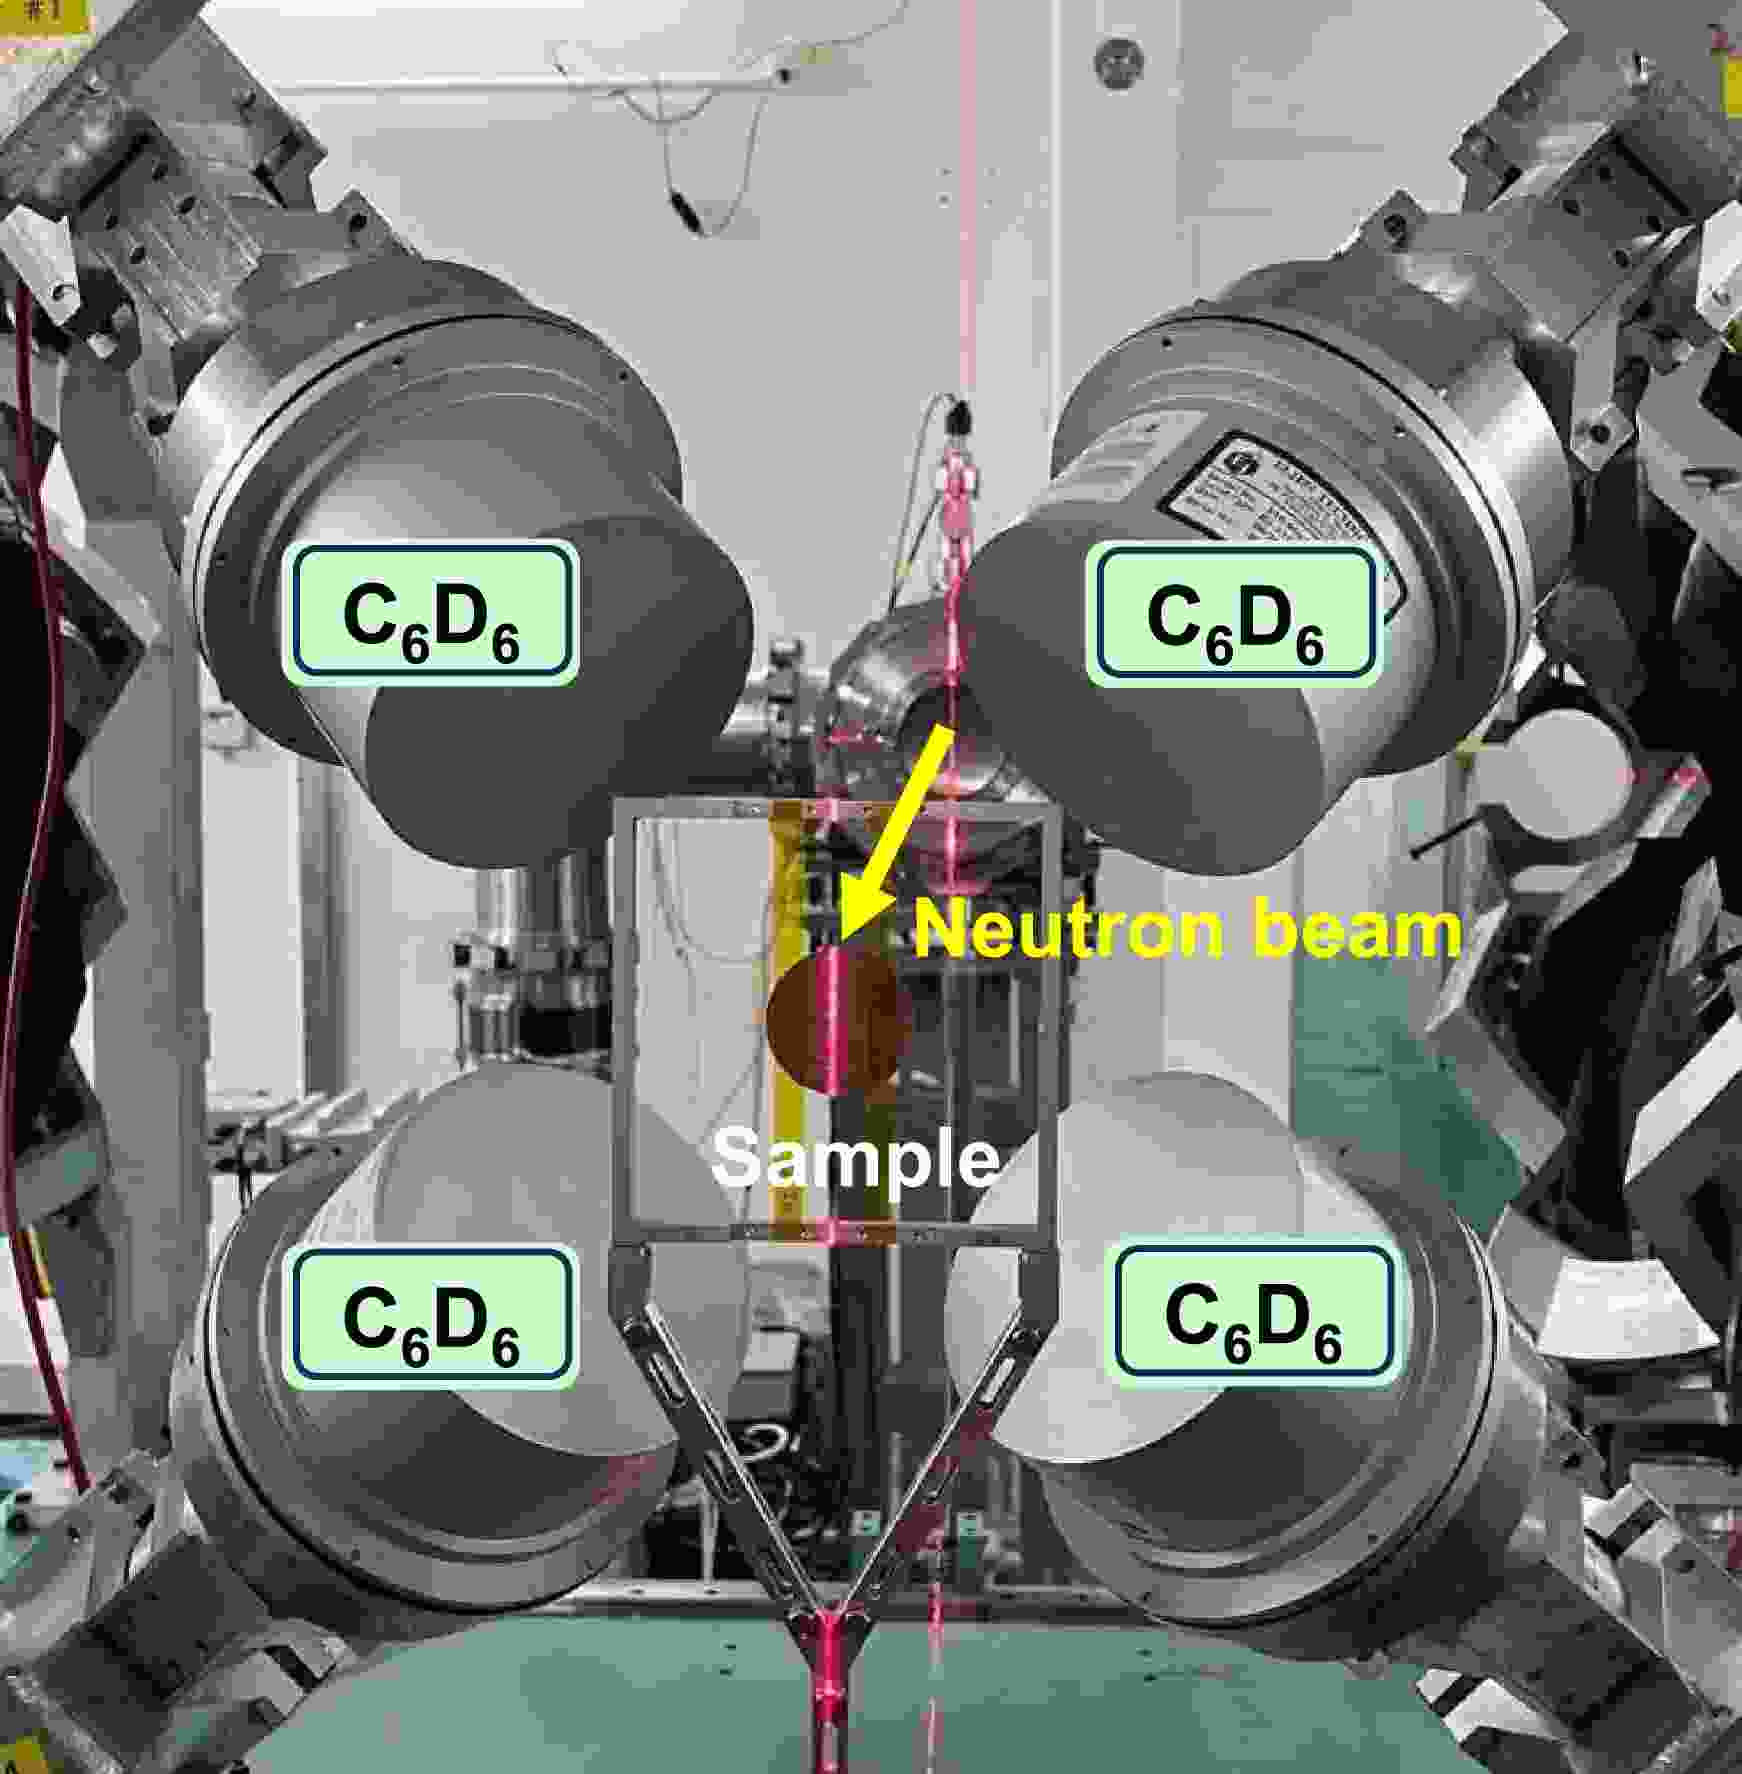
$ \text{C}_6\text{D}_6 $ detectors. As shown in Fig. 1, the system consists of four$ \text{C}_6\text{D}_6 $ liquid scintillation detectors (Model EJ-315), an aluminum detector support, and an aluminum sample holder.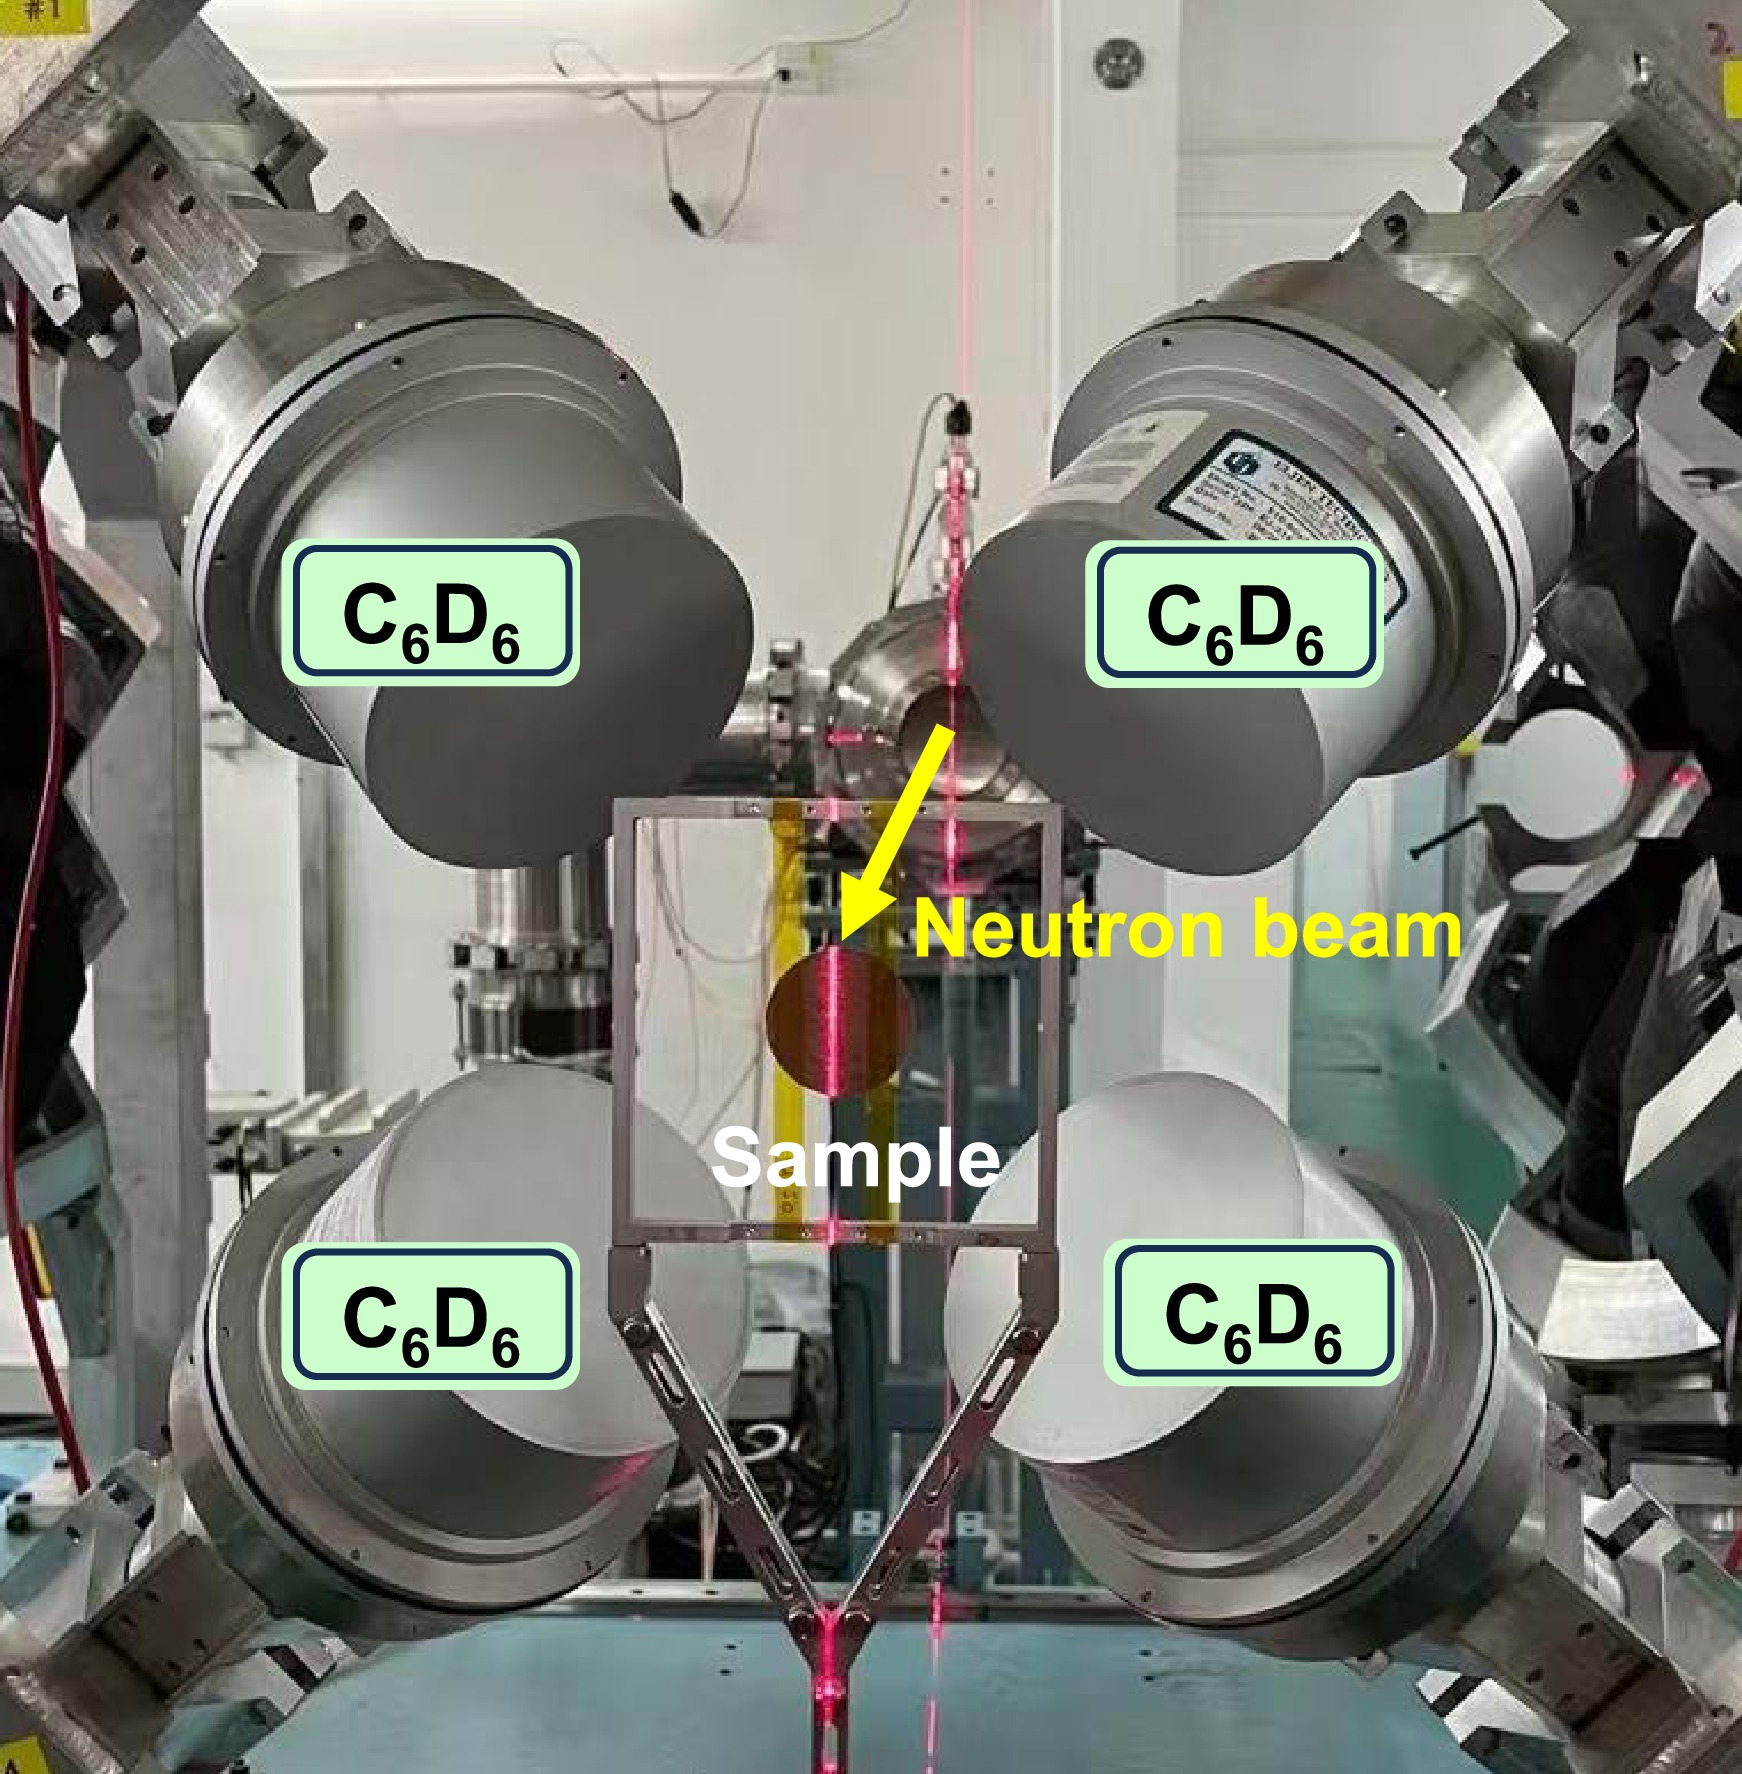
Figure 1. (color online) Configuration of the
$ \text{C}_6\text{D}_6 $ detector array.The system was located at the center of experimental station ES#2. The detectors were positioned upstream of the sample to reduce the scattered neutron background. The angle between the detector axis and the neutron beam direction ranged from 110
$ ^\circ $ to 125$ ^\circ $ . Each scintillator had a diameter of 130 mm and a length of 76.2 mm. They were encapsulated in a 1.5 mm thick aluminum casing and coupled to a photomultiplier tube (ETEL 9390 KEB PMT). The distance from the center of the detector front face to the sample center was approximately 150 mm, and the vertical distance to the neutron beam axis was approximately 80 mm [29].This detection system features a fast time response (pulse width
$ \sim $ 10 ns) and very low sensitivity to scattered neutrons. These characteristics make it suitable for$ (n, \gamma) $ cross section measurements. The output signal amplitudes ranged from 0.01 to 3 V. Full waveform digitization was performed using a readout electronics system with a 1 GS/s sampling rate and 12-bit resolution [30, 31]. In the experiment, the neutron start time was extracted from the pulsed proton beam, while the stop time was determined by the$ \text{C}_6\text{D}_6 $ detectors. -
The measurements were performed using
$ \text{C}_6\text{D}_6 $ detectors. As shown in Fig. 1, the system consists of four$ \text{C}_6\text{D}_6 $ liquid scintillator detectors (Model EJ-315), an aluminum detector support, and an aluminum sample holder.
Figure 1. (color online) Configuration of the
$ \text{C}_6\text{D}_6 $ Detector Array.The system was located at the center of experimental station ES#2. The detectors were positioned upstream of the sample to reduce the scattered neutron background. The angle between the detector axis and the neutron beam direction ranges from 110
$ ^\circ $ to 125$ ^\circ $ . Each scintillator has a diameter of 130 mm and a length of 76.2 mm. It is encapsulated in a 1.5 mm thick aluminum casing and coupled to a photomultiplier tube (ETEL 9390 KEB PMT). The distance from the center of the detector front face to the sample center was about 150 mm, and the vertical distance to the neutron beam axis was approximately 80 mm[29].This detection system features a fast time response (pulse width
$ \sim $ 10 ns) and very low sensitivity to scattered neutrons. These characteristics make it suitable for$ (n, \gamma) $ cross section measurements. The output signal amplitudes range from 0.01 to 3 V. Full waveform digitization was performed using a readout electronics system with a 1 GS/s sampling rate and 12-bit resolution[30, 31]. In the experiment, the neutron start time was extracted from the pulsed proton beam, while the stop time was determined by the$ \text{C}_6\text{D}_6 $ detectors. -
Five samples were employed in the experiment:
$ ^{209} $ Bi,$ ^{\text{nat}} $ C,$ ^{\text{nat}} $ Pb,$ ^{197} $ Au, and an empty sample holder. High-purity (99.99%)$ ^{209} $ Bi was the primary target for the neutron capture cross section measurement.$ ^{197} $ Au served as the standard reference to validate the experimental setup and analysis methods, given that its capture cross sections are defined as international standards by IAEA. To achieve accurate background subtraction, three additional measurements were performed using background samples. A$ ^{\text{nat}} $ C sample was used to measure the γ-ray background induced by neutron scattering in the experimental environment. A$ ^{\text{nat}} $ Pb sample was utilized to determine the in-beam prompt γ-ray background [32]. The empty sample holder was measured to account for background from material activation and other environmental sources. All samples were cylindrical, and their dimensions are summarized in Table 1.Sample Diameter/mm Thickness/mm $ ^{197} $ Au30 0.1 $ ^{\rm nat} $ C30 0.42 $ ^{\rm nat} $ Pb30 0.1 $ ^{209} $ Bi40 1 Table 1. Dimensions of experimental samples.
-
Five samples were employed in the experiment:
$ ^{209} $ Bi,$ ^{\text{nat}} $ C,$ ^{\text{nat}} $ Pb,$ ^{197} $ Au, and an empty sample holder. High-purity (99.99%)$ ^{209} $ Bi was the primary target for the neutron capture cross section measurement.$ ^{197} $ Au served as the standard reference to validate the experimental setup and the analysis methods, as its capture cross sections are defined as international standards by the IAEA. To achieve accurate background subtraction, three additional measurements corresponding to background samples were performed. A$ ^{\text{nat}} $ C sample was used to measure the γ-ray background induced by neutron scattering in the experimental environment. A$ ^{\text{nat}} $ Pb sample was utilized to determine the in-beam prompt γ background[32]. The empty sample holder was measured to account for the background from material activation and other environmental sources. All samples were cylindrical, and their dimensions are summarized in Table 1.Sample Diameter (mm) Thickness (mm) $ ^{197} $ Au30 0.1 $ ^{\rm nat} $ C30 0.42 $ ^{\rm nat} $ Pb30 0.1 $ ^{209} $ Bi40 1 Table 1. Dimensions of experimental samples.
-
The neutron energy
$ E_{\text{n}} $ is determined by the TOF method:$ E_n = \frac{1}{2} m_n \left( \frac{L}{t} \right)^2 $
(1) where
$ m_n $ is the neutron mass, L is the flight path (m), t is the time of flight (s).$ t = T_{\text{ff}} + \frac{L}{c} - T_{\gamma} $
(2) where,
$ T_{\text{ff}} $ is the time when a neutron is detected, and$ T_{\gamma} $ is the start signal representing the arrival of the γ-flash at the detector. c is the speed of light in vacuum, equal to$ 2.9979 \times 10^8 $ m/s. This distance was determined by calibrating the experimental TOF spectrum against the standard resonances of$ ^{197}\text{Au} $ from the ENDF/B-VIII.0 library [33]. The final value of L was obtained using the standard relationship between neutron energy and flight time. -
The neutron energy
$ E\mathit{_n} $ is determined by the TOF method:$ E_n = \frac{1}{2} m_n \left( \frac{L}{t} \right)^2 , $
(1) where
$ m_n $ is the neutron mass, L is the flight path (m), and t is the time of flight (s):$ t = T_{\text{ff}} + \frac{L}{c} - T_{\gamma} , $
(2) where
$ T_{\text{ff}} $ is the time at which a neutron is detected,$ T_{\gamma} $ is the start signal representing the arrival of the γ-flash at the detector, and c is the speed of light in vacuum, equal to$ 2.9979 \times 10^8 $ m/s. The flight path was determined by calibrating the experimental TOF spectrum against the standard resonances of$ ^{197}\text{Au} $ from the ENDF/B-VIII.0 library [33]. The final value of L was obtained using the standard relationship between neutron energy and flight time. -
In the measurement of
$ (n, \gamma) $ reaction cross sections using$ \text{C}_6\text{D}_6 $ detectors, the recorded signals consist of prompt γ-rays from the de-excitation of compound nuclei and various background components. During data reduction, the ambient background ($ B_{\text{empty}} $ ) is subtracted via empty target holder measurements. Furthermore, the backgrounds induced by scattered neutrons ($ B_{\text{sn}} $ ) and in-beam γ-rays ($ B_{\text{s}\gamma} $ ) are determined and corrected using carbon and lead targets, respectively.$ B(E_n) = B_{\text{empty}}(E_n) + B_{\text{sn}}(E_n) + B_{\text{s}\gamma}(E_n) $
(3) The neutron energy was determined from the measured flight time using the TOF method. Data for each target were normalized using a Li-Si detector. The proton flux data were provided by the Back-n [34]. The measured energy spectra of the various backgrounds are shown in Fig. 2.
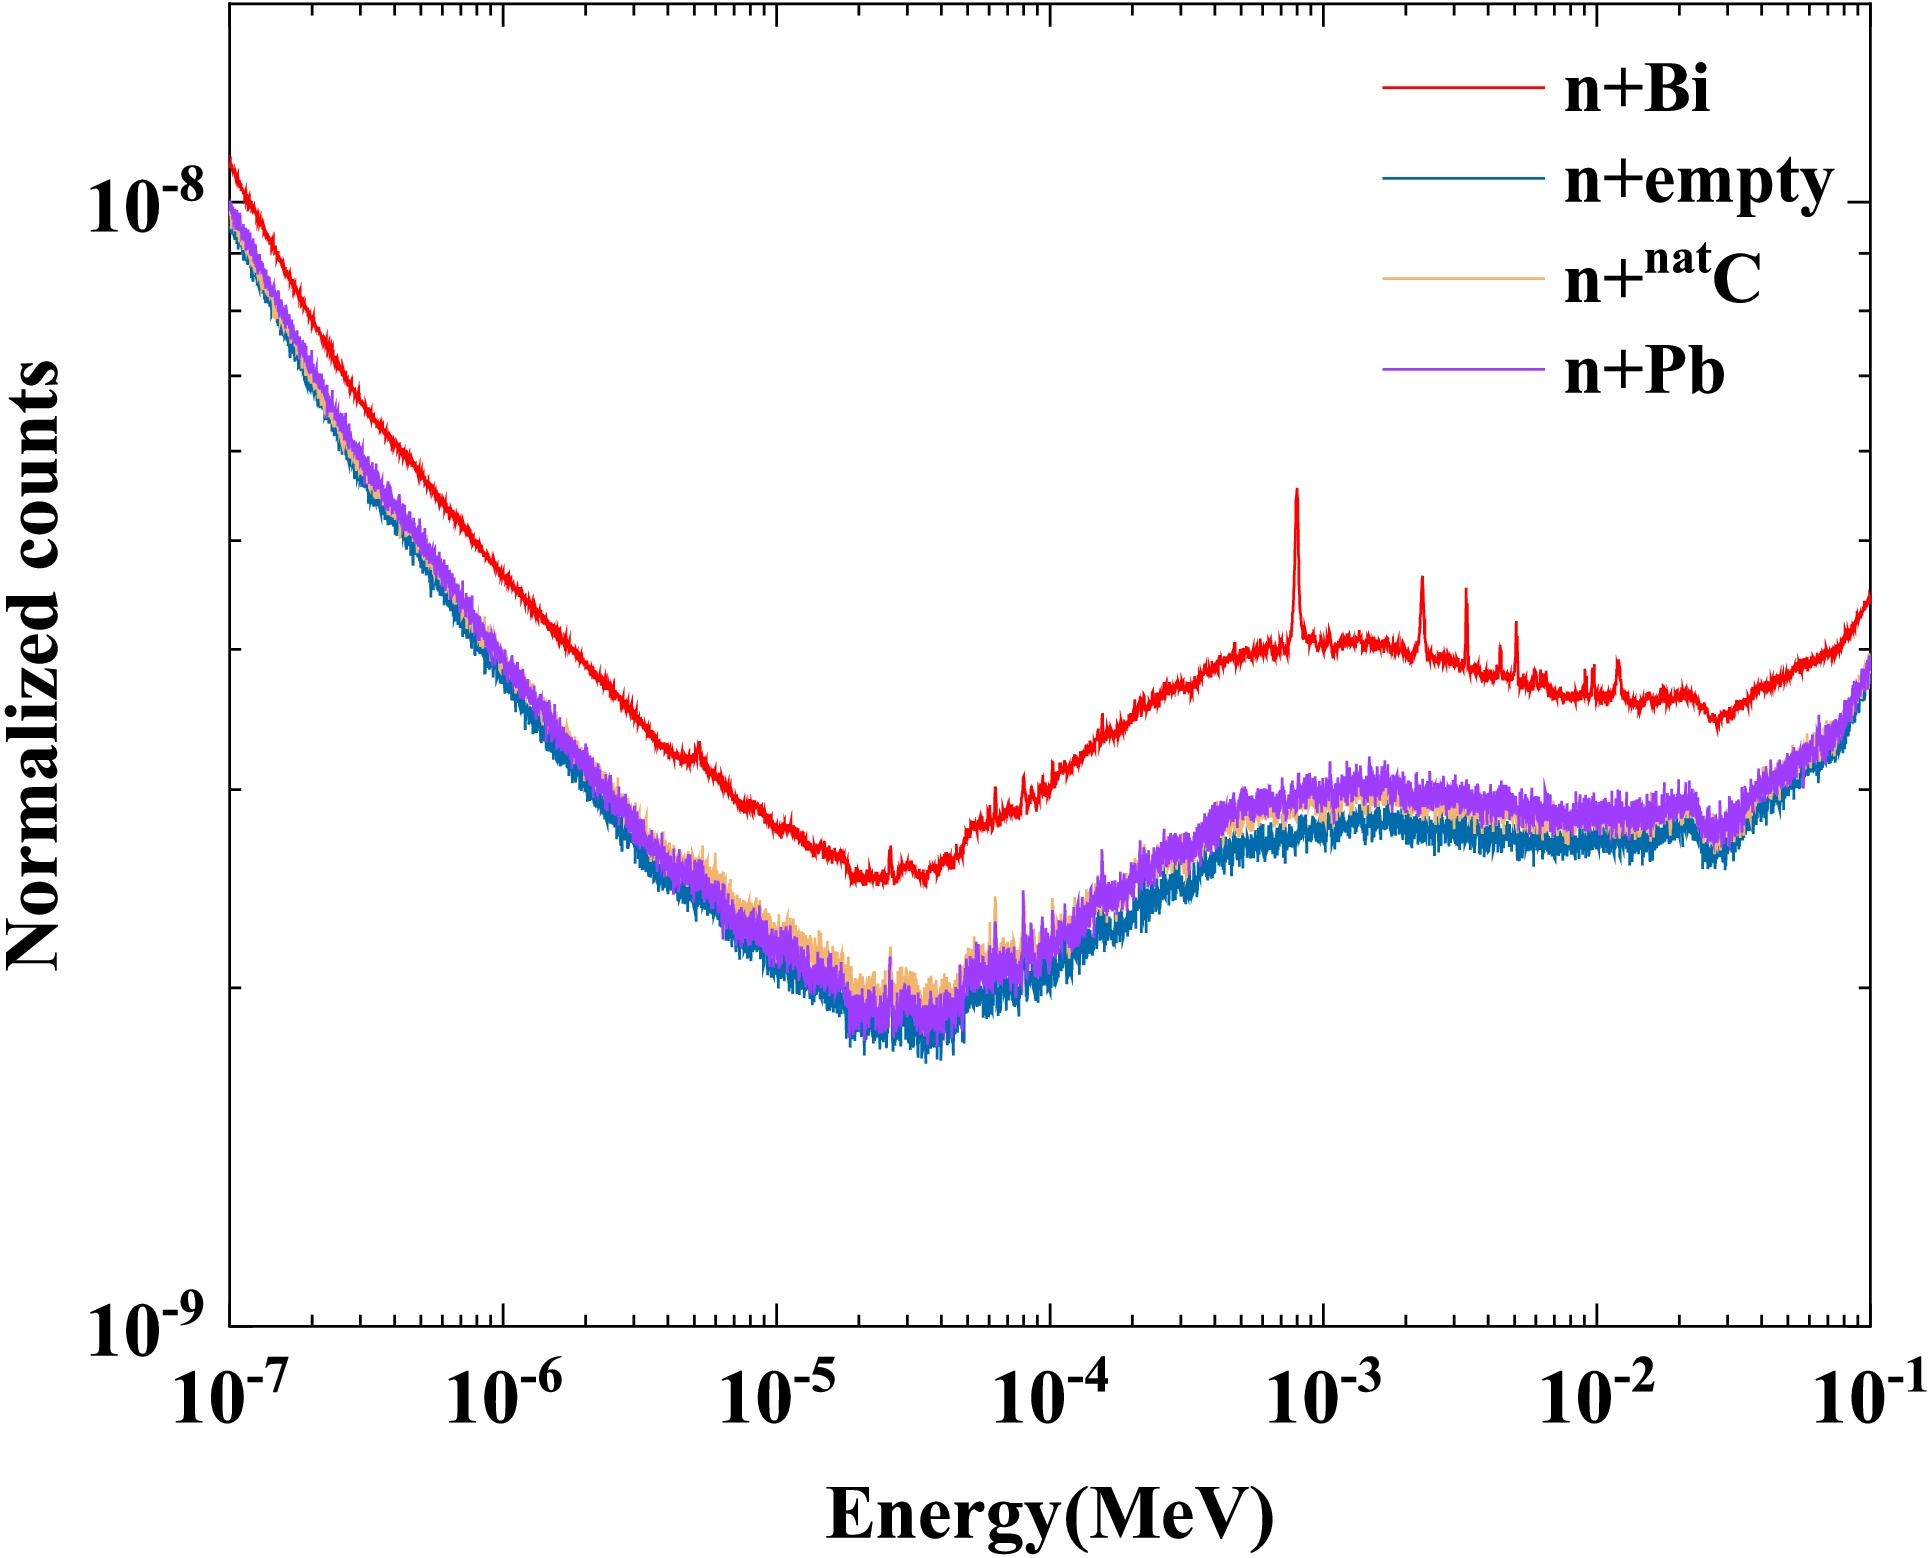
Figure 2. (color online) Raw spectra of
$ ^{209} $ Bi and background, and the background-subtracted spectrum.As shown in Fig. 2, the measured spectrum of the Pb target nearly coincides with that of the empty target holder, indicating that the Pb sample did not contribute effectively to the measured signal. This behavior is attributed to an experimental issue related to the Pb sample condition during the measurement. Consequently, the Pb target data are not included in the subsequent analysis.
-
In measurements of
$ (n, \gamma) $ reaction cross sections using$ \text{C}_6\text{D}_6 $ detectors, the recorded signals consist of prompt γ-rays from the de-excitation of compound nuclei and various background components. During data reduction, the ambient background ($ B_{\text{empty}} $ ) is subtracted using measurements of the empty target holder. Furthermore, the backgrounds induced by scattered neutrons ($ B_{\text{sn}} $ ) and in-beam γ-rays ($ B_{\text{s}\gamma} $ ) are determined and corrected using carbon and lead targets, respectively:$ B(E_n) = B_{\text{empty}}(E_n) + B_{\text{sn}}(E_n) + B_{\text{s}\gamma}(E_n). $
(3) The neutron energy was determined from the measured flight time using the TOF method. Data for each target were normalized using a Li-Si detector. The proton flux data were provided by Back-n [34]. The measured energy spectra of the various background components are shown in Fig. 2.
Figure 2. (color online) Raw spectra of
$ ^{209} $ Bi and background, along with the background-subtracted spectrum.As shown in Fig. 2, the measured spectrum of the Pb target nearly coincides with that of the empty target holder, indicating that the Pb sample did not contribute effectively to the measured signal. This behavior is attributed to an experimental issue related to the condition of the Pb sample during the measurement. Consequently, the Pb target data were not included in the subsequent analysis.
-
To determine the neutron capture yield, the actual number of capture events in the target is required. However, the detectors record the number of γ-rays rather than the capture events themselves. Because the γ-ray emission depends on the specific de-excitation path of the compound nucleus, the number of detected γ-rays is not directly proportional to the number of capture events. Therefore, the PHWT must be applied to correct the detection efficiency [35].
The γ-ray detection efficiency of the
$ \text{C}_6\text{D}_6 $ detector is sufficiently low. This ensures that at most one cascade γ-ray is detected per capture event. Therefore, the detection efficiency for a capture event can be approximated as follows:$ \varepsilon_c = 1 - \prod\limits_{i=1}^{N} (1 - \varepsilon_{\gamma i}) \approx \sum\limits_{i=1}^{N} \varepsilon_{\gamma i},$
(4) where
$ \varepsilon_c $ is the total detection efficiency for a single neutron capture event, and$ \varepsilon_{\gamma i} $ is the detection efficiency for the i-th γ-ray in the cascade. The weighting function is determined using Monte Carlo simulations and mathematical weighting methods. This ensures that the γ-ray detection efficiency is proportional to its energy, satisfying the following relationship:$ \varepsilon_{\gamma i} = k E_{\gamma i}, $
(5) where
$ E_{\gamma i} $ is the energy of the incident γ-ray. Under these conditions, the detection efficiency for a neutron capture event becomes proportional to the total energy of the γ-cascade. This efficiency is independent of the intermediate de-excitation paths. Therefore, the detection efficiency can be expressed as follows:$ \varepsilon_c \approx k \sum\limits_{i=1}^{N} E_{\gamma i} \approx k E_x = k (S_n + E_n) ,$
(6) where
$ E_x $ is the total excitation energy,$ S_n $ is the neutron separation energy, and$ E_n $ is the kinetic energy of the incident neutron. The weighting function can be expressed as follows:$ \mathrm{WF}(E_d) = \sum\limits_{m=0}^{3} a_m E_d^m ,$
(7) where
$ E_d $ represents the deposited energy in the$ \text{C}_6\text{D}_6 $ detector. To obtain the energy deposition spectra and detection efficiency curves, the sample target and detector system were modeled using Geant4 (version 11.3.2) with the FTFP_BERT physics list. The specific geometry and material compositions are described in Sec. II.B and Fig. 1. Based on this model, twenty-five sets of monoenergetic γ-rays were simulated over an energy range of 0.01–12 MeV with a step size of 0.5 MeV. The parameters were then determined by solving the following equation using the least-squares method [36]. The weighting function for$ ^{209}\text{Bi} $ is shown in Fig. 3.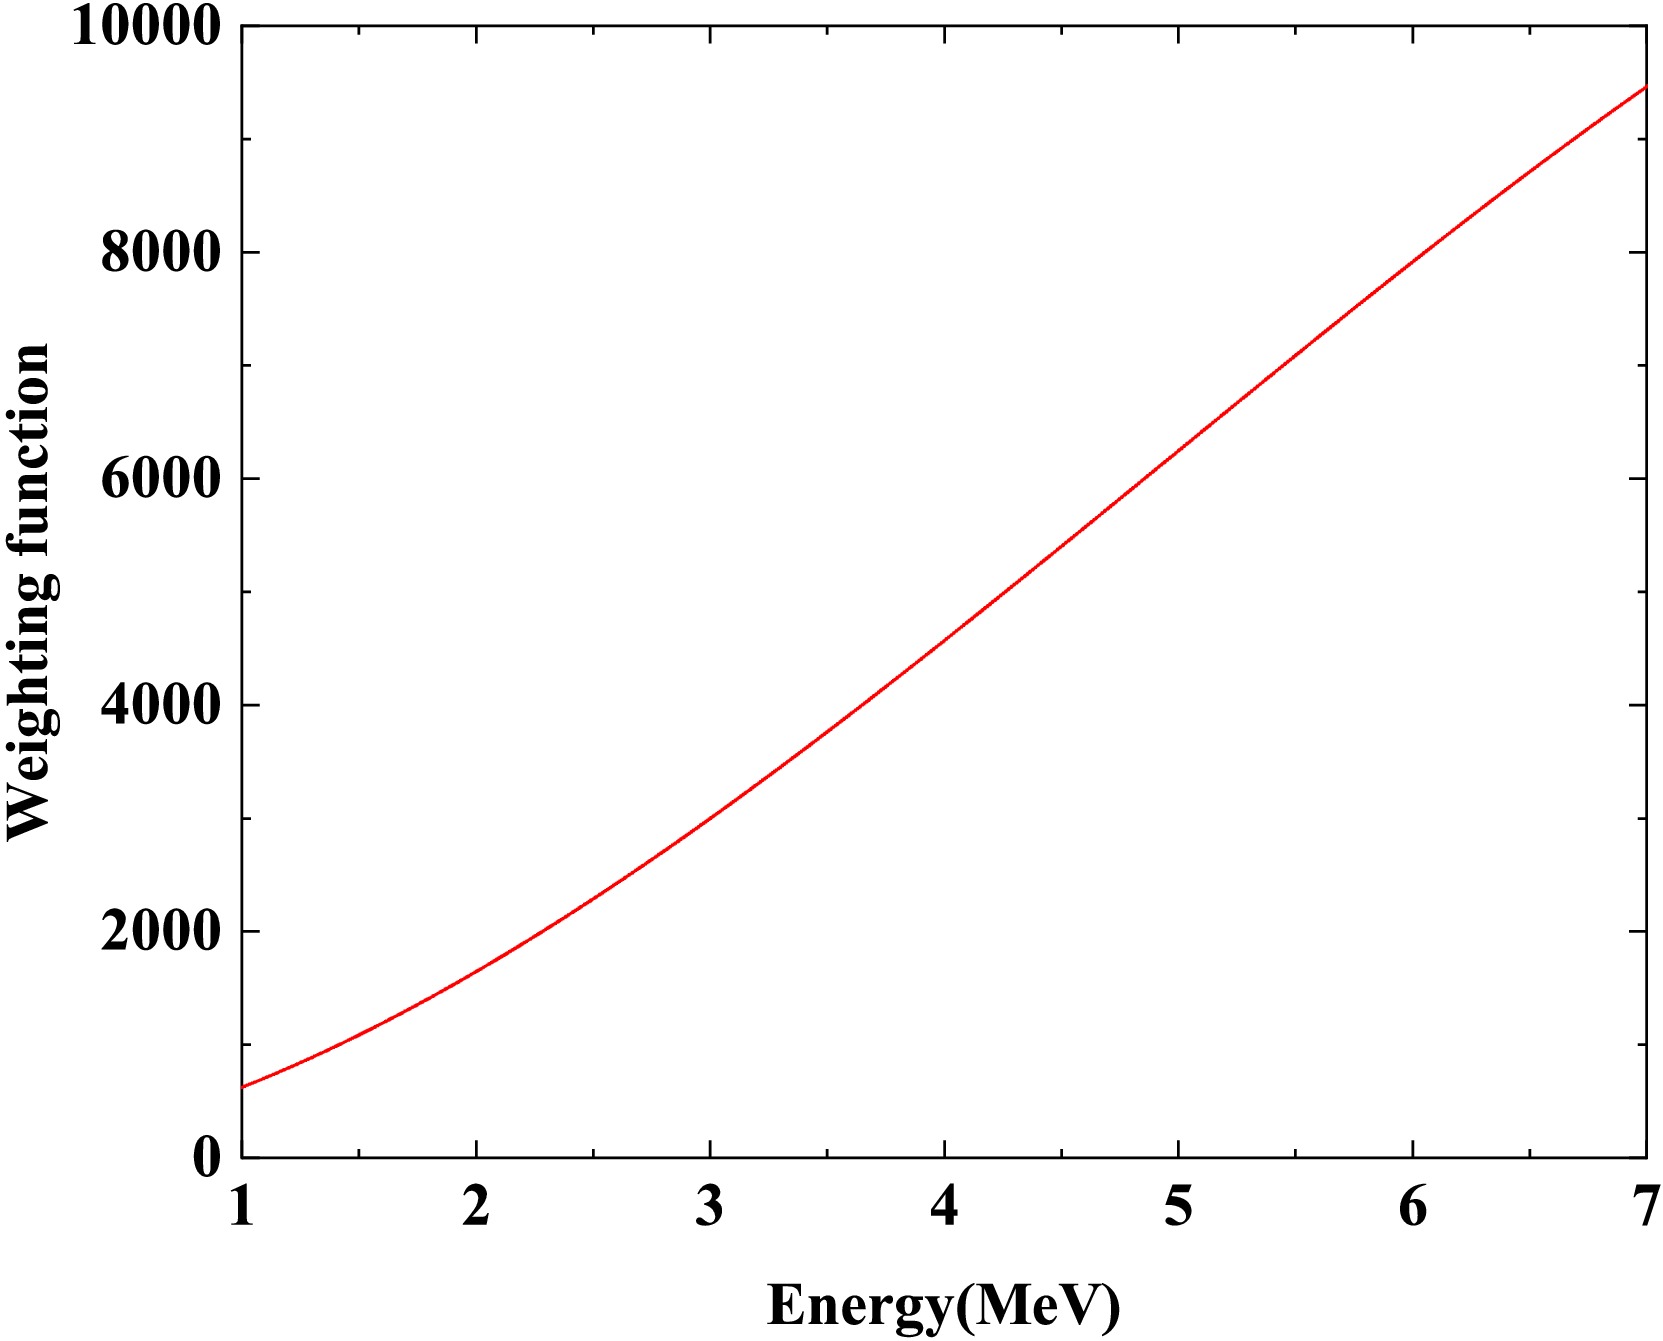
Figure 3. (color online) Calculated weighting function for
$ ^{209} $ Bi as a function of deposited energy, determined using the PHWT.$ \chi^2=\sum\limits_{j=1}^N\left[E_{\gamma j}-\int_{E_L}^{\infty}R(E_d,E_{\gamma j})\mathrm{WF}(E_d)\, \mathrm{d}E_d\right]^2. $
(8) -
To determine the neutron capture yield, the actual number of capture events in the target is required. However, the detectors record the number of γ-rays rather than the capture events themselves. Since the γ-ray emission depends on the specific de-excitation path of the compound nucleus, the number of detected γ-rays is not directly proportional to the number of capture events. Therefore, the PHWT must be applied to correct the detection efficiency[35].
The γ-ray detection efficiency of the
$ \text{C}_6\text{D}_6 $ detector is sufficiently low. This ensures that at most one cascade γ-ray is detected per capture event. Therefore, the detection efficiency for a capture event can be approximated as:$ \varepsilon_c = 1 - \prod\limits_{i=1}^{N} (1 - \varepsilon_{\gamma i}) \approx \sum\limits_{i=1}^{N} \varepsilon_{\gamma i} $
(4) where
$ \varepsilon_c $ is the total detection efficiency for a single neutron capture event, and$ \varepsilon_{\gamma i} $ is the detection efficiency for the i-th γ-ray in the cascade. The weighting function is determined using Monte Carlo simulations and mathematical weighting methods. This ensures that the γ-ray detection efficiency is proportional to its energy, satisfying the following relationship:$ \varepsilon_{\gamma i} = k E_{\gamma i} $
(5) where
$ E_{\gamma i} $ is the energy of the incident γ-ray. Under these conditions, the detection efficiency for a neutron capture event becomes proportional to the total energy of the γ-cascade. This efficiency is independent of the intermediate de-excitation paths. Therefore, the detection efficiency can be expressed as:$ \varepsilon_c \approx k \sum\limits_{i=1}^{N} E_{\gamma i} \approx k E_x = k (S_n + E_n) $
(6) where
$ E_x $ is the total excitation energy,$ S_n $ is the neutron separation energy, and$ E_n $ is the kinetic energy of the incident neutron. The weighting function can be expressed as follows:$ \mathrm{WF}(E_d) = \sum\limits_{m=0}^{3} a_m E_d^m $
(7) where
$ E_d $ represents the deposited energy in the$ \text{C}_6\text{D}_6 $ detector. To obtain the energy deposition spectra and detection efficiency curves, the sample target and detector system were modeled using Geant4(version 11.3.2) with the FTFP_BERT physics list. The specific geometry and material compositions are described in Sec. 2.2 and Fig. 1. Based on this model, twenty-five sets of monoenergetic γ-rays were simulated within an energy range of 0.01–12 MeV with a step of 0.5 MeV. Then, the parameters were determined by solving the following equation with the least-squares method [36]. The weighting function for$ ^{209}\text{Bi} $ is shown in Fig. 3.
Figure 3. (color online) The calculated weighting function for
$ ^{209} $ Bi as a function of deposited energy, determined using the PHWT.$ \chi^2 = \sum\limits_{j=1}^{N} \left[ E_{\gamma j} - \int_{E_L}^{\infty} R(E_d, E_{\gamma j}) \mathrm{WF}(E_d) \, dE_d \right]^2 $
(8) -
After background subtraction and pulse height weighting correction, the neutron capture yield is determined as follows:
$ Y_w(E_n) = N_\mathrm{norm} \times \frac{C_w(E_n) - B_w(E_n)}{\phi(E_n) \times (S_n + E_n)} $
(9) where the weighted counts and weighted background are denoted by
$ C_w(E_n) $ and$ B_w(E_n) $ , respectively.$ \phi(E_n) $ represents the neutron flux at the sample position (in units of$ n/\text{cm}^2/\text{s} $ ), and$ N_\mathrm{norm} $ is the absolute normalization factor [37] determined by comparing the experimental data with the evaluation database. The relationship between the neutron capture cross section and the capture yield is expressed as follows:$ \sigma_{(n,\gamma)}(E_n) = Y_w(E_n) \times \frac{\sigma_t(E_n)}{1 - \exp\left[-n\sigma_t(E_n)\right]} $
(10) Eq.(10) shows the relationship between the capture yield
$ Y_w(E_n) $ , the neutron capture cross section$ \sigma_{(n,\gamma)}(E_n) $ , and the total cross section$ \sigma_t(E_n) $ . In this expression, n denotes the areal density (atoms/b).The neutron capture cross section was determined based on eq.(10), and the results are shown in Fig. 4. Comparing the experimental data with the evaluated library, the main resonance structures of
$ ^{209} $ Bi are clearly observed in the low-energy region. The peak energies match the evaluated data well, which indicates the reliability of the neutron energy calibration.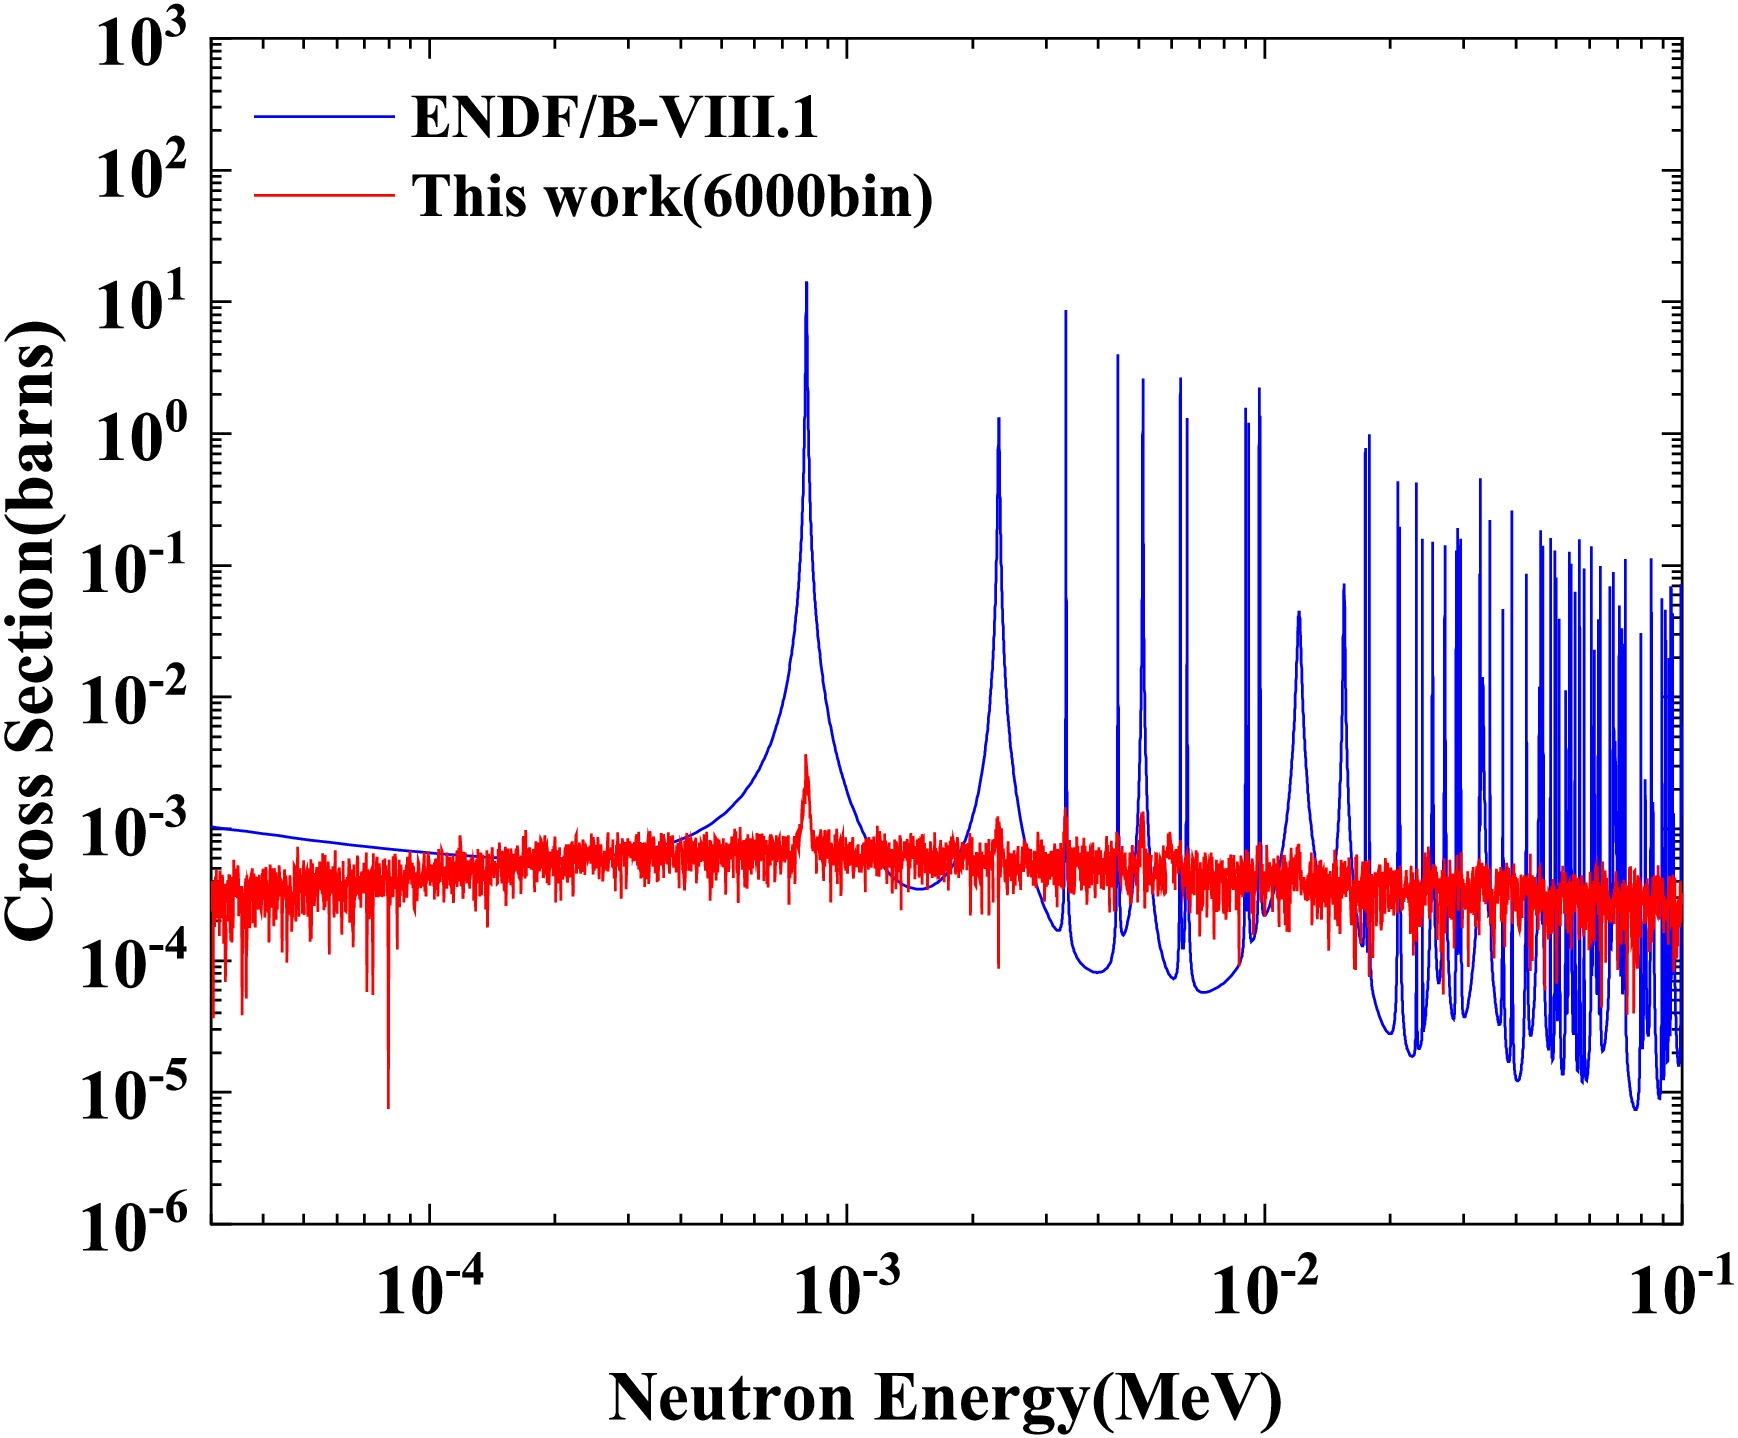
Figure 4. (color online) Comparison of the measured
$ ^{209} $ Bi(n, γ) capture cross section with the evaluated data from the ENDF/B-VIII.1 library.However, the measured resonance strengths are systematically lower than the evaluated values under the present experimental conditions. This discrepancy can be mainly attributed to the limited signal-to-background ratio and a residual in-beam γ background contribution. The neutron capture cross section of
$ ^{209} $ Bi is extremely small, and the capture signal becomes comparable to the background level in the current setup, leading to large statistical fluctuations and preventing the reliable extraction of weak resonances from the noise floor. In addition, the in-beam γ background could not be fully removed because the Pb measurement used for its estimation did not provide an effective contribution, resulting in a residual background that further affects the extracted resonance strengths.The uncertainty sources for the
$ ^{209} $ Bi capture cross-section measurement are summarized in Table 2. According to the studies by the Back-n Collaboration, the relative uncertainty of the neutron flux is 2.3%–4.5% above 0.15 MeV [38]. The data processing uncertainty is mainly attributed to the PHWT, which is approximately 3% [39]. The background subtraction aims to obtain the net counts, and its uncertainty includes the statistical errors of each sample and the proton beam normalization. Due to the limited signal to background (S/B) ratio, the uncertainty associated with background subtraction is relatively large, estimated at approximately 10%. The flight path length was calibrated using the$ ^{197} $ Au standard capture resonances, with an uncertainty of 0.03%. Since the in-beam γ background was not subtracted, a residual systematic uncertainty of less than 77.2% was assigned, which was determined by quantitatively assessing the fractional contribution of the background to the total measured signal. The uncertainty of the self-shielding factor originates from the total cross-section data deviations of$ ^{209} $ Bi provided by the ENDF/B-VIII.1 library. The uncertainty from sample impurities is 0.01% Finally, the total combined uncertainty of the measured cross sections is determined to be less than 77.8%.Sources of uncertainty Uncertainty (%) Neutron flux 4.5 Pulse height weighting function <3 Background subtraction (6000 Bin) <10 Normalization factor <1 Flight path L 0.03 Impurities in the sample 0.01 In-beam γ background <77.2 Self-shielding factor (6000 Bin) <1.6 Total uncertainty <77.8 Table 2. Summary of the uncertainty components in the
$ ^{209} $ Bi capture cross section measurement. -
After background subtraction and pulse height weighting correction, the neutron capture yield is determined as follows:
$ Y_w(E_n) = N_\mathrm{norm} \times \frac{C_w(E_n) - B_w(E_n)}{\phi(E_n) \times (S_n + E_n)} ,$
(9) where the weighted counts and weighted background are denoted by
$ C_w(E_n) $ and$ B_w(E_n) $ , respectively;$ \phi(E_n) $ represents the neutron flux at the sample position (in units of$ n/\text{cm}^2/\text{s} $ ); and$ N_\mathrm{norm} $ is the absolute normalization factor [37], determined by comparing the experimental data with the evaluation database. The relationship between the neutron capture cross section and the capture yield is expressed as follows:$ \sigma_{(n,\gamma)}(E_n) = Y_w(E_n) \times \frac{\sigma_t(E_n)}{1 - \exp\left[-n\sigma_t(E_n)\right]}. $
(10) Eq. (10) shows the relationship among the capture yield
$ Y_w(E_n) $ , the neutron capture cross section$ \sigma_{(n,\gamma)}(E_n) $ , and the total cross section$ \sigma_t(E_n) $ . In this expression, n denotes the areal density (atoms/b).The neutron capture cross section was determined using Eq. (10), and the results are shown in Fig. 4. A comparison of the experimental data with the evaluated library shows that the main resonance structures of
$ ^{209} $ Bi are clearly observed in the low-energy region. The peak energies agree well with the evaluated data, indicating the reliability of the neutron energy calibration.
Figure 4. (color online) Comparison of the measured
$ ^{209} $ Bi(n, γ) capture cross section with the evaluated data from the ENDF/B-VIII.1 library.However, under the aforementioned experimental conditions, the measured resonance strengths are systematically lower than the evaluated values . This discrepancy can be mainly attributed to the limited S/B ratio and residual in-beam γ-ray background. The neutron capture cross section of
$ ^{209} $ Bi is extremely small, and the capture signal becomes comparable to the background level in the current setup, leading to large statistical fluctuations and preventing the reliable extraction of weak resonances from the noise floor. In addition, the in-beam γ-ray background could not be fully removed because the Pb measurement used for its estimation did not provide an effective contribution, resulting in a residual background that further affected the extracted resonance strengths.The sources of uncertainty in the
$ ^{209} $ Bi capture cross-section measurement are summarized in Table 2. According to studies by the Back-n Collaboration, the relative uncertainty of the neutron flux is 2.3%−4.5% above 0.15 MeV [24]. The data processing uncertainty is mainly attributed to the PHWT and is approximately 3% [38]. Background subtraction aims to obtain the net counts, and its uncertainty includes the statistical errors of each sample and the proton beam normalization. Owing to the limited S/B ratio, the uncertainty associated with background subtraction is relatively large and is estimated to be approximately 10%. The flight path length was calibrated using the$ ^{197} $ Au standard capture resonances, with an uncertainty of 0.03%. Because the in-beam γ-ray background was not subtracted, a residual systematic uncertainty of less than 77.2% was assigned. This value was determined by quantitatively assessing the fractional contribution of the background to the total measured signal. The uncertainty of the self-shielding factor originates from deviations in the total cross-section data for$ ^{209} $ Bi provided by the ENDF/B-VIII.1 library. The uncertainty arising from sample impurities is 0.01%. Finally, the total combined uncertainty of the measured cross sections was determined to be less than 77.8%.Sources of uncertainty Uncertainty (%) Neutron flux 4.5 Pulse height weighting function <3 Background subtraction (6000 Bin) <10 Normalization factor <1 Flight path L 0.03 Impurities in the sample 0.01 In-beam γ background <77.2 Self-shielding factor (6000 Bin) <1.6 Total uncertainty <77.8 Table 2. Summary of the uncertainty components in the
$ ^{209} $ Bi capture cross section measurement. -
In the precise measurement of neutron capture cross sections, the neutron scattering background is a primary source of systematic background. This interference is particularly significant for low cross section nuclides, such as
$ ^{209} $ Bi. Under conditions of limited statistics, residual components induced by scattering neutrons are difficult to eliminate entirely, even after background subtraction, which limits the experimental data quality. Based on this, the ratio of the elastic scattering to capture cross section ($ \sigma_{\text{el}} / \sigma_{\gamma} $ ) is introduced as a preliminary physical indicator to evaluate the feasibility of such experiments.The selection of
$ ^{107,109} $ Ag as comparators is based on the fact that they are the nuclides with the lowest capture cross-sections successfully measured and published with high-quality data at the Back-n facility of the CSNS to date [36, 40]. A comparison of the$ \sigma_{\text{el}} / \sigma_{\gamma} $ ratios for$ ^{107,109} $ Ag and$ ^{209} $ Bi is shown in Fig. 5. The result indicate that the$ \sigma_{\text{el}}/\sigma_{\gamma} $ ratio is less than 0.02, allowing for the acquisition of relatively clear cross-section results. When it is higher than$ 1.3 \times 10^{6} $ , high-quality experimental data cannot be obtained.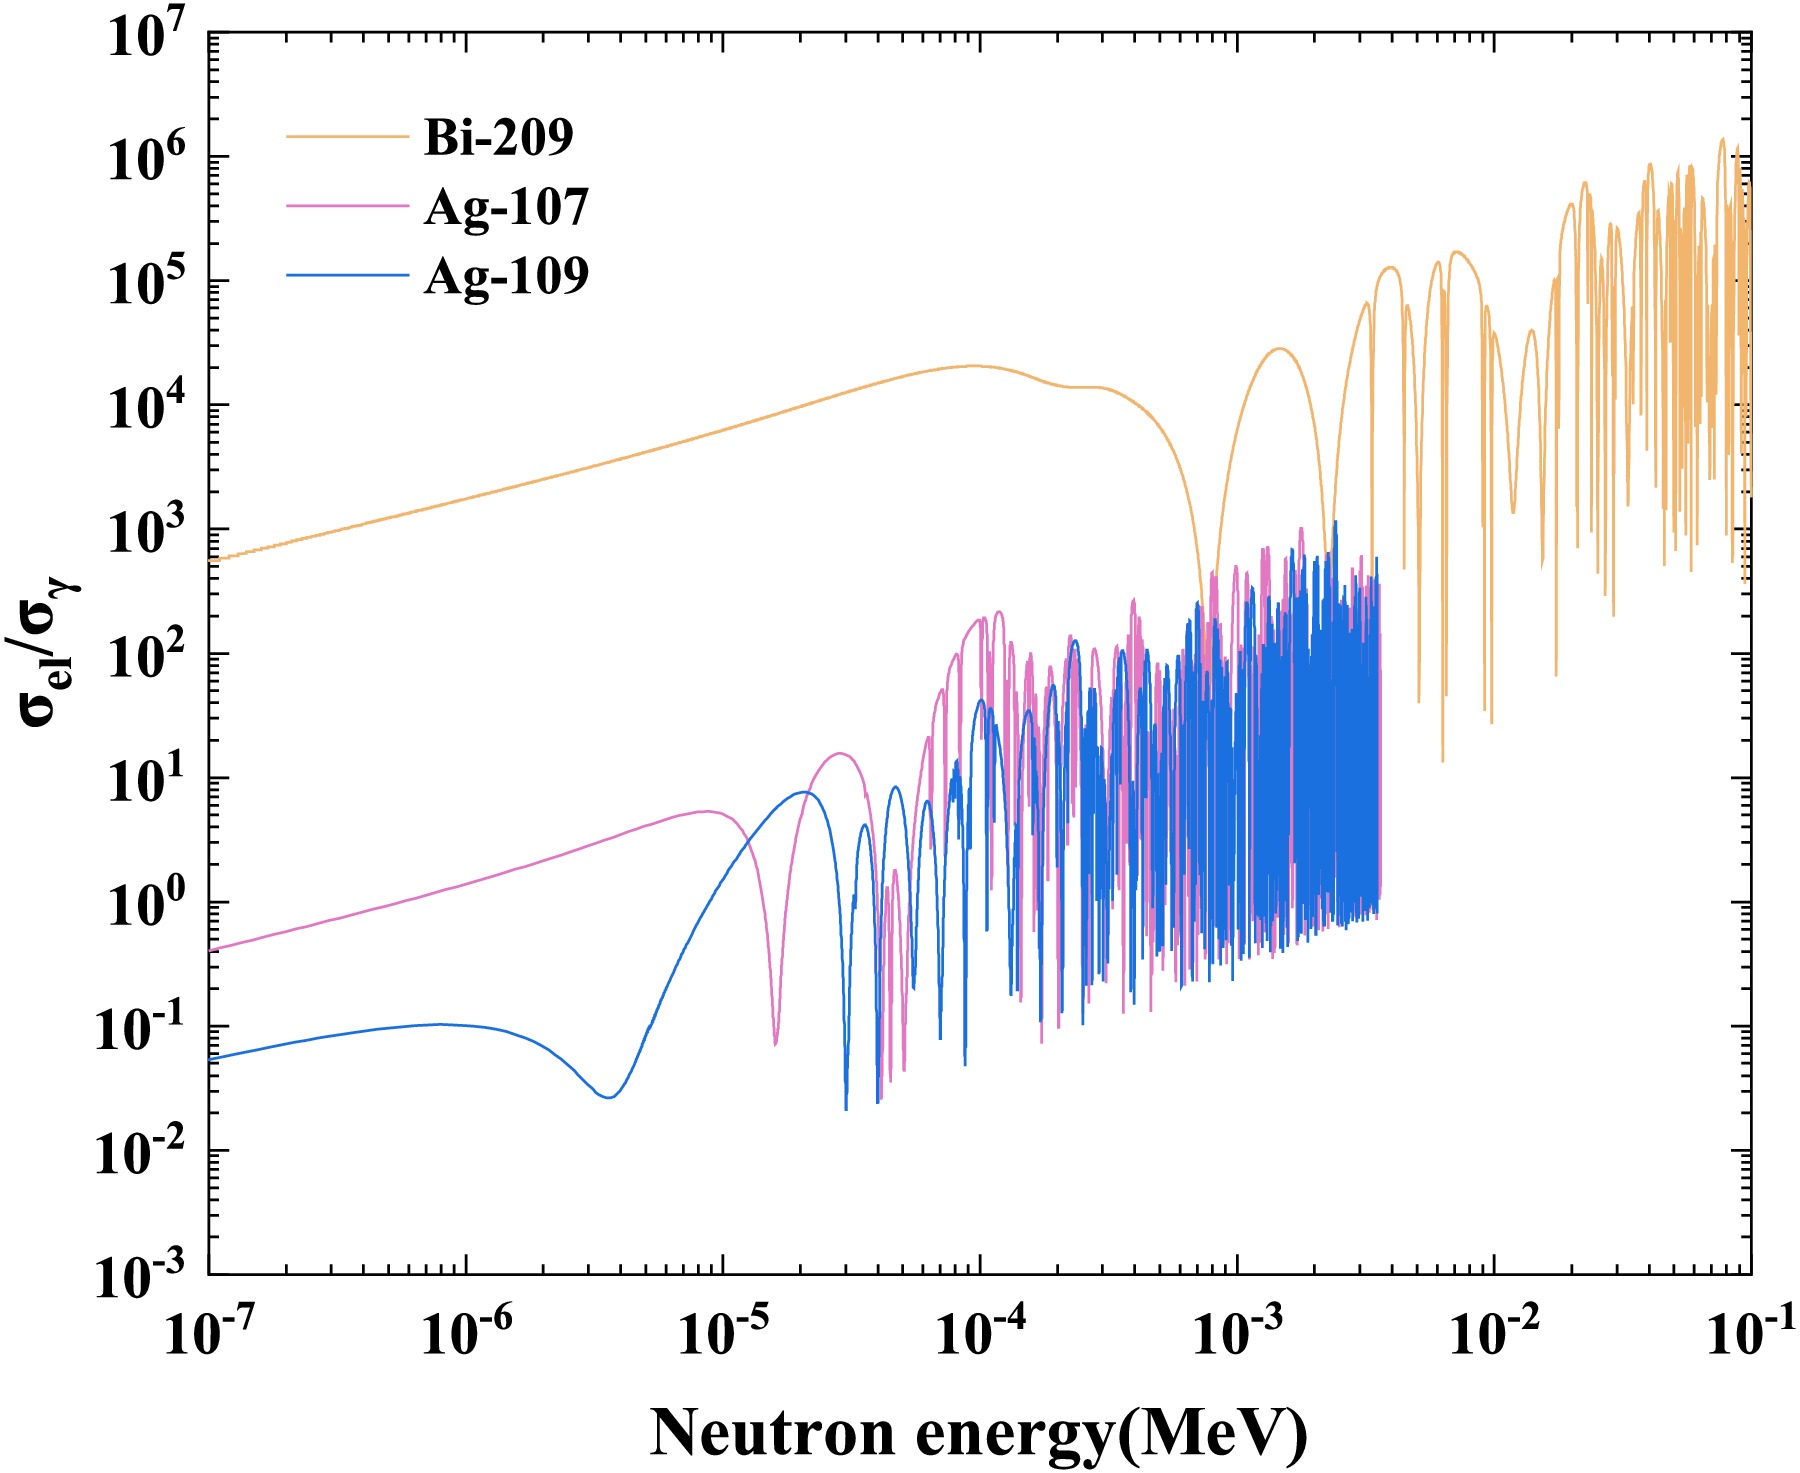
Figure 5. (color online) Comparison of Neutron Scattering to Capture Cross Section Ratios for
$ ^{209} $ Bi,$ ^{107} $ Ag, and$ ^{109} $ Ag.For future measurements of low-capture cross sections using
$ \text{C}_6\text{D}_6 $ detectors on the Back-n white neutron facility at CSNS, it is recommended that an initial assessment of the$ \sigma_{el} / \sigma_{\gamma} $ ratio be incorporated into the experimental design. During the preparation stage, this ratio for the target nuclide should be theoretically estimated. If the predicted ratio is lower than that of$ ^{209} $ Bi, the measurement conditions are relatively favorable. However, if the ratio is comparable to or even higher than that of$ ^{209} $ Bi, strict measures must be considered in the experimental design to minimize the impact of the scattering background on the final results. -
In the precise measurement of neutron capture cross sections, the scattering neutron is the primary source of systematic background. This interference is particularly significant for low cross section nuclides, such as
$ ^{209} $ Bi. Under conditions of limited statistics, residual components induced by scattered neutrons are difficult to eliminate entirely, even after background subtraction, which limits the quality of the experimental data. Based on this consideration, the ratio of the elastic scattering cross section to the capture cross section ($ \sigma_{\text{el}} / \sigma_{\gamma} $ ) is introduced as a preliminary physical indicator to evaluate the feasibility of such experiments.The selection of
$ ^{107,109} $ Ag as comparators is based on the fact that they are the nuclides with the lowest capture cross-sections successfully measured and published with high-quality data at the Back-n facility of CSNS to date [36, 39]. A comparison of the$ \sigma_{\text{el}} / \sigma_{\gamma} $ ratios for$ ^{107,109} $ Ag and$ ^{209} $ Bi is shown in Fig. 5. The results indicate that, when the$ \sigma_{\text{el}}/\sigma_{\gamma} $ ratio is less than 0.02, relatively clear cross-section results can be obtained. When the ratio exceeds$ 1.3 \times 10^{6} $ , high-quality experimental data cannot be obtained.
Figure 5. (color online) Comparison of neutron scattering to capture cross section ratios for
$ ^{209} $ Bi,$ ^{107} $ Ag, and$ ^{109} $ Ag.For future measurements of low-capture cross sections using
$ \text{C}_6\text{D}_6 $ detectors on the Back-n white neutron facility of CSNS, it is recommended that an initial assessment of the$ \sigma_{el} / \sigma_{\gamma} $ ratio be incorporated into the experimental design. During the preparation stage, this ratio should be estimated theoretically for the target nuclide. If the predicted ratio is lower than that of$ ^{209} $ Bi, the measurement conditions are relatively favorable. However, if the ratio is comparable to or even higher than that of$ ^{209} $ Bi, strict measures should be considered in the experimental design to minimize the impact of the scattering background on the final results. -
In neutron capture cross section measurements, the PHWT is primarily used to correct the detection efficiency. This technique involves applying an appropriate weighting function to the observed pulse height spectra. In the specific case of
$ ^{209} $ Bi, the number of effective capture events is extremely limited, resulting in a poor S/B ratio. When the polynomial weighting function is applied to these low-statistics data, it significantly amplifies the statistical fluctuations in the yield spectrum, as shown in Fig. 6. Consequently, the weak resonances are completely obscured by these amplified fluctuations, making it difficult to extract the capture cross section reliably .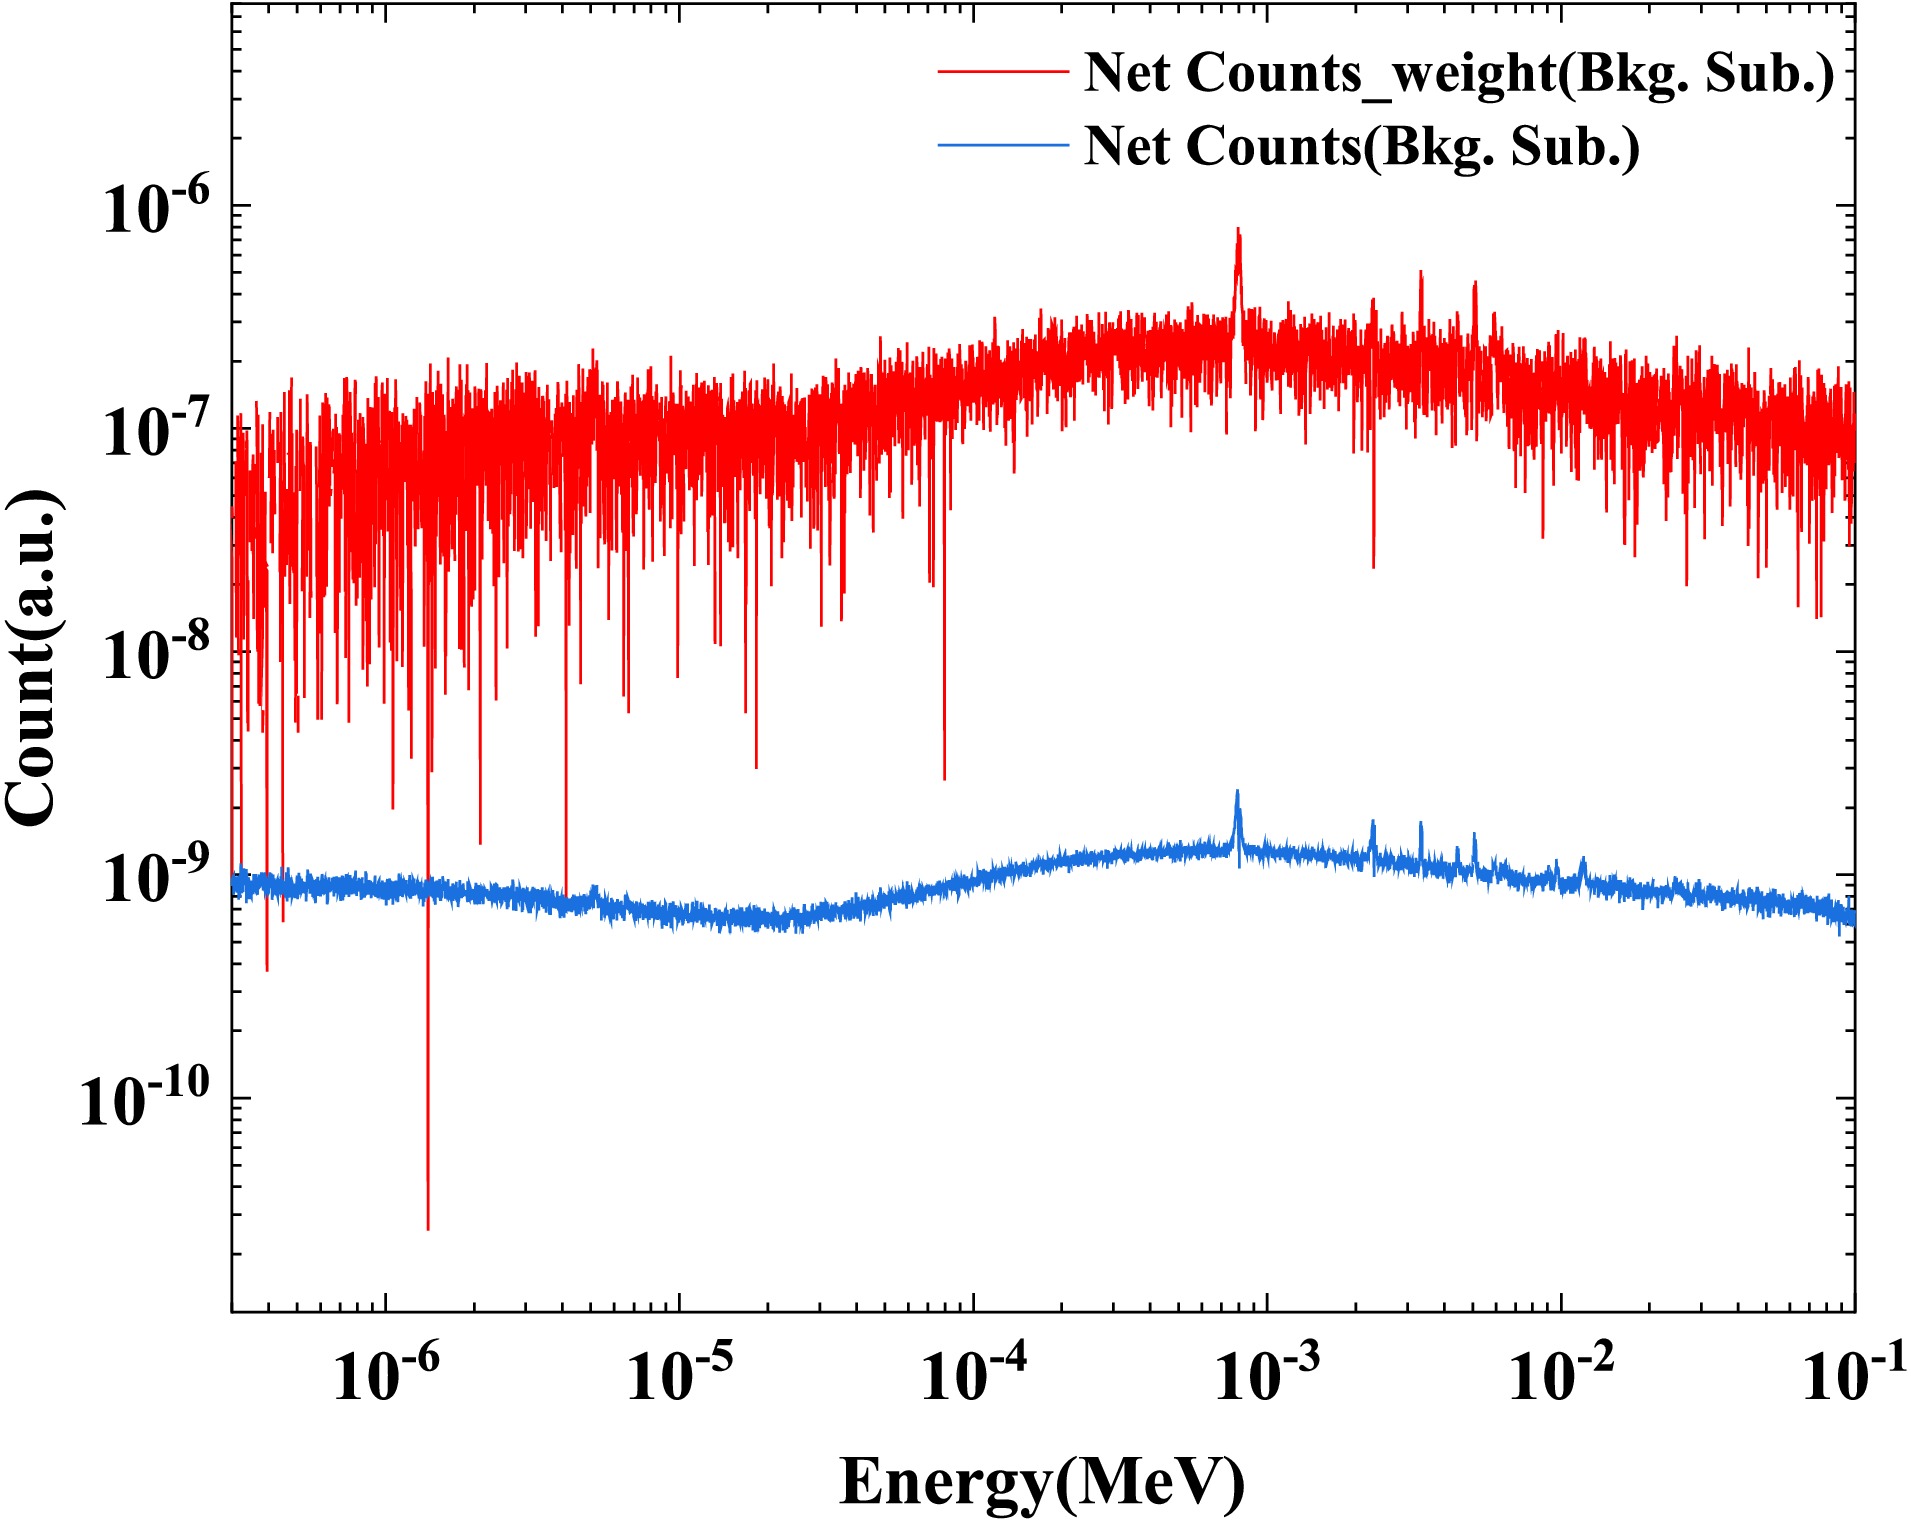
Figure 6. (color online) Comparison of the background-subtracted counts and weighted counts for
$ ^{209} $ Bi as a function of neutron energy.To address the issue of insufficient statistics, the most direct and effective approach is to extend the measurement time to accumulate more raw counts. Provided that the scattering background is well suppressed, increasing the sample thickness can also enhance the probability of capture events. However, thicker samples lead to more significant neutron self-shielding effects. Therefore, it is recommended to use a more precise point-wise weighting function instead of a polynomial weighting function [40]. This method allows a more accurate weighting treatment based on specific detector responses.
-
In neutron capture cross section measurements, the PHWT is primarily used to correct the detection efficiency. This technique is the application of an appropriate weighting function to the observed pulse height spectra. In the specific case of
$ ^{209} $ Bi, the number of effective capture events is extremely limited, resulting in a poor signal-to-background ratio. When the polynomial weighting function is applied to these low-statistics data, it significantly amplifies the statistical fluctuations in the yield spectrum, as shown in Fig. 6. Consequently, the weak resonances are completely obscured by these intensified fluctuations, making it difficult to reliably extract the capture cross section.
Figure 6. (color online) Comparison of the background-subtracted counts and the weighted counts for
$ ^{209} $ Bi as a function of neutron energy.To address the issue of insufficient statistics, the most direct and effective approach is to extend the measurement time to accumulate more raw counts. Provided that the scattering background is well suppressed, increasing the sample thickness can also enhance the probability of capture events. However, thicker samples lead to more significant neutron self-shielding effects. Therefore, it is recommended to use a more precise point-wise weighting function instead of the polynomial weighting function [41]. This method allows for a more accurate weighting treatment based on specific detector responses.
-
The choice of bin width is critical to the S/B ratio when processing the neutron capture data of
$ ^{209} $ Bi. To analyze the capture characteristics, different binning strategies were compared. As shown in Fig. 4, the positions of some small resonances were successfully identified using 6000 bins. However, because the$ ^{209} $ Bi capture cross section is extremely small and the experimental background is high, the signals are obscured by strong statistical fluctuations. This results in poorly defined resonances and a very low S/B ratio in unresolved-resonance regions. Considering the statistical limitations, a coarser binning of 100 bins was used to increase the counts per channel and obtain the average cross section, as shown in Fig. 7.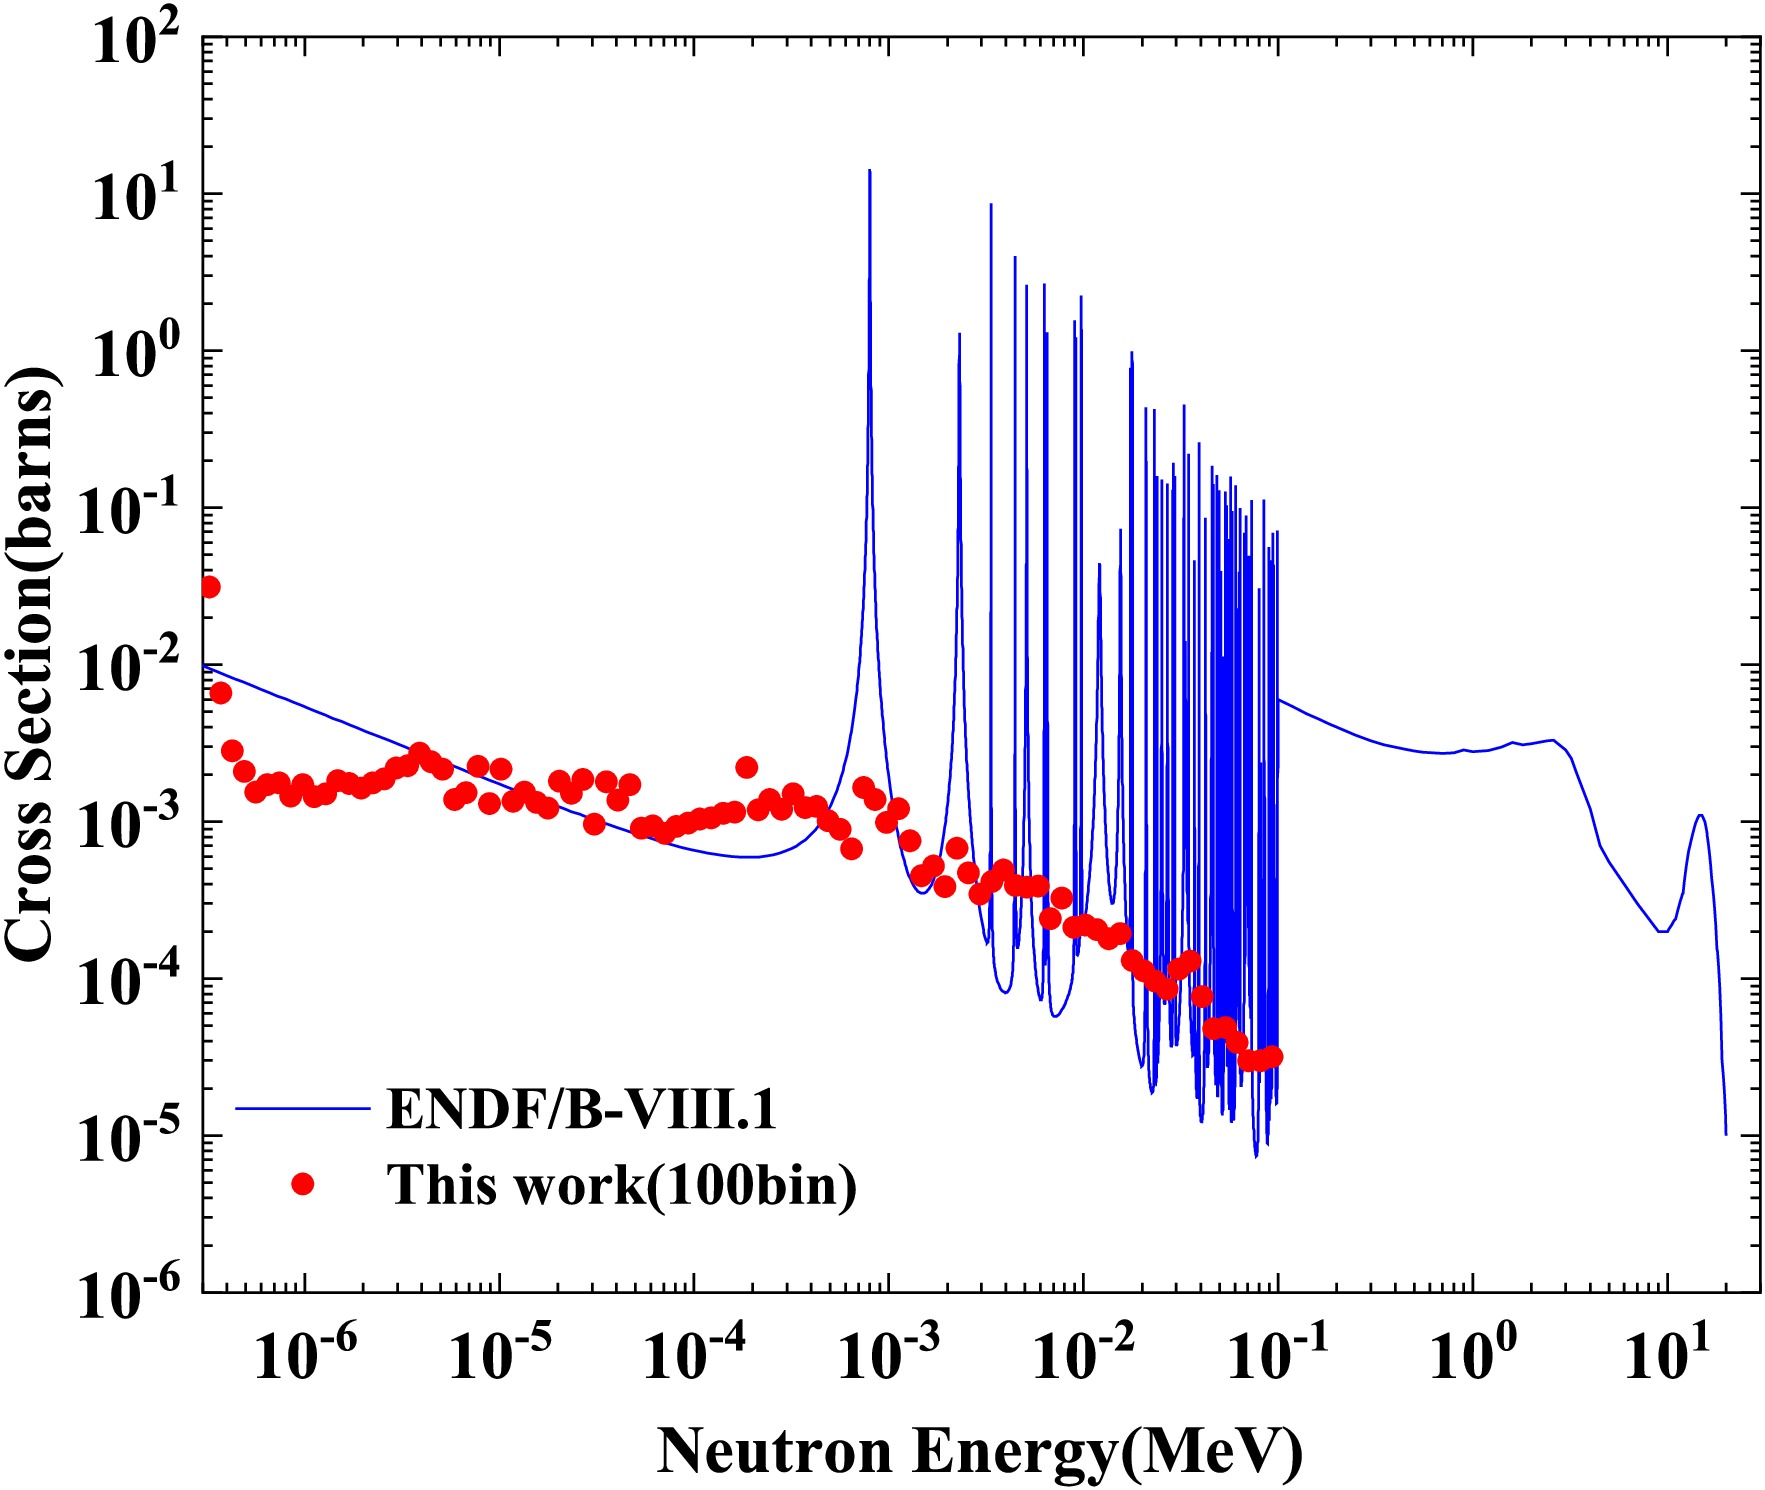
Figure 7. (color online) Measured
$ ^{209} $ Bi(n, γ) cross section (100 bins) compared with ENDF/B-VIII.1 evaluation.The macroscopic trend of the experimental cross section becomes clear with fewer bins. Nevertheless, large variations in the extracted cross section are still observed in the eV−keV energy region, where a smoother behavior would be expected. This indicates that the result is dominated by strong statistical uncertainties. Such fluctuations are mainly attributed to the background subtraction procedure, in which two large quantities (signal and background) are subtracted to obtain a small net signal, leading to substantial amplification of the associated uncertainties.
For the 100 bin energy grouping, the uncertainties introduced by background subtraction and the self-shielding factor are 1.1% and 1.1%, respectively. Other uncertainty components are summarized in Table 2. The total combined uncertainty for this energy region is less than 76.3%.
-
The choose of bin width is critical for the signal-to-background ratio when processing the neutron capture data of
$ ^{209} $ Bi. To analyze the capture characteristics, different binning strategies were compared. As shown in Fig. 4, the positions of some small resonances are successfully identified with 6000 bins. However, because the$ ^{209} $ Bi capture cross section is extremely small and the experimental background is high, the signals are obscured by strong statistical fluctuations. This results in poorly defined resonances and a very low signal-to-background in un-resolved-resonance regions. Considering the statistical limitations, a coarser binning of 100 bins was used to increase the counts per channel and obtain the average cross section, as shown in Fig. 7.
Figure 7. (color online) Measured
$ ^{209} $ Bi(n, γ) cross section (100 bins) compared with ENDF/B-VIII.1 evaluation.The macroscopic trend of the experimental cross section becomes clear with fewer bins. Nevertheless, a large variation of the extracted cross section is still observed in the eV–keV energy region, where a smoother behavior would be expected. This indicates that the result is dominated by strong statistical uncertainties. Such fluctuations are mainly attributed to the background subtraction procedure, in which two large quantities (signal and background) are subtracted to obtain a small net signal, leading to a substantial amplification of the associated uncertainties.
For the 100 bin energy grouping, the uncertainties introduced by background subtraction and the self-shielding factor are 1.1% and 1.1%, respectively. Other uncertainty components are summarized in Table 2. The total combined uncertainty for this energy region is found to be less than 76.3%.
-
A comparative analysis between this study and that conducted by Domingo-Pardo et al. [7, 8] was performed to understand why the
$ ^{209} $ Bi capture cross section is difficult to extract at CSNS. The detailed experimental conditions are summarized in Table 3.Parameters 2006 C. Domingo-Pardo [8] This study Flight path length 185 m 77 m Neutron source 20 GeV protons, 0.4 Hz 1.6 GeV protons, 25 Hz Neutron energy range A few meV to several GeV 0.1 eV to 200 MeV Pulse structure Single pulse, 6 ns Double-bunch mode, 410 ns interval $ \text{C}_6\text{D}_6 $ detector housingCarbon fiber thin wall 1.5 mm aluminum housing Detector support Suspended by thin strings Aluminum support and sample holder Sample thickness 6.1 mm 1 mm Sample diameter 20 mm 40 mm Irradiation time 60 h 40 h Table 3. Comparison of experimental conditions between the 2006 n_TOF experiment and this study.
In terms of experimental performance, n_TOF features a 6 ns pulse width and a 185 m flight path. This setup provides a better energy resolution than Back-n. The
$ ^{209} $ Bi isotope has an extremely small capture cross section but a very large scattering cross-section. To minimize backgrounds, the n_TOF experiment used customized C$ _6 $ D$ _6 $ detectors with carbon fiber housings and removed the quartz windows from the photomultiplier tubes. Additionally, a ceiling-suspension system was used to reduce the amount of aluminum and other metallic materials. In contrast, our experiment used aluminum casings and aluminum stands. These materials could potentially capture neutrons scattered from the Bi sample, resulting in additional prompt γ-ray background.To further compare this study with the n_TOF experiment, Geant4 simulations were performed. The CSNS experimental setup, including an aluminum casing, a 1.0 mm Bi target, and a sample holder, was used as the baseline. The impacts of the casing material, target thickness, and sample holder were systematically analyzed to evaluate their individual contributions to the S/B ratio. The simulation results are summarized in Table 4.
Configuration Signal (×103) Background (×106) S/B ratio (×10−4) Baseline (Al casing, 1 mm target) 10.00 48.38 2.07 (1%) Carbon fiber (replace Al casing) 9.94 47.98 2.07 (1%) 6.1 mm Bi target (replace 1 mm target) 54.14 179.79 3.01 (0.43%) Without holder (holder removed) 10.00 48.63 2.06 (1%) Table 4. Comparison of S/B ratios for different configurations.
Under the current physical model, the simulation results indicate that varying the sample thickness has the most significant impact on the S/B ratio. In contrast, replacing the aluminum casing with carbon fiber and removing the sample holder provide nearly negligible improvements. This suggests that neutron scattering from structural components is not the primary bottleneck limiting the S/B ratio in the current experimental environment.
Although the simulation results suggest that adjusting the target thickness is an effective approach to improve the S/B ratio, it should be noted that the modeling of collimator details and complex scattering environments was simplified. In real experiments, the composition of the neutron scattering background is much more complex. Therefore, the current quantitative analysis is primarily intended to reveal how individual parameters affect the S/B ratio.
-
A comparative analysis between this work and the study by Domingo-Pardo et al. [7, 8] was performed to understand why the
$ ^{209} $ Bi capture cross section is difficult to extract at CSNS. The detailed experimental conditions are summarized in Table 3.Parameters 2006 C. Domingo-Pardo [8] This work Flight path length 185 m 77 m Neutron source 20 GeV protons, 0.4 Hz 1.6 GeV protons, 25 Hz Neutron energy range a few meV to several GeV 0.1 eV to 200 MeV Pulse structure Single pulse, 6 ns Double-bunch mode, 410 ns interval $ \text{C}_6\text{D}_6 $ detector housingCarbon fiber thin wall 1.5 mm Aluminum housing Detector support Suspended by thin strings Aluminum support and sample holder Sample thickness 6.1 mm 1 mm Sample diameter 20 mm 40 mm Irradiation time 60 h 40 h Table 3. Comparison of experimental conditions between the 2006 n_TOF experiment and this work.
Regarding experimental performance, n_TOF features a 6 ns pulse width and a 185 m flight path. This setup provides a better energy resolution than the Back-n. The
$ ^{209} $ Bi isotope has an extremely small capture cross-section but a very large scattering cross-section. To minimize backgrounds, the n_TOF experiment used customized C$ _6 $ D$ _6 $ detectors with carbon fiber housings and removed the quartz windows of the photomultiplier tubes. Additionally, a ceiling-suspension system was used to reduce the amount of aluminum and other metallic materials. In contrast, our experiment used aluminum casings and aluminum stands. Such materials could potentially capture neutrons scattered from the Bi sample, which might result in an additional prompt γ-ray background.To further compare this work with the n_TOF experiment, Geant4 simulations were performed. The CSNS experimental setup (including an aluminum casing, a 1.0 mm Bi target, and a sample holder) was used as the baseline. We systematically analyzed the impacts of the casing material, target thickness, and sample holder to evaluate their individual contributions to the S/B ratio. The simulation results are summarized in Table 4.
Configuration Signal ( $ \times 10^3 $ )Background ( $ \times 10^6 $ )S/B ratio ( $ \times 10^{-4} $ )Baseline (Al casing, 1 mm target) 10.00 48.38 2.07 (1%) Carbon fiber (replace Al casing) 9.94 47.98 2.07 (1%) 6.1 mm Bi target (replace 1 mm target) 54.14 179.79 3.01 (0.43%) Without holder (holder removed) 10.00 48.63 2.06 (1%) Table 4. Comparison of S/B ratios for different configurations.
Under the current physical model, simulation results indicate that varying the sample thickness has the most significant impact on the S/B ratio. In contrast, replacing the aluminum casing with carbon fiber and removing the sample holder provide almost negligible improvements. This suggests that neutron scattering from structural components is not the primary bottleneck limiting the S/B ratio in the current experimental environment.
While simulation trends suggest that adjusting target thickness is an effective way to improve the S/B ratio, it should be noted that the modeling of collimator details and complex scattering environments has been simplified. In experiments, the composition of the neutron scattering background is much more complex. Therefore, the current quantitative analysis is primarily intended to reveal how individual parameters impact the S/B ratio.
-
This work is presented as a methodological study evaluating the technical feasibility and limitations of measuring neutron capture cross sections at the milli-barn scale using
$ \text{C}_6\text{D}_6 $ detectors at the Back-n facility of CSNS. Using$ ^{209}\text{Bi} $ as a case study, the neutron energy was determined by the TOF method, and the PHWT was applied to correct the detector efficiency. Background subtraction was performed using data from carbon and empty targets.The results indicate that the in-beam γ background was not fully subtracted due to issues with the Pb target data. Furthermore, the extremely small capture cross section of
$ ^{209} $ Bi results in limited signal statistics and an exceptionally high ratio of scattering-to-capture cross section ($ \sigma_{el}/\sigma_{\gamma} $ ). As a consequence, no clearly identifiable resonance structures are observed in the extracted$ ^{209} $ Bi capture cross section. Under these extreme conditions, the traditional polynomial weighting function significantly amplifies statistical fluctuations. Accordingly, the weak resonance structures are obscured by intense environmental and scattering-induced backgrounds. To extract the average cross section, a coarse binning strategy with 100 bins was adopted to suppress noise. However, the signal-to-background ratio remains suboptimal due to the low signal counts and uncertainties in the in-beam γ background subtraction.Based on these results, it is concluded that suppressing neutron scattering interference, achieving accurate background subtraction, and ensuring sufficient statistics are critical for measuring low cross-section nuclides in high-background environments. For future experiments, it is recommend to significantly increase the measurement time to improve statistics. Additionally, experimental designs should prioritize low-scattering lightweight detectors, such as those with carbon fiber casings, and optimized sample supports to minimize scattering backgrounds. Provided that the neutron scattering background is low, increasing the sample thickness combined with a point-wise weighting function is recommended for more refined data processing. Finally, the integrity and consistency of benchmark measurements must be ensured to facilitate reliable subtraction of complex backgrounds.
-
This study is presented as a methodological study evaluating the technical feasibility and limitations of measuring neutron capture cross sections at the milli-barn scale using
$ \text{C}_6\text{D}_6 $ detectors at the Back-n facility of CSNS. Using$ ^{209}\text{Bi} $ for a case study, the neutron energy was determined by the TOF method, and the PHWT was applied to correct the detector efficiency. Background subtraction was performed using data from carbon and empty targets.The results indicate that the in-beam γ-ray background was not fully subtracted owing to issues with the Pb target data. Furthermore, the extremely small capture cross section of
$ ^{209} $ Bi results in limited signal statistics and an exceptionally high ratio of scattering-to-capture cross section ($ \sigma_{el}/\sigma_{\gamma} $ ). As a consequence, no clearly identifiable resonance structures were observed in the extracted$ ^{209} $ Bi capture cross section. Under these extreme conditions, the traditional polynomial weighting function significantly amplifies statistical fluctuations. As a result, the weak resonance structures are obscured by intense environmental and scattering-induced backgrounds. To extract the average cross section, a coarse binning strategy with 100 bins was adopted to suppress noise. However, the S/B ratio remained suboptimal owing to the low signal counts and uncertainties in the in-beam γ-ray background subtraction.Based on these results, it is concluded that suppressing neutron scattering interference, achieving accurate background subtraction, and ensuring sufficient statistics are critical for measuring low cross-section nuclides in high-background environments. For future experiments, it is recommended that the measurement time be significantly increased to improve statistics. In addition, experimental designs should prioritize low-scattering, lightweight detectors, such as those with carbon fiber casings, and optimized sample supports to minimize scattering backgrounds. Provided that the neutron scattering background is low, increasing the sample thickness along with using a point-wise weighting function is recommended for more refined data processing. Finally, the integrity and consistency of benchmark measurements must be ensured to facilitate reliable subtraction of complex backgrounds.
-
We thank the staff members of the Back-n white neutron facility (https://cstr.cn/31113.02.CSNS.Back-n) at the China Spallation Neutron Source (CSNS) (https://cstr.cn/31113.02.CSNS), for providing technical support and assistance in data collection and analysis.
-
We thank the staff of the Back-n white neutron facility (https://cstr.cn/31113.02.CSNS.Back-n) at the China Spallation Neutron Source (CSNS) (https://cstr.cn/31113.02.CSNS) for providing technical support and assistance in data collection and analysis.
Measurement of the neutron capture cross section using C6D6 detectors at the milli-barn scale: a case study of 209Bi
- Received Date: 2026-02-08
- Available Online: 2026-07-15
Abstract: Accurate neutron capture cross section data are essential for validating nuclear models, understanding the origin of heavy elements, and improving reactor safety assessments. Measuring weakly absorbing nuclides at the milli-barn scale is challenging because of low-intensity signals, high levels of environmental background, and sensitivity to target impurities. To investigate the capability of $\text{C}_6\text{D}_6$ detectors for measuring the neutron capture cross sections at the milli-barn scale, an experiment on the $^{209}$Bi $(n, \gamma)$ reaction was performed at the Back-n white neutron facility of the China Spallation Neutron Source (CSNS). The data were processed using the time-of-flight (TOF) method and the pulse-height weighting technique (PHWT). Because of the notably small capture cross section of $^{209}$Bi and the complex background, the experimental results exhibited strong statistical fluctuations, making it difficult to identify resonance structures. To address this issue, the average capture cross section was determined by optimizing the energy binning. The reasons behind the resonance structures being obscured by the background were analyzed, and possible solutions were proposed. In this study, we provide valuable insights into the measurement of nuclides with low neutron capture cross sections using $\text{C}_6\text{D}_6$ detectors.


 DownLoad: