


 Abstract
 HTML
HTML Reference
 Related
 PDF
PDF


-
The rapid neutron-capture process (r-process) is responsible for roughly half of the elements heavier than iron [1−4]. In neutron-rich environments, the reaction flow can proceed to very heavy nuclei, where neutron-induced fission competes with neutron capture and β-decay [5−7]. Once fission dominates, fission recycling regulates the production of actinides and shapes the late-time abundance patterns of heavy elements [8−11]. Consequently, identifying the onset of fission cycling is a central problem in r-process nucleosynthesis.
For a given astrophysical environment
$ (T_9, n_n) $ , the onset of fission cycling depends on whether the r-process path reaches nuclei for which neutron-induced fission is faster than β-decay and on the first nucleus along the path that satisfies this condition [12]. These nuclei are expected to be located primarily in the actinide and light transuranic region near the predicted shell closure at$ N \approx 184 $ [10, 13]. In this region, nuclear masses, fission barriers, and decay properties remain highly uncertain, with significant discrepancies among global nuclear models [7, 13, 14]. Consequently, both the predicted location and the robustness of fission cycling vary considerably across existing studies, highlighting their strong dependence on nuclear physics inputs [8, 10, 12, 15].Most previous studies of fission cycling have relied on reaction-network nucleosynthesis, either through post-processing of hydrodynamic ejecta trajectories (e.g., [16−18]) or via parameterized surveys across a fixed set of outflow conditions (e.g., [19]). Complementary studies have focused on deriving neutron-induced fission rates and quantifying their model dependence (e.g., [12]). Although these network-based approaches have yielded valuable insights, they offer limited guidance for establishing a systematic correlation between the onset of fission cycling and the underlying nuclear structure inputs across the full
$ (T_9, n_n) $ plane. In particular, the correlation between the equilibrium r-process path and the onset of fission cycling, as a function of temperature and neutron density, has not been explored in a continuous and reproducible manner [20].In this work, we develop a systematic framework to identify the onset of fission cycling across the
$ (T_9, n_n) $ plane. Building on the structural trends of neutron-rich isotopic chains near the predicted$ N \approx 184 $ shell closure, we first determine the thermodynamic conditions under which the equilibrium r-process path enters the very heavy mass region, thereby forming a continuous band in the$ (T_9, n_n) $ plane [21−23].We then construct an equilibrium path band based on the effective neutron separation energy
$ S_{{{n}}}^{0} $ as a structural criterion. This band includes nuclei whose separation-energy systematics are consistent with the equilibrium r-process path in this region. In particular, we focus on nuclei with$ 94 \le Z \le 106 $ , corresponding to actinide and early transuranic nuclei that are most relevant for fission cycling.Finally, we perform point-by-point evaluations of neutron-induced fission and β-decay lifetimes using a consistent set of nuclear inputs. For each
$ (T_9, n_n) $ condition, the first nucleus satisfying$ \tau_{n,{\rm{f}}} \lt \tau_{\beta} $ is identified as marking the onset of fission cycling.By combining the heavy-region condition band with these lifetime evaluations, the framework yields a global and transparent map of fission-cycling onset nuclei across the
$ (T_9, n_n) $ plane. This provides a complementary perspective to traditional trajectory-based r-process studies. -
The rapid neutron-capture process (r-process) is responsible for roughly half of the elements heavier than iron [1−4]. In neutron-rich environments, the reaction flow can proceed to very heavy nuclei, where neutron-induced fission competes with neutron capture and β-decay [5−7]. Once fission dominates, fission recycling regulates the production of actinides and shapes the late-time abundance patterns of heavy elements [8−11]. Consequently, identifying the onset of fission cycling is a central problem in r-process nucleosynthesis.
For a given astrophysical environment
$ (T_9, n_n) $ , the onset of fission cycling depends on whether the r-process path reaches nuclei for which neutron-induced fission is faster than β-decay and on the first nucleus along the path that satisfies this condition [12]. These nuclei are expected to be located primarily in the actinide and light transuranic region near the predicted shell closure at$ N \approx 184 $ [10, 13]. In this region, nuclear masses, fission barriers, and decay properties remain highly uncertain, with significant discrepancies among global nuclear models [7, 13, 14]. Consequently, both the predicted location and the robustness of fission cycling vary considerably across existing studies, highlighting their strong dependence on nuclear physics inputs [8, 10, 12, 15].Most previous studies of fission cycling have relied on reaction-network nucleosynthesis, either through post-processing of hydrodynamic ejecta trajectories (e.g., [16−18]) or via parameterized surveys across a fixed set of outflow conditions (e.g., [19]). Complementary studies have focused on deriving neutron-induced fission rates and quantifying their model dependence (e.g., [12]). Although these network-based approaches have yielded valuable insights, they offer limited guidance for establishing a systematic correlation between the onset of fission cycling and the underlying nuclear structure inputs across the full
$ (T_9, n_n) $ plane. In particular, the correlation between the equilibrium r-process path and the onset of fission cycling, as a function of temperature and neutron density, has not been explored in a continuous and reproducible manner [20].In this work, we develop a systematic framework to identify the onset of fission cycling across the
$ (T_9, n_n) $ plane. Building on the structural trends of neutron-rich isotopic chains near the predicted$ N \approx 184 $ shell closure, we first determine the thermodynamic conditions under which the equilibrium r-process path enters the very heavy mass region, thereby forming a continuous band in the$ (T_9, n_n) $ plane [21−23].We then construct an equilibrium path band based on the effective neutron separation energy
$ S_{{\rm{n}}}^{0} $ as a structural criterion. This band includes nuclei whose separation-energy systematics are consistent with the equilibrium r-process path in this region. In particular, we focus on nuclei with$ 94 \le Z \le 106 $ , corresponding to actinide and early transuranic nuclei that are most relevant for fission cycling.Finally, we perform point-by-point evaluations of neutron-induced fission and β-decay lifetimes using a consistent set of nuclear inputs. For each
$ (T_9, n_n) $ condition, the first nucleus satisfying$ \tau_{n,{\rm{f}}} \lt \tau_{\beta} $ is identified as marking the onset of fission cycling.By combining the heavy-region condition band with these lifetime evaluations, the framework yields a global and transparent map of fission-cycling onset nuclei across the
$ (T_9, n_n) $ plane. This provides a complementary perspective to traditional trajectory-based r-process studies. -
The rapid neutron-capture process (r-process) is responsible for roughly half of the elements heavier than iron [1−4]. In neutron-rich environments, the reaction flow can proceed to very heavy nuclei, where neutron-induced fission competes with neutron capture and β-decay [5−7]. Once fission dominates, fission recycling regulates the production of actinides and shapes the late-time abundance patterns of heavy elements [8−11]. Consequently, identifying the onset of fission cycling is a central problem in r-process nucleosynthesis.
For a given astrophysical environment
$ (T_9, n_n) $ , the onset of fission cycling depends on whether the r-process path reaches nuclei for which neutron-induced fission is faster than β-decay and on the first nucleus along the path that satisfies this condition [12]. These nuclei are expected to be located primarily in the actinide and light transuranic region near the predicted shell closure at$ N \approx 184 $ [10, 13]. In this region, nuclear masses, fission barriers, and decay properties remain highly uncertain, with significant discrepancies among global nuclear models [7, 13, 14]. Consequently, both the predicted location and the robustness of fission cycling vary considerably across existing studies, highlighting their strong dependence on nuclear physics inputs [8, 10, 12, 15].Most previous studies of fission cycling have relied on reaction-network nucleosynthesis, either through post-processing of hydrodynamic ejecta trajectories (e.g., [16−18]) or via parameterized surveys across a fixed set of outflow conditions (e.g., [19]). Complementary studies have focused on deriving neutron-induced fission rates and quantifying their model dependence (e.g., [12]). Although these network-based approaches have yielded valuable insights, they offer limited guidance for establishing a systematic correlation between the onset of fission cycling and the underlying nuclear structure inputs across the full
$ (T_9, n_n) $ plane. In particular, the correlation between the equilibrium r-process path and the onset of fission cycling, as a function of temperature and neutron density, has not been explored in a continuous and reproducible manner [20].In this work, we develop a systematic framework to identify the onset of fission cycling across the
$ (T_9, n_n) $ plane. Building on the structural trends of neutron-rich isotopic chains near the predicted$ N \approx 184 $ shell closure, we first determine the thermodynamic conditions under which the equilibrium r-process path enters the very heavy mass region, thereby forming a continuous band in the$ (T_9, n_n) $ plane [21−23].We then construct an equilibrium path band based on the effective neutron separation energy
$ S_{{{n}}}^{0} $ as a structural criterion. This band includes nuclei whose separation-energy systematics are consistent with the equilibrium r-process path in this region. In particular, we focus on nuclei with$ 94 \le Z \le 106 $ , corresponding to actinide and early transuranic nuclei that are most relevant for fission cycling.Finally, we perform point-by-point evaluations of neutron-induced fission and β-decay lifetimes using a consistent set of nuclear inputs. For each
$ (T_9, n_n) $ condition, the first nucleus satisfying$ \tau_{n,{\rm{f}}} \lt \tau_{\beta} $ is identified as marking the onset of fission cycling.By combining the heavy-region condition band with these lifetime evaluations, the framework yields a global and transparent map of fission-cycling onset nuclei across the
$ (T_9, n_n) $ plane. This provides a complementary perspective to traditional trajectory-based r-process studies. -
The framework developed in Sec. 3 relies on a consistent set of nuclear inputs that characterize the structural properties of neutron-rich nuclei and govern the competition between β-decay and neutron-induced fission.
-
The framework developed in Sec. III relies on a consistent set of nuclear inputs that characterize the structural properties of neutron-rich nuclei and govern the competition between β-decay and neutron-induced fission.
-
The framework developed in Sec. III relies on a consistent set of nuclear inputs that characterize the structural properties of neutron-rich nuclei and govern the competition between β-decay and neutron-induced fission.
-
All structural quantities used in constructing the equilibrium path are derived from the FRDM2012 global mass model [24]. The one- and two-neutron separation energies are defined as
$ \begin{aligned}[b] S_{{{n}}}(Z,A) &= B(Z,A) - B(Z,A-1), \\ S_{2{{n}}}(Z,A) &= B(Z,A) - B(Z,A-2). \end{aligned} $
(1) These considerations form the basis for evaluating equilibrium abundance ratios and for identifying structural trends among adjacent isotopic chains, including evolution toward the predicted neutron shell closure at
$ N \approx 184 $ . The behavior of$ S_{2{{n}}} $ across the actinide region determines the selection of a consistent Z window for constructing the heavy-region condition band in the$ (T_9,n_n) $ plane. -
All structural quantities used in constructing the equilibrium path are derived from the FRDM2012 global mass model [24]. The one- and two-neutron separation energies are defined as
$ \begin{aligned}[b] S_{{\rm{n}}}(Z,A) &= B(Z,A) - B(Z,A-1), \\ S_{2{\rm{n}}}(Z,A) &= B(Z,A) - B(Z,A-2), \end{aligned} $
(1) These considerations form the basis for evaluating equilibrium abundance ratios and for identifying structural trends among adjacent isotopic chains, including evolution toward the predicted neutron shell closure at
$ N \approx 184 $ . The behavior of$ S_{2{\rm{n}}} $ across the actinide region determines the selection of a consistent Z window for constructing the heavy-region condition band in the$ (T_9,n_n) $ plane. -
All structural quantities used in constructing the equilibrium path are derived from the FRDM2012 global mass model [24]. The one- and two-neutron separation energies are defined as
$ \begin{aligned}[b] S_{{{n}}}(Z,A) &= B(Z,A) - B(Z,A-1), \\ S_{2{{n}}}(Z,A) &= B(Z,A) - B(Z,A-2). \end{aligned} $
(1) These considerations form the basis for evaluating equilibrium abundance ratios and for identifying structural trends among adjacent isotopic chains, including evolution toward the predicted neutron shell closure at
$ N \approx 184 $ . The behavior of$ S_{2{{n}}} $ across the actinide region determines the selection of a consistent Z window for constructing the heavy-region condition band in the$ (T_9,n_n) $ plane. -
Neutron-induced fission lifetimes are derived from stellar reaction rates computed with the TALYS 2.0 nuclear reaction code in astrophysical-rate mode [25]. Throughout this work, a uniform set of nuclear-physics inputs is employed to ensure consistency across the nuclear region under study.
Nuclear masses for the reaction-rate calculations are taken from the Möller finite-range droplet model (FRDM2012), which provides the structural baseline for this study. Neutron-induced fission is treated as a competing decay channel of the compound nucleus. For the baseline onset mapping, fission barriers follow the standard TALYS prescription: experimentally constrained barriers are adopted where available; otherwise, a macroscopic rotating liquid-drop model is used.
These stellar neutron-induced fission rates are then converted to the corresponding fission lifetimes. The sensitivity of the inferred onset nuclei to the adopted nuclear mass model and to alternative fission-barrier prescriptions is examined separately in Sec. V.A and V.B.
-
Neutron-induced fission lifetimes are derived from stellar reaction rates computed with the TALYS 2.0 nuclear reaction code in astrophysical-rate mode [25]. Throughout this work, a uniform set of nuclear-physics inputs is employed to ensure consistency across the nuclear region under study.
Nuclear masses for the reaction-rate calculations are taken from the Möller finite-range droplet model (FRDM2012), which provides the structural baseline for this study. Neutron-induced fission is treated as a competing decay channel of the compound nucleus. For the baseline onset mapping, fission barriers follow the standard TALYS prescription: experimentally constrained barriers are adopted where available; otherwise, a macroscopic rotating liquid-drop model is used.
These stellar neutron-induced fission rates are then converted to the corresponding fission lifetimes. The sensitivity of the inferred onset nuclei to the adopted nuclear mass model and to alternative fission-barrier prescriptions is examined separately in Secs. 5.1 and 5.2.
-
Neutron-induced fission lifetimes are derived from stellar reaction rates computed with the TALYS 2.0 nuclear reaction code in astrophysical-rate mode [25]. Throughout this work, a uniform set of nuclear-physics inputs is employed to ensure consistency across the nuclear region under study.
Nuclear masses for the reaction-rate calculations are taken from the Möller finite-range droplet model (FRDM2012), which provides the structural baseline for this study. Neutron-induced fission is treated as a competing decay channel of the compound nucleus. For the baseline onset mapping, fission barriers follow the standard TALYS prescription: experimentally constrained barriers are adopted where available; otherwise, a macroscopic rotating liquid-drop model is used.
These stellar neutron-induced fission rates are then converted to the corresponding fission lifetimes. The sensitivity of the inferred onset nuclei to the adopted nuclear mass model and to alternative fission-barrier prescriptions is examined separately in Sec. V.A and V.B.
-
β-decay lifetimes are taken from the large-scale QRPA calculations of Marketin et al. [26], which provide consistent coverage of neutron-rich heavy nuclei. These lifetimes are used to compare β-decay and neutron-induced fission lifetimes along the actinide segments of the equilibrium path band, and to identify, for each
$ (T_9, n_n) $ point, the nucleus satisfying$ \tau_{n,{\rm{f}}} \lt \tau_{\beta} $ . -
Taken together, the FRDM2012 nuclear masses, TALYS stellar reaction rates, and QRPA β-decay lifetimes form the set of nuclear inputs used to construct the heavy-region condition band, define the equilibrium path band, and determine the onset of fission cycling across the
$ (T_9, n_n) $ plane. -
Taken together, the FRDM2012 nuclear masses, TALYS stellar reaction rates, and QRPA β-decay lifetimes form the set of nuclear inputs used to construct the heavy-region condition band, define the equilibrium path band, and determine the onset of fission cycling across the
$ (T_9, n_n) $ plane. -
Taken together, the FRDM2012 nuclear masses, TALYS stellar reaction rates, and QRPA β-decay lifetimes form the set of nuclear inputs used to construct the heavy-region condition band, define the equilibrium path band, and determine the onset of fission cycling across the
$ (T_9, n_n) $ plane. -
This section outlines the computational framework used to determine the conditions under which the equilibrium r-process path can reach the very heavy neutron-rich region. The predicted shell closure at
$ N \approx 184 $ is adopted as a structural reference.The framework also identifies, for each
$ (T_9, n_n) $ condition, the first nucleus for which neutron-induced fission outpaces β-decay.Our methodology builds on and extends the waiting-point (WP) formulation of Xu et al. [27], incorporating additional structural diagnostics, equilibrium-path filtering, and large-scale reaction-lifetime calculations using TALYS 2.0.
-
In
$ (n,\gamma)\rightleftarrows(\gamma,n) $ equilibrium, the abundance ratio between adjacent isotopes within an isotopic chain follows the standard Saha relation [28]. For completeness, we briefly summarize the key elements of the equilibrium formulation introduced in Ref. [27] that are needed for the present work. It is convenient to group the slowly varying prefactors—including the neutron density, thermal phase-space factor, partition function, and mass factors—into a single effective quantity, thereby defining the equilibrium one-neutron separation energy$ S_n^0(T_9, n_n) $ .With this definition, the abundance ratio can be written in a compact form
$ \begin{aligned} \frac{Y(Z,A+1)}{Y(Z,A)} \simeq \exp \left[ \frac{ S_{{{n}}}(Z,A+1) - S_{{{n}}}^{0}(T_{9}, n_{n}) }{ k T } \right] \, , \end{aligned} $
(2) where Y denotes the nuclear abundance and
$ S_n $ the one-neutron separation energy.The equilibrium r-process path is defined by the condition
$ Y(Z,A+1)/Y(Z,A)=1 $ , which is equivalent to the separation-energy condition$ \begin{aligned} S_{{{n}}}(Z,A) = S_{{{n}}}^{0}(T_{9}, n_{n}) \, . \end{aligned} $
(3) In practical applications, the partition-function ratio
$ G(Z,A+1)/G(Z,A) $ and the mass factor$ (A+1)/A $ are typically set to unity, because their deviations from unity are small and therefore have a negligible impact on$ S_n^0 $ over the relevant thermodynamic range. Under this approximation,$ S_n^0 $ depends solely on$ (T_9, n_n) $ and assumes the analytic form derived by Xu et al. [27] for$ (n,\gamma) \rightleftharpoons (\gamma,n) $ equilibrium in r-process environments:$ \begin{aligned} S_{{{n}}}^{0}(T_{9}, n_{n}) \;\approx\; T_{9}\left[ 2.79 + \frac{ 1.5\,\log_{10} T_{9} - \log_{10} \left( \dfrac{n_{n}}{10^{20}\,{\rm{cm^{-3}}}} \right) }{5.04} \right]\,. \end{aligned} $
(4) This expression captures the joint dependence of isotopic abundance ratios on temperature and neutron density and is valid over the ranges
$ 1 \leqslant T_9 \leqslant 3 $ and$ 10^{20} \leqslant n_n \leqslant 10^{30}{\, \rm{cm^{-3}}} $ , which are consistent with the astrophysical conditions considered in this work. -
In
$ (n,\gamma)\rightleftarrows(\gamma,n) $ equilibrium, the abundance ratio between adjacent isotopes within an isotopic chain follows the standard Saha relation [28]. For completeness, we briefly summarize the key elements of the equilibrium formulation introduced in Ref. [27] that are needed for the present work. It is convenient to group the slowly varying prefactors—including the neutron density, thermal phase-space factor, partition function, and mass factors—into a single effective quantity, thereby defining the equilibrium one-neutron separation energy$ S_n^0(T_9, n_n) $ .With this definition, the abundance ratio can be written in a compact form
$ \begin{aligned} \frac{Y(Z,A+1)}{Y(Z,A)} \simeq \exp \left[ \frac{ S_{{\rm{n}}}(Z,A+1) - S_{{\rm{n}}}^{0}(T_{9}, n_{n}) }{ k T } \right] \, , \end{aligned} $
(2) where Y denotes the nuclear abundance and
$ S_n $ the one-neutron separation energy.The equilibrium r-process path is defined by the condition
$ Y(Z,A+1)/Y(Z,A)=1 $ , which is equivalent to the separation-energy condition$ \begin{aligned} S_{{\rm{n}}}(Z,A) = S_{{\rm{n}}}^{0}(T_{9}, n_{n}) \, . \end{aligned} $
(3) In practical applications, the partition-function ratio
$ G(Z,A+1)/G(Z,A) $ and the mass factor$ (A+1)/A $ are typically set to unity, because their deviations from unity are small and therefore have a negligible impact on$ S_n^0 $ over the relevant thermodynamic range. Under this approximation,$ S_n^0 $ depends solely on$ (T_9, n_n) $ and assumes the analytic form derived by Xu et al. [27] for$ (n,\gamma) \rightleftharpoons (\gamma,n) $ equilibrium in r-process environments:$ \begin{aligned} S_{{\rm{n}}}^{0}(T_{9}, n_{n}) \;\approx\; T_{9}\left[ 2.79 + \frac{ 1.5\,\log_{10} T_{9} - \log_{10} \left( \dfrac{n_{n}}{10^{20}\,{\rm{cm^{-3}}}} \right) }{5.04} \right]\,, \end{aligned} $
(4) This expression captures the joint dependence of isotopic abundance ratios on temperature and neutron density and is valid over the ranges
$ 1 \leqslant T_9 \leqslant 3 $ and$ 10^{20} \leqslant n_n \leqslant 10^{30},{\rm{cm^{-3}}} $ , which are consistent with the astrophysical conditions considered in this work. -
In this work, we adopt and explicitly implement the critical waiting-point (CWP) framework introduced by Xu et al. [27], which is based on the equilibrium formulation summarized in Sec. III.A. Within this framework, the equilibrium r-process path, under
$ (n,\gamma)\rightleftarrows(\gamma,n) $ conditions, proceeds predominantly along even-N isotopic chains and is characterized by a nearly constant effective neutron separation energy$ S_n^0(T_9, n_n) $ .CWP nuclei constitute a subset of waiting-point nuclei that primarily constrain the thermodynamic conditions required for the formation of a given r-process abundance peak. Using the definition of
$ S_n^0(T_9, n_n) $ from Sec. III.A, the CWP condition can be expressed in terms of separation-energy systematics along an even-N isotopic chain. For two even-N isotopes$ (Z,N) $ and$ (Z,N+2) $ within the same isotopic chain, the abundance ratio follows from Eq. (2) as:$ \begin{aligned} \frac{Y(Z,A)}{Y(Z,A-2)} \simeq \exp \left[ \frac{ S_{2{{n}}}(Z,A) - 2 S_{{{n}}}^{0}(T_{9}, n_{n}) }{ k T } \right] \, . \end{aligned} $
(5) This provides the basis for deriving the CWP condition. Specifically, a nucleus
$ (Z,N) $ satisfies the CWP condition if$ S_n^0(T_9, n_n) $ lies between the two adjacent values of$ S_{2{{n}}}/2 $ within the same even-N isotopic chain, i.e.,$ \begin{aligned} \frac{1}{2} S_{2{{n}}}(Z,N+2) \;\lesssim\; S_{{{n}}}^{0}(T_{9}, n_{n}) \;\lesssim\; \frac{1}{2} S_{2{{n}}}(Z,N) \, . \end{aligned} $
(6) This defines the range of
$ S_n^0 $ for which$ (Z,N) $ serves as a CWP nucleus along the equilibrium path.For completeness, the canonical CWP nuclei associated with the classical shell closures at
$ N=50,\, 82, $ and 126, as reported in Ref. [27], are listed in Table 1.N CWP nuclei 50 $ ^{80}{\rm{Zn}} $ ,$ ^{79}{\rm{Cu}} $ ,$ ^{78}{\rm{Ni}} $ 82 $ ^{130}{\rm{Cd}} $ ,$ ^{129}{\rm{Ag}} $ ,$ ^{128}{\rm{Pd}} $ ,$ ^{127}{\rm{Rh}} $ ,$ ^{126}{\rm{Ru}} $ 126 $ ^{195}{\rm{Tm}} $ ,$ ^{194}{\rm{Er}} $ ,$ ^{193}{\rm{Ho}} $ ,$ ^{192}{\rm{Dy}} $ ,$ ^{191}{\rm{Tb}} $ Table 1. Critical waiting-point nuclei.
For each even-N isotopic chain near a shell closure, we combine Eq. (6) with the functional form of
$ S_n^0(T_9, n_n) $ to map the CWP condition onto a finite region in the$ (T_9, n_n) $ plane. The intersection of these regions for selected CWP nuclei then defines the thermodynamic conditions necessary to produce the corresponding r-process abundance peak under equilibrium assumptions.Applying this construction to the classical shell closures at
$ N=50, \, 82,\, 126 $ with FRDM2012 separation energies reproduces the systematic trends reported by Xu et al. [27] (Fig. 1), thereby validating our implementation of the CWP framework. This result provides a methodological basis for extending the analysis to the region near$ N \approx 184 $ , a predicted shell closure relevant to actinide nucleosynthesis. By adopting the separation-energy systematics of these classical CWP nuclei as a structural baseline, we ensure that the present analysis of the onset of fission cycling remains consistent with the original framework while adapting it to the thermodynamic conditions of heavy-element nucleosynthesis.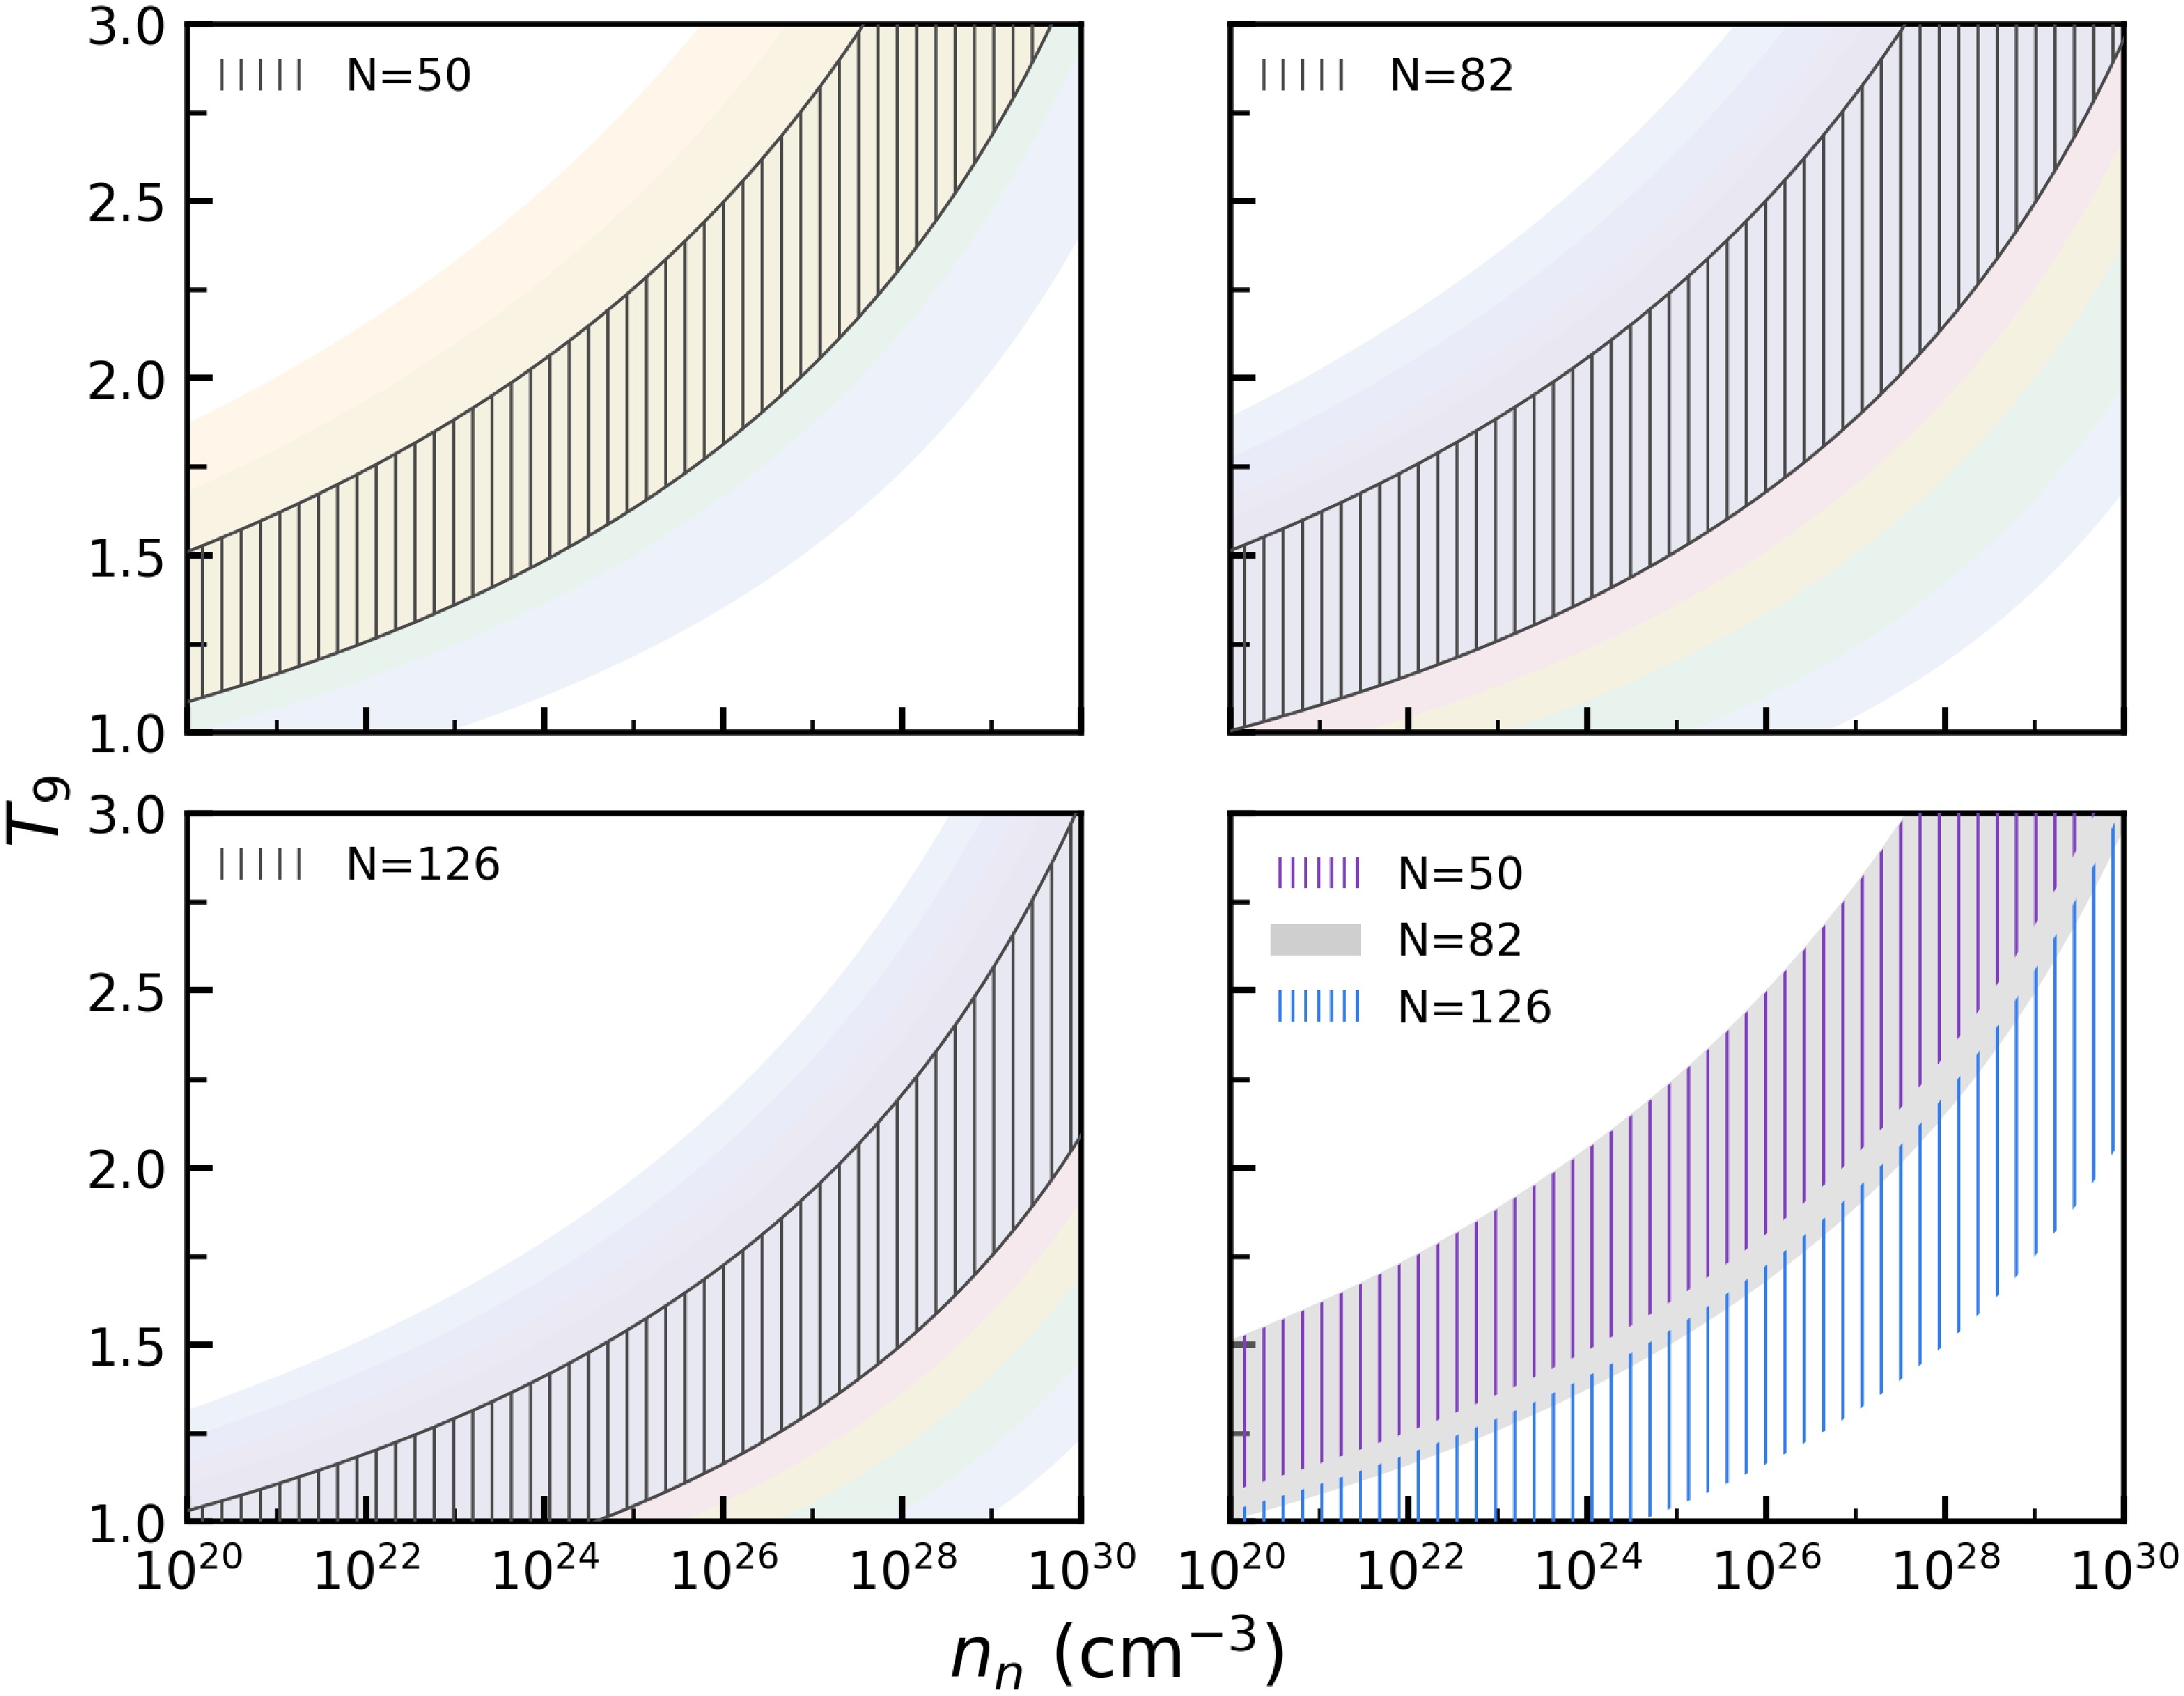
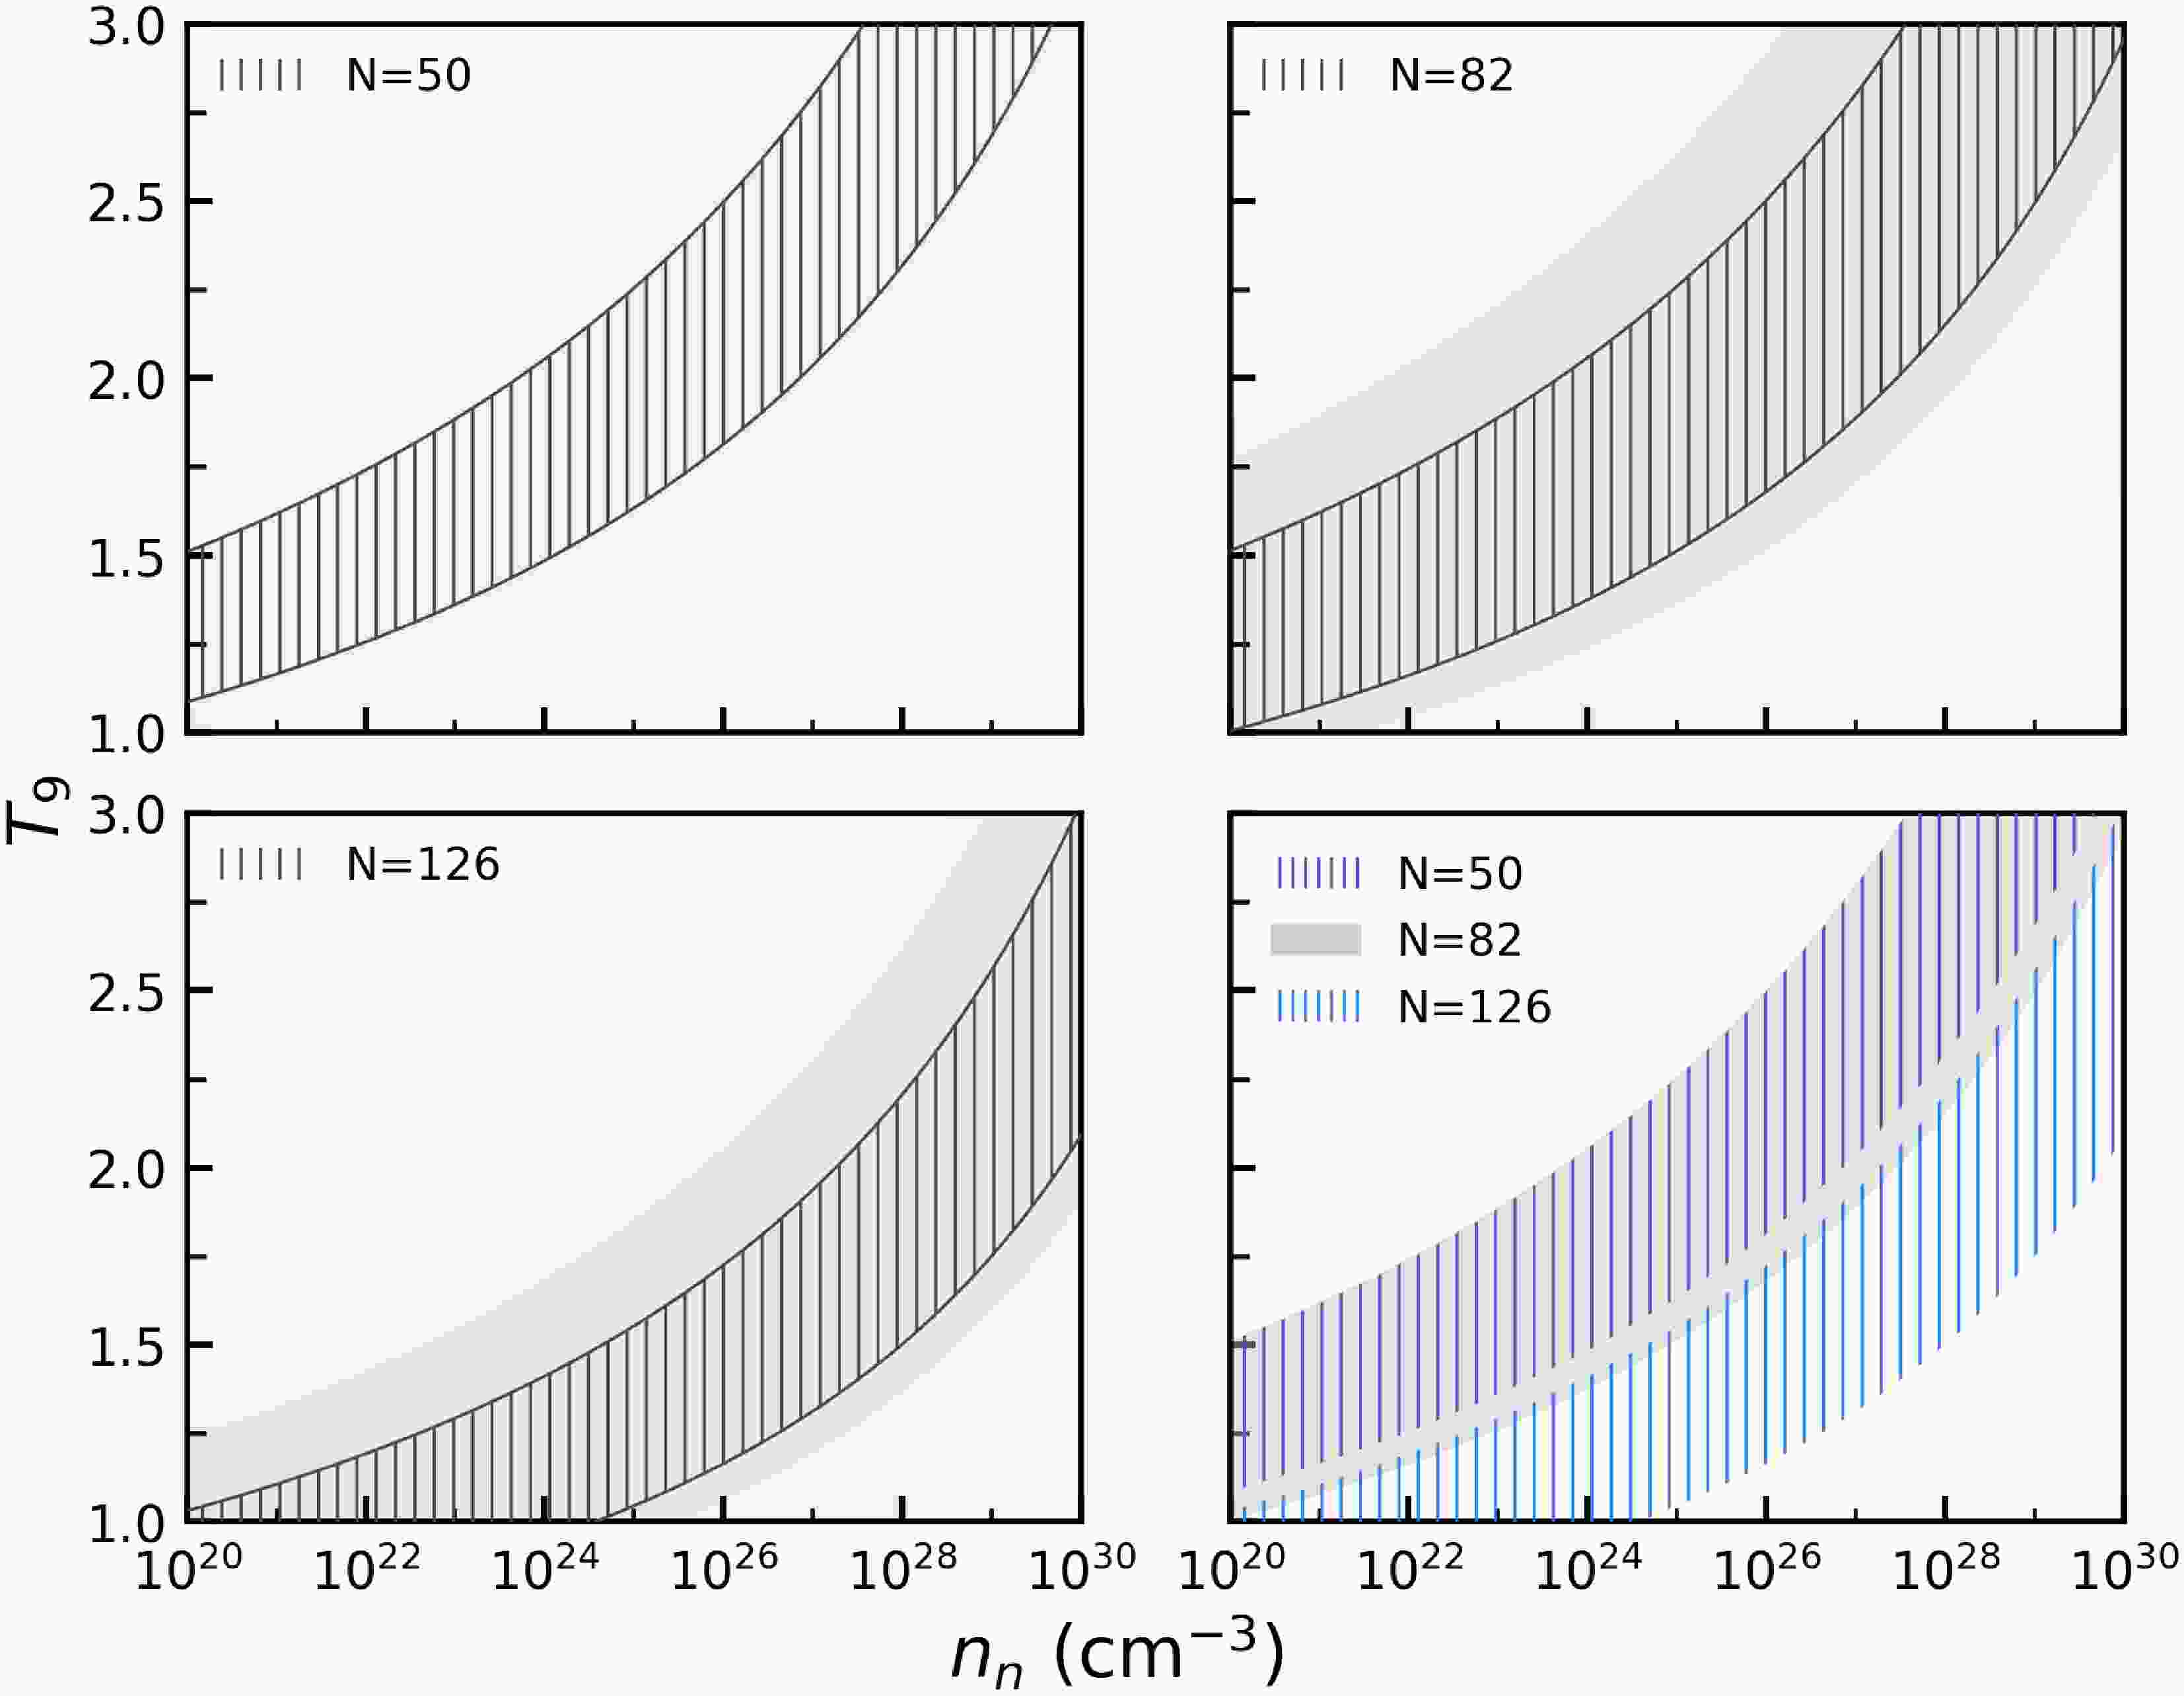
Figure 1. (color online) The
$T_9-n_n $ conditions required by the$N = $ 50, 82, and 126 CWP nuclei. The lower-right panel compares the relative locations and overlaps of these conditions for the three shell closures. Results are based on FRDM2012 separation energies and reproduce the trends reported by Xu et al. [27]. -
In this work, we adopt and explicitly implement the critical waiting-point (CWP) framework introduced by Xu et al. [27], which is based on the equilibrium formulation summarized in Sec. 3.1. Within this framework, the equilibrium r-process path, under
$ (n,\gamma)\rightleftarrows(\gamma,n) $ conditions, proceeds predominantly along even-N isotopic chains and is characterized by a nearly constant effective neutron separation energy$ S_n^0(T_9, n_n) $ .CWP nuclei constitute a subset of waiting-point nuclei that primarily constrain the thermodynamic conditions required for the formation of a given r-process abundance peak. Using the definition of
$ S_n^0(T_9, n_n) $ from Sec. 3.1, the CWP condition can be expressed in terms of separation-energy systematics along an even-N isotopic chain. For two even-N isotopes$ (Z,N) $ and$ (Z,N+2) $ within the same isotopic chain, the abundance ratio follows from Eq. (2) as:$ \begin{aligned} \frac{Y(Z,A)}{Y(Z,A-2)} \simeq \exp \left[ \frac{ S_{2{\rm{n}}}(Z,A) - 2 S_{{\rm{n}}}^{0}(T_{9}, n_{n}) }{ k T } \right] \, , \end{aligned} $
(5) This provides the basis for deriving the CWP condition. Specifically, a nucleus
$ (Z,N) $ satisfies the CWP condition if$ S_n^0(T_9, n_n) $ lies between the two adjacent values of$ S_{2{\rm{n}}}/2 $ within the same even-N isotopic chain, i.e.,$ \begin{aligned} \frac{1}{2} S_{2{\rm{n}}}(Z,N+2) \;\lesssim\; S_{{\rm{n}}}^{0}(T_{9}, n_{n}) \;\lesssim\; \frac{1}{2} S_{2{\rm{n}}}(Z,N) \, , \end{aligned} $
(6) This defines the range of
$ S_n^0 $ for which$ (Z,N) $ serves as a CWP nucleus along the equilibrium path.For completeness, the canonical CWP nuclei associated with the classical shell closures at
$ N=50, 82, $ and 126, as reported in Ref. [27], are listed in Table 1.N CWP nuclei 50 $ ^{80}{\rm{Zn}} $ ,$ ^{79}{\rm{Cu}} $ ,$ ^{78}{\rm{Ni}} $ 82 $ ^{130}{\rm{Cd}} $ ,$ ^{129}{\rm{Ag}} $ ,$ ^{128}{\rm{Pd}} $ ,$ ^{127}{\rm{Rh}} $ ,$ ^{126}{\rm{Ru}} $ 126 $ ^{195}{\rm{Tm}} $ ,$ ^{194}{\rm{Er}} $ ,$ ^{193}{\rm{Ho}} $ ,$ ^{192}{\rm{Dy}} $ ,$ ^{191}{\rm{Tb}} $ Table 1. Critical waiting-point nuclei.
For each even-N isotopic chain near a shell closure, we combine Eq. 6 with the functional form of
$ S_n^0(T_9, n_n) $ to map the CWP condition onto a finite region in the$ (T_9, n_n) $ plane. The intersection of these regions for selected CWP nuclei then defines the thermodynamic conditions necessary to produce the corresponding r-process abundance peak under equilibrium assumptions.Applying this construction to the classical shell closures at
$ N=50, 82,126 $ with FRDM2012 separation energies reproduces the systematic trends reported by Xu et al. [27] (Fig. 1), thereby validating our implementation of the CWP framework. This result provides a methodological basis for extending the analysis to the region near$ N \approx 184 $ , a predicted shell closure relevant to actinide nucleosynthesis. By adopting the separation-energy systematics of these classical CWP nuclei as a structural baseline, we ensure that the present analysis of the onset of fission cycling remains consistent with the original framework while adapting it to the thermodynamic conditions of heavy-element nucleosynthesis.
Figure 1. (color online) The
$T_9-n_n $ conditions required by the$N = 50 $ , 82, and 126 CWP nuclei. The lower-right panel compares the relative locations and overlaps of these conditions for the three shell closures. Results are based on FRDM2012 separation energies and reproduce the trends reported by Xu et al. [27]. -
In this work, we adopt and explicitly implement the critical waiting-point (CWP) framework introduced by Xu et al. [27], which is based on the equilibrium formulation summarized in Sec. III.A. Within this framework, the equilibrium r-process path, under
$ (n,\gamma)\rightleftarrows(\gamma,n) $ conditions, proceeds predominantly along even-N isotopic chains and is characterized by a nearly constant effective neutron separation energy$ S_n^0(T_9, n_n) $ .CWP nuclei constitute a subset of waiting-point nuclei that primarily constrain the thermodynamic conditions required for the formation of a given r-process abundance peak. Using the definition of
$ S_n^0(T_9, n_n) $ from Sec. III.A, the CWP condition can be expressed in terms of separation-energy systematics along an even-N isotopic chain. For two even-N isotopes$ (Z,N) $ and$ (Z,N+2) $ within the same isotopic chain, the abundance ratio follows from Eq. (2) as:$ \begin{aligned} \frac{Y(Z,A)}{Y(Z,A-2)} \simeq \exp \left[ \frac{ S_{2{{n}}}(Z,A) - 2 S_{{{n}}}^{0}(T_{9}, n_{n}) }{ k T } \right] \, . \end{aligned} $
(5) This provides the basis for deriving the CWP condition. Specifically, a nucleus
$ (Z,N) $ satisfies the CWP condition if$ S_n^0(T_9, n_n) $ lies between the two adjacent values of$ S_{2{{n}}}/2 $ within the same even-N isotopic chain, i.e.,$ \begin{aligned} \frac{1}{2} S_{2{{n}}}(Z,N+2) \;\lesssim\; S_{{{n}}}^{0}(T_{9}, n_{n}) \;\lesssim\; \frac{1}{2} S_{2{{n}}}(Z,N) \, . \end{aligned} $
(6) This defines the range of
$ S_n^0 $ for which$ (Z,N) $ serves as a CWP nucleus along the equilibrium path.For completeness, the canonical CWP nuclei associated with the classical shell closures at
$ N=50,\, 82, $ and 126, as reported in Ref. [27], are listed in Table 1.N CWP nuclei 50 $ ^{80}{\rm{Zn}} $ ,$ ^{79}{\rm{Cu}} $ ,$ ^{78}{\rm{Ni}} $ 82 $ ^{130}{\rm{Cd}} $ ,$ ^{129}{\rm{Ag}} $ ,$ ^{128}{\rm{Pd}} $ ,$ ^{127}{\rm{Rh}} $ ,$ ^{126}{\rm{Ru}} $ 126 $ ^{195}{\rm{Tm}} $ ,$ ^{194}{\rm{Er}} $ ,$ ^{193}{\rm{Ho}} $ ,$ ^{192}{\rm{Dy}} $ ,$ ^{191}{\rm{Tb}} $ Table 1. Critical waiting-point nuclei.
For each even-N isotopic chain near a shell closure, we combine Eq. (6) with the functional form of
$ S_n^0(T_9, n_n) $ to map the CWP condition onto a finite region in the$ (T_9, n_n) $ plane. The intersection of these regions for selected CWP nuclei then defines the thermodynamic conditions necessary to produce the corresponding r-process abundance peak under equilibrium assumptions.Applying this construction to the classical shell closures at
$ N=50, \, 82,\, 126 $ with FRDM2012 separation energies reproduces the systematic trends reported by Xu et al. [27] (Fig. 1), thereby validating our implementation of the CWP framework. This result provides a methodological basis for extending the analysis to the region near$ N \approx 184 $ , a predicted shell closure relevant to actinide nucleosynthesis. By adopting the separation-energy systematics of these classical CWP nuclei as a structural baseline, we ensure that the present analysis of the onset of fission cycling remains consistent with the original framework while adapting it to the thermodynamic conditions of heavy-element nucleosynthesis.
Figure 1. (color online) The
$T_9-n_n $ conditions required by the$N = $ 50, 82, and 126 CWP nuclei. The lower-right panel compares the relative locations and overlaps of these conditions for the three shell closures. Results are based on FRDM2012 separation energies and reproduce the trends reported by Xu et al. [27]. -
A wide range of global nuclear mass models, including macroscopic-microscopic approaches and self-consistent mean-field calculations, predict an enhanced neutron shell closure near
$ N \approx 184 $ [13, 29, 30].Despite model-to-model differences in the predicted shell strength and detailed separation-energy systematics, the region around
$ N \approx 184 $ is widely regarded as a structural benchmark for very neutron-rich heavy nuclei beyond the classical$ N=126 $ shell [31, 32].In this framework, the region near
$ N \approx 184 $ is used as a structural reference to identify when the equilibrium r-process flow enters the very-heavy mass regime, rather than as a strict requirement that the path reach$ N=184 $ . Accordingly, the extension to the heavy region is formulated in terms of a structural-consistency criterion based on neutron separation energies.Specifically, the heavy-region condition band is anchored to a common separation-energy window inferred from the classical waiting-point regions at
$ N=82 $ and$ N=126 $ , expressed in terms of the$ S_{2n}/2 $ metric. This construction yields a conceptually model-independent diagnostic, whereas its quantitative realization depends on the separation-energy systematics predicted by the adopted nuclear mass model.The implementation of this criterion and the resulting structural constraints in the
$ N \approx 184 $ region are presented in the next section. -
Building on the validated CWP framework for the classical r-process abundance peaks at
$ N=50,\, 82, $ and 126 (Sec. III.B), we extend the analysis to the very neutron-rich heavy region near$ N\approx184 $ . As discussed in Sec. III.C, this region is adopted as a structural reference for actinide-producing main r-process conditions.This extension is restricted to the main r-process regime responsible for the production of heavy nuclei, in particular those in the actinide region, whereas the
$ N=50 $ peak, commonly attributed to the weak r-process, is excluded from the present consideration [4].As discussed in Sec. III.B, the classical abundance peaks at
$ N=82 $ and$ N=126 $ are established under similar thermodynamic conditions within the$ (n,\gamma)\rightleftarrows(\gamma,n) $ equilibrium regime. This shared physical basis justifies adopting the corresponding classical$ S_n^0 $ window as a structural reference for identifying heavy-region CWP nuclei near$ N\approx184 $ .For the heavy-region CWP nuclei identified on this basis, the corresponding
$ S_n^0 $ intervals are mapped onto the$ (T_9,n_n) $ plane through Eq. (4). Their overlap defines the thermodynamic domain within which the r-process can access the heavy region, thereby establishing the corresponding condition band.To account for residual variations in separation-energy systematics and moderate deviations from ideal equilibrium, we introduce an effective tolerance
$ \Delta S $ , which sets the finite width of this condition band. This band then provides the thermodynamic basis for constructing the equilibrium path band in the following section. -
Building on the validated CWP framework for the classical r-process abundance peaks at
$ N=50,82, $ and 126 (Sec. 3.2), we extend the analysis to the very neutron-rich heavy region near$ N\approx184 $ . As discussed in Sec. 3.3, this region is adopted as a structural reference for actinide-producing main r-process conditions.This extension is restricted to the main r-process regime responsible for the production of heavy nuclei, in particular those in the actinide region, whereas the
$ N=50 $ peak, commonly attributed to the weak r-process, is excluded from the present consideration [4].As discussed in Sec. 3.2, the classical abundance peaks at
$ N=82 $ and$ N=126 $ are established under similar thermodynamic conditions within the$ (n,\gamma)\rightleftarrows(\gamma,n) $ equilibrium regime. This shared physical basis justifies adopting the corresponding classical$ S_n^0 $ window as a structural reference for identifying heavy-region CWP nuclei near$ N\approx184 $ .For the heavy-region CWP nuclei identified on this basis, the corresponding
$ S_n^0 $ intervals are mapped onto the$ (T_9,n_n) $ plane through Eq. 4. Their overlap defines the thermodynamic domain within which the r-process can access the heavy region, thereby establishing the corresponding condition band.To account for residual variations in separation-energy systematics and moderate deviations from ideal equilibrium, we introduce an effective tolerance
$ \Delta S $ , which sets the finite width of this condition band. This band then provides the thermodynamic basis for constructing the equilibrium path band in the following section. -
Building on the heavy-region CWP condition band established in Sec. III.D, the boundary values of the associated separation-energy window provide a natural structural criterion for identifying nuclei accessible to equilibrium r-process flow. We define the equilibrium path band as the set of nuclei in the heavy actinide region whose separation-energy systematics are consistent with this window.
Because the condition band already incorporates the effective tolerance
$ \Delta S $ , which reflects both intrinsic variations in the separation-energy systematics and uncertainty propagation from nuclear masses, no additional uncertainty is introduced into the path-band construction. The band is not restricted to the reference CWP nuclei themselves but also includes neighboring isotopic chains that satisfy the same structural criterion. This extension reflects the role of the$ N \approx 184 $ region as a structural reference for the onset of access to the heavy region, rather than imposing a restriction to a specific set of nuclei.A nucleus
$ (Z,N) $ is deemed to belong to the equilibrium path band if its two-neutron separation energy per neutron,$ S_{2n}/2 $ , lies within this window. This quantity provides a convenient measure of isotopic-chain systematics in very neutron-rich heavy nuclei and remains fully consistent with the CWP-based framework adopted in this work.The resulting equilibrium path band should therefore be interpreted as a structure-defined envelope of nuclei accessible to equilibrium r-process flow in the heavy actinide region, rather than as a single path corresponding to a fixed thermodynamic trajectory. This set of nuclei provides the nuclear-chart basis for the lifetime comparisons and fission-onset analysis presented in Sec. III.F.
-
Building on the heavy-region CWP condition band established in Sec. 3.4, the boundary values of the associated separation-energy window provide a natural structural criterion for identifying nuclei accessible to equilibrium r-process flow. We define the equilibrium path band as the set of nuclei in the heavy actinide region whose separation-energy systematics are consistent with this window.
Because the condition band already incorporates the effective tolerance
$ \Delta S $ , which reflects both intrinsic variations in the separation-energy systematics and uncertainty propagation from nuclear masses, no additional uncertainty is introduced into the path-band construction. The band is not restricted to the reference CWP nuclei themselves but also includes neighboring isotopic chains that satisfy the same structural criterion. This extension reflects the role of the$ N \approx 184 $ region as a structural reference for the onset of access to the heavy region, rather than imposing a restriction to a specific set of nuclei.A nucleus
$ (Z,N) $ is deemed to belong to the equilibrium path band if its two-neutron separation energy per neutron,$ S_{2n}/2 $ , lies within this window. This quantity provides a convenient measure of isotopic-chain systematics in very neutron-rich heavy nuclei and remains fully consistent with the CWP-based framework adopted in this work.The resulting equilibrium path band should therefore be interpreted as a structure-defined envelope of nuclei accessible to equilibrium r-process flow in the heavy actinide region, rather than as a single path corresponding to a fixed thermodynamic trajectory. This set of nuclei provides the nuclear-chart basis for the lifetime comparisons and fission-onset analysis presented in Sec. 3.6.
-
Once the equilibrium r-process flow reaches the actinide region, the competition between neutron-induced fission and β decay governs the removal of material from the heavy equilibrium-path band. Under the CWP
$ T_9 $ –$ n_n $ conditions for the heavy region established in Sec. 3.4, this competition is quantified by directly comparing the characteristic lifetimes$ \tau_{n,f}(T_9,n_n) $ and$ \tau_{\beta} $ .Neutron-induced fission lifetimes. These lifetimes are derived from Maxwellian-averaged stellar reaction rates computed using TALYS 2.0. For each nucleus and temperature
$ T_9 $ , TALYS provides a stellar reaction rate$ R_\star(T_9) $ , with units of$ {\rm{cm^3\,mol^{-1}}\,s^{-1}} $ , which accounts for the thermal population of excited states. The corresponding rate per target nucleus is$ \begin{aligned} \langle \sigma v \rangle_{\star}(T_{9}) = \frac{R_{\star}(T_{9})}{N_{{\rm{A}}}}, \end{aligned} $
(7) where
$ N_{{\rm{A}}} $ denotes Avogadro's number. For a neutron number density of$ n_n $ , the fission rate per target nucleus is given by$ \begin{aligned} \lambda_{n,f}(T_9,n_n) = n_n\,\langle\sigma v\rangle_\star(T_9), \end{aligned} $
(8) and the corresponding lifetime is
$ \begin{aligned} \tau_{n,{\rm{f}}}(T_{9}, n_{n}) = \lambda_{n,{\rm{f}}}^{-1}(T_{9}, n_{n}). \end{aligned} $
(9) β-decay lifetimes. These lifetimes are obtained from large-scale covariant RHB+pn-RQRPA calculations by Marketin, Huther, and Martínez-Pinedo, which provide consistent coverage of neutron-rich actinide and transuranic nuclei [26]. For each nucleus, the total decay rate
$ \lambda_{{\rm{tot}}} $ is used, and the β-decay lifetime is defined as:$ \begin{aligned} \tau_{\beta} = \lambda_{{\rm{tot}}}^{-1}. \end{aligned} $
(10) Application across the path band. The lifetimes described above are evaluated for all nuclei within the structure-defined equilibrium path band (Sec. 3.5). At each thermodynamic point
$ (T_9, n_n) $ within the heavy-region CWP domain, we define the onset of fission cycling in two steps.First, we identify the minimum proton number Z at which neutron-induced fission becomes competitive with β-decay, i.e.,
$ \tau_{n,f}(T_9,n_n) \le \tau_\beta $ .Second, for this Z, the onset nucleus is the isotope with the lowest neutron number N that satisfies the same condition.
This procedure provides a consistent and transparent criterion for locating the onset of fission cycling across the
$ (T_9,n_n) $ plane. -
Once the equilibrium r-process flow reaches the actinide region, the competition between neutron-induced fission and β decay governs the removal of material from the heavy equilibrium-path band. Under the CWP
$ T_9 $ –$ n_n $ conditions for the heavy region established in Sec. III. D, this competition is quantified by directly comparing the characteristic lifetimes$ \tau_{n,f}(T_9,n_n) $ and$ \tau_{\beta} $ .Neutron-induced fission lifetimes. These lifetimes are derived from Maxwellian-averaged stellar reaction rates computed using TALYS 2.0. For each nucleus and temperature
$ T_9 $ , TALYS provides a stellar reaction rate$ R_\star(T_9) $ , with units of$ {\rm{cm^3\,mol^{-1}}\,s^{-1}} $ , which accounts for the thermal population of excited states. The corresponding rate per target nucleus is$ \begin{aligned} \langle \sigma v \rangle_{\star}(T_{9}) = \frac{R_{\star}(T_{9})}{N_{{\rm{A}}}}, \end{aligned} $
(7) where
$ N_{{\rm{A}}} $ denotes Avogadro's number. For a neutron number density of$ n_n $ , the fission rate per target nucleus is given by$ \begin{aligned} \lambda_{n,f}(T_9,n_n) = n_n\,\langle\sigma v\rangle_\star(T_9), \end{aligned} $
(8) and the corresponding lifetime is
$ \begin{aligned} \tau_{n,{\rm{f}}}(T_{9}, n_{n}) = \lambda_{n,{\rm{f}}}^{-1}(T_{9}, n_{n}). \end{aligned} $
(9) β-decay lifetimes. These lifetimes are obtained from large-scale covariant RHB+pn-RQRPA calculations by Marketin, Huther, and Martínez-Pinedo, which provide consistent coverage of neutron-rich actinide and transuranic nuclei [26]. For each nucleus, the total decay rate
$ \lambda_{{\rm{tot}}} $ is used, and the β-decay lifetime is defined as:$ \begin{aligned} \tau_{\beta} = \lambda_{{\rm{tot}}}^{-1}. \end{aligned} $
(10) Application across the path band. The lifetimes described above are evaluated for all nuclei within the structure-defined equilibrium path band (Sec. III. E). At each thermodynamic point
$ (T_9, n_n) $ within the heavy-region CWP domain, we define the onset of fission cycling in two steps.First, we identify the minimum proton number Z at which neutron-induced fission becomes competitive with β-decay, i.e.,
$ \tau_{n,f}(T_9,n_n) \le \tau_\beta $ .Second, for this Z, the onset nucleus is the isotope with the lowest neutron number N that satisfies the same condition.
This procedure provides a consistent and transparent criterion for locating the onset of fission cycling across the
$ (T_9,n_n) $ plane. -
This section presents results from applying the structural and equilibrium-path framework developed in Sec. 3 to the heavy actinide region.
We first identify the subset of actinide isotopic chains near
$ N \approx 184 $ whose separation-energy systematics are consistent with the common CWP window defined by the classical$ N=82 $ and$ N=126 $ peaks.We then map this structurally selected window onto the
$ (T_9,n_n) $ plane to determine the corresponding thermodynamic domain and to construct the associated equilibrium r-process path band in the actinide region.Finally, within this restricted set of thermodynamic conditions and nuclear paths, we evaluate the competition between neutron-induced fission and β-decay and identify the onset of fission cycling along the equilibrium r-process path band.
-
This section presents results from applying the structural and equilibrium-path framework developed in Sec. III to the heavy actinide region.
We first identify the subset of actinide isotopic chains near
$ N \approx 184 $ whose separation-energy systematics are consistent with the common CWP window defined by the classical$ N=82 $ and$ N=126 $ peaks.We then map this structurally selected window onto the
$ (T_9,n_n) $ plane to determine the corresponding thermodynamic domain and to construct the associated equilibrium r-process path band in the actinide region.Finally, within this restricted set of thermodynamic conditions and nuclear paths, we evaluate the competition between neutron-induced fission and β-decay and identify the onset of fission cycling along the equilibrium r-process path band.
-
Applying the construction described in Sec. III.D to the FRDM2012 mass model, we identify a subset of actinide isotopic chains near
$ N \approx 184 $ whose separation-energy systematics are consistent with the common CWP window defined by the classical$ N=82 $ and$ N=126 $ peaks.Figure 2 illustrates the systematics of the two-neutron separation energy,
$ S_{2n}/2 $ , for isotopic chains near the classical CWP regions at$ N=82 $ and$ N=126 $ , along with candidate actinide chains approaching$ N \approx 184 $ .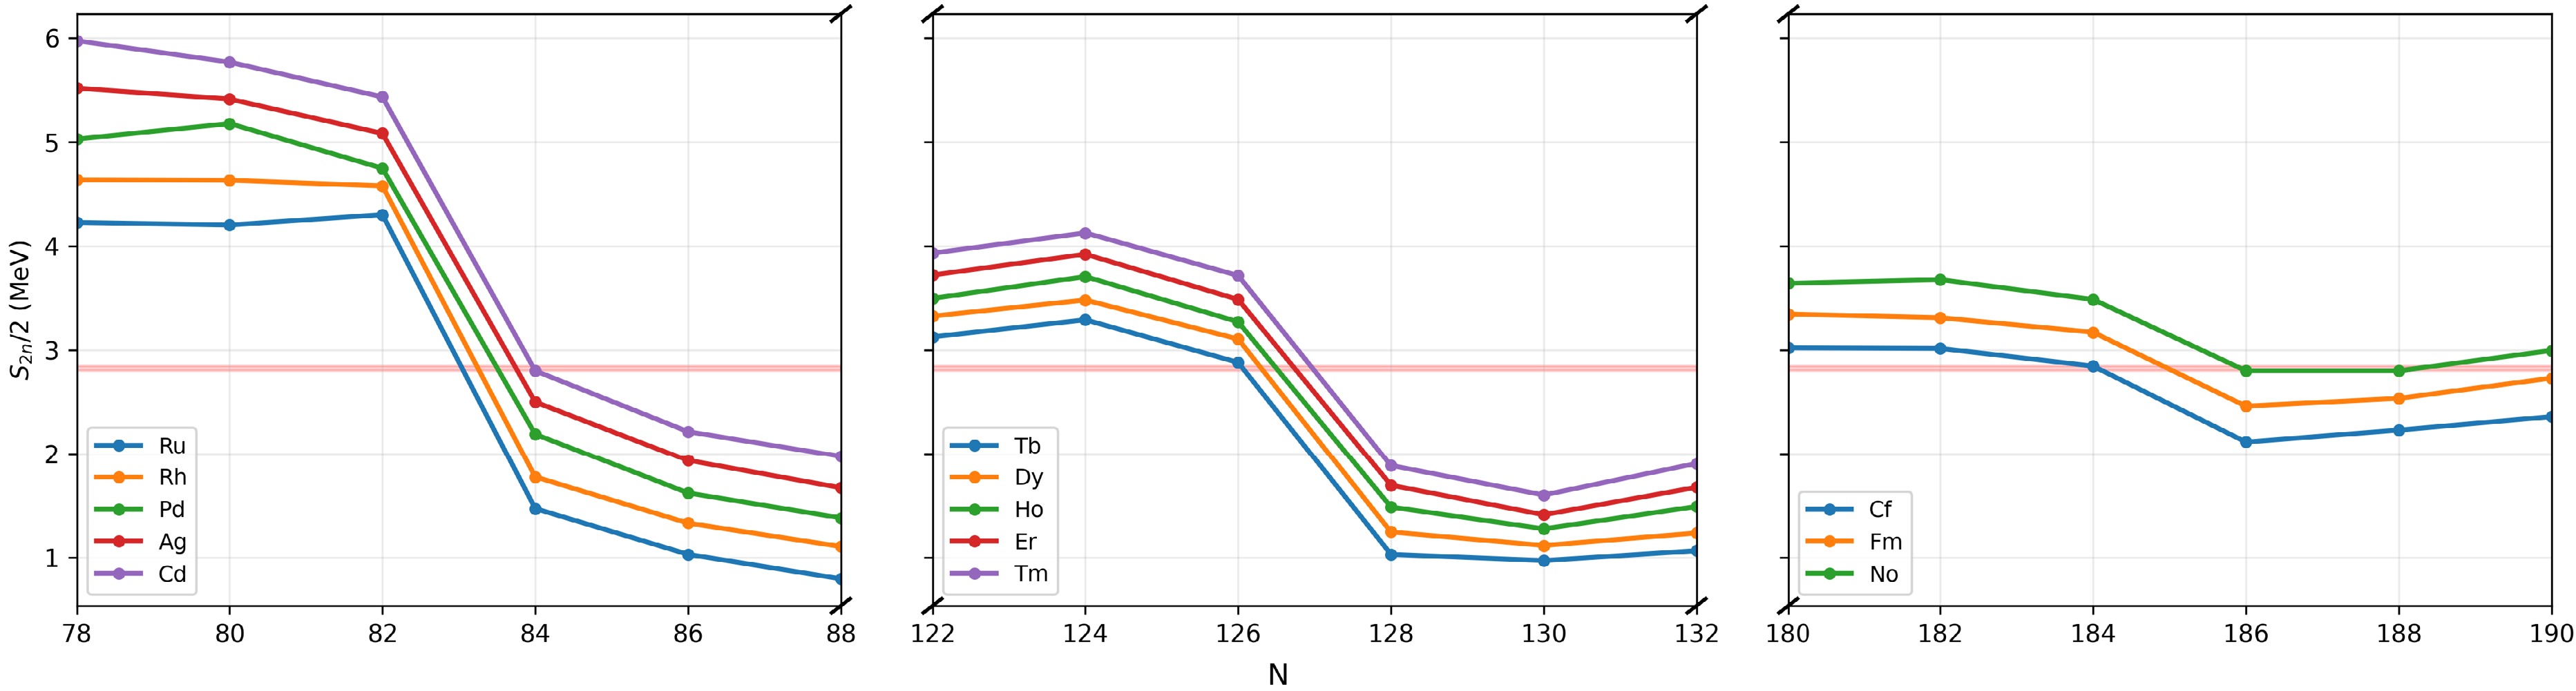
Figure 2. (color online) Shown are the systematics of the two-neutron separation-energy metric
$ S_{2n}/2 $ along selected isotopic chains near the classical waiting points (CWPs) at$ N=82 $ and$ N=126 $ , together with candidate actinide chains approaching$ N \approx 184 $ . The shaded horizontal band indicates the common CWP$ S_n^0 $ window required to sustain the abundance peaks at$ N=82 $ and$ N=126 $ under identical thermodynamic conditions. Applying this structural consistency criterion to the$ N \approx 184 $ region selects only the$ Z=98 $ , 100, and 102 chains (Cf, Fm, and No), whereas neighboring chains deviate systematically as N approaches 184.Imposing that the
$ N=82 $ and$ N=126 $ peaks be sustained under identical thermodynamic conditions defines a common interval in$ S_{2n}/2 $ that characterizes the equilibrium r-process path.Within the FRDM2012 mass model, only the actinide isotopic chains with
$ Z=98 $ , 100, and 102 (Cf, Fm, and No) satisfy this structural criterion near$ N \approx 184 $ . These chains are therefore identified as the heavy-region CWP nuclei.The corresponding
$ S_n^0 $ intervals trace loci in the$ (T_9,n_n) $ plane, as shown in Fig. 3. Their overlap defines the core band of thermodynamic conditions for the$ N \approx 184 $ region.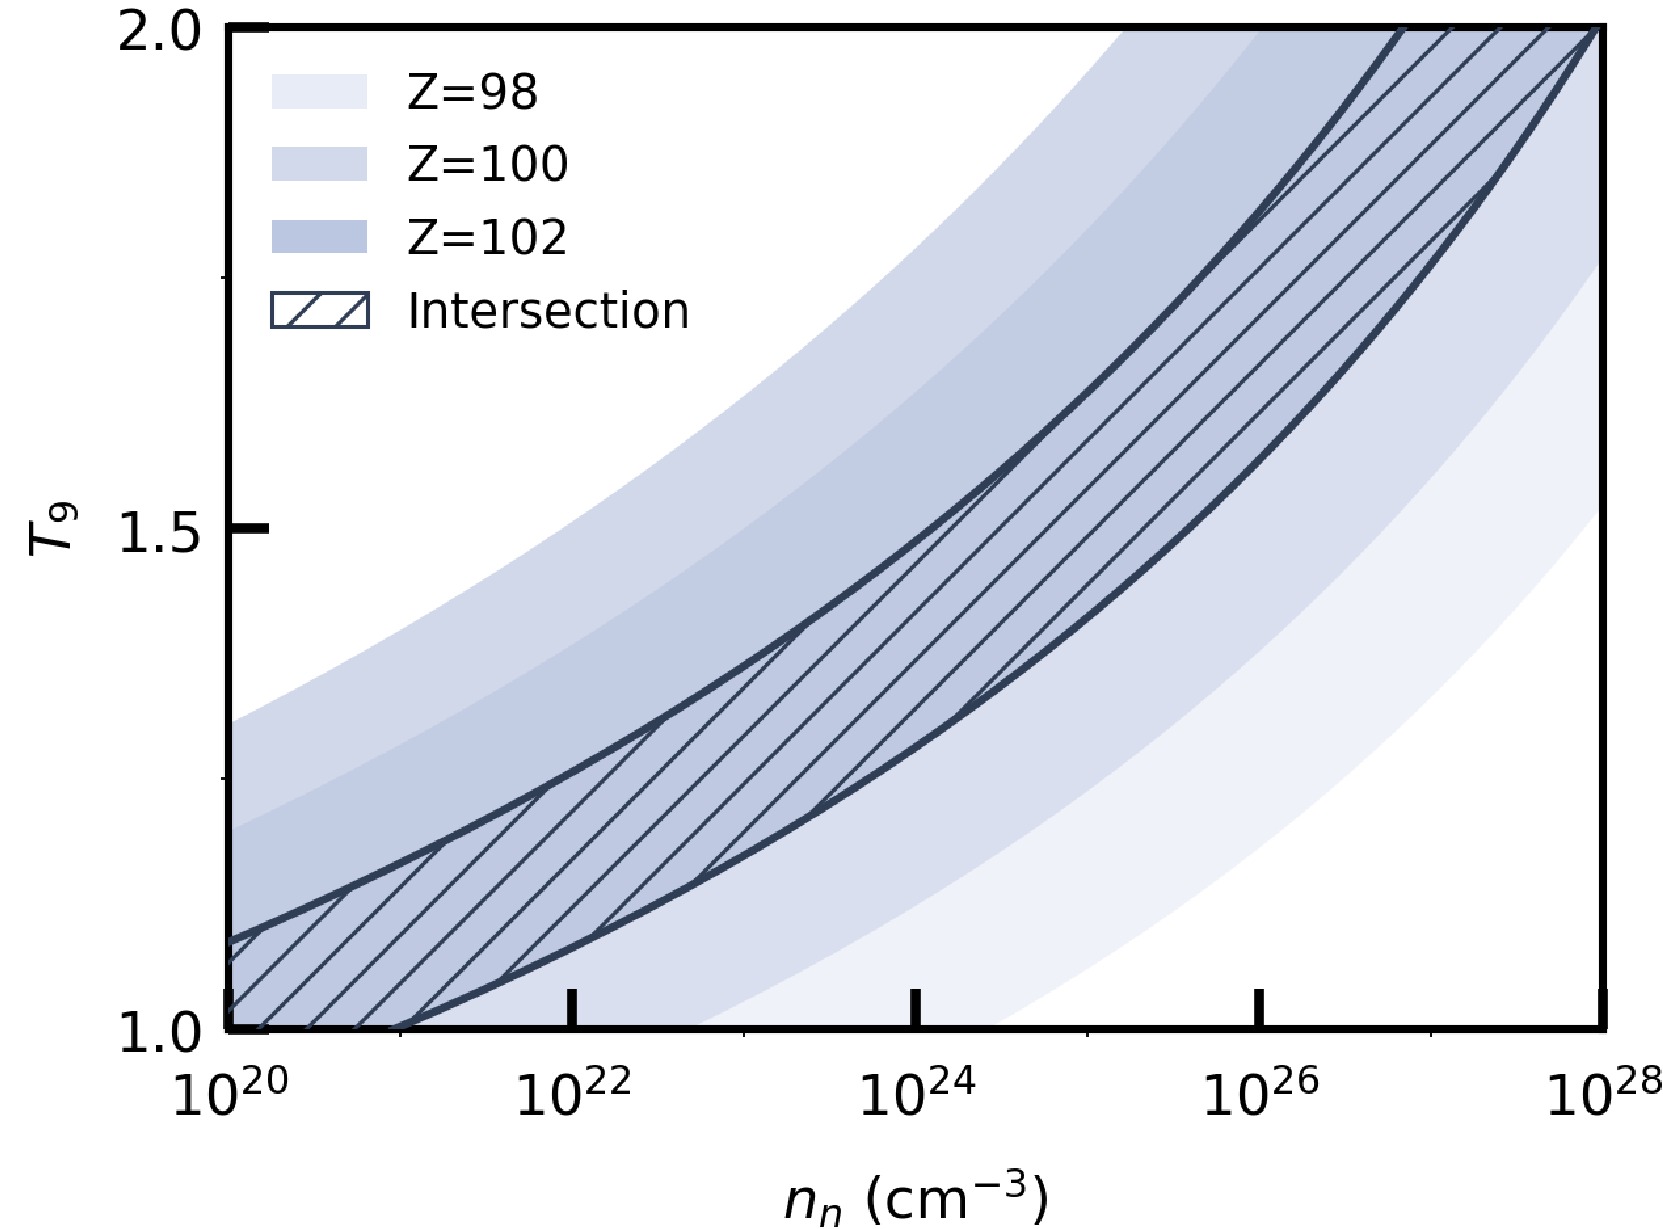
Figure 3. (color online) Thermodynamic conditions
$(T_9,n_n) $ required by the heavy-region CWP nuclei near$ N \approx 184$ . Shaded bands show the individual$T_9-n_n $ loci for the$Z=98 $ , 100, and 102 isotopic chains (Cf, Fm, and No). The hatched region indicates their overlap, which defines the condition band for equilibrium r-process flow in the heavy actinide region.To account for residual variations in separation-energy systematics and deviations from ideal equilibrium, we adopt an effective tolerance of
$ \Delta S = 0.2\ {\rm{MeV}} $ . This choice is motivated by the propagation of uncertainties from nuclear masses to$ S_{2n} $ ; because$ S_{2n} $ is defined as a difference, the typical uncertainty on$ S_{2n}/2 $ is at the level of a few tenths of MeV. Given the relatively smooth systematics near$ N \approx 184 $ in FRDM2012, this value is a representative tolerance that captures the expected scale of model uncertainties and structural variations around the CWP nuclei.For clarity and to focus on the heavy-region conditions relevant for actinide nucleosynthesis, the thermodynamic domain is restricted to
$ 1 \leqslant T_9 \leqslant 2 $ and$ 10^{20} \leqslant n_n \leqslant 10^{28}\,{\rm{cm^{-3}}} $ , consistent with the typical parameter ranges adopted in previous studies of the main r-process. This range constitutes a subset of the broader r-process parameter space ($ T_9 \sim 1 $ −3) and focuses on the region most relevant to the present analysis [33].This tolerance defines the effective separation-energy window,
$ 2.6\ {\rm{MeV}} \leqslant S_{2n}/2 \leqslant 3.045\ {\rm{MeV}}. $
This characterizes both the structural consistency and the thermodynamic domain of equilibrium r-process flow in the
$ N \approx 184 $ region.The restriction to
$ Z=98 $ , 100, and 102 reflects the separation-energy systematics predicted by FRDM2012; the sensitivity of this selection to alternative mass models is discussed in Sec. V.A. -
Applying the construction described in Sec. 3.4 to the FRDM2012 mass model, we identify a subset of actinide isotopic chains near
$ N \approx 184 $ whose separation-energy systematics are consistent with the common CWP window defined by the classical$ N=82 $ and$ N=126 $ peaks.Fig. 2 illustrates the systematics of the two-neutron separation energy,
$ S_{2n}/2 $ , for isotopic chains near the classical CWP regions at$ N=82 $ and$ N=126 $ , along with candidate actinide chains approaching$ N \approx 184 $ .
Figure 2. (color online) Shown are the systematics of the two-neutron separation-energy metric
$ S_{2n}/2 $ along selected isotopic chains near the classical waiting points (CWPs) at$ N=82 $ and$ N=126 $ , together with candidate actinide chains approaching$ N \approx 184 $ . The shaded horizontal band indicates the common CWP$ S_n^0 $ window required to sustain the abundance peaks at$ N=82 $ and$ N=126 $ under identical thermodynamic conditions. Applying this structural consistency criterion to the$ N \approx 184 $ region selects only the$ Z=98 $ , 100, and 102 chains (Cf, Fm, and No), whereas neighboring chains deviate systematically as N approaches 184.Imposing that the
$ N=82 $ and$ N=126 $ peaks be sustained under identical thermodynamic conditions defines a common interval in$ S_{2n}/2 $ that characterizes the equilibrium r-process path.Within the FRDM2012 mass model, only the actinide isotopic chains with
$ Z=98 $ , 100, and 102 (Cf, Fm, and No) satisfy this structural criterion near$ N \approx 184 $ . These chains are therefore identified as the heavy-region CWP nuclei.The corresponding
$ S_n^0 $ intervals trace loci in the$ (T_9,n_n) $ plane, as shown in Fig. 3. Their overlap defines the core band of thermodynamic conditions for the$ N \approx 184 $ region.
Figure 3. (color online) Thermodynamic conditions
$(T_9,n_n) $ required by the heavy-region CWP nuclei near$ N \approx 184$ . Shaded bands show the individual$T_9-n_n $ loci for the$Z=98 $ , 100, and 102 isotopic chains (Cf, Fm, and No). The hatched region indicates their overlap, which defines the condition band for equilibrium r-process flow in the heavy actinide region.To account for residual variations in separation-energy systematics and deviations from ideal equilibrium, we adopt an effective tolerance of
$ \Delta S = 0.2\ {\rm{MeV}} $ . This choice is motivated by the propagation of uncertainties from nuclear masses to$ S_{2n} $ ; because$ S_{2n} $ is defined as a difference, the typical uncertainty on$ S_{2n}/2 $ is at the level of a few tenths of MeV. Given the relatively smooth systematics near$ N \approx 184 $ in FRDM2012, this value is a representative tolerance that captures the expected scale of model uncertainties and structural variations around the CWP nuclei.For clarity and to focus on the heavy-region conditions relevant for actinide nucleosynthesis, the thermodynamic domain is restricted to
$ 1 \leqslant T_9 \leqslant 2 $ and$ 10^{20} \leqslant n_n \leqslant 10^{28}\,{\rm{cm^{-3}}} $ , consistent with the typical parameter ranges adopted in previous studies of the main r-process. This range constitutes a subset of the broader r-process parameter space ($ T_9 \sim 1 $ –3) and focuses on the region most relevant to the present analysis [33].This tolerance defines the effective separation-energy window.
$ 2.6\ {\rm{MeV}} \leqslant S_{2n}/2 \leqslant 3.045\ {\rm{MeV}}, $
This characterizes both the structural consistency and the thermodynamic domain of equilibrium r-process flow in the
$ N \approx 184 $ region.The restriction to
$ Z=98 $ , 100, and 102 reflects the separation-energy systematics predicted by FRDM2012; the sensitivity of this selection to alternative mass models is discussed in Sec. 5.1. -
Using the calibrated separation-energy window derived in Sec. IV. A, we construct the equilibrium path band by applying the structural criterion defined in Sec. III. E.
A nucleus is included in the band if its
$ S_{2n}/2 $ value lies within the heavy-region window$ 2.6\ {\rm{MeV}} \leqslant S_{2n}/2 \leqslant 3.045\ {\rm{MeV}} $ . The proton-number range is extended from the reference CWP chains ($ Z=98 $ , 100,102) to the broader actinide region, covering$ 94 \leqslant Z \leqslant 106 $ , without imposing an odd-even restriction.Because the calibrated window already accounts for the relevant variations in separation-energy systematics and for moderate deviations from ideal equilibrium, no further broadening of the path band is applied.
Figure 4 shows the resulting equilibrium path band superimposed on the nuclear chart for
$ 94 \leqslant Z \leqslant 106 $ . Colored tiles denote nuclei selected by the heavy-region structural criterion, with the color scale indicating the relative competition between neutron-induced fission and β-decay (see Sec. IV.C).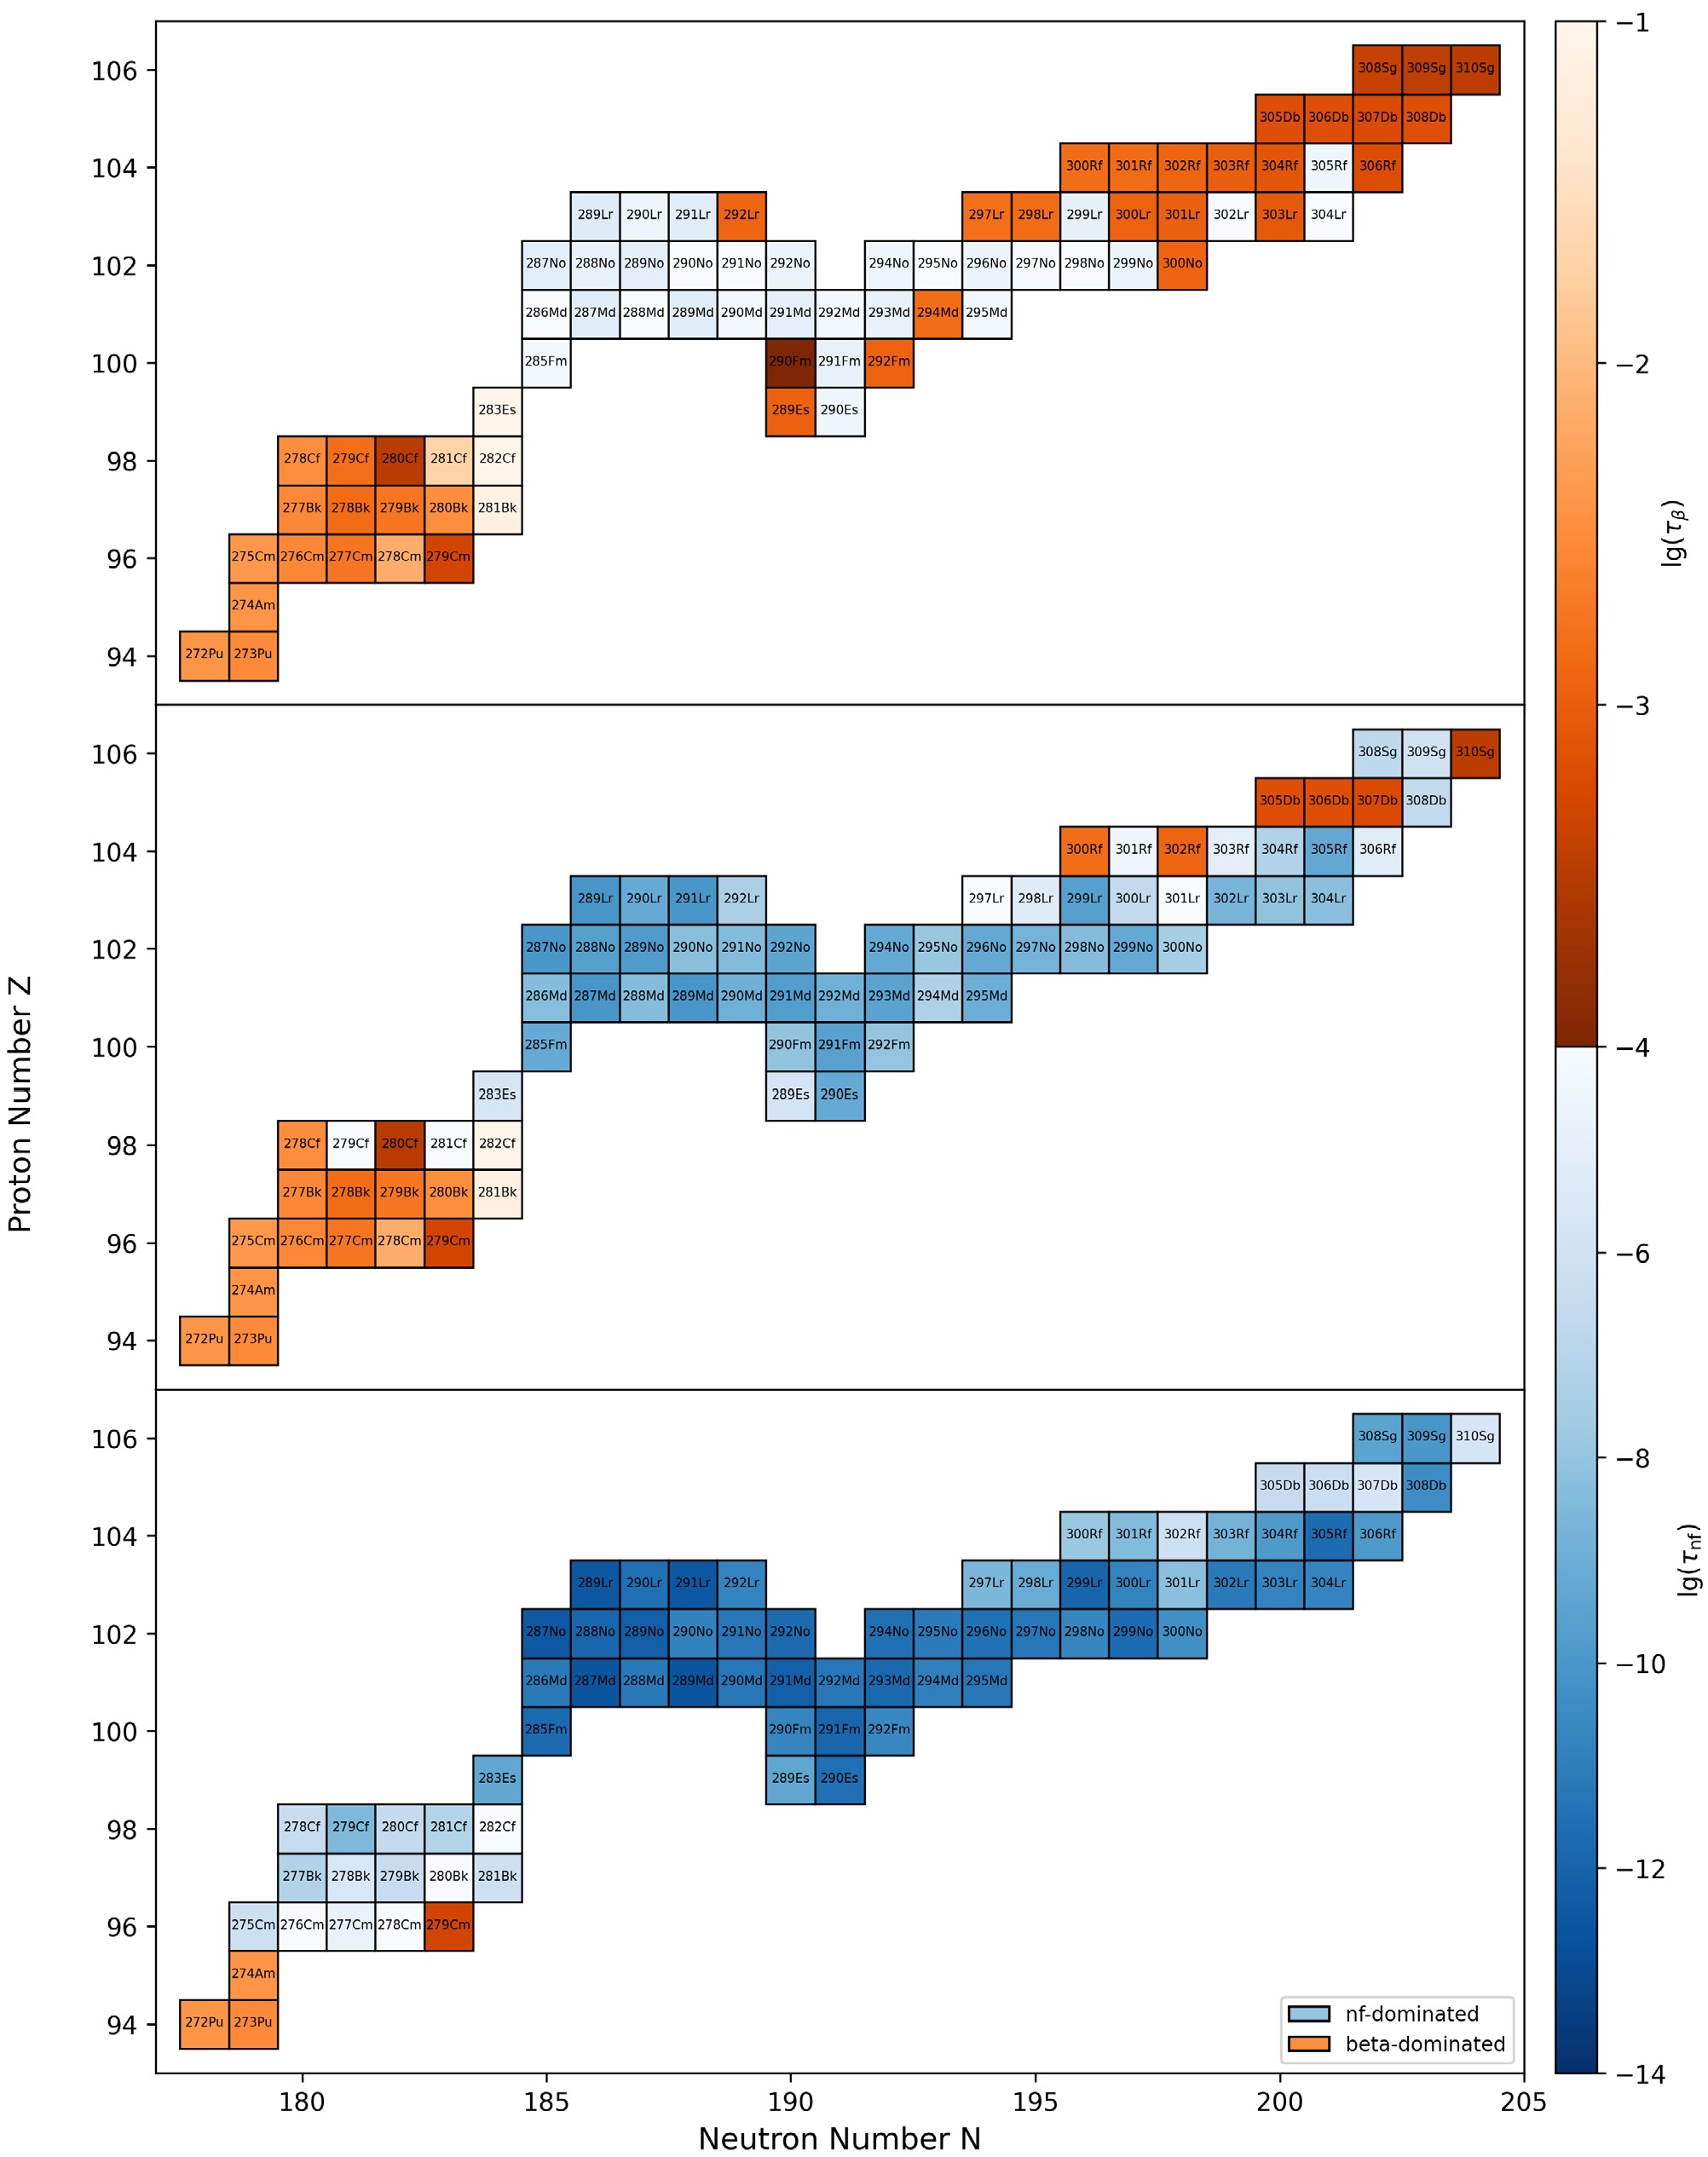
Figure 4. (color online) Neutron-induced fission and β-decay lifetimes along the equilibrium path band in the actinide region. The three panels correspond to representative thermodynamic conditions (top to bottom):
$T_9=1.0$ ,$n_n=7.0\times10^{19}\,{\rm{cm^{-3}}}$ ;$T_9=1.5$ ,$n_n=7.0\times10^{24}\,{\rm{cm^{-3}}}$ ; and$T_9=2.0$ ,$n_n=2.5\times10^{27}\,{\rm{cm^{-3}}}$ . Each tile represents a nucleus within the path band defined in Sec. IV. B. Colors indicate the relative dominance of neutron-induced fission and β-decay ($\tau_{n,f}$ vs.$\tau_{\beta}$ ), with blue denoting fission-dominated nuclei and red denoting β-decay-dominated nuclei.The band spans the full actinide region and is centered near the reference CWP chains at
$ Z=98 $ , 100, and 102. It defines the nuclear domain for subsequent lifetime comparisons and for identifying the onset of fission cycling. -
Using the calibrated separation-energy window derived in Sec. 4.1, we construct the equilibrium path band by applying the structural criterion defined in Sec. 3.5.
A nucleus is included in the band if its
$ S_{2n}/2 $ value lies within the heavy-region window$ 2.6\ {\rm{MeV}} \leqslant S_{2n}/ 2 \leqslant 3.045\ {\rm{MeV}} $ . The proton-number range is extended from the reference CWP chains ($ Z=98 $ , 100,102) to the broader actinide region, covering$ 94 \leqslant Z \leqslant 106 $ , without imposing an odd-even restriction.Because the calibrated window already accounts for the relevant variations in separation-energy systematics and for moderate deviations from ideal equilibrium, no further broadening of the path band is applied.
Fig. 4 shows the resulting equilibrium path band superimposed on the nuclear chart for
$ 94 \leqslant Z \leqslant 106 $ . Colored tiles denote nuclei selected by the heavy-region structural criterion, with the color scale indicating the relative competition between neutron-induced fission and β-decay (see Sec. 4.3).
Figure 4. (color online) Neutron-induced fission and β-decay lifetimes along the equilibrium path band in the actinide region. The three panels correspond to representative thermodynamic conditions (top to bottom):
$T_9=1.0$ ,$n_n=7.0\times10^{19}\,{\rm{cm^{-3}}}$ ;$T_9=1.5$ ,$n_n=7.0\times10^{24}\,{\rm{cm^{-3}}}$ ; and$T_9=2.0$ ,$n_n=2.5\times10^{27}\,{\rm{cm^{-3}}}$ . Each tile represents a nucleus within the path band defined in Sec. 4.2. Colors indicate the relative dominance of neutron-induced fission and β-decay ($\tau_{n,f}$ vs.$\tau_{\beta}$ ), with blue denoting fission-dominated nuclei and red denoting β-decay-dominated nuclei.The band spans the full actinide region and is centered near the reference CWP chains at
$ Z=98 $ , 100, and 102. It defines the nuclear domain for subsequent lifetime comparisons and for identifying the onset of fission cycling. -
Using the calibrated separation-energy window derived in Sec. IV. A, we construct the equilibrium path band by applying the structural criterion defined in Sec. III. E.
A nucleus is included in the band if its
$ S_{2n}/2 $ value lies within the heavy-region window$ 2.6\ {\rm{MeV}} \leqslant S_{2n}/2 \leqslant 3.045\ {\rm{MeV}} $ . The proton-number range is extended from the reference CWP chains ($ Z=98 $ , 100,102) to the broader actinide region, covering$ 94 \leqslant Z \leqslant 106 $ , without imposing an odd-even restriction.Because the calibrated window already accounts for the relevant variations in separation-energy systematics and for moderate deviations from ideal equilibrium, no further broadening of the path band is applied.
Figure 4 shows the resulting equilibrium path band superimposed on the nuclear chart for
$ 94 \leqslant Z \leqslant 106 $ . Colored tiles denote nuclei selected by the heavy-region structural criterion, with the color scale indicating the relative competition between neutron-induced fission and β-decay (see Sec. IV.C).
Figure 4. (color online) Neutron-induced fission and β-decay lifetimes along the equilibrium path band in the actinide region. The three panels correspond to representative thermodynamic conditions (top to bottom):
$T_9=1.0$ ,$n_n=7.0\times10^{19}\,{\rm{cm^{-3}}}$ ;$T_9=1.5$ ,$n_n=7.0\times10^{24}\,{\rm{cm^{-3}}}$ ; and$T_9=2.0$ ,$n_n=2.5\times10^{27}\,{\rm{cm^{-3}}}$ . Each tile represents a nucleus within the path band defined in Sec. IV. B. Colors indicate the relative dominance of neutron-induced fission and β-decay ($\tau_{n,f}$ vs.$\tau_{\beta}$ ), with blue denoting fission-dominated nuclei and red denoting β-decay-dominated nuclei.The band spans the full actinide region and is centered near the reference CWP chains at
$ Z=98 $ , 100, and 102. It defines the nuclear domain for subsequent lifetime comparisons and for identifying the onset of fission cycling. -
We investigate the onset of fission cycling along the equilibrium path band (Sec. IV.B) under three representative thermodynamic conditions drawn from the heavy-region CWP
$ (T_9, n_n) $ domain shown in Fig. 3.These points span the band of conditions:
$ T_9=1.0 $ ,$ n_n=7.0\times10^{19}\,{\rm{cm^{-3}}} $ ;$ T_9=1.5 $ ,$ n_n=7.0\times10^{24}\,{\rm{cm^{-3}}} $ ; and$ T_9=2.0 $ ,$ n_n=2.5\times10^{27}\,{\rm{cm^{-3}}} $ .For each
$ (T_9, n_n) $ pair, we evaluate the neutron-induced fission and β-decay lifetimes as described in Sec. III. F and identify the onset of fission cycling along the path band.The results are shown in Fig. 4, where blue regions indicate fission-dominated nuclei and red regions indicate β-decay-dominated nuclei. According to the operational criterion defined in Sec. III.F, the onset nuclides for the three representative conditions are 290Es, 279Cf, and 275Cm, respectively.
At the lowest neutron density, β-decay dominates over most of the path band, and neutron-induced fission becomes competitive only at relatively high Z and mass number A. As temperature and neutron density increase, the fission-dominated region expands systematically toward lower Z and lower mass number A, shifting the onset of fission cycling from 290Es to 279Cf and finally to 275Cm.
This trend indicates that more extreme thermodynamic conditions lead to an earlier onset of fission cycling along the equilibrium path band.
-
We investigate the onset of fission cycling along the equilibrium path band (Sec. 4.2) under three representative thermodynamic conditions drawn from the heavy-region CWP
$ (T_9, n_n) $ domain shown in Fig. 3.These points span the band of conditions:
$ T_9=1.0 $ ,$ n_n=7.0\times10^{19}\,{\rm{cm^{-3}}} $ ;$ T_9=1.5 $ ,$ n_n=7.0\times10^{24}\,{\rm{cm^{-3}}} $ ; and$ T_9=2.0 $ ,$ n_n=2.5\times10^{27}\,{\rm{cm^{-3}}} $ .For each
$ (T_9, n_n) $ pair, we evaluate the neutron-induced fission and β-decay lifetimes as described in Sec. 3.6 and identify the onset of fission cycling along the path band.The results are shown in Fig. 4, where blue regions indicate fission-dominated nuclei and red regions indicate β-decay-dominated nuclei. According to the operational criterion defined in Sec. 3.6, the onset nuclides for the three representative conditions are 290Es, 279Cf, and 275Cm, respectively.
At the lowest neutron density, β-decay dominates over most of the path band, and neutron-induced fission becomes competitive only at relatively high Z and mass number A. As temperature and neutron density increase, the fission-dominated region expands systematically toward lower Z and lower mass number A, shifting the onset of fission cycling from 290Es to 279Cf and finally to 275Cm.
This trend indicates that more extreme thermodynamic conditions lead to an earlier onset of fission cycling along the equilibrium path band.
-
We extend the lifetime analysis across the full
$ T_9 $ –$ n_n $ parameter space and construct a global map of the onset of fission cycling in the actinide region.Figure 5 shows the onset nucleus identified at each thermodynamic point
$ (T_9, n_n) $ within the CWP domain. Each colored point corresponds to a distinct set of conditions, with the onset characterized by its proton number$ Z_{{\rm{fc}}} $ and mass number$ A_{{\rm{fc}}} $ .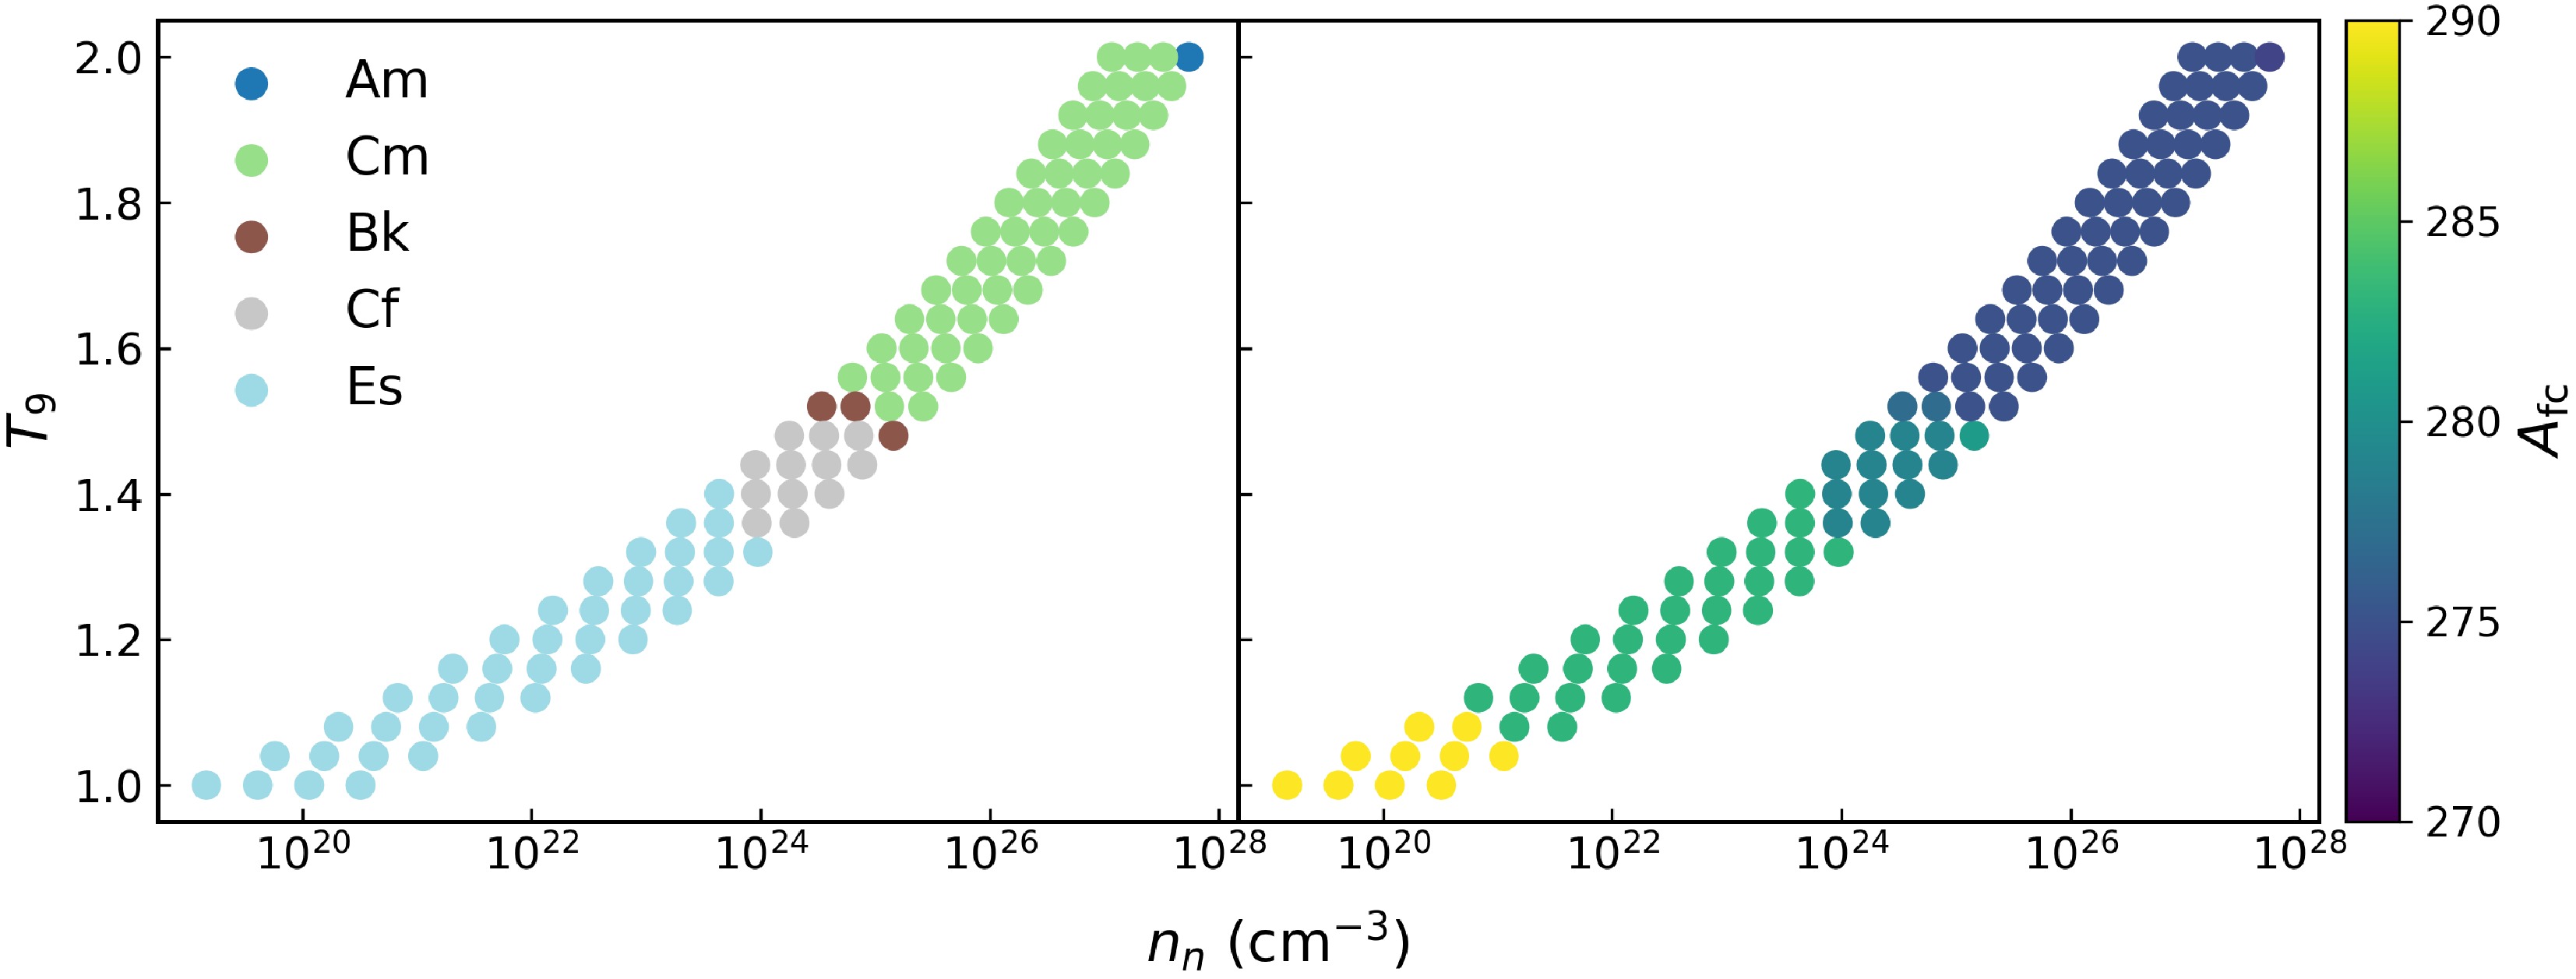
Figure 5. (color online) Onset of fission cycling across the
$ T_9 $ –$ n_n $ parameter space. Left: Proton number$ Z_{{\rm{fc}}} $ of the nucleus at onset. Right: Corresponding mass number$ A_{{\rm{fc}}} $ .The left panel displays
$ Z_{{\rm{fc}}} $ , while the right panel shows the corresponding$ A_{{\rm{fc}}} $ .The full set of
$ (T_9,n_n) $ points, together with the corresponding values of$ Z_{{\rm{fc}}} $ and$ A_{{\rm{fc}}} $ , is listed in Appendix A (Table A1).$ T_9\; {\rm{/GK}} $ $ n_n $ $ {\rm{/cm}}^{-3} $ $ \log_{10}n_n $ $ A_{{\rm{fc}}} $ $ Z_{{\rm{fc}}} $ $ {\rm{elem}}_{{\rm{fc}}} $ $ n_n $ $ {\rm{/cm}}^{-3} $ $ \log_{10}n_n $ $ A_{{\rm{fc}}} $ $ Z_{{\rm{fc}}} $ $ {\rm{elem}}_{{\rm{fc}}} $ 1.000 $ 1.457 \times 10^{19} $ 19.163 290 99 Es $ 4.092 \times 10^{19} $ 19.612 290 99 Es 1.000 $ 1.149 \times 10^{20} $ 20.060 290 99 Es $ 3.229 \times 10^{20} $ 20.509 290 99 Es 1.040 $ 5.780 \times 10^{19} $ 19.762 290 99 Es $ 1.560 \times 10^{20} $ 20.193 290 99 Es 1.040 $ 4.212 \times 10^{20} $ 20.625 290 99 Es $ 1.137 \times 10^{21} $ 21.056 290 99 Es 1.080 $ 2.075 \times 10^{20} $ 20.317 290 99 Es $ 5.400 \times 10^{20} $ 20.732 290 99 Es 1.080 $ 1.405 \times 10^{21} $ 21.148 283 99 Es $ 3.657 \times 10^{21} $ 21.563 283 99 Es 1.120 $ 6.814 \times 10^{20} $ 20.833 283 99 Es $ 1.714 \times 10^{21} $ 21.234 283 99 Es 1.120 $ 4.310 \times 10^{21} $ 21.634 283 99 Es $ 1.084 \times 10^{22} $ 22.035 283 99 Es 1.160 $ 2.065 \times 10^{21} $ 21.315 283 99 Es $ 5.031 \times 10^{21} $ 21.702 283 99 Es 1.160 $ 1.226 \times 10^{22} $ 22.088 283 99 Es $ 2.986 \times 10^{22} $ 22.475 283 99 Es 1.200 $ 5.823 \times 10^{21} $ 21.765 283 99 Es $ 1.377 \times 10^{22} $ 22.139 283 99 Es 1.200 $ 3.257 \times 10^{22} $ 22.513 283 99 Es $ 7.701 \times 10^{22} $ 22.887 283 99 Es 1.240 $ 1.538 \times 10^{22} $ 22.187 283 99 Es $ 3.538 \times 10^{22} $ 22.549 283 99 Es 1.240 $ 8.138 \times 10^{22} $ 22.911 283 99 Es $ 1.872 \times 10^{23} $ 23.272 283 99 Es 1.280 $ 3.830 \times 10^{22} $ 22.583 283 99 Es $ 8.582 \times 10^{22} $ 22.934 283 99 Es 1.280 $ 1.923 \times 10^{23} $ 23.284 283 99 Es $ 4.310 \times 10^{23} $ 23.634 283 99 Es 1.320 $ 9.035 \times 10^{22} $ 22.956 283 99 Es $ 1.976 \times 10^{23} $ 23.296 283 99 Es 1.320 $ 4.321 \times 10^{23} $ 23.636 283 99 Es $ 9.449 \times 10^{23} $ 23.975 283 99 Es 1.360 $ 2.029 \times 10^{23} $ 23.307 283 99 Es $ 4.337 \times 10^{23} $ 23.637 283 99 Es 1.360 $ 9.268 \times 10^{23} $ 23.967 279 98 Cf $ 1.981 \times 10^{24} $ 24.297 279 98 Cf 1.400 $ 4.357 \times 10^{23} $ 23.639 283 99 Es $ 9.112 \times 10^{23} $ 23.960 279 98 Cf 1.400 $ 1.905 \times 10^{24} $ 24.280 279 98 Cf $ 3.985 \times 10^{24} $ 24.600 279 98 Cf 1.440 $ 8.977 \times 10^{23} $ 23.953 279 98 Cf $ 1.839 \times 10^{24} $ 24.265 279 98 Cf 1.440 $ 3.768 \times 10^{24} $ 24.576 279 98 Cf $ 7.720 \times 10^{24} $ 24.888 279 98 Cf 1.480 $ 1.781 \times 10^{24} $ 24.251 279 98 Cf $ 3.578 \times 10^{24} $ 24.554 279 98 Cf 1.480 $ 7.191 \times 10^{24} $ 24.857 279 98 Cf $ 1.445 \times 10^{25} $ 25.160 281 97 Bk 1.520 $ 3.411 \times 10^{24} $ 24.533 277 97 Bk $ 6.730 \times 10^{24} $ 24.828 277 97 Bk 1.520 $ 1.328 \times 10^{25} $ 25.123 275 96 Cm $ 2.619 \times 10^{25} $ 25.418 275 96 Cm 1.560 $ 6.326 \times 10^{24} $ 24.801 275 96 Cm $ 1.227 \times 10^{25} $ 25.089 275 96 Cm 1.560 $ 2.378 \times 10^{25} $ 25.376 275 96 Cm $ 4.611 \times 10^{25} $ 25.664 275 96 Cm 1.600 $ 1.139 \times 10^{25} $ 25.056 275 96 Cm $ 2.171 \times 10^{25} $ 25.337 275 96 Cm 1.600 $ 4.141 \times 10^{25} $ 25.617 275 96 Cm $ 7.896 \times 10^{25} $ 25.897 275 96 Cm 1.640 $ 1.993 \times 10^{25} $ 25.300 275 96 Cm $ 3.742 \times 10^{25} $ 25.573 275 96 Cm 1.640 $ 7.024 \times 10^{25} $ 25.847 275 96 Cm $ 1.319 \times 10^{26} $ 26.120 275 96 Cm 1.680 $ 3.401 \times 10^{25} $ 25.532 275 96 Cm $ 6.289 \times 10^{25} $ 25.799 275 96 Cm 1.680 $ 1.163 \times 10^{26} $ 26.066 275 96 Cm $ 2.151 \times 10^{26} $ 26.333 275 96 Cm 1.720 $ 5.664 \times 10^{25} $ 25.753 275 96 Cm $ 1.033 \times 10^{26} $ 26.014 275 96 Cm 1.720 $ 1.882 \times 10^{26} $ 26.275 275 96 Cm $ 3.432 \times 10^{26} $ 26.535 275 96 Cm 1.760 $ 9.225 \times 10^{25} $ 25.965 275 96 Cm $ 1.659 \times 10^{26} $ 26.220 275 96 Cm 1.760 $ 2.983 \times 10^{26} $ 26.475 275 96 Cm $ 5.365 \times 10^{26} $ 26.730 275 96 Cm 1.800 $ 1.471 \times 10^{26} $ 26.168 275 96 Cm $ 2.612 \times 10^{26} $ 26.417 275 96 Cm 1.800 $ 4.636 \times 10^{26} $ 26.666 275 96 Cm $ 8.228 \times 10^{26} $ 26.915 275 96 Cm 1.840 $ 2.301 \times 10^{26} $ 26.362 275 96 Cm $ 4.034 \times 10^{26} $ 26.606 275 96 Cm 1.840 $ 7.072 \times 10^{26} $ 26.850 275 96 Cm $ 1.240 \times 10^{27} $ 27.093 275 96 Cm 1.880 $ 3.534 \times 10^{26} $ 26.548 275 96 Cm $ 6.121 \times 10^{26} $ 26.787 275 96 Cm 1.880 $ 1.060 \times 10^{27} $ 27.025 275 96 Cm $ 1.837 \times 10^{27} $ 27.264 275 96 Cm 1.920 $ 5.334 \times 10^{26} $ 26.727 275 96 Cm $ 9.134 \times 10^{26} $ 26.961 275 96 Cm 1.920 $ 1.564 \times 10^{27} $ 27.194 275 96 Cm $ 2.679 \times 10^{27} $ 27.428 275 96 Cm 1.960 $ 7.922 \times 10^{26} $ 26.899 275 96 Cm $ 1.342 \times 10^{27} $ 27.128 275 96 Cm 1.960 $ 2.273 \times 10^{27} $ 27.357 275 96 Cm $ 3.850 \times 10^{27} $ 27.585 275 96 Cm 2.000 $ 1.159 \times 10^{27} $ 27.064 275 96 Cm $ 1.942 \times 10^{27} $ 27.288 275 96 Cm 2.000 $ 3.255 \times 10^{27} $ 27.513 275 96 Cm $ 5.456 \times 10^{27} $ 27.737 274 95 Am Table A1. Numerical values for the nuclei at the onset of fission cycling,
$ (A_{{\rm{fc}}}, Z_{{\rm{fc}}}, {\rm{elem}}_{{\rm{fc}}}) $ , are listed as functions of the temperature$ T_9 $ (in GK) and the neutron density$ n_n $ (in$ {\rm{cm}}^{-3} $ ), corresponding to the results shown in Fig. 5. For each temperature$ T_9 $ , two rows are used, with two sets of$ (n_n, \log_{10}n_n, A_{{\rm{fc}}}, Z_{{\rm{fc}}}, {\rm{elem}}_{{\rm{fc}}}) $ per row.The map indicates that the onset of fission cycling spans a well-defined region of the actinide chart, extending from americium (Am) to einsteinium (Es). As temperature and neutron density increase, the onset shifts systematically toward lower mass numbers, from
$ A\approx290 $ to$ A\approx270 $ .Rather than occurring at a fixed neutron number, the onset follows a continuous trajectory along the equilibrium boundary, reflecting the strong environmental dependence of the competition between neutron-induced fission and β-decay.
-
We extend the lifetime analysis across the full
$ T_9 $ –$ n_n $ parameter space and construct a global map of the onset of fission cycling in the actinide region.Fig. 5 shows the onset nucleus identified at each thermodynamic point
$ (T_9, n_n) $ within the CWP domain. Each colored point corresponds to a distinct set of conditions, with the onset characterized by its proton number$ Z_{{\rm{fc}}} $ and mass number$ A_{{\rm{fc}}} $ .
Figure 5. (color online) Onset of fission cycling across the
$ T_9 $ –$ n_n $ parameter space. Left: Proton number$ Z_{{\rm{fc}}} $ of the nucleus at onset. Right: Corresponding mass number$ A_{{\rm{fc}}} $ .The left panel displays
$ Z_{{\rm{fc}}} $ , while the right panel shows the corresponding$ A_{{\rm{fc}}} $ .The full set of
$ (T_9,n_n) $ points, together with the corresponding values of$ Z_{{\rm{fc}}} $ and$ A_{{\rm{fc}}} $ , is listed in Appendix A (Table A1).$ T_9\; ({\rm{GK}}) $ $ n_n $ ($ {\rm{cm}}^{-3} $ )$ \log_{10}n_n $ $ A_{{\rm{fc}}} $ $ Z_{{\rm{fc}}} $ $ {\rm{elem}}_{{\rm{fc}}} $ $ n_n $ ($ {\rm{cm}}^{-3} $ )$ \log_{10}n_n $ $ A_{{\rm{fc}}} $ $ Z_{{\rm{fc}}} $ $ {\rm{elem}}_{{\rm{fc}}} $ 1.000 $ 1.457 \times 10^{19} $ 19.163 290 99 Es $ 4.092 \times 10^{19} $ 19.612 290 99 Es 1.000 $ 1.149 \times 10^{20} $ 20.060 290 99 Es $ 3.229 \times 10^{20} $ 20.509 290 99 Es 1.040 $ 5.780 \times 10^{19} $ 19.762 290 99 Es $ 1.560 \times 10^{20} $ 20.193 290 99 Es 1.040 $ 4.212 \times 10^{20} $ 20.625 290 99 Es $ 1.137 \times 10^{21} $ 21.056 290 99 Es 1.080 $ 2.075 \times 10^{20} $ 20.317 290 99 Es $ 5.400 \times 10^{20} $ 20.732 290 99 Es 1.080 $ 1.405 \times 10^{21} $ 21.148 283 99 Es $ 3.657 \times 10^{21} $ 21.563 283 99 Es 1.120 $ 6.814 \times 10^{20} $ 20.833 283 99 Es $ 1.714 \times 10^{21} $ 21.234 283 99 Es 1.120 $ 4.310 \times 10^{21} $ 21.634 283 99 Es $ 1.084 \times 10^{22} $ 22.035 283 99 Es 1.160 $ 2.065 \times 10^{21} $ 21.315 283 99 Es $ 5.031 \times 10^{21} $ 21.702 283 99 Es 1.160 $ 1.226 \times 10^{22} $ 22.088 283 99 Es $ 2.986 \times 10^{22} $ 22.475 283 99 Es 1.200 $ 5.823 \times 10^{21} $ 21.765 283 99 Es $ 1.377 \times 10^{22} $ 22.139 283 99 Es 1.200 $ 3.257 \times 10^{22} $ 22.513 283 99 Es $ 7.701 \times 10^{22} $ 22.887 283 99 Es 1.240 $ 1.538 \times 10^{22} $ 22.187 283 99 Es $ 3.538 \times 10^{22} $ 22.549 283 99 Es 1.240 $ 8.138 \times 10^{22} $ 22.911 283 99 Es $ 1.872 \times 10^{23} $ 23.272 283 99 Es 1.280 $ 3.830 \times 10^{22} $ 22.583 283 99 Es $ 8.582 \times 10^{22} $ 22.934 283 99 Es 1.280 $ 1.923 \times 10^{23} $ 23.284 283 99 Es $ 4.310 \times 10^{23} $ 23.634 283 99 Es 1.320 $ 9.035 \times 10^{22} $ 22.956 283 99 Es $ 1.976 \times 10^{23} $ 23.296 283 99 Es 1.320 $ 4.321 \times 10^{23} $ 23.636 283 99 Es $ 9.449 \times 10^{23} $ 23.975 283 99 Es 1.360 $ 2.029 \times 10^{23} $ 23.307 283 99 Es $ 4.337 \times 10^{23} $ 23.637 283 99 Es 1.360 $ 9.268 \times 10^{23} $ 23.967 279 98 Cf $ 1.981 \times 10^{24} $ 24.297 279 98 Cf 1.400 $ 4.357 \times 10^{23} $ 23.639 283 99 Es $ 9.112 \times 10^{23} $ 23.960 279 98 Cf 1.400 $ 1.905 \times 10^{24} $ 24.280 279 98 Cf $ 3.985 \times 10^{24} $ 24.600 279 98 Cf 1.440 $ 8.977 \times 10^{23} $ 23.953 279 98 Cf $ 1.839 \times 10^{24} $ 24.265 279 98 Cf 1.440 $ 3.768 \times 10^{24} $ 24.576 279 98 Cf $ 7.720 \times 10^{24} $ 24.888 279 98 Cf 1.480 $ 1.781 \times 10^{24} $ 24.251 279 98 Cf $ 3.578 \times 10^{24} $ 24.554 279 98 Cf 1.480 $ 7.191 \times 10^{24} $ 24.857 279 98 Cf $ 1.445 \times 10^{25} $ 25.160 281 97 Bk 1.520 $ 3.411 \times 10^{24} $ 24.533 277 97 Bk $ 6.730 \times 10^{24} $ 24.828 277 97 Bk 1.520 $ 1.328 \times 10^{25} $ 25.123 275 96 Cm $ 2.619 \times 10^{25} $ 25.418 275 96 Cm 1.560 $ 6.326 \times 10^{24} $ 24.801 275 96 Cm $ 1.227 \times 10^{25} $ 25.089 275 96 Cm 1.560 $ 2.378 \times 10^{25} $ 25.376 275 96 Cm $ 4.611 \times 10^{25} $ 25.664 275 96 Cm 1.600 $ 1.139 \times 10^{25} $ 25.056 275 96 Cm $ 2.171 \times 10^{25} $ 25.337 275 96 Cm 1.600 $ 4.141 \times 10^{25} $ 25.617 275 96 Cm $ 7.896 \times 10^{25} $ 25.897 275 96 Cm 1.640 $ 1.993 \times 10^{25} $ 25.300 275 96 Cm $ 3.742 \times 10^{25} $ 25.573 275 96 Cm 1.640 $ 7.024 \times 10^{25} $ 25.847 275 96 Cm $ 1.319 \times 10^{26} $ 26.120 275 96 Cm 1.680 $ 3.401 \times 10^{25} $ 25.532 275 96 Cm $ 6.289 \times 10^{25} $ 25.799 275 96 Cm 1.680 $ 1.163 \times 10^{26} $ 26.066 275 96 Cm $ 2.151 \times 10^{26} $ 26.333 275 96 Cm 1.720 $ 5.664 \times 10^{25} $ 25.753 275 96 Cm $ 1.033 \times 10^{26} $ 26.014 275 96 Cm 1.720 $ 1.882 \times 10^{26} $ 26.275 275 96 Cm $ 3.432 \times 10^{26} $ 26.535 275 96 Cm 1.760 $ 9.225 \times 10^{25} $ 25.965 275 96 Cm $ 1.659 \times 10^{26} $ 26.220 275 96 Cm 1.760 $ 2.983 \times 10^{26} $ 26.475 275 96 Cm $ 5.365 \times 10^{26} $ 26.730 275 96 Cm 1.800 $ 1.471 \times 10^{26} $ 26.168 275 96 Cm $ 2.612 \times 10^{26} $ 26.417 275 96 Cm 1.800 $ 4.636 \times 10^{26} $ 26.666 275 96 Cm $ 8.228 \times 10^{26} $ 26.915 275 96 Cm 1.840 $ 2.301 \times 10^{26} $ 26.362 275 96 Cm $ 4.034 \times 10^{26} $ 26.606 275 96 Cm 1.840 $ 7.072 \times 10^{26} $ 26.850 275 96 Cm $ 1.240 \times 10^{27} $ 27.093 275 96 Cm 1.880 $ 3.534 \times 10^{26} $ 26.548 275 96 Cm $ 6.121 \times 10^{26} $ 26.787 275 96 Cm 1.880 $ 1.060 \times 10^{27} $ 27.025 275 96 Cm $ 1.837 \times 10^{27} $ 27.264 275 96 Cm 1.920 $ 5.334 \times 10^{26} $ 26.727 275 96 Cm $ 9.134 \times 10^{26} $ 26.961 275 96 Cm 1.920 $ 1.564 \times 10^{27} $ 27.194 275 96 Cm $ 2.679 \times 10^{27} $ 27.428 275 96 Cm 1.960 $ 7.922 \times 10^{26} $ 26.899 275 96 Cm $ 1.342 \times 10^{27} $ 27.128 275 96 Cm 1.960 $ 2.273 \times 10^{27} $ 27.357 275 96 Cm $ 3.850 \times 10^{27} $ 27.585 275 96 Cm 2.000 $ 1.159 \times 10^{27} $ 27.064 275 96 Cm $ 1.942 \times 10^{27} $ 27.288 275 96 Cm 2.000 $ 3.255 \times 10^{27} $ 27.513 275 96 Cm $ 5.456 \times 10^{27} $ 27.737 274 95 Am Table A1. Numerical values for the nuclei at the onset of fission cycling,
$ (A_{{\rm{fc}}}, Z_{{\rm{fc}}}, {\rm{elem}}_{{\rm{fc}}}) $ , are listed as functions of the temperature$ T_9 $ (in GK) and the neutron density$ n_n $ (in$ {\rm{cm}}^{-3} $ ), corresponding to the results shown in Fig. 5. For each temperature$ T_9 $ , two rows are used, with two sets of$ (n_n, \log_{10}n_n, A_{{\rm{fc}}}, Z_{{\rm{fc}}}, {\rm{elem}}_{{\rm{fc}}}) $ per row.The map indicates that the onset of fission cycling spans a well-defined region of the actinide chart, extending from americium (Am) to einsteinium (Es). As temperature and neutron density increase, the onset shifts systematically toward lower mass numbers, from
$ A\approx290 $ to$ A\approx270 $ .Rather than occurring at a fixed neutron number, the onset follows a continuous trajectory along the equilibrium boundary, reflecting the strong environmental dependence of the competition between neutron-induced fission and β-decay.
-
We extend the lifetime analysis across the full
$ T_9 $ –$ n_n $ parameter space and construct a global map of the onset of fission cycling in the actinide region.Figure 5 shows the onset nucleus identified at each thermodynamic point
$ (T_9, n_n) $ within the CWP domain. Each colored point corresponds to a distinct set of conditions, with the onset characterized by its proton number$ Z_{{\rm{fc}}} $ and mass number$ A_{{\rm{fc}}} $ .
Figure 5. (color online) Onset of fission cycling across the
$ T_9 $ –$ n_n $ parameter space. Left: Proton number$ Z_{{\rm{fc}}} $ of the nucleus at onset. Right: Corresponding mass number$ A_{{\rm{fc}}} $ .The left panel displays
$ Z_{{\rm{fc}}} $ , while the right panel shows the corresponding$ A_{{\rm{fc}}} $ .The full set of
$ (T_9,n_n) $ points, together with the corresponding values of$ Z_{{\rm{fc}}} $ and$ A_{{\rm{fc}}} $ , is listed in Appendix A (Table A1).$ T_9\; {\rm{/GK}} $ $ n_n $ $ {\rm{/cm}}^{-3} $ $ \log_{10}n_n $ $ A_{{\rm{fc}}} $ $ Z_{{\rm{fc}}} $ $ {\rm{elem}}_{{\rm{fc}}} $ $ n_n $ $ {\rm{/cm}}^{-3} $ $ \log_{10}n_n $ $ A_{{\rm{fc}}} $ $ Z_{{\rm{fc}}} $ $ {\rm{elem}}_{{\rm{fc}}} $ 1.000 $ 1.457 \times 10^{19} $ 19.163 290 99 Es $ 4.092 \times 10^{19} $ 19.612 290 99 Es 1.000 $ 1.149 \times 10^{20} $ 20.060 290 99 Es $ 3.229 \times 10^{20} $ 20.509 290 99 Es 1.040 $ 5.780 \times 10^{19} $ 19.762 290 99 Es $ 1.560 \times 10^{20} $ 20.193 290 99 Es 1.040 $ 4.212 \times 10^{20} $ 20.625 290 99 Es $ 1.137 \times 10^{21} $ 21.056 290 99 Es 1.080 $ 2.075 \times 10^{20} $ 20.317 290 99 Es $ 5.400 \times 10^{20} $ 20.732 290 99 Es 1.080 $ 1.405 \times 10^{21} $ 21.148 283 99 Es $ 3.657 \times 10^{21} $ 21.563 283 99 Es 1.120 $ 6.814 \times 10^{20} $ 20.833 283 99 Es $ 1.714 \times 10^{21} $ 21.234 283 99 Es 1.120 $ 4.310 \times 10^{21} $ 21.634 283 99 Es $ 1.084 \times 10^{22} $ 22.035 283 99 Es 1.160 $ 2.065 \times 10^{21} $ 21.315 283 99 Es $ 5.031 \times 10^{21} $ 21.702 283 99 Es 1.160 $ 1.226 \times 10^{22} $ 22.088 283 99 Es $ 2.986 \times 10^{22} $ 22.475 283 99 Es 1.200 $ 5.823 \times 10^{21} $ 21.765 283 99 Es $ 1.377 \times 10^{22} $ 22.139 283 99 Es 1.200 $ 3.257 \times 10^{22} $ 22.513 283 99 Es $ 7.701 \times 10^{22} $ 22.887 283 99 Es 1.240 $ 1.538 \times 10^{22} $ 22.187 283 99 Es $ 3.538 \times 10^{22} $ 22.549 283 99 Es 1.240 $ 8.138 \times 10^{22} $ 22.911 283 99 Es $ 1.872 \times 10^{23} $ 23.272 283 99 Es 1.280 $ 3.830 \times 10^{22} $ 22.583 283 99 Es $ 8.582 \times 10^{22} $ 22.934 283 99 Es 1.280 $ 1.923 \times 10^{23} $ 23.284 283 99 Es $ 4.310 \times 10^{23} $ 23.634 283 99 Es 1.320 $ 9.035 \times 10^{22} $ 22.956 283 99 Es $ 1.976 \times 10^{23} $ 23.296 283 99 Es 1.320 $ 4.321 \times 10^{23} $ 23.636 283 99 Es $ 9.449 \times 10^{23} $ 23.975 283 99 Es 1.360 $ 2.029 \times 10^{23} $ 23.307 283 99 Es $ 4.337 \times 10^{23} $ 23.637 283 99 Es 1.360 $ 9.268 \times 10^{23} $ 23.967 279 98 Cf $ 1.981 \times 10^{24} $ 24.297 279 98 Cf 1.400 $ 4.357 \times 10^{23} $ 23.639 283 99 Es $ 9.112 \times 10^{23} $ 23.960 279 98 Cf 1.400 $ 1.905 \times 10^{24} $ 24.280 279 98 Cf $ 3.985 \times 10^{24} $ 24.600 279 98 Cf 1.440 $ 8.977 \times 10^{23} $ 23.953 279 98 Cf $ 1.839 \times 10^{24} $ 24.265 279 98 Cf 1.440 $ 3.768 \times 10^{24} $ 24.576 279 98 Cf $ 7.720 \times 10^{24} $ 24.888 279 98 Cf 1.480 $ 1.781 \times 10^{24} $ 24.251 279 98 Cf $ 3.578 \times 10^{24} $ 24.554 279 98 Cf 1.480 $ 7.191 \times 10^{24} $ 24.857 279 98 Cf $ 1.445 \times 10^{25} $ 25.160 281 97 Bk 1.520 $ 3.411 \times 10^{24} $ 24.533 277 97 Bk $ 6.730 \times 10^{24} $ 24.828 277 97 Bk 1.520 $ 1.328 \times 10^{25} $ 25.123 275 96 Cm $ 2.619 \times 10^{25} $ 25.418 275 96 Cm 1.560 $ 6.326 \times 10^{24} $ 24.801 275 96 Cm $ 1.227 \times 10^{25} $ 25.089 275 96 Cm 1.560 $ 2.378 \times 10^{25} $ 25.376 275 96 Cm $ 4.611 \times 10^{25} $ 25.664 275 96 Cm 1.600 $ 1.139 \times 10^{25} $ 25.056 275 96 Cm $ 2.171 \times 10^{25} $ 25.337 275 96 Cm 1.600 $ 4.141 \times 10^{25} $ 25.617 275 96 Cm $ 7.896 \times 10^{25} $ 25.897 275 96 Cm 1.640 $ 1.993 \times 10^{25} $ 25.300 275 96 Cm $ 3.742 \times 10^{25} $ 25.573 275 96 Cm 1.640 $ 7.024 \times 10^{25} $ 25.847 275 96 Cm $ 1.319 \times 10^{26} $ 26.120 275 96 Cm 1.680 $ 3.401 \times 10^{25} $ 25.532 275 96 Cm $ 6.289 \times 10^{25} $ 25.799 275 96 Cm 1.680 $ 1.163 \times 10^{26} $ 26.066 275 96 Cm $ 2.151 \times 10^{26} $ 26.333 275 96 Cm 1.720 $ 5.664 \times 10^{25} $ 25.753 275 96 Cm $ 1.033 \times 10^{26} $ 26.014 275 96 Cm 1.720 $ 1.882 \times 10^{26} $ 26.275 275 96 Cm $ 3.432 \times 10^{26} $ 26.535 275 96 Cm 1.760 $ 9.225 \times 10^{25} $ 25.965 275 96 Cm $ 1.659 \times 10^{26} $ 26.220 275 96 Cm 1.760 $ 2.983 \times 10^{26} $ 26.475 275 96 Cm $ 5.365 \times 10^{26} $ 26.730 275 96 Cm 1.800 $ 1.471 \times 10^{26} $ 26.168 275 96 Cm $ 2.612 \times 10^{26} $ 26.417 275 96 Cm 1.800 $ 4.636 \times 10^{26} $ 26.666 275 96 Cm $ 8.228 \times 10^{26} $ 26.915 275 96 Cm 1.840 $ 2.301 \times 10^{26} $ 26.362 275 96 Cm $ 4.034 \times 10^{26} $ 26.606 275 96 Cm 1.840 $ 7.072 \times 10^{26} $ 26.850 275 96 Cm $ 1.240 \times 10^{27} $ 27.093 275 96 Cm 1.880 $ 3.534 \times 10^{26} $ 26.548 275 96 Cm $ 6.121 \times 10^{26} $ 26.787 275 96 Cm 1.880 $ 1.060 \times 10^{27} $ 27.025 275 96 Cm $ 1.837 \times 10^{27} $ 27.264 275 96 Cm 1.920 $ 5.334 \times 10^{26} $ 26.727 275 96 Cm $ 9.134 \times 10^{26} $ 26.961 275 96 Cm 1.920 $ 1.564 \times 10^{27} $ 27.194 275 96 Cm $ 2.679 \times 10^{27} $ 27.428 275 96 Cm 1.960 $ 7.922 \times 10^{26} $ 26.899 275 96 Cm $ 1.342 \times 10^{27} $ 27.128 275 96 Cm 1.960 $ 2.273 \times 10^{27} $ 27.357 275 96 Cm $ 3.850 \times 10^{27} $ 27.585 275 96 Cm 2.000 $ 1.159 \times 10^{27} $ 27.064 275 96 Cm $ 1.942 \times 10^{27} $ 27.288 275 96 Cm 2.000 $ 3.255 \times 10^{27} $ 27.513 275 96 Cm $ 5.456 \times 10^{27} $ 27.737 274 95 Am Table A1. Numerical values for the nuclei at the onset of fission cycling,
$ (A_{{\rm{fc}}}, Z_{{\rm{fc}}}, {\rm{elem}}_{{\rm{fc}}}) $ , are listed as functions of the temperature$ T_9 $ (in GK) and the neutron density$ n_n $ (in$ {\rm{cm}}^{-3} $ ), corresponding to the results shown in Fig. 5. For each temperature$ T_9 $ , two rows are used, with two sets of$ (n_n, \log_{10}n_n, A_{{\rm{fc}}}, Z_{{\rm{fc}}}, {\rm{elem}}_{{\rm{fc}}}) $ per row.The map indicates that the onset of fission cycling spans a well-defined region of the actinide chart, extending from americium (Am) to einsteinium (Es). As temperature and neutron density increase, the onset shifts systematically toward lower mass numbers, from
$ A\approx290 $ to$ A\approx270 $ .Rather than occurring at a fixed neutron number, the onset follows a continuous trajectory along the equilibrium boundary, reflecting the strong environmental dependence of the competition between neutron-induced fission and β-decay.
-
The framework developed here combines structural diagnostics, the
$ T_9 $ –$ n_n $ condition band, equilibrium-path filtering, and point-by-point lifetime comparisons to identify the onset of fission cycling under equilibrium r-process conditions.It applies to regimes in which an approximate
$ (n,\gamma)\rightleftarrows(\gamma,n) $ equilibrium holds and a waiting-point-like description of the reaction flow remains valid [3, 4, 34]. Such conditions are expected during the high-temperature, high-neutron-density phases of the r-process, for example, in the early, hot stages of compact-object merger ejecta [16].We now examine the key assumptions and nuclear-physics uncertainties that determine the robustness of the inferred fission-onset boundary.
-
Within the FRDM2012 mass model adopted here, both the extent of the
$ T_9 $ –$ n_n $ condition band and the set of actinide isotopic chains included in the equilibrium-path band are determined by the systematics of the predicted neutron-separation energies.The structural diagnostic introduced in Sec. IV.A, based on the
$ S_{2n}/2 $ metric near$ N\approx184 $ , selects a subset of even-Z chains for which the separation energies vary smoothly.The effective bandwidth
$ \Delta S $ is chosen to encompass the spread in$ S_{2n} $ among the selected isotopic chains, while reflecting both intrinsic variations in the separation-energy systematics and the propagation of nuclear-mass uncertainties to$ S_{2n} $ ; because of its difference form, the latter sets a characteristic scale of a few tenths of an MeV. It thus provides a consistent measure of the structural uncertainty associated with the heavy-region condition band.Across the condition band, the equilibrium separation energy
$ S_n^0 $ varies systematically with$ (T_9,n_n) $ , while the relative positioning of the selected isotopic chains is essentially unchanged. As a result, the location of the fission-cycling onset is governed primarily by the competition between$ \tau_{n,{\rm{f}}} $ (which depends strongly on$ n_n $ ) and$ \tau_\beta $ , rather than by moderate variations in the separation-energy systematics. This suggests that the inferred fission-onset boundary is relatively robust against moderate mass-model uncertainties, provided that the global$ S_{2n} $ trends near$ N \approx 184 $ are reasonably reproduced.Although FRDM2012 is adopted here as a consistent structural baseline, the framework itself is not tied to a specific mass model and can be applied to other global mass models. Systematic comparisons with alternative mass tables will be carried out in future work to further quantify the robustness of the condition-band construction and the resulting fission-onset map.
-
Within the FRDM2012 mass model adopted here, both the extent of the
$ T_9 $ –$ n_n $ condition band and the set of actinide isotopic chains included in the equilibrium-path band are determined by the systematics of the predicted neutron-separation energies.The structural diagnostic introduced in Sec. 4.1, based on the
$ S_{2n}/2 $ metric near$ N\approx184 $ , selects a subset of even-Z chains for which the separation energies vary smoothly.The effective bandwidth
$ \Delta S $ is chosen to encompass the spread in$ S_{2n} $ among the selected isotopic chains, while reflecting both intrinsic variations in the separation-energy systematics and the propagation of nuclear-mass uncertainties to$ S_{2n} $ ; because of its difference form, the latter sets a characteristic scale of a few tenths of an MeV. It thus provides a consistent measure of the structural uncertainty associated with the heavy-region condition band.Across the condition band, the equilibrium separation energy
$ S_n^0 $ varies systematically with$ (T_9,n_n) $ , while the relative positioning of the selected isotopic chains is essentially unchanged. As a result, the location of the fission-cycling onset is governed primarily by the competition between$ \tau_{n,{\rm{f}}} $ (which depends strongly on$ n_n $ ) and$ \tau_\beta $ , rather than by moderate variations in the separation-energy systematics. This suggests that the inferred fission-onset boundary is relatively robust against moderate mass-model uncertainties, provided that the global$ S_{2n} $ trends near$ N \approx 184 $ are reasonably reproduced.Although FRDM2012 is adopted here as a consistent structural baseline, the framework itself is not tied to a specific mass model and can be applied to other global mass models. Systematic comparisons with alternative mass tables will be carried out in future work to further quantify the robustness of the condition-band construction and the resulting fission-onset map.
-
Within the FRDM2012 mass model adopted here, both the extent of the
$ T_9 $ –$ n_n $ condition band and the set of actinide isotopic chains included in the equilibrium-path band are determined by the systematics of the predicted neutron-separation energies.The structural diagnostic introduced in Sec. IV.A, based on the
$ S_{2n}/2 $ metric near$ N\approx184 $ , selects a subset of even-Z chains for which the separation energies vary smoothly.The effective bandwidth
$ \Delta S $ is chosen to encompass the spread in$ S_{2n} $ among the selected isotopic chains, while reflecting both intrinsic variations in the separation-energy systematics and the propagation of nuclear-mass uncertainties to$ S_{2n} $ ; because of its difference form, the latter sets a characteristic scale of a few tenths of an MeV. It thus provides a consistent measure of the structural uncertainty associated with the heavy-region condition band.Across the condition band, the equilibrium separation energy
$ S_n^0 $ varies systematically with$ (T_9,n_n) $ , while the relative positioning of the selected isotopic chains is essentially unchanged. As a result, the location of the fission-cycling onset is governed primarily by the competition between$ \tau_{n,{\rm{f}}} $ (which depends strongly on$ n_n $ ) and$ \tau_\beta $ , rather than by moderate variations in the separation-energy systematics. This suggests that the inferred fission-onset boundary is relatively robust against moderate mass-model uncertainties, provided that the global$ S_{2n} $ trends near$ N \approx 184 $ are reasonably reproduced.Although FRDM2012 is adopted here as a consistent structural baseline, the framework itself is not tied to a specific mass model and can be applied to other global mass models. Systematic comparisons with alternative mass tables will be carried out in future work to further quantify the robustness of the condition-band construction and the resulting fission-onset map.
-
The neutron-induced fission rates calculated with TALYS in this work depend on the adopted fission-barrier systematics. The baseline onset map presented in Sec. 4 uses the standard TALYS prescription, combining experimentally constrained barriers where available (
$\mathrm{fismodel}=1 $ ) with a rotating liquid-drop description as a fallback ($ \mathrm{fismodelalt}=4$ ).To assess this dependence, we performed a complementary set of calculations using a fully theoretical barrier set, based on the macroscopic–microscopic barriers of Mamdouh et al. (
$\mathrm{fismodel}=2 $ ) together with the Rotating Finite-Range Model of Sierk ($\mathrm{fismodelalt}=3 $ ), and recomputed the onset map on the same$ (T_9, n_n) $ grid.The resulting onset nuclei exhibit systematic yet bounded shifts under the alternative barrier prescription. Across all sampled thermodynamic points, the typical shift is +1 in both Z and A, with roughly one-third of the points remaining unchanged. The effect is predominantly local: 98.7% of the grid points satisfy
$ |\Delta Z|\le 3 $ and$ |\Delta A|\le 8 $ , and only two points show larger deviations, confined to a narrow region in which the$ \tau_{n,f} $ –$ \tau_\beta $ crossing is particularly steep.These results indicate that, although fission-barrier systematics can significantly modify individual fission lifetimes, their impact on the fission-onset boundary remains limited. The changes are restricted to local reassignments among neighboring actinide nuclei, without altering the global structure of the onset map across the equilibrium-path band.
-
The neutron-induced fission rates calculated with TALYS in this work depend on the adopted fission-barrier systematics. The baseline onset map presented in Sec. IV uses the standard TALYS prescription, combining experimentally constrained barriers where available (
$\mathrm{fismodel}= $ 1) with a rotating liquid-drop description as a fallback ($ \mathrm{fismodelalt}=4$ ).To assess this dependence, we performed a complementary set of calculations using a fully theoretical barrier set, based on the macroscopic–microscopic barriers of Mamdouh et al. (
$\mathrm{fismodel}=2 $ ) together with the Rotating Finite-Range Model of Sierk ($\mathrm{fismodelalt}=3 $ ), and recomputed the onset map on the same$ (T_9, n_n) $ grid.The resulting onset nuclei exhibit systematic yet bounded shifts under the alternative barrier prescription. Across all sampled thermodynamic points, the typical shift is +1 in both Z and A, with roughly one-third of the points remaining unchanged. The effect is predominantly local: 98.7% of the grid points satisfy
$ |\Delta Z|\le 3 $ and$ |\Delta A|\le 8 $ , and only two points show larger deviations, confined to a narrow region in which the$ \tau_{n,f} $ –$ \tau_\beta $ crossing is particularly steep.These results indicate that, although fission-barrier systematics can significantly modify individual fission lifetimes, their impact on the fission-onset boundary remains limited. The changes are restricted to local reassignments among neighboring actinide nuclei, without altering the global structure of the onset map across the equilibrium-path band.
-
We have developed a framework to identify the onset of fission cycling in the r-process across a broad range of astrophysical conditions. By combining structural diagnostics, thermodynamic constraints in the
$ T_9 $ –$ n_n $ plane, equilibrium-path filtering, and lifetime comparisons, the framework provides a systematic approach to determine when fission begins to influence the r-process flow.Applying this framework to the actinide region near
$ N\approx184 $ , we find a clear, systematic trend across the$ T_9 $ –$ n_n $ band of conditions. As temperature and neutron density increase, the onset shifts toward lighter actinides along the equilibrium path, with the dominant fissioning nuclei evolving from heavier species (e.g., Es) to Am and neighboring elements. The corresponding mass numbers decrease from$ A\approx290 $ toward$ A\approx270 $ .These trends are consistent with previous r-process studies that place the dominant fissioning region near the
$ N \sim 184 $ shell closure, with typical masses around$ A\approx280 $ [3, 35]. Within this framework, our analysis further shows that the onset of fission cycling is governed primarily by the competition between neutron-induced fission and β-decay, rather than by shifts in the equilibrium path itself.The framework is flexible and can be extended to alternative nuclear inputs and astrophysical conditions, providing a transparent basis for future studies of fission feedback and actinide production in heavy-element nucleosynthesis.
Determination of the fission-cycling onset in the r-process
- Received Date: 2026-02-04
- Available Online: 2026-07-15
Abstract: Identifying the thermodynamic conditions marking the onset of fission cycling is crucial for modeling heavy-element production in the r-process. In this work, we develop a framework to determine this onset over the $ (T_9, n_n) $ plane. We define a heavy-region condition band near $ N \approx 184 $ and construct an equilibrium path band based on the effective neutron separation energy $ S_n^{0}(T_9, n_n) $. We then compare the lifetimes of neutron-induced fission and β-decay for nuclei with $ 94 \leqslant Z \leqslant 106 $. Within this framework, we construct a continuous map of actinide nuclei along the equilibrium path band, identifying where neutron-induced fission first overtakes β-decay. We find that, with increasing temperature and neutron density, the onset shifts toward nuclei with lower proton number (Z) and smaller mass number (A), transitioning from the Es-Cf region to the Am region. These results provide a quantitative benchmark for identifying the conditions under which fission cycling occurs in heavy r-process environments.


 DownLoad: