


 Abstract
 HTML
HTML Reference
 Related
 PDF
PDF


-
The 6Li(n, t)4He tritium production reaction plays an important role in both basic nuclear physics [1] and nuclear engineering. Owing to its large cross section–adopted as a standard in the 0.0253 eV to 1.0 MeV range–and its well–defined reaction products, 6Li–based materials are extensively used in neutron detectors [2–4], dosimeters, and reactor shielding design [5, 6]. Accurate cross sections for the 6Li(n, t)4He reaction across a broad neutron energy range are essential for neutron detection, development of nuclear engineering devices such as fission and fusion reactors, and basic nuclear physics.
Over the past decades, numerous experiments have been conducted to measure the cross sections of the 6Li(n, t)4He reaction. Bartle [7] reported data from 2.16 to 9.66 MeV, while earlier work by Ribe [8] covered the 0.88–6.52 MeV range. Gabbard [9] extended measurements from 19 keV to 4.07 MeV, and Murray [10] reported data from 1.2 to 7.96 MeV. Clements and Rickard [11] contributed results between 0.156 and 3.90 MeV. Drosg [12] measured the cross section from 0.05 to 4 MeV in 1994. Zhang conducted three separate measurement campaigns: in 2000 at 3.67 and 4.42 MeV [13]; in 2003 at 1.85 and 2.67 MeV [14]; and in 2006 at 1.05, 1.54, and 2.25 MeV [15]. In each case, angle–integrated cross sections were derived from differential data using Legendre polynomial fitting. Bai [16] provided differential cross sections at 15 angles between 1.0 eV and 3.0 MeV, including 50 points below 0.1 MeV reported for the first time. Macklin [17] focused on the 1 eV to 1 MeV region, and Goldberg [18] measured tritium production cross sections at 15 MeV. Kirsch [19] reported broad–range measurements from 0.24 to 9.8 MeV in 2017. Most recently, Prusachenko [20] extended the measurement range to 4.25–7.50 MeV using a Cs2LiYCl6:Ce–based scintillation detector and the time–of–flight technique. Despite extensive experimental efforts, discrepancies persist among datasets, particularly in the fast neutron energy region above 3 MeV. Nuclear data evaluation libraries such as ENDF/B–VIII.0 [21], ENDF/B–VII.1 [22], JEFF–3.3 [23], and TENDL–2023 [24] show good mutual agreements. However, in the 3.5–8 MeV range, notable deviations–up to 68% at 6 MeV–are observed when compared to those of recent evaluations such as ENDF/B–VIII.1 [25], JENDL–5.0 [26] and BROND–3.1 [27]. Thesedifferences underscore the importance of reliable experimental data for enhancing the reliability and consistency of evaluated nuclear cross sections.
A gridded ionization chamber (GIC) is a gas–filed detector where charged particles ionize the working gas to electron and positive ion pairs. An electric field is applied via electrodes–typically with a positive high voltage on the anode and a negative high voltage on the cathode. For an electron–pulse type ionization chamber, only the signal generated by electron drift is collected. During electron drift, the induced charges are generated on the cathode and anode of the GIC. The advantages of GIC lie in its large detection angle, high detection efficiency, high energy resolution, and stable operation in long time measurements. Compared to semiconductor detectors, the GIC is almost unaffected by irradiation damage.
In this context, new cross–section measurements of the 6Li(n, t)4He reaction were performed in the neutron energy range from 3.3 to 5.3 MeV. The experiments were conducted using a GIC at the EG–5 Van de Graaff accelerator at the FLNP, JINR. Lithium fluoride samples enriched in 6Li with varying thicknesses and krypton–CO2 gas mixtures at different pressures were employed to optimize the detection of both alpha particles and tritons. Neutron fluxes were monitored using two U3O8 samples (99.999% enriched 238U) inside the GIC, with a calibrated 3He long counter serving as an independent flux monitor. The cross–section data of the 6Li(n, t)4He reaction in the 3.3–5.3 MeV range were obtained, which contributed to improving and updating the nuclear data evaluations.
-
A simplified block diagram of the experimental setup is presented in Fig. 1, which illustrates configurations both with and without the use of a fast neutron collimator (Fig. 1(a) and Fig. 1(b), respectively).
Figure 1. (color online) Schematic of the experimental setup (1 side = forward direction; 2 side = backward direction). (a) – configuration without collimator; (b) – configuration with collimator.
-
The experiments were conducted at the Van de Graaff accelerator EG–5 of the FLNP, JINR. Fast neutrons were produced via the 2H(d, n)3He reaction using a deuterium gas target 2.0 cm in length and 1.0 cm in diameter. The gas cell was separated from the beamline vacuum by a 6.0 μm thick molybdenum foil. The deuteron beam current was approximately 2.0 μA, and the deuterium gas pressure was kept in the range of 2.0 to 2.5 atm. The neutron energy was determined using kinematic calculations from the DD reaction. In addition, the neutron energy uncertainty, which includes the spread caused by the energy loss of the beam in the deuterium gas target and angular distribution, was estimated. The DD–based source provides quasi–monoenergetic neutrons. The spectrum was simulated with NeuSDesc [28]; the spectrum is dominated by main–energy neutrons with a smaller low–energy contribution, which was corrected in the analysis. The energy resolution of the source is estimated to be 150–200 keV because of deuteron energy spread and target pressure. The neutron energy uncertainties are shown as an error bar in the cross–section results.
A steel collimator (20 cm×20 cm×20 cm) featuring a copper insert (60 mm diameter) with a conical aperture (10 mm entrance, 33 mm exit) was used to reduce the background from scattered and thermal neutrons. The copper insert reduces neutron scattering and improves beam collimation. The absolute neutron flux was measured using the 238U(n, f) reaction. Uranium samples were placed at defined positions on the cathode of the GIC. One of the 238U3O8 samples was glued to the GIC shielding plate, which then served as the fission cathode. In parallel, a long counter filled with 3He was employed as a secondary neutron flux monitor, with both methods yielding consistent results.
In this work, we used a steel collimator with a copper insert. This design is equivalent to a solid copper collimator, which confines the neutron irradiation area in accordance with the sample size while also allowing flexibility to change the beam size by replacing only the insert (potentially with different materials). As shown in Fig. 1, the copper collimator was placed between the quasi–monoenergetic neutron source and the gridded ionization chamber (GIC) for neutron collimation. The collimator geometry was modeled with SuperMC [29]. Fast neutron radiography [30] was employed to measure neutron beam profiles behind the copper collimator, and the results (Fig. 2 in Ref. [30]) are consistent with simulations, confirming the reliability of the design.
Figure 2. (color online) Simulated two–dimensional anode–cathode spectra at a gas pressure of 1.0 atm.
-
The detection system was based on a GIC with a common cathode design, offering a large solid angle and high detection efficiency for charged particles, as shown in Fig. 1. Its structure and performance characteristics are detailed in our previous work [31]. To detect charged particles from the 6Li(n, t)4He reaction, the chamber was filled with a krypton–carbon dioxide (Kr + 3%CO2) gas mixture at variable pressures (0.7, 1.0, and 4.0 atm). Adjusting the gas pressure was essential to optimize the stopping of different particles: alpha particles, which have shorter ranges, were best detected at low pressures, whereas tritons, with longer ranges, required higher pressures. The GIC acheives the simultaneous detection of tritons and alpha particles and holds the ability to discriminate reaction channels using the anode signal rise time and amplitude.
Both cathode and anode plates were covered with tantalum foil to reduce background events from interactions between the neutrons and detector materials. Anode and cathode signals from the GIC were processed by a Pixie–16 digital data acquisition system (14–bit resolution, 250 MHz sampling rate) that consists of a PXI–6023 XIA–14 chassis (Wiener), NI PXI–8820 embedded controller, and Pixie–16 high–speed digitizer.
-
A five–position sample changer was mounted at the common cathode of the GIC, enabling sample exchanges without opening the chamber. All samples were prepared on 0.10 mm thick tantalum backings with a 48 mm diameter. Four enriched 6LiF (90.5% 6Li) samples with different areal densities (50–300 μg/cm2) were used. Table 1 summarizes the sample characteristics and positions.
Sample position Sample* Purpose Thickness/(µg•cm-2) Sample** Thickness/(µg•cm-2) No.1 α– source Energy calibration
–α– source
–No.2 238U3O8
Neutron flux measurements
475.0Al
–No.3 6LiF#I
Foreground measurements272.9 6LiF#II 233.5 No.4 6LiF#III 105.3 6LiF#IV 46.0 No.5 Ta Background measurements – Ta – *For the forward direction
**For the backward directionTable 1. Positions of the samples on the cathode and their characteristics.
-
Simulations were performed for the 6Li(n, t)4He reaction within the neutron energy range from 3.3 to 5.3 MeV considering various lithium sample thicknesses from 50 to 300 μg/cm2 and GIC gas pressures of 0.7, 1.0, and 4.0 atm.The simulation code was developed based on MATLAB, where the stopping power data calculated using the SRIM code and cross–section data from the ENDF/B–VIII library were used.
Simulation spectra under different experimental condition were compared to optimize experimental conditions for accurate cross–section determination. Further, the simulated spectra were used to estimate the detection efficiencies of the α and triton events.
Examples of the simulation results of the two–dimensional anode–cathode spectra in the forward direction for a lithium sample with a thickness of 270 μg/cm2 at gas pressures of 1.0 and 4.0 atm, and at a neutron energy of 5.1 MeV, are shown in Figs. 2 and 3, respectively. Simulations at 5.1 MeV neutron energy were representative because of the longer ionization tracks of triton or α, which can be used to guide the overall detector response.
Figure 3. (color online) Simulated two–dimensional anode–cathode spectra at a gas pressure of 4.0 atm.
As shown in Fig. 2, when the gas pressure is 1.0 atm, all α particles can deposit their energy at the sensitive volume of the GIC. Therefore, the α events can be well identified. For triton, only a small part of energy can be detected by the GIC because of the long range. In the two–dimensional spectrum, triton events are located at the area with an anode energy below 4 MeV and cannot be separated from the background. When the gas pressure is 4.0 atm, all α particles and tritons can deposit their energy at the GIC, as shown in Fig. 3. Owing to the higher gas pressure, the range of α particles is very short and the cathode energy is almost the same as the anode energy for α events, which means that the α events show a line shape inclined at 45 degrees at the two–dimensional spectrum. The triton events with different emitting angles hold different energies, which makes the triton events exhibit a narrow distribution in the two–dimensional spectrum.
-
The present measurements aimed to investigate the 6Li(n, t)4He reaction in the neutron energy range of 3.3–5.3 MeV. Due to the light mass of the involved nuclei, the reaction exhibits strong kinematic effects, with both alpha particles and tritons predominantly emitted in the forward direction (0°–90°). No statistically significant events were detected at backward angles because of unfavorable kinematics, as described in Zhang [15]. A total of six measurement series were conducted with variations in both the working gas pressure and the use of a collimator, as indicated in Table 2. The first two series involved measurements with a collimator at 0.7 and 4.0 atm using the thick lithium sample (Sample #I). The remaining four series were performed without a collimator. At 1.0 atm, two separate measurements were carried out: one using Sample #II and the other using Sample #III. Data were collected at six neutron energy points ranging from 3.3 to 5.3 MeV. For each measurement, the following measurement procedure was followed: The GICsystem was first calibrated using alpha sources. After calibration, the lithium sample was exposed to the neutron beam for 2 h, during which the charged particles–alpha and tritons, were detected. Subsequently, a background measurement was conducted for 2 h using a pure tantalum backing. Next, the absolute neutron flux was measured by a 238U sample on the GIC cathode for 1 h. The uranium sample had the same geometry and positioning as the lithium samples (see Table 1). The signals from the fission fragments of the fission chamber were fed to the data acquisition system during the measurements of the foreground, background, and 238U(n, f) reaction. In all measurements, a 3He long counter was used as a neutron flux monitor. Data analysis revealed that the neutron flux results from both the long counter and fission chamber closely matched. Therefore, the data obtained from the fission chamber were used for further analysis. The cross sections of the 6Li(n, t)4He (i.e., 6Li(n, α)) reaction for the forward and backward directions were calculated using the formula detailed in prior work [32].
Measurement series Collimator Working gas pressure Sample 1 Yes 0.7 atm 6LiF #I, II 2 Yes 4.0 atm 6LiF #I, II 3 No 1.0 atm 6LiF #III, IV 4 No 1.0 atm 6LiF #III, IV 5 No 4.0 atm 6LiF #III, IV 6 No 4.0 atm 6LiF #III, IV Table 2. Measurement configurations.
Measurements were performed with and without the copper collimator. The collimator produced a confined quasi–parallel beam, improving signal–to–background ratios, especially at lower pressures (e.g., 0.7 atm). In contrast, measurements without the collimator maximized neutron flux at the sample and increased counting statistics, which was particularly beneficial for thin lithium samples and low–yield reactions. Results from both configurations were consistent within uncertainties, and the comparison was used to verify robustness and assess systematic errors.
-
Owing to the light masses of the participating nuclei, the reaction products–alpha particles and tritons–were predominantly emitted in the forward direction (0°–90°) as a result of reaction kinematics. No statistically significant events were observed at backward angles (90°–180°), which was consistent with prior studies [15]. Consequently, information about α–particles emitted in the backward direction was obtained from the measurements of forward–emitted tritons, which mirror the kinematics of the unobserved α–particles because of momentum conservation. At low gas pressure (see Fig. 4(a)), forward–emitted alpha particles formed two distinct groups in the two–dimensional spectrum: a) events corresponding solely to alpha particles, and b) combined events from both alpha particles and tritons. At high pressure (see Fig. 5(a)), forward–emitted tritons were clearly separated and analyzed. The number of these forward tritons corresponded to the number of alpha particles emitted in the backward direction. As shown in Fig. 4 (b) and Fig. 5 (b), the background events are very less in the area of the α and triton events, indicating the slight influence of the background events.
Figure 4. (color online) Measured two–dimensional anode–cathode spectrum with a collimator at a gas pressure of 0.7 atm for Sample #1 (thickness: 272.9 μg/cm2) (a) and Ta backing (b) at a neutron energy of 4.5 MeV.
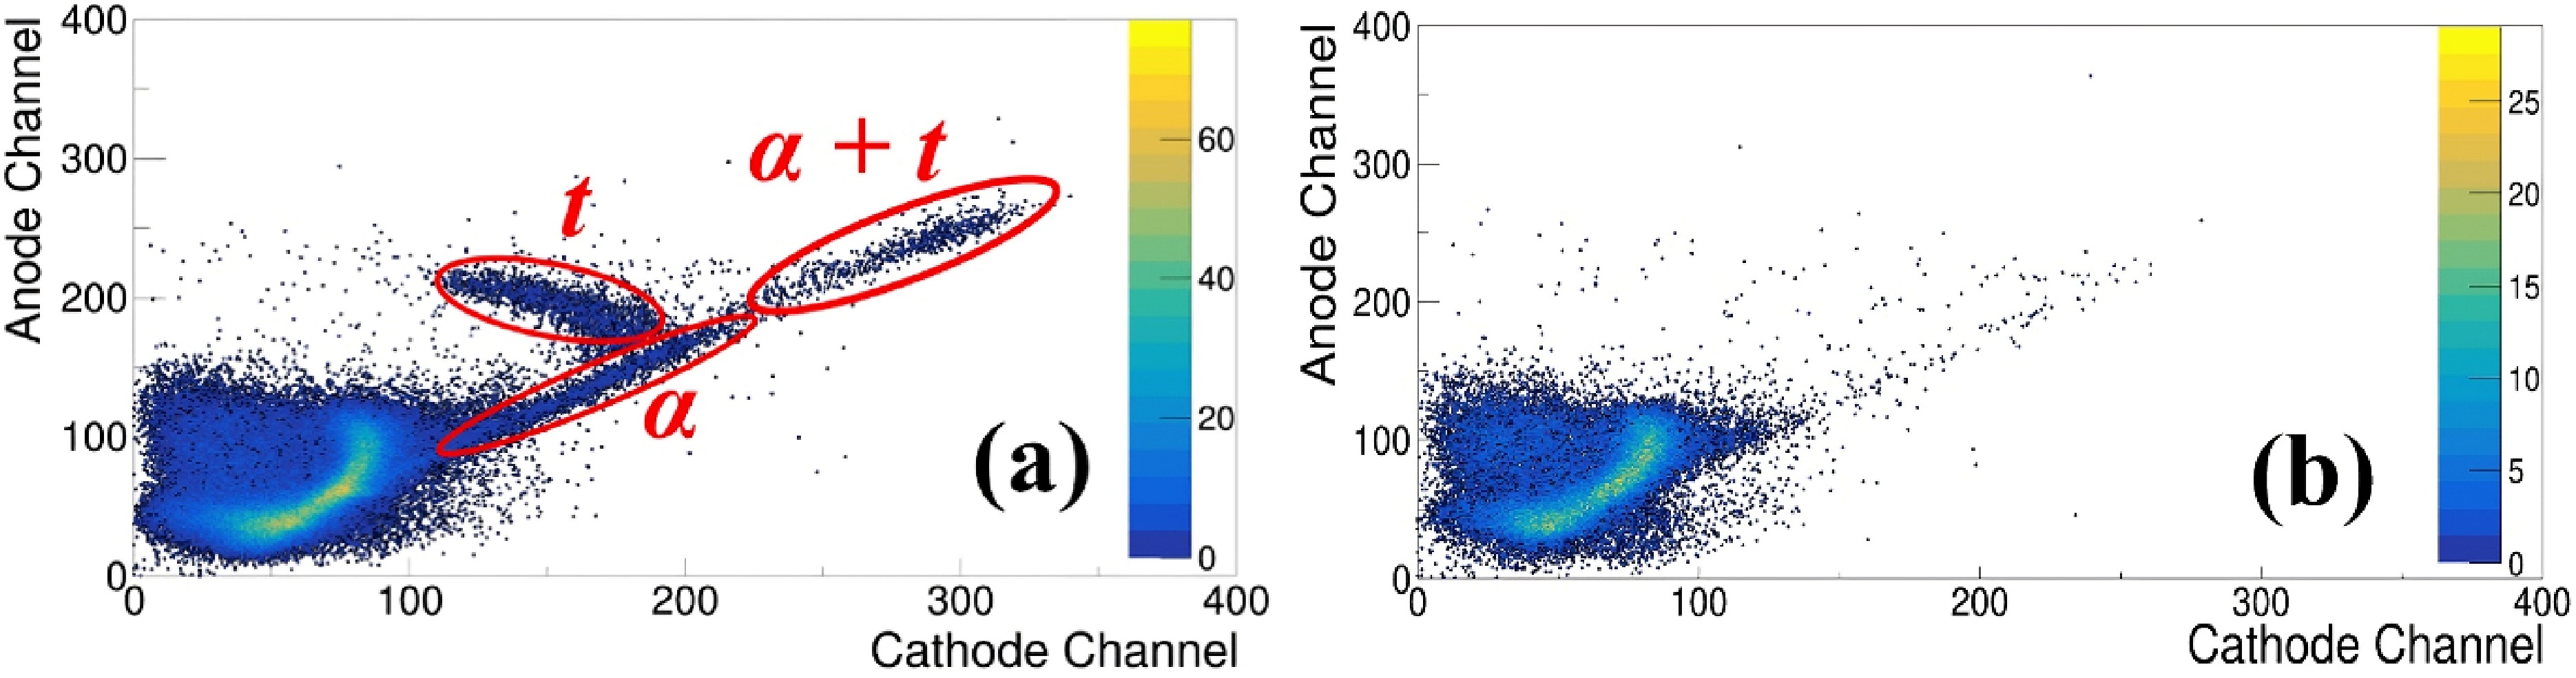
Figure 5. (color online) Measured two–dimensional anode–cathode spectrum with a collimator at a gas pressure of 4.0 atm for Sample #1 (thickness: 272.9 μg/cm2) (a) and Ta backing (b) at a neutron energy of 4.5 MeV.
Reaction products were identified using pulse–height and energy–loss correlation in the GIC. α–particles and tritons were separated based on their distinct energy deposition and ranges, with regions of interest defined in energy–energy plots. Coincident cathode–anode signals were required to suppress the background, and subtraction spectra with Ta backings were used for further background removal. Statistical uncertainties were derived from counting statistics, whereas systematic uncertainties were estimated from the regions of interest (ROIs) definition and subtraction procedures
For the accurate normalization of the reaction yield, the absolute neutron flux was measured using a 238U3O8 sample placed on the cathode of the GIC. The fission count spectrum at 4.5 MeV for the triton measurement is shown in Fig. 6, which illustrates the statistical quality of the neutron flux data used for cross section determination. Fission fragments were identified by their characteristic large pulse–height signals in the GIC, which is clearly distinguishable from other charged particles. A simulation of the expected fragment distribution has been included in Fig. 6 to aid interpretation, and the fission threshold was determined based on this simulation. Statistical uncertainties arise from event counts, whereas systematic uncertainties are dominated by detector calibration and neutron flux normalization.
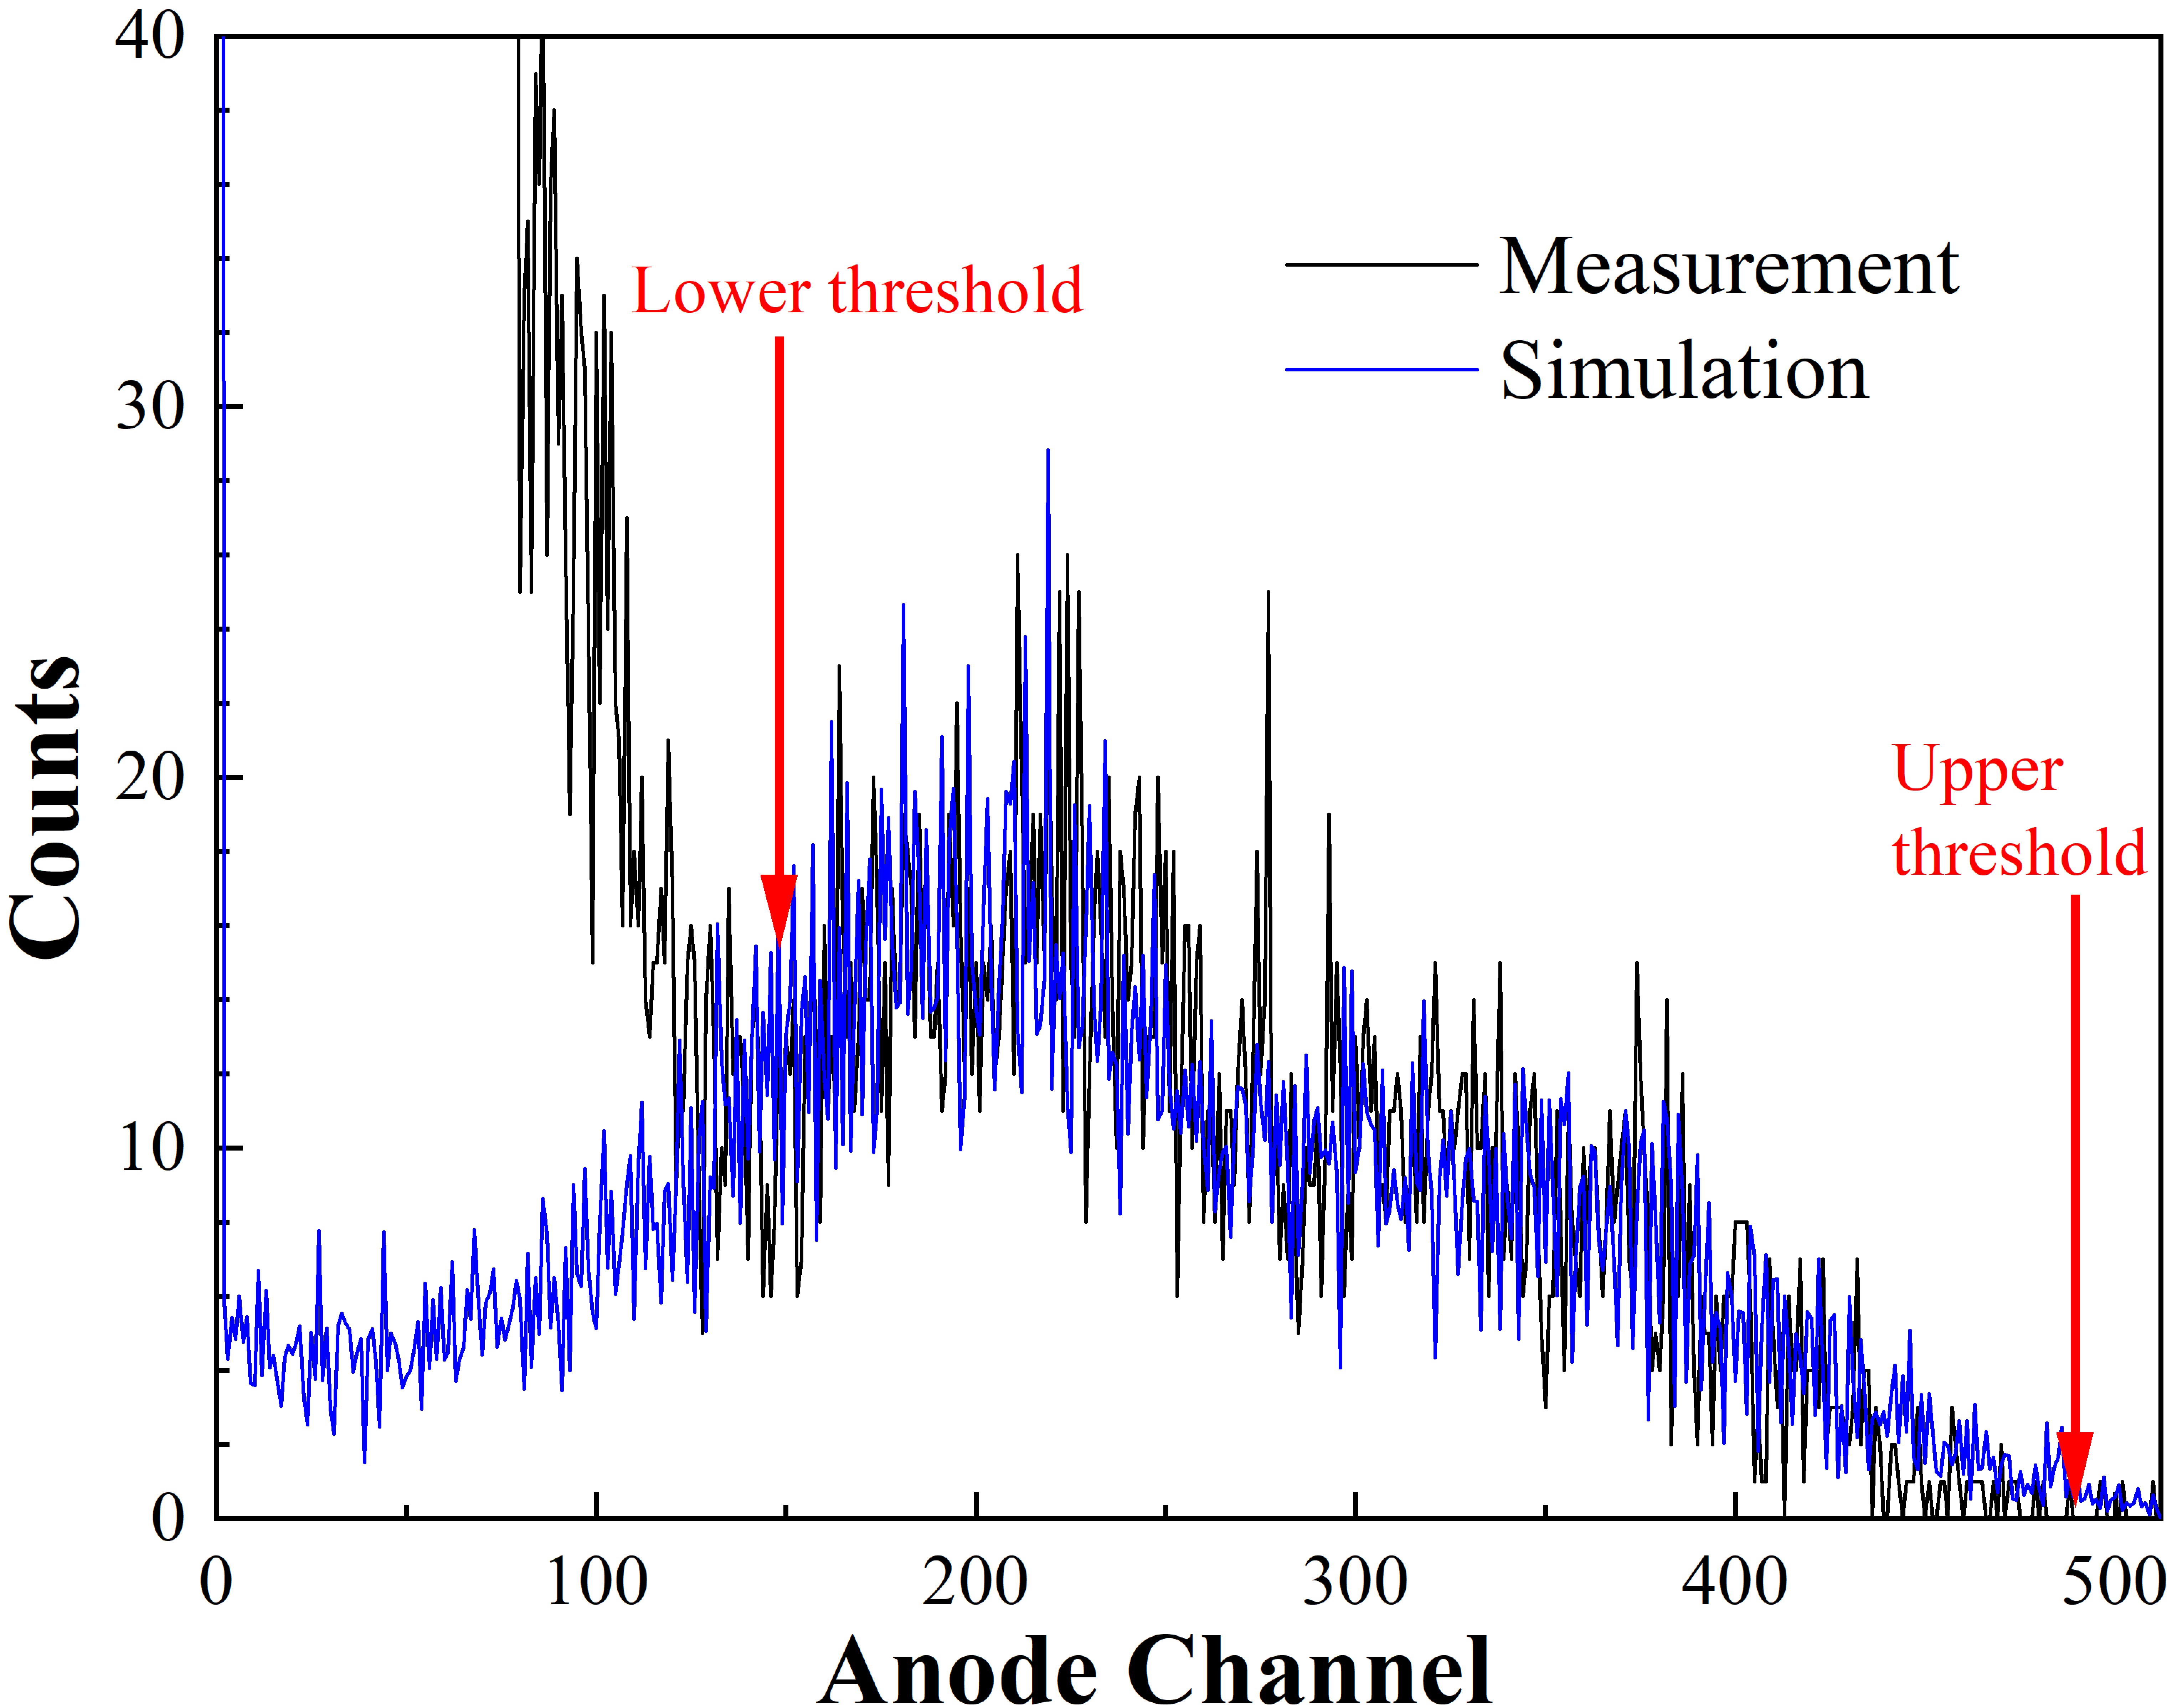
Figure 6. (color online) Fission count spectrum at a neutron energy of 4.5 MeV (working gas Kr+3%CO2, pressure 4.0 atm).
The cross section σ of the 6Li(n, t)4He reaction was obtained using
$ \sigma=K\cdot\sigma_{n,f}\frac{N_{\alpha}\mathit{\mathit{\mathit{\varepsilon}}}\mathrm{_{\mathit{f}}}}{N_f\mathit{\varepsilon}_{\alpha}}\frac{N_{\text{238}\mathrm{U}}}{N_{\text{6Li}}}, $

(1) where K = Fisf/Fisα; Fisα and Fisf represent fission–fragment counts of the fission chamber while the 6Li(n, t)4He and 238U(n, f) reactions were measured, respectively; σn,f represents the 238U(n, f) reactions cross section taken from ENDF/B–VIII; Nα and Nf respectively represent the numbers of pure alpha and fission events within the threshold value in the 6Li(n, t)4He and 238U(n, f) reactions; εf and εα represent the detection efficiencies of the fission and alpha events, respectively; and N238U and N6Li represent the atom numbers of the 238U and 6Li, respectively.
The uncertainty in the measured cross sections for the 6Li(n,t)4He reaction arises from multiple sources. The most significant contribution stems from the determination of the number of detected alpha particles, tritons, and combined alpha–triton events. This includes both statistical errors and uncertainties related to background subtraction, as well as event selection criteria such as energy thresholds and valid–event–area cuts.
Additional sources of uncertainty include the measurement of absolute neutron flux, reference cross section for the 238U(n, f) reaction, and atomic content of both 6Li and 238U samples. The estimated contributions from each source are summarized in Table 3. Considering all all factors, the total uncertainty in the measured cross sections is estimated to lie within the range of 7.5% to 9.8%.
Source of Uncertainty Relative Error (%) 238U(n, f) reference cross section 0.7 Determination of number of fission events 3.0 Alpha/triton event statistics 3.0–5.0 Background subtraction and neutron flux normalization 3.0 Atom number of 238U in the 238U3O8 sample 2.0 Atom number of 6Li in the 6LiF sample 2.0 Total combined uncertainty 7.5–9.8 Table 3. Principal sources of uncertainty and their estimated magnitudes.
Therefore, the total yield of charged particles from the 6Li(n, t)4He reaction was obtained as the sum of the three identified event groups.
The obtained cross section results are summarized in Table 4, where the experimental data are grouped by particle type and measurement series based on the sample used. The averaged measurement values are illustrated in Fig. 7.
Energy/MeV Collimator/thickness, μg/cm2 Cross section/mb α+(α+t) (t) Total Avg. value (total cross section) 3.3 Yes/6LiF(272.9) 62.2±6 43.3±5 105.5±8 111.9±9 Yes/6LiF(272.9) 79.1±8 43.3±5 122.4±9 No/6LiF(105.3) 54.3 ±5 45.9±5 100.2±7 No/ 6LiF(46.0) 73.6 ±8 45.9±5 119.5±9 3.9 Yes/6LiF(272.9) 58.9±7 42.1±5 101.0±9 101.5±10 Yes/6LiF(272.9) 72.0±7 24.2±4 96.2±8 No/6LiF(105.3) 56.9±10 42.4±5 99.3±10 No/ 6LiF(46.0) 56.3±10 53.3±6 109.6±10 4.3 Yes/6LiF(272.9) 56.8±5 33.7±4 90.5±6 106.5±9 Yes/6LiF(272.9) 69.7±7 56.7±6 126.4±9 No/6LiF(105.3) 55.0±6 40.9±4 95.9±7 No/ 6LiF(46.0) 86.2±9 22.8±3 113.0±9 4.5 Yes/6LiF(272.9) 52.1±5 36.7±4 88.8±6 96.2±8 Yes/6LiF(272.9) 61.0±6 40.4±4 101.4±7 No/6LiF(105.3) 48.0±5 38.0±4 86.0±6 No/ 6LiF(46.0) 61.8±6 46.6±5 108.4±8 4.8 No/6LiF(105.3) 42.3±4 30.7 ±3 73.0±5 79.3±6 No/ 6LiF(46.0) 46.6±5 38.9±4 85.5±6 5.1 No/6LiF(105.3) 40.4±4 21.5±2 61.9±4 69.2±6 No/ 6LiF(46.0) 49.2±5 27.2±3 76.4±6 Table 4. Measured (n, t) cross sections for the 6Li(n, t)4He reaction.
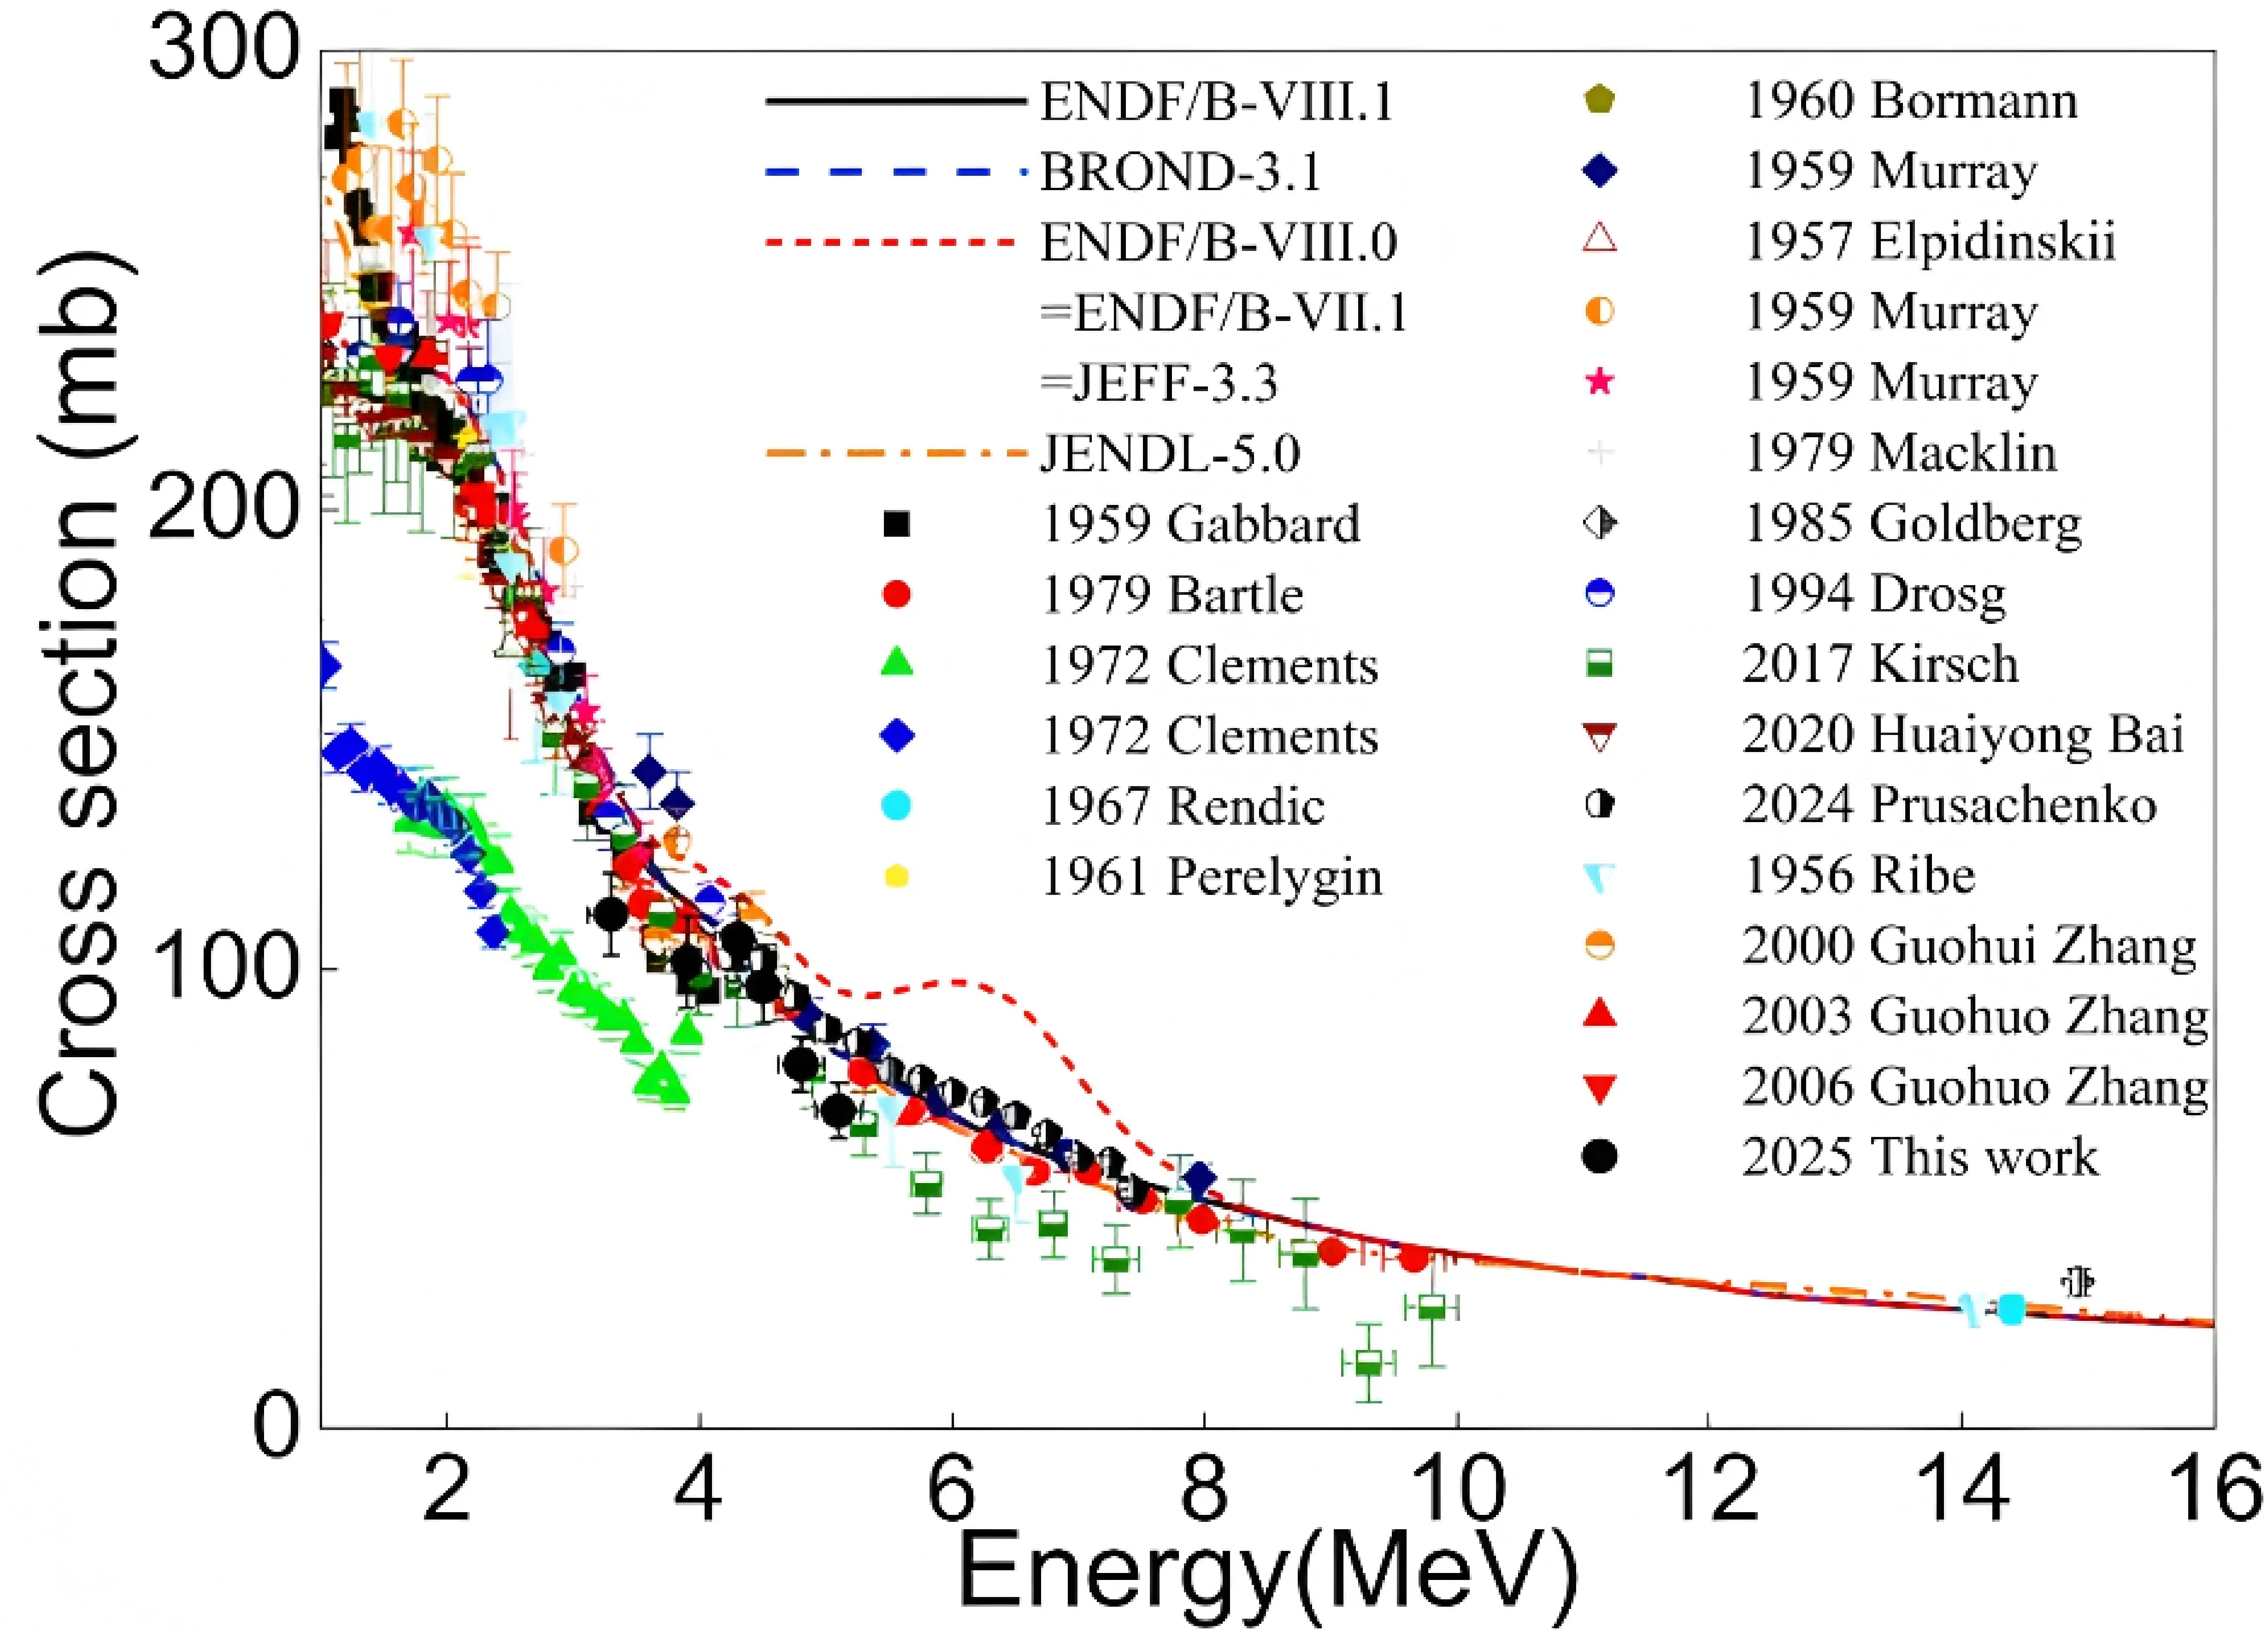
Figure 7. (color online) Measured cross sections of the 6Li(n, t)4He reaction compared with previous experimental data and evaluated nuclear data libraries.
In our study, results obtained with and without the collimator were consistent within the combined uncertainties. However, measurements with the collimator exhibited improved signal–to–background ratios, particularly at lower gas pressures (e.g., 0.7 atm), where the resolution is more sensitive to stray interactions. These differences support the inclusion of both configurations to verify data robustness and assist in uncertainty estimation.
-
Owing to the light masses of the participating nuclei, the reaction products–alpha particles and tritons–were predominantly emitted in the forward direction (0°–90°) as a result of reaction kinematics. No statistically significant events were observed at backward angles (90°–180°), which was consistent with prior studies [15]. Consequently, information about α–particles emitted in the backward direction was obtained from the measurements of forward–emitted tritons, which mirror the kinematics of the unobserved α–particles because of momentum conservation. At low gas pressure (see Fig. 4(a)), forward–emitted alpha particles formed two distinct groups in the two–dimensional spectrum: a) events corresponding solely to alpha particles, and b) combined events from both alpha particles and tritons. At high pressure (see Fig. 5(a)), forward–emitted tritons were clearly separated and analyzed. The number of these forward tritons corresponded to the number of alpha particles emitted in the backward direction. As shown in Fig. 4 (b) and Fig. 5 (b), the background events are very less in the area of the α and triton events, indicating the slight influence of the background events.
Figure 4. (color online) Measured two–dimensional anode–cathode spectrum with a collimator at a gas pressure of 0.7 atm for Sample #1 (thickness: 272.9 μg/cm2) (a) and Ta backing (b) at a neutron energy of 4.5 MeV.
Figure 5. (color online) Measured two–dimensional anode–cathode spectrum with a collimator at a gas pressure of 4.0 atm for Sample #1 (thickness: 272.9 μg/cm2) (a) and Ta backing (b) at a neutron energy of 4.5 MeV.
Reaction products were identified using pulse–height and energy–loss correlation in the GIC. α–particles and tritons were separated based on their distinct energy deposition and ranges, with regions of interest defined in energy–energy plots. Coincident cathode–anode signals were required to suppress the background, and subtraction spectra with Ta backings were used for further background removal. Statistical uncertainties were derived from counting statistics, whereas systematic uncertainties were estimated from the regions of interest (ROIs) definition and subtraction procedures
For the accurate normalization of the reaction yield, the absolute neutron flux was measured using a 238U3O8 sample placed on the cathode of the GIC. The fission count spectrum at 4.5 MeV for the triton measurement is shown in Fig. 6, which illustrates the statistical quality of the neutron flux data used for cross section determination. Fission fragments were identified by their characteristic large pulse–height signals in the GIC, which is clearly distinguishable from other charged particles. A simulation of the expected fragment distribution has been included in Fig. 6 to aid interpretation, and the fission threshold was determined based on this simulation. Statistical uncertainties arise from event counts, whereas systematic uncertainties are dominated by detector calibration and neutron flux normalization.
Figure 6. (color online) Fission count spectrum at a neutron energy of 4.5 MeV (working gas Kr+3%CO2, pressure 4.0 atm).
The cross section σ of the 6Li(n, t)4He reaction was obtained using
$ \sigma=K\cdot\sigma_{n,f}\frac{N_{\alpha}\mathit{\mathit{\mathit{\varepsilon}}}\mathrm{_{\mathit{f}}}}{N_f\mathit{\varepsilon}_{\alpha}}\frac{N_{\text{238}\mathrm{U}}}{N_{\text{6Li}}}, $
(1) where K = Fisf/Fisα; Fisα and Fisf represent fission–fragment counts of the fission chamber while the 6Li(n, t)4He and 238U(n, f) reactions were measured, respectively; σn,f represents the 238U(n, f) reactions cross section taken from ENDF/B–VIII; Nα and Nf respectively represent the numbers of pure alpha and fission events within the threshold value in the 6Li(n, t)4He and 238U(n, f) reactions; εf and εα represent the detection efficiencies of the fission and alpha events, respectively; and N238U and N6Li represent the atom numbers of the 238U and 6Li, respectively.
The uncertainty in the measured cross sections for the 6Li(n,t)4He reaction arises from multiple sources. The most significant contribution stems from the determination of the number of detected alpha particles, tritons, and combined alpha–triton events. This includes both statistical errors and uncertainties related to background subtraction, as well as event selection criteria such as energy thresholds and valid–event–area cuts.
Additional sources of uncertainty include the measurement of absolute neutron flux, reference cross section for the 238U(n, f) reaction, and atomic content of both 6Li and 238U samples. The estimated contributions from each source are summarized in Table 3. Considering all all factors, the total uncertainty in the measured cross sections is estimated to lie within the range of 7.5% to 9.8%.
Source of Uncertainty Relative Error (%) 238U(n, f) reference cross section 0.7 Determination of number of fission events 3.0 Alpha/triton event statistics 3.0–5.0 Background subtraction and neutron flux normalization 3.0 Atom number of 238U in the 238U3O8 sample 2.0 Atom number of 6Li in the 6LiF sample 2.0 Total combined uncertainty 7.5–9.8 Table 3. Principal sources of uncertainty and their estimated magnitudes.
Therefore, the total yield of charged particles from the 6Li(n, t)4He reaction was obtained as the sum of the three identified event groups.
The obtained cross section results are summarized in Table 4, where the experimental data are grouped by particle type and measurement series based on the sample used. The averaged measurement values are illustrated in Fig. 7.
Energy/MeV Collimator/thickness, μg/cm2 Cross section/mb α+(α+t) (t) Total Avg. value (total cross section) 3.3 Yes/6LiF(272.9) 62.2±6 43.3±5 105.5±8 111.9±9 Yes/6LiF(272.9) 79.1±8 43.3±5 122.4±9 No/6LiF(105.3) 54.3 ±5 45.9±5 100.2±7 No/ 6LiF(46.0) 73.6 ±8 45.9±5 119.5±9 3.9 Yes/6LiF(272.9) 58.9±7 42.1±5 101.0±9 101.5±10 Yes/6LiF(272.9) 72.0±7 24.2±4 96.2±8 No/6LiF(105.3) 56.9±10 42.4±5 99.3±10 No/ 6LiF(46.0) 56.3±10 53.3±6 109.6±10 4.3 Yes/6LiF(272.9) 56.8±5 33.7±4 90.5±6 106.5±9 Yes/6LiF(272.9) 69.7±7 56.7±6 126.4±9 No/6LiF(105.3) 55.0±6 40.9±4 95.9±7 No/ 6LiF(46.0) 86.2±9 22.8±3 113.0±9 4.5 Yes/6LiF(272.9) 52.1±5 36.7±4 88.8±6 96.2±8 Yes/6LiF(272.9) 61.0±6 40.4±4 101.4±7 No/6LiF(105.3) 48.0±5 38.0±4 86.0±6 No/ 6LiF(46.0) 61.8±6 46.6±5 108.4±8 4.8 No/6LiF(105.3) 42.3±4 30.7 ±3 73.0±5 79.3±6 No/ 6LiF(46.0) 46.6±5 38.9±4 85.5±6 5.1 No/6LiF(105.3) 40.4±4 21.5±2 61.9±4 69.2±6 No/ 6LiF(46.0) 49.2±5 27.2±3 76.4±6 Table 4. Measured (n, t) cross sections for the 6Li(n, t)4He reaction.
Figure 7. (color online) Measured cross sections of the 6Li(n, t)4He reaction compared with previous experimental data and evaluated nuclear data libraries.
In our study, results obtained with and without the collimator were consistent within the combined uncertainties. However, measurements with the collimator exhibited improved signal–to–background ratios, particularly at lower gas pressures (e.g., 0.7 atm), where the resolution is more sensitive to stray interactions. These differences support the inclusion of both configurations to verify data robustness and assist in uncertainty estimation.
-
The cross sections for the 6Li(n, t)4He reaction at neutron energies of 3.3, 3.9, 4.3, 4.5, 4.8, and 5.1 MeV were measured at the EG–5 accelerator. The results obtained in this work were compared with available experimental data from the EXFOR database and evaluated nuclear data libraries.
Our results are consistent with recent measurements, such as those by Kirsch [19] and Prusachenko [20], and they follow the expected decreasing trend in cross section with increasing neutron energy. In comparison with major nuclear data libraries–JEFF–3.3, ENDF/B–VIII.0, ENDF/B–VIII.1, JENDL–5.0, and BROND–3.1–our results showed that ENDF/B–VIII.1 and JENDL–5.0 exhibited the closest agreement across the 3.3–5.1 MeV range, particularly around 4.5 MeV. In contrast, JEFF–3.3 and ENDF/B–VII.1/VIII.0 systematically overestimated the cross section by approximately 15%–30% in this region. BROND–3.1 showed better agreement with our data above 4.3 MeV, indicating improved accuracy in this energy range.
The cross–section values presented here provide valuable new experimental input for the refinement of evaluated nuclear data files. These results will support advancements in applications such as neutron detection, reactor design, fusion diagnostics, and tritium production.
Cross section measurement of the 6Li(n,t)4He reaction in the MeV neutron energy range
- Received Date: 2025-06-20
- Available Online: 2025-12-15
Abstract: Cross sections of the 6Li(n, t)4He reaction were measured in the fast neutron energy range from 3.3 to 5.3 MeV using a gridded ionization chamber (GIC) and well–calibrated experimental setup at the EG–5 Van de Graaff accelerator of the Frank Laboratory of Neutron Physics, Joint Institute for Nuclear Research (FLNP, JINR). Lithium fluoride (6LiF) samples with varying thicknesses and krypton–CO2 gas mixtures with different pressures were used to optimize the detection of both alpha particles and tritons. Neutron fluxes were monitored using two high–purity (99.999%) 238U3O8 samples placed inside the GIC, complemented by an externally calibrated 3He long counter. The measured 6Li(n, t)4He cross–section data were compared with existing results of measurements and evaluations from EXFOR and ENDF nuclear data libraries, and the results showed a good agreement in the measured neutron energy range. These new measurements provide reliable cross–section data that contribute to the refinement of evaluated nuclear data files and support applications in nuclear physics, tritium production, and reactor design.


 DownLoad: