


 Abstract
 HTML
HTML Reference
 Related
 PDF
PDF


-
A neutron star (NS) serves as a natural laboratory for studying extreme conditions such as high densities, strong gravitational fields, and strong electromagnetic fields [1−4]. Since Baade and Zwicky first devised the concept of NSs in 1934 [5], experimental observations and theoretical studies of NSs have developed rapidly over the past century, connecting nuclear physics, particle physics, and astrophysics. Recently, LIGO and Virgo first detected gravitational waves from the binary NS merger event GW170817 [6, 7] in 2017 and GW190814 [8] in 2019, providing an important basis for better understanding the properties of NSs, opening the era of multi-messenger research.
As the densest form of matter in the universe, NSs have a very large density span from the core to the atmosphere, involving different forms of physics and related equations of state (EOSs) [9]. It is common to assume that thermodynamic and β equilibria have been reached in NSs at
$ T = 0 $ , which means a NS has had sufficient time to cool down and equilibrate since the supernova explosion. Another important assumption is the absence of accretion [10]. The outermost layer is the atmosphere, which is composed of a gaseous plasma and is very thin, usually between a few millimeters and a few centimeters. However, it has an important influence on the thermal radiation spectrum of a NS. Beneath it lies the outer crust, where electronic degeneracy pressure plays the main supporting role. The surface of the outer crust ($ \rho \sim 10\; {\text{kg cm}} ^{-3} \sim 10^{-12}\;\text{fm}^{-3} $ ) consists of$ ^{56} {\rm{Fe}}$ atoms. With increasing density, the free electrons will be captured by nuclei to stay energetically favorable. Therefore, the atoms gradually become neutron-rich until the neutron drip density ($ \rho \sim 4\times10^{11}\; {\text{g cm}} ^{-3} \sim 2.5\times10^{-4}\;\text{fm}^{-3} $ ) is reached, which is the boundary between the outer and inner crusts [11, 12].In the inner crust of a NS, neutrons begin to drip out of the nuclei and neutron degeneracy pressure comes into play. At this point, the neutron-rich nuclei may no longer be spherical but might appear in bubbles, rods, sheets, tubes, and other shapes [13, 14]. The inner and outer crusts are only a few hundred meters thick. As the density continues to increase, the outer core of the NS, which is approximately a few kilometers thick, becomes a fluid of neutrons, protons, and electrons in β equilibrium. The composition of the inner-core region of a NS, where the density and pressure are extremely high, is uncertain and may involve hyperons, mesons, or quark matter [4, 15−18]. It may also be in a superfluid and superconducting state [4, 19−22].
In this study, we focus on the outer crust of NSs, where the nuclei and electron Fermi gas tend to crystallize into a body-centered-cubic lattice to lower the total energy. Therefore, the masses of neutron-rich nuclei are an important input to calculate the crustal composition and EOS. However, nuclear physics experiments cannot determine the properties of very neutron-rich nuclei close to the neutron drip line, which appear in the outer crust with increasing density. Therefore, theoretical methods need to be devised to extrapolate to very neutron-rich matter.
In 1971, Baym, Pethick, and Sutherland [11] developed the BPS model to determine the composition and EOS of the outer crust by using the 1966 nuclear mass table [23]. After that, a large number of studies followed the BPS model to calculate the sequence of nuclei by using different nuclear models. For example, the authors of Ref. [24] studied the outer-crust composition using the experimental nuclear data mass table from 1993 [25] and theoretical nuclear data from the liquid-drop models [26, 27]. More recently [28], the composition and neutron drip point were studied using the mass table updated in 2003 [29] and various theoretical nuclear data, such as those from the Skyrme models BSk2 and BSk8 [30−35], relativistic model TMA [36], and finite-range drop model (FRDM) [27, 37]. In Ref. [10], the properties of the outer crust were calculated based on the Hartree-Fock-Bogoliubov (HFB) method using four interactions: three Skyrme forces HFB-19,20,21 and the Gogny force D1M [38]. This study was later extended to a unified EOS for an entire NS using Skyrme forces HFB-22,24,25,26 [39, 40]. Similarly, in Ref. [41], the AME2012 [42] table was used in conjunction with deformed HFB calculations performed with the Barcelona-Catania-Paris-Madrid (BCPM) energy-density functional. In Ref. [43], the AME2016 [44] and theoretical values were used within the quark-meson coupling (QMC) model.
According to these previous studies, the main uncertainty lies in the theoretical computation of very neutron-rich nuclei. The sequence and onset densities of nuclei in the outer crust, as well as the neutron drip point, are all sensitive to nuclear binding energies, although the final crustal EOS is not. More accurate experimental data on neutron-rich nuclei are expected to improve the precision of theoretical models.
As a quantum many-body system, explaining and predicting the properties of nuclear matter based on nucleon-nucleon interactions has long been a challenging problem. Among the various approaches proposed to address this complexity [4], the Brueckner-Hartree-Fock (BHF) method stands out for its microscopic foundation. It is based on realistic nucleon-nucleon interactions and explicitly incorporates three-body forces (TBFs), providing a microscopically consistent description of nuclear forces. This contrasts with Skyrme-Hartree-Fock (SHF) or relativistic mean-field (RMF) models, which rely on phenomenological parameterizations of effective interactions fitted to properties of stable nuclei. BHF self-consistently accounts for short-range correlations, medium polarization, and isospin-dependent effects critical for neutron-rich systems, ensuring robust extrapolations toward the neutron drip line.
However, it should be noted that modeling the NS crust requires accounting for several finite-size effects beyond the bulk calculation, which effectively compensates for the differences between nuclear-matter calculations to some extent, as will be shown.
In this study, we use state-of-the-art experimental binding energies from AME2020 [45]; beyond that, we extend the nuclear mass table by using a liquid-drop model based on a microscopic BHF energy-density functional. We obtain the composition and EOS of the outer crust and determine the neutron drip point. Solving the Tolman-Oppenheimer-Volkov (TOV) equations [46, 47], we obtain the mass, thickness, and other properties of the outer crust. Other theoretical models for the outer crust are compared. We use natural units:
$ \hbar = c = G = 1 $ . -
We briefly review the BHF approach [41, 48, 49], which is based on the Bethe-Goldstone equation for the in-medium scattering matrix G,
$ G[E;\rho ] = V + \sum\limits_{k_a,k_b>k_F} V \frac{\left| k_a k_b \right\rangle Q \left\langle k_a k_b \right|} {E - e(k_a) - e(k_b) + \mathrm{i}\varepsilon} G[E;\rho] \:, $

(1) where Q is the Pauli operator, E is the starting energy,
$ k_F $ is the Fermi momentum, and V is the nucleon-nucleon interaction, which is the bare two-nucleon potential (Argonne$ V_{18} $ [50] in our case) plus an averaged TBF, reduced to an effective, density-dependent two-body force [51, 52]. The single-particle energy is given by$ e(k) = \frac{k^2}{2m} + U(k;\rho) \:, $

(2) where the continuous-choice single-particle potential is determined by
$ U(k;\rho) = \sum\limits_{k'\le k_F} {\left\langle kk' \right|} G[e(k)+e(k');\rho] \left| kk' \right\rangle_a \:, $

(3) where
$ {\left|kk'\right\rangle_a} \equiv \left|kk'\right\rangle - \left|k'k\right\rangle $ . Eqs. (1)−(3) are coupled to each other. When they are solved self-consistently and reach convergence, the BHF energy per nucleon is obtained as$ E = \frac35 \frac{k_F^2}{2m} + \frac{1}{2\rho} \mathop{\text{Re}}\sum\limits_{k,k'\le k_F} \left\langle kk' \right| G[e(k)+e(k');\rho]\left| kk' \right\rangle_a \:. $

(4) In Fig. 1, we show the energies per nucleon for symmetric nuclear matter (SNM) and pure neutron matter (PNM) obtained in this manner as a function of the total baryon number density ρ. The BHF EOS reproduces the saturation properties of nuclear matter, with a saturation density
$ \rho_0\approx0.18\;\text{fm}^{-3} $ , a binding energy per particle$ E_0\approx-14.6\;\text{MeV} $ for SNM, an incompressibility$ K_0\equiv9\rho_0^2\mathrm{d}^2E_{\text{SNM}}/\mathrm{d}\rho^2(\rho_0)\approx207\; \text{MeV} $ , and a symmetry energy$ E_\text{sym}\approx E_\text{PNM}(\rho_0)-E_\text{SNM}(\rho_0) \approx 33\;\text{MeV} $ . It also satisfies all current observational constraints for NSs, such as maximum mass, radii, and tidal deformability; see Ref. [53] for further details.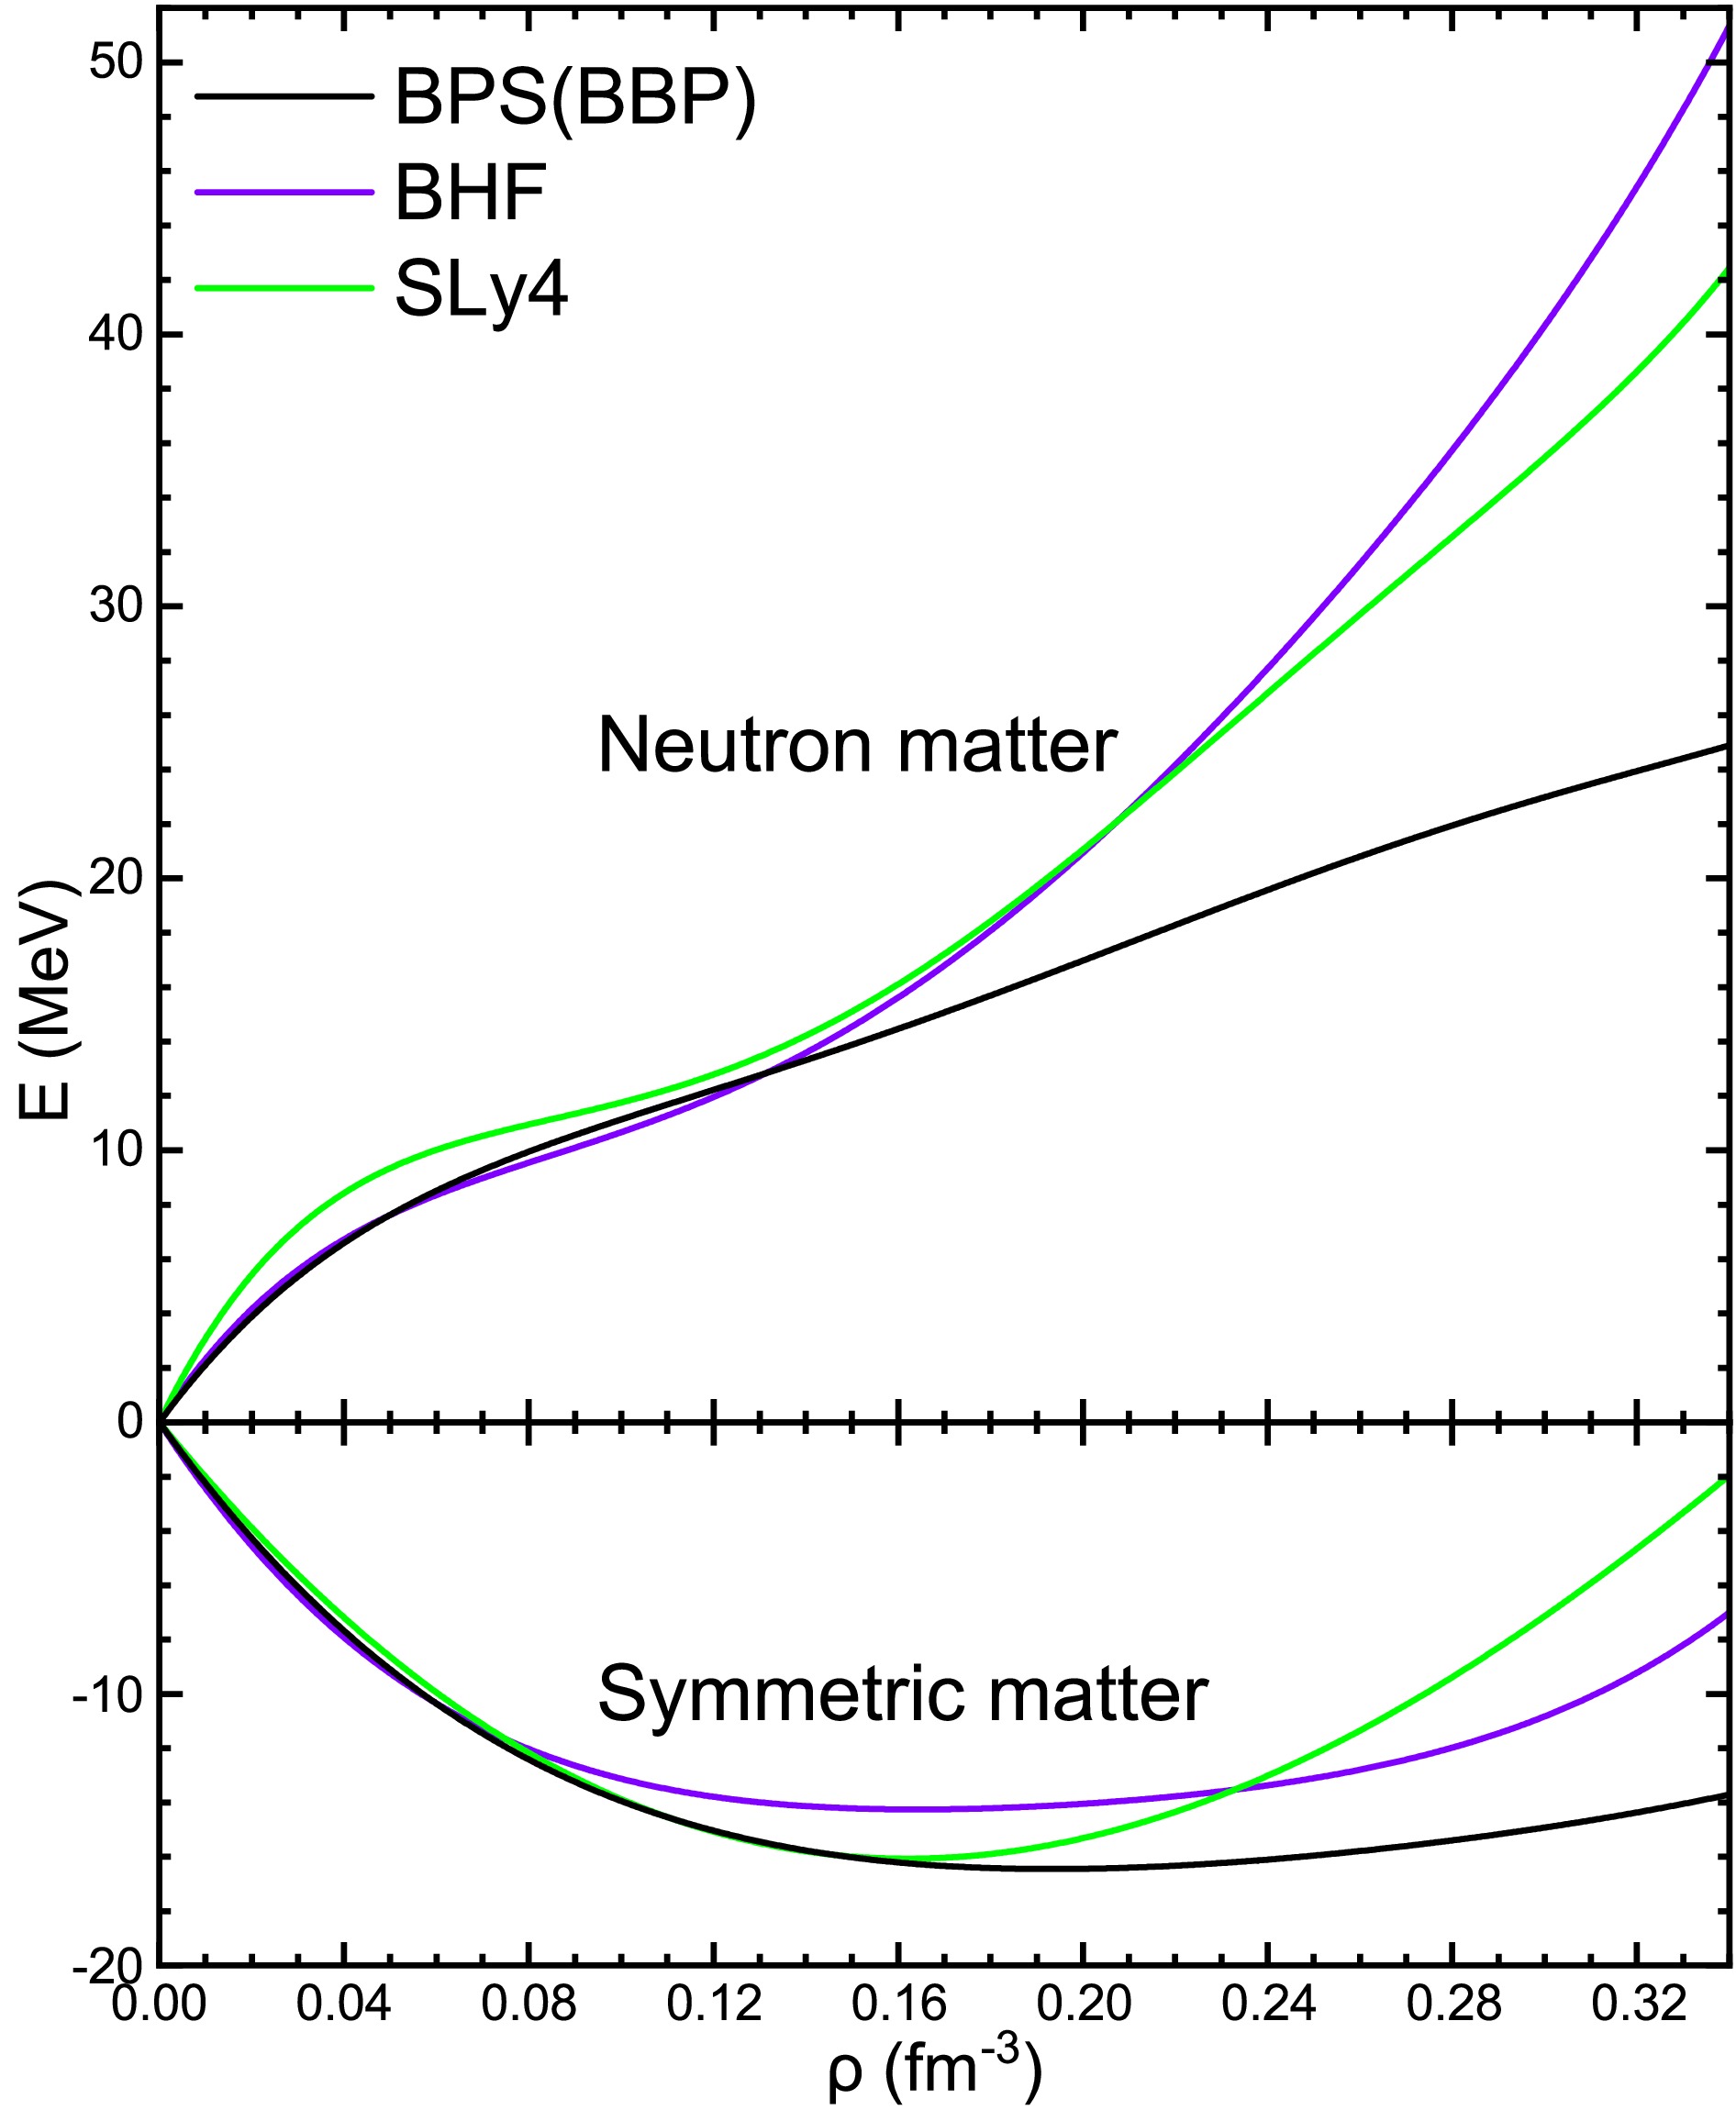
Figure 1. (color online) Energy per nucleon for symmetric nuclear matter and pure neutron matter of the BPS, BHF, and SLy4 models versus baryon number density.
For comparison, the plot also includes the results for the BBP parameterized EOS [54], used in BPS [11], and the SLy4 SHF EOS [55, 56], with saturation parameters of
$ \rho_0\approx0.20\;\text{fm}^{-3} $ ,$ E_0\approx-16.5\;\text{MeV} $ ,$ K_0\approx143\;\text{MeV} $ , and$ E_\text{sym}\approx33\;\text{MeV} $ (BBP) and$ \rho_0\approx0.16\;\text{fm}^{-3} $ ,$ E_0\approx-16.0\; $ MeV,$ K_0\approx230\;\text{MeV} $ , and$ E_\text{sym}\approx32\;\text{MeV} $ (SLy4), respectively. It is evident that the EOSs are mainly distinguished by their compressibilities, even unrealistically low for the BBP EOS. Nevertheless, it turns out that the predicted crustal properties of the three models are very similar owing to compensation by the various finite-size effects introduced later.Furthermore, the energy per nucleon at any asymmetry parameter
$ \beta = (\rho_n-\rho_p)/(\rho_n+\rho_p) $ is obtained through the well-tested parabolic relation [49, 52, 57−60],$ E(\rho,x) = E(\rho,0.5) + (1-2x)^2 E_\text{sym}(\rho) \:, $

(5) where
$ x = \rho_p/\rho $ is the proton fraction, and$ E_\text{sym}(\rho) = E(\rho,0)-E(\rho,0.5) $ , the latter two terms being the energies of PNM and SNM, respectively. Therefore, only parameterizations of the energy per nucleon for SNM and PNM are required.Next, we use a simple liquid-drop model [61−64] to link the BHF energy density
$ \varepsilon_\text{BHF} = \rho E(\rho,x) $ with the energy of a finite nucleus,$ \begin{aligned}[b] B(Z,N) = \;& B_\text{Vol.} + B_\text{Surf.} + B_\text{Coul.} \\ =\;& \int \mathrm{d}^3r\; \varepsilon_\text{BHF}\left[\rho(r),\beta(r)\right] + f_0\int \mathrm{d}^3r\; \left|\nabla\rho(r)\right|^2 \\&+ \frac{(4\pi e)^2}{4\pi\varepsilon_0} \int_0^\infty \mathrm{d}rr \int_0^r \mathrm{d}r' {r'}^2 \rho_p(r)\rho_p(r') \:, \end{aligned} $

(6) composed of the volume-, surface-, and Coulomb-energy terms. For simplicity, we ignore the pairing energy and other refinements. The surface-energy parameter
$ f_0 $ will be used as a fit parameter for the experimental binding energies.The proton and neutron densities are expressed as standard two-parameter Fermi distribution,
$ \rho_i(r) = \frac{a_i}{1 + \mathrm{e}^{(r-R_i)/d_i}} \:, $

(7) with radius
$ R_i $ , diffuseness$ d_i $ , and normalization$ a_i $ fixed by$ \int \mathrm{d}^3r\; \rho_{n,p}(r) = (N,Z) \:. $

(8) For each nucleus, the four parameters
$ R_i $ and$ d_i $ are determined by minimizing the total energy given by Eq. (6). -
We follow the BPS model [11] to describe the composition and EOS of the outer crust of a NS. Please, refer to [10, 28, 41, 43, 65] for further details. Considering a nonaccreting cold NS, it is convenient and reasonable to assume that thermodynamic and chemical equilibrium have been reached in the outer crust, and that the nuclei and electron gas crystallize into a body-centered-cubic lattice [66, 67]. Then, the total energy per nucleus can be expressed as
$ E(Z,N,\rho) = E_N + E_e + E_L \:, $

(9) in terms of nuclear, electron, and lattice energies. The equilibrium nucleus is determined by the competition between surface energy (which tends to favor large-A nuclei) and Coulomb energy (which tends to favor small-A nuclei). The latter consists of positive nuclear Coulomb self-energy and negative lattice energy. To find the equilibrium nucleus,
$ E(Z,N,\rho) $ is minimized by varying Z and N at fixed ρ.The nuclear contribution, corresponding to the total mass of the nucleus, is given by
$ E_N(Z,N) = Z m_p + N m_n + B(Z,N) \:, $

(10) where
$ m_{n/p} $ is the neutron or proton mass, and$ B(Z,N) $ is the binding energy per nucleus given by Eq. (6).The electron contribution, given by
$ E_e = \varepsilon_e V_\text{WS} = \varepsilon_e A/\rho $ , is that of a relativistic Fermi gas,$ \varepsilon_e = \frac{m_e^4}{8\pi^2} \Big[ x\sqrt{1+x^2}(2x^2+1) - \mathop{\text{arsinh}}{(x)} \Big] \:, $

(11) where
$ x = k_e/m_e $ is the dimensionless kinetic parameter with electron mass$ m_e $ and Fermi momentum$ k_e = (3\pi^2 n_e)^{1/3} $ , related to the electron number density$ n_e = (Z/A)\rho $ .The lattice energy is [68]
$ E_L = -1.820 \frac{(Ze)^2}{a} = -C_L \frac{Z^2}{A^{1/3}} k_B \:, $

(12) where a is the lattice constant,
$ C_L = 3.407 \times10^{-3} $ , and$ k_B \equiv (3{\pi^2}{\rho})^{1/3} $ .The pressure obtained from the equilibrium energy is
$\begin{aligned}[b] p = - \frac{\partial E}{\partial V}\bigg|_{Z,N} = \frac{\partial(\varepsilon/\rho)}{\partial \rho} \rho^2 = \frac{\partial\varepsilon}{\partial\rho} \rho - \varepsilon = p_e + \frac{\rho}{3A} E_L \:, \end{aligned} $

(13) where
$ p_e = \mu_e n_e - \varepsilon_e = \frac{m_e^4}{8\pi^2} \Big[ x\sqrt{1+x^2}(2x^2 /3-1) + \mathop{\text{arsinh}}{(x)} \Big] \: $

(14) and
$ \mu_e = \sqrt{k_e^2 + m_e^2} $ .The baryon (neutron) chemical potential is
$\begin{aligned}[b] \mu(Z,N,\rho) =\;& \frac{\partial\varepsilon}{\partial\rho} = \frac{E(Z,N,\rho)}{A} + \frac{p}{\rho} = \frac{\varepsilon+p}{\rho} \\ =\;& \big[ E_N(Z,N) + Z\mu_e + \frac43 E_L \big] / A \:. \end{aligned}$

(15) Given that the pressure p and chemical potentials
$ \mu,\mu_e $ change continuously with increasing depth of the crust, there is a density discontinuity at each change of the equilibrium nucleus,$ \rho' - \rho = n_e \bigg( \frac{A'}{Z'} - \frac{A}{Z} \bigg) = \rho \bigg( \frac{Z/A}{Z'/A'} - 1 \bigg) \:. $

(16) Therefore, it is more convenient to use the pressure as an independent variable and minimize the chemical potential at fixed pressure by using tabulated nuclear masses
$ E_N(Z,N) $ .The main uncertainty in the composition of the outer crust arises from the unknown binding energies of the neutron-rich heavy nuclei close to the transition to the inner crust, defined by
$ \mu = m_n $ , which determines the onset density of the inner crust and terminal nucleus of the outer crust. Many previous studies followed the same theoretical procedure using different nuclear mass tables and their extensions. Here, we use the nuclear energies from the most recent AME2020 mass table and the proposed nuclear model described above for this purpose. -
From the EOS
$ p(\varepsilon) $ , we can obtain the internal structure of a static and spherically-symmetric NS by solving the well-known TOV equations [46, 47],$\frac{\mathrm{d}p}{\mathrm{d}r} = -\frac{m}{r^2} \frac{(\varepsilon+p)(1 + 4\pi r^3 p/m)}{1-2m/r} \:, $

(17) $\frac{\mathrm{d}m}{\mathrm{d}r} = \; 4\pi r^2\varepsilon \:, $

(18) where
$ m(r) $ is the enclosed mass. The integration is performed from the center,$ p(r = 0) = p_c $ , to the surface,$ p(R) = 0 $ [10, 69]. Given that only the EOS of the outer crust is obtained in our calculations, we adopt the compatible BHF V18 EOS [70] in the core and Shen20 EOS [71] in the inner crust. The transition density between the inner crust and core is optimized to ensure continuous pressure and energy density across the β-stable EOS phases. From the composition of the outer crust calculated before, we obtain the total extension and mass of the outer crust, among other quantities. -
The space-time metric of slowly and uniformly rotating axisymmetric NSs can be expressed as
$ \mathrm{d}s^2 = -\mathrm{e}^{\gamma+\rho}\mathrm{d}t^2 + \mathrm{e}^{2\beta}(\mathrm{d}r^2+r^2\mathrm{d}\theta^2) + \mathrm{e}^{\gamma-\rho}r^2 \sin^2 \theta (\mathrm{d}\phi-\omega \mathrm{d}t)^2 \:, $

(19) where γ, ρ, β, ω are the metric potentials, which are functions of r and θ only. The moment of inertia (MI) of a NS can be expressed as [72−74]
$ \frac{I}{MR^2} = \frac{R}{2M} \frac{w_R}{3+w_R} \:,\quad w_R = \frac{r}{\omega} \frac{\mathrm{d}\omega}{\mathrm{d}r}\bigg|_{r = R} \:, $

(20) $ \frac{\mathrm{d}w}{\mathrm{d}r} = \frac{4\pi r(\varepsilon+p)(4+w)}{(1-2m/r)} - \frac{w(3+w)}{r} \:. $

(21) With the EOS
$ p(\varepsilon) $ as input, these equations can be solved numerically together with the TOV equations to obtain the mass, thickness, and MI of the NS and its outer crust [40]. -
Next, we present our numerical results for the binding energies of finite nuclei based on the BHF method. We also present properties of the outer crust of NSs, such as composition, EOS, drip line, crust mass, thickness, moment of inertia, adiabatic index, and speed of sound.
-
Based on the BHF energy-density functional and liquid-drop model, the nuclear binding energies can be calculated as outlined before: For each known nucleus, the experimental values of binding energy are fit by adjusting the surface-energy parameter
$ f_0 $ . Then, for either fixed proton number Z or fixed neutron number N, the results are extrapolated into the unknown neutron-rich region up to the predicted neutron drip line; see, e.g., the curves in Fig. 2(c) for the second method. Results for both approaches are carefully compared. This procedure performs well within the shell limits, i.e.,$ Z = 28-50 $ and$ N = 50-82 $ , which turns out to be sufficient for our purpose.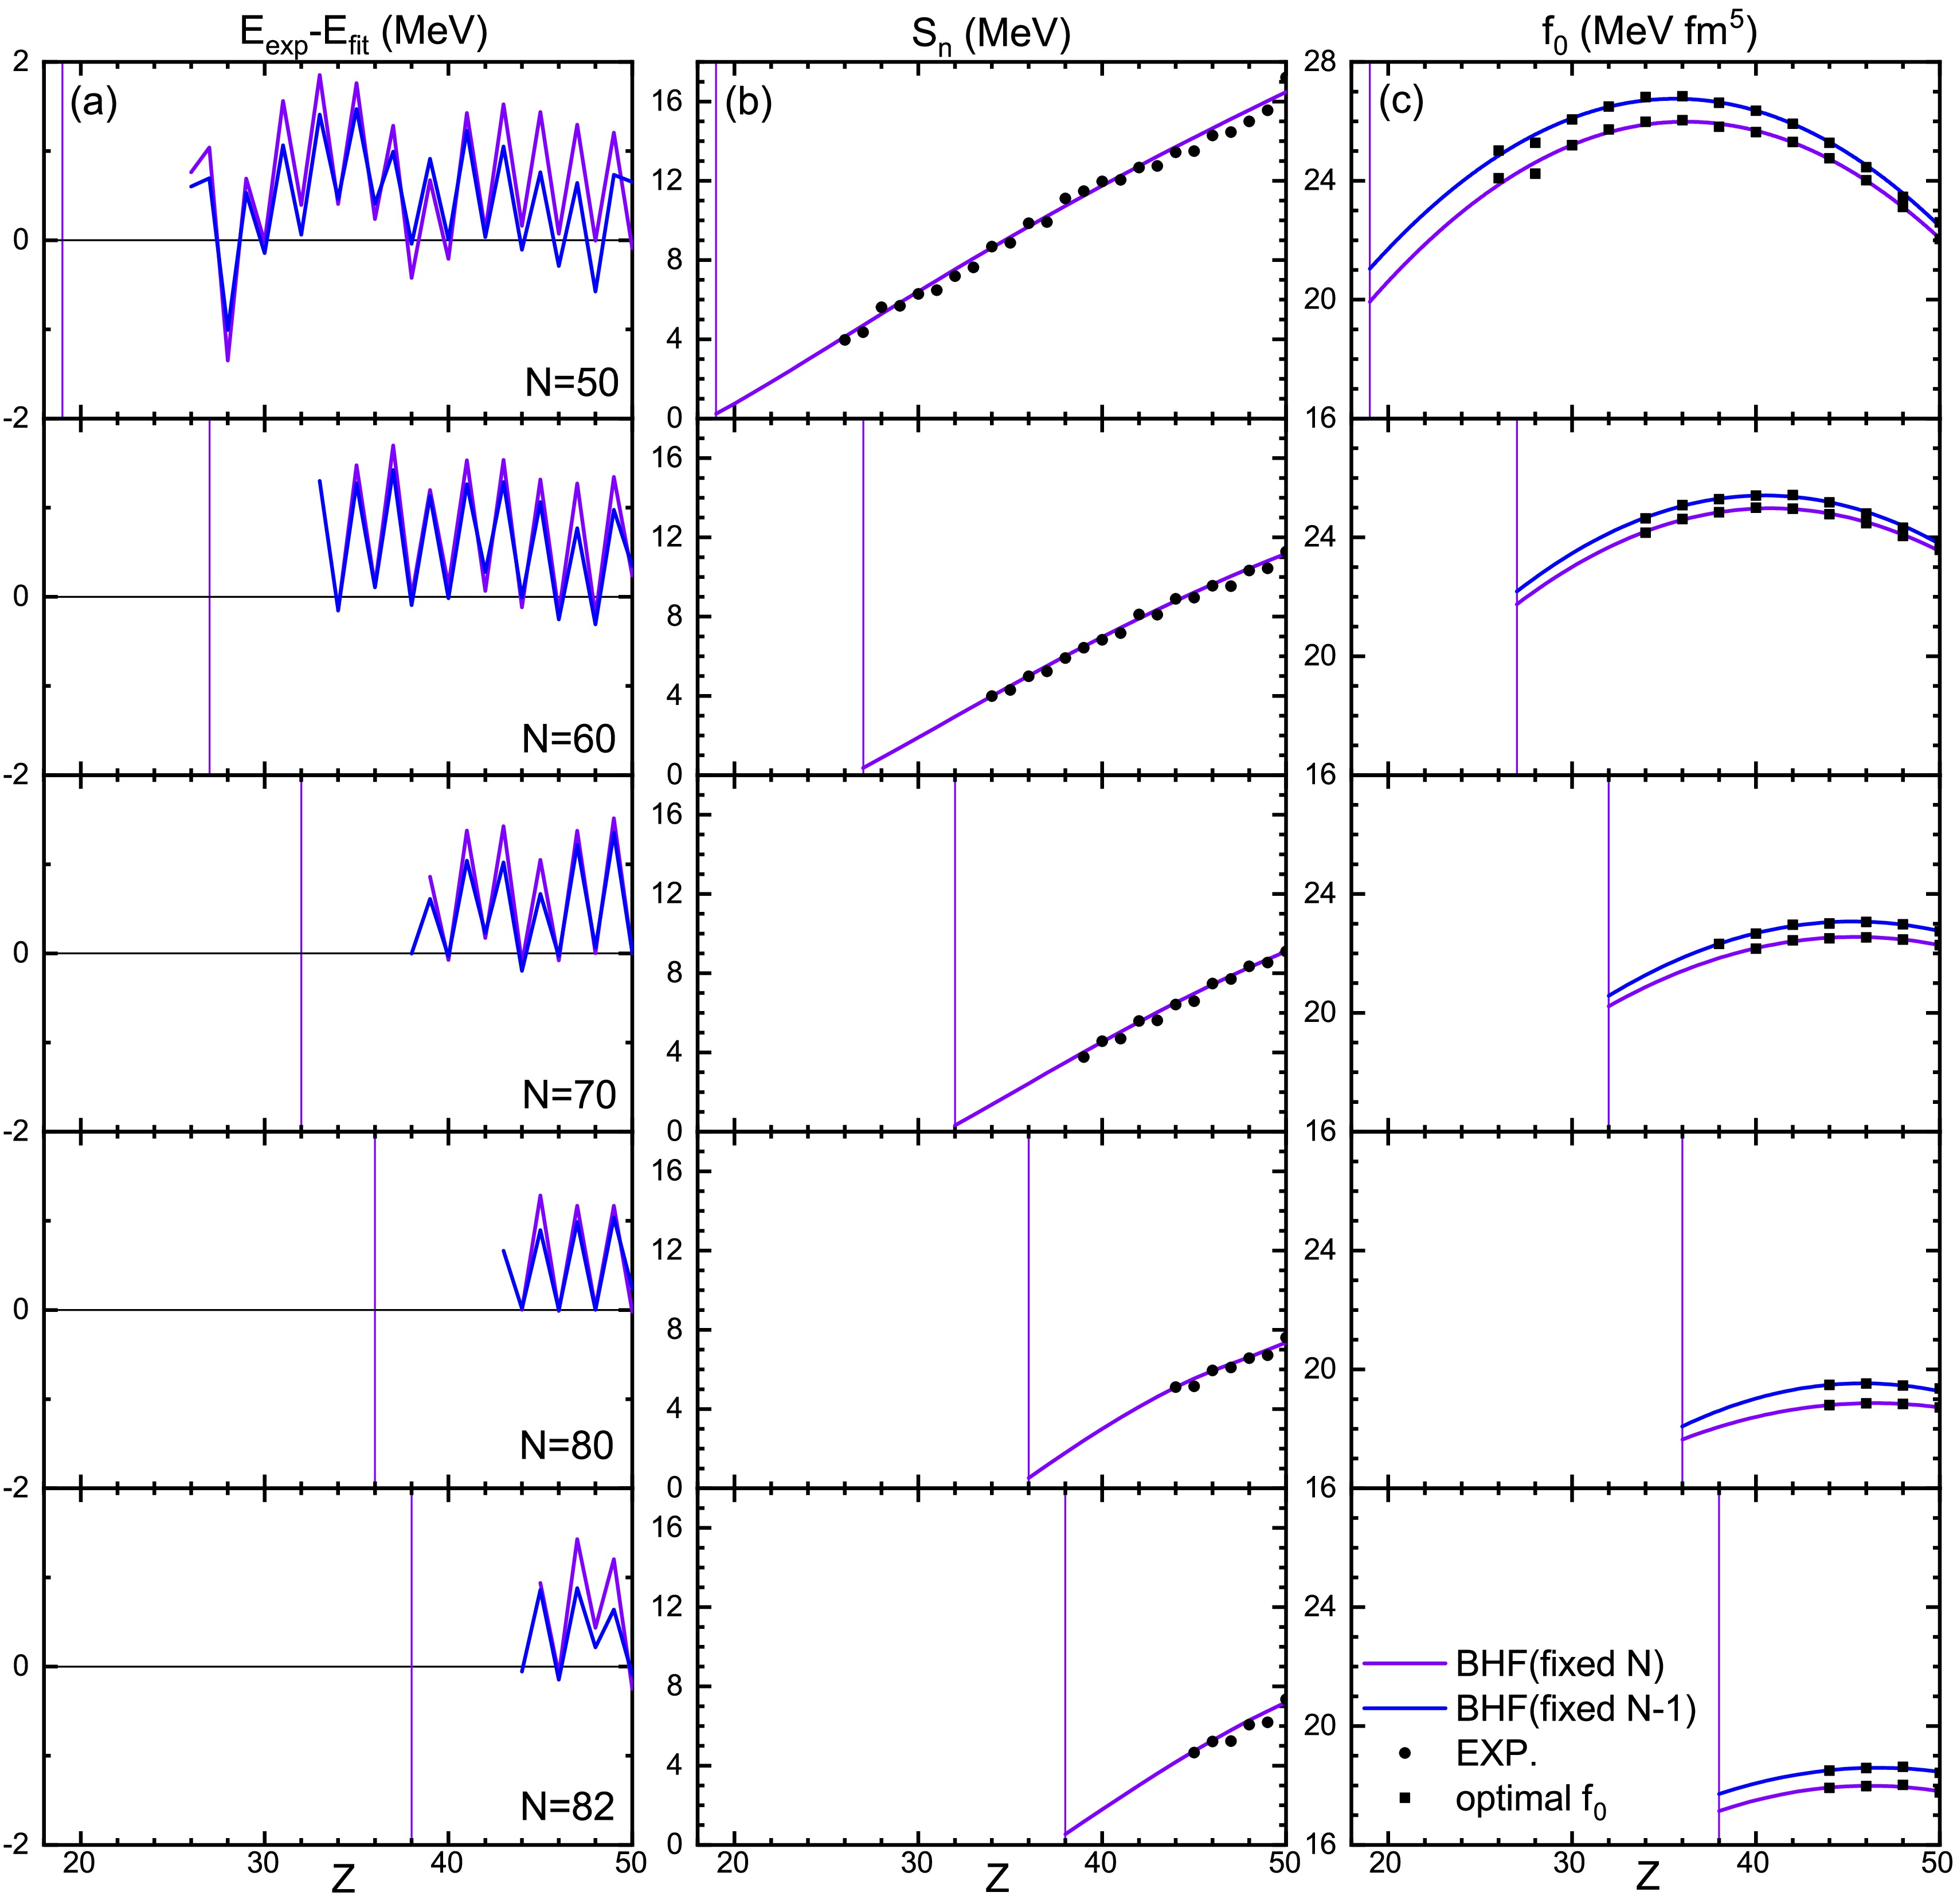
Figure 2. (color online) Fitting results for the neutron number
$ N = 50,60,70,80,82 $ isotones as a function of the proton number Z: (a) difference between fit and experimental energies,$ E_\text{exp}-E_\text{fit} $ , (b) neutron separation energy$ S_n $ , and (c) optimal surface energy parameter$ f_0 $ . Results for BHF (violet and blue curves fitting square markers) and experimental AME2020 data [45] (black round markers) are compared. Vertical lines indicate the neutron drip point.For illustration, Fig. 2 shows results for fixed
$ N = $ 50, 60, 70, 80, 82, which are important isotones in subsequent calculations, especially$ N = 50 $ and 82. Given that the computation of the neutron separation energy$ S_{ n} $ requires the knowledge of the$ (Z,N) $ and$ (Z,N-1) $ energies, we need to fit the surface-energy parameter$ f_0 $ of even-Z nuclei for both fixed N and fixed$ N-1 $ ; see Fig. 2(c). Note that the fit quality is high: the difference between fit and experimental AME2020 [45] total energies,$ E_\text{exp}-E_\text{fit} $ , is accurate within$ 2\;\text{MeV} $ (because pairing energies are not taken into account in our liquid-drop model) and nearly perfect for even nuclei. The (predicted) neutron separation energy$ S_n $ of each nucleus before the neutron drip point is shown in the panels in Fig. 2(b). For example, for$ N = 82 $ , this method predicts the energies of the$ Z = 44-38 $ nuclei down to the drip line, as required for the crust calculation. We conclude that inclusion of pairing into the formalism could only affect the drip line by one unit, which is a small impact; see also Ref. [28]. -
Table 1 lists the results in terms of the sequence of nuclei in the outer crust, following the formalism presented in Sec. II, using the AME2020 [45] nuclear energies when available, and extrapolating towards the neutron drip line, as just described. This table contains threshold densities
$ \rho_\text{min},\, \rho_\text{max} $ , energy density ε, pressure p, ratio of electron and lattice pressures$ p_e/|p_L| $ , neutron chemical potential$ \mu_n $ , and electron chemical potential$ \mu_e $ for the different stages. Experimental nuclei appear up to$ \rho = 1.00\times10^{-4}\;\text{fm}^{-3} $ , which is the magic nucleus$ ^{80} $ Ni. At higher density, the theoretically calculated neutron-rich nuclei emerge. For our calculations, these are$ N = 82 $ nuclei$ ^{124} {\rm{Mo}}$ ,$ ^{122} {\rm{Zr}}$ , and$ ^{120}{\rm{Sr}} $ , which is the final nucleus at the outer-inner crust boundary, with$ \rho_\text{max} = 2.44\times 10^{-4}\;\text{fm}^{-3} $ and$ \varepsilon_\text{max} = 0.229\;\text{MeV}\,\text{fm}^{-3} $ .Element Z N $\rho_\text{min}\;/ \;\text{fm}^{-3}$ 

$\rho_\text{max}\;/ \;\text{fm}^{-3}$ 

$\varepsilon_\text{max}\;/(\text{MeV}\,\text{fm}^{-3})$ 

$p_\text{max}\;/(\text{MeV}\,\text{fm}^{-3})$ 

$ p_e/|p_L| $ 

$ -\mu_n $ /MeV

$ \mu_e $ /MeV

Common $ ^{56} {\rm{Fe}}$ 

26 30 0 5.04 × 10⁻⁹ 4.69 × 10⁻⁶ 3.46 × 10⁻¹⁰ 19.3 8.93 0.96 $ ^{62} {\rm{Ni}}$ 

28 34 5.20 × 10⁻⁹ 1.66 × 10⁻⁷ 1.54 × 10⁻⁴ 4.43 × 10⁻⁸ 23.0 8.22 2.62 $ ^{64} {\rm{Ni}}$ 

28 36 1.71 × 10⁻⁷ 8.10 × 10⁻⁷ 7.55 × 10⁻⁴ 3.61 × 10⁻⁷ 23.6 7.50 4.34 $ ^{66} {\rm{Ni}}$ 

28 38 8.37 × 10⁻⁷ 9.10 × 10⁻⁷ 8.48 × 10⁻⁴ 4.05 × 10⁻⁷ 23.6 7.44 4.47 $ ^{86} {\rm{Kr}}$ 

36 50 9.30 × 10⁻⁷ 1.88 × 10⁻⁶ 1.75 × 10⁻³ 1.04 × 10⁻⁶ 20.0 6.98 5.65 $ ^{84} {\rm{Se}}$ 

34 50 1.95 × 10⁻⁶ 6.85 × 10⁻⁶ 6.39 × 10⁻³ 5.63 × 10⁻⁶ 20.9 5.85 8.58 $ ^{82} {\rm{Ge}}$ 

32 50 7.10 × 10⁻⁶ 1.68 × 10⁻⁵ 1.57 × 10⁻² 1.78 × 10⁻⁵ 21.8 4.79 11.42 $ ^{80} {\rm{Zn}}$ 

30 50 1.75 × 10⁻⁵ 3.19 × 10⁻⁵ 2.98 × 10⁻² 3.98 × 10⁻⁵ 22.8 3.88 13.95 BHF $ ^{78} {\rm{Ni}}$ 

28 50 3.33 × 10⁻⁵ 8.13 × 10⁻⁵ 7.60 × 10⁻² 1.31 × 10⁻⁴ 23.9 2.22 18.77 $ ^{80} {\rm{Ni}}$ 

28 52 8.38 × 10⁻⁵ 1.00 × 10⁻⁴ 9.36 × 10⁻² 1.67 × 10⁻⁴ 23.9 1.83 19.94 $ ^{124} {\rm{Mo}}$ 

42 82 1.05 × 10⁻⁴ 1.35 × 10⁻⁴ 1.27 × 10⁻¹ 2.36 × 10⁻⁴ 18.2 1.25 21.82 $ ^{122} {\rm{Zr}}$ 

40 82 1.40 × 10⁻⁴ 1.89 × 10⁻⁴ 1.77 × 10⁻¹ 3.54 × 10⁻⁴ 18.8 0.53 24.13 $ ^{120} {\rm{Sr}}$ 

38 82 1.96 × 10⁻⁴ 2.44 × 10⁻⁴ 2.29 × 10⁻¹ 4.76 × 10⁻⁴ 19.5 $ \approx0 $ 

25.97 SLy4 $ ^{78} {\rm{Ni}}$ 

28 50 3.33 × 10⁻⁵ 8.13 × 10⁻⁵ 7.60 × 10⁻² 1.31 × 10⁻⁴ 23.9 2.22 18.77 $ ^{80} {\rm{Ni}}$ 

28 52 8.38 × 10⁻⁵ 9.27 × 10⁻⁵ 8.68 × 10⁻² 1.51 × 10⁻⁴ 23.9 1.99 19.45 $ ^{124} {\rm{Mo}}$ 

42 82 9.73 × 10⁻⁵ 1.17 × 10⁻⁴ 1.10 × 10⁻¹ 1.95 × 10⁻⁴ 18.2 1.58 20.80 $ ^{122} {\rm{Zr}}$ 

40 82 1.21 × 10⁻⁴ 1.79 × 10⁻⁴ 1.67 × 10⁻¹ 3.28 × 10⁻⁴ 18.8 0.68 23.67 $ ^{120} {\rm{Sr}}$ 

38 82 1.85 × 10⁻⁴ 2.46 × 10⁻⁴ 2.31 × 10⁻¹ 4.81 × 10⁻⁴ 19.5 $ \approx0 $ 

26.04 FRDM $ ^{78} {\rm{Ni}}$ 

28 50 3.33 × 10⁻⁵ 6.69 × 10⁻⁵ 6.26 × 10⁻² 1.01 × 10⁻⁴ 23.9 2.63 17.59 $ ^{126} $ Ru

44 82 7.01 × 10⁻⁵ 7.77 × 10⁻⁵ 7.27 × 10⁻² 1.17 × 10⁻⁴ 17.7 2.41 18.32 $ ^{124} {\rm{Mo}}$ 

42 82 8.05 × 10⁻⁵ 1.12 × 10⁻⁴ 1.05 × 10⁻¹ 1.84 × 10⁻⁴ 18.2 1.71 20.50 $ ^{122} {\rm{Zr}}$ 

40 82 1.16 × 10⁻⁴ 1.60 × 10⁻⁴ 1.50 × 10⁻¹ 2.83 × 10⁻⁴ 18.8 0.98 22.82 $ ^{120} {\rm{Sr}}$ 

38 82 1.66 × 10⁻⁴ 2.27 × 10⁻⁴ 2.12 × 10⁻¹ 4.31 × 10⁻⁴ 19.5 0.22 25.33 $ ^{118} {\rm{Kr}}$ 

36 82 2.35 × 10⁻⁴ 2.60 × 10⁻⁴ 2.44 × 10⁻¹ 4.93 × 10⁻⁴ 20.2 $ \approx0 $ 

26.19 BPS $ ^{56} {\rm{Fe}}$ 

26 30 4.88 × 10⁻⁹ 4.54 × 10⁻⁶ 3.30 × 10⁻¹⁰ 19.3 8.97 0.95 $ ^{62} {\rm{Ni}}$ 

28 34 1.62 × 10⁻⁷ 1.51 × 10⁻⁴ 4.31 × 10⁻⁸ 23.0 8.26 2.60 $ ^{64} {\rm{Ni}}$ 

28 36 7.48 × 10⁻⁷ 6.97 × 10⁻⁴ 3.25 × 10⁻⁷ 23.5 7.57 4.24 $ ^{84} {\rm{Se}}$ 

34 50 4.90 × 10⁻⁶ 4.58 × 10⁻³ 3.61 × 10⁻⁶ 20.9 6.24 7.69 $ ^{82} {\rm{Ge}}$ 

32 50 1.34 × 10⁻⁵ 1.25 × 10⁻² 1.32 × 10⁻⁵ 21.8 5.15 10.61 $ ^{80} {\rm{Zn}}$ 

30 50 2.93 × 10⁻⁵ 2.74 × 10⁻² 3.56 × 10⁻⁵ 22.8 4.09 13.58 $ ^{78} {\rm{Ni}}$ 

28 50 9.74 × 10⁻⁵ 9.16 × 10⁻² 1.67 × 10⁻⁴ 23.9 1.89 19.97 $ ^{76} {\rm{Fe}}$ 

26 50 1.07 × 10⁻⁴ 1.00 × 10⁻¹ 1.77 × 10⁻⁴ 25.1 1.79 20.25 $ ^{124} {\rm{Mo}}$ 

42 82 1.12 × 10⁻⁴ 1.04 × 10⁻¹ 1.83 × 10⁻⁴ 18.2 1.74 20.50 $ ^{122} {\rm{Zr}}$ 

40 82 1.60 × 10⁻⁴ 1.50 × 10⁻¹ 2.84 × 10⁻⁴ 18.8 1.00 22.86 $ ^{120} {\rm{Sr}}$ 

38 82 2.23 × 10⁻⁴ 2.10 × 10⁻¹ 4.24 × 10⁻⁴ 19.5 0.28 25.25 $ ^{118} {\rm{Kr}}$ 

36 82 2.59 × 10⁻⁴ 2.43 × 10⁻¹ 4.91 × 10⁻⁴ 20.2 $ \approx0 $ 

26.19 For comparison, we also list the BPS results recalculated in Ref. [28] using the AME2003 table [29] and the theoretical nuclear-mass table reported by Myers and Swiatecki [23], the finite-range-droplet model (FRDM) [75], and the HFB results with SLy4 Skyrme energy-density functional [56]. Because of the sensitivity to the nuclear binding energies, different models predict distinct nuclear sequences at high density. In fact, even a small variation in total binding energy of approximately
$ 1\;\text{MeV} $ can lead to a change in the composition prediction. It is remarkable that our results indicate the same nuclei as the SLy4 model, albeit with slightly different density domains.The results are also depicted in Fig. 3(e) as a function of density. Note that as the density increases from the outermost
$ ^{56} {\rm{Fe}}$ nucleus, the composition follows a sequence of plateaus at the magic numbers, first$ Z = 28 $ , then$ N = 50 $ , and finally$ N = 82 $ . Above$ \rho\approx10^{-4}\;\text{fm}^{-3} $ all models follow the$ N = 82 $ shell. During this evolution, the proton fraction$ Z/A $ (d), neutron separation energy$ S_ n $ (c), and binding energy per nucleon$ E(Z,N) $ of the equilibrium nuclei (b) decrease steadily in magnitude until the drip line is reached at approximately$ \rho\approx2.5\times10^{-4}\;\text{fm}^{-3} $ . Fig. 3(a) shows the relation between pressure and density, i.e., the EOS. The pressure increases continuously with the depth, apart from small jumps in density as one nucleus transits to another, which our formalism is unable to model accurately. The pressures are similar for various models, with only small differences at the end of the outer crust. This suggests that the nuclear binding energy has little impact on the EOS. This is not surprising, as the pressure at the densities of interest is dominated by relativistic electrons, which account for approximately 95% of the total pressure within the outer crust, as indicated by the relevant ratio$ p_e/|p_L| $ in Table 1.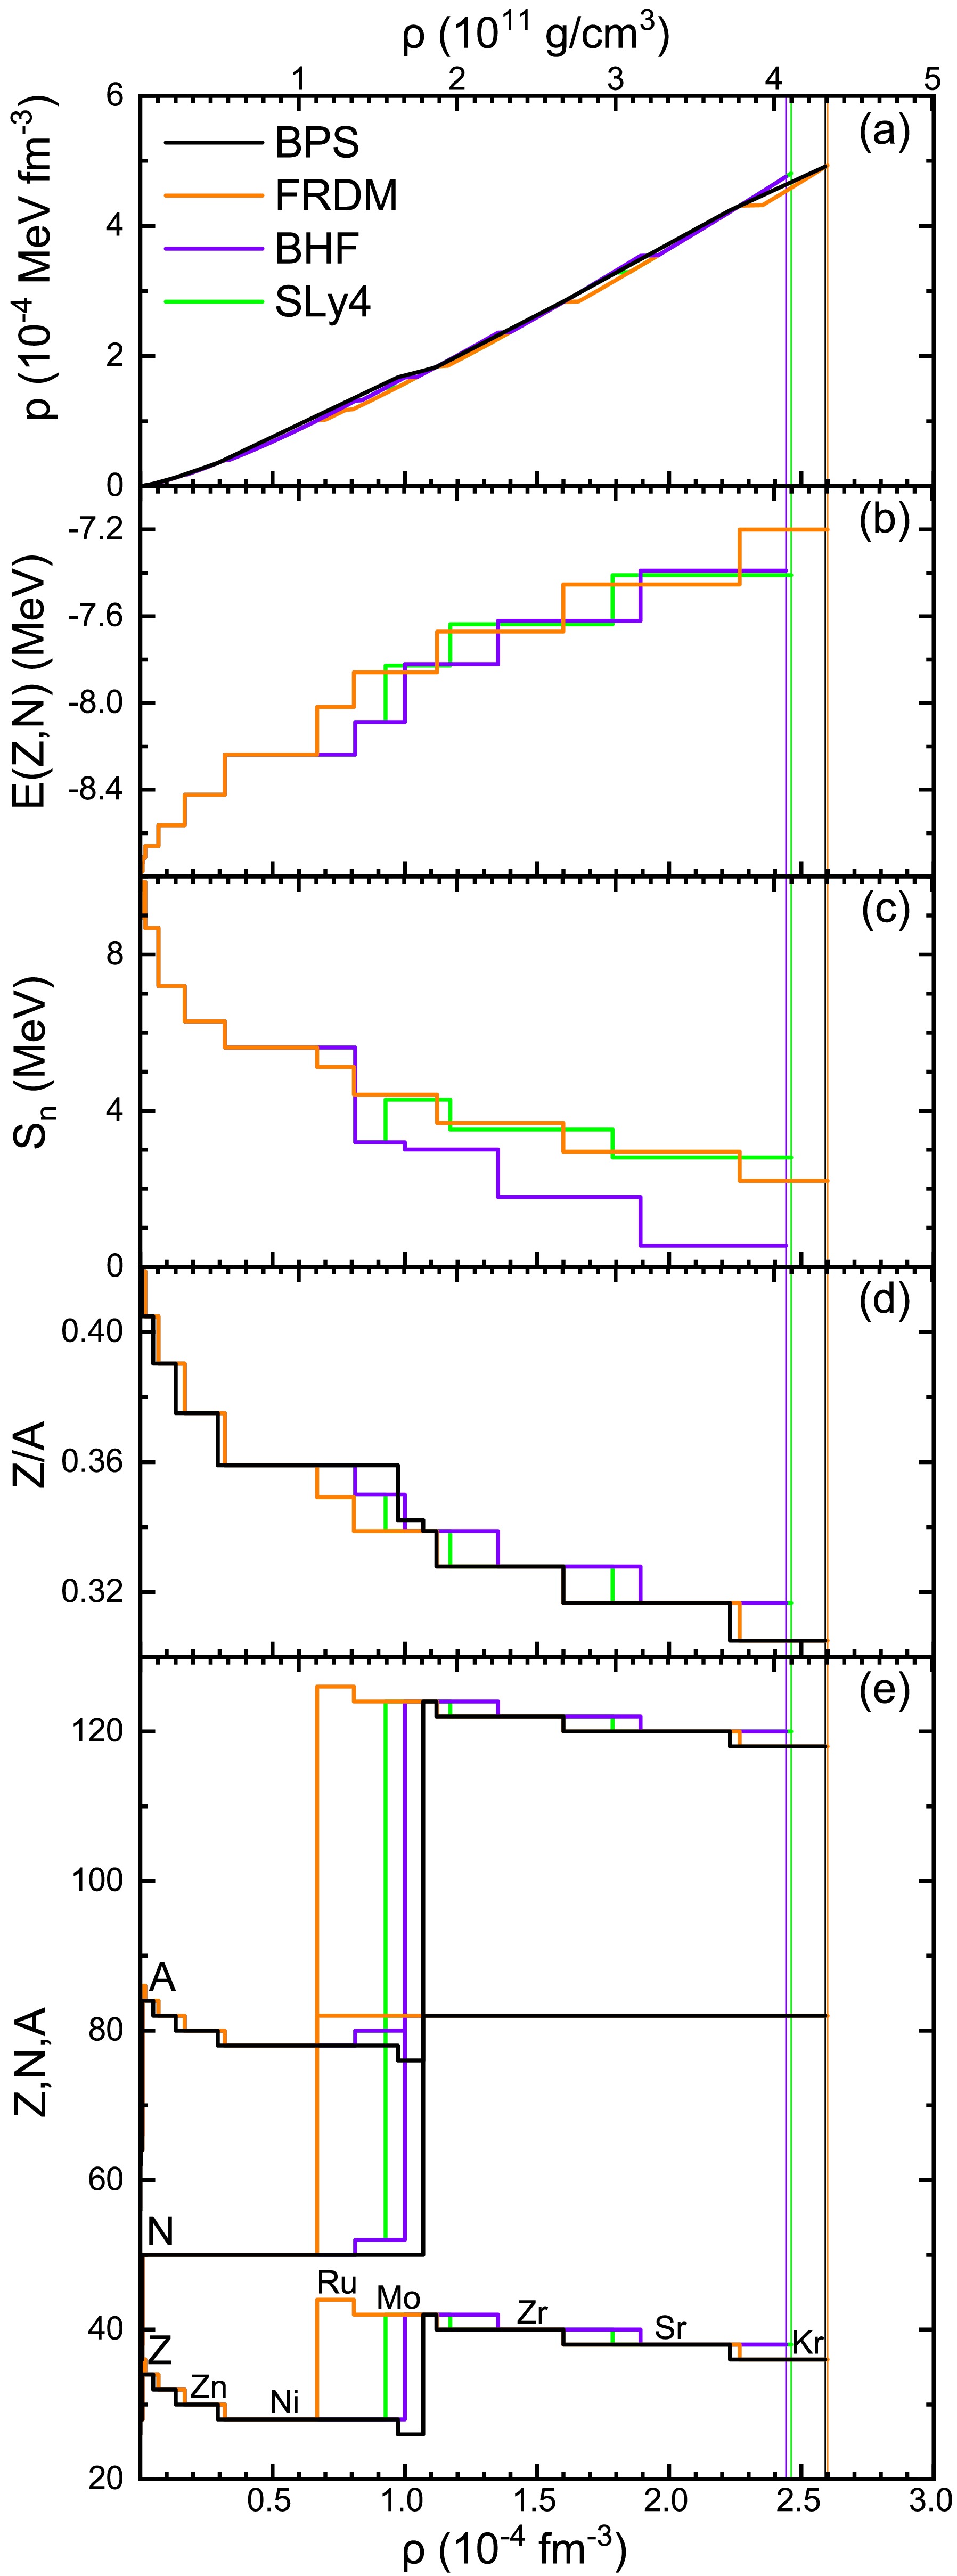
Figure 3. (color online) Properties of the NS outer crust as a function of baryon density: (a) pressure p, (b) binding energy per nucleon
$E(Z,N)$ , (c) neutron separation energy$ S_{_{ }n} $ , (d)$Z/A$ , and (e)$Z,N,A$ of the equilibrium nuclei. Results for BHF (violet curves), BPS [28] (black), FRDM [75] (orange), and SLy4 [56] (green) are compared. Vertical lines indicate the neutron drip point. -
Figure 4 shows the sequence of crust nuclei in the
$ (Z,N) $ plane and the corresponding projections on N and Z with their density dependence. In the experimental-nuclei region, the results are notably similar because all models are based on experimental mass tables. At higher density, all models predict the magic number$ N = 82 $ with$ Z = 36-44 $ ; however, they predict different density intervals for a given value of Z.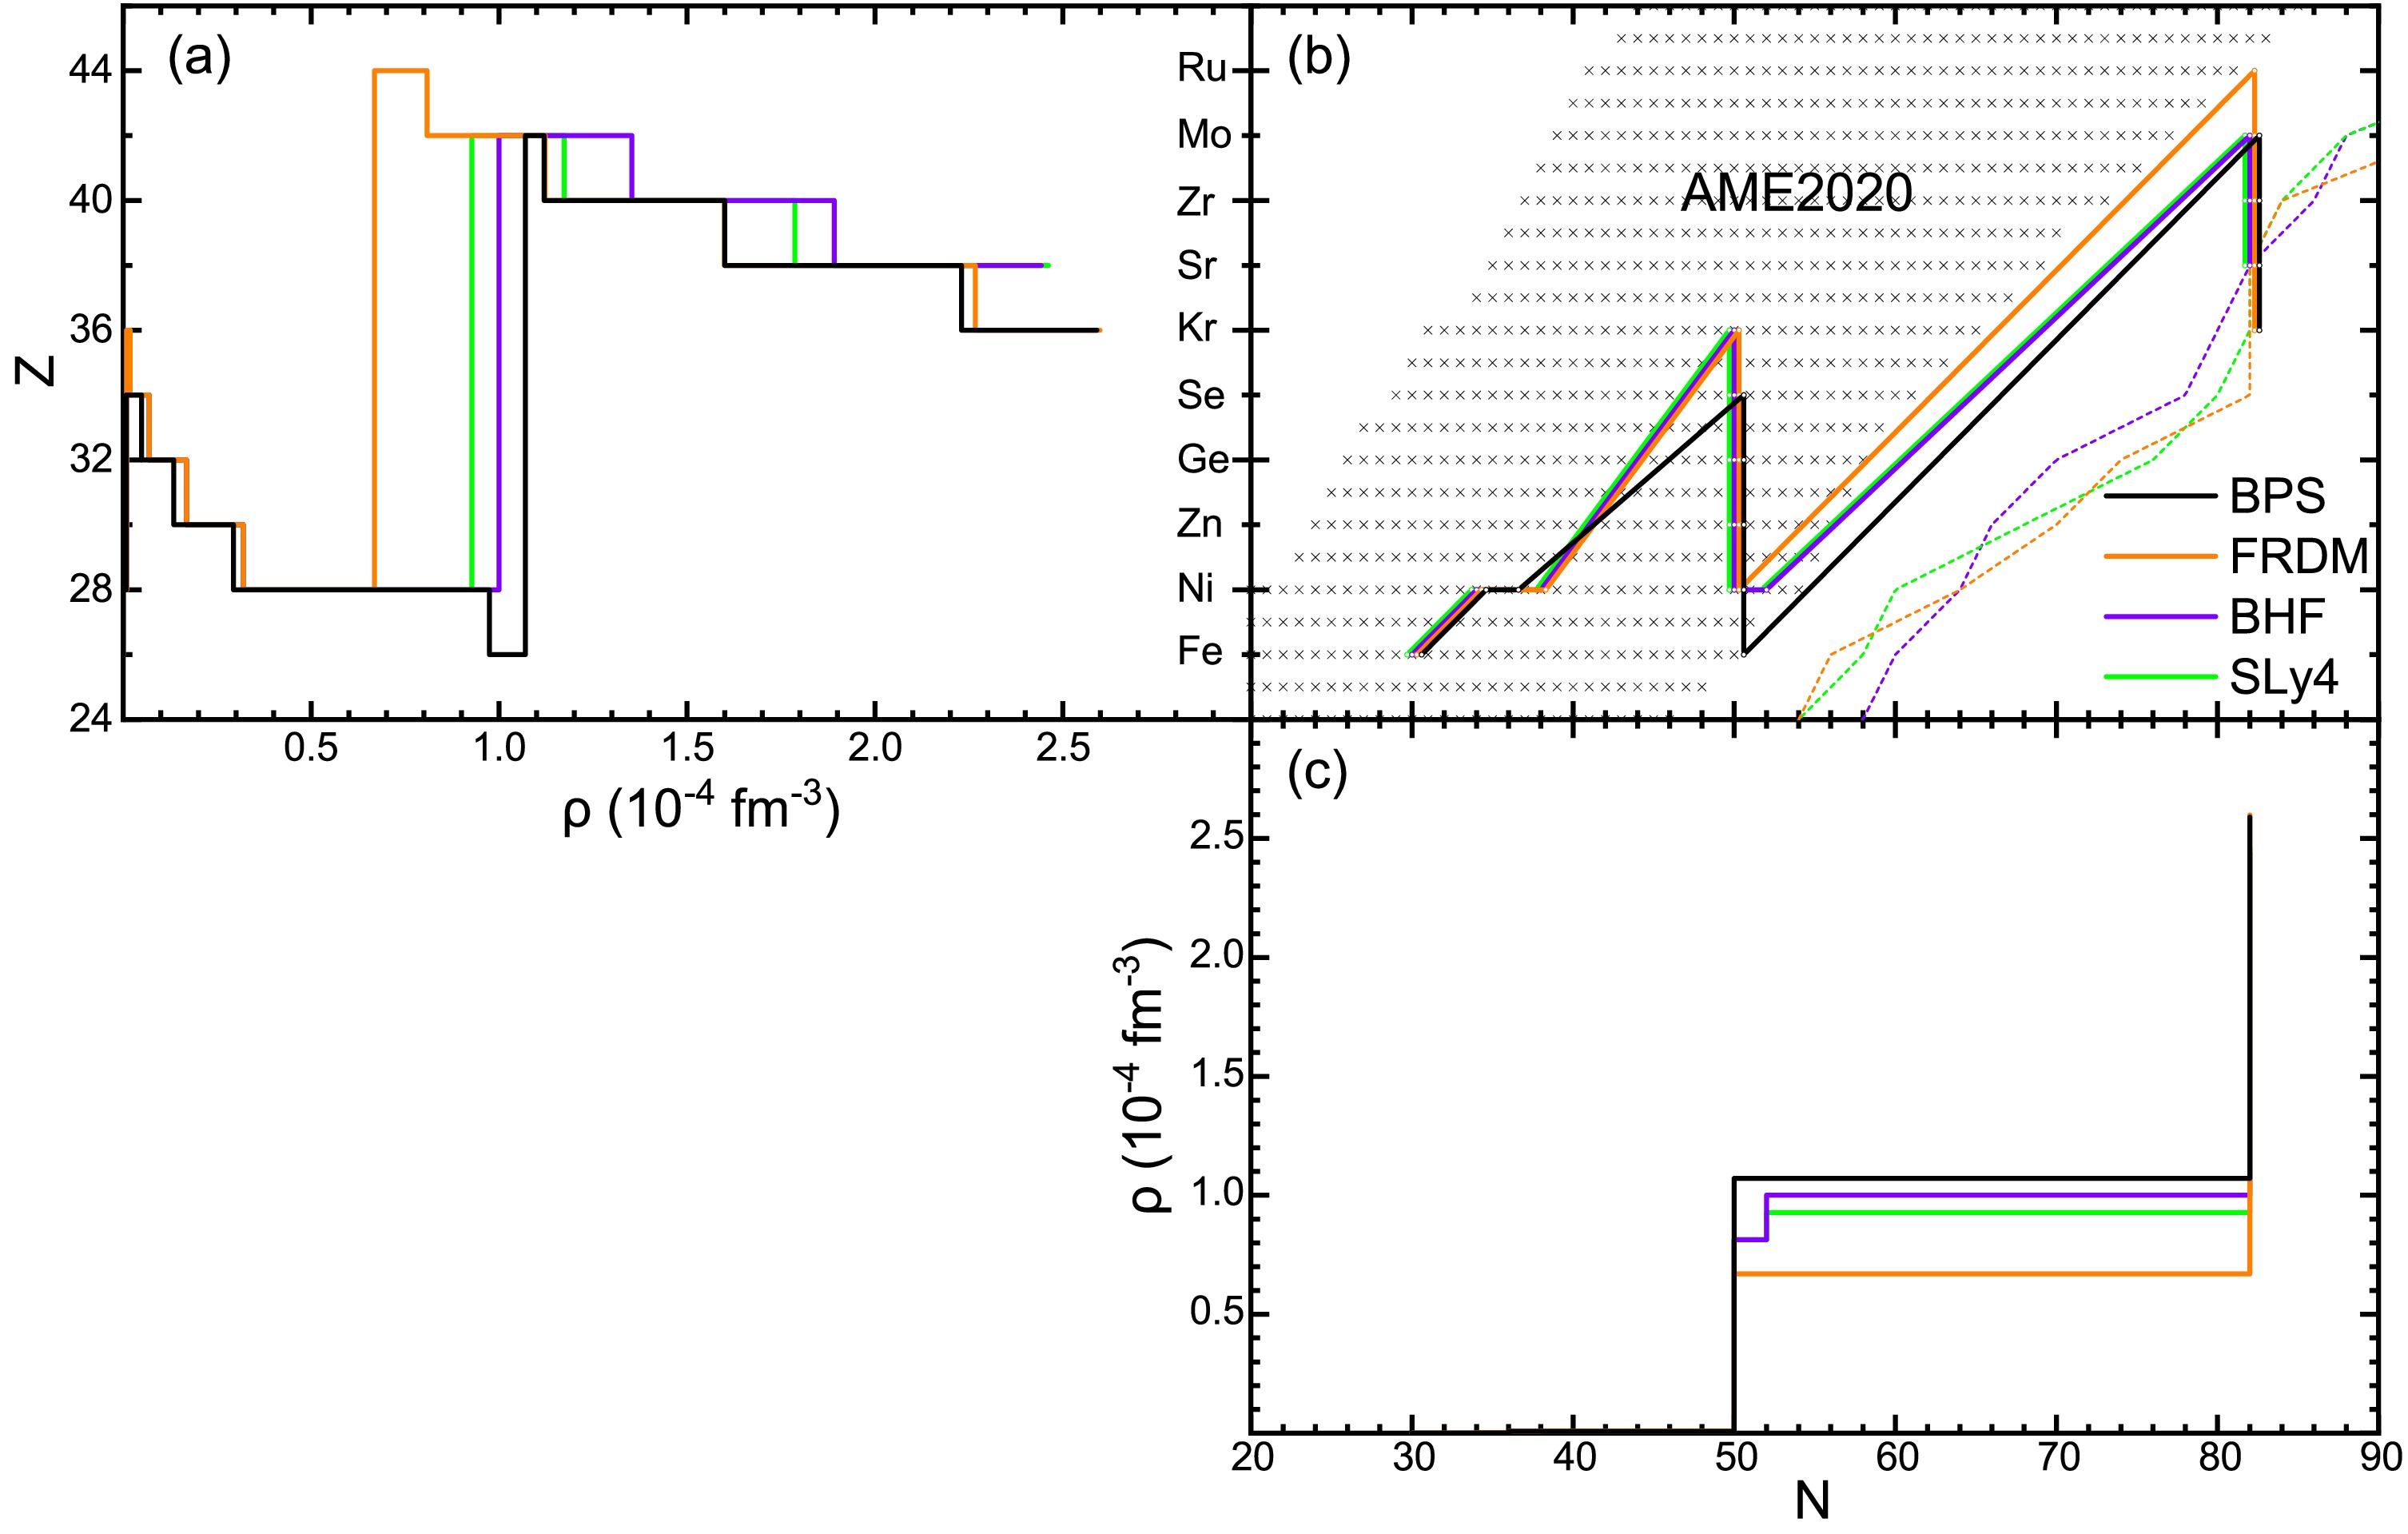
Figure 4. (color online) (b) Sequence of outer-crust nuclei in the nuclear
$ (Z,N) $ chart for various models (thick solid lines and markers) and their neutron drip lines (thin dotted lines). The crosses represent nuclei in the AME2020 database [45]. (a,c) Corresponding Z and N dependencies on baryon number density.The neutron drip lines of the different models are also shown. Note that each model predicts a slightly different drip line. However, this is only relevant at the limit of the crust, when the nuclear sequences of all models meet their respective drip line. The prediction of the neutron drip line is thus crucial for determining the last nucleon in the outer crust and the density and pressure at the boundary between the inner and outer crusts. At
$ N = 82,Z = 38 $ , the theoretical drip lines of all four considered EOSs meet, and the predicted final nuclei of the BHF, BPS, SLy4, FRDM models are all$ N = 82 $ , namely$ ^{118} {\rm{Kr}}$ for BPS and FRDM and$ ^{120} {\rm{Sr}}$ for BHF and SLy4. Note that the corresponding inner-outer crust transition densities are similar for these models.The observation of the NS merger event GW170817 [6, 7], particularly its associated kilonova AT2017gfo, revealed that r-process nucleosynthesis in the ejected material occurs under extreme physical conditions near the outer crust of a NS. These observations indicate that the r-process pathway predominantly follows trajectories close to the neutron drip line, providing additional validation for nuclear mass models [73, 76, 77]. Future combination of precise radioactive beam measurements and advanced gravitational wave detector observations will critically refine the neutron drip line predictions and hence the NS crustal properties as well.
-
Figure 5 represents the baryon density profiles for NSs with
$ M_G = 1.0M_\odot $ (a),$ 1.4M_\odot $ (b), and$ M_\text{max}\approx2.34M_\odot $ (c) for different EOSs. All EOSs have a similar maximum mass$ \sim2.34M_\odot $ , with a radius of$ 10.50\; $ km, because of the same core and inner-crust EOS. The inner-outer crust boundary is indicated. The density drops dramatically in the outer crust by approximately 11 orders of magnitude but occupies only a small part of the stellar radius, in particular for massive NSs.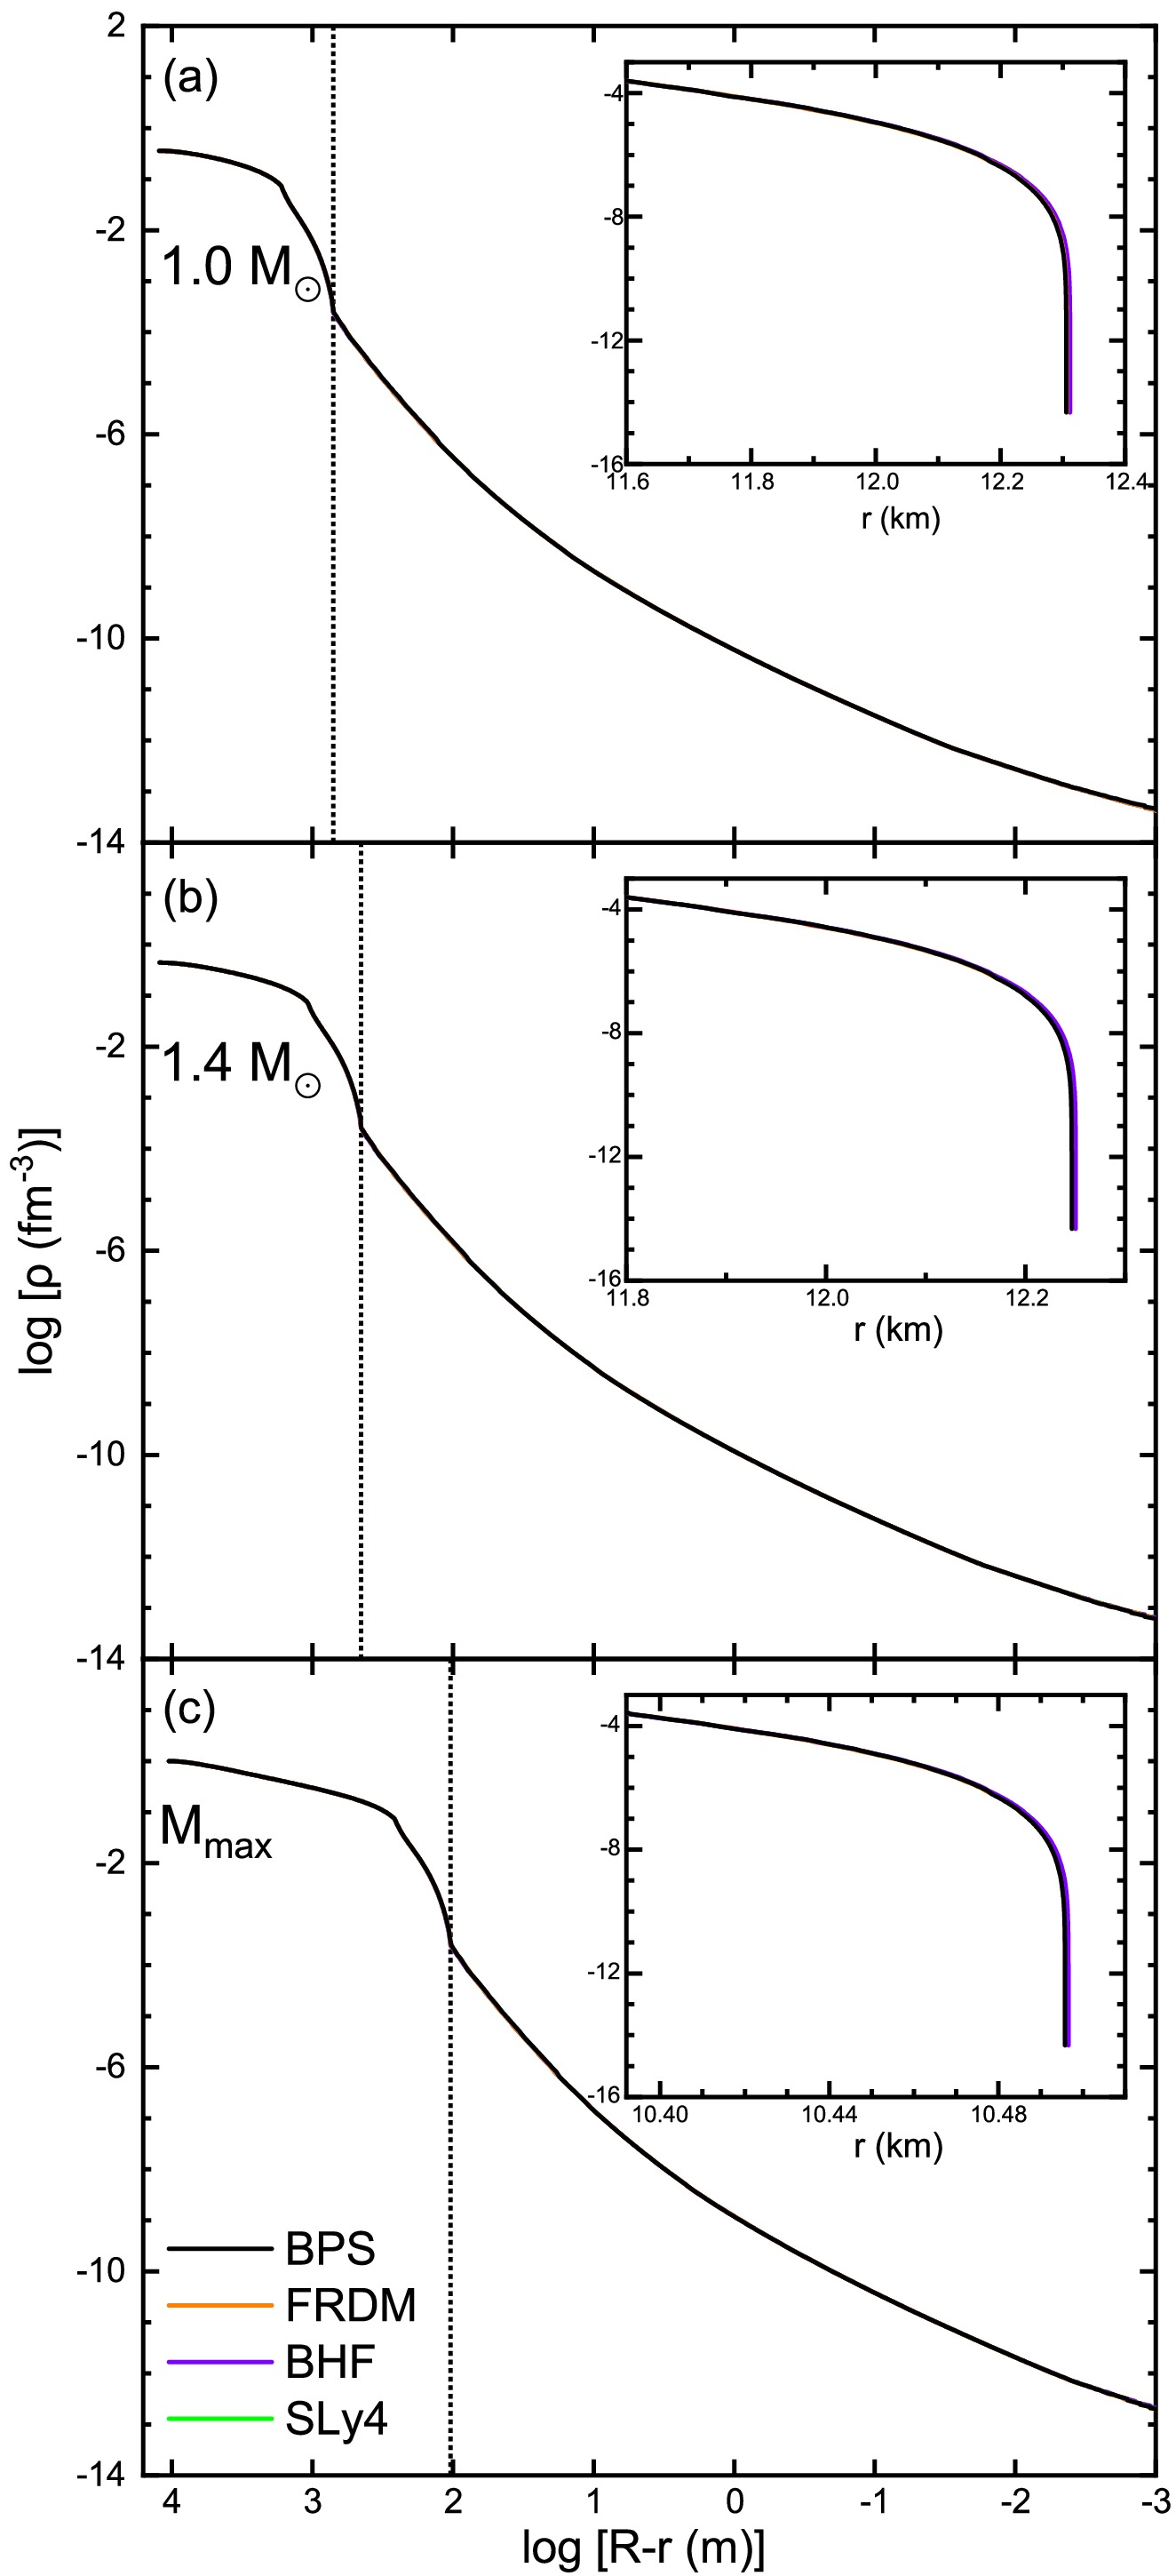
Figure 5. (color online) Density profiles for
$M_G=1.0M_\odot , 1.4M_\odot , $ $ M_\text{max}$ NSs for different EOSs. Vertical dotted lines indicate the inner-outer crust boundary. The insets show only the outer crust.Figures 6(a), (b), (c) show the mass, radial extension, and static MI of the outer crust as functions of the total NS mass. The crustal mass accounts for only a small portion,
$ \sim 10^{-5}M_\odot $ of the whole NS. Therefore, also the relative crustal contribution to the total MI is of order$ 10^{-5} $ . Meanwhile, the extension of a few hundred meters for medium-mass NSs is more notable. All quantities decrease continuously with the increase of the NS mass. The total MI represented in Fig. 6(d) increases nearly linearly with the mass of the NS, given that the NS radius (Fig. 6(e)) remains almost constant except at the highest masses. The results obtained from the four EOSs are nearly identical. A slight variation is observed in the crustal mass, leading to a corresponding relative variation in the crustal MI, as the NS radii (e) are nearly identical across the four EOSs. Some theoretical models, in fact, propose universal relations among I, M, and R [73, 74, 78, 79], suggesting that the intrinsic properties of I may be inferred from observational determinations of the stellar mass and radius, and vice versa. Thus, future precise measurements of I could also provide tighter constraints on NS radii through the universal relations.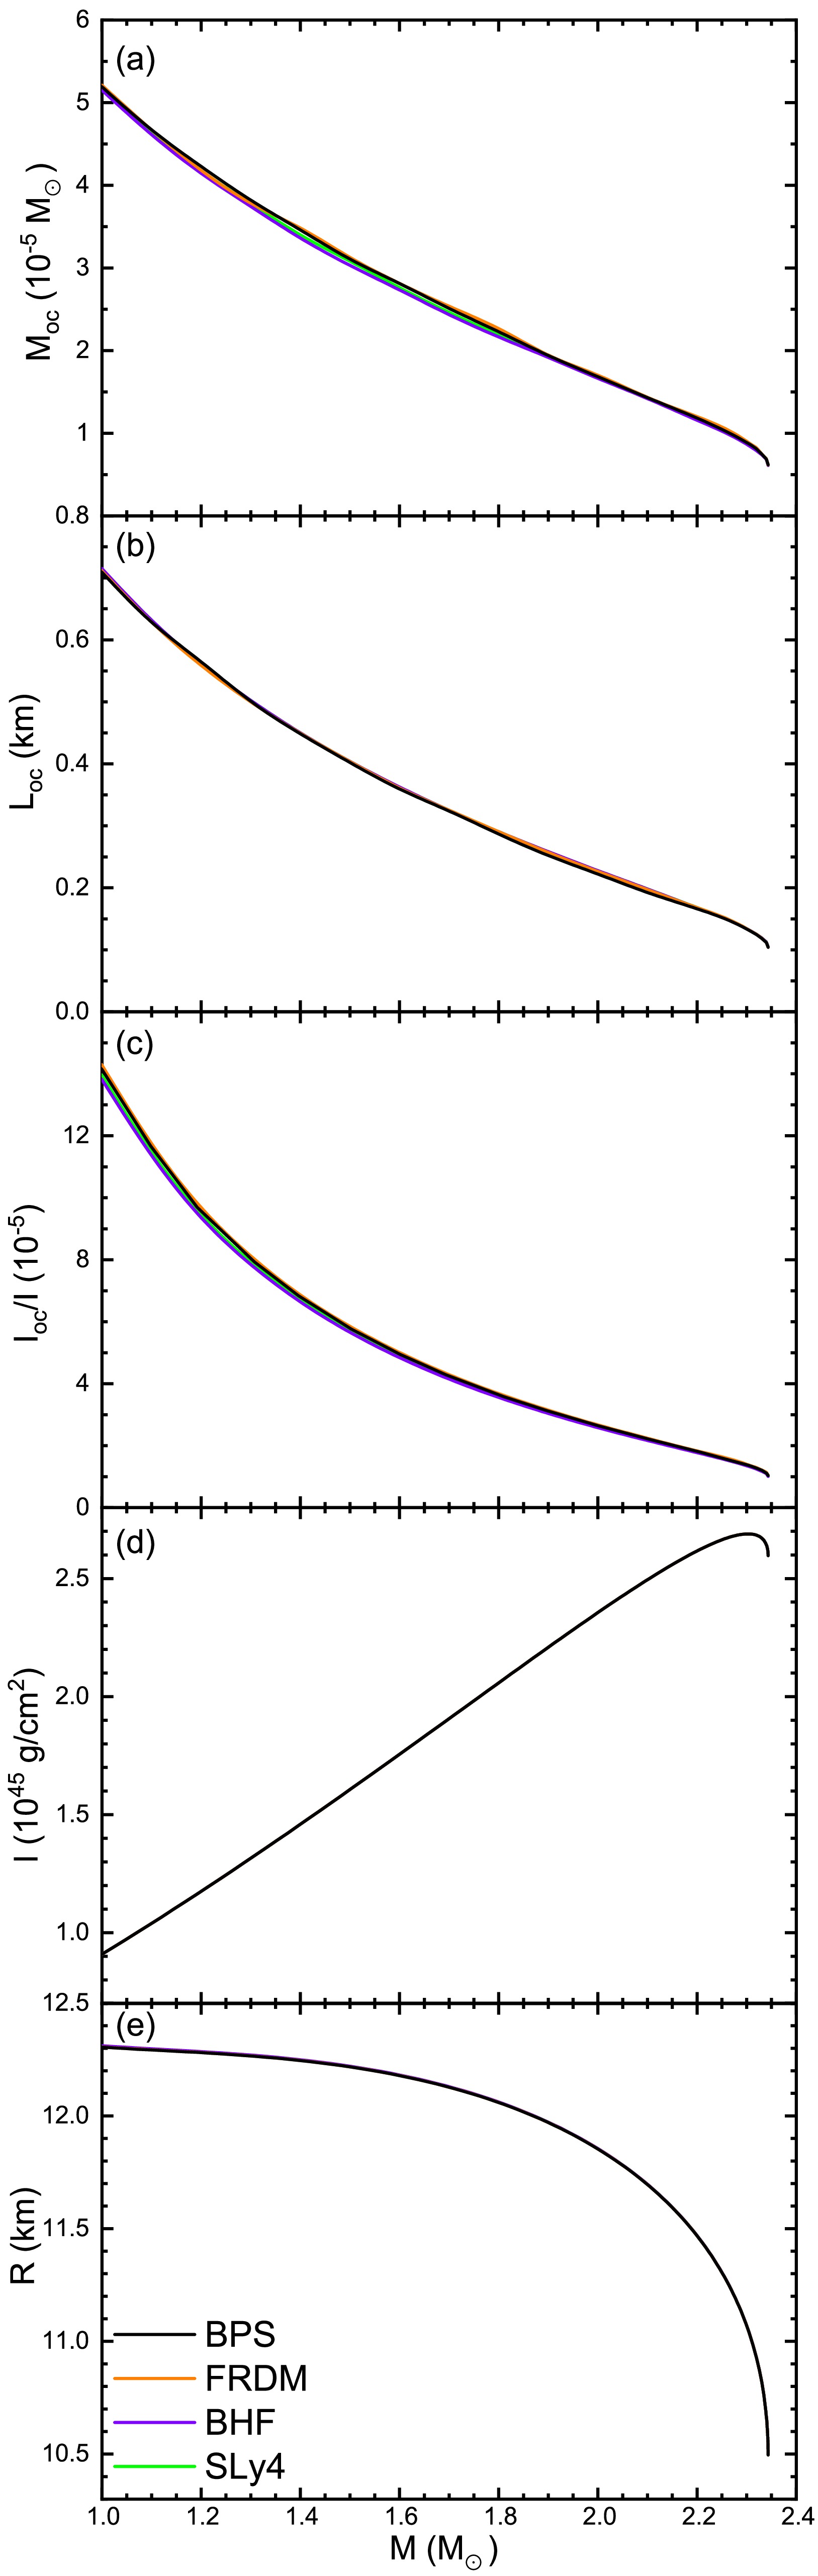
Figure 6. (color online) Outer-crust mass (a), radial thickness (b), relative contribution to the MI (c), total MI (d), and radius (e) of the star as functions of the NS mass for different EOSs.
The adiabatic index, defined as
$ \Gamma = \frac{\rho}{p} \frac{\partial p}{\partial\rho} \:, $

(22) which represents the stiffness of the EOS [28, 41, 43], is shown in Fig. 7(a) for the different models. It also turns out nearly model independent, as the pressure itself (see Fig. 3(a)). With increasing density, Γ approaches the limit of 4/3, given that the electron and lattice pressures, being
$ \sim\rho^{4/3} $ , become dominant in the outer crust. When one nucleus transits to another, the adiabatic index drops to zero, which is not shown for simplicity [28]. Moreover, the speed of sound, given by$ c_s^2=\mathrm{d}p/\mathrm{d}\varepsilon $ [43], shown in Fig. 7(b), is practically EOS independent.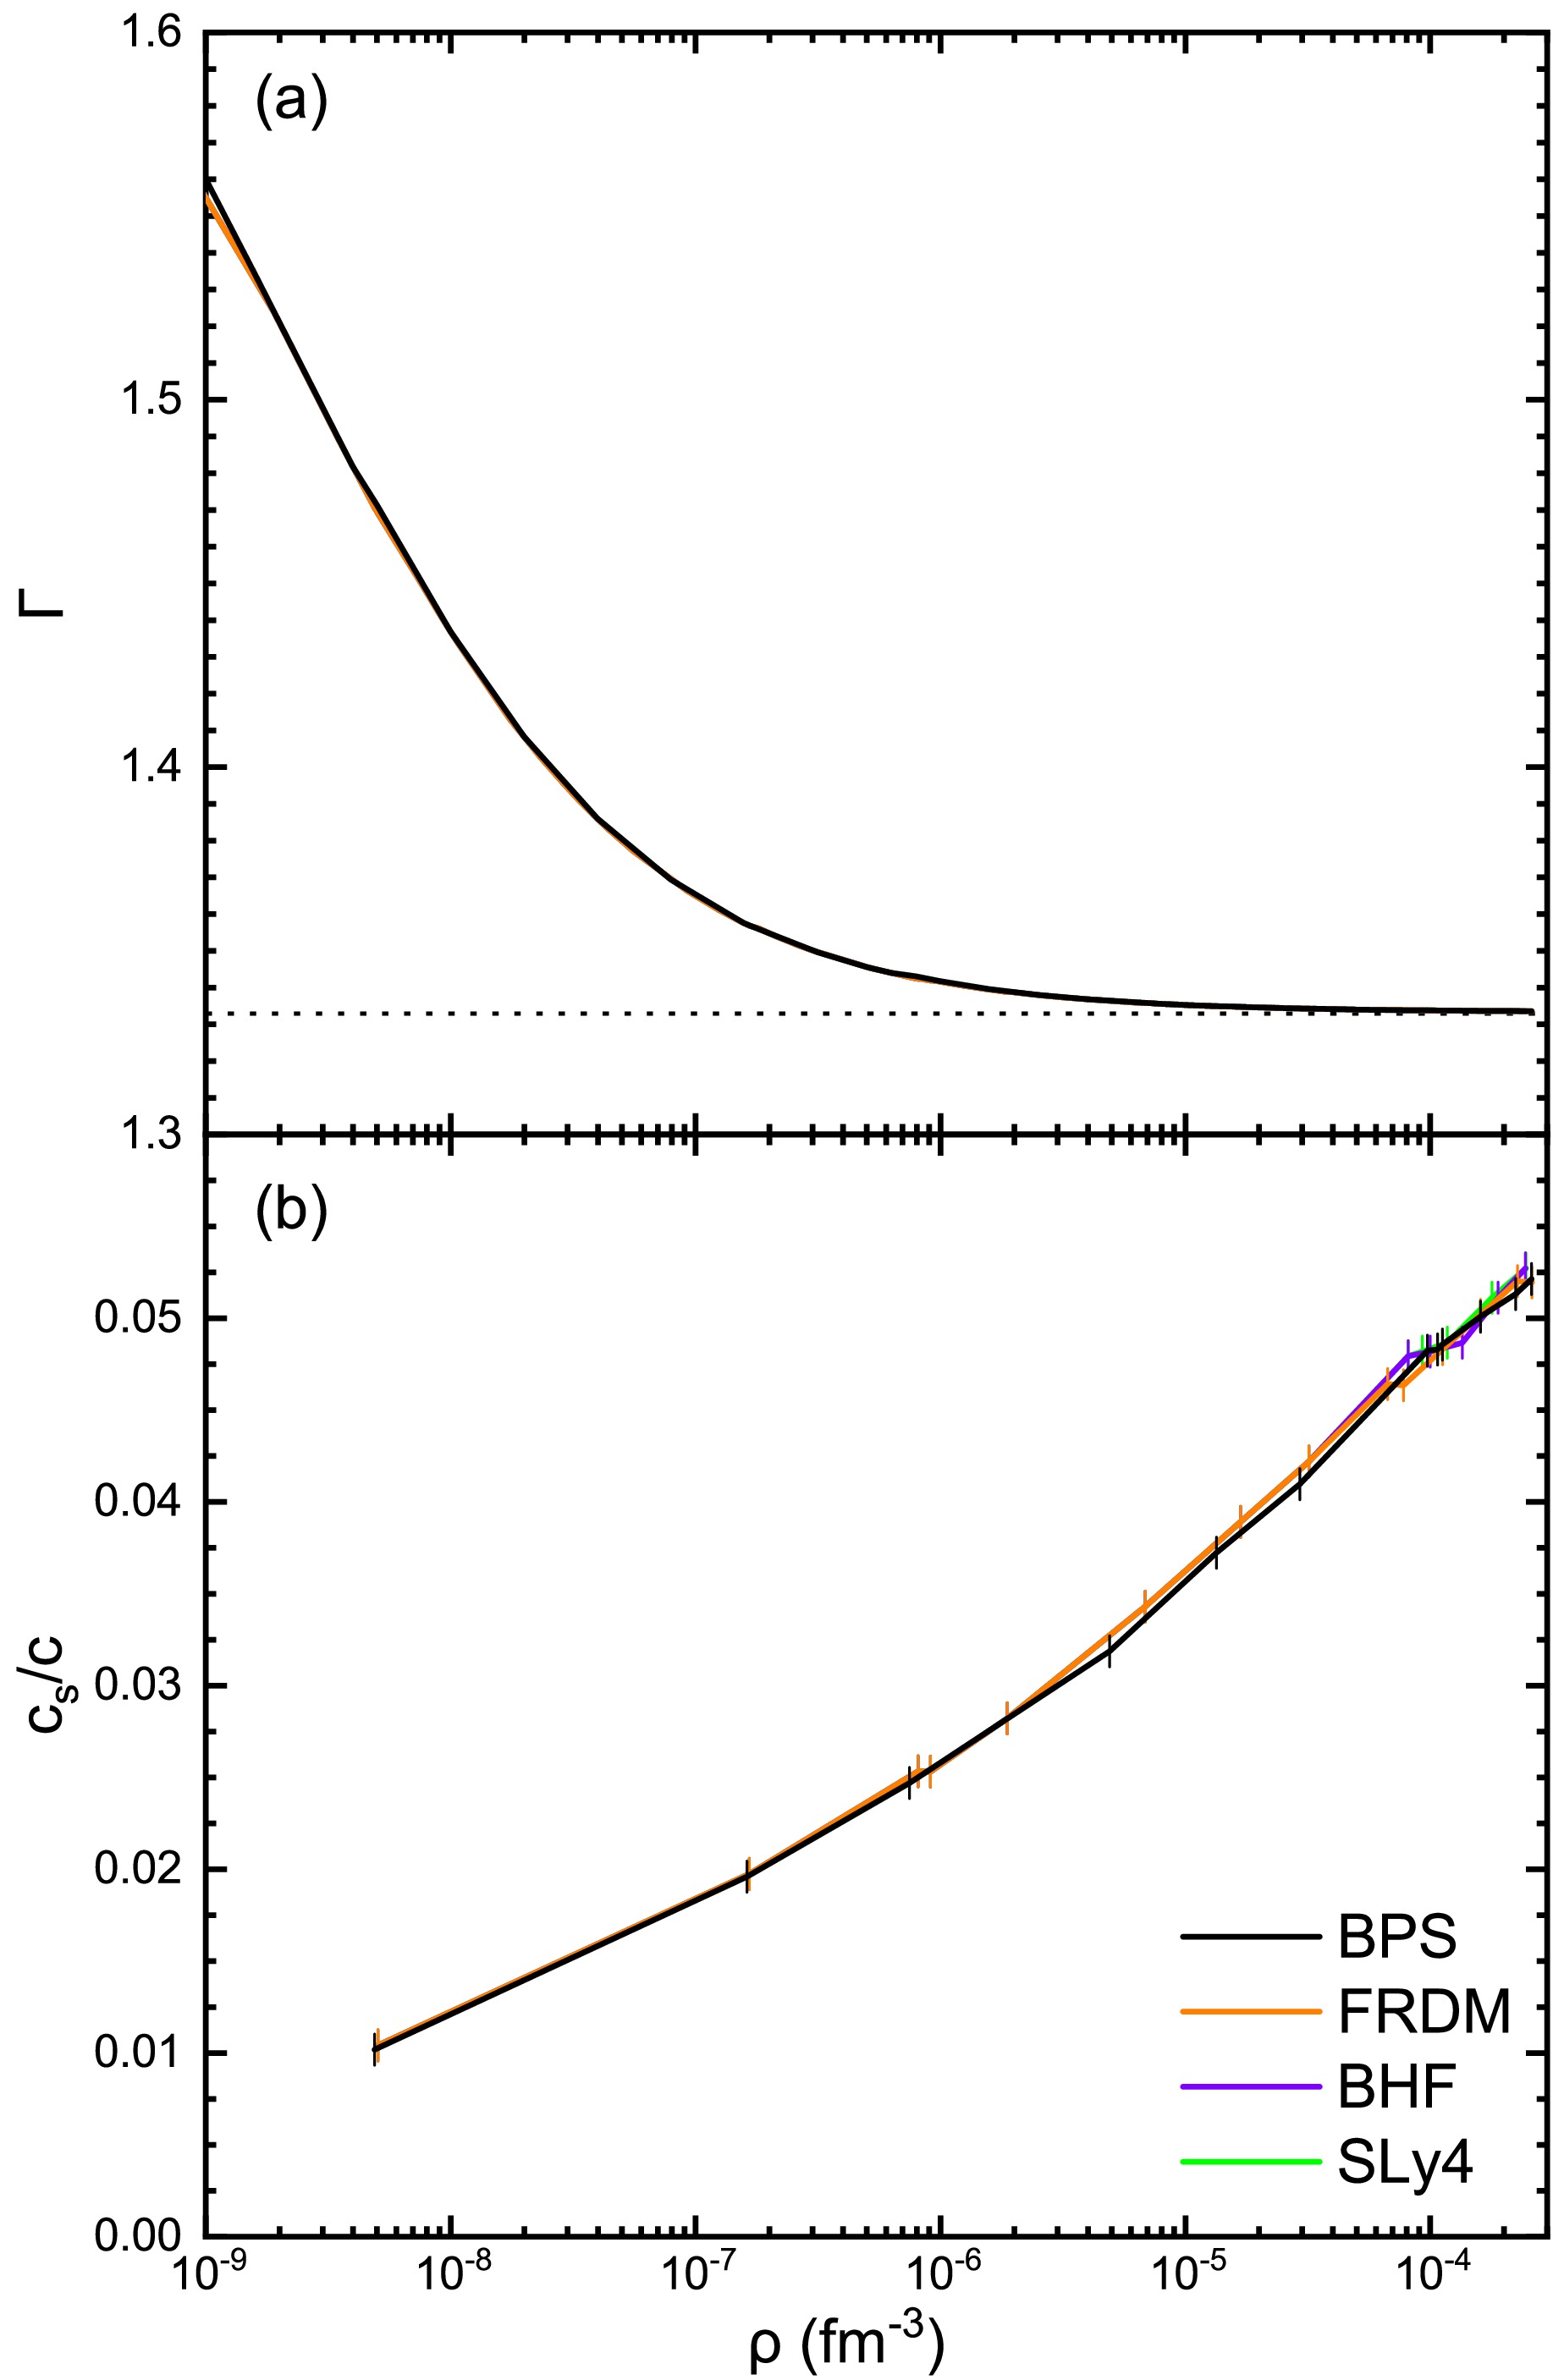
Figure 7. (color online) Adiabatic index (a) and speed of sound (b) versus baryon number density for four models. The horizontal dotted line indicates 4/3. The markers indicate transitions between different equilibrium nuclei.
-
We calculated the properties of the outer crust of nonaccreting cold NSs. Using a BHF energy-density functional, we fitted the experimental nuclear binding energies within a liquid-drop model by adjusting the surface-energy parameter and extrapolated into the unknown neutron-rich region up to the predicted neutron drip line. We then applied the BPS formalism to determine the outer-crust composition and EOS, using the state-of-the-art AME2020 nuclear energies when available, and extrapolated the nuclear data toward the neutron drip line based on BHF theory.
The composition follows a sequence of plateaus along the magic numbers
$ Z = 28 $ ,$ N = 50 $ ,$ N = 82 $ . The results are very similar to those obtained by using the SLy4 Skyrme force and also to the original BPS results. In particular the predicted neutron drip (onset of the inner crust) occurs at$ ^{120} {\rm{Sr}}$ for BHF at$ \rho = 2.44\times 10^{-4}\;\text{fm}^{-3} $ ,$ ^{120} {\rm{Sr}}$ for SLy4 at$ \rho = 2.46\times10^{-4}\;\text{fm}^{-3} $ , and$ ^{118} {\rm{Kr}}$ for BPS at$ \rho = 2.59\times10^{-4}\;\text{fm}^{-3} $ . Consequently, the EOSs for the different models are basically the same. Combining the outer-crust EOS with the BHF V18 EOS for the core and the Shen20 EOS for the inner crust, we analyzed the mass, thickness, and MI of the outer crust and confirmed that there are only slight differences among the various EOSs, as is the case for the adiabatic index and speed of sound in the outer crust.Therefore, this study confirms the validity and accuracy of the original BPS EOS, as already reported in previous studies with updated nuclear data and different theoretical frameworks [28].
Analysis of the outer crust of neutron stars using the Brueckner-Hartree-Fock method
- Received Date: 2025-04-01
- Available Online: 2025-09-15
Abstract: We study the properties of the outer crust of nonaccreting cold neutron stars using a liquid-drop model based on a microscopic Brueckner-Hartree-Fock energy-density functional. We calculate an extended nuclear mass table, particularly near the neutron drip line. Combined with the latest experimental binding energies from AME2020, we determine the sequence of equilibrium nuclei and construct the equation of state for the outer crust. Various properties of the outer crust are calculated in detail and compared with those from other crust models.


 DownLoad: