


 Abstract
 HTML
HTML Reference
 Related
 PDF
PDF


-
Hadronic transitions with
$ \pi^+\pi^- $ or η emittance have contributed significantly to discoveries of quarkonium(-like) states, such as$ Y(4260) $ in$ e^+e^-\to \pi^+\pi^- J/\psi $ via initial-state radiation (ISR) by the BaBar experiment [1]. While searching for an$ s\bar{s} $ version of$ Y(4260) $ , BaBar discovered$ Y(2175) $ (now called '$ \phi(2170) $ ') in$ e^+e^-\to \pi^+\pi^-\phi $ via ISR [2], which was later confirmed by Belle [3]. While searching for$ \phi(2170) $ in the hadronic transition with η, BaBar studied the$ e^+e^-\to\eta\phi $ process via ISR using a$ 232\; ~ {\rm{fb}}^{-1} $ data sample and found an excess with a mass of$ (2125\pm 22\pm 10)\; {{\rm{MeV}}}/c^2 $ (tens of$ {{\rm{MeV}}}/c^2 $ lower than the world average value of$ \phi(2170) $ [4]) and a width of$ (61\pm 50\pm 13)\; {\rm{MeV}} $ [5, 6]. Hereinafter, the first quoted uncertainties are statistical and the second ones are systematic. Belle measured this process with considerably larger statistics in a$ 980\; ~ {\rm{fb}}^{-1} $ data sample but did not find this excess, and the statistical significance of$ \phi(2170) $ was only$ 1.7\sigma $ [7].Interesting measurements have been obtained from the CMD-3 and BESIII experiments over the past years. The CMD-3 experiment measured the process
$ e^+e^-\to K^+K^-\eta $ from 1.59 to$ 2.007\; {\rm{GeV}} $ and found it to be dominated by the$ \eta\phi $ contribution [8]. CMD-3 then calculated the contribution to the anomalous magnetic moment of the muon:$a_\mu^{\eta\phi}(E < 1.8\; {\rm{GeV}}) = (0.321\pm 0.015 \pm 0.016)\times 10^{-10}$ ,$ a_\mu^{\eta\phi} (E<2.0\; {\rm{GeV}}) = (0.440\pm 0.015\pm 0.022)\times 10^{-10} $ . With a$ 715\; ~ {\rm{pb}}^{-1} $ data sample taken at 22 CM energy points in the range of 2.00 to$ 3.08\; {\rm{GeV}} $ , BESIII measured the Born cross sections of$ e^+e^-\to\eta\phi $ [9] and$ e^+e^-\to \phi \eta^{\prime} $ [10]. BESIII reported the observation of$ \phi(2170) $ in the$ \eta\phi $ final state and determined its resonant parameters to be$m_{ \phi(2170)} = (2163.5 \pm 6.2 \pm 3.0)\; {{\rm{MeV}}}/c^2$ and$ \Gamma_{ \phi(2170)} = (31.1^{+21.1}_{-11.6}\pm 1.1)\; {\rm{MeV}} $ [9], for which the width was considerably narrower than the world average value of approximately$ 100 $ MeV [4]. BESIII also observed a resonance near$ 2.17\; {{\rm{GeV}}}/c^2 $ in the$ \phi \eta^{\prime} $ final state with a statistical significance exceeding$ 10\sigma $ [10]. Assuming it is$ \phi(2170) $ , one can infer the ratio${\cal B}[\phi(2170)\to\phi\eta]/ {\cal B}[\phi(2170)\to \phi \eta^{\prime}] = (0.23\pm 0.10 \pm 0.18)$ , which is smaller than the prediction of$ s\bar{s}g $ hybrid models by several orders of magnitude.It is puzzling that
$ \phi(2170) $ is not significant in the η transition compared with the$ \pi^+\pi^- $ transition, and the measurement of$ \phi(2170) $ in the$ \eta\phi $ final state is still poor. The lineshape of$ \sigma(e^+e^-\to\eta\phi) $ is considerably different from that of$ \sigma(e^+e^-\to \pi^+\pi^-\phi) $ [2, 3], which may help us understand the difference between$ e^+e^-\to\eta J/\psi $ and$ e^+e^-\to \pi^+\pi^- J/\psi $ . In the$ c\bar{c} $ sector,$\sigma(e^+e^- \to \eta J/\psi)/ \sigma(e^+e^-\to \pi^+\pi^- J/\psi) \approx 1$ at the peak of$ Y(4260) $ , whereas$ \sigma(e^+e^-\to \eta\phi)/\sigma(e^+e^- \to \pi^+\pi^-\phi) \gg 1 $ at the peak of$ \phi(1680) $ and$ \ll 1 $ at the peak of$ \phi(2170) $ in the$ s\bar{s} $ sector. In a recent lattice quantum chromodynamics (QCD) calculation [11], the properties of the two lowest states were found to comply with those of ϕ and$ \phi(1680) $ but had no obvious correspondence to$ \phi(2170) $ .Besides
$ \phi(1680) $ , there is one more state, known as '$ X(1750) $ ,' that is a candidate of the$ s\bar{s} $ quarkonium. The observation of$ \phi(1680) $ in$ K^+K^- $ and$ K\bar{K}^{*}(892) $ is sometimes cited as evidence that this state is an$ s\bar{s} $ quarkonium, as the radial excitation of ϕ. However, it was argued that the one true evidence for ϕ as an$ s\bar{s} $ state should be the large branching fractions to hidden strangeness modes such as$ \eta\phi $ [12]. The FOCUS experiment reported a high-statistics study of the diffraction photo-production of$ K^+K^- $ and observed$ X(1750) $ with a mass of$(1753.5 \pm 1.5 \pm 2.3)\; {{\rm{MeV}}}/c^2$ and a width of$(122.3 \pm 6.2 \pm 0.8)~ {\rm{MeV}}$ [13]. Meanwhile, FOCUS observed a slight enhancement below the$ \phi(1680) $ region but no obvious$ X(1750) $ signal in the$ K\bar{K}^{*}(892) $ final state.If
$ \phi(1680) $ and$ X(1750) $ are the same state, the mass measured in$ e^+e^- $ collisions and photoproduction experiments typically has a difference of$ 50-100\; {{\rm{MeV}}}/c^2 $ , with$ K\bar{K}^{*}(892) $ dominance in$ e^+e^- $ collisions and$ K^+K^- $ dominance in photo-production. This may constitute evidence for two distinct states, although interference with$ q\bar{q}\; (q = u,\; d) $ vectors may complicate a comparison of these two processes. This issue can be addressed by studying channels in which interference with$ q\bar{q}\; (q = u,\; d) $ vectors is expected to be unimportant, notably,$ \eta\phi $ . With a sample of 4.48 million$ \psi(2S) $ events, BESIII performed the first partial wave analysis of$ \psi(2S) \to K^+K^-\eta $ and simultaneously observed$ \phi(1680) $ and$ X(1750) $ in the$ K^+K^- $ mass spectrum [14], which indicates that$ X(1750) $ is distinct from$ \phi(1680) $ . Meanwhile, BESIII determined$ X(1750) $ to be a$1^{--}$ resonance.Because the cross sections of
$ e^+e^-\to\eta\phi $ have been effectively measured by the BaBar, Belle, BESIII, and CMD-3 experiments, it is helpful to consider all of them to achieve a better understanding of$ \phi(1680) $ ,$ X(1750) $ , and$ \phi(2170) $ . In this study, we combine the measured$ \sigma(e^+e^-\to\eta\phi) $ from the BaBar, Belle, BESIII, and CMD-3 experiments to gain greater lineshape precision, which is helpful for the study of the anomalous magnetic moment of the muon. Then, we perform combined fits to these measured cross sections for the resonant parameters of$ \phi(1680) $ and$ \phi(2170) $ and estimate the production of$ X(1750) $ in the$ \eta\phi $ final state. -
The measurements of
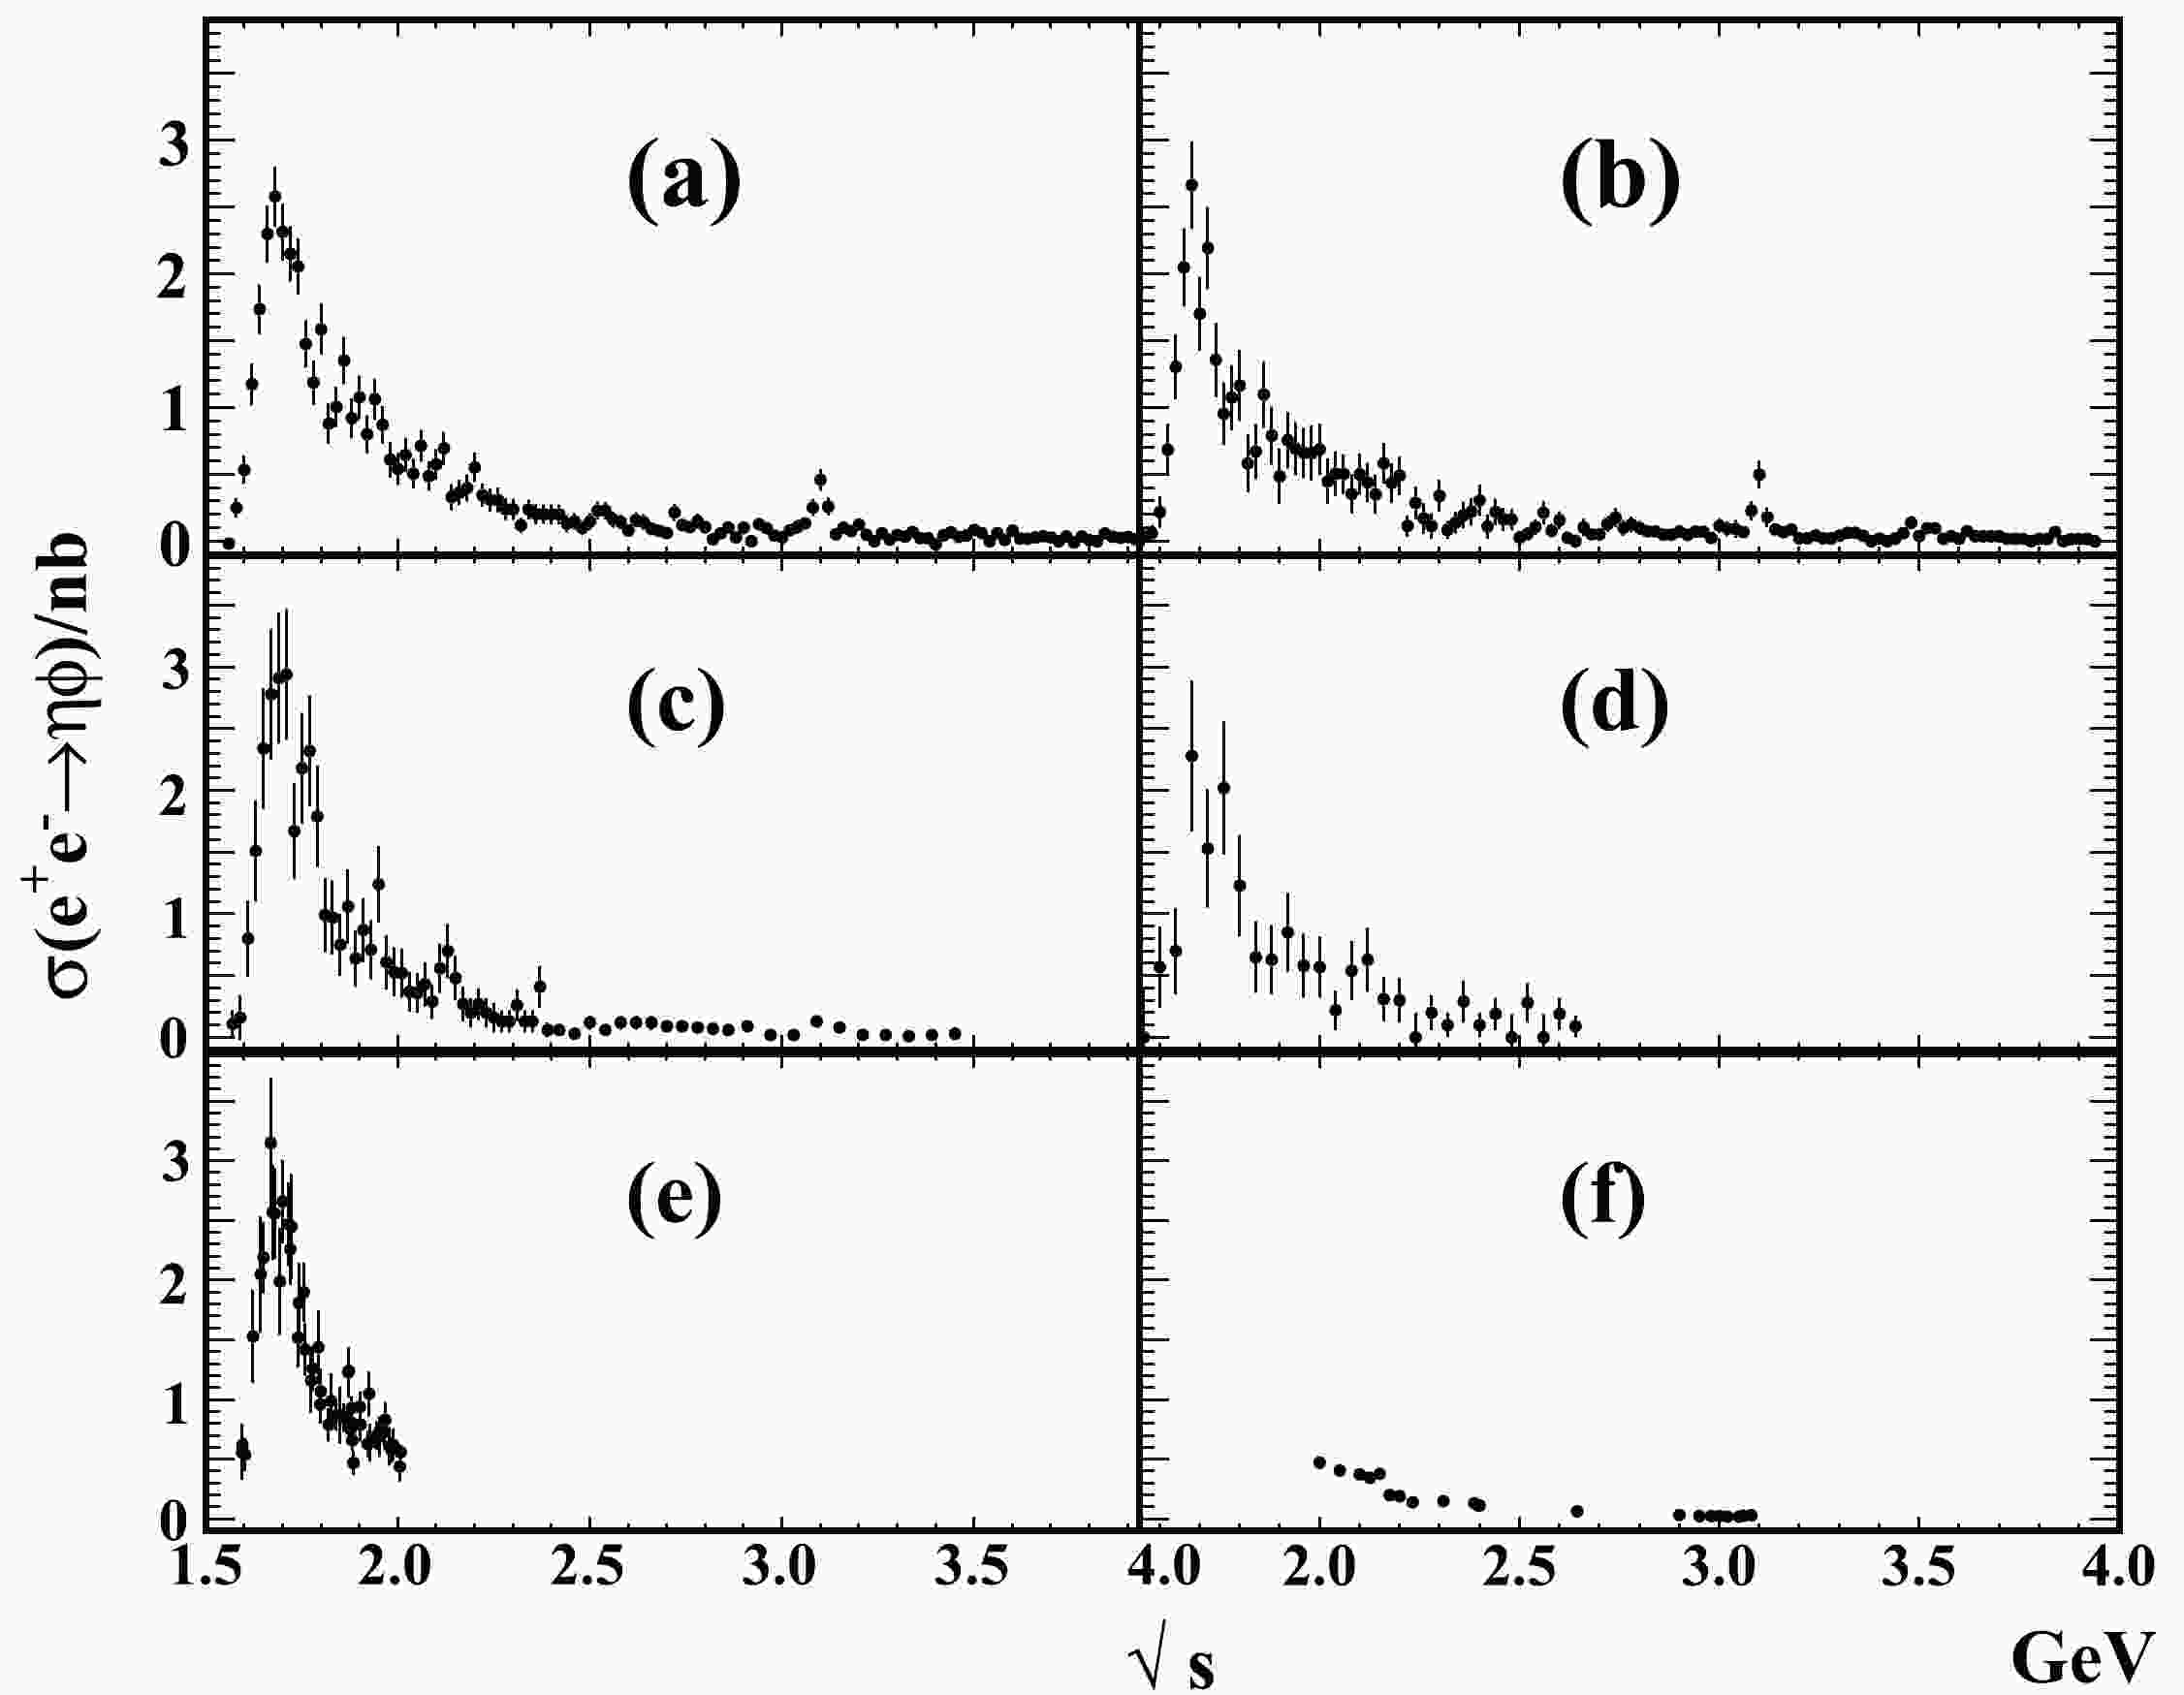
$ \sigma(e^+e^-\to\eta\phi) $ from the BaBar, Belle, BESIII, and CMD-3 experiments are shown in Fig. 1, where (a) to (f) are the Belle measurement with the$ \eta\to \gamma\gamma $ mode [5], Belle measurement with the$ \eta\to \pi^+\pi^-\pi^0 $ mode [6], BaBar measurement with the$ \eta\to \gamma\gamma $ mode, BaBar measurement with the$ \eta\to \pi^+\pi^-\pi^0 $ mode [7], CMD-3 measurement [8], and BESIII measurement [9], respectively.
Figure 1.
$ \sigma(e^+e^-\to\eta\phi) $ measured in (a) the$ \eta \to \gamma\gamma $ mode at Belle, (b) the$ \eta \to \pi^+\pi^-\pi^0 $ mode at Belle, (c) the$ \eta \to \gamma\gamma $ mode at BaBar, (d) the$ \eta \to \pi^+\pi^-\pi^0 $ mode at BaBar, (e) the$ \eta\to \gamma\gamma $ mode at CMD-3, and (f) the$ \eta \to \gamma\gamma $ mode at BESIII.● We show comparisons of the latest results from Belle and the previous measurements from BaBar, BESIII, and CMD-3 in Fig. 2. The comparisons reveal good agreement between the four experiments.
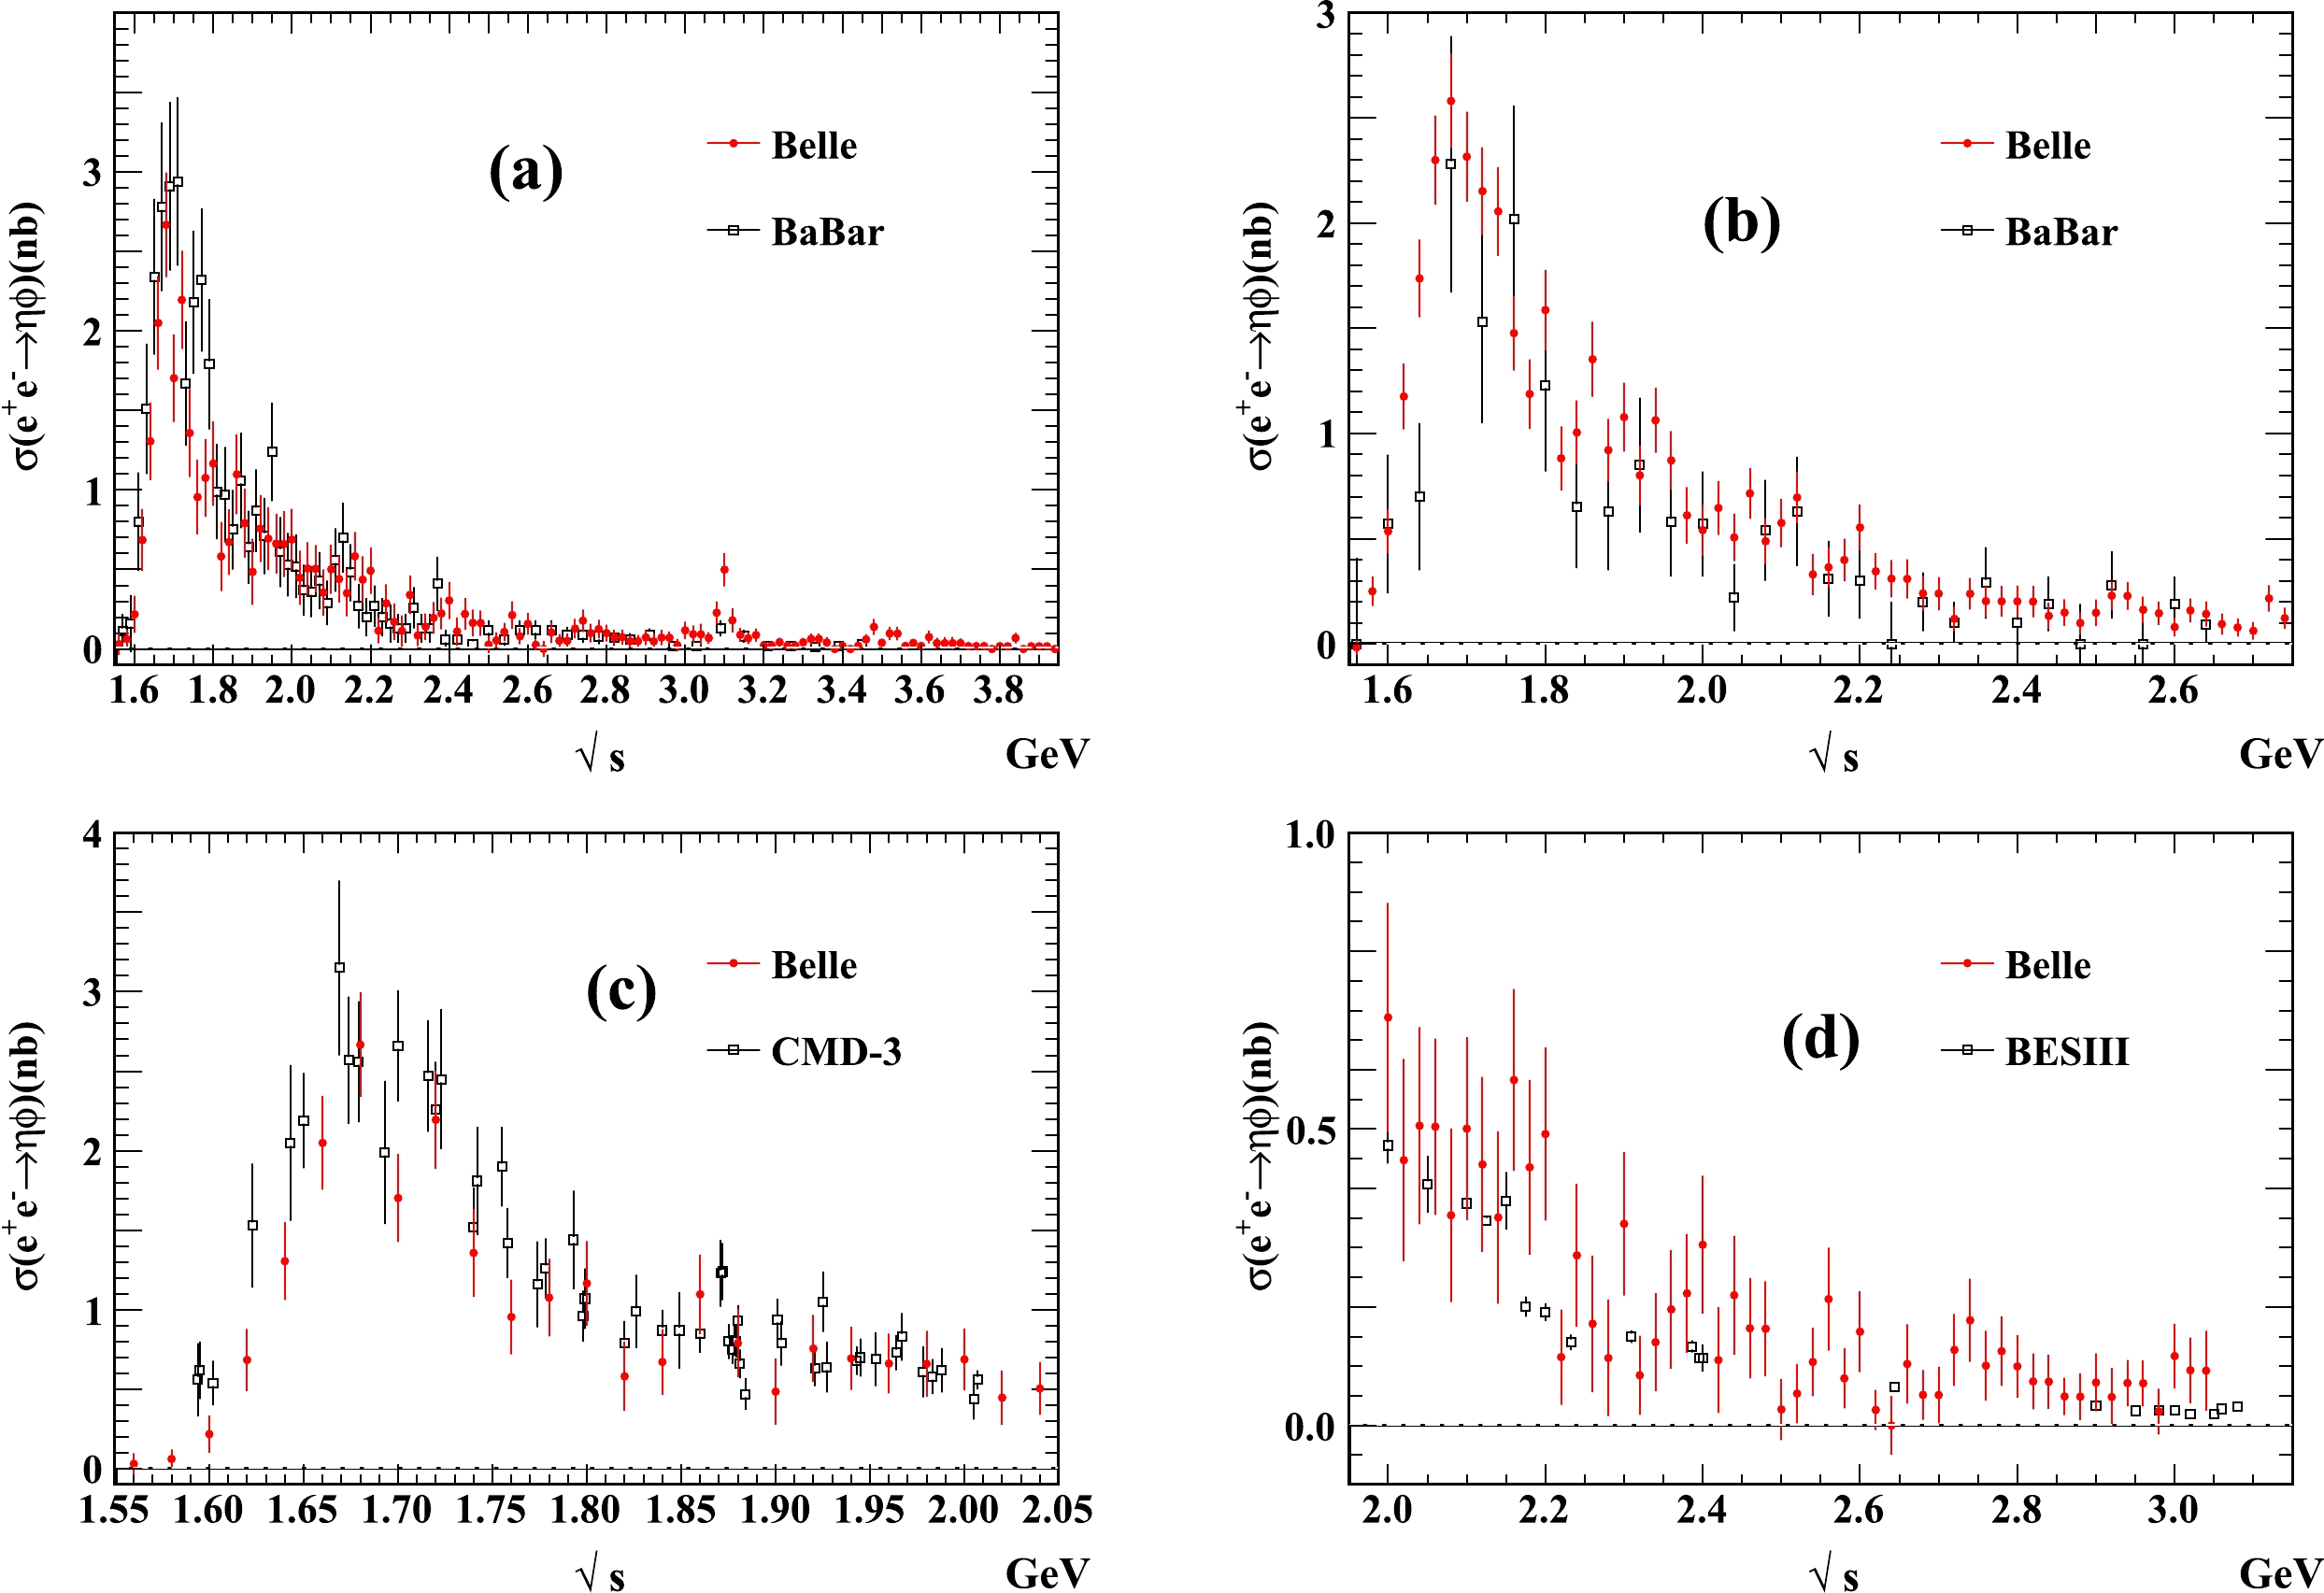
Figure 2. (color online) Measurements of
$ \sigma(e^+e^-\to\eta\phi) $ from the BaBar, BESIII, and CMD-3 experiments compared with the latest measurements from the Belle experiment. Plots (a) and (b) show the comparison between BaBar and Belle in the$ \eta\to \gamma\gamma $ mode and$ \eta\to \pi^+\pi^- \pi^0 $ mode, respectively; plots (c) and (d) show the comparison between CMD-3 and Belle and between BESIII and Belle, respectively, where the Belle measurement has the$ \eta\to \gamma\gamma $ and$ \eta\to \pi^+\pi^- \pi^0 $ modes combined.● In the BaBar measurements,
$ \sigma(e^+e^-\to\eta\phi) $ measured in the$ \eta\to \pi^+\pi^-\pi^0 $ mode is slightly lower than that measured in the$ \eta\to \gamma\gamma $ mode; however, both have similar lineshapes, including a small bump around$ 2.13\; {\rm{GeV}} $ . The expected$ J/\psi $ signal according to the world average value of$ {\cal B}(J/\psi\to\eta\phi) $ [4] is not clear in the BaBar measurements.● With a considerably larger data sample, the Belle measurements are approximately twice as accurate as those measured in the BaBar experiment. There are clear
$ J/\psi $ signals in both the$ \eta\to \gamma\gamma $ and$ \pi^+\pi^-\pi^0 $ modes, whereas enhancement is not observed around$ 2.13\; {\rm{GeV}} $ and$ 2.17\; {\rm{GeV}} $ .● BESIII reported the Born cross section of
$e^+e^-\to \eta\phi$ . We calculate the dressed cross section of$ e^+e^- \to \eta\phi $ with the vacuum polarization and Born cross sections from Ref. [9], as shown in Fig. 1(f).● The
$ 50\; {\rm{MeV}} $ interval in the BESIII data sample is a disadvantage in determining the lineshape of a structure with a width of tens of$ {\rm{MeV}} $ . When determining$ \phi(2170) $ , BESIII relied on$ \sigma(e^+e^-\to\eta\phi) $ below$ 2\; {\rm{GeV}} $ measured by the BaBar experiment, which is dominated by the large contribution from the$ \phi(1680) $ signal.●
$ \sigma(e^+e^-\to\eta\phi) $ measured by CMD-3 are below$ 2\; {\rm{GeV}} $ , with a precision similar to that of the Belle measurement.● Clear
$ \phi(1680) $ signals are observed in the BaBar, Belle, and CMD-3 measurements.The measurements of the dressed cross section of
$ e^+e^-\to\eta\phi $ from the four experiments are consistent with each other. Therefore, we combine these measurements to obtain the best precision of$ \sigma(e^+e^-\to\eta\phi) $ . A precise$ \sigma(e^+e^-\to\eta\phi) $ is helpful for studying the anomalous magnetic moment of the muon [8] and may provide hints of$ \phi(2170) $ or$ X(1750) $ . The calculation for the combination uses$ \bar{x} = \frac{\sum_{i}{x_i/\Delta x^2_i}}{\sum_{i}{1/\Delta x^2_i}} ,$

(1) $ \bar{\sigma} = \frac{\sum_{i}{\sigma_i/\Delta \sigma^2_i}}{\sum_{i}{1/\Delta \sigma^2_i}}, $

(2) $ (\Delta \sigma)^2 = \frac{1}{\sum_i {1/\Delta \sigma^2_i}} , $

(3) where
$ \sigma_i $ is the value of the ith ($ i=1,\; 2,\; 3,\; 4,\; 5,\; 6 $ ) experimental measurement of the cross section at the energy point$ x_i $ ($ \sqrt{s_i} $ ) illustrated in Fig. 1, and$ \Delta \sigma_i $ and$ \Delta x_i $ are their related uncertainties. The average of$ x_i $ takes into account the difference in$ \sqrt s $ in the data taking of the BESIII or CMD-3 experiment and the average$ \sqrt s $ reported by BaBar and Belle using ISR technology. The uncertainties of$ \sqrt s $ in the BESIII and CMD-3 experiments are of the$ 1\; {\rm{MeV}} $ level, and the two experiments have no overlap in the$ \sqrt s $ region. We take half of the$ \sqrt s $ bin width in the BaBar and Belle measurements as the uncertainty ($ \Delta x_i $ ). However, there are correlations between the measurements, such as the branching fraction of ϕ or η decay. We revisit the estimation of Eq. (3) according to Ref. [15] and construct the matrices of the statistical uncertainties$C^{\rm stat}$ and uncorrelated systematic uncertainties$C^{\rm uncor\_syst}$ as$\begin{aligned}[b]& C^{\rm stat/uncor\_syst} =\\& \begin{pmatrix} S_1\cdot \sigma_1^2 & 0 & 0 & \cdots & 0 \\ 0 & S_2\cdot\sigma_2^2 & 0 & \cdots & 0 \\ 0 & 0 & S_3\cdot\sigma_3^2 & \cdots & 0 \\ \vdots & \vdots & \vdots & S_i\cdot\sigma_i^2 & \vdots \\ 0 & 0 & 0 & \cdots & S_6\cdot\sigma_6^2 \\ \end{pmatrix} \end{aligned} $

(4) with
$ S_i = (\delta_i^{\rm stat})^2 $ or$ (\delta_i^{\rm uncor\_syst})^{2} $ , where$ \delta_i^{\rm stat} $ and$ \delta_i^{\rm uncor\_syst} $ are the statistical and uncorrelated systematic relative uncertainties of$ \sigma_i $ . We then construct the matrix of the correlated systematic uncertainties$C^{\rm cor\_syst}$ as$ \begin{array}{*{20}{l}} C^{cor\_syst} = \begin{pmatrix} a_{11} & a_{12} & \cdots & a_{1j} \\ a_{12} & a_{22} & \cdots & a_{2j} \\ \vdots & \vdots & \ddots & \vdots \\ a_{i1} & a_{i2} & \cdots & a_{ij} \\ \end{pmatrix} \end{array} $

(5) where
$a_{ij} \equiv \delta_{i}^{\rm cor\_syst}\cdot \delta_j^{\rm cor\_syst}\cdot \sigma_{i}\cdot \sigma_{j}$ . We obtain the effective global covariance matrix$ \begin{array}{*{20}{l}} \begin{aligned} C = C^{\rm stat} + C^{\rm uncor\_sys} + C^{\rm cor\_syst} . \end{aligned} \end{array} $

(6) According to Ref. [15], we calculate the error of
$ \bar{\sigma} $ using$ \begin{array}{*{20}{l}} \begin{aligned} (\Delta \sigma)^{2} = (\sum_{ij} (C^{-1})_{ij})^{-1}. \end{aligned} \end{array} $

(7) We show the results of the combination in Fig. 3 and Table 1.
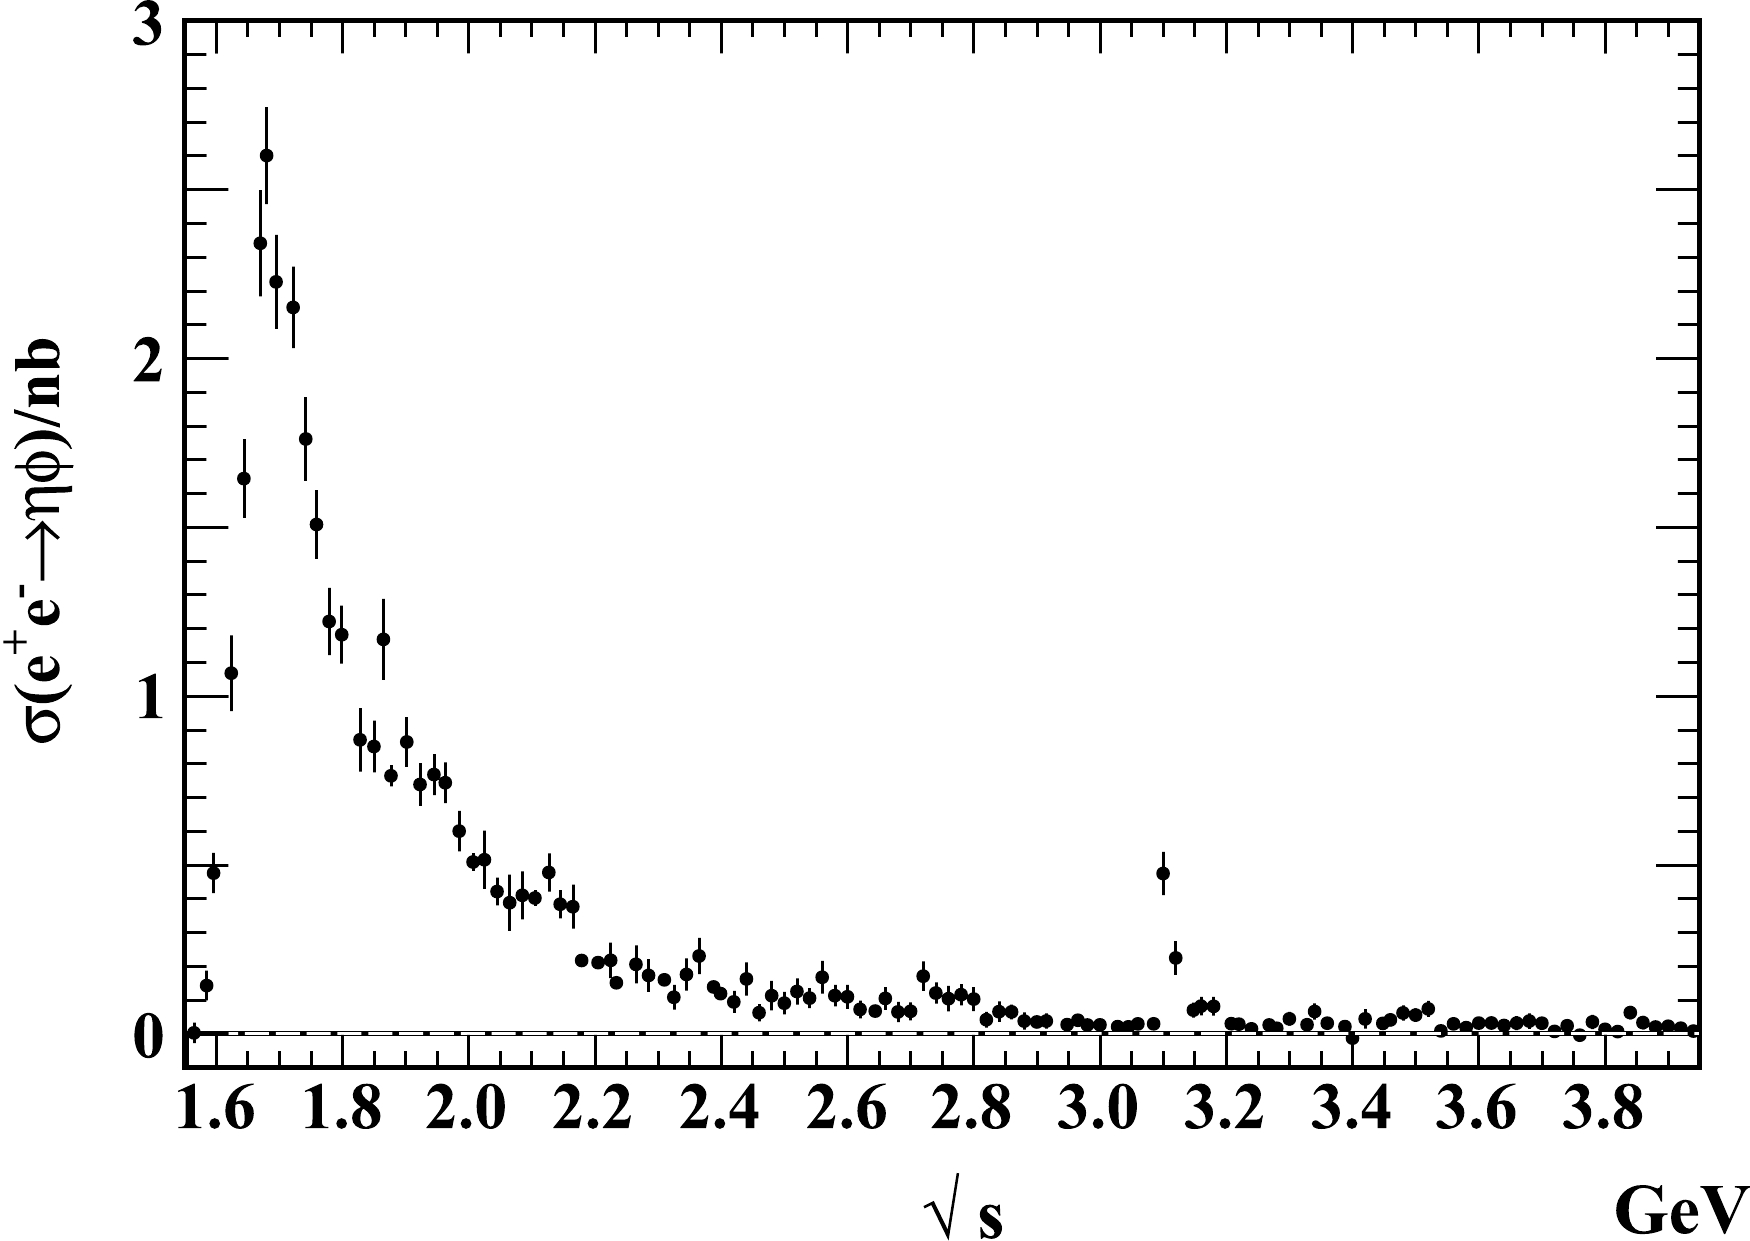
Figure 3. Cross section of
$ e^+e^- \to \eta\phi $ from the combination of the measurements by the BaBar, Belle, BESIII, and CMD-3 experiments.$ \sqrt s $ 

$ \sigma(e^+e^-\to\eta\phi) $ 

$ \sqrt s $ 

$ \sigma(e^+e^-\to\eta\phi) $ 

$ \sqrt s $ 

$ \sigma(e^+e^-\to\eta\phi) $ 

$ \sqrt s $ 

$ \sigma(e^+e^-\to\eta\phi) $ 

1.565 $ 3\pm 30\pm 1 $ 

2.165 $ 376\pm 65\pm 22 $ 

2.76 $ 104\pm 38\pm 5 $ 

3.36 $ 31\pm 18\pm 2 $ 

1.585 $ 143\pm 44\pm 4 $ 

2.179 $ 217\pm 17\pm 10 $ 

2.78 $ 116\pm 31\pm 7 $ 

3.388 $ 21\pm 15\pm 2 $ 

1.596 $ 476\pm 60\pm 11 $ 

2.205 $ 211\pm 15\pm 8 $ 

2.80 $ 103\pm 36\pm 5 $ 

3.40 $ -13\pm 8\pm 1 $ 

1.624 $ 1068\pm 112\pm 36 $ 

2.225 $ 218\pm 53\pm 8 $ 

2.82 $ 42\pm 23\pm 1 $ 

3.42 $ 44\pm 29\pm 3 $ 

1.644 $ 1644\pm 117\pm 53 $ 

2.234 $ 15\pm 13\pm 7 $ 

2.84 $ 65\pm 30\pm 3 $ 

3.448 $ 31\pm 12\pm 1 $ 

1.67 $ 2341\pm 157\pm 90 $ 

2.265 $ 206\pm 56\pm 11 $ 

2.86 $ 65\pm 22\pm 3 $ 

3.46 $ 41\pm 19\pm 2 $ 

1.68 $ 2600\pm 144\pm 76 $ 

2.285 $ 173\pm 48\pm 7 $ 

2.88 $ 38\pm 26\pm 2 $ 

3.48 $ 62\pm 22\pm 3 $ 

1.695 $ 2226\pm 139\pm 62 $ 

2.31 $ 160\pm 11\pm 6 $ 

2.90 $ 35\pm 2\pm 2 $ 

3.50 $ 55\pm 20\pm 3 $ 

1.722 $ 2151\pm 121\pm 59 $ 

2.325 $ 108\pm 37\pm 5 $ 

2.915 $ 38\pm 22\pm 3 $ 

3.52 $ 74\pm 24\pm 4 $ 

1.742 $ 1761\pm 124\pm 48 $ 

2.345 $ 176\pm 48\pm 9 $ 

2.948 $ 27\pm 5\pm 1 $ 

3.54 $ 8\pm 12\pm 7 $ 

1.759 $ 1508\pm 102\pm 40 $ 

2.365 $ 230\pm 54 \pm 10 $ 

2.965 $ 40\pm 16\pm 4 $ 

3.56 $ 29\pm 14\pm 1 $ 

1.779 $ 1221\pm 100\pm 34 $ 

2.388 $ 139\pm 10 \pm 5 $ 

2.98 $ 26\pm 5\pm 1 $ 

3.58 $ 18\pm 13\pm 3 $ 

1.799 $ 1182\pm 86\pm 29 $ 

2.399 $ 119\pm 5\pm 5 $ 

3.00 $ 26\pm 5\pm 1 $ 

3.60 $ 32\pm 14\pm 1 $ 

1.828 $ 870\pm 94\pm 24 $ 

2.42 $ 94\pm 33\pm 7 $ 

3.028 $ 21\pm 4\pm 2 $ 

3.62 $ 32\pm 19\pm 1 $ 

1.85 $ 851\pm 76\pm 24 $ 

2.44 $ 162\pm 49\pm 8 $ 

3.045 $ 21\pm 4\pm 1 $ 

3.64 $ 25\pm 18\pm 1 $ 

1.865 $ 1168\pm 120\pm 35 $ 

2.46 $ 62\pm 26\pm 8 $ 

3.06 $ 29\pm 5\pm 1 $ 

3.66 $ 32\pm 21\pm 2 $ 

1.877 $ 764\pm 32\pm 12 $ 

2.48 $ 113\pm 44 \pm 6 $ 

3.085 $ 29\pm 2\pm 1 $ 

3.68 $ 38\pm 23\pm 2 $ 

1.902 $ 864\pm 73\pm 22 $ 

2.50 $ 91\pm 33 \pm 2 $ 

3.10 $ 475\pm 64\pm 24 $ 

3.70 $ 31\pm 18\pm 2 $ 

1.923 $ 738\pm 63\pm 19 $ 

2.52 $ 125\pm 39 \pm 4 $ 

3.12 $ 224\pm 50\pm 10 $ 

3.72 $ 7\pm 9\pm 1 $ 

1.945 $ 768\pm 61\pm 21 $ 

2.54 $ 106\pm 29 \pm 6 $ 

3.148 $ 70\pm 22\pm 3 $ 

3.74 $ 24\pm 12\pm 1 $ 

1.963 $ 743\pm 60\pm 19 $ 

2.56 $ 167\pm 49 \pm 9 $ 

3.16 $ 82\pm 28\pm 4 $ 

3.76 $ -4\pm 6\pm 1 $ 

1.985 $ 600\pm 60\pm 16 $ 

2.58 $ 113\pm 32\pm 5 $ 

3.18 $ 81\pm 28\pm 4 $ 

3.78 $ 35\pm 21\pm 3 $ 

2.007 $ 509\pm 26\pm 12 $ 

2.60 $ 110\pm 36\pm 5 $ 

3.208 $ 30\pm 13\pm 2 $ 

3.80 $ 13\pm 10\pm 1 $ 

2.025 $ 515\pm 86\pm 26 $ 

2.62 $ 72\pm 26\pm 2 $ 

3.22 $ 28\pm 16\pm 2 $ 

3.82 $ 6\pm 9\pm 1 $ 

2.045 $ 421\pm 41\pm 15 $ 

2.644 $ 67\pm 5\pm 3 $ 

3.24 $ 15\pm 16\pm 3 $ 

3.84 $ 63\pm 20\pm 3 $ 

2.065 $ 388\pm 83\pm 29 $ 

2.66 $ 105 \pm 34\pm 5 $ 

3.268 $ 26\pm 12\pm 1 $ 

3.86 $ 33\pm 20\pm 2 $ 

2.085 $ 410\pm 71\pm 20 $ 

2.68 $ 65\pm 30\pm 3 $ 

3.28 $ 16\pm 18\pm 1 $ 

3.88 $ 20\pm 11\pm 1 $ 

2.105 $ 402\pm 24\pm 14 $ 

2.70 $ 67\pm 27\pm 3 $ 

3.30 $ 44\pm 20\pm 2 $ 

3.90 $ 22\pm 11\pm 1 $ 

2.127 $ 478\pm 57\pm 12 $ 

2.72 $ 171\pm 44\pm 8 $ 

3.328 $ 27\pm 15\pm 2 $ 

3.92 $ 17\pm 10\pm 1 $ 

2.145 $ 384\pm 42\pm 12 $ 

2.74 $ 121\pm 32\pm 7 $ 

3.34 $ 66\pm 24\pm 3 $ 

3.94 $ 8\pm 13\pm 1 $ 

Table 1. Cross section of
$ e^+e^-\to\eta\phi $ versus$ \sqrt s $ calculated with the measurements from the BaBar, Belle, BESIII, and CMD-3 experiments. The first errors are statistical and the second ones are systematic. -
$ \phi(1680) $ ,$ X(1750) $ , and$ \phi(2170) $ may exist in the$ e^+e^-\to\eta\phi $ process. We perform combined fits to$ \sigma(e^+e^-\to\eta\phi) $ measured by the BaBar, Belle, BESIII and CMD-3 experiments and shown in Fig. 1. The fit range is from the threshold to$ 2.85\; {{\rm{GeV}}}/c^2 $ . Assuming there are$ \phi(1680) $ ,$ X(1750) $ , and$ \phi(2170) $ components and a non-resonant contribution in the$ \eta\phi $ final state, we take the parameterization of$ \sigma(e^+e^-\to\eta\phi) $ similar to that used in the BaBar analysis [5]:$ \begin{aligned}[b] \sigma( e^+e^-\to\eta\phi)(\sqrt s) =& 12\pi\mathcal{P}_{\eta\phi}(\sqrt s)|A_{\eta\phi}^{n.r.}(\sqrt s)\\&+ A_{\eta\phi}^{ \phi(1680)}(\sqrt s) + A_{\eta\phi}^{X(1750)}(\sqrt s) \\&+ A_{\eta\phi}^{ \phi(2170)}(\sqrt s) |^2, \end{aligned} $

(8) where
$ \mathcal{P}_{\eta\phi} $ is the phase space of the$ \eta\phi $ final state, the non-resonant amplitude takes the form$ A_{\eta\phi}^{n.r.}(\sqrt s) = a_{0}/s^{a_{1}} $ , and$ A_{\eta\phi}^{ \phi(1680)} $ ,$ A_{\eta\phi}^{X(1750)} $ , and$ A_{\eta\phi}^{ \phi(2170)} $ are the amplitudes of$ \phi(1680) $ ,$ X(1750) $ , and$ \phi(2170) $ , respectively.For
$ A_{\eta\phi}^{ \phi(1680)} $ and$ A_{\eta\phi}^{X(1750)} $ , we describe the form with a Breit-Wigner (BW) function,$ \begin{array}{*{20}{l}} A^{\eta\phi}_X(\sqrt s) = \sqrt{ {\cal B}^{\eta\phi}_{X}\Gamma^{ e^+e^-}_{X}}\cdot \dfrac{ \sqrt{\Gamma_X/ \mathcal{P}_{\eta\phi}(M_X)}\cdot {\rm e}^{{\rm i}\theta_{X}}}{M_{X}^2 - s - {\rm i}\sqrt s\Gamma_{X}(\sqrt s)}, \end{array} $

(9) where X is
$ \phi(1680) $ or$ X(1750) $ , the resonant parameters$ M_X $ ,$ \Gamma_X $ , and$ \Gamma_X^{ e^+e^-} $ are the mass, total width, and partial width to$ e^+e^- $ , respectively,$ {\cal B}_X^{\eta\phi} $ is the branching fraction of$ X \to \eta\phi $ decay, and$ \theta_X $ is the relative phase.The BaBar measurement [5] shows that
$ K\bar{K}^{*}(892) $ and$ \eta\phi $ are two major decays of$ \phi(1680) $ and$ {\cal B}^{ K\bar{K}^{*}(892)}_{ \phi(1680)} \approx 3 \times {\cal B}^{\eta\phi}_{ \phi(1680)} $ , where$ {\cal B}^{ K\bar{K}^{*}(892)}_{ \phi(1680)} $ is the branching fraction of the$ \phi(1680) \to K\bar{K}^{*}(892) $ decay. We also take the same form as in Ref. [5]:$ \begin{aligned}[b] \Gamma_{ \phi(1680)}(\sqrt s) = & \Gamma_{ \phi(1680)}\cdot \Bigg[\frac{\mathcal{P}_{KK^{*}(892)}(\sqrt s)}{\mathcal{P}_{ K\bar{K}^{*}(892)}(M_{ \phi(1680)})} {\cal B}^{ K\bar{K}^{*}(892)}_{ \phi(1680)} \\&+ \frac{\mathcal{P}_{\eta\phi}(\sqrt s)}{\mathcal{P}_{\eta\phi}(M_{ \phi(1680)})} {\cal B}^{\eta\phi}_{ \phi(1680)} \\ & + (1- {\cal B}^{\eta\phi}_{ \phi(1680)}- {\cal B}^{ K\bar{K}^{*}(892)}_{ \phi(1680)})\Bigg]. \end{aligned} $

(10) Here,
$ \mathcal{P}_{ K\bar{K}^{*}(892)} $ is the phase space of the$\phi(1680)\to K\bar{K}^{*}(892)$ decay. The other decays of$ \phi(1680) $ are neglected, and their phase space dependence are correspondingly ignored. Because both the$ K\bar{K}^{*}(892) $ and$ \eta\phi $ final states contain a vector meson (V) and pseudoscalar meson (P), the phase space takes the form$ \mathcal{P}_{VP}(\sqrt s)=\Bigg[\frac{(s + M^2_V - M^2_P)^2 - 4 s M^2_V} s\Bigg]^{3/2}. $

(11) We take the same form of
$ X(1750) $ as in the BESIII measurement [14]:$ \Gamma_{X(1750)}(\sqrt s) = \Gamma_{X(1750)}\cdot \frac{M_{X(1750)}^2}{s} \cdot \left[\frac{p(\sqrt s)}{p(M_{X(1750)})}\right]^{2l+1}, $

(12) where
$ p(\sqrt s) $ [$ p(M_{X(1750)}) $ ] is the momentum of a daughter particle in the rest frame of the resonance with energy$ \sqrt s $ (mass$ M_{X(1750)} $ ), and l is the orbital angular momentum of the daughter particle.We describe the amplitude of the
$ \phi(2170)\to\eta\phi $ decay as in Ref. [7]:$ \begin{aligned}[b] A_{\eta\phi}^{ \phi(2170)}(s) =& \sqrt{ {\cal B}^{\eta\phi}_{ \phi(2170)}\Gamma^{ e^+e^-}_{ \phi(2170)}}\\&\cdot \frac{\sqrt{\Gamma_{ \phi(2170)}/\mathcal{P}_{\eta\phi}[M_{ \phi(2170)}]} \cdot {\rm e}^{{\rm i}\theta_{ \phi(2170)}}}{M^2_{ \phi(2170)} - s - {\rm i}\sqrt s\Gamma_{ \phi(2170)}} \cdot\frac{B(p)}{B(p')}, \end{aligned} $

(13) where
$ M_{ \phi(2170)} $ and$ \Gamma_{ \phi(2170)} $ are the mass and width of$ \phi(2170) $ ,$ B(p) $ is the P-wave Blatt-Weisskopf form factor, and p ($ p' $ ) is the breakup momentum corresponding to$ \sqrt s $ (mass$ M_{ \phi(2170)} $ ). -
We perform several combined fits to
$ \sigma(e^+e^-\to\eta\phi) $ measured by BaBar, Belle, BESIII, and CMD-3. These are fits with 1) only$ \phi(1680) $ , 2)$ \phi(1680) $ and the non-resonant component, 3)$ \phi(1680) $ ,$ \phi(2170) $ , and the non-resonant component, and 4)$ \phi(1680) $ ,$ X(1750) $ ,$ \phi(2170) $ , and the non-resonant component. The input data are$ \sigma(e^+e^-\to \eta\phi) $ and the related uncertainties shown in Fig. 1. Based on the fit results, which are described below, we obtain the nominal fit results from the third case.The input data of the combined fits are the values of
$ \sigma(e^+e^-\to\eta\phi) $ measured by the BaBar, Belle, BESIII, and CMD-3 experiments, and a least$ \chi^2 $ method with MINUIT [16] is used. According to Ref. [15], we define$ \chi^2_k $ of the kth energy point as$ \begin{array}{*{20}{l}} \chi^2_k = \sum\limits_{i,j}(\Delta\sigma_{ik})(C^{-1})_{ij}(\Delta \sigma_{jk}), \end{array} $

(14) where
$ \Delta \sigma_{ik} $ ($ \Delta \sigma_{jk} $ ) is the difference between the measured value from the ith (jth) data sample and the fitted value of$ \sigma(e^+e^-\to\eta\phi) $ , and the effective global covariance matrix C is described in Eq. (6). The total$ \chi^2 $ is the sum of$ \chi^2_k $ over all energy points.In the measurement of one experiment, there may be a correlation between the two modes of η decays in one
$ \sqrt s $ bin, or a correlation between all$ \sqrt s $ bins. For the first correlation, we calculate$ \begin{array}{*{20}{l}} \chi^{\prime 2}_i = (C_{ii}^{\prime})\cdot (\sigma^{ \gamma\gamma,i}_{\rm measured} - \sigma^i_{fit})\cdot (\sigma^{ \pi^+\pi^- \pi^0,i}_{\rm measured} - \sigma^i_{fit}) \end{array} $

(15) for the ith
$ \sqrt s $ bin. Here, we also use the relative uncertainty$(\delta_i^{\rm cor\_syst})^2$ between the two modes of η decays to calculate the elements$ C_{ii}^{\prime} $ of the correlation matrix. We obtain$ \chi^{\prime 2} = \sum_i \chi^{\prime 2}_i $ for the sum of all the$ \sqrt s $ bins in one experiment. Similarly, we calculate$ \chi^{\prime \prime 2} $ for the second correlation as$ \begin{array}{*{20}{l}} \chi^{\prime \prime 2} = \sum\limits_{i,j} (C_{ij}^{\prime \prime}) \cdot (\sigma_{\rm measured}^{i} - \sigma_{fit}^i)\cdot (\sigma_{\rm measured}^{j} - \sigma_{fit}^j),\; i\ne j. \end{array} $

(16) Here, the matrix element
$C_{ij}^{\prime \prime} = \delta_{i}^{\rm cor\_syst}\cdot \delta_{j}^{\rm cor\_syst}$ is for the correlation between the ith and jth$ \sqrt s $ bins. Note that$\delta_{i}^{\rm cor\_syst}$ refers to different correlated systematic uncertainties in the calculations of$ \chi^{\prime 2} $ and$ \chi^{\prime \prime 2} $ .We add
$ \chi^{\prime 2} $ and$ \chi^{\prime \prime 2} $ to the total$ \chi^2 $ for the constraints owing to the two types of correlations in the combined fits. -
Fitting to
$ \sigma(e^+e^-\to\eta\phi) $ measured by the four experiments with only the$ A_{\eta\phi}^{ \phi(1680)}(\sqrt s) $ component in Eq. (8), we obtain reasonably good results with a quality of$ \chi^2/ndf = 381/254 $ , as illustrated in Fig. 4. Here,$ ndf $ is the number of all fitted data points minus the number of free parameters. We obtain the resonant parameters of$ \phi(1680) $ as$ M_{ \phi(1680)} = (1723 \pm 6)\; {{\rm{MeV}}}/c^2 $ ,$\Gamma_{ \phi(1680)} = (376 \pm 9) {\rm{MeV}}$ , and$ {\cal B}_{ \phi(1680)}^{\eta\phi} \Gamma^{ e^+e^-}_{ \phi(1680)} = (197 \pm 5)\; {\rm{eV}} $ . The world average values of the mass and width of$ \phi(1680) $ are$(1680\pm 20) {{\rm{MeV}}}/c^2$ and$ (150\pm 50)\; {\rm{MeV}} $ [4], respectively. We can see that the mass and width from this fit are considerably different from the world average values, which is due to the absence of several components in our fit, such as the non-resonant contribution and$ \phi(2170) $ . We also notice that the world average value of the width has a large uncertainty.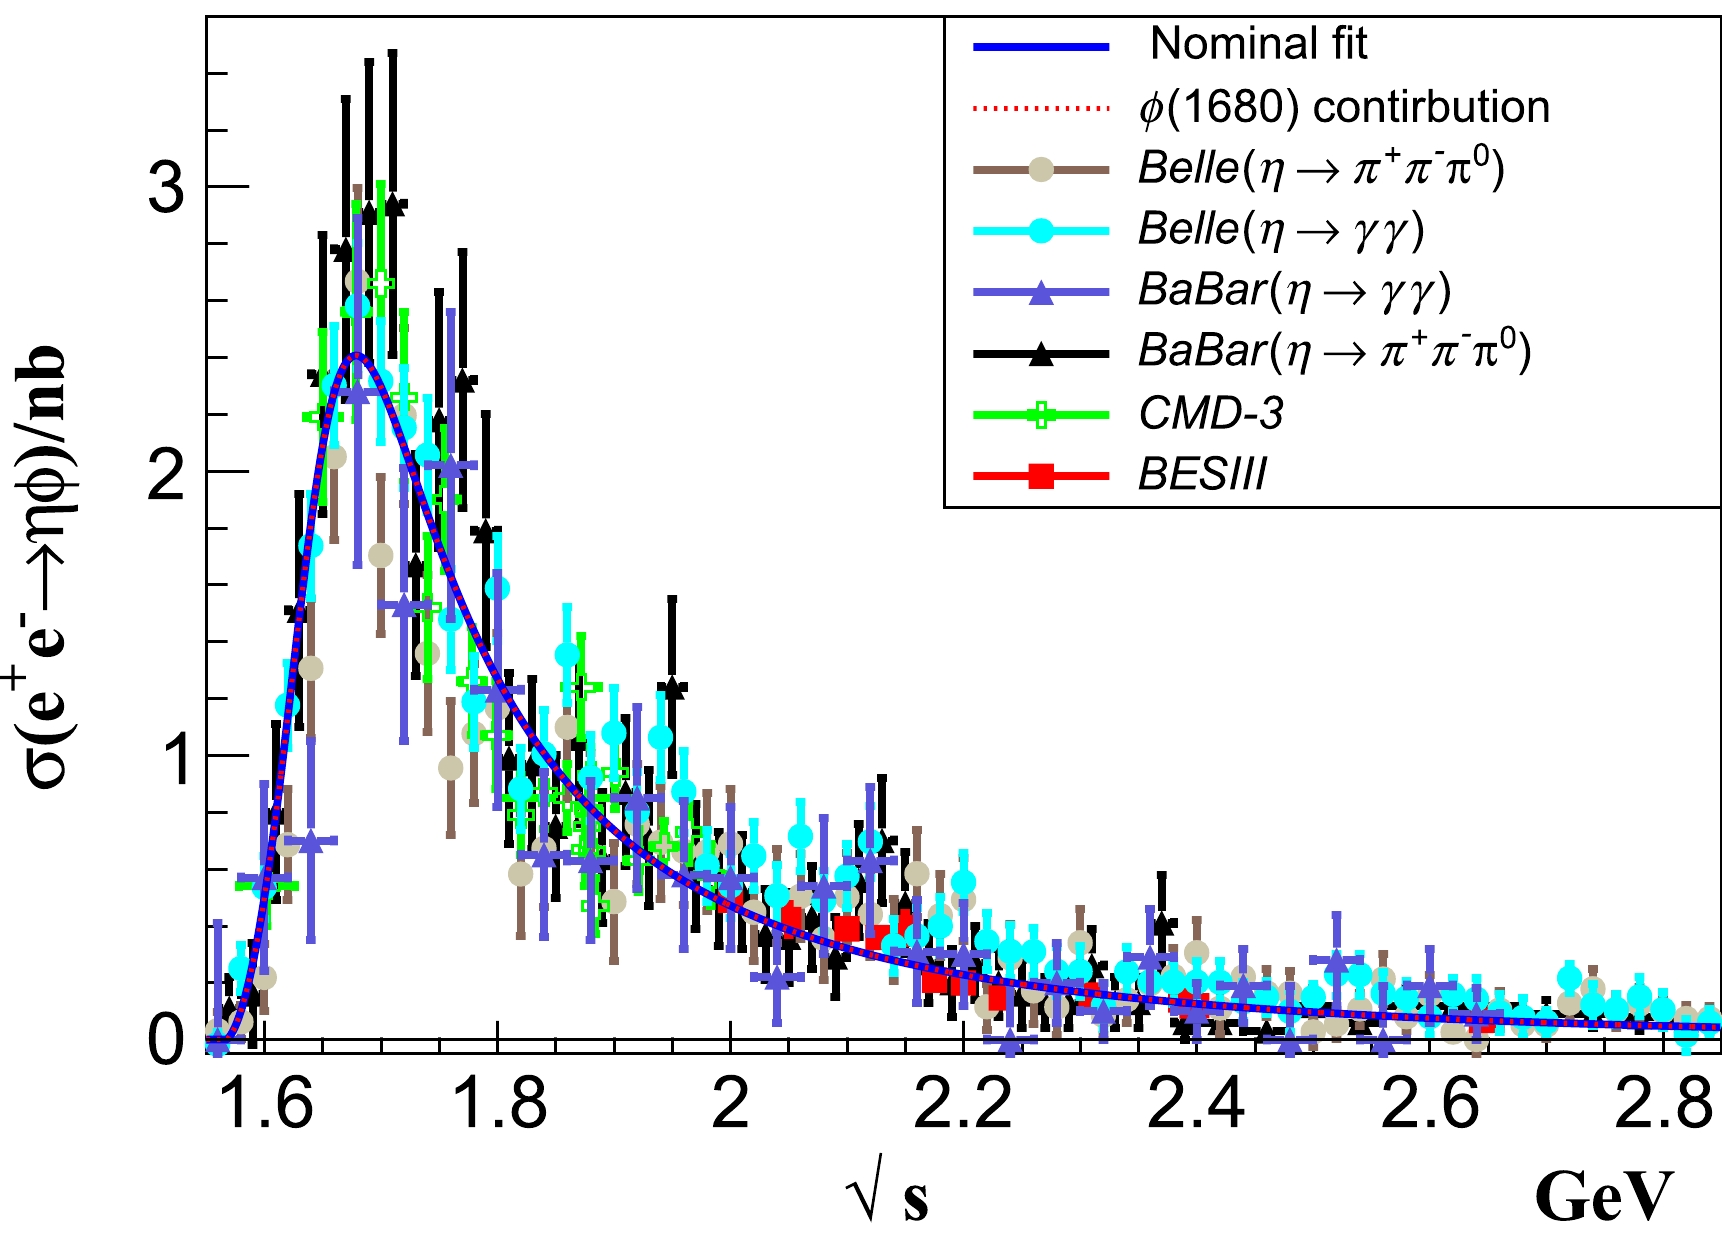
Figure 4. (color online) Results of fitting to
$ \sigma(e^+e^-\to\eta\phi) $ measured by the BaBar, Belle, BESIII, and CMD-3 experiments with only$ \phi(1680) $ . The blue solid line shows the fit results, and the red dashed line shows the$ \phi(1680) $ component. -
Fitting to
$ \sigma(e^+e^-\to\eta\phi) $ with only$ A_{\eta\phi}^{ \phi(1680)}(\sqrt s) $ and the non-resonant contribution in Eq. (8), we obtain two solutions of equivalent quality with$ \chi^2/ndf = 347/251 $ , as illustrated in Fig. 5 and Table 2. Hereinafter, we use all the measured data from the four experiments as input for the combined fits but show only the combined$ \sigma(e^+e^-\to \eta \phi) $ from Fig. 3 to represent the data in the plots. We obtain the same resonant parameters$ M_{ \phi(1680)} = (1676 \pm 3) \; {{\rm{MeV}}}/c^2 $ and$ \Gamma_{ \phi(1680)} = (161^{+5}_{-4})\; {\rm{MeV}} $ while$ {\cal B}_{ \phi(1680)}^{\eta\phi} \Gamma^{ e^+e^-}_{ \phi(1680)} = (88 \pm 3) $ eV or$ (162^{+5}_{-3})\; {\rm{eV}} $ from the two solutions. The two resonant parameters have good agreement with the world average values, and the precision is effectively improved. Meanwhile, the branching fraction of$ \phi(1680)\to\eta\phi $ is${\cal B}_{ \phi(1680)}^{\eta\phi} = (20^{+4}_{-3})\%$ or$(24\pm 3)\%$ , which is close to the value$\sim 17\%$ that can be calculated according to the BaBar measurement [6]. We can see that most of the measured$ \sigma(e^+e^-\to\eta \phi) $ from the four experiments are above the fit curve around$ 2.17\; {\rm{GeV}} $ in Fig. 5, which indicates the requirement of$ \phi(2170) $ .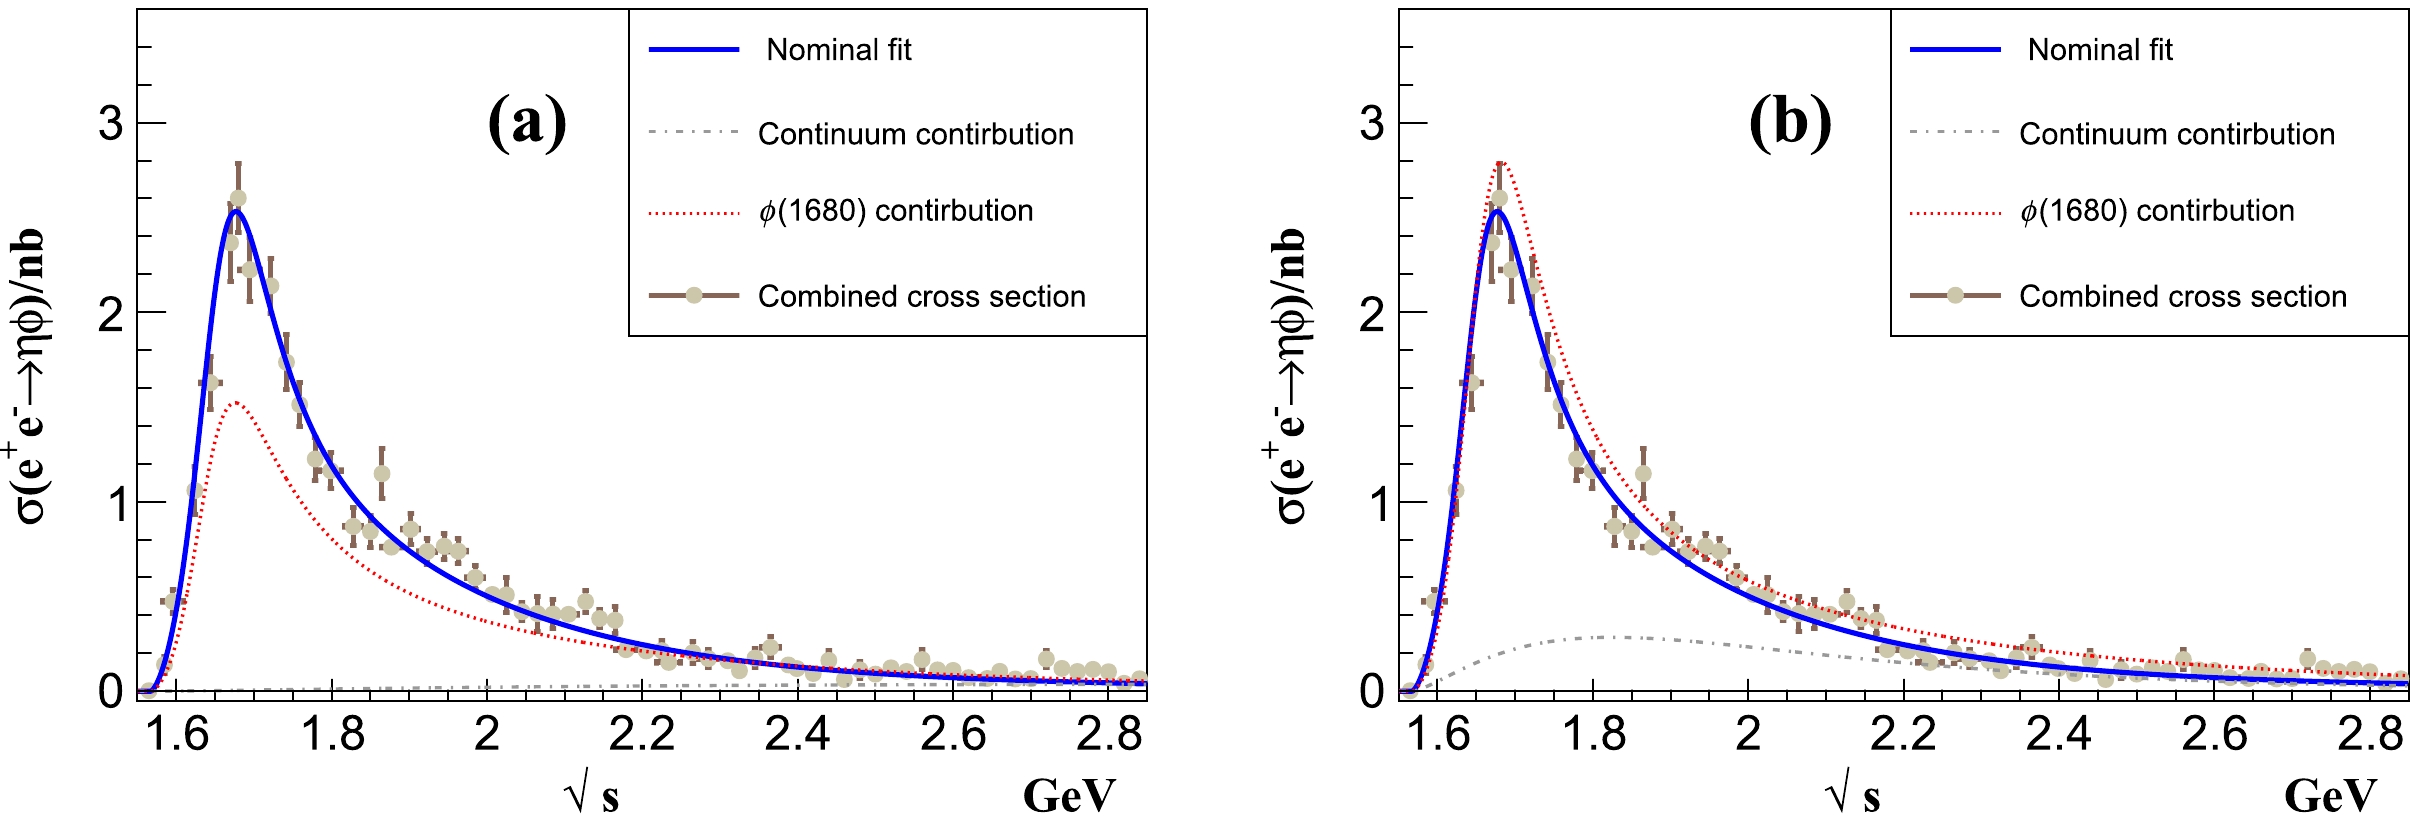
Figure 5. (color online) Fitting to
$ \sigma(e^+e^-\to\eta\phi) $ measured by the BaBar, Belle, BESIII, and CMD-3 experiments, including$ \phi(1680) $ and the non-resonant contribution. The blue solid lines show the fit results, and the red, green, and gray dashed lines show the$ \phi(1680) $ and non-resonant components. The interference between the non-resonant component and$ \phi(1680) $ is not shown.Parameters with $ \phi(2170) $ 

without $ \phi(2170) $ 

Solution I Solution II Solution III Solution IV Solution I Solution II $ \chi^2/ndf $ 

284/247 347/251 $ a_{0} $ 

$ -0.12\pm 0.02 $ 

$ 4.4\pm 0.2 $ 

$ 1.1\pm 0.2 $ 

$ -5.0\pm 0.2 $ 

$ -0.9^{+0.1}_{-0.3} $ 

$ -5.0\pm 0.3 $ 

$ a_{1} $ 

$ -4.8^{+0.2}_{-0.1} $ 

$ 2.8\pm 0.1 $ 

$ -3.1\pm 0.2 $ 

$ 2.6\pm 0.3 $ 

$ 1.0^{+0.4}_{-0.3} $ 

$ 3.0\pm 0.1 $ 

${\cal B}^{\eta\phi}_{ \phi(1680))}\Gamma^{ e^+e^-}_{ \phi(1680)} /{\rm{eV} }$ 

$ 79\pm 4 $ 

$ 127\pm 5 $ 

$ 65^{+5}_{-4} $ 

$ 215^{+8}_{-5} $ 

$ 88\pm 3 $ 

$ 162^{+5}_{-3} $ 

$M_{ \phi(1680)} /({ {\rm{MeV} } }/c^2)$ 

$ 1678^{+5}_{-3} $ 

$ 1676\pm3 $ 

$\Gamma_{ \phi(1680)}/{\rm{MeV} }$ 

$ 156\pm5 $ 

$ 161^{+5}_{-4} $ 

$ {\cal B}^{\eta\phi}_{ \phi(1680)}(\%) $ 

$ 19^{+2}_{-1} $ 

$ 22\pm 2 $ 

$ 24^{+4}_{-3} $ 

$ 19^{+2}_{-1} $ 

$ 20^{+4}_{-3} $ 

$ 24\pm 3 $ 

${\cal B}_{ \phi(2170)}^{\eta\phi}\Gamma^{ e^+e^-}_{ \phi(2170)}/{\rm{eV} }$ 

$ 0.56^{+0.03}_{-0.02} $ 

$ 0.36^{+0.05}_{-0.03} $ 

$ 38\pm 1 $ 

$ 41\pm2 $ 

− $M_{ \phi(2170)} /({ {\rm{MeV} } }/c^2)$ 

$ 2169\pm5 $ 

− $\Gamma_{ \phi(2170)} /{\rm{MeV} }$ 

$ 96^{+17}_{-14} $ 

− $\theta_{ \phi(1680)}/(^\circ)$ 

$ -63\pm12 $ 

$ -95\pm 9 $ 

$ -88\pm6 $ 

$ -122\pm7 $ 

$ 102^{+7}_{-6} $ 

$ -94^{+11}_{-6} $ 

$\theta_{ \phi(2170)}/(^\circ)$ 

$ 81^{+14}_{-9} $ 

$ -77^{+10}_{-5} $ 

$ -159^{+19}_{-15} $ 

$ 133^{+16}_{-13} $ 

− Table 2. Results of fitting to
$ \sigma(e^+e^-\to\eta\phi) $ measured by the BaBar, Belle, BESIII, and CMD-3 experiments with the non-resonant component,$ \phi(1680) $ , and$ \phi(2170) $ , or without$ \phi(2170) $ . -
With
$ A_{\eta\phi}^{ \phi(1680)} $ and$ A_{\eta\phi}^{ \phi(2170)} $ but no$ A_{\eta\phi}^{X(1750)} $ in Eq. (8), we obtain four solutions of equivalent quality with$ \chi^2/ndf = $ 284/247 from the nominal combined fit, as illustrated in Fig. 6 and Table 2. The four solutions have the same resonant parameters,$ M_{ \phi(1680)} $ ,$ \Gamma_{ \phi(1680)} $ ,$ M_{ \phi(2170)} $ , and$ \Gamma_{ \phi(2170)} $ :$ M_{ \phi(1680)} = (1678^{+5}_{-3} \pm 7)\; {{\rm{MeV}}}/c^2 $ ,$\Gamma_{ \phi(1680)} = (156 \pm 5 \pm 9) {\rm{MeV}}$ ,$ M_{ \phi(2170)} = (2169 \pm 5 \pm 6)\; {{\rm{MeV}}}/c^2 $ , and$\Gamma_{ \phi(2170)} = (96^{+17}_{-14} \pm 9)\; {\rm{MeV}}$ . We can see that the mass and width of$ \phi(2170) $ are close to the world average values:$m_{ \phi(2170)} = (2162\pm 7)\; {{\rm{MeV}}}/c^2$ and$ \Gamma_{ \phi(2170)} = (100^{+31}_{-23})\; {\rm{MeV}} $ [4]. The four solutions show that$ {\cal B}_{ \phi(1680)}^{\eta \phi} \Gamma^{ e^+e^-}_{ \phi(1680)} = (79 \pm 4 \pm 16) $ ,$ (127\pm 5 \pm 12) $ ,$ (65^{+5}_{-4}\pm 13 $ or$ (215^{+8}_{-5}\pm 11)\; {\rm{eV}} $ , and$ {\cal B}_{ \phi(2170)}^{\eta\phi} \Gamma^{ e^+e^-}_{ \phi(2170)} = (0.56^{+0.03}_{-0.02} \pm 0.07) $ ,$ (0.36 \pm 0.04 \pm 0.07) $ ,$ (38\pm 1\pm 5) $ or$ (41 \pm 2 \pm 6)\; {\rm{eV}} $ . The branching fraction of$ \phi(1680)\to\eta\phi $ is${\cal B}_{ \phi(1680)}^{\eta\phi} \approx 20\%$ , with uncertainties of less than 5%. Comparing the change of$ \Delta \chi^2 = 63 $ and$ \Delta ndf = 4 $ between the fit with and without$ \phi(2170) $ , we obtain the statistical significance of the$ \phi(2170) $ resonance to be$ 7.2\sigma $ . By fixing the mass and width of$ \phi(2170) $ at the world average values [4], we obtain the fit results listed in Table 3, with curves similar to those in Fig. 6. We then estimate the statistical significance of$ \phi(2170) $ to be$ 7.4\sigma $ . We describe the systematic uncertainties in the fit results in Sec. V.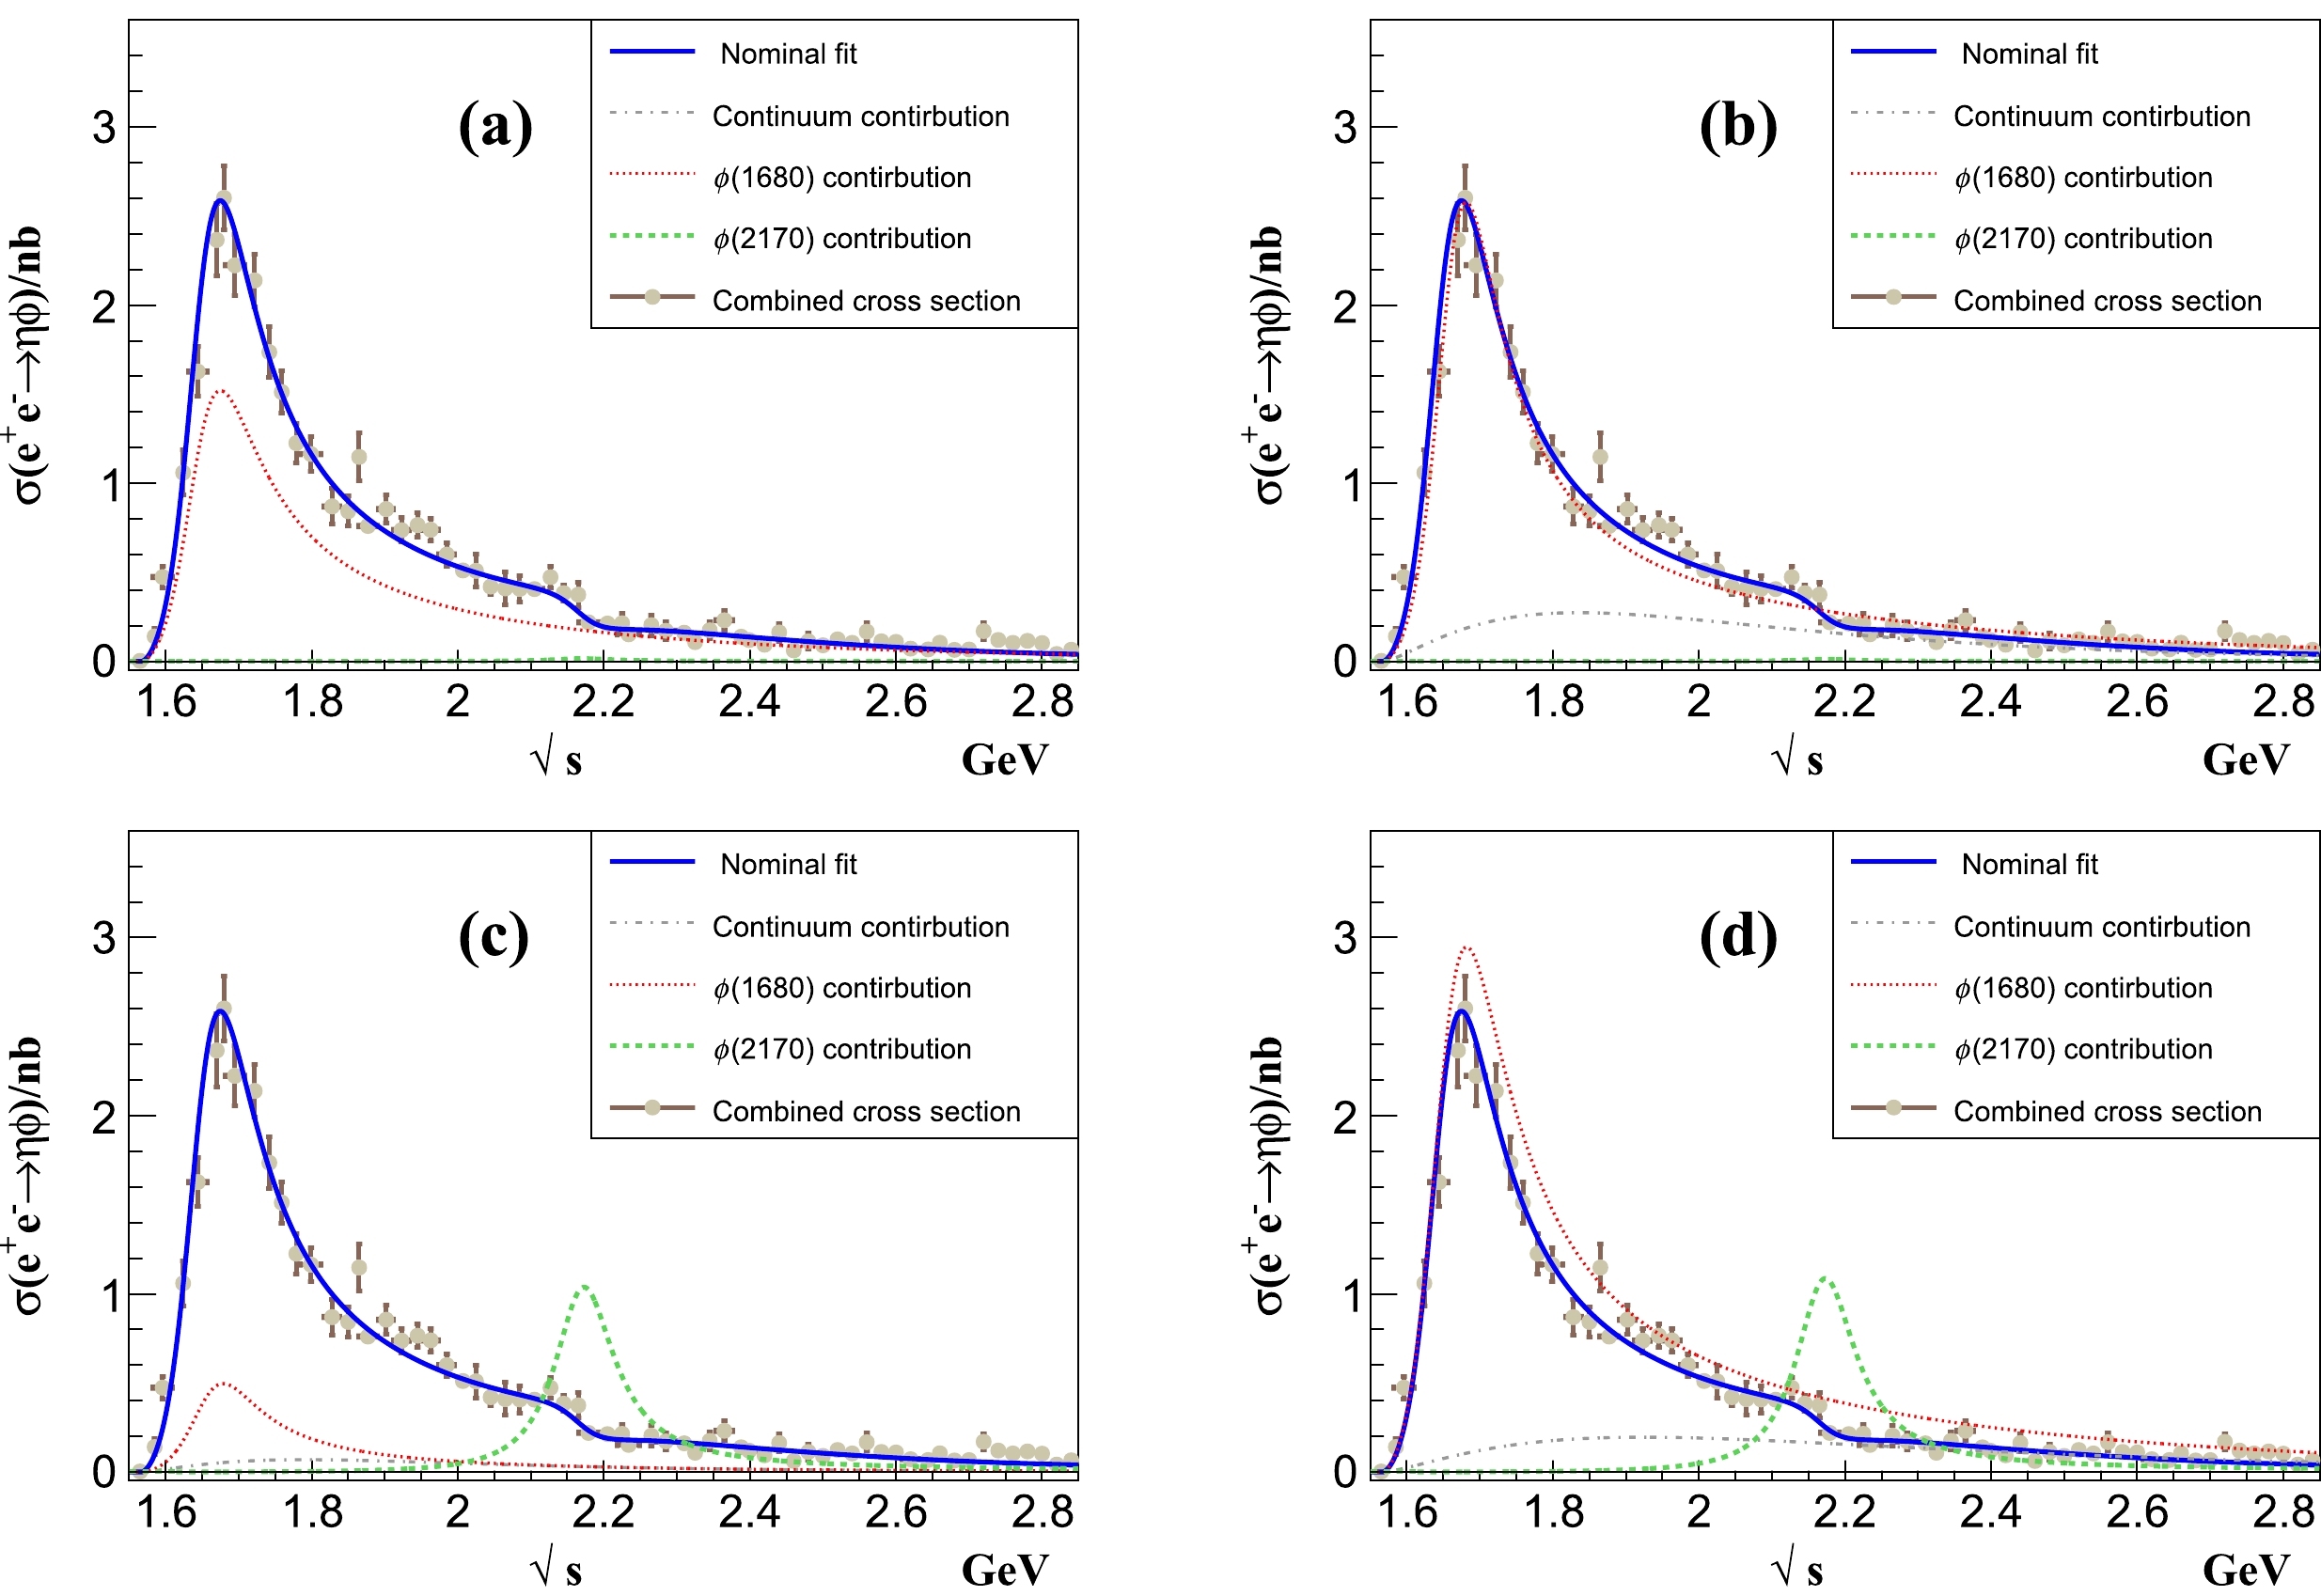
Figure 6. (color online) Nominal fit to
$ \sigma(e^+e^-\to\eta\phi) $ measured by the BaBar, Belle, BESIII, and CMD-3 experiments, including the$ \phi(1680) $ ,$ \phi(2170) $ , and non-resonant components. The blue solid lines show the fit results, and the red, green, and gray dashed lines show the$ \phi(1680) $ ,$ \phi(2170) $ , and non-resonant components, respectively. The interference among the$ \phi(1680) $ ,$ \phi(2170) $ , and non-resonant components is not shown.Parameters with $ \phi(2170) $ 

Solution I Solution II Solution III Solution IV $ \chi^2/ndf $ 

288/249 $ a_{0} $ 

$ -0.45\pm 0.05 $ 

$ 0.19\pm 0.02 $ 

$ -4.1\pm 0.2 $ 

$ -4.4\pm 0.5 $ 

$ a_{1} $ 

$ -0.27^{+0.05}_{-0.04} $ 

$ 2.8\pm 0.2 $ 

$ -0.43^{+0.08}_{-0.05} $ 

$ 2.6^{+0.5}_{-0.3} $ 

${\cal B}^{\eta\phi}_{ \phi(1680)}\Gamma^{ e^+e^-}_{ \phi(1680)}/{\rm{eV} }$ 

$ 85\pm3 $ 

$ 123^{+6}_{-4} $ 

$ 53\pm 6 $ 

$ 193^{+6}_{-5} $ 

$M_{ \phi(1680)} /({ {\rm{MeV} } }/c^2)$ 

$ 1677^{+5}_{-4} $ 

$\Gamma_{ \phi(1680)}/{\rm{MeV} }$ 

$ 158^{+5}_{-4} $ 

$ {\cal B}^{\eta\phi}_{ \phi(1680)}(\%) $ 

$ 18^{+5}_{-3} $ 

$ 22\pm5 $ 

$ 23^{+5}_{-3} $ 

$ 20\pm5 $ 

${\cal B}_{ \phi(2170)}^{\eta\phi}\Gamma^{ e^+e^-}_{ \phi(2170)}/{\rm{eV} }$ 

$ 0.48^{+0.04}_{-0.02} $ 

$ 0.37\pm 0.03 $ 

$ 38\pm 1 $ 

$ 37^{+2}_{-1} $ 

$M_{ \phi(2170)} /({ {\rm{MeV} } }/c^2)$ 

$ 2162(fixed) $ 

$\Gamma_{ \phi(2170)} /{\rm{MeV} }$ 

$ 100(fixed) $ 

$\theta_{ \phi(1680)}/(^\circ)$ 

$ 80\pm12 $ 

$ -109\pm 11 $ 

$ -88^{+12}_{-7} $ 

$ -54\pm6 $ 

$\theta_{ \phi(2170)}/(^\circ)$ 

$ -61^{+14}_{-10} $ 

$ -48^{+10}_{-8} $ 

$ -173^{+16}_{-12} $ 

$ -165\pm 9 $ 

Table 3. Results of fitting to
$ \sigma(e^+e^-\to\eta\phi) $ measured by the BaBar, Belle, BESIII, and CMD-3 experiments with the$ \phi(1680) $ ,$ \phi(2170) $ , and non-resonant components. The mass and width of$ \phi(2170) $ are fixed at the world average values [4].As discussed in Ref. [17], there are
$ 2^{n-1} $ solutions in a fit with n components in the amplitude. They have the same goodness of fit and the same mass and width of a resonance. Unfortunately, we cannot find a proliferation of the solutions as in several previous measurements [3, 18−20]. -
To investigate the production of
$ X(1750) $ in the$ e^+e^-\to\eta\phi $ process, we perform the combined fit with Eq. (8). We fix the mass and width of$ X(1750) $ at the world average values [4] and obtain eight solutions of an equivalent quality of$ \chi^2/ndf = 290/245 $ , with the same masses and widths of$ \phi(1680) $ and$ \phi(2170) $ . The fit results are listed in Table 4, and the first two solutions are shown in Fig. 7. Comparing$ \Delta\chi^2 = 6 $ and$ \Delta ndf = 2 $ in the fits with and without$ X(1750) $ , the statistical significance of$ X(1750) $ is$ 2.0\sigma $ . Because$ X(1750) $ is not significant here, we determine the upper limit (UL) of its production ($ {\cal B}_{X(1750)}^{\eta\phi}\Gamma^{ e^+e^-}_{X(1750)} $ ) in the eight solutions at the 90% C.L. by integrating the likelihood versus the$ X(1750) $ yield, as listed in Table 4.Parameters Solution I Solution II Solution III Solution IV Solution V Solution VI Solution VII Solution VIII $\chi^2/ndf$ 

290/245 $a_{0}$ 

$2.2^{+0.4}_{-0.2}$ 

$-1.2\pm 0.2$ 

$-0.15\pm 0.04$ 

$-0.12\pm 0.02$ 

$-0.62^{+0.04}_{-0.03}$ 

$0.14\pm 0.04$ 

$1.4^{+0.3}_{-0.2}$ 

$-1.2\pm 0.4$ 

$a_{1}$ 

$2.9^{+0.3}_{-0.2}$ 

$2.7\pm 0.3$ 

$0.61^{+0.04}_{-0.02}$ 

$-1.2^{+0.2}_{-0.1}$ 

$1.6\pm 0.3$ 

$0.79\pm 0.04$ 

$1.6\pm 0.2$ 

$2.5\pm 0.2$ 

$ {\cal B}^{\eta\phi}_{ \phi(1680)}\Gamma^{ e^+e^-}_{ \phi(1680)}$ /eV

$247^{+9}_{-7}$ 

$93 \pm 6$ 

$107 \pm 9$ 

$159^{+11}_{-7}$ 

$244^{+9}_{-5}$ 

$170^{+11}_{-7}$ 

$114^{+9}_{-5}$ 

$280\pm 12$ 

$M_{ \phi(1680)}$ /(MeV

$/c^2)$ 

$1680 \pm 4$ 

$\Gamma_{ \phi(1680)}$ /MeV

$147 \pm 8$ 

$ {\cal B}^{\eta\phi}_{ \phi(1680)}(\%)$ 

$19\pm 3$ 

$18\pm 3$ 

$19^{+4}_{-3}$ 

$21\pm3$ 

$22\pm 3$ 

$19\pm 3$ 

$21^{+4}_{-2}$ 

$22\pm4$ 

$ {\cal B}_{X(1750)}^{\eta\phi}\Gamma^{ e^+e^-}_{X(1750)}$ /eV

$210^{+18}_{-14}$ 

$102^{+15}_{-12}$ 

$167^{+22}_{-16}$ 

$172\pm 19 $ 

$227^{+20}_{-16}$ 

$250^{+23}_{-17}$ 

$289\pm22$ 

$102^{+18}_{-14}$ 

UL of $ {\cal B}_{X(1750)}^{\eta\phi}\Gamma^{ e^+e^-}_{X(1750)}$ /eV

249 136 197 214 269 287 322 142 $M_{X(1750)}$ /(MeV

$/c^2)$ 

1754 (fixed) $\Gamma_{X(1750)}$ /MeV

120 (fixed) $ {\cal B}_{ \phi(2170)}^{\eta\phi}\Gamma^{ e^+e^-}_{ \phi(2170)}$ /eV

$0.34 \pm 0.02$ 

$38^{+2}_{-1}$ 

$0.57 \pm 0.04$ 

$39^{+2}_{-1}$ 

$0.42 \pm 0.02$ 

$37^{+2}_{-1}$ 

$0.44^{+0.04}_{-0.02}$ 

$41\pm 2$ 

$M_{ \phi(2170)}$ /(MeV/

$c^2)$ 

$2169^{+8}_{-6}$ 

$\Gamma_{ \phi(2170)}$ /MeV

$95^{+22}_{-14}$ 

$\theta_{ \phi(1680)}/ (^\circ)$ 

$98^{+11}_{-9}$ 

$109 \pm 17$ 

$88 \pm 16$ 

$-97^{+11}_{-9}$ 

$-134 \pm 17$ 

$119 \pm 15$ 

$-125 \pm 19$ 

$-109^{+20}_{-14}$ 

$\theta_{X(1750)}/(^\circ)$ 

$-55 \pm 7$ 

$-68^{+18}_{-12}$ 

$-74 \pm 14$ 

$105^{+20}_{-14}$ 

$63 \pm 12$ 

$-59 \pm 14$ 

$108 \pm 15$ 

$131^{+18}_{-13}$ 

$\theta_{ \phi(2170))}/(^\circ)$ 

$-118 \pm 15$ 

$-94^{+16}_{-13}$ 

$-108 \pm 14$ 

$132 \pm 21$ 

$-83 \pm 17$ 

$-69^{+15}_{-11}$ 

$-127 \pm 24$ 

$-111 \pm 17$ 

Table 4. Results of fitting to
$\sigma(e^+e^-\to\eta\phi)$ measured by the BaBar, Belle, BESIII, and CMD-3 experiments with the$ \phi(1680)$ ,$X(1750)$ ,$ \phi(2170)$ , and non-resonant components. The mass and width of$X(1750)$ are fixed at the world average values [4].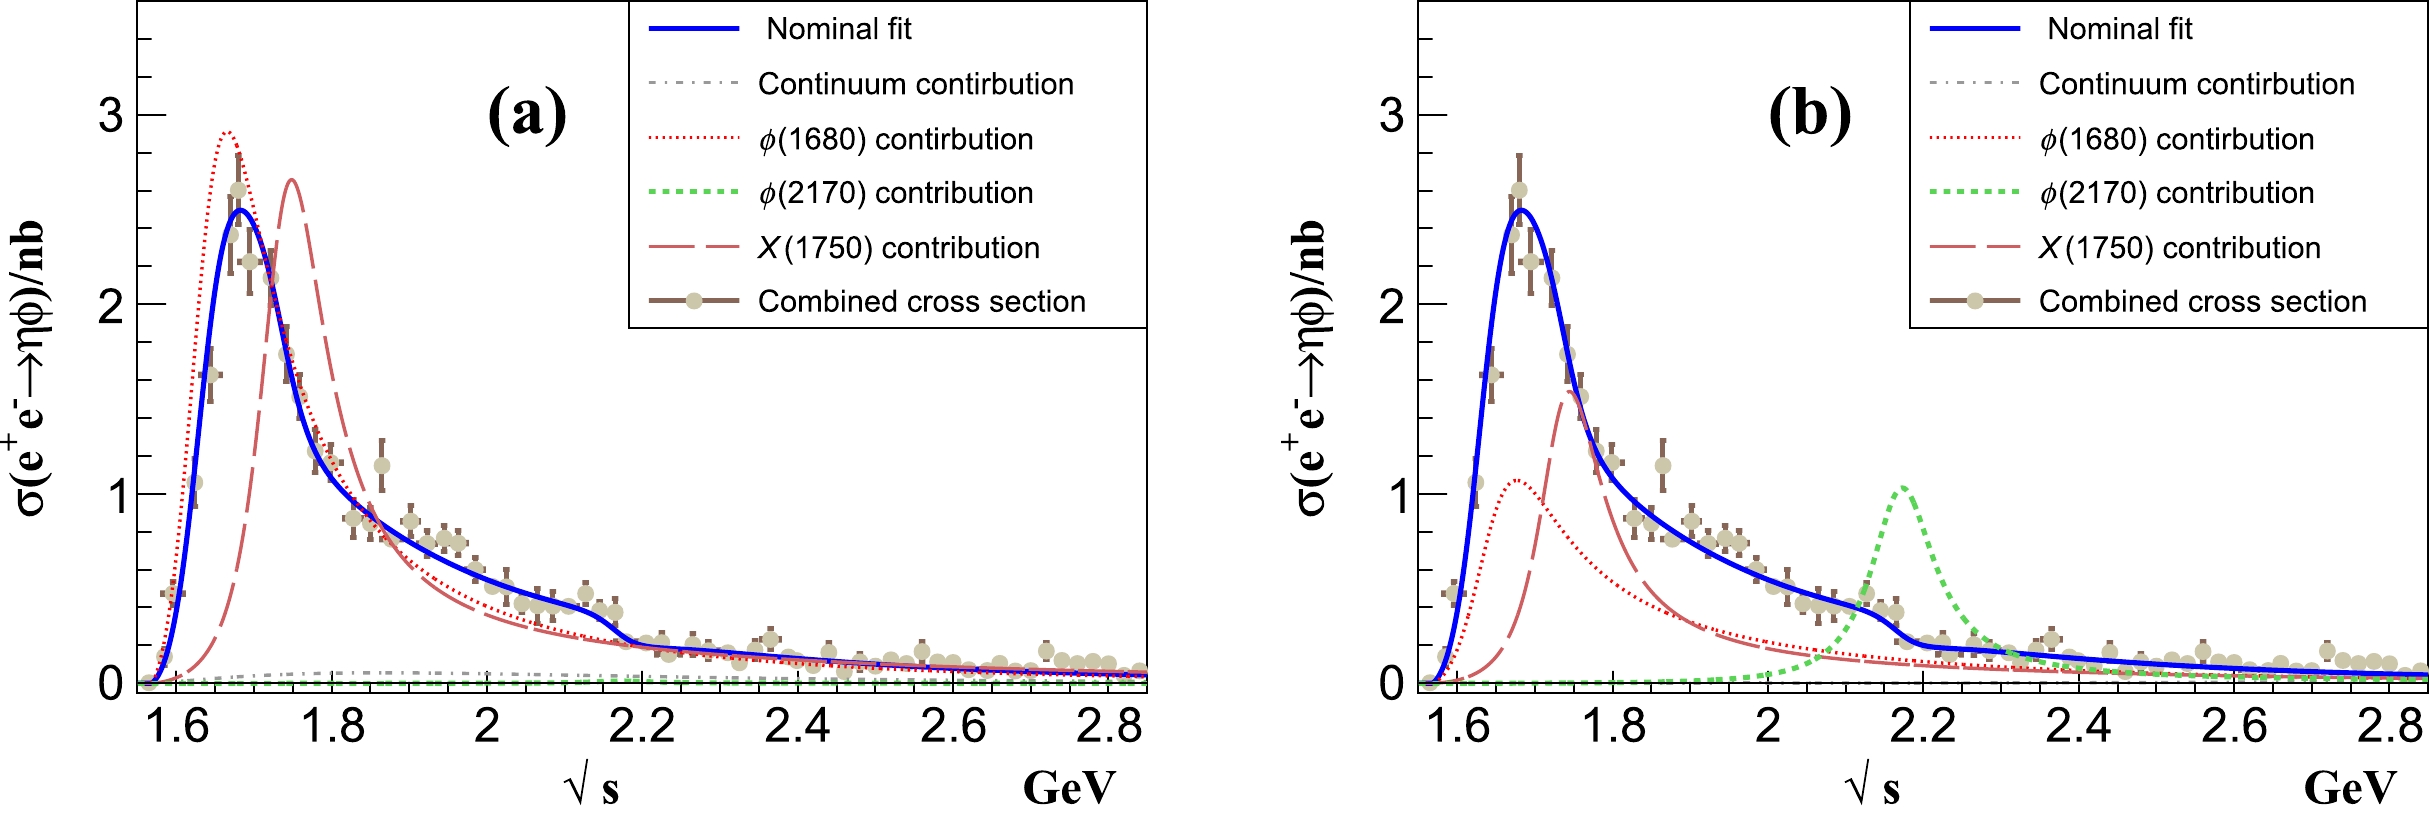
Figure 7. (color online) Two solutions from the fitting to
$ \sigma(e^+e^-\to\eta\phi) $ measured by the BaBar, Belle, BESIII, and CMD-3 experiments with$ \phi(1680) $ ,$ X(1750) $ , and$ \phi(2170) $ . The blue solid lines show the best fit results, and the red, orange, green, and gray dashed lines show the$ \phi(1680) $ ,$ X(1750) $ ,$ \phi(2170) $ , and non-resonant components, respectively. The interference among the$ \phi(1680) $ ,$ X(1750) $ ,$ \phi(2170) $ , and non-resonant components is not shown. -
We characterize the following systematic uncertainties for the nominal fit results and estimate the uncertainty of the parameterization in Eq. (9) with two different parameterization methods, which have the forms
$ A(M)\propto \frac{\sqrt{\Gamma_{ \phi(1680)}(\sqrt s)\Gamma_{ e^+e^-}}}{s-M^{2}+ {\rm i} M\Gamma_{ \phi(1680)}} $

(17) and
$ A(M)\propto \frac{M}{\sqrt s}\cdot\frac{\sqrt{\Gamma_{ \phi(1680)}(\sqrt s)\Gamma_{ e^+e^-}}}{s-M^{2}+{\rm i} M\Gamma_{ \phi(1680)}}. $

(18) By changing the fit range to
$ [1.6,\; 2.9]\; {{\rm{GeV}}}/c^2 $ , we find that the systematic uncertainty due to the fit range is negligible. We use$ A_{\eta\phi}^{n.r.}(s) = a_{0}/s $ to estimate the model dependence of the non-resonant contribution. We obtain the uncertainty in$ {\cal B}^{ K\bar{K}^{*}(892)}_{ \phi(1680)}/ {\cal B}^{\eta\phi}_{ \phi(1680)} $ by varying$ 1\sigma $ according to the previous measurement [5]. To estimate the uncertainty due to the possible contribution from$\phi(1680)\to \phi\pi\pi$ , we take${\cal B}(\phi(1680)\to \phi\pi\pi) = {\cal B}(\phi(1680) \to \phi\eta)/2$ [3] and modify Eq. (10) to$ \begin{aligned}[b] \Gamma_{ \phi(1680)}(\sqrt s) = \Gamma_{ \phi(1680)}\cdot \Bigg[\frac{\mathcal{P}_{KK^{*}(892)}(\sqrt s)}{\mathcal{P}_{ K\bar{K}^{*}(892)}(M_{ \phi(1680)})} {\cal B}^{ K\bar{K}^{*}(892)}_{ \phi(1680)} \end{aligned} $

$ \begin{aligned}[b] &+ \frac{\mathcal{P}_{\eta\phi}(\sqrt s)}{\mathcal{P}_{\eta\phi}(M_{ \phi(1680)})} {\cal B}^{\eta\phi}_{ \phi(1680)} \\ & +\frac{\mathcal{P}_{\phi\pi\pi}(\sqrt s)}{\mathcal{P}_{\phi\pi\pi}(M_{ \phi(1680)})} {\cal B}^{\phi\pi\pi}_{ \phi(1680)} \\&+ \Bigg(1- {\cal B}^{\eta\phi}_{ \phi(1680)}- {\cal B}^{\phi\pi\pi}_{ \phi(1680)}- {\cal B}^{ K\bar{K}^{*}(892)}_{ \phi(1680)}\Bigg)\Bigg] \end{aligned} $

(19) in the combined fits. Here,
$ \mathcal{P}_{\phi\pi\pi} $ is the phase space of the$ \phi(1680)\to \phi \pi\pi $ decay.Assuming all these sources are independent and summing them in quadrature, the total systematic uncertainties are listed in Table 5.
Parameter Source $A_{\eta\phi}^{n.r.}(s)$ 

$\mathcal{B}_{\phi(1680)}^{K \bar{K}^*(892)} / \mathcal{B}_{\phi(1680)}^{\eta \phi}$ 

Parameterization $\phi(1680)\to\phi\pi\pi$ 

Sum $M_{\phi(1680)}$ 

2 3 3 5 7 $\Gamma_{\phi(1680)}$ 

3 5 5 4 9 $\Gamma_{\phi(1680)}^{e^{+} e^{-}}{\cal B}_{\phi(1680)}^{\eta\phi}$ 

Sol. I 8 10 7 6 16 Sol. II 4 9 6 2 12 Sol. III 7 5 7 6 13 Sol. IV 6 5 4 7 11 ${\cal B}_{\phi(1680)}^{\eta\phi}$ 

Sol. I 0.7 0.9 1.3 1 2 Sol. II 0.5 0.9 1.2 2 4 Sol. III 0.9 1.5 1.8 2 3 Sol. IV 0.7 0.4 1.8 1 3 $M_{\phi(2170)}$ 

3 5 2 2 6 $\Gamma_{\phi(2170)}$ 

6 2 6 3 9 $\Gamma_{\phi(2170)}^{e^{+} e^{-}}{\cal B}_{\phi(2170)}^{\eta\phi}$ 

Sol. I 0.02 0.03 0.05 0.03 0.07 Sol. II 0.02 0.04 0.04 0.03 0.07 Sol. III 2 2 3 2 5 Sol. IV 3 3 4 1 6 Table 5. Systematic uncertainties of the resonance parameters for
$ \phi(1680) $ and$ \phi(2170) $ . M, Γ,$ \Gamma^{ e^+e^-} {\cal B} $ , and$ {\cal B} $ are the mass with units of$ {{\rm{MeV}}}/c^2 $ , total width with units of$ {\rm{MeV}} $ , the production of the branching fraction and the partial width to$ e^+e^- $ with units of$ {\rm{eV}} $ , and the branching fraction (%), respectively. -
Combining the measurements by the BaBar, Belle, BESIII, and CMD-3 experiments, we calculate
$ \sigma(e^+e^-\to\eta\phi) $ from the threshold to$ 3.95\; {\rm{GeV}} $ with improved precision. There are clear$ \phi(1680) $ and$ J/\psi $ signals and lineshape changes around the mass of$ \phi(2170) $ in the$ \eta\phi $ final state. We perform combined fits to$ \sigma(e^+e^-\to\eta\phi) $ measured by the four experiments and obtain the nominal fit results with the$ \phi(1680) $ ,$ \phi(2170) $ , and non-resonant components. The statistical significance of$ \phi(2170) $ is$ 7.2\sigma $ . The mass and width of$ \phi(2170) $ are$ M_{ \phi(2170)} = (2169 \pm 5 \pm 6)\; {{\rm{MeV}}}/c^2 $ and$ \Gamma_{ \phi(2170)} = (96^{+17}_{-14}\pm 9)\; {\rm{MeV}} $ , which are consistent with the world average values [4]. The mass and width of$ \phi(1680) $ are$M_{ \phi(1680)} = (1678^{+5}_{-3} \pm 7) {{\rm{MeV}}}/c^2$ and$ \Gamma_{ \phi(1680)} = (156\pm 5 \pm 9)\; {\rm{MeV}} $ , with a good precision compared with the world average values [4]. The branching fraction of the$ \phi(1680)\to\eta\phi $ decay is approximately 20%, with uncertainties of less than 6%. We also determine$ {\cal B}_{ \phi(1680)}^{\eta\phi}\Gamma^{ e^+e^-}_{ \phi(1680)} $ and$ {\cal B}_{ \phi(2170)}^{\eta\phi}\Gamma^{ e^+e^-}_{ \phi(2170)} $ from the fits. Assuming its existence in the$ e^+e^-\to\eta\phi $ process, the statistical significance of$ X(1750) $ is only$ 2.0\sigma $ . We determine the UL of$ X(1750) $ in$ e^+e^-\to\eta\phi $ at the 90% C.L. -
We thank Prof. Changzheng Yuan for very helpful discussions.
Determination of the resonant parameters of excited vector strangenia with ${\boldsymbol e^+ \boldsymbol e^-\to\boldsymbol\eta\boldsymbol\phi }$ data
- Received Date: 2023-05-23
- Available Online: 2023-11-15
Abstract: We determine the resonant parameters of the vector states


 DownLoad: