-
Many investigators have measured the cross-sections of the ((n, 2n)), (n, p), (n, α), (n, n′), (n, d), and (n, t) reactions induced by neutrons of the 14 MeV region covering all elements. A careful look at the reported values of cross-section indicates that in several cases, the associated uncertainties are large and matching is very rarely found. It is therefore imperative to update the data by remeasuring the cross-section values with a possible minimum associated uncertainty [1]. The degree of correctness of nuclear models employed to determine the nuclear cross-sections must also be confirmed using experimental results from fast neutron-induced reactions [2]. Significant efforts have been made to gather and assess the vast amount of empirical data related to neutron-induced cross-sections for various applications related to nuclear reaction theory reported in literature [3, 4]. Bromine is a member of the halogen group. It has two naturally stable isotopes, 79Br (50.65%) and 81Br (49.35%). They are medium mass number nuclei with approximately equal abundance. The experimental values of the cross-sections of bromine isotopes induced by neutrons are important in testing the nuclear model. Numerous laboratories have determined the cross-sections of bromine isotopes generated using 14 MeV neutrons [2, 5–27]. Previously reported results, however, revealed a considerable discrepancy and uncertainty (see Table 1). For example, early data on the 79Br((n, 2n))78Br reaction ranged from 710 to 1337 mb, with the maximum value being over two times the minimum value. Data for the 79Br((n, α))75As reaction also showed a difference of more than two times, ranging from 9.1 to 20 mb. The 81Br(n, p)81mSe reaction has a minimum cross-section of 8.2 mb, along with a maximum cross-section of 32 mb in the 14 MeV region for neutron energy, presenting a difference of approximately 3.8 times. Furthermore, the maximum and minimum values in literature data for the 81Br((n, α))78As reaction differ by 35 times. Several reaction cross-sections have an uncertainty of 20% to 50%. The main reason for this inconsistency arises from using poor-resolution NaI(Tl) crystal and different types of detectors, such as Geiger–Mueller tubes (GEMUC) and plastic scintillators (SCIN) in γ-spectrometers, or using inconsistent decay data. For the 79Br((n, 2n))78Br reaction, the cross-sections were estimated by Paul and Clarke (1953) [6], Grimeland et al. (1965) [8], and Minetti and Pasquarelli (1967) [9] using the beta particle counting method, Rayburn (1961) [7], Grimeland et al. (1965) [8], Cevolani and Petralia (1962) [13], Carles (1963) [14], and Pansare and Bhoraskar (1993) [16] using annihilation radiation (AR), and Zhao et al. (2009) [2], Rao et al. (1971) [5], Okumura (1967) [10], Williams (1981) [12], and Sakane et al. (2001) [17] using a 613 keV characteristic γ-ray of the 78Br product radionuclide. In fact, 613 keV γ-rays are produced not only by the 78Br nucleus but also the 78As nucleus via the 81Br((n, α))78As reaction. At the same time, the 613.7 keV characteristic γ-ray is also affected by the close energy γ-ray (616.3 keV) from 81Br((n, 2n))80m,gBr reactions. For the 81Br(n, p)81mSe reaction, Zhao et al. [2], Rao et al. [5], Minetti and Pasquarelli [9], Molla and Qaim [20], and Sakane et al. [21] measured the cross-section of this reaction with 103 keV characteristic γ-rays using HPGe, GeLi, NaI, GeLi, and HPGe detectors, respectively. The remaining experiments in literature acquired the cross-section value of identical reactions using the beta counting method. For the 81Br((n, α))78As reaction, the cross-sections were estimated by Zhao et al. (2009) [2], Rao et al. (1971) [5], Grimeland et al. (1965) [8], and Minetti and Pasquarelli (1967) [9] by employing 694.9 keV, 614 keV, 2.65 MeV, and 0.62 MeV characteristic γ-rays, respectively. According to the above discussion, the choice of a 614 keV ray is inappropriate, and γ-rays with an energy of 0.62 MeV and 2.65 MeV could not determine the activity of the daughter nucleus 78As. The remaining studies used the beta counting method to determine the 81Br((n, α))78As reaction cross-section [6, 18, 19, 22–24]. In the case of the 79Br((n, α))76As reaction, in addition to the gamma counting method used by Rao et al. [5] and Bormann et al. [26], some researchers also acquired cross-sectional measurement data by measuring beta [8, 9, 22–24].
Reaction Sample Decay data Detector Monitor reaction Neutron energy /MeV Cross section /mb Reference 79Br(n, 2n)78Br NaBr T1/2=6.4 min, Eγ=614 keV, Iγ= 13 % GeLi 27Al(n, α)24Na 14.4±0.3 741±74 [5] LiBr, NaBr T1/2=6.4 min, beta counting No information 14.5 1141±285 [6] NaBr T1/2=6.33 min, AR NaI 63Cu(n, 2n)62Cu 14.4±0.3 835±63 [7] CBr4 T1/2=6.4 min, beta counting NaI No information 14.8±0.1 1060±35 [8] CBr4 T1/2=6.4 min, AR NaI No information 14.8±0.1 1141±27 [8] CBr4 T1/2=6.4 min, beta counting NaI No information 14.7 864±45 [9] NaBr T1/2=6.46 min, Eγ=613.68 keV (Iγ= 13.6 %) HPGe 93Nb(n, 2n)92mNb 13.5±0.3
14.6±0.3710±45
912±91[2]
[2]No information HPGe 93Nb(n, 2n)92mNb 13.5±0.3
14.8±0.3714±48
919±97[11]
[11]T1/2=6.45 min, Eγ=613.6 keV (Iγ= 13.6 %) GeLi 56Fe(n, p)56Mn 14.6 1020±90 [12] Eγ=620 keV NaI No information 13.46±0.08
14.16±0.08
14.35±0.08
14.79±0.09821±18
920±30
933±15
1013±14[10] CBr4 T1/2=6.4 min, AR NaI No information 14.13±0.1 793±48 [13] T1/2=6.46 min, AR NaI 63Cu(n, 2n)62Cu 14.1 1337±167 [14] KBr T1/2=6.46 min, Eγ=613.85 keV (Iγ= 13.6 %) HPGe 27Al(n, α)24Na 13.4
14.28
14.58
14.87710±37
920±49
950±50
1024±54[17] T1/2=6.37 min NaI 63Cu(n, 2n)62Cu 14.6 942±64 [15] T1/2=6.46 min, AR NaI 27Al(n, α)24Na 14.7 1013.5±50 [16] 81Br(n, p)81mSe NaBr T1/2=57 min, Eγ=103 keV, Iγ= 12 % GeLi 27Al(n, α)24Na 14.4±0.3 13±2 [5] CBr4 T1/2=57 min, beta counting NaI No information 14.8±0.1 26±13 [8] CBr4 T1/2=57 min, Eγ=0.1 MeV NaI No information 14.7 23±5 [9] beta counting NaI 27Al(n, α)24Na 14.6 32±8 [18] NaBr T1/2=57.28 min, Eγ=103.01 keV (Iγ= 13.0 %) HPGe 93Nb(n, 2n)92mNb 13.5±0.3
14.1±0.28.2±1.2
8.55±1.0[2]
[2]KBr beta counting GEMUC 31P(n, p)31Si 14.8±0.2 16±3 [19] NaBr T1/2=57 min, Eγ=103 keV, Iγ= 10.6 % GeLi 27Al(n, α)24Na 14.7±0.3 15.3±2.0 [20] T1/2=57.28 min, Eγ=102.98 keV, Iγ= 10.7 % HPGe 27Al(n,α)24Na 13.4
13.65
14.58
14.878.6±0.9
11.1±2.0
11.6±1.4
11.6±1.4[21] T1/2=58 min, beta counting GEMUC 65Cu(n, 2n)64Cu 14.8 14.5±2 [22] 81Br(n, α)78As NaBr T1/2=90 min, Eγ=614 keV, Iγ= 42 % GeLi 27Al(n, α)24Na 14.4±0.3 19±2 [5] LiBr, NaBr T1/2=90 min, beta counting No information 14.5 103±20.6 [6] CBr4 T1/2=91 min, beta counting NaI No information 14.8±0.1 14±10 [8] CBr4 T1/2=91min, Eγ=2.65 MeV, Iγ= 14 % NaI 27Al(n, α)24Na 14.8±0.1 7±3 [8] CBr4 T1/2=91 min, Eγ=0.62 MeV NaI No information 14.7 3.2±1 [9] beta counting NaI 27Al(n, α)24Na 14.6 107±20 [18] NaBr T1/2=90.7 min, Eγ=694.9 keV (Iγ= 16.7%) HPGe 93Nb(n, 2n)92mNb 13.5±0.3
14.1±0.24.22±0.81
4.02±1.04[2]
[2]KBr beta counting GEMUC 31P(n, p)31Si 14.8±0.2 3.8±1.0 [19] T1/2=95 min, beta counting GEMUC 65Cu(n, 2n)64Cu 14.8 6.5±1.2 [22] Continued on next page Table 1. Summary of 79Br(n, 2n)78Br, 81Br(n, p)81mSe, 81Br(n, α)78As, and 79Br(n, α)76As reaction details from previous measurements.
Table 1-continued from previous page Reaction Sample Decay data Detector Monitor reaction Neutron energy /MeV Cross section /mb Reference T1/2=90 min, beta counting PROPC No information 14.7±0.2 6.6±1.4 [23] KBr beta counting PROPC 27Al(n, α)24Na 13.6±0.2
14.1±0.5
14.8±0.23.1±0.4
3.3±0.4
3.7±0.3[24] No information NaI 56Fe(n, p)56Mn 14.6 12±5 [25] 79Br(n, α)76As NaBr T1/2=26.5 h, Eγ=559 keV, Iγ= 39.2% GeLi 27Al(n, α)24Na 14.4±0.3 20±2 [5] CBr4 T1/2=26.5 h, beta counting NaI No information 14.8±0.1 20±10 [8] CBr4 T1/2=26.5 h, beta counting NaI No information 14.7 15.3±1.5 [9] NaBr T1/2=26 h, Eγ=555 keV LONGC 27Al(n, α)24Na 13.2 11.6±2.9 [26] 14.1 13±3.3 [26] 14.4 13.6±3.3 [26] KBr beta counting GEMUC 31P(n, p)31Si 14.8±0.2 12±2 [19] T1/2=26.5 h, beta counting GEMUC 65Cu(n, 2n)64Cu 14.8 17±2 [22] T1/2=27 h, beta counting PROPC No information 14.7±0.2 9.2±2.0 [23] KBr beta counting PROPC 27Al(n, α)24Na 13.6±0.2
14.1±0.5
14.8±0.210.0±0.8
9.1±0.5
10.8±0.7[24] No information NaI 56Fe(n, p)56Mn 14.6 16±5 [25] T1/2=26.8 h, No information 14.05±0.55 10.0±1.8 [27] In this research, cross-sectional measurements of the 79Br((n, 2n))78Br, 81Br(n, p)81mSe, 79Br((n, α))76As, and 81Br((n, α))78As reactions were conducted using neutron energies equivalent to 13.5, 14.1, 14.4, and 14.8 MeV. A detailed analysis of the uncertainties in the measured cross-sections was performed using the covariance analysis method. In an attempt to mitigate the impact of energy near the recorded γ-rays, a high-resolution HPGe detector was employed. The observed outcomes were compared with previously published data and the findings of the JEFF-3.3 [28], JENDL-4.0 [29], TENDL-2019 [30], and ENDF/B-VIII.0 [31] databases. Using TALYS-1.95 [32], the theoretical excitation function curve was also derived.
-
Other sources [33–35] provide detailed instructions on how to identify radioactive products and measure their cross-sections. In this paper, only the most salient features of the measurements made in this study are presented.
-
First, 0.6–0.9 g of NaBr powder (99.99% pure, natural isotopic composition, Aladdin Industrial Corporation) was placed inside a polymethyl methacrylate sample box. Four specimens (20 mm in diameter) and eight monitors (aluminium foils with Φ=20 mm, 0.3 mm thicknesses, and a purity of 99.999%, and niobium foils with Φ= 20 mm, 0.12 mm thicknesses, and a purity of 99.99%) were then combined for the irradiation studies. By weighing the sample and considering its geometry, the thicknesses of the four NaBr samples were calculated to be 0.2139, 0.2711, 0.3006, and 0.2950 g/cm2. From these four samples, a stack of NbAl-NaBr-AlNb was also created.
The neutron fluxes for the low-threshold 81Br(n, p)81mSe (Eth=0.920 MeV), 81Br((n, α))78As (Eth=0 MeV), and 79Br((n, α))76As (Eth=0 MeV) reactions were monitored by implementing the 27Al(n, α)24Na reaction (Eth = 3.249 MeV). The neutron fluxes for high-threshold 79Br((n, 2n))78Br (Eth=10.824 MeV) reactions were monitored by implementing the 93Nb(n, 2n)92mNb reaction (Eth = 8.792 MeV). Previously reported 27Al(n, α)24Na and 93Nb(n, 2n)92mNb reaction cross-sections are listed in Table 2 [36].
Table 2. Cross-sections (mb) of the 93Nb(n, 2n)92mNb, 27Al(n, α)24Na, and reference reactions at various neutron energies.
-
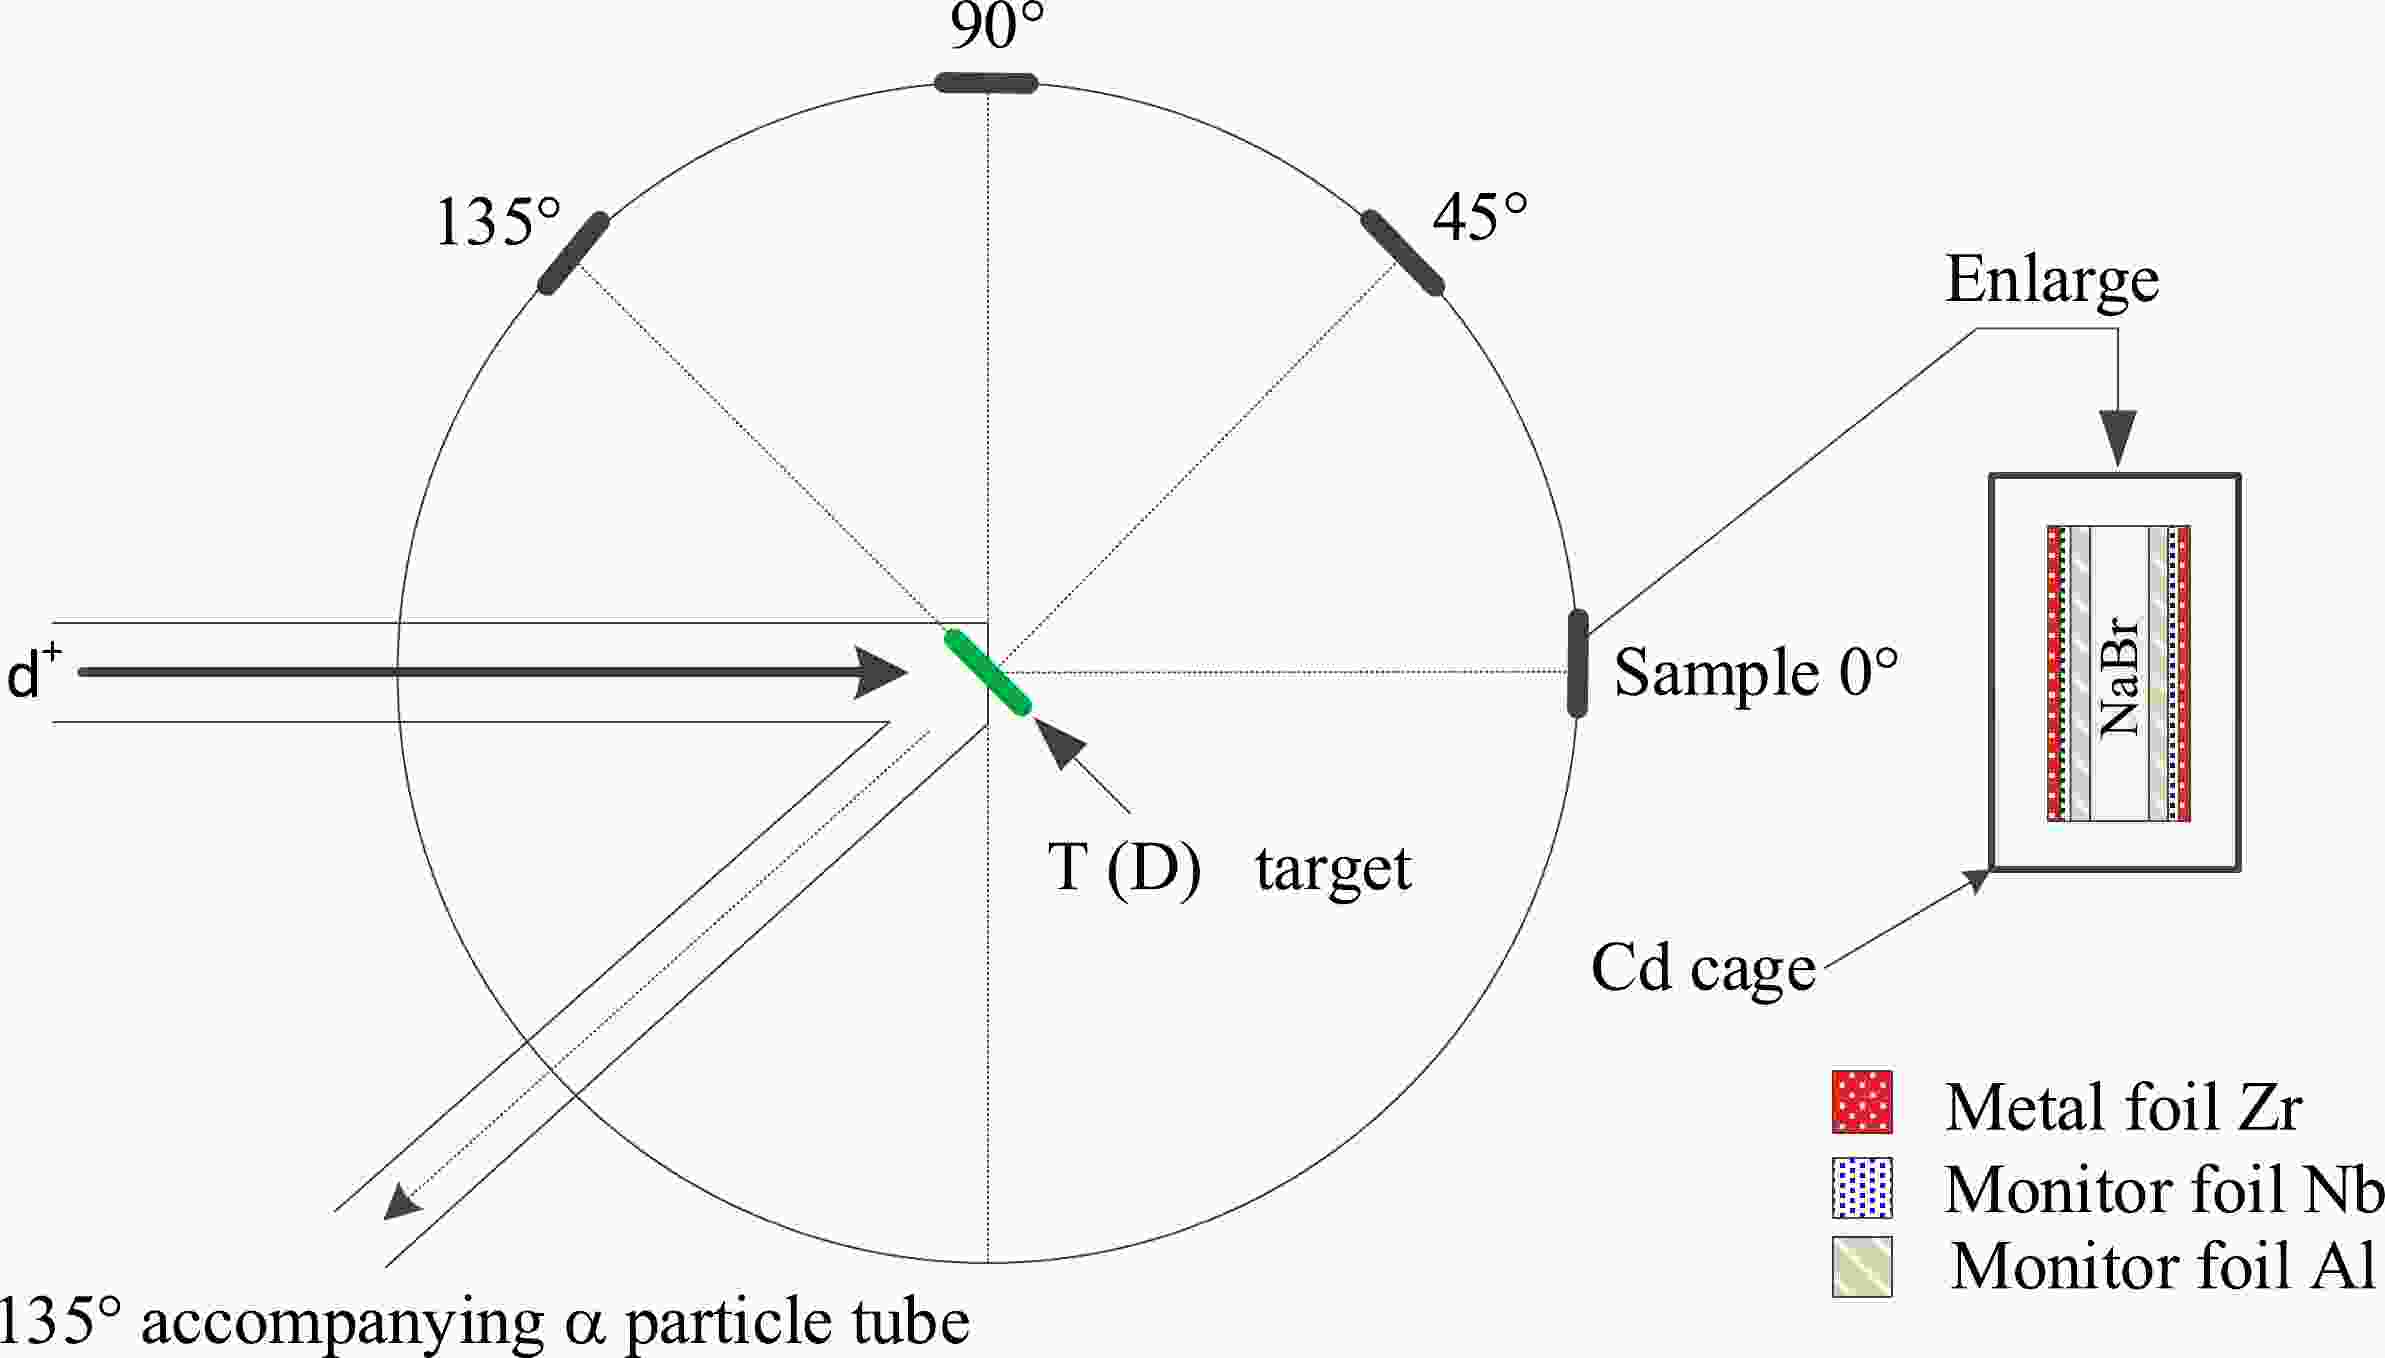
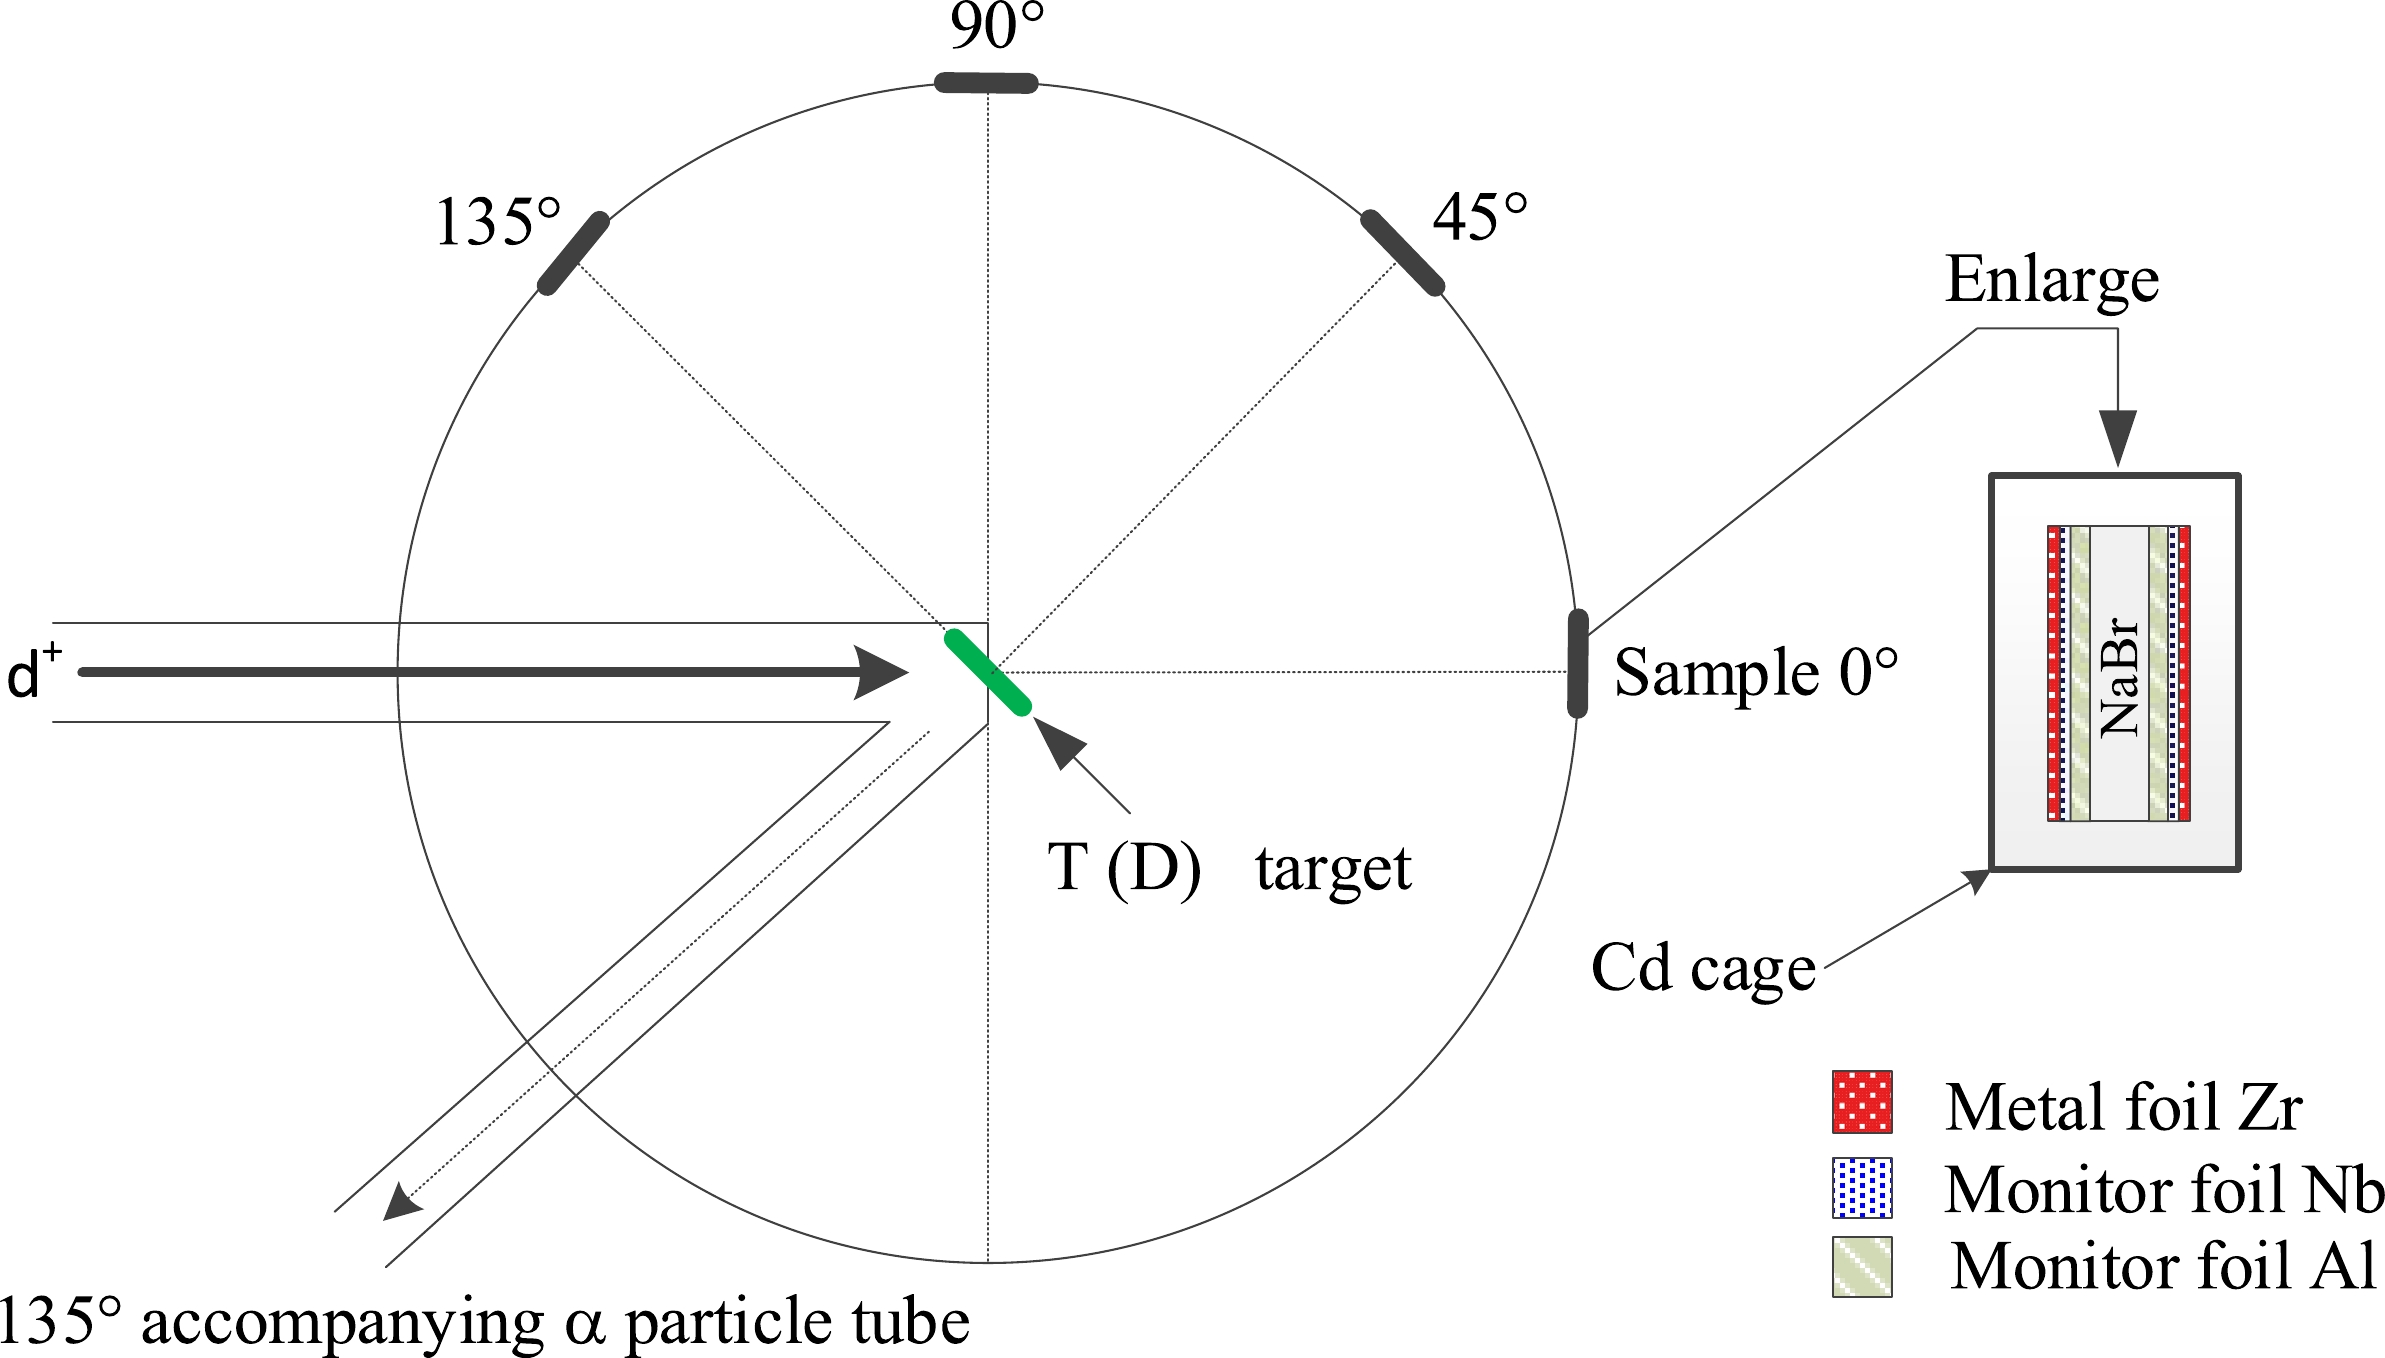
At the China Academy of Engineering Physics (CAEP), the specimens were exposed to radiation using the K-400 Neutron Generator for approximately two hours at a neutron yield of (4~5)×1010 n/s in the 4π solid angles. The thickness of the tritium-titanium (T-Ti) target was 2.65 mg/cm2. The neutrons were generated via the d+T→ 4He+n+17.6 MeV reaction while employing a beam current of 240 μA and an effective deuteron beam energy of 134 keV. The sample groups were positioned at 0º (No. 1), 45º (No. 4), 90º (No. 2), and 135º (No. 3) with respect to the direction of the deuteron beam, and the distance to the T-Ti target was approximately 50 mm (see Fig. 1).
-
Two methods were employed to ascertain the average neutron energy over the course of the irradiation tests at incidence angles of 0°, 45°, 90°, and 135°. The initial strategy made use of the cross-section ratios of the reactions of 93Nb((n, 2n))92mNb and 90Zr((n, 2n))89m+gZr [37]. Another strategy made use of the expression from our previous work [38]. The energy of these neutrons was, in order, 14.8, 14.4, 14.1, and 13.5 MeV. An uncertainty of 0.2 MeV for the neutron energy at 5 cm was assessed based on a sample evaluation and the d+ beam diameter (4 mm) [38]. This uncertainty value is consistent with the result of less than 1.5% given in Ref. [37]. Within their uncertainties, the outcomes of the two methods are comparable.
-
A low-background high-purity germanium (HPGe) detector equipped with an energy resolution of 1.69 keV (FWHM) at 1.332 MeV for 60Co and a relative efficiency of ~68% (ORTEC, model GEM 60P, crystal length of 72.3 mm, crystal diameter of 70.1 mm) was used to measure the radioactivity. The γ-rays of interest have been highlighted in the NaBr sample's typical spectra obtained in the measurement of the ground and isomeric states, which are shown in Figs. 2 and 3. There were no interfering gamma rays from Na in the NaBr sample. Table 3 presents a summary of the γ –ray, half-lives, and intensities employed in the analysis [39]. The detection efficiency of the HPGe detector was obtained using the 25 gamma lines of the standard sources 133Ba, 137Cs, 152Eu, and 226Ra. Our previously published study [40] contains additional information.
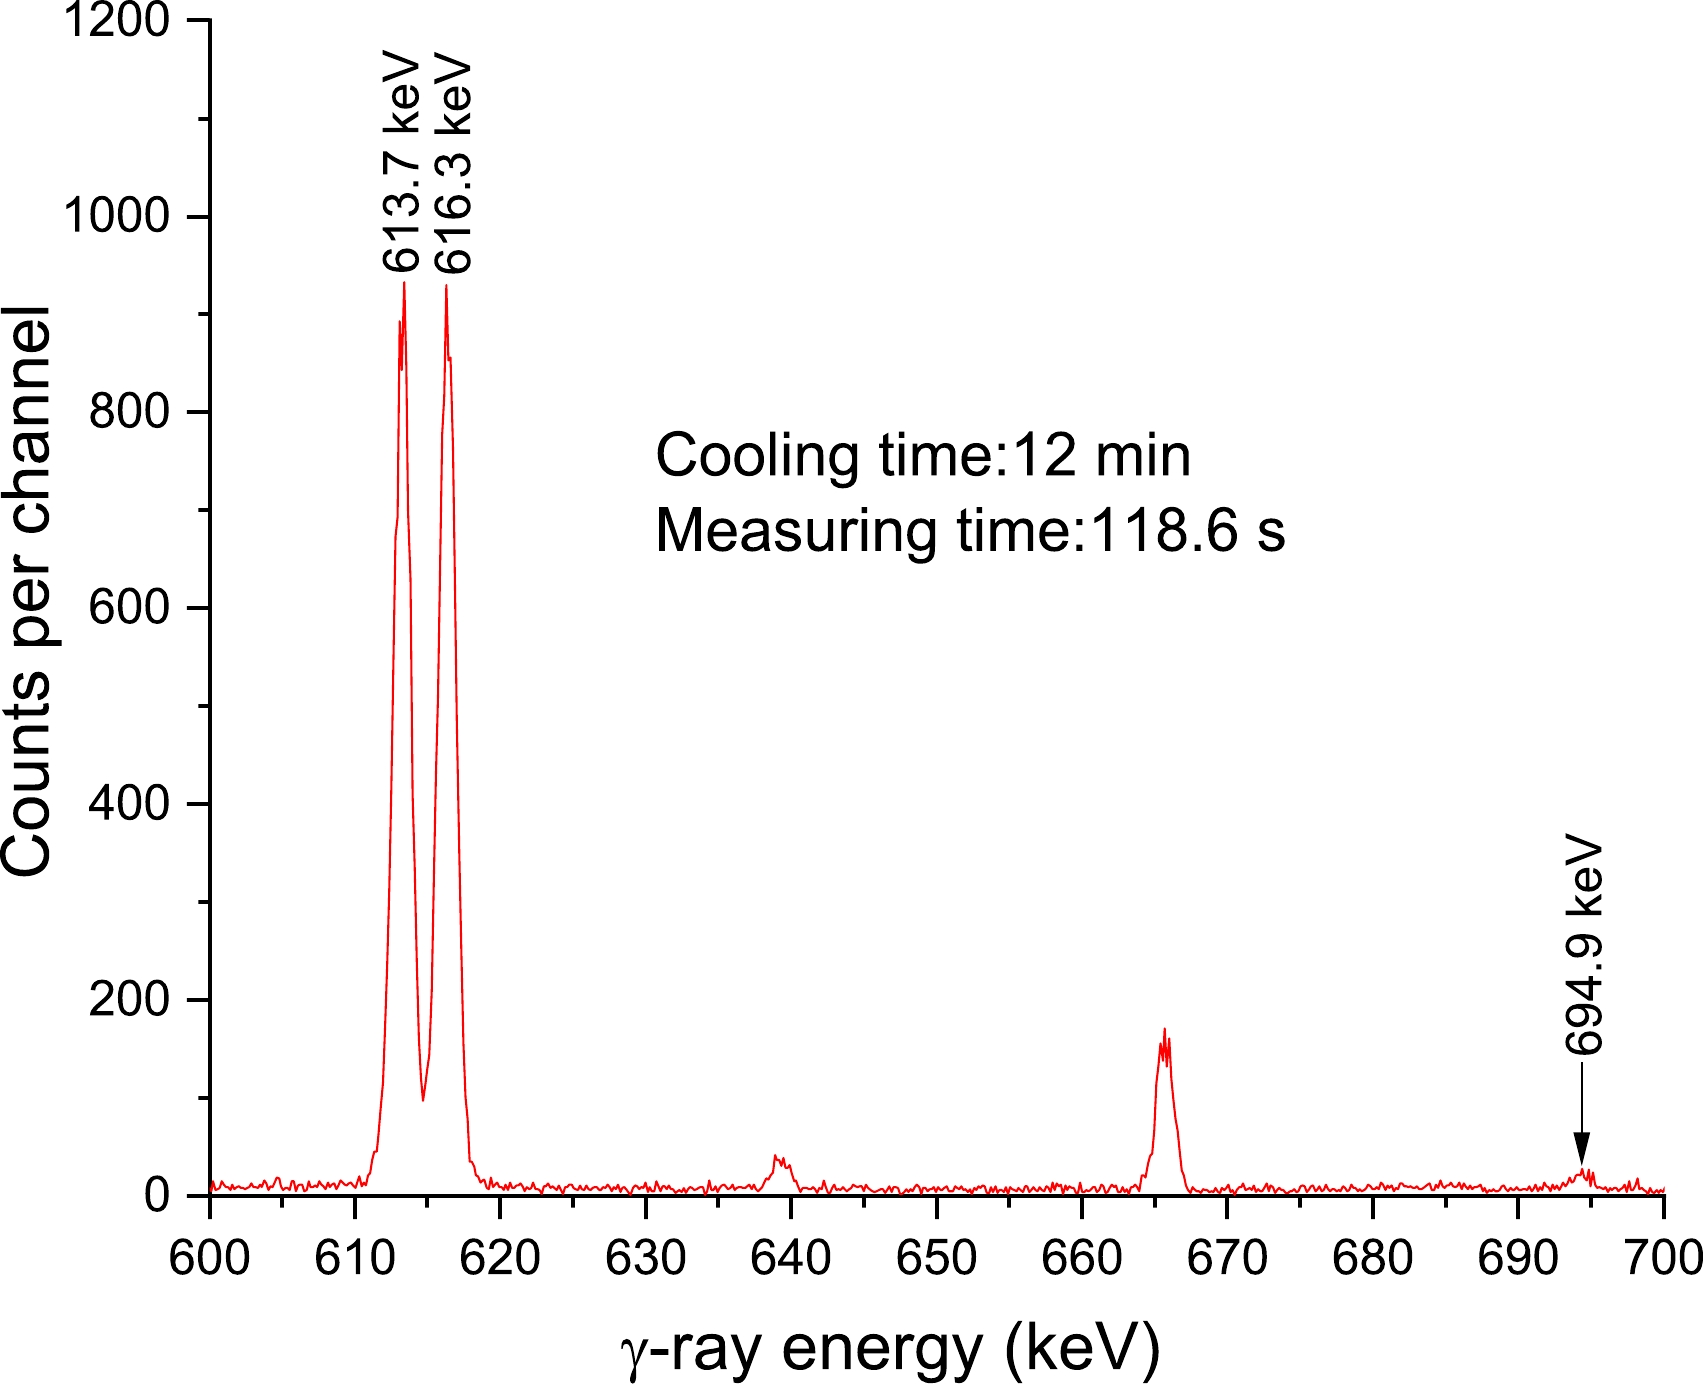
Figure 2. (color online) NaBr γ-ray spectrum acquired using a 68% relative efficiency HPGe detector for an acquisition time of 118.6 s, 12 min after neutron activation. The peaks of interest are 613.7, 616.3, and 694.9 keV.
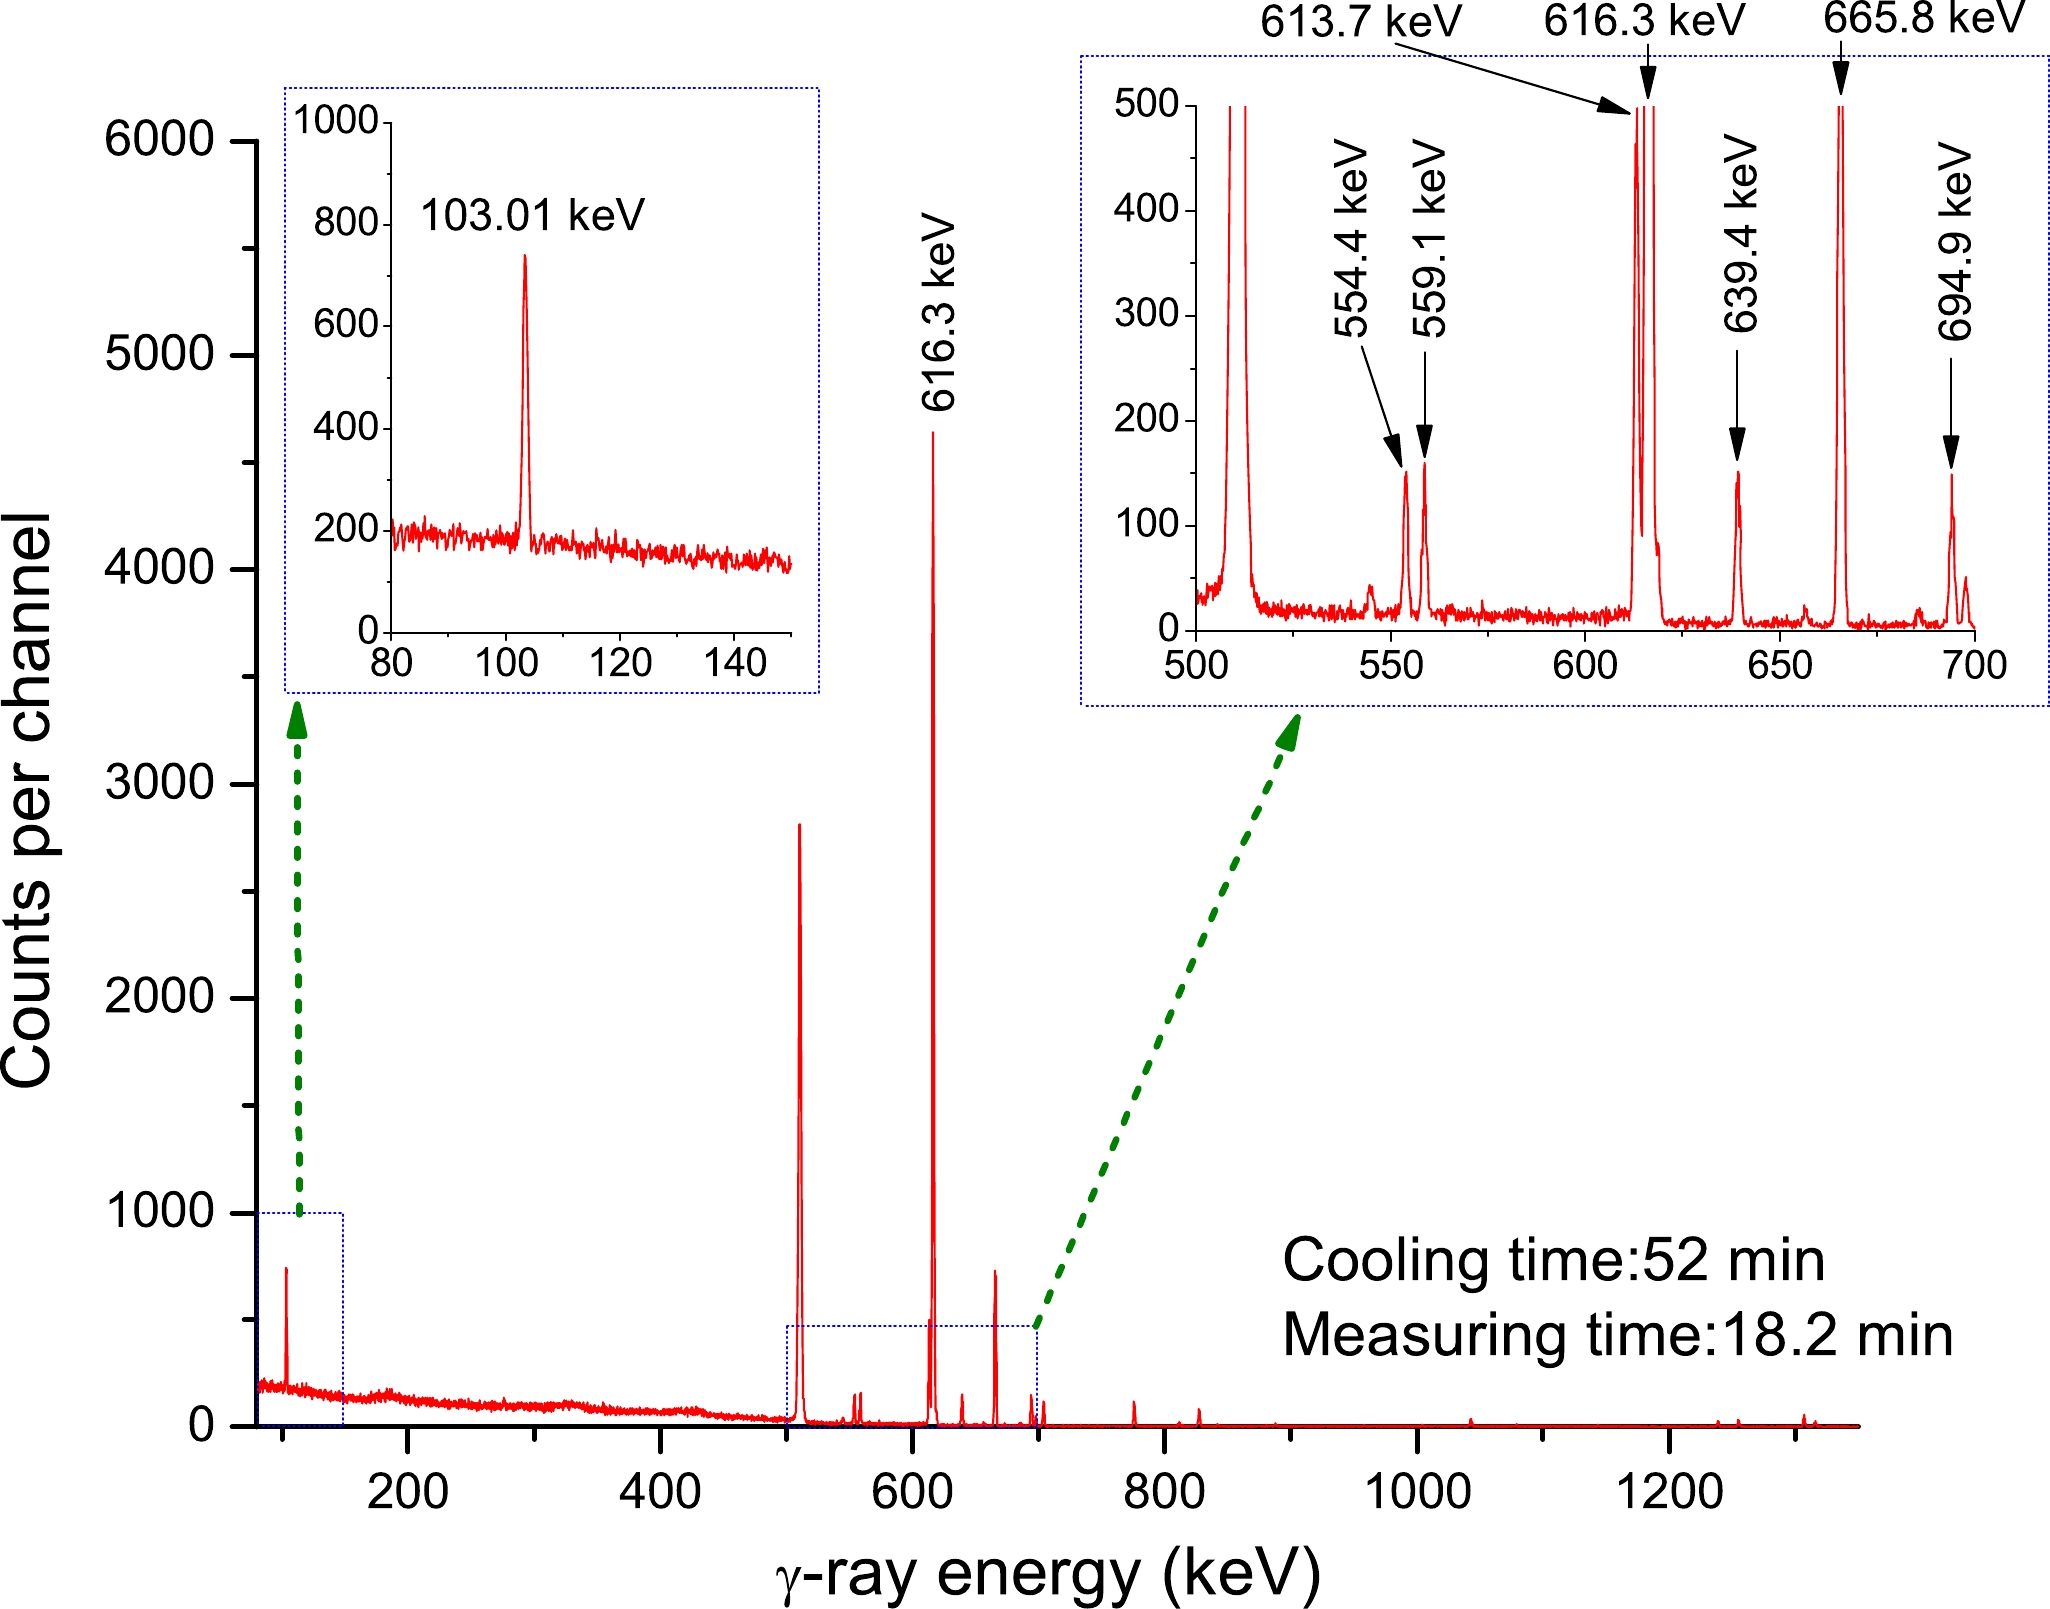
Figure 3. (color online) NaBr γ-ray spectrum acquired using a 68% relative efficiency HPGe detector at En=14.4 MeV for an acquisition time of 18.2 min, 52 min after neutron activation. The lines of interest are 103.01 keV (81mSe), 559.1 keV (76As), 616.3 keV (80mBr), and 694.9 keV (78As). The 80–150 keV and 500–700 keV energy ranges are shown in the enlarged portion of the spectrum.
Abundance of target isotope (%) Reaction E-threshold /MeV Mode of decay (%) T1/2 Eγ /keV Iγ (%) 50.65(9) 79Br(n, 2n)78Br 10.824 EC(100) 6.45(4) min 613.68 13.6(4) 49.35(9) 81Br(n, p)81mSe 0.920 IT(99.95) 57.28(2) min 103.01 12.8(3) 49.35(9) 81Br(n, α)78As 0.000 β-(100) 90.7(2) min 354.3 1.9(3) 545.3 3.0(4) 613.8 54(6) 694.9 16.7(22) 828.1 8.1(10) 888.7 2.1(3)) 1240.3 5.9(9) 1308.7 13.0(18) 50.65(9) 79Br(n, α)76As 0.000 β-(100) 26.24(9) h 559.1 45.0(20) 563.2 1.20(8) 657.05 6.2(4) 1212.9 1.44(11) 1216.08 3.42(24) 100 27Al(n, α)24Na 3.249 β-(100) 14.997(12) h 1368.6 100 100 93Nb(n, 2n)92mNb 8.972 EC (100) 10.15(2) d 934.44 99.15(4) The numbers in brackets represent the uncertainties, for example, 50.65(9) % means (50.65±0.09) %, and 6.45(4) min means (6.45±0.04) min. Table 3. Reactions and decay data of the corresponding activation products (from Ref. [39]). Calculations were performed using the data in boldface font.
-
Calculation of the reaction cross-sections was performed using [41]
$ {\sigma _x} = \frac{{{{[S\varepsilon {I_\gamma }\eta KMD]}_0}}}{{{{[S\varepsilon {I_\gamma }\eta KMD]}_x}}}\frac{{{{[\lambda AFC]}_x}}}{{{{[\lambda AFC]}_0}}}{\sigma _0}, $

(1) where the subscripts x and 0 denote the measured and standard response values, respectively, ε is the full-energy peak efficiency of the measured characteristic gamma-ray, Iγ represents the gamma-ray intensity, η denotes the abundance of the target nuclide, M is the mass of the sample,
$D={\rm e}^{-\lambda t_{1}}-{\rm e}^{-\lambda \left(t_{1}+t_{2}\right)}$ represents the counting collection factor,$S=1-{\rm e}^{-\lambda T}$ is the growth factor of the product nuclide, T denotes the total irradiation time, t1 is the total cooling time, t2 is the total measurement time, A is the atomic weight, C represents the measured full energy peak area, λ is the decay constant of the residual nucleus, and$K = \sum\limits_i^L {[{\Phi _i}(1 - {{\rm e}^{ - \lambda \Delta {t_i}}}){{\rm e}^{ - \lambda {T_i}}}]/(\Phi S)}$ is the neutron fluence fluctuation factor, where L is the number of time intervals into which the irradiation time is divided, Δti is the duration of the ith time interval, Ti represents the time interval from the end of the ith interval to the end of irradiation, Φi is the neutron flux averaged over the sample during Δti, and Φ is the neutron flux averaged over the sample during the total irradiation time T. Moreover, F is the total activity correction factor, expressed as$ F = {f_c} \times {f_s} \times {f_p} \times {f_g} , $

(2) where fc, fs, fp, and fg are the correcting factors representing the coincidence-summation effect of cascade γ-rays produced by the nuclide, the self-absorption of the γ-rays, the attenuation of γ-rays in polymethyl methacrylate (for niobium and aluminum foil, fp=1), and the specimen counting geometries, respectively. The methodology described elsewhere [42] served as the foundation for the computations of the correction factors for coincidence summing.
The mass attenuation coefficient (μ/ρ) values for sodium and bromine were calculated following the extrapolation of the values listed in reference [43]. An easy weighted summation of the different components yielded the ratio (μ/ρ) for the compound (NaBr) as follows:
$ \mu / \rho=\sum_{i} w_{i}(\mu / \rho)_{i} , (i=1, 2), $

(3) where the ith atomic constituent's weighting is represented by wi. The linear attenuation coefficients in NaBr were subsequently computed from the following expression:
$\mu = {\text{3}}{\text{.203}}(\mu /\rho )$ , where 3.203 (in g/cm3) is the density of NaBr. At γ-ray energies of 103.01, 559.1, 613.68, and 694.9 keV, the correction factors are given in Table 4.γ-ray energy/keV μ/ρ (cm2/g) μ(NaBr)
/cm−1Sample No. Correction factors fs Na Br NaBr 103.01 0.1570 0.6622 0.5493 1.759 1 1.0599 2 1.0763 3 1.0848 4 1.0832 559.1 0.0800 0.0785 0.0788 0.253 1 1.0085 2 1.0107 3 1.0119 4 1.0117 613.68 0.0767 0.0744 0.0749 0.240 1 1.0080 2 1.0102 3 1.0113 4 1.0111 694.9 0.0729 0.0701 0.0707 0.227 1 1.0076 2 1.0096 3 1.0107 4 1.0105 Table 4. Correction factors for the specimen's self-absorption at a certain γ-ray energy. The four samples are at 0º (No. 1), 45º (No. 4), 90º (No. 2), and 135º (No. 3) relative to the beam.
The full-energy peak area measured should be subtracted from the contribution from 78As via the 81Br((n, α))78As reaction to arrive at Cx in Eq. (1), which was employed for the calculation of the cross-sections of the 79Br((n, 2n))78Br reaction (C613). C613 can be written as follows in accordance with the laws governing the production and decay of artificially radioactive nuclides:
$ {C_{613}} = \frac{{{I_{613}}}}{{{I_{694.9}}}}{C_{694.9}} ,$

(4) where I613 and I694.9 are the intensities of the characteristic γ-rays with energies of 613.8 keV and 694.9 keV from the product nucleus 78As, respectively. C613 and C694.9 are the full peak counts of these two γ-rays.
-
The main sources of uncertainties during the determination of cross-sections included the following items (where the subscripts Nb/Al and x show the monitored and measured reaction-related terms, respectively): Cx,Nb/Al is the γ-ray counting statistics, Mx,Nb/Al is the target mass, ηx is the target isotopic abundance, Ix,Nb/Al refers to the γ-ray intensity, σNb/Al is the standard cross-section, εx,Nb/Al is the efficiency (the calculated covariance and correlation matrix for the HPGe detector efficiency is given in Table 5), and Sx,Nb/Al, Dx,Nb/Al are the timing factors. The uncertainty within the estimated reaction cross-section was calculated by employing the fractional uncertainty (%) from all the variables listed above [44–47]. Tables 6–9 were utilized for the propagation of the covariance matrix among the various neutron energies and to illustrate the fractional uncertainties in the different factors responsible for the measured reaction cross-section. The same detection equipment was used to measure all of the radioactive samples, and the nuclear decay parameters were measured regardless of the type of sample. As a result, all neutron energies had the same detector efficiency, target isotope abundance, γ-ray intensity, and timing factors Sx,Nb/Al, proving that the neutron energies were associated. Therefore, the next stage in the covariance analysis involved the computation of correlation coefficients between individual qualities linked to the various energies after computing the fractional uncertainty. Table 10 summarizes the correlation coefficients between the characteristics related to various energies, where i, j, k, and l denote energies equivalent to 13.5, 14.1, 14.4, and 14.8 MeV, respectively. The values listed in Tables 11–14 were utilized to derive the cross-section covariance matrix among two energies (σxi, σxj) by adding the matrices of 14 subsets (attributes), making use of the given expression [47], and propagating the total uncertainty.
Eγ /keV Covariance matrix (×10−8) Correlation matrix 103.01 559.1 613.68 694.9 934.44 1368.6 103.01 559.1 613.68 694.9 934.44 1368.6 103.01 5.373 1.000 559.1 1.894 1.083 0.785 1.000 613.68 1.808 1.015 0.960 0.796 0.995 1.000 694.9 1.713 0.924 0.885 0.830 0.811 0.974 0.992 1.000 934.44 1.512 0.709 0.692 0.669 0.591 0.848 0.886 0.919 0.955 1.000 1368.6 1.163 0.465 0.438 0.415 0.406 0.410 0.784 0.699 0.699 0.712 0.824 1.000 Table 5. Calculated covariance and correlation matrix of the HPGe detector efficiencies for specific γ-ray energies.
Attributes
(x)Fractional uncertainties (%) 13.5 MeV
(Δxi)14.1 MeV
(Δxj)14.4 MeV
(Δxk)14.8 MeV
(Δxl)Cx 2.33 1.95 0.98 2.20 CNb 0.91 0.92 0.88 1.01 Ix 2.94 2.94 2.94 2.94 INb 0.04 0.04 0.04 0.04 Mx 0.02 0.03 0.03 0.04 MNb 0.01 0.01 0.01 0.01 ηx 0.18 0.18 0.18 0.18 σNb 0.63 0.55 0.54 0.56 εx 1.36 1.36 1.36 1.36 εNb 1.38 1.38 1.38 1.38 Sx 0.00 0.00 0.00 0.00 SNb 0.20 0.20 0.20 0.20 Dx 2.79 2.34 0.24 2.01 DNb 0.19 0.19 0.19 0.19 Total error (%) 5.19 4.79 3.82 4.77 Table 6. Fractional uncertainties (%) of the various attributes associated with the 79Br(n, 2n)78Br reaction cross-sections assessed at different neutron energies.
Attributes
(x)Fractional uncertainties (%) 13.5 MeV
(Δxi)14.1 MeV
(Δxj)14.4 MeV
(Δxk)14.8 MeV
(Δxl)Cx 4.62 4.60 3.34 5.30 CAl 1.10 1.00 1.00 1.00 Ix 2.34 2.34 2.34 2.34 IAl 0.01 0.01 0.01 0.01 Mx 0.02 0.03 0.03 0.04 MAl 0.01 0.01 0.01 0.01 ηx 0.18 0.18 0.18 0.18 σAl 0.80 0.46 0.41 0.39 εx 1.54 1.54 1.54 1.54 εAl 1.43 1.43 1.43 1.43 Sx 0.02 0.02 0.02 0.02 SAl 0.08 0.08 0.08 0.08 Dx 0.01 0.02 0.01 0.02 DAl 0.07 0.07 0.07 0.07 Total error (%) 5.76 5.68 4.72 6.26 Table 7. Fractional uncertainties (%) of the various characteristics associated with the measured cross-sections of the 81Br(n, p)81mSe reaction at different neutron energies.
Attributes
(x)Fractional uncertainties (%) 13.5 MeV
(Δxi)14.1 MeV
(Δxj)14.4 MeV
(Δxk)14.8 MeV
(Δxl)Cx 9.20 8.80 4.30 8.00 CAl 1.10 1.00 1.00 1.00 Ix 13.17 13.17 13.17 13.17 IAl 0.01 0.01 0.01 0.01 Mx 0.02 0.03 0.03 0.04 MAl 0.01 0.01 0.01 0.01 ηx 0.18 0.18 0.18 0.18 σAl 0.80 0.46 0.41 0.39 εx 1.37 2.50 2.50 2.50 εAl 1.43 1.37 1.37 1.37 Sx 0.13 1.43 1.43 1.43 SAl 0.08 0.08 0.08 0.08 Dx 0.14 0.15 0.12 0.15 DAl 0.07 0.07 0.07 0.07 Total error (%) 16.25 16.00 14.04 15.58 Table 8. Fractional uncertainties (%) of the various characteristics associated with the measured cross-sections of the 81Br(n, α)78As reaction at different neutron energies.
Attributes
(x)Fractional uncertainties (%) 13.5 MeV
(Δxi)14.1 MeV
(Δxj)14.4 MeV
(Δxk)14.8 MeV
(Δxl)Cx 2.85 2.90 2.20 2.58 CAl 1.10 1.00 1.00 1.00 Ix 4.44 4.44 4.44 4.44 IAl 0.01 0.01 0.01 0.01 Mx 0.02 0.03 0.03 0.04 MAl 0.01 0.01 0.01 0.01 ηx 0.18 0.18 0.18 0.18 σAl 0.80 0.46 0.41 0.39 εx 1.36 1.36 1.36 1.36 εAl 1.43 1.43 1.43 1.43 Sx 0.33 0.33 0.33 0.33 SAl 0.08 0.08 0.08 0.08 Dx 0.15 0.15 0.16 0.15 DAl 0.07 0.07 0.07 0.07 Total error (%) 5.81 5.78 5.46 5.62 Table 9. Fractional uncertainties (%) of the various attributes associated with the measured cross-sections of the 79Br(n, α)76As reaction at different neutron energies.
Correlation coefficient (Δx, Δx) Cx CNb/Al Ix INb/Al Mx MNb/Al ηx σNb/Al εx εNb/Al Sx SNb/Al Dx DNb/Al Cor(Δxi, Δxi) 1 1 1 1 1 1 1 1 1 1 1 1 1 1 Cor(Δxi, Δxj) 0 0 1 1 0 0 1 0 0.9987 1 0 0 0 0 Cor(Δxi, Δxk) 0 0 1 1 0 0 1 0 0.9987 1 0 0 0 0 Cor(Δxi, Δxl) 0 0 1 1 0 0 1 0 0.9987 1 0 0 0 0 Cor(Δxj, Δxj) 1 1 1 1 1 1 1 1 1 1 1 1 1 1 Cor(Δxj, Δxk) 0 0 1 1 0 0 1 0 0.9987 1 0 0 0 0 Cor(Δxj, Δxl) 0 0 1 1 0 0 1 0 0.9987 1 0 0 0 0 Cor(Δxk, Δk) 1 1 1 1 1 1 1 1 1 1 1 1 1 1 Cor(Δxk, Δxl) 0 0 1 1 0 0 1 0 0.9987 1 0 0 0 0 Cor(Δxl, Δxl) 1 1 1 1 1 1 1 1 1 1 1 1 1 1 Table 10. Correlation coefficient between attributes associated with various neutron energies determined for the 79Br(n, 2n)78Br, 79Br(n, α)76As , 81Br(n, p)81mSe, and 81Br(n, α)78As reactions.
Neutron energy
En /MeVCross-section
σx /mbΔσx(%) Correlation matrix 13.5±0.2 1048±54 5.19 1.00 14.1±0.2 1193±57 4.79 0.50 1.00 14.4±0.2 1210±46 3.82 0.63 0.68 1.00 14.8±0.2 1250±60 4.77 0.50 0.54 0.68 1.00 Table 11. Cross-sections (mb) of the 79Br(n, 2n)78Br reaction measured experimentally with their total uncertainty values and correlation matrix at different neutron energies.
Neutron energy
En /MeVCross-section
σx /mbΔσx(%) Correlation matrix 13.5±0.2 10.5±0.6 5.76 1.00 14.1±0.2 11.2±0.6 5.68 0.30 1.00 14.4±0.2 11.6±0.5 4.72 0.37 0.37 1.00 14.8±0.2 12.4±0.8 6.26 0.28 0.28 0.34 1.00 Table 12. Cross-sections (mb) of the 81Br(n, p)81mSe reaction measured experimentally with their total uncertainty values and correlation matrix at different neutron energies.
Neutron energy
En /MeVCross-section
σx /mbΔσx(%) Correlation matrix 13.5±0.2 3.9±0.6 16.25 1.00 14.1±0.2 4.3±0.7 16.00 0.68 1.00 14.4±0.2 5.3±0.7 14.04 0.78 0.79 1.00 14.8±0.2 5.7±0.9 15.58 0.70 0.71 0.81 1.00 Table 13. Cross-sections (mb) of the 81Br(n, α)78As reaction measured experimentally with their total uncertainty values and correlation matrix at different neutron energies.
Neutron energy
En /MeVCross-section
σx /mbΔσx(%) Correlation matrix 13.5±0.2 11.5±0.7 5.81 1.00 14.1±0.2 11.9±0.7 5.78 0.70 1.00 14.4±0.2 12.3±0.7 5.46 0.75 0.75 1.00 14.8±0.2 13.5±0.8 5.62 0.72 0.73 0.77 1.00 Table 14. Cross-sections (mb) of the 79Br(n, α)76As reaction measured experimentally with their total uncertainty values and correlation matrix at different neutron energies.
$ \operatorname {Cov}\left(\sigma_{x i}, \sigma_{x j}\right)=\sum_{i} \sum_{j} \Delta x_{i} \times \operatorname {Cor}\left(\Delta x_{i}, \Delta x_{j}\right) \times \Delta x_{j}. $

(5) A [4×4] covariance matrix was generated using Eq. (5). Then, the following formula [47] was utilized to determine the net uncertainty in the estimated cross-section:
$ \operatorname{Cov}\left(\sigma_{x i}, \sigma_{x i}\right)=\left(\Delta \sigma_{x i}\right)^{2}. $

(6) The following equation was also used to propagate the [4×4] correlation matrix between the neutron energies derived from the covariance matrix and total uncertainty [47]:
$ \operatorname{Cor}\left(\sigma_{x i}, \sigma_{x j}\right)=\frac{\operatorname{Cov}\left(\sigma_{x i}, \sigma_{x j}\right)}{\left(\Delta \sigma_{x i}\right) \cdot\left(\Delta \sigma_{x j}\right)}. $

(7) -
The theoretical code TALYS uses the Hauser–Feshbach model extended with estimates for width-fluctuations, direct interactions, and pre-equilibrium emission [32]. This code (ver.-1.95) was used to determine the 79Br((n, 2n))78Br, 81Br(n, p)81mSe, 81Br((n, α))78As, and 79Br((n, α))76As reaction cross-sections up to the equivalent of 20 MeV in neutron energy. Nuclear processes including neutrons, protons, tritons, photons, α-particles, deuterons, and 3He aimed at certain nuclei were simulated using the nuclear model code TALYS-1.95. For reactions with an incident energy of up to 200 MeV, this is appropriate [48–51]. Our calculation used the default settings, with the exception of the nuclear level density models (NLDs). For the level density, TALYS employs a variety of models, from tabular level densities obtained from microscopic models to phenomenological analytical expressions. Ref. [52] contains all the information in its entirety. The following are three phenomenological level densities: The ldmodel 1 has constant temperature, and the Fermi-gas model divides the excitation energy into two regions, one in which the constant temperature law is used with lower energy, and the other utilizing the Fermi-gas model with higher energy. The back-shifted Fermi-gas model (ldmodel 2) uses the Fermi gas expression over all energy domains. In light of Bardeen-Cooper-Schrieffer theory, ldmodel 3 (the generalized superfluid model) considers superconductive pairing correlations [53–55]. The following three microscopic level densities are listed: The microscopic level densities (Skyrme force) in ldmodel 4 are taken from Goriely's tables [51]. Microscopic level densities obtained from Hilaire's combinatorial tables (Skyrme force) make up ldmodel 5. Microscopic level densities obtained from Hilaire's combinatorial tables (temperature dependent HFB, Gogny force) make up ldmodel 6.
-
The 79Br((n, 2n))78Br, 81Br(n, p)81mSe, 79Br((n, α))76As, and 81Br((n, α))78As reaction cross-sections were obtained using a neutron activation technique and offline γ-ray detection with a HPGe spectrometer. The results were then compared to the theoretical results of the TALYS-1.95 nuclear reaction model code [32] and the data present in the JENDL-4.0 [29], JEFF-3.3 [28] TENDL-2019 [30], and ENDF/B-VIII.0 [31] data libraries.
-
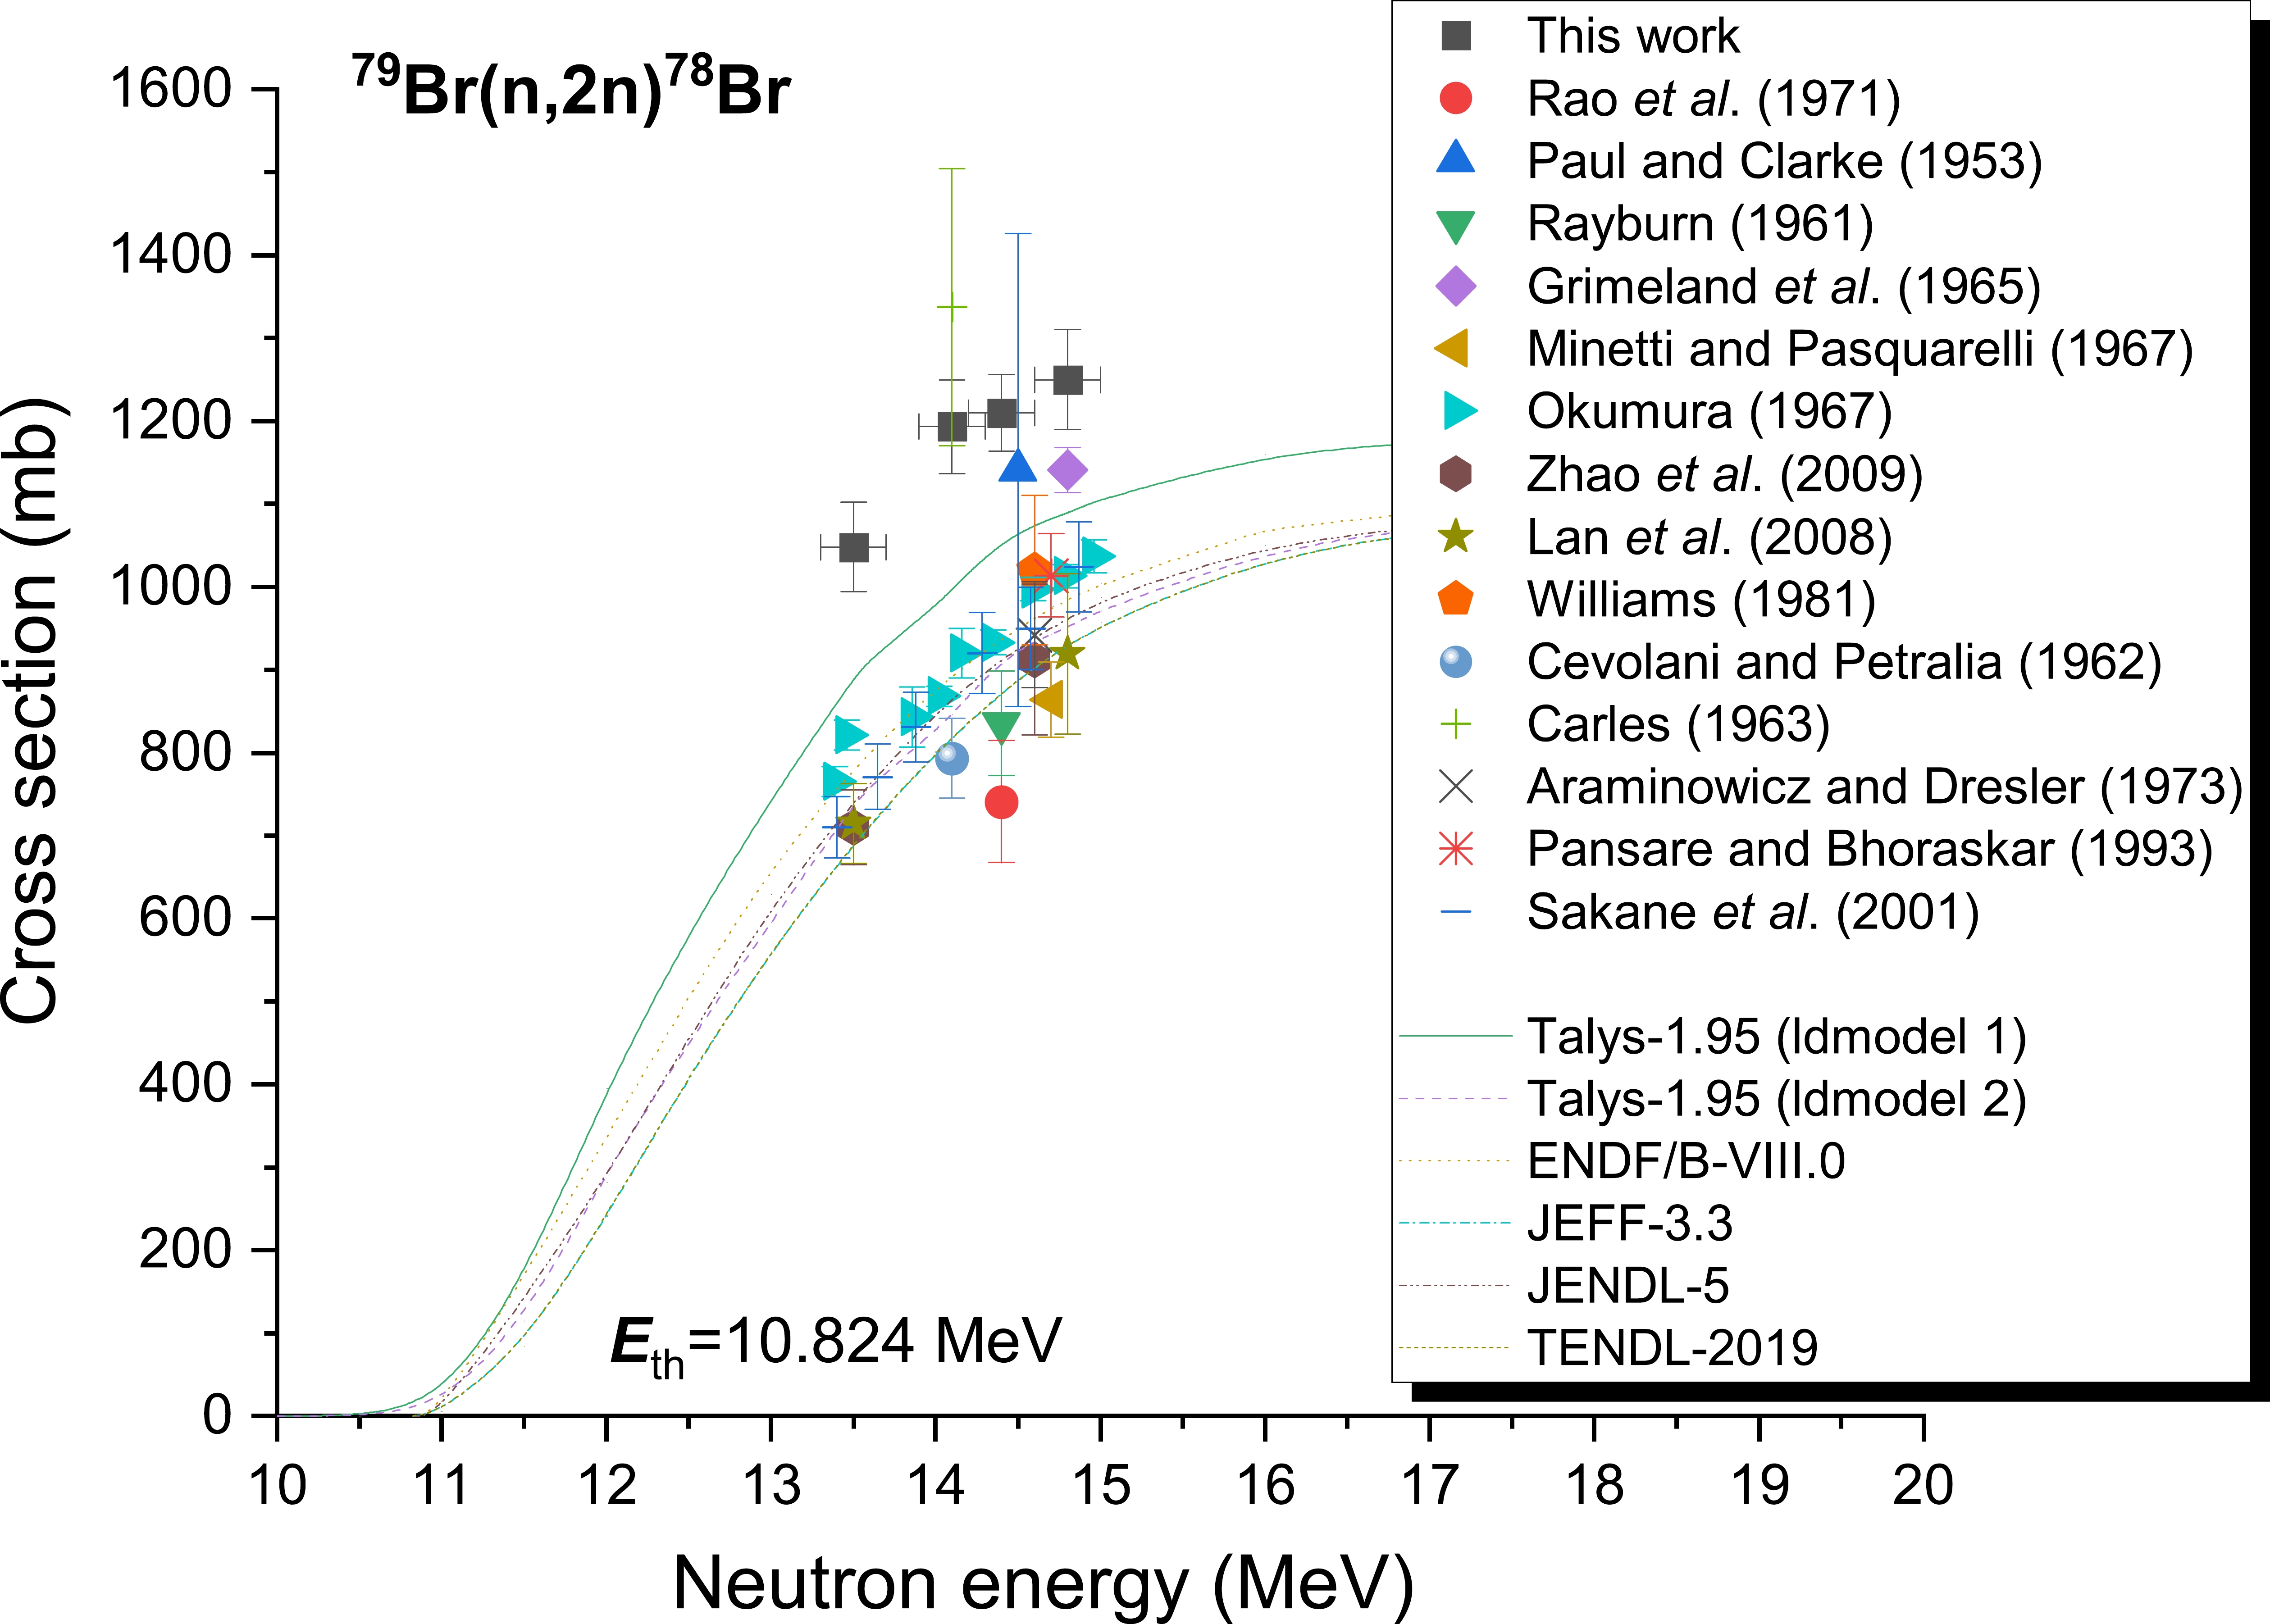
In the 13–15 MeV neutron energy range, the cross-sections of the 79Br((n, 2n))78Br reaction were measured using various counting methods that have been reported in 14 publications [2, 5–17]. The measured cross-sections ranged from 710 to 1337 mb. For the 79Br((n, 2n))78Br reaction, the cross-sections were estimated using the 613 keV characteristic γ-ray of the 78Br product radionuclide [2, 5, 10, 12, 17]. In fact, 613 keV γ-rays originate not only from 78Br but also the 78As nucleus via the reaction 81Br((n, α))78As. At the same time, this characteristic γ-ray (613.7 keV) is also affected by the close energy γ-ray (616.3 keV), which originates from the 81Br((n, 2n))80m,gBr reaction. Previous studies did not consider this effect [2, 5, 10, 12, 17]. This research involved determining the 79Br((n, 2n))78Br reaction cross-section using a γ-ray with an intensity Iγ=13.6% and an energy of 613.68 keV released during the decay of 78Br. The 613.7 keV and 616.3 keV energy peaks, which are typical, can be distinguished with a high-resolution HPGe detector (see Fig. 2). Equation (4) also simultaneously eliminated the counting impact from the 81Br((n, α))78As reaction. Figure 4 shows all of the experimental results that have been published in literature, as well as our measured results, theoretical calculations, and reaction assessment curves. The continuous lines in Fig. 4 represent the values determined by TALYS-1.95 computations utilizing ldmodels 1 and 2, along with information from the ENDF/B-VIII.0 [31], JEFF-3.3 (TENDL-2019 [30]) [28], and JENDL-4.0 [29] libraries. The evaluation values [28–31] and results from TALYS-1.95 [32] with a neutron energy of roughly 14 MeV exhibited notable differences. Our observations demonstrated an increase in the cross-section with the increment in neutron energy in the 14 MeV range, which is compatible with theoretical and assessment data. The current findings corroborate well (with the accepted limit of experimental uncertainties) with the data put forth by Paul and Clarke [6] and Carles [14] as well as with the outcome of the TALYS-1.95 code (ldmodel 1) for the neutron energy range 13–15 MeV. Besides the assessed data from JENDL-4.0 [29], JEFF-3.3 [28], TENDL-2019 [30], and ENDF/B-VIII.0 [31], the theoretical computation obtained via TALYS-1.95 code (ldmodel 2) and the results reported in earlier literature [2, 5, 7–13, 15–17] all showed smaller cross-sections than the present results, those obtained through the use of the TALYS-1.95 code (ldmodel 1), and the values reported by Carles [14] and Paul and Clarke [6].
-
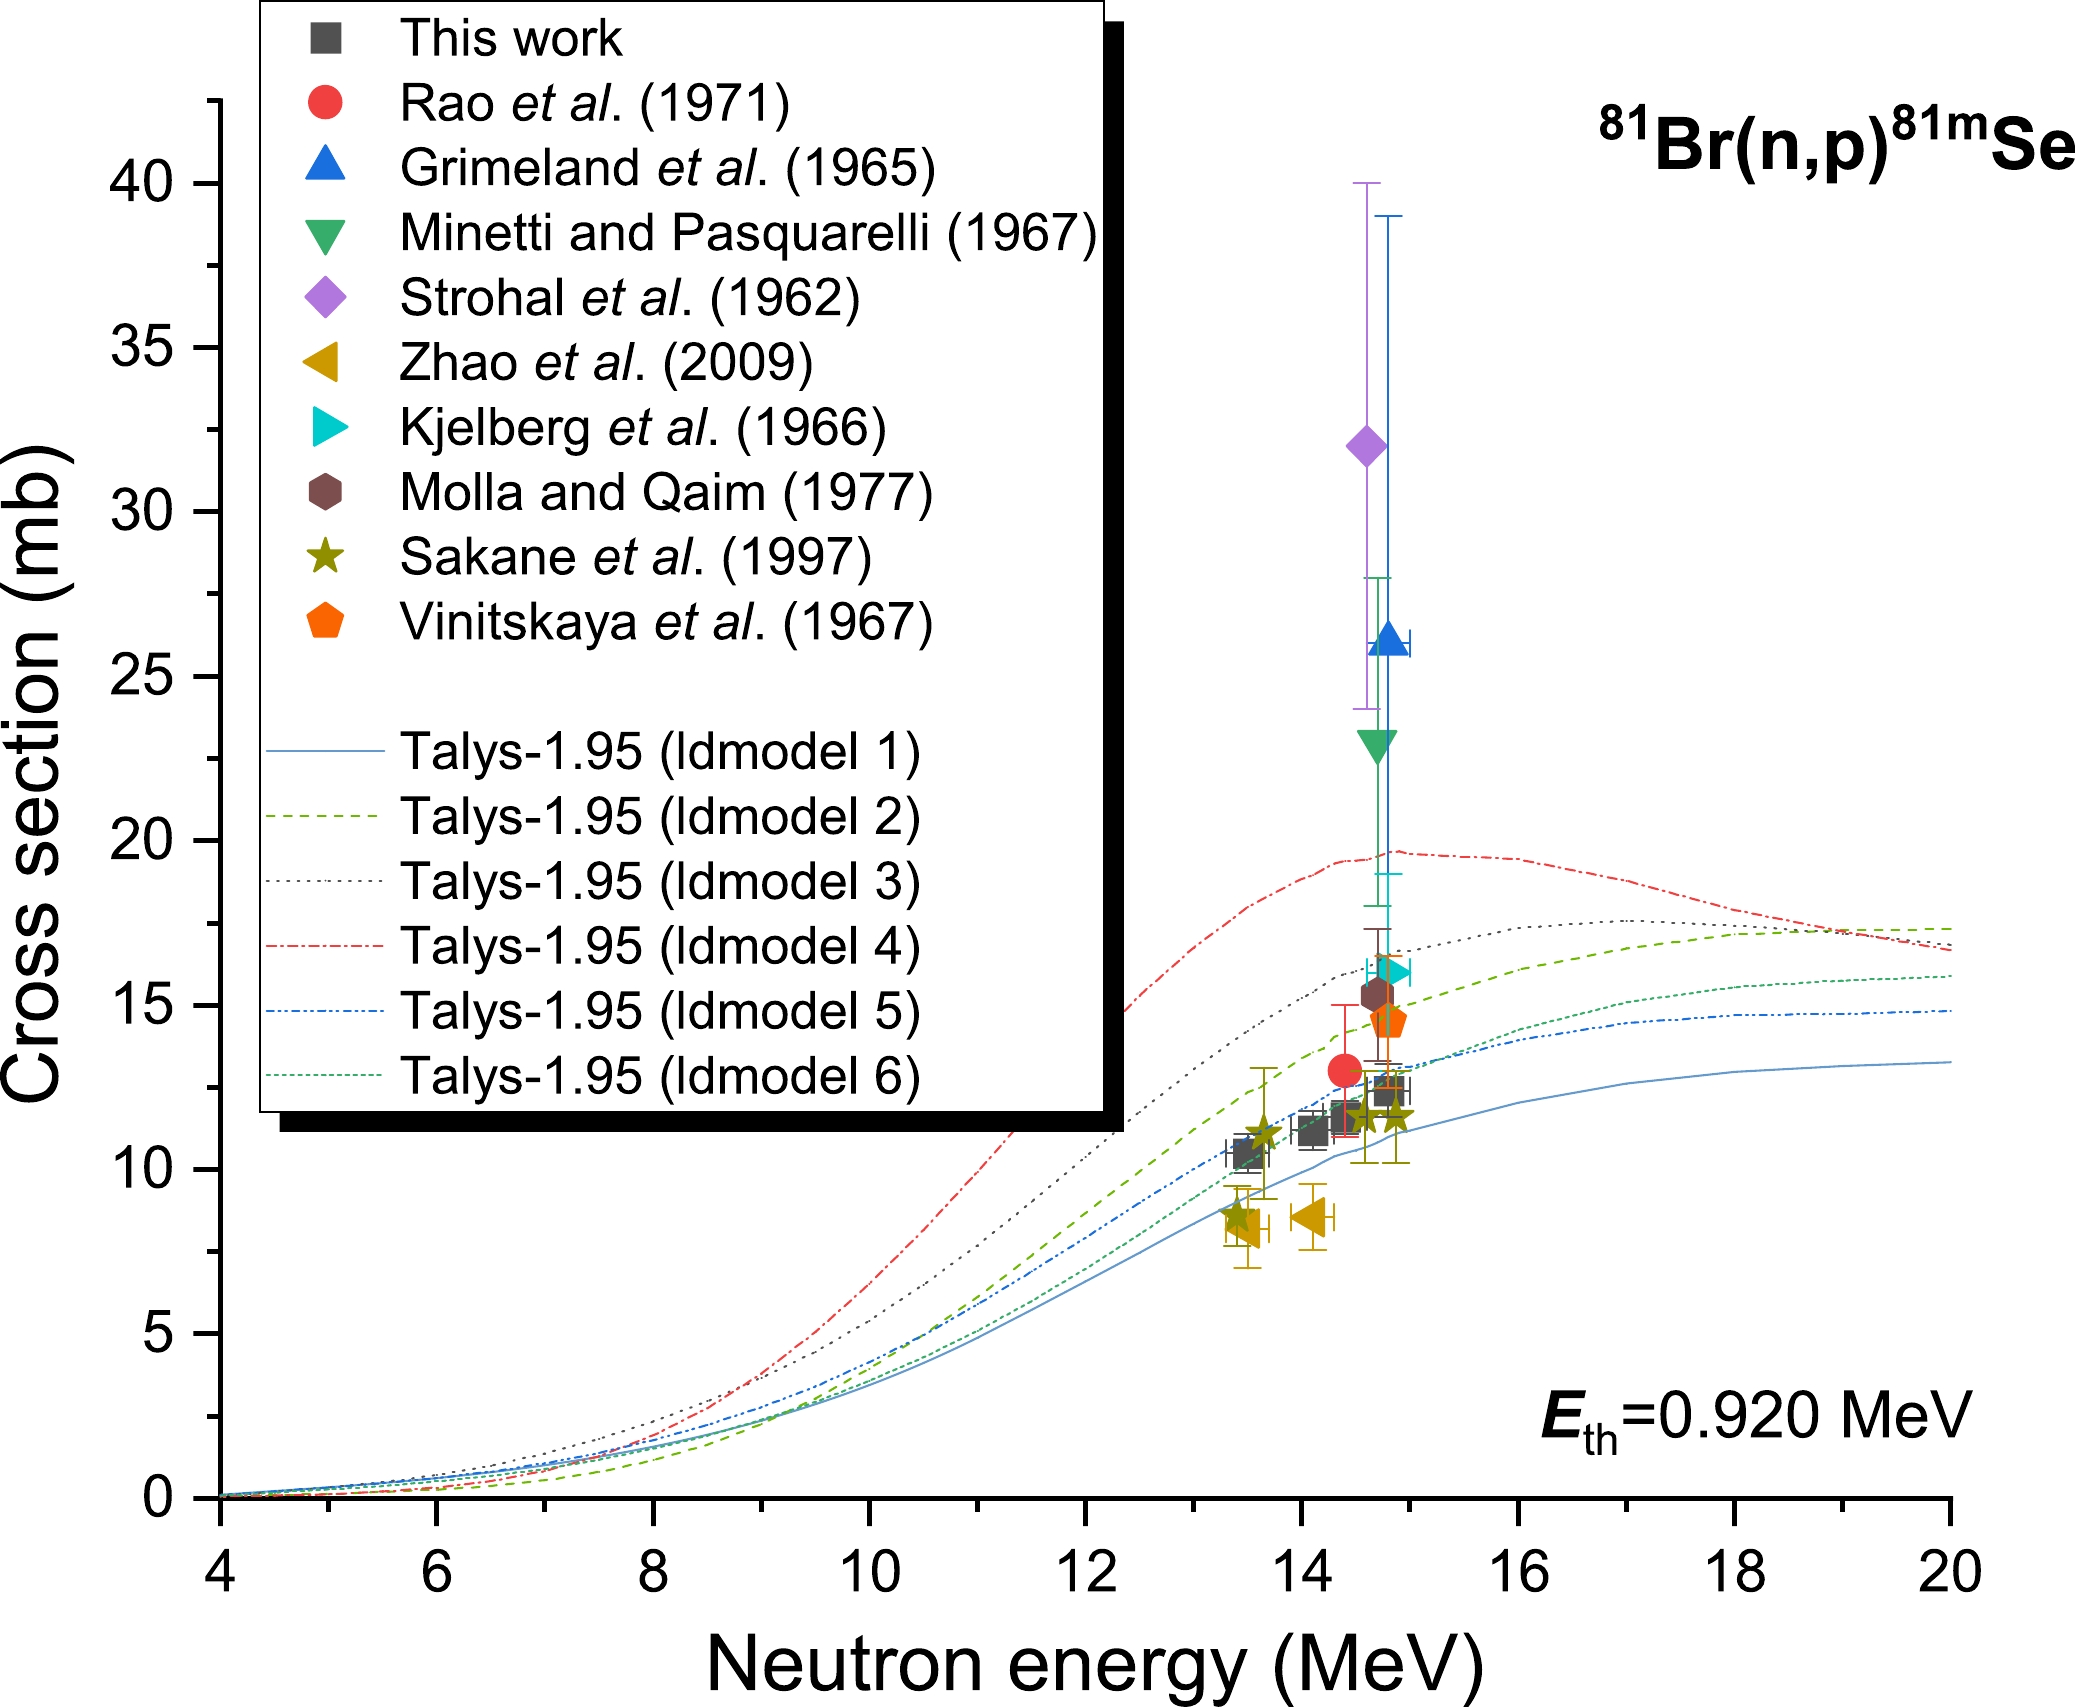
The γ-rays of particular significance are labeled in Fig. 3, which depicts a typical spectrum obtained from the NaBr samples used to estimate the cross-sectional measurement of the product nucleus (81mSe). In this study, the 81Br(n, p)81mSe reaction cross-section value was calculated using 103.01 (12.8%) keV γ-rays released during 81mSe decay (T1/2=57.28 min). The results are reported in Table 12 with an uncertainty range of 4.72%–6.26%. Fig. 5 displays the experimental data from this study, data from other published studies, and the excitation function curve calculated using TALYS-1.95. The evaluation nuclear data libraries are devoid of any entries for the assessment of 81Br(n, p)81mSe reaction cross-sections. For 81Br(n, p)81mSe reaction cross-sections, the earlier obtained data may be divided into a pair of bands with a considerable difference of roughly 150% for a range of neutron energies of 13–15 MeV. Within the accepted experimental uncertainty limit, the findings from the current experimental procedure between neutron energies of 13.5 and 14.8 MeV are in good agreement with the result documented by Rao et al. [5] and Sakane et al. [21]. In addition, they are in good agreement with the TALYS-1.95 theoretical calculation results using ldmodels 5 and 6. This is the case despite the fact that the experimental uncertainty was considered relatively large. However, our findings are smaller than the results reported in Refs. [8, 9, 18–20, 22].
-
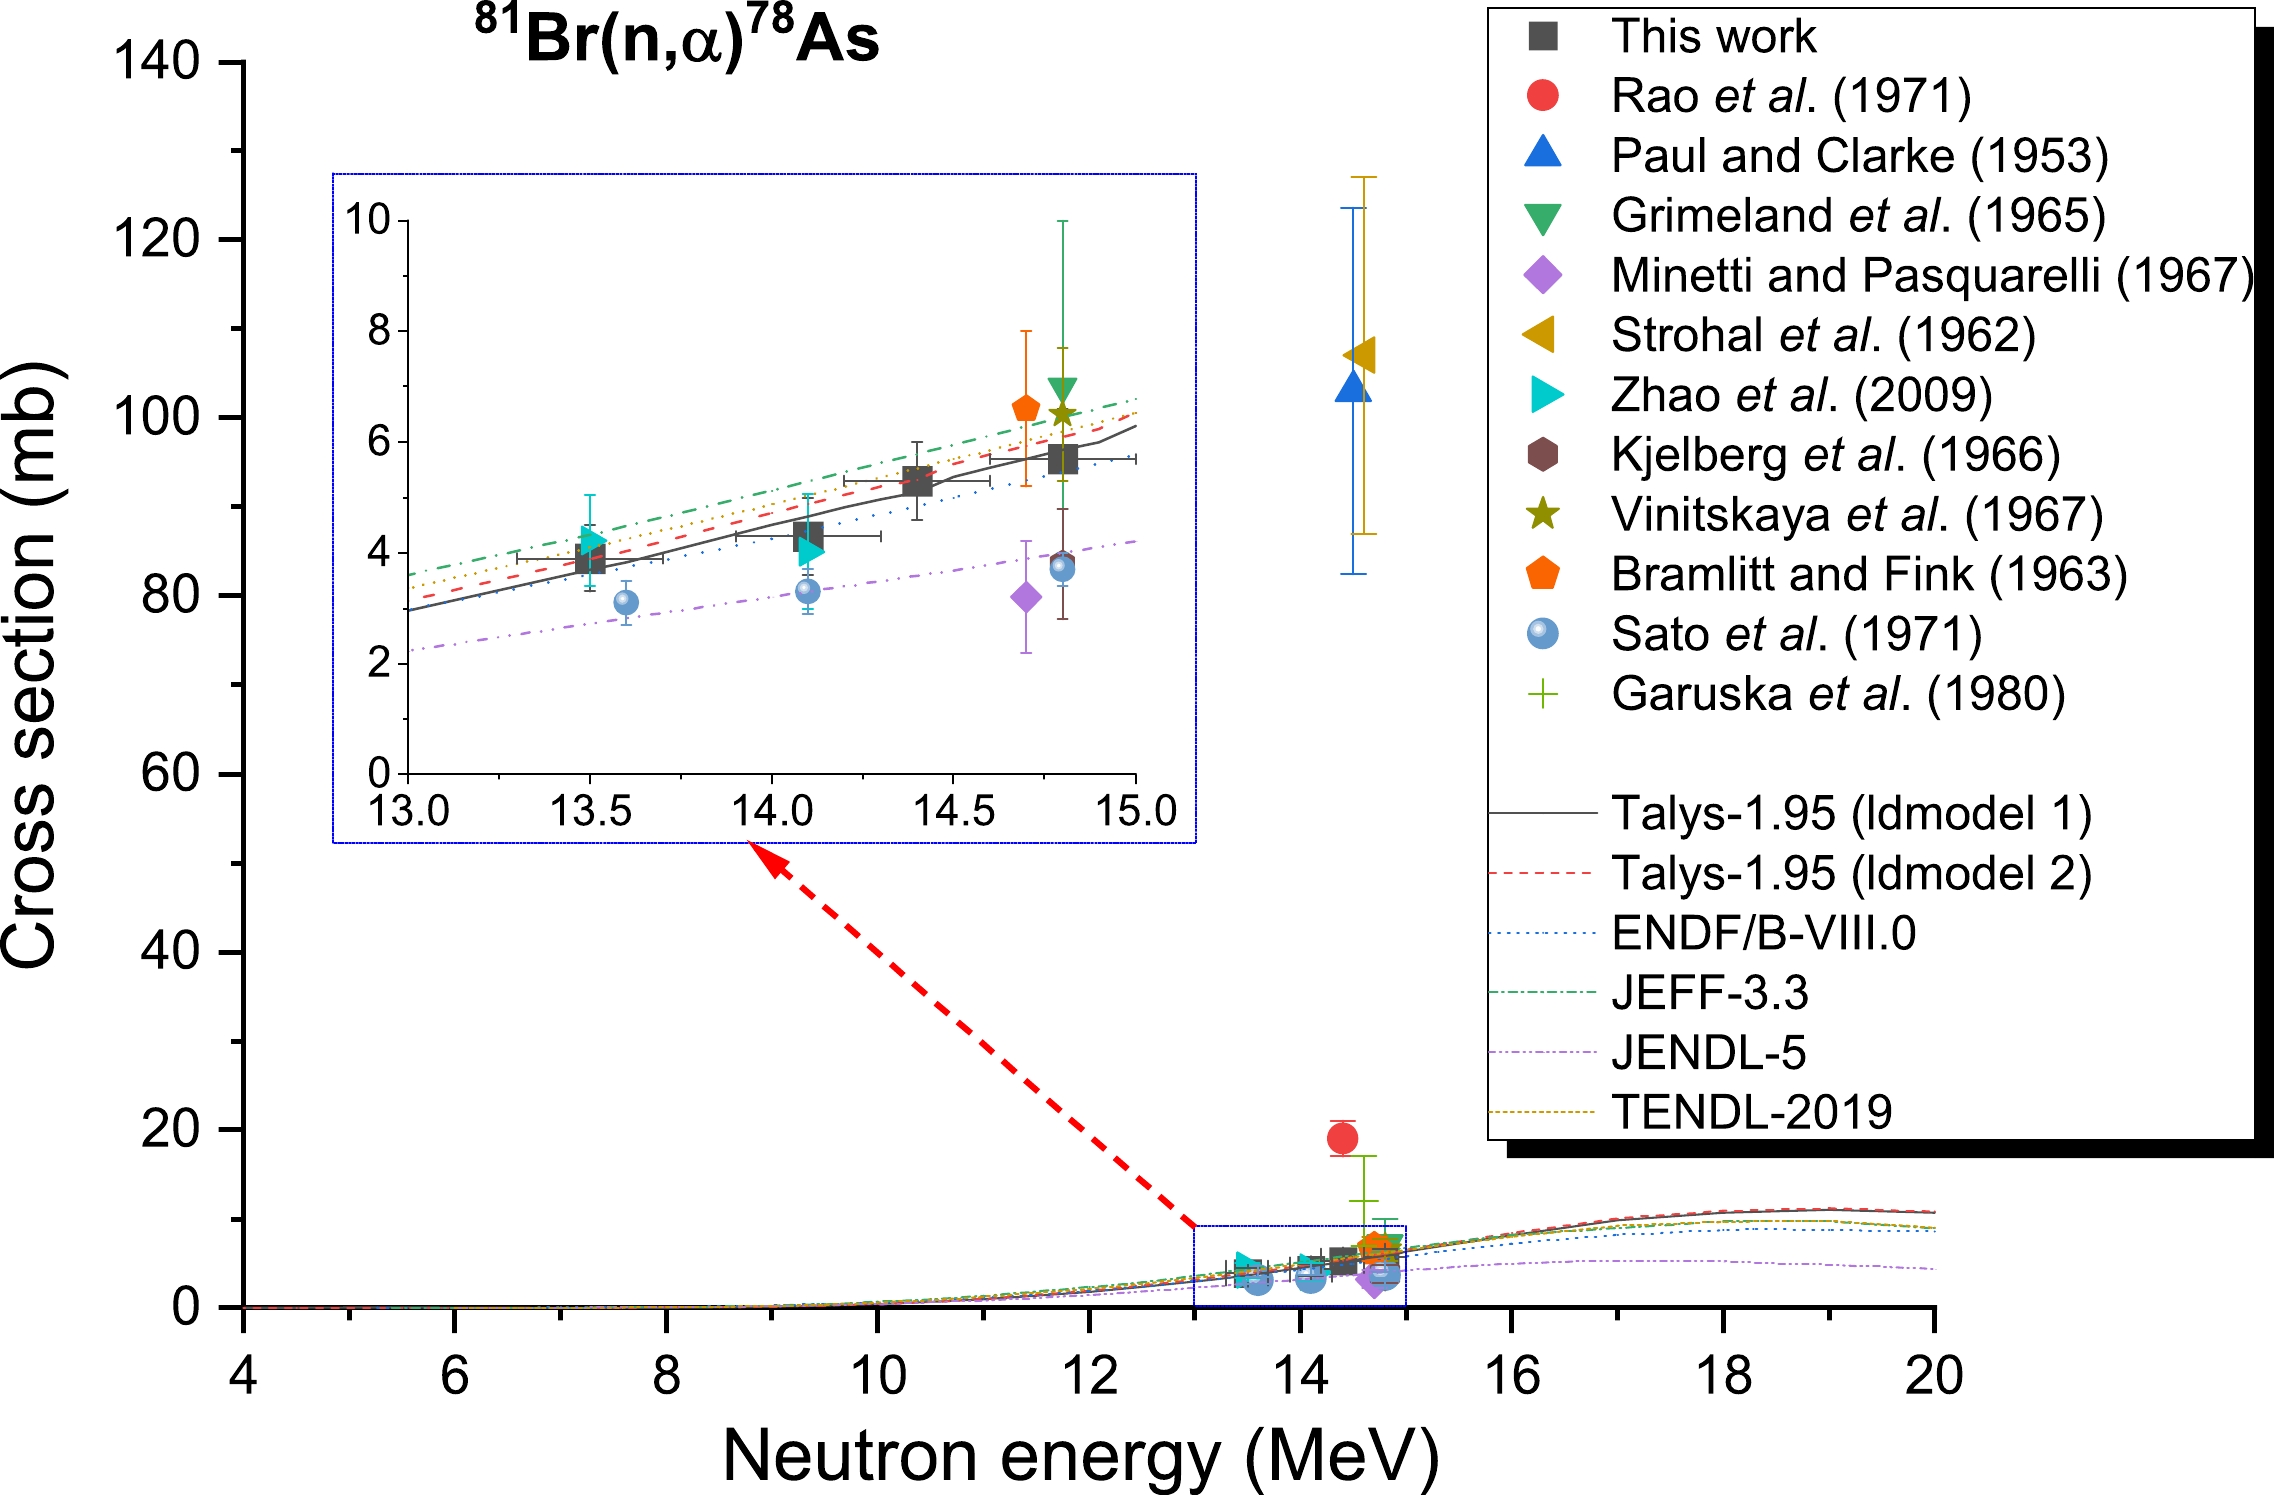
The 81Br((n, α))78As reaction cross-sections are depicted in Fig. 6 and are based on the findings gathered from Refs. [2, 5, 6, 8, 9, 18, 19, 22–25]. The results of the computations performed with TALYS-1.95 and the data acquired from the JENDL-4.0 [20], JEFF-3.3 [28], TENDL-2019 [30], and ENDF/B-VIII.0 [31] libraries are depicted in Fig. 6 as continuous lines. For neutrons with an energy close to 14 MeV, earlier measurements have exhibited large discrepancies between values. For 81Br((n, α))78As reaction cross-sections, the collected data may be classified into a pair of bands that are approximately 35 times different from one another at an energy range between 13 and 15 MeV. The experimental data presented in Refs. [6, 18] centered on a cross-section of 105 mb, whereas data presented in Refs. [2, 8, 9, 19, 22–25] centered on 5 mb. The γ-ray with an energy of 694.9 keV released during the decay of 78As was used in the current study to ascertain the reaction cross-section value for 81Br((n, α))78As. Because the 79Br((n, 2n))78Br reaction influences this line, the choice of characteristic rays with a 614 keV energy level in Ref. [5] is unsuitable. Within the experimental uncertainty limits, the current results in the 14 MeV region for neutron energy are in excellent agreement with the previously published data of Zhao et al. [2], Vinitskaya et al. [22], Bramlitt and Fink [23], and Garuska et al. [25]. They are also consistent with the evaluation values obtained on the basis of ENDF/B-VIII.0 [31] and the findings of the TALYS-1.95 computations with ldmodels 1 and 2, as presented in Fig. 6. Despite this, the results that were previously published by Paul and Clarke [6] and Strohal et al. [18] are 35 times larger, and those of Rao et al. [5] are five times larger, than our results. On the other hand, the findings of the current investigation are superior to those obtained by Minetti and Pasquarelli [9] and Sato et al. [24] as well as the assessment values obtained using JENDL-4.0 [29]. Regarding this reaction, it is unfortunate that the uncertainty in the characteristic ray intensity of the product nucleus is greater than 10% (see Table 3), which indicates that the results are relatively uncertain. However, despite this setback, it is imperative to bear in mind that the uncertainty of the results does not affect the overall accuracy of the experiment (see Table 13 and Fig. 6).
-
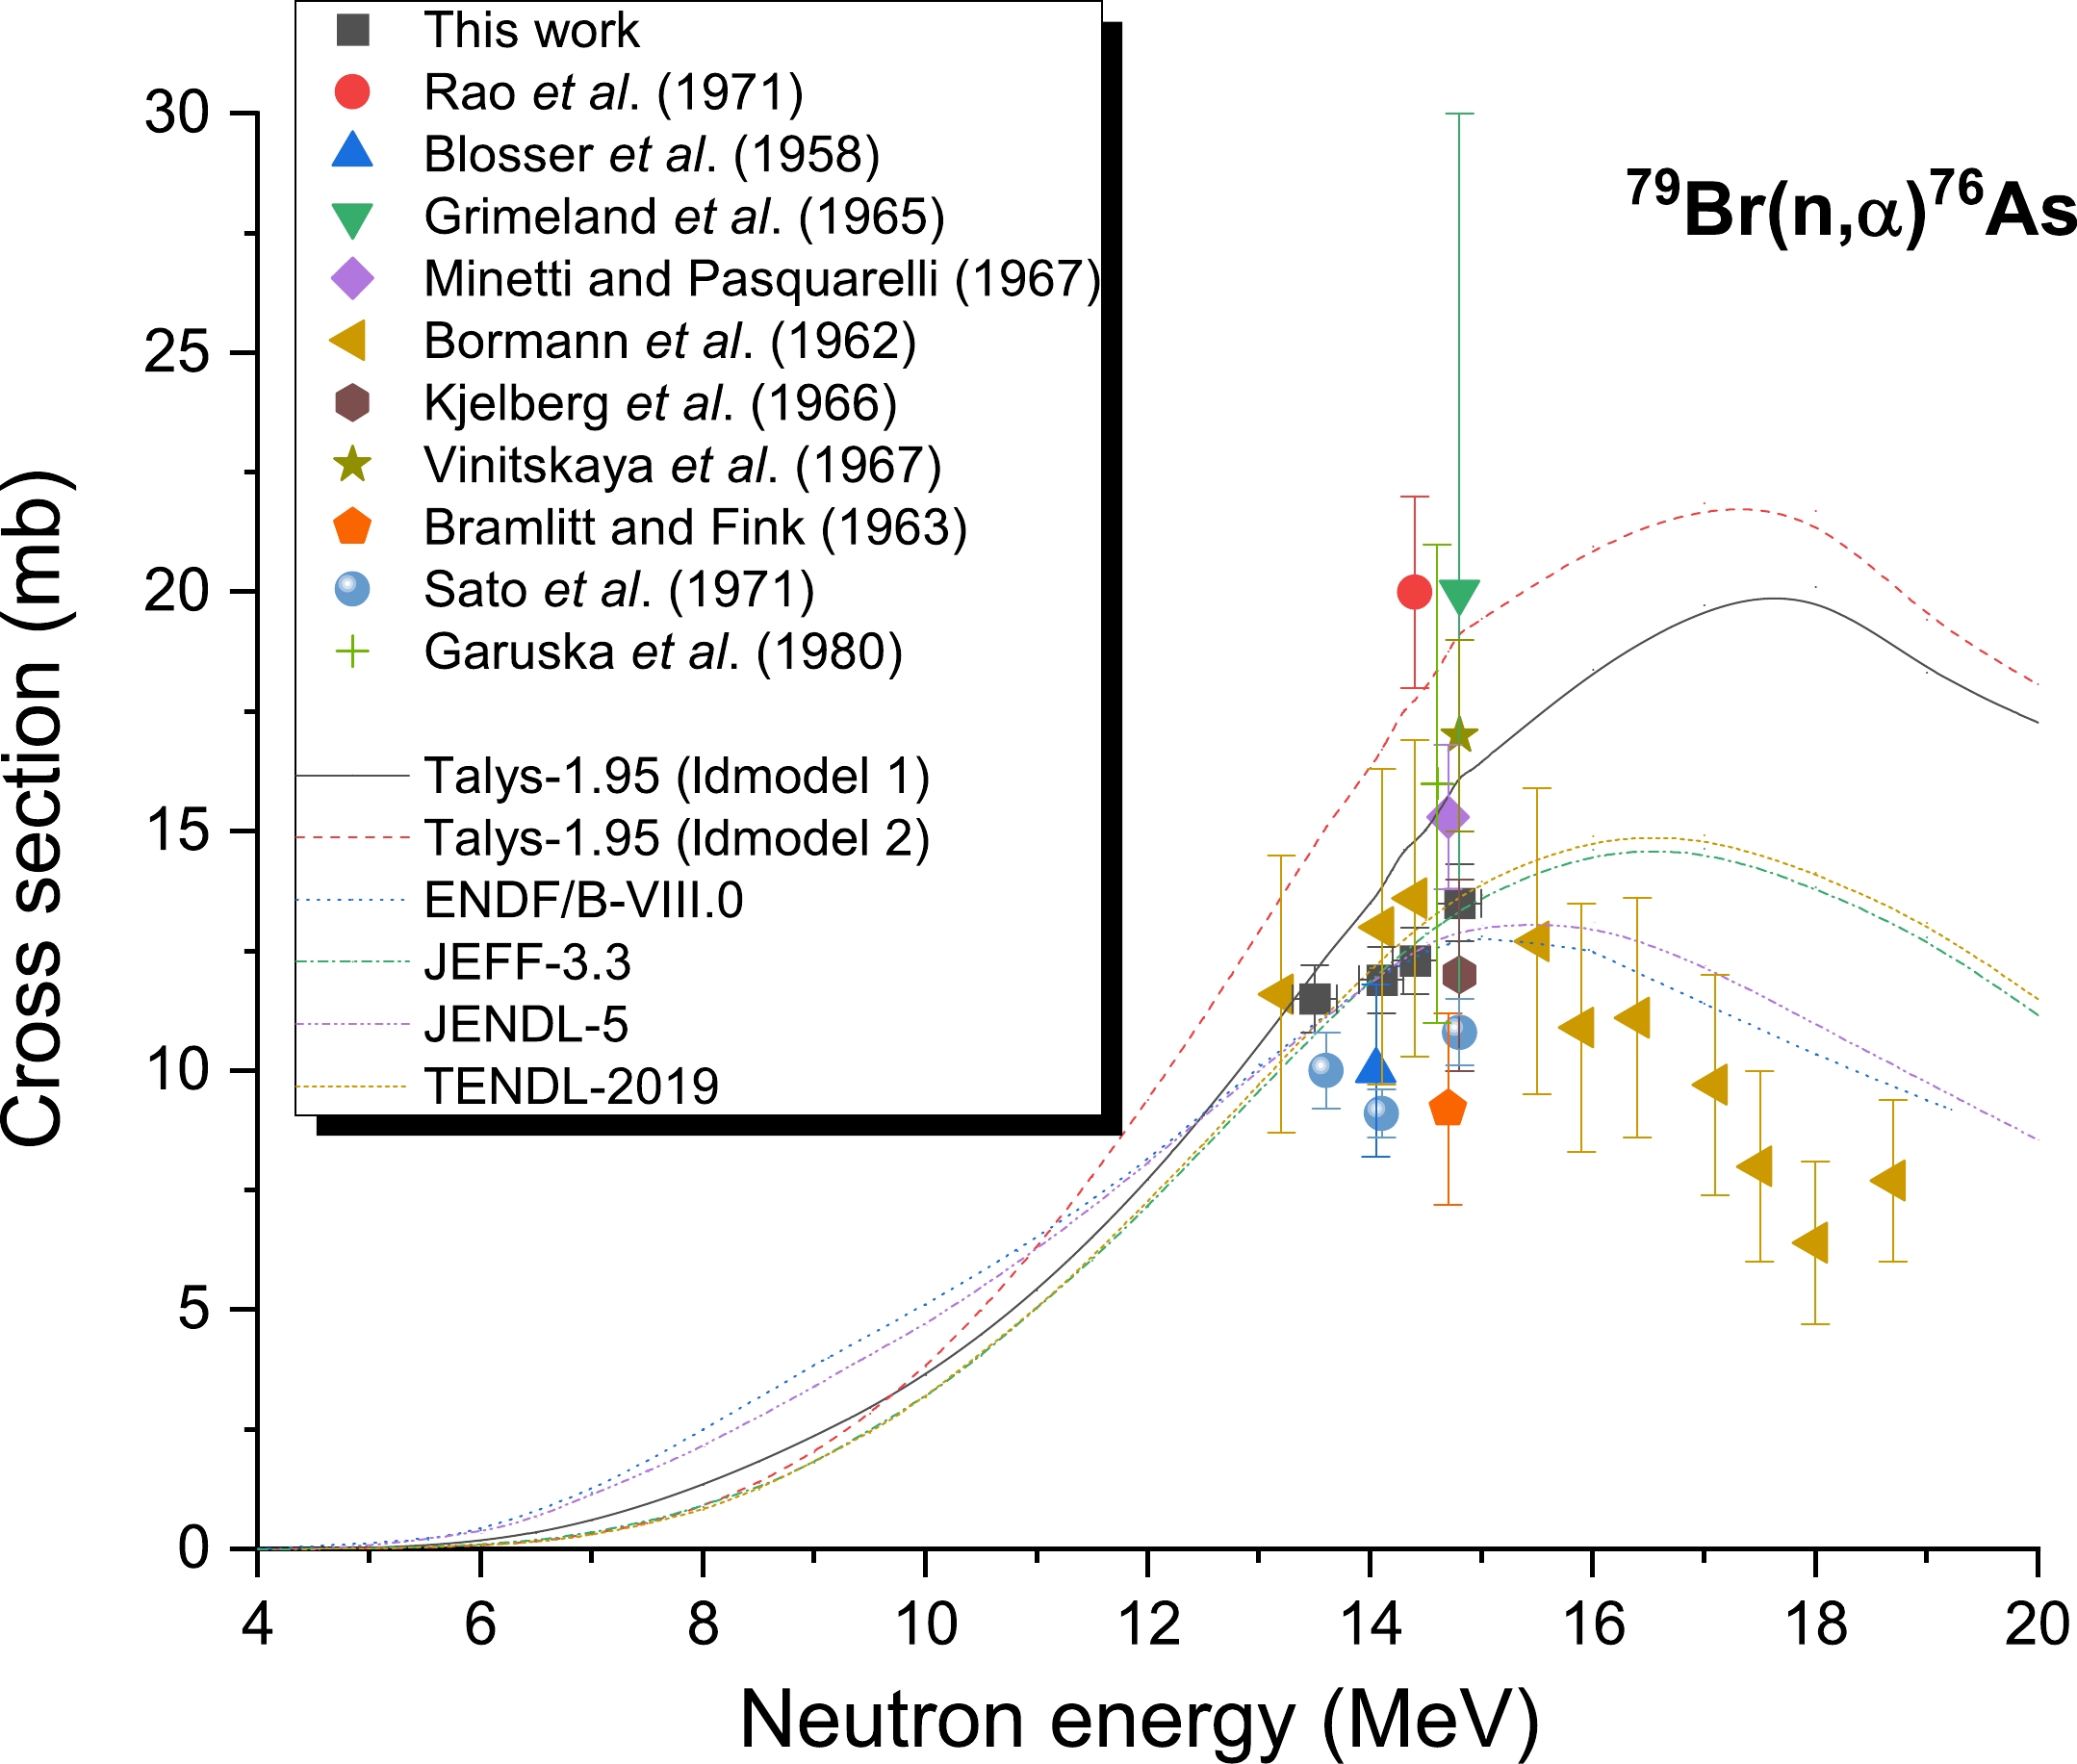
Likewise, Fig. 7 presents the cross-sections of the 79Br((n, α))76As reaction. Ten previous reports on the cross-section of this reaction have been documented, including by Minetti and Pasquarelli (1967) [9], Rao et al. (1971) [5], Grimeland et al. (1965) [8], Kjelberg et al. (1966) [19], Bramlitt and Fink (1963) [23], Vinitskaya et al. (1967) [22], Sato et al. (1971) [24], Garuska et al. (1980) [25], Bormann et al. (1962) [26], and Blosser et al. (1958) [27]. The cross-section values of the reaction under consideration are scattered according to Fig. 7, and the uncertainty is relatively large in the 13.3–15 MeV neutron energy span. It is also evident in Fig. 7 that the data generated in the current investigation is consistent with the results of the ENDF/B-VIII.0 [31], JEFF-3.3 [28], JENDL-4.0 [29], and TENDL-2019 [30] libraries and literature values [8, 9, 19, 25–27] within the limits of allowable experimental uncertainties. In the 14 MeV region, the values obtained in our investigation were high compared to the literature values [23, 24]; however, they were lower compared to the findings of the TALYS-1.95 calculations using ldmodels 1 and 2 and the results of Vinitskaya et al. (1967) [22] and Rao et al. [5].
-
Using the activation method, the 79Br((n, 2n))78Br, 81Br((n, α))78As, 81Br(n, p)81mSe, and 79Br((n, α))76As reactions were investigated in the 14 MeV neutron energy region. The covariance analysis method was utilized to perform a comprehensive investigation of the unpredictability of the cross-sectional measurement data. It was estimated that the margin of error for the results lay somewhere between 3.82% and 6.26% for the 79Br((n, 2n))78Br, 81Br(n, p)81mSe, and 79Br((n, α))76As reactions, and between 14.04% and 16.25% for the 81Br((n, α))78As reaction. Talys-1.95 was used to perform calculations to determine the cross-sections of the above reactions up to a neutron energy of 20 MeV. We compared the results of our study to those obtained from earlier experiments, evaluations of data, and theoretical projections derived from the Talys-1.95 computer program. Overall, the results of this measurement had a lower degree of uncertainty. The neutron cross-section databases are anticipated to increase as a result of our findings. We anticipate that between the origin and 20 MeV, the energy range of incident neutrons, these findings will yield novel cross-section results for bromine isotopes. Furthermore, accurate cross-sectional data can be an essential component in the model verification of nuclear reactions and determining the parameters of nuclear reaction models, particularly in the case of nuclear reactions with conflicting experimental data.
New cross-section measurements for the (n, 2n), (n, p), and (n, α) reactions on bromine in the 14 MeV region with detailed uncertainty quantification
- Received Date: 2022-09-07
- Available Online: 2023-03-15
Abstract: Measurement of the cross-sections of the 79Br(n, 2n)78Br, 81Br(n, p)81mSe, 81Br(n, α)78As, and 79Br(n, α)76As reactions was performed at specific neutron energies, precisely, 13.5±0.2, 14.1±0.2, 14.4±0.2, and 14.8±0.2 MeV, relative to the standard 93Nb(n, 2n)92mNb and 27Al(n, α)24Na reference reactions using offline γ-ray spectrometry and neutron activation. Monoenergetic neutrons were generated at the China Academy of Engineering Physics via a 3H(d, n)4He reaction using the K-400 Neutron Generator equipped with a solid 3H-Ti based target. The activity of the reaction produce was obtained using a high-purity germanium detector. The cross-sections of the (n, 2n), (n, p), and (n, α) reactions on the bromine isotopes were measured in the 13–15 MeV neutron energy range. The covariance analysis approach was employed for a thorough inspection of any uncertainties within the measured cross-section data. A discussion and comparison of the observed outcome were carried out with previously published data, especially with the results of the JENDL-4.0, JEFF-3.3, TENDL-2019, and ENDF/B-VIII.0 data libraries, along with the theoretical excitation function curve derived by employing the TALYS-1.95 program. Improved cross-section restrictions for the investigated processes in the 13–15 MeV neutron energy range will be obtained using the current findings, which will help to raise the caliber of associated databases. Furthermore, the parameters of relevant nuclear reaction models can be verified using this data.


 Abstract
 HTML
HTML Reference
 Related
 PDF
PDF




 DownLoad: