


 Abstract
 HTML
HTML Reference
 Related
 PDF
PDF


-
Neutron induced cross section data are important for monitors and structural materials in fusion devices. Yttrium (Y), a grayish white metal, is naturally present as a single stable isotope, 89Y. The 89Y(n, 2n)88m+gY nuclear reaction is used to monitor the neutron energy in fusion reactors [1]. Zinc (Zn), a silver-gray metal, is found naturally occurring as five stable isotopes, 70Zn(0.61%), 68Zn(18.45%), 67Zn(4.04%), 66Zn(27.73%), and 64Zn(49.17%). Molybdenum (Mo) is a silvery white metal found occurring naturally as seven stable isotopes, 100Mo(9.82%), 98Mo(24.39%), 97Mo(9.6%), 96Mo(16.67%), 95Mo(15.84%), 94Mo(9.15%), and 92Mo(14.53%). Zinc and molybdenum are used as structural materials in fusion reactors [2]. Additionally, 63Zn and 99Mo are important radionuclides. 99Mo decays to 99mTc, which along with 63Zn is used in positron emission tomography [3]. Experimental data in the exchange format (EXFOR) database [4], even if reported at the same neutron energies, differ in the nuclear data (half-life of product, γ-ray intensity, and monitor cross section data) and detector used for gamma ray spectrometry. This can lead to disagreement between earlier measurements and recently reported cross sections upon normalization with the updated nuclear databases. In addition, there is a requirement for measured cross sections to be reported with covariances. Therefore, it is important to improve the accuracy by remeasuring cross sections for reactions where discrepancies exist between experimental data and evaluated data.
This paper includes a detailed description of the experimental setup, sample preparation, methodology for induced activity measurements, and uncertainty estimation. Moreover, a brief outline of nuclear model calculations with the TALYS-1.96 [5] and EMPIRE-3.2.3 [6] nuclear codes is provided. The results were compared with the previous measurements and evaluated nuclear data libraries [1, 7, 8].
-
Samples of pure Zn metal (99.99%) powder, Y2O3 (99.99%) powder, and MoO3 (99.99%) powder of natural isotopic abundance were prepared by packing known weights of sample powder into polythene vials. The samples were sandwiched between two aluminum foils of known weight, and the sample size was 10 mm × 10 mm. Details on the isotopic abundance, weight, thickness, and density of the samples are summarized in Table 1. The samples were irradiated at the 14 MeV Neutron Generator facility [9], Department of Physics, Savitribai Phule Pune University, Pune, India. The 14 MeV neutron beam was produced by bombarding ~150 keV D+ ions on an 8 Ci TiT (titanium-tritide) solid target. The temperature of the TiT target with copper backing was controlled by a water-cooling system. The deuterium ion beam current on the target was ~60 μA at an accelerating voltage of 150 ± 1 kV. A sample wrapped in aluminum monitor foil was mounted at 0° with respect to the incident deuterium beam at a distance of 1 cm from the TiT target. Irradiation was carried out separately for each sample. The neutron energy at the sample position corresponds to 14.77 ± 0.17 MeV. The neutron energy of 14.77 MeV was predetermined for the particular sample foil geometry, irradiation position, and D+ energy from the ratio of the cross sections of the 90Zr(n, 2n)89Zrg reaction to the cross section of the 93Nb(n, 2n)92Nbm reaction [10]. Here, foils containing 90Zr and 93Nb with dimensions of 10 mm × 10 mm were irradiated with neutrons at the same distance from the TiT target. The neutron energy was deduced by comparing the ratio of the saturated activities per unit mass (considering the decay constant, branching ratios, isotopic abundance, irradiation time, and efficiency) of 89Zrg to 92Nbm with the ratio of the standard ENDF/B-VIII.0 cross section evaluations for the 90Zr(n, 2n)89Zrg and 93Nb(n, 2n)92Nbm reactions. The uncertainty in the neutron energy at the irradiation position was 0.17 MeV, which originated from the sample geometry, sample distance from the TiT target, and the radius of the D+ beam [11]. The samples were transferred to the counting room after irradiation.
Target
isotopeAbundance
/(%)Sample
weight
/gSample
thickness
/cmSample
density
/(g/cm3)70Zn 0.61 ± 0.1 2.0086 ± 0.0005 0.1 7.133 68Zn 18.45 ± 0.63 67Zn 4.04 ± 0.16 66Zn 27.73 ± 0.98 64Zn 49.17 ± 0.75 27Al 100 0.5029 ± 0.0005 0.02 2.7 89Y 100 0.5018 ± 0.0005 0.1 5.01 27Al 100 0.3 ± 0.0005 0.02 2.7 100Mo 9.82 ± 0.31 2 ± 0.0005 0.1 4.69 98Mo 24.39 ± 0.37 97Mo 9.60 ± 0.14 96Mo 16.67 ± 0.15 95Mo 15.84 ± 0.11 94Mo 9.15 ± 0.09 92Mo 14.53 ± 0.3 27Al 100 0.2877 ± 0.0005 0.02 2.7 Table 1. Sample details of the present study.
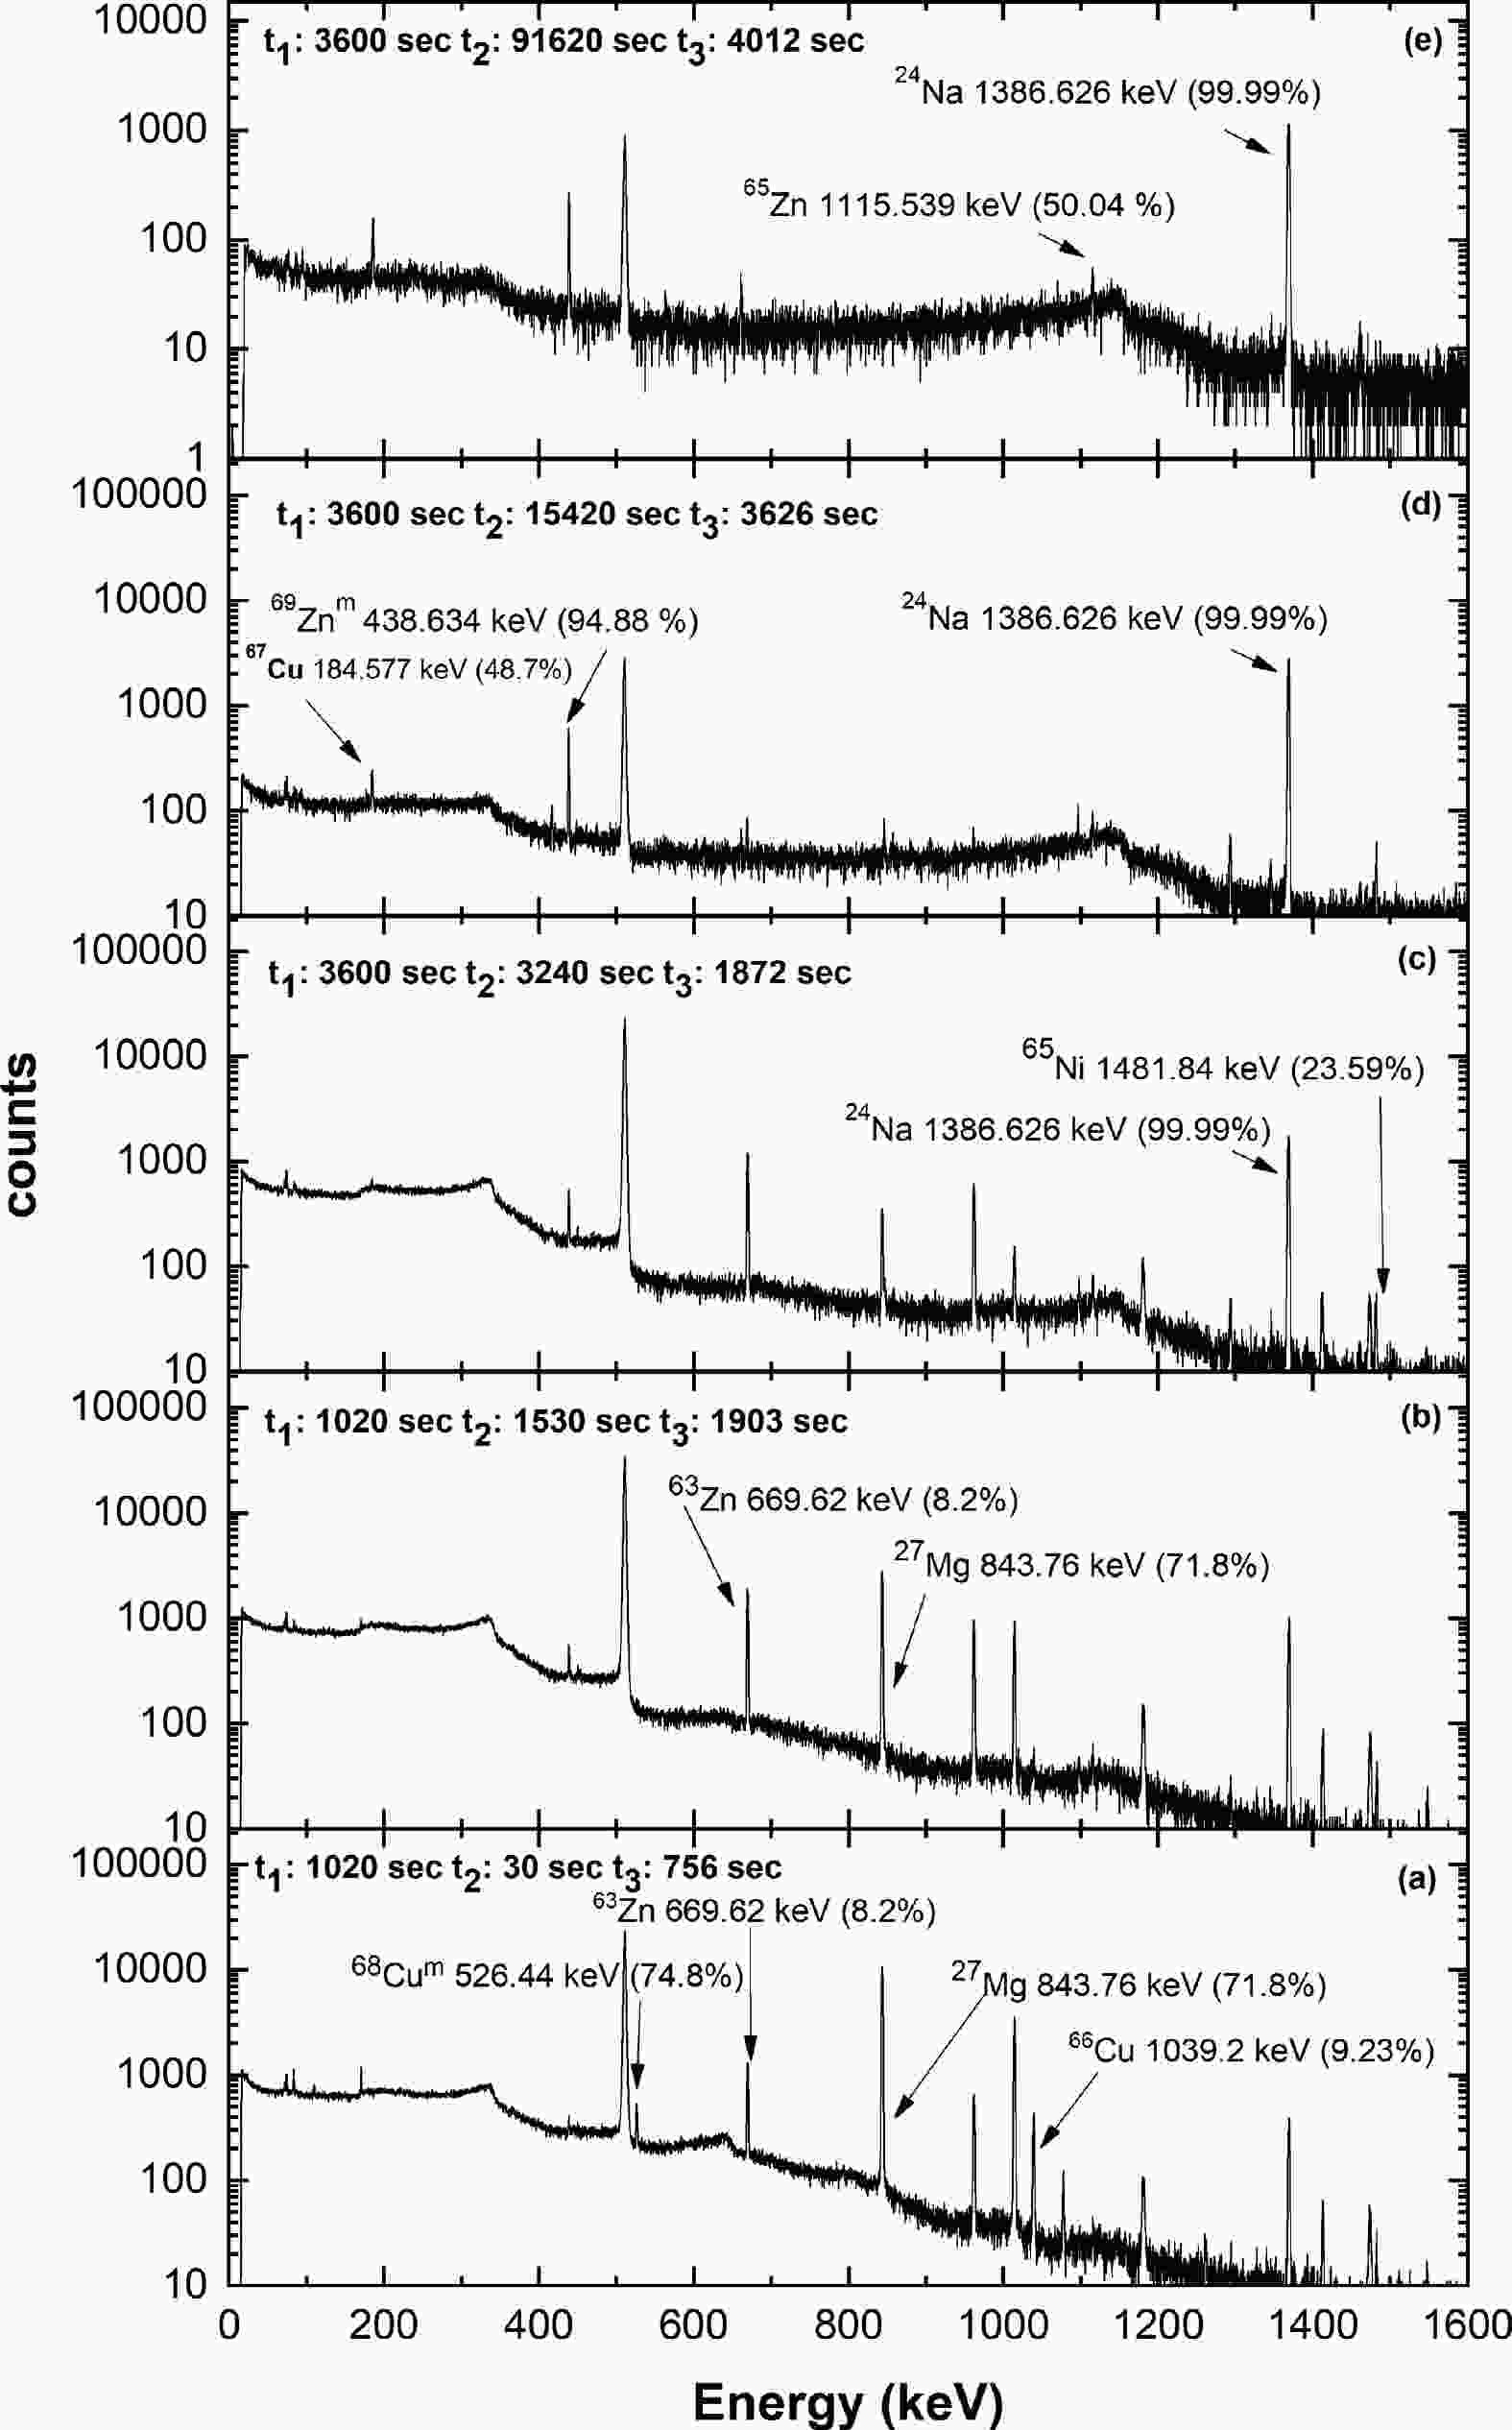
The gamma-ray activity of the irradiated samples was measured using a pre-calibrated lead-shielded Ortec high-purity germanium (HPGe) detector with 30% relative efficiency and 1.5 keV energy resolution at a gamma energy of 1.33 MeV. The data acquisition was performed with an Ortec-make EASY-MCA-8K Multichannel Analyzer and Maestro software. The dead time during counting was maintained below 2%. The recorded gamma-ray spectra for natZn+Al, Y+Al, and natMo+Al samples irradiated by 14.77 MeV neutrons are shown in Fig. 1, Fig. 2, and Fig. 3, respectively. In Figs. 1 to 3,
$ {t}_{1} $ is the irradiation time,$ {t}_{2} $ is the cooling time, and$ {t}_{3} $ is the counting time. In Fig. 1 (a) and (b), the short half-life gamma-ray spectra are shown for product nuclides 68Cum, 66Cu, and 63Zn along with the monitor reaction product nuclide 27Mg. In Fig. 1 (c), (d), and (e), the long half-life gamma-ray spectra are shown for product nuclides 65Ni, 67Cu, 69Znm, and 65Zn along with the monitor reaction product nuclide 24Na. In Fig. 2, the gamma-ray spectrum is shown for product nuclides 90Ym and 88Y along with the monitor reaction product nuclide 24Na. In Fig. 3 (a), the short half-life gamma-ray spectrum is shown for product nuclides 89Zrm and 98Nbm along with the monitor reaction product nuclide 27Mg. In Fig. 3 (b) and (c), the long half-life gamma-ray spectra are shown for product nuclides 97Nbg, 99Mo, 93Mom, 96Nb, 89Zrg, and 92Nbm along with the monitor reaction product nuclide 24Na. The nuclear data adopted for the calculation of cross sections are given in Table 2 along with the respective references. The details of the threshold energy, cooling time, counting time, and gamma-ray net peak counts are listed in Table 3.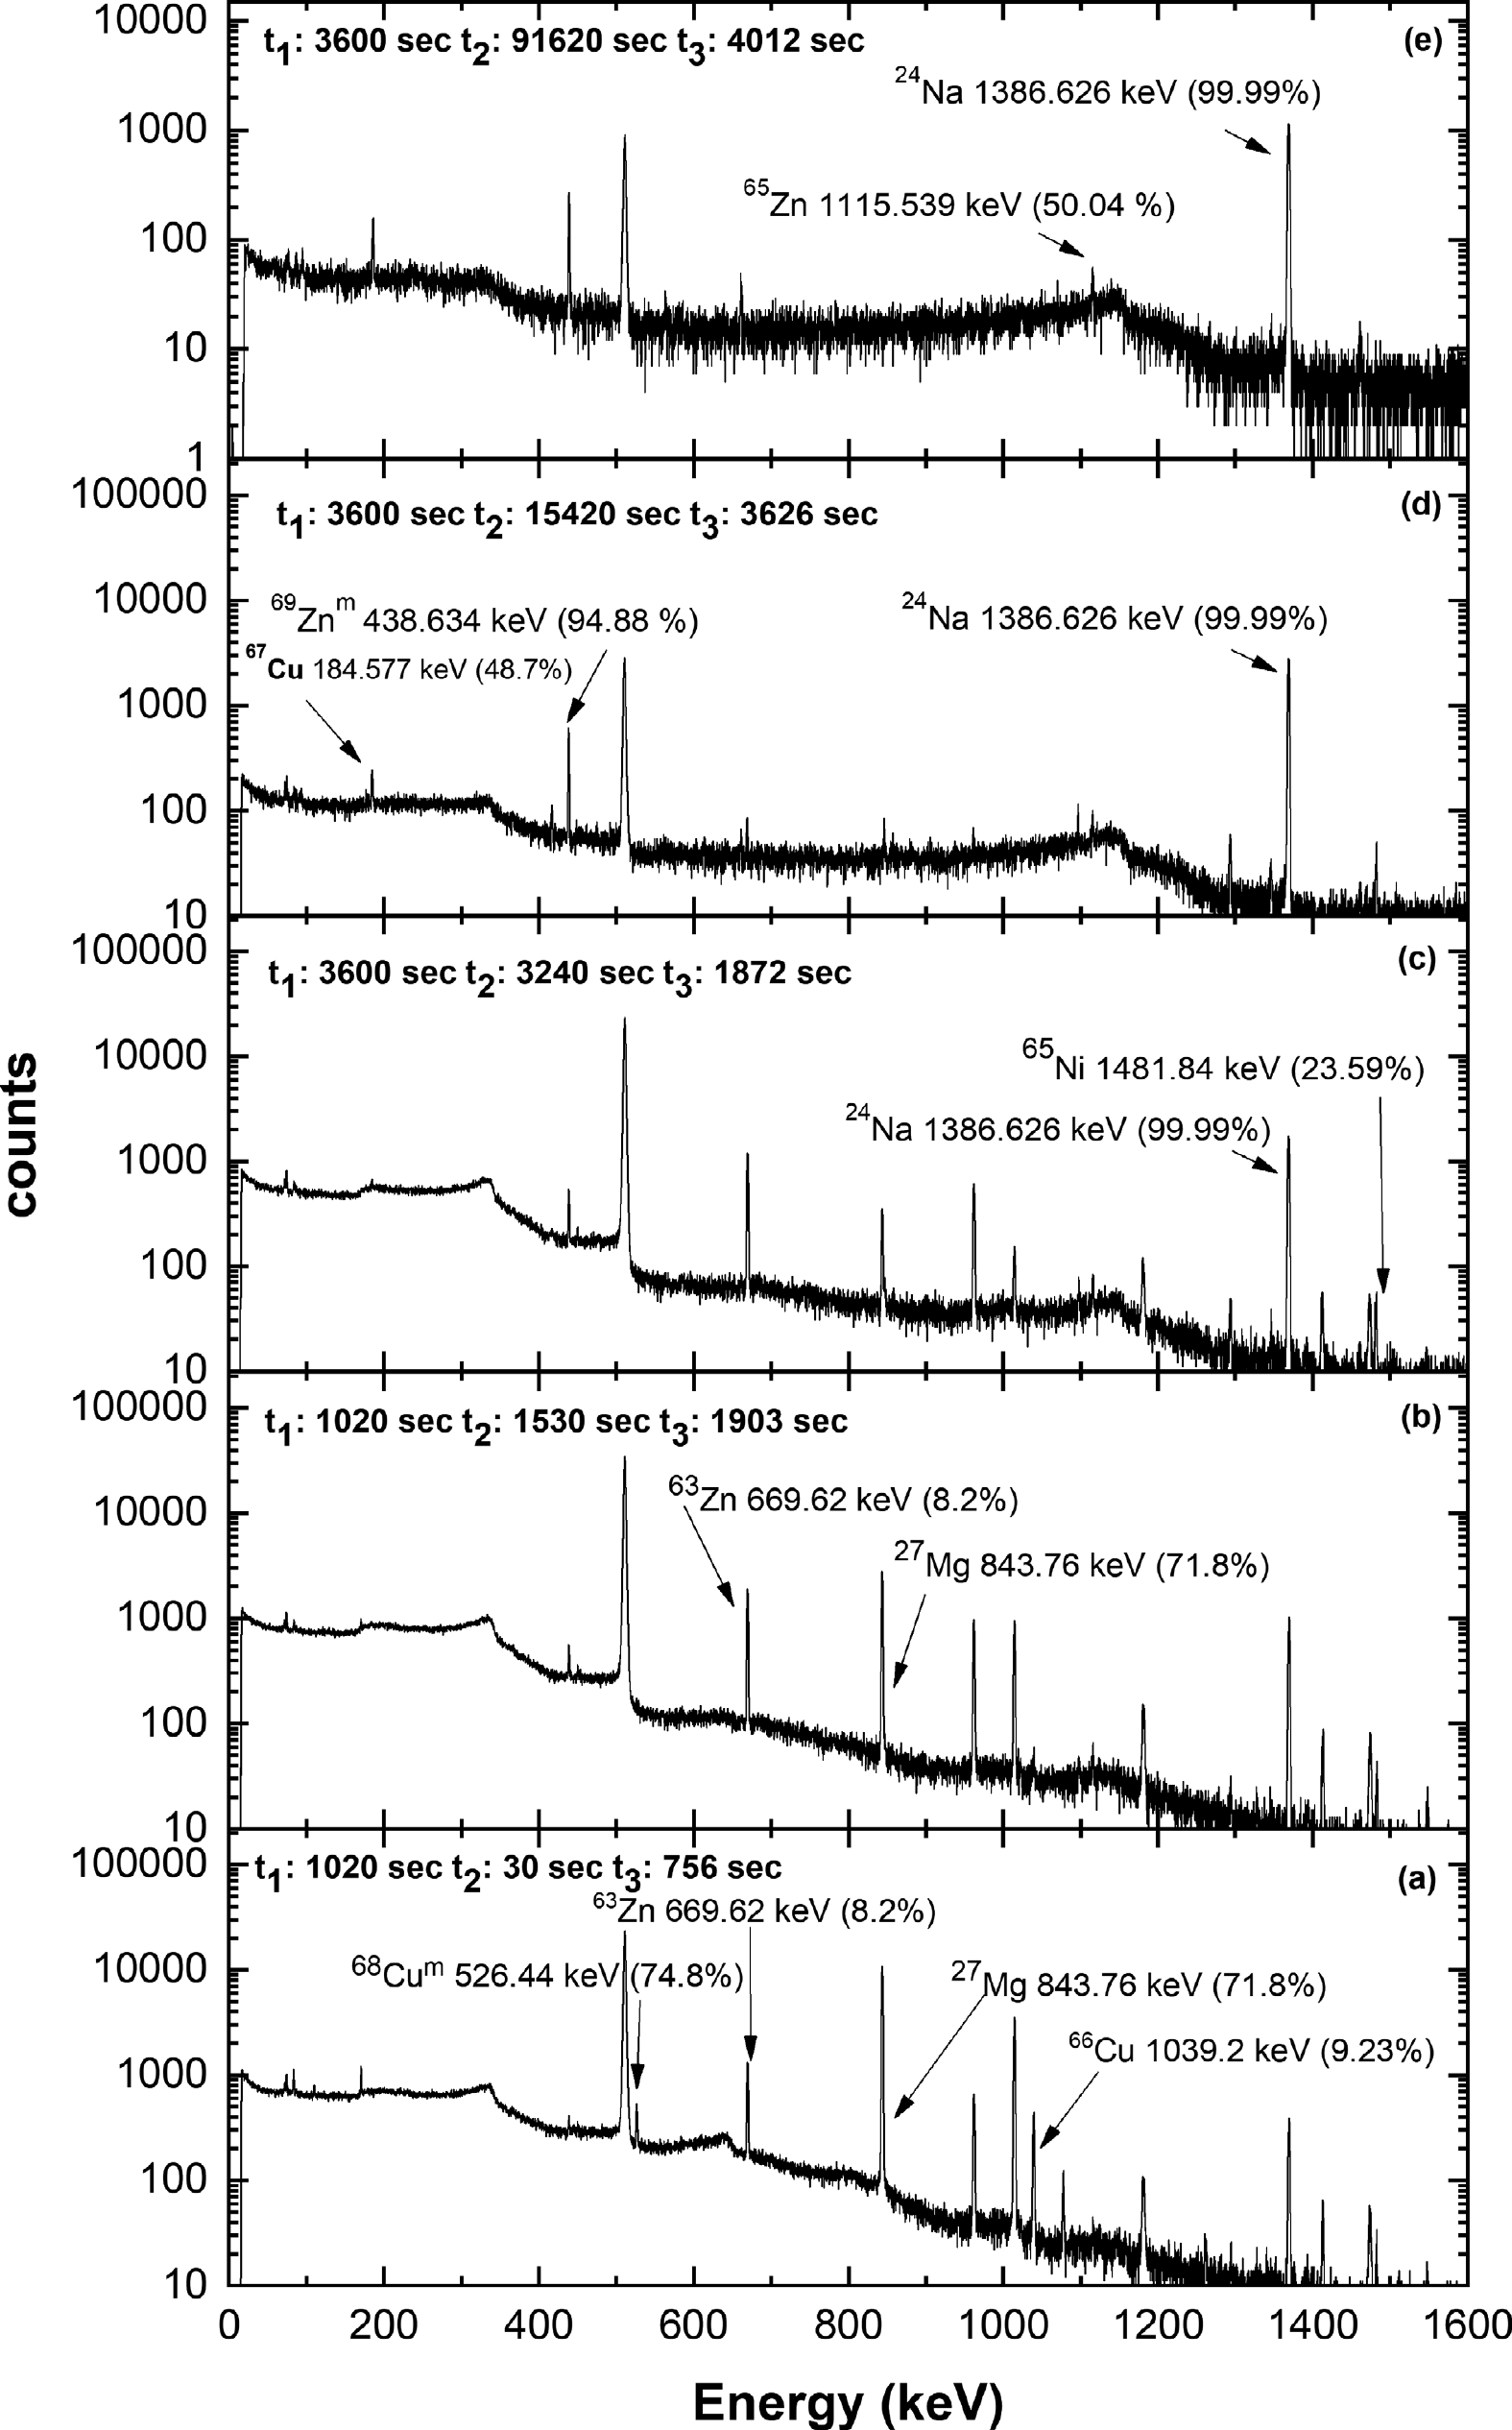
Figure 1. Recorded gamma-ray spectra of irradiated natZn sample and Al monitor.
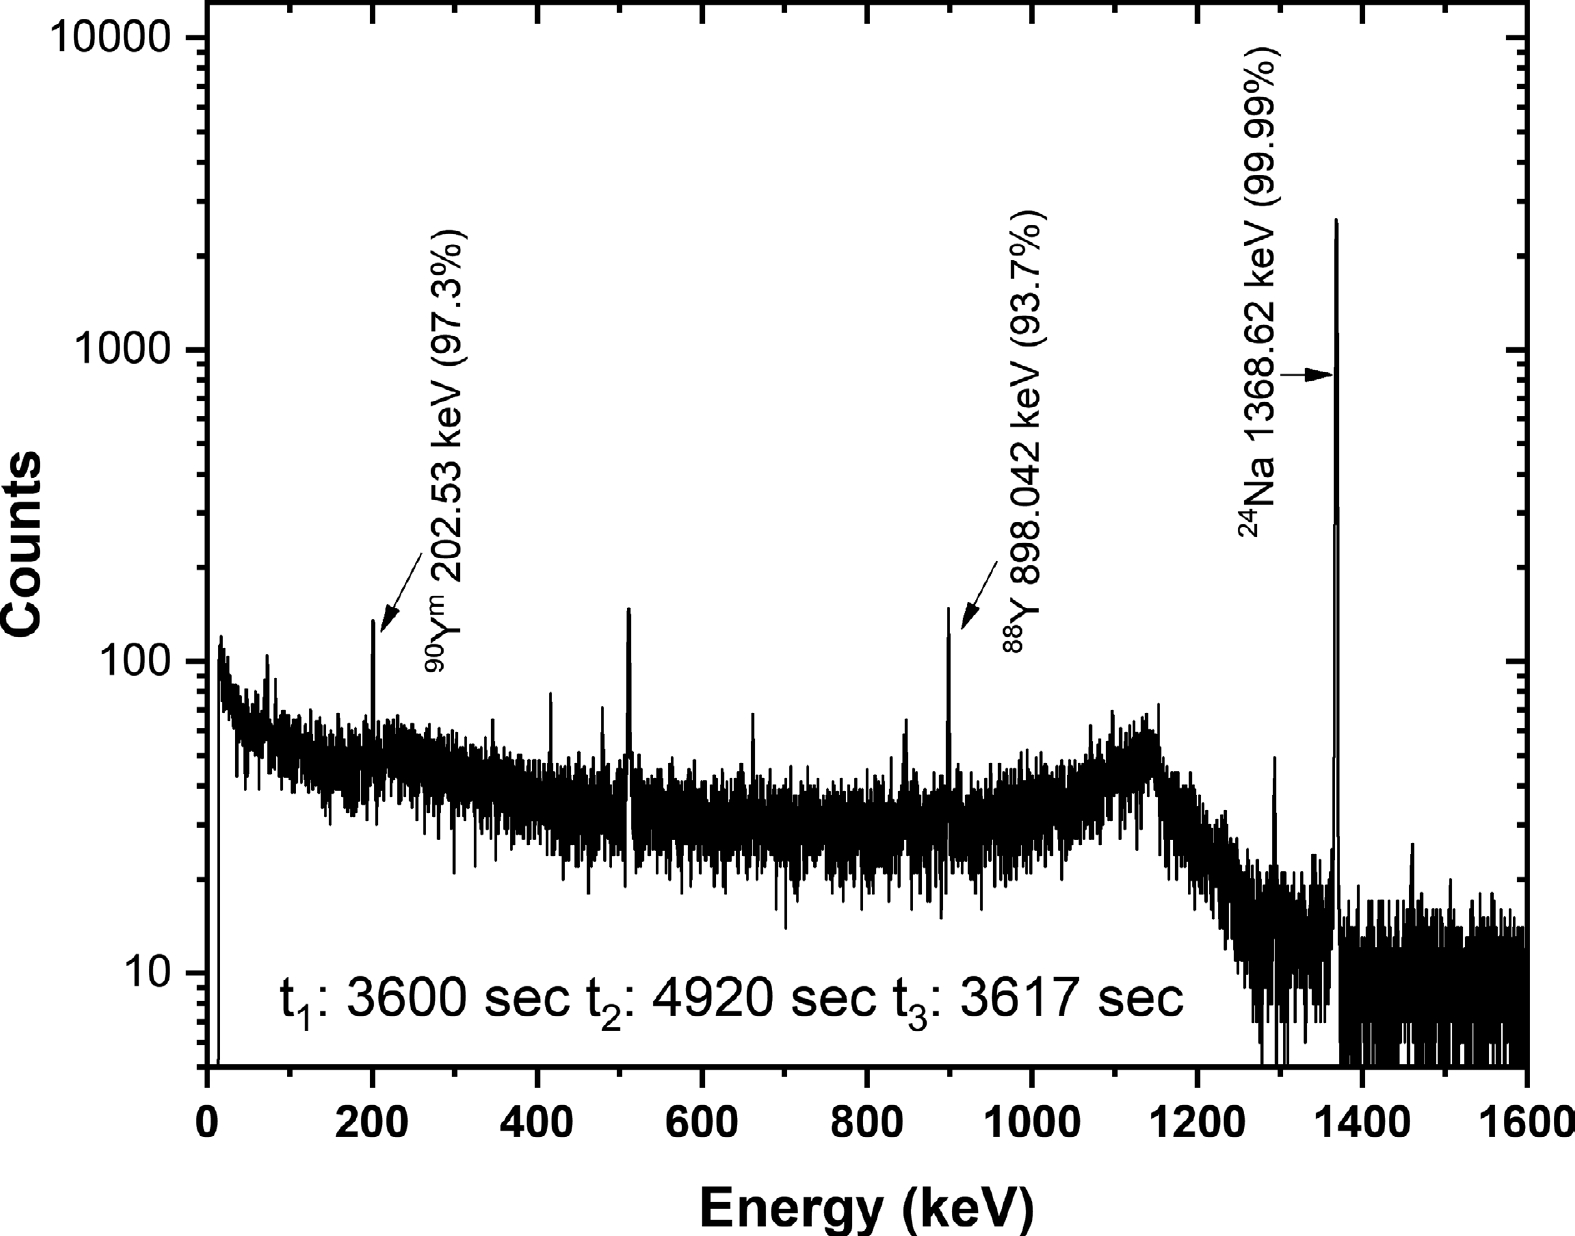
Figure 2. Recorded gamma-ray spectrum of irradiated natY sample and Al monitor.
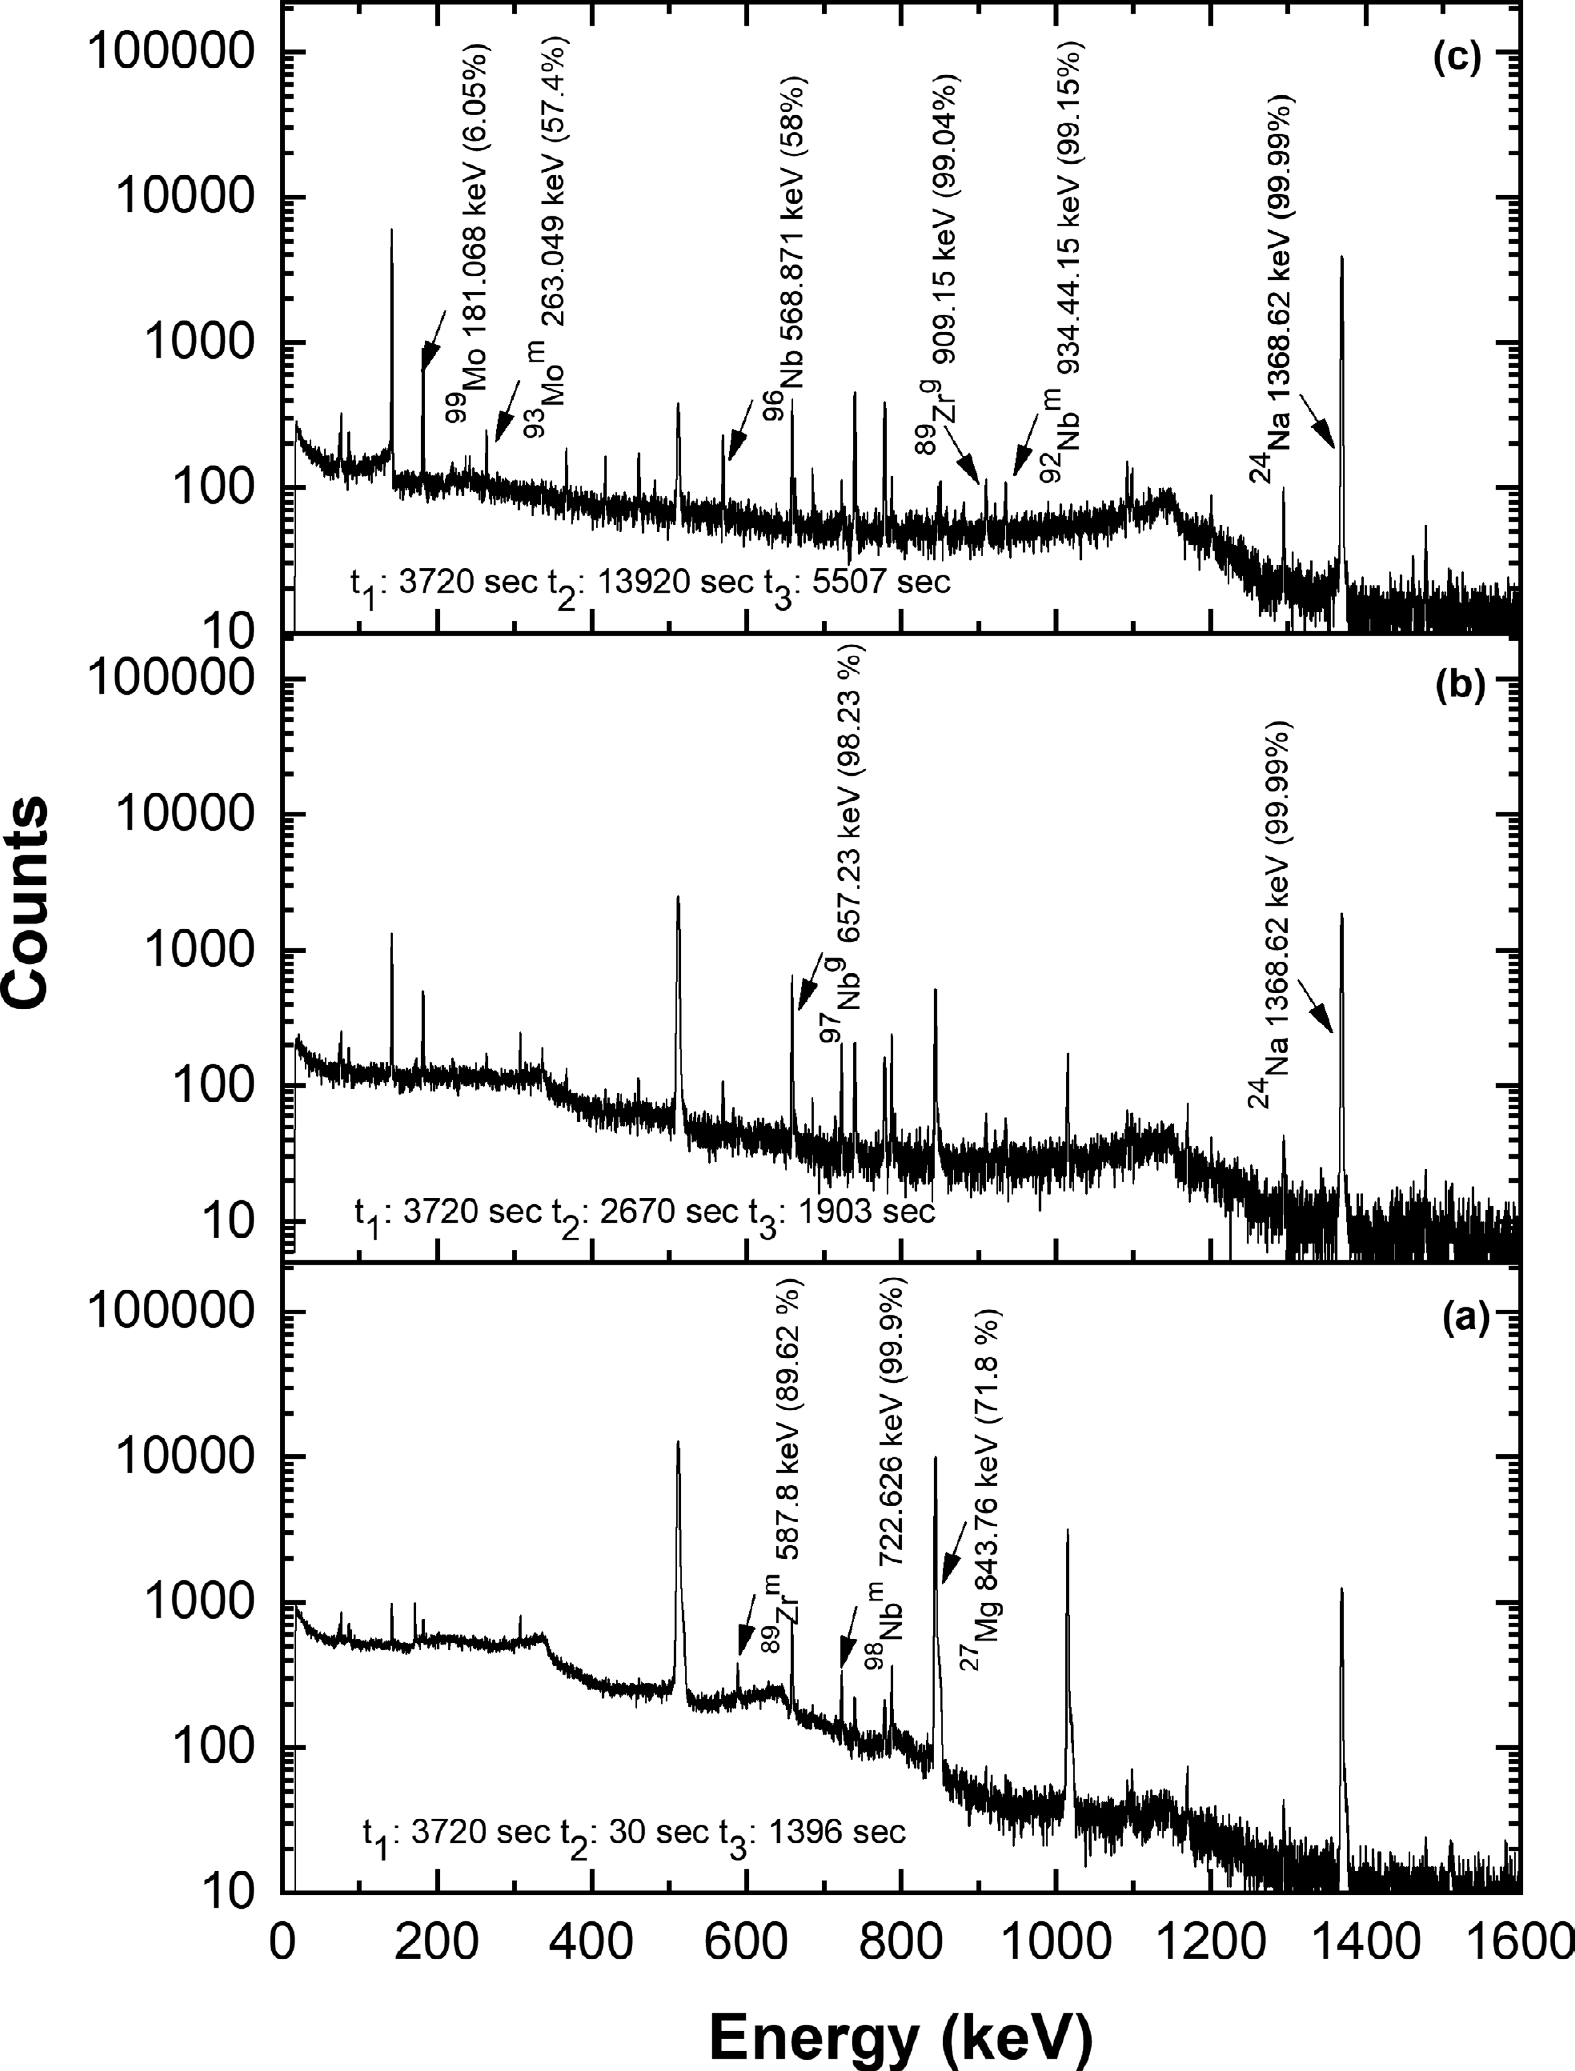
Figure 3. Recorded gamma-ray spectra of irradiated natMo sample and Al monitor.
Nuclide T1/2 Decay mode Eγ
/keVIγ
(%)Reference 69Znm 13.756 ± 0.018 hr IT (99.967%) 438.634 94.88 ± 0.07 [12] 68Cum 3.75 ± 0.05 min IT (86%) 526.44 74.8 ± 1.7 [13] 65Ni 2.5175 ± 0.0005 hr β− (100%) 1481.84 23.59 ± 0.14 [14] 67Cu 61.83 ± 0.12 hr β− (100%) 184.577 48.7 ± 0.3 [15] 66Cu 5.120 ± 0.014 min β− (100%) 1039.2 9.23 ± 0.09 [16] 65Zn 243.93 ± 0.09 days ec β+ (100%) 1115.539 50.04 ± 0.10 [14] 63Zn 38.47 ± 0.05 min ec β+ (100%) 669.62 8.2 ± 0.3 [17] 90Ym 3.19 ± 0.06 hr IT (99.9982%) 202.53 97.3 ± 0.04 [18] 88Y 106.626 ± 0.021 days ec β+ (100%) 898.042 93.7 ± 0.03 [19] 99Mo 65.924 ± 0.006 hr β− (100%) 181.068 6.05 ± 0.12 [20] 98Nbm 53.3 ± 0.4 min β− (99.9%) 722.626 73.8 ± 1.5 [21] 97Nbg 72.1 ± 0.7 min β− (100%) 657.23 98.23 ± 0.08 [22] 96Nb 23.35 ± 0.05 hr β− (100%) 568.871 58.0 ± 0.3 [23] 93Mom 6.85 ± 0.07 hr IT (99.88%) 263.049 57.4 ± 1.1 [24] 92Nbm 10.15 ± 0.02 days ec β+ (100%) 934.44 99.15 ± 0.04 [25] 89Zrm 4.161 ± 0.010 min IT (93.77%) 587.8 89.62 ± 0.17 [26] 89Zrg 78.41 ± 0.12 hr ec β+ (100%) 909.15 99.04 ± 0.03 [26] 27Mg 9.458±0.012 min β− (100%) 843.76 71.80±0.02 [27] 24Na 14.997±0.012 hr β− (100%) 1368.626 99.9936±0.0015 [28] Table 2. Decay data adopted in the present study.
Reaction Threshold energy
/MeVCooling time
/sCounting time
/sγ-ray net peak counts 70Zn(n, 2n)69Znm 9.796 15420 3626 4263 ± 114 68Zn(n, p)68Cum 4.331 30 756 2302 ± 140 68Zn(n, α)65Ni 0 3240 1872 677 ± 52 67Zn(n, p)67Cu 0 15420 3626 571 ± 60 66Zn(n, p)66Cu 1.887 30 756 3625 ± 85 66Zn(n, 2n)65Zn 11.226 91620 4012 220 ± 24 64Zn(n, 2n)63Zn 12.047 1480 1903 7835 ± 109 89Y(n, γ)90Ym 0 4920 3617 460 ± 40 89Y(n, 2n)88Y 11.611 4920 3617 583 ± 44 100Mo(n, 2n)99Mo 8.375 13920 5507 4053 ± 83 98Mo(n, p)98Nbm 3.936 30 1396 1444 ± 119 97Mo(n, p)97Nbg 1.165 2670 1903 2975 ± 78 96Mo(n, p)96Nb 2.435 13920 5507 1096 ± 79 94Mo(n, 2n)93Mom 12.232 13920 5507 622 ± 53 92Mo(n, p)92Nbm 0 13920 5507 336 ± 44 92Mo(n, α)89Zrm 0 30 1396 973 ± 100 92Mo(n, α)89Zrg 0 13920 5507 367 ± 45 Table 3. Details of threshold energy, cooling time, counting time, and gamma-ray counts for the product nuclides of the reactions.
-
A standard 152Eu (T1/2 = 13.517 ± 0.009 yr. [29]) source of known activity (A0 = 4336.98 ± 86.74 Bq as of 1 Oct. 1999) was used to calibrate the HPGe detector. The photo-peaks of six gamma lines of the 152Eu source were used to determine the detection efficiency of the HPGe detector. The detection efficiency ε for the point source placed at a distance of 2 mm from the end-cap of the detector is given by
$ {\epsilon }_{p}=\frac{C{K}_{C}}{{A}_{0}{\rm e}^{-\lambda T}{I}_{\gamma }\mathrm{\Delta }t}, $

(1) where
$ C $ is the number of counts obtained for a counting time ($ \mathrm{\Delta }t $ =3600 seconds) for a particular gamma-line of 152Eu with a branching ratio$ {I}_{\gamma } $ ,$ {K}_{C} $ is the correction factor for the coincidence summing effect calculated using EFFTRAN code [30],$ {A}_{0} $ is the activity of the 152Eu source at the time of manufacture, and T is the time between the date of manufacture and the beginning of counting. In addition, the EFFTRAN code was used to transfer efficiencies from point source geometry ($ {\epsilon }_{p} $ ) to sample geometry ($ {\epsilon }_{f} $ ). The uncertainty in detection efficiency was calculated by following Ref. [11] and is listed in Table 4. The correlation matrix for the measured detection efficiency is presented in Table 5. The efficiencies of the detector at required energies were generated with a linear parametric function following Ref. [31] by varying m from 1 to 6$ {\mathit{E}}_{\mathit{\gamma }} $ /keV

$ {\mathit{I}}_{\mathit{\gamma }} $ (%)

C $ {\mathit{K}}_{\mathit{C}} $ 

$ {\mathit{\epsilon }}_{\mathit{p}} $ (

$ {\mathit{E}}_{\mathit{\gamma }}) $ 

$ {\mathit{\epsilon }}_{\mathit{f}} $ 

$ {\Delta \mathit{\epsilon }}_{\mathit{f}} $ 

121.78 28.53 ± 0.016 171345 ± 461 1.2987 15.477 15.107 0.305 344.28 26.59 ± 0.20 98114 ± 338 1.191 8.799 8.516 0.184 778.9 12.93 ± 0.08 21679 ± 182 1.2975 4.364 4.218 0.095 964.08 14.51 ± 0.07 21573 ±176 1.1897 3.542 3.422 0.076 1112.07 13.67 ± 0.08 19538 ± 176 1.099 3.153 3.046 0.069 1408.01 20.87 ± 0.09 24057 ± 167 1.1379 2.632 2.542 0.055 Table 4. Detection efficiencies (%) for the point source geometry
$ {\epsilon }_{p} $ , foil geometry$ {\epsilon }_{f} $ , and uncertainty.$ {\mathit{E}}_{\mathit{\gamma }} $ /keV

$ {\mathit{\epsilon }}_{\mathit{f}} $ (%)

Correlation matrix 121.78 15.107 ± 0.305 1 344.28 8.516 ± 0.184 0.916 1 778.9 4.218 ± 0.095 0.879 0.82 1 964.08 3.422 ± 0.076 0.895 0.835 0.801 1 1112.07 3.046 ± 0.069 0.873 0.814 0.781 0.796 1 1408.01 2.542 ± 0.055 0.917 0.856 0.821 0.837 0.816 1 Table 5. Correlation matrix for the measured detection efficiencies.
$ \mathrm{ln}{\epsilon }_{i}=\sum _{i=1}^{m}{p}_{m}{\left(\mathrm{ln}{E}_{i}\right)}^{m-1}. $

(2) The best quality of fit was achieved for
$ m=4 $ , with${\dfrac{\chi^{2} }{6-4}}=1.073 \approx 1$ , where$ {p}_{m} $ is the parameter of the fitting function, m is the order of the fitting function, and$ {E}_{i} $ is the energy of γ-lines in MeV. The efficiencies corresponding to the γ-rays of the reaction products were determined using the following linear parametric model:$ \mathrm{ln}\epsilon =-3.398-0.857(\mathrm{ln}E)+0.107{\left(\mathrm{ln}E\right)}^{2}+0.082{(\mathrm{ln}E)}^{3}. $

(3) The interpolated detection efficiency curve and measured detection efficiencies are plotted in Fig. 4. The interpolated efficiencies, correlation matrix for the sample, and monitor reactions are listed in Table 6.
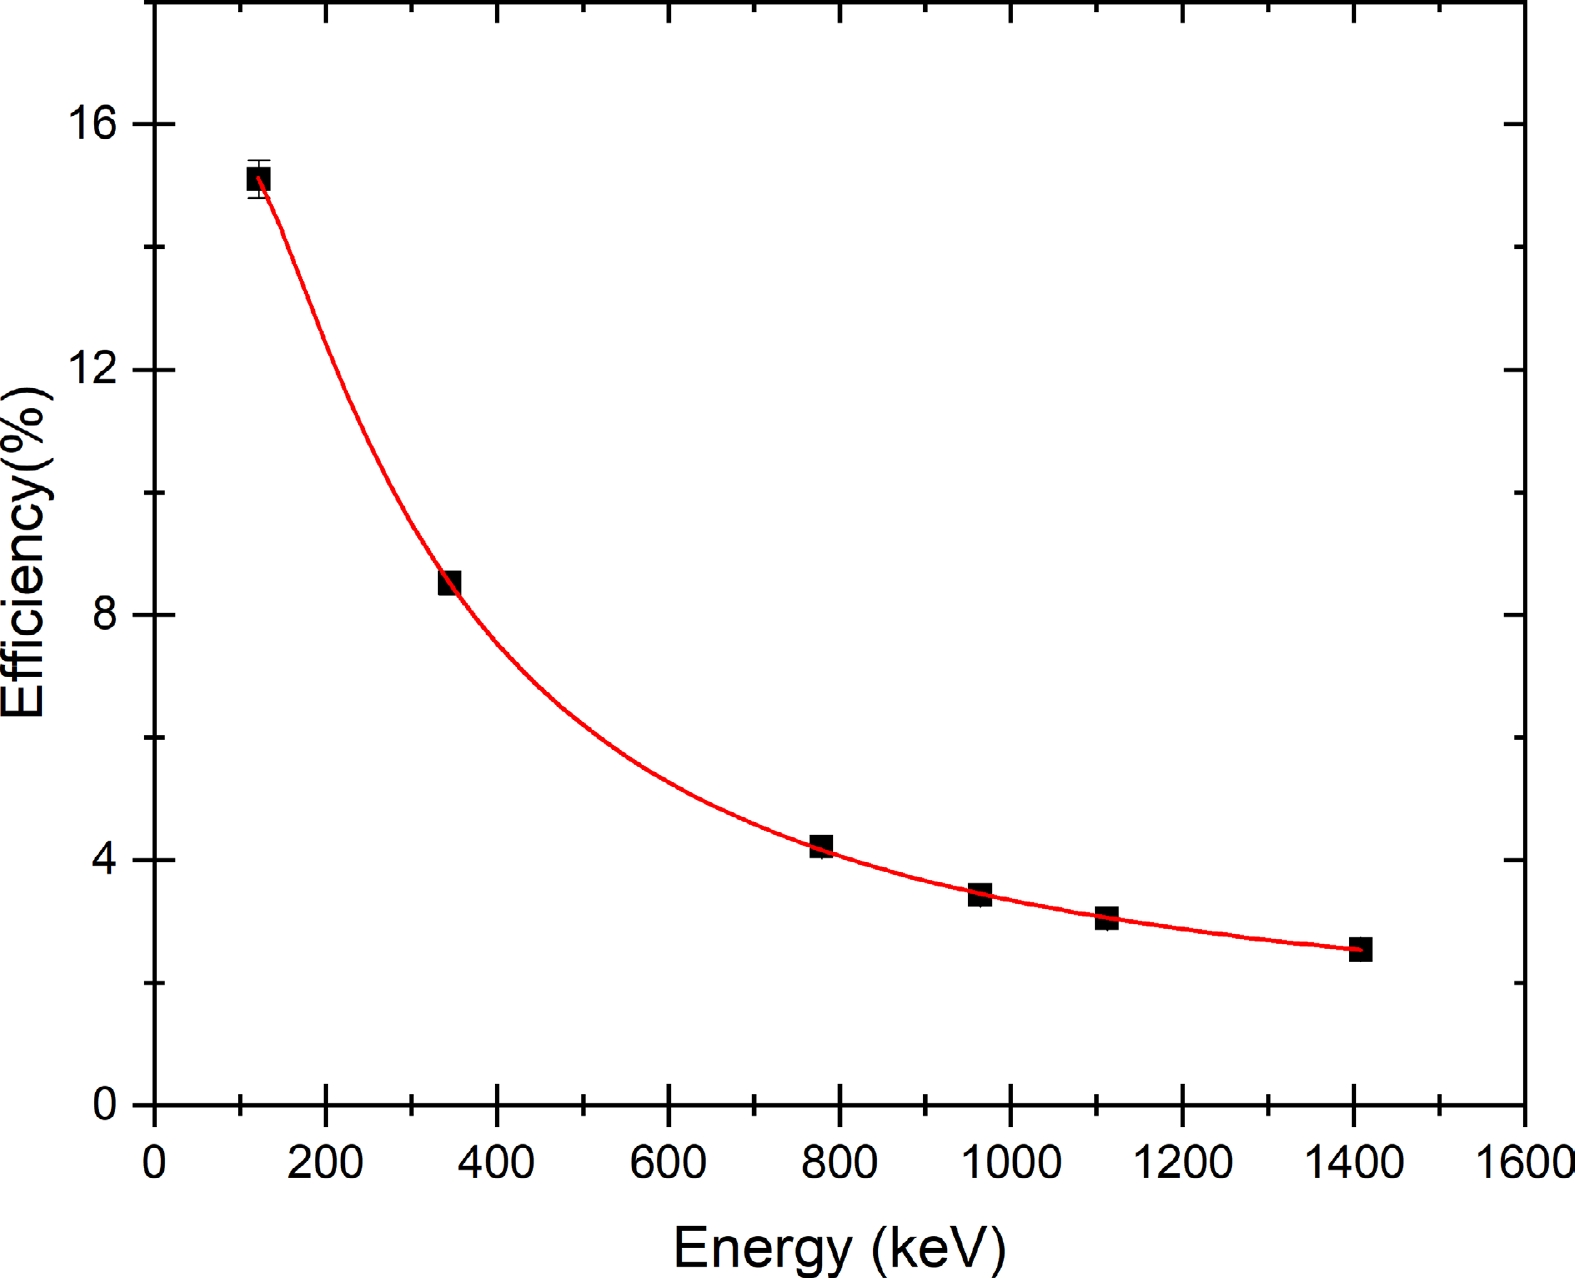
Figure 4. (color online) Detector efficiency with gamma energy using a 152Eu standard source along with the fitted efficiency curve.
Product Nuclide $ {\mathit{E}}_{\mathit{\gamma }} $ /keV

$ \mathit{\epsilon } $ (%)

Correlation matrix 67Cu 184.577 12.969 ± 0.286 1 69Znm 438.634 6.96 ± 0.147 0.933 1 68Cum 526.44 5.928 ± 0.125 0.886 0.992 1 63Zn 669.62 4.774 ± 0.101 0.826 0.965 0.99 1 27Mg 843.76 3.883 ± 0.082 0.802 0.943 0.975 0.995 1 66Cu 1039.2 3.237 ± 0.067 0.825 0.932 0.958 0.977 0.991 1 65Zn 1115.539 3.050 ± 0.063 0.842 0.926 0.947 0.963 0.979 0.998 1 24Na 1368.626 2.591 ± 0.055 0.887 0.874 0.868 0.864 0.885 0.937 0.959 1 65Ni 1481.84 2.44 ± 0.054 0.889 0.827 0.807 0.791 0.813 0.879 0.909 0.99 1 90Ym 202.53 12.354 ± 0.276 1 88Y 898.042 3.672 ± 0.077 0.795 1 24Na 1368.626 2.591 ± 0.055 0.876 0.898 1 99Mo 181.068 13.095 ± 0.288 1 93Mom 263.049 10.444 ± 0.233 0.994 1 96Nb 568.871 5.53 ± 0.117 0.867 0.886 1 89Zrm 587.8 5.37 ± 0.114 0.858 0.877 1 1 97Nbg 657.23 4.85 ± 0.103 0.832 0.849 0.997 0.998 1 98Nbm 722.626 4.457 ± 0.095 0.816 0.831 0.992 0.995 0.999 1 27Mg 843.76 3.883 ± 0.082 0.805 0.815 0.984 0.987 0.994 0.998 1 89Zrg 909.15 3.633 ± 0.076 0.809 0.815 0.979 0.982 0.99 0.995 0.999 1 92Nbm 934.44 3.547 ± 0.074 0.811 0.816 0.977 0.98 0.988 0.993 0.998 1 1 24Na 1368.626 2.591 ± 0.055 0.89 0.865 0.866 0.865 0.864 0.867 0.885 0.9 0.907 1 Table 6. Interpolated efficiencies, uncertainties, and correlation matrix for the sample and monitor reactions.
-
In this study, the cross sections of the 70Zn(n, 2n)69Znm, 68Zn(n, α)65Ni, 67Zn(n, p)67Cu, 66Zn(n, 2n)65Zn, 89Y(n, γ)90Ym, 89Y(n, 2n)88Y, 100Mo(n, 2n)99Mo, 97Mo(n, p)97Nbg, 96Mo(n, p)96Nb, 94Mo(n, 2n)93Mom, 92Mo(n, p)92Nbm, and 92Mo(n, α)89Zrg reactions were measured at a neutron energy of 14.77 ± 0.17 MeV with 27Al(n, α)24Na as the monitor reaction. The cross sections of the 68Zn(n, p)68Cum, 66Zn(n, p)66Cu, 64Zn(n, 2n)63Zn, 98Mo(n, p)98Nbm, and 92Mo(n, α)89Zrm reactions were measured at a neutron energy of 14.77 ± 0.17 MeV with 27Al(n, p)27Mg as the monitor reaction. The cross sections were determined using the neutron activation equation [32]
$ {\sigma }_{s}={\sigma }_{m}\frac{{\epsilon }_{m}{C}_{s}{a}_{m}{A}_{s}{{M}_{m}I}_{\gamma m}{f}_{m}{F}_{s}}{{\epsilon }_{s}{C}_{m}{a}_{s}{A}_{m}{{M}_{s}I}_{\gamma s}{f}_{s}{F}_{m}}. $

(4) Here, the sample and monitor reaction parameters are denoted with the subscripts s and m, respectively.
${\sigma }_{m}= 111.69\pm 2.73~{\rm mb},66.42 \pm 2.02~{\rm mb}$ are the interpolated values taken from the IRDFF-II evaluated data file for the 27Al(n, α)24Na and 27Al(n, p)27Mg reactions at 14.77 ± 0.17 MeV, respectively. ε is the detector efficiency, C is the photo peak counts, a is the isotopic abundance, A is the atomic mass, M is the mass, Iγ is the branching ratio of γ-rays taken from Ref. [33], and f is the timing factor.$ F={f}_{c}\times {f}_{a} $ is the correction factor due to the coincidence summing effects ($ {f}_{c} $ ) and gamma ray self-attenuation$ \left({f}_{a}\right) $ . The correction factor due to coincidence summing effects was calculated with the TrueCoinc code [34]. The self-attenuation coefficients$ {f}_{a} $ were calculated with the mass attenuation coefficients taken from the NIST Standard Reference Database [35]. The correction factors$ {f}_{a} $ and$ {f}_{c} $ for sample and monitor reaction product nuclides are listed in Table 7. The timing factor f is given byProduct nuclide Eγ/keV Sample $ {f}_{c} $ 

$ {f}_{a} $ 

F 69Znm 438.634 Zn 1 1.032 1.032 68Cum 526.44 Zn 1 1.03 1.03 65Ni 1481.84 Zn 0.99 1.017 1.008 67Cu 184.577 Zn 1 1.065 1.065 66Cu 1039.2 Zn 1.001 1.021 1.022 65Zn 1115.539 Zn 1 1.02 1.02 63Zn 669.62 Zn 1.01 1.026 1.036 90Ym 202.53 Y2O3 1.082 1.049 1.136 88Y 898.042 Y2O3 1.16 1.016 1.178 99Mo 181.068 MoO3 1.053 1.058 1.118 98Nbm 722.626 MoO3 1.102 1.017 1.121 97Nbg 657.23 MoO3 1 1.018 1.018 96Nb 568.871 MoO3 1.099 1.019 1.119 93Mom 263.049 MoO3 1.084 1.036 1.122 92Nbm 934.44 MoO3 1 1.016 1.016 89Zrm 587.8 MoO3 1 1.019 1.019 89Zrg 909.15 MoO3 1.037 1.015 1.053 27Mg 843.76 Al foil 1.002 1.002 1.004 24Na 1368.626 Al foil 1 1.002 1.002 Table 7. Self-attenuation coefficient
$ {f}_{a} $ and coincidence summing correction factor$ {f}_{c} $ for samples and monitor reaction products.$ f=\frac{\left(1-{\rm e}^{-\lambda {t}_{1}}\right)\left({\rm e}^{-\lambda {t}_{2}}\right)\left(1-{\rm e}^{-\lambda {t}_{3}}\right)}{\lambda }, $

(5) where λ is the decay constant,
$ {t}_{1} $ is the irradiation time,$ {t}_{2} $ is the cooling time, and$ {t}_{3} $ is the counting time.The uncertainty in
$ {\sigma }_{s} $ was propagated from the uncertainties in the measured parameters, that is, the monitor cross section$ \left({\sigma }_{m}\right) $ , efficiency$\left({\epsilon }_{m},~{\epsilon }_{s}\right)$ , counts (${C}_{m},~{C}_{s})$ , sample isotopic abundance$ \left({a}_{s}\right) $ , mass (${M}_{m},~{M}_{s}$ ), intensity$\left({I}_{\gamma m},~{I}_{\gamma s}\right)$ , and timing factor$\left({f}_{m},~{f}_{s}\right)$ . The fractional uncertainties in atomic mass$({A}_{s},~{A}_{m})$ and monitor isotopic abundance ($ {a}_{m}) $ were negligible. The uncertainty in the timing factor$ f $ was calculated following Sec. III.B. of Ref. [36]. The covariances between ($ {\epsilon }_{m},{\epsilon }_{s} $ ) were obtained by following the methodology described in Sec. III.A. of Ref. [37]. The uncertainty in the detector efficiencies wasreduced by adopting$ {\eta }_{m,s}=\dfrac{{\epsilon }_{m}}{{\epsilon }_{s}} $ [32], where$ {\eta }_{m,s} $ is the detection efficiencyratio of the monitor reaction product ($ {\epsilon }_{m} $ ) and sample reaction product ($ {\epsilon }_{s} $ ). The covariances of ($ {\epsilon }_{m},{\epsilon }_{s} $ ) were further propagated to$\begin{aligned}[b] Cov\left({\eta }_{m/s1},{\eta }_{m/s2}\right)=&\left(\frac{1}{{\epsilon }_{s1}{\epsilon }_{s2}}\right)\Big[\left({\eta }_{m/s1}{\eta }_{m/s2}{Cov(\epsilon }_{s1},{\epsilon }_{s2})\right)\\&-\left({\eta }_{m/s1}Cov\left({\epsilon }_{m},{\epsilon }_{s1}\right)\right)\\&-\left({\eta }_{m/s2}Cov\left({\epsilon }_{m},{\epsilon }_{s2}\right)\right)+Var\left({\epsilon }_{m}\right)\Big] \end{aligned}.$

(6) The partial uncertainties for each parameter of Eq. (4) and their correlations are given in Table 8, Table 9, and Table 10. In Tables 8 to 10, the correlation coefficients due to different parameters were assigned 0 for uncorrelated and 1 for fully correlated. The value of the correlation coefficient for the parameter
$ {\eta }_{m,s} $ lay between$ -1 \le Cor\left({\eta }_{m/s1},{\eta }_{m/s2}\right)\le 1 $ calculated with Eq. (6). The covariance matrix for the measured cross section from the fractional uncertainties given in Tables 8 to 10 was calculated using the following equation:Nuclide Parameter 69Znm 68Cum 65Ni 67Cu 66Cu 65Zn 63Zn Correlation $ {\mathit{C}}_{\mathit{s}} $ 

2.674 6.082 7.681 10.508 2.345 10.909 1.391 Uncorrelated $ {\mathit{C}}_{\mathit{m}} $ 

0.648a 0.362b 0.78c 0.636d 0.348e 0.895f 0.743g a, c, d, and f are fully correlated; b, e, and g are fully correlated $ {\mathit{I}}_{\mathit{\gamma }\mathit{s}} $ 

0.074 2.273 0.593 0.616 0.975 0.2 3.659 Uncorrelated $ {\mathit{I}}_{\mathit{\gamma }\mathit{m}} $ 

0.002a 0.028b 0.002c 0.002d 0.028e 0.002f 0.028g a, c, d, and f are fully correlated; b, e, and g are fully correlated $ {\mathit{\eta }}_{\mathit{m},\mathit{s}} $ 

0.276 0.074 0.007 1.194 0.015 0.022 0.074 Partially correlated $ {\mathit{f}}_{\mathit{\lambda }\mathit{s}} $ 

0.096 0.932 0.011 0.183 1.184 0.037 0.197 Uncorrelated $ {\mathit{f}}_{\mathit{\lambda }\mathit{m}} $ 

0.06a 0.01b 0.074c 0.06d 0.01e 0.018f 0.26g a, c, d, and f are fully correlated; b, e, and g are fully correlated $ {\mathit{M}}_{\mathit{s}} $ 

0.025 0.025b 0.025c 0.025 0.025e 0.025f 0.025 b and c are fully correlated; e and f are fully correlated $ {\mathit{M}}_{\mathit{m}} $ 

0.099a 0.099b 0.099c 0.099d 0.099e 0.099f 0.099g a, c, d, and f are fully correlated; b, e, and g are fully correlated $ {\mathit{a}}_{\mathit{s}} $ 

16.393 3.415b 3.415c 3.96 3.534e 3.534f 1.525 b and c are fully correlated; e and f are fully correlated $ {\mathit{\sigma }}_{\mathit{m}} $ 

2.444a 3.023b 2.444c 2.444d 3.023e 3.023f 3.023g a, c, d, and f are fully correlated; b, e, and g are fully correlated Total (%) 16.805 7.998 8.81 11.59 5.442 11.761 5.240 Table 8. Partial uncertainties (%) and correlations between the various parameters used to obtain the neutron induced cross sections for the zinc target.
$ {V}_{{\sigma }_{ij}}=\sum _{p=1}^{11}\left(\frac{\partial {\sigma }_{i}}{\partial {q}_{pi}}\Delta {q}_{pi}\right)Cor\left({q}_{pi},{q}_{pj}\right)\left(\frac{\partial {\sigma }_{j}}{\partial {q}_{pj}}\Delta {q}_{pj}\right), $

(7) where
$ p $ refers to the measured parameter, and$ Cor\left({q}_{pi},{q}_{pj}\right) $ is a square matrix (order is the number of sample product nuclides). The total uncertainty in the measured cross section was calculated with the following equation:$ {\left(\Delta {\sigma }_{i}\right)}^{2}={V}_{{\sigma }_{ii}}. $

(8) The correlation matrix between the reaction cross sections can be calculated from the covariance matrix
$ {V}_{{\sigma }_{ij}} $ and the total uncertainty via the following equation:$ Cor\left({\sigma }_{i},{\sigma }_{j}\right)=\frac{{V}_{{\sigma }_{ij}}}{\Delta {\sigma }_{i}\times {\Delta \sigma }_{j}}. $

(9) Nuclide Parameter 88Y 90Ym Correlation $ {\mathit{C}}_{\mathit{s}} $ 

7.547 8.696 Uncorrelated $ {\mathit{C}}_{\mathit{m}} $ 

0.758 0.758 Fully correlated $ {\mathit{I}}_{\mathit{\gamma }\mathit{s}} $ 

0.32 0.041 Uncorrelated $ {\mathit{I}}_{\mathit{\gamma }\mathit{m}} $ 

0.002 0.002 Fully correlated $ {\mathit{\eta }}_{\mathit{m},\mathit{s}} $ 

0.029 0.077 Partially correlated $ {\mathit{f}}_{\mathit{\lambda }\mathit{s}} $ 

0.197 0.934 Uncorrelated $ {\mathit{f}}_{\mathit{\lambda }\mathit{m}} $ 

0.071 0.071 Fully correlated $ {\mathit{M}}_{\mathit{s}} $ 

0.102 0.102 Fully correlated $ {\mathit{M}}_{\mathit{m}} $ 

0.167 0.167 Fully correlated $ {\mathit{a}}_{\mathit{s}} $ 

- - Not available $ {\mathit{\sigma }}_{\mathit{m}} $ 

2.444 2.444 Fully correlated Total (%) 7.981 9.124 Table 9. Partial uncertainties (%) and correlations between the various parameters used to obtain the neutron induced cross sections for the yttrium target.
Nuclide Parameter 99Mo 98Nbm 97Nbg 96Nb 93Mom 92Nbm 89Zrm 89Zrg Correlation $ {\mathit{C}}_{\mathit{s}} $ 

2.048 8.241 2.622 7.208 8.521 13.095 10.277 12.262 Uncorrelated $ {\mathit{C}}_{\mathit{m}} $ 

0.68a 0.436b 0.807c 0.68d 0.68e 0.68f 0.436g 0.68h a, c, d, e, f, and h are fully correlated; b and g are fully correlated $ {\mathit{I}}_{\mathit{\gamma }\mathit{s}} $ 

1.983 2.033 0.081 0.517 1.916 0.04 0.19 0.03 Uncorrelated $ {\mathit{I}}_{\mathit{\gamma }\mathit{m}} $ 

0.002a 0.028b 0.002c 0.002d 0.002e 0.002f 0.028g 0.002h a, c, d, e, f, and h are fully correlated; b and g are fully correlated $ {\mathit{\eta }}_{\mathit{m},\mathit{s}} $ 

0.898 0.066 0.081 0.112 0.559 0.034 0.112 0.037 Partially correlated $ {\mathit{f}}_{\mathit{\lambda }\mathit{s}} $ 

0.009 0.377 0.012 0.181 0.493 0.194 2.405 0.146 Uncorrelated $ {\mathit{f}}_{\mathit{\lambda }\mathit{m}} $ 

0.061a 0.077b 0.199c 0.061d 0.061e 0.061f 0.077g 0.061h a, c, d, e, f, and h are fully correlated; b and g are fully correlated $ {\mathit{M}}_{\mathit{s}} $ 

0.025 0.025 0.025 0.025 0.025 0.025f 0.025g 0.025h Only f, g, and h are fully correlated $ {\mathit{M}}_{\mathit{m}} $ 

0.174a 0.174b 0.174c 0.174d 0.174e 0.174f 0.174g 0.174h a, c, d, e, f, and h are fully correlated; b and g are fully correlated $ {\mathit{a}}_{\mathit{s}} $ 

3.157 1.517 1.458 0.9 0.984 2.065f 2.065g 2.065h Only f, g, and h are fully correlated $ {\mathit{\sigma }}_{\mathit{m}} $ 

2.444a 3.023b 2.444c 2.444d 2.444e 2.444f 2.444g 3.023h a, c, d, e, f, and h are fully correlated; b and g are fully correlated Total (%) 5.037 9.164 3.964 7.717 9.18 13.5 11.042 12.821 Table 10. Partial uncertainties (%) and correlations between the various parameters used to obtain the neutron induced cross sections for the molybdenum target.
-
The cross sections of the measured nuclear reactions were calculated theoretically using the TALYS-1.96 [5] and EMPIRE-3.2.3 [6] nuclear reaction codes. These codes consider the contributions of compound nucleus theory, direct reactions, and pre-equilibrium processes depending on the incident energy of the projectile. These contributions are incorporated into the code by a set of optical models that determine the transmission coefficients of outgoing particles, nuclear level density models, preequilibrium models, and gamma strength functions that determine the photon transmission coefficients. The theoretical calculations were conducted over neutron incident energies from 13 to 17 MeV and compared with the experimental results from the present study and reported experimental data from the EXFOR database.
-
The TALYS-1.96 code can be used for nuclear reactions that involve incident projectiles such as gammas, neutrons, protons, deuterons, and α-particles in the incident energy range from 1 keV to 200 MeV. Detailed description of the TALYS-1.96 code and available models can be found in Ref. [5].
$ 384=6\mathrm{ }\times \mathrm{ }2\mathrm{ }\times \mathrm{ }4\times \mathrm{ }8 $ calculations were performed with combinations of six level density models, two nucleon-nucleus optical model potentials, four pre-equilibrium models, and eight γ-ray strength functions available in TALYS-1.96 code. A single set of models was chosen based on chi-square fitting with EXFOR data. The best model combination for neutron induced reactions on natZn was i) the level densities based on the generalized superfluid model [38] (ldmodel 3), ii) Koning-Delaroche [39] nucleon-nucleus local optical model (localomp y), iii) exciton model [40] for pre-equilibrium (preeqmode 1), and iv) gamma strength function calculated with the hybrid model of Goriely [41] (strength 5). For neutron induced reactions on natY, the chosen model combination was i) level densities based on the generalized superfluid model [38] (ldmodel 3), ii) Koning-Delaroche [39] nucleon-nucleus global optical model (localomp n), iii) exciton model [40] for pre-equilibrium (preeqmode 2), and iv) the gamma strength function calculated with HFB+QRPA [41] (strength 8). The best reproduction of experimental cross sections for neutron induced reactions on natMo was obtained with the following model combination: i) Level densities based on the HFB + Skyrme force calculations from Hilaire’s tables [42] (ldmodel 5), ii) the Koning-Delaroche [39] nucleon-nucleus global optical model (localomp n), iii) the exciton model [40] for pre-equilibrium (preeqmode 1), and iv) the gamma strength function calculated with the generalized Lorentzian of Brink and Axel [43, 44] (strength 2). The value of a chosen set of parameters within the models (aadjust, ctable, and avadjust) was randomly varied between ± X % of its central value [45] to account for statistical uncertainties arising from model calculations. The uncertainty in the calculated excitation function due to parameter uncertainties was determined using 1000 calculations. Here, the input parameter values were randomly sampled about the central value, and the energy input file had neutron energies binned at 1 MeV. The uncertainty in the evaluated calculations per neutron energy bin was expressed as the percentage standard deviation per unit calculated cross section at that energy bin. -
The EMPIRE-3.2.3 code can be used for nuclear reactions that involve incident projectiles such as photons, neutrons, protons, deuterons, α-particles, and heavy ions in the incident energy range from 1 keV to 200 MeV. Detailed descriptions of the nuclear models in the EMPIRE-3.2.3 code can be found in Ref. [6].
$ 168=4 \times 2 \times 3 \times 7 $ calculations were performed with combinations of four level density models, two nucleon-nucleus optical model potentials, three pre-equilibrium models, and seven γ-ray strength functions available in the EMPIRE-3.2.3 code. A single set of models was chosen based on chi-square fitting with the EXFOR data. The best model combination for neutron induced reactions on natZn was i) the level densities based on microscopic HFB level densities [46] (LEVDEN 3), ii) Koning-Delaroche nucleon-nucleus optical model [39] (OMPOT 2405), iii) Monte Carlo pre-equilibrium model for preequilibrium (HMS 1), and iv) gamma strength function calculated with the enhanced generalised Lorentzian from the RIPL database [47] (GSTRFN 4). The chosen model combination for neutron induced reactions on natY was i) the EMPIRE-specific level densities [48] (LEVDEN 0), ii) Wilmore-Hodgson optical model [49] (OMPOT 401), iii) multi-step compound model for pre-equilibrium (MSC 1), and iv) gamma strength function given by the modified Lorentzian [50] (GSTRFN 1). For neutron induced reactions on natMo, the best fit was obtained with i) the EMPIRE-specific level densities [48] (LEVDEN 0), ii) Koning-Delaroche nucleon-nucleus optical model [39] (OMPOT 2405), iii) Monte Carlo pre-equilibrium model for preequilibrium (HMS 1), and iv) gamma strength function calculated with the modified Lorentzian [50] (GSTRFN 3). -
The correlation matrix and measured neutron induced reaction cross sections for zinc, yttrium, and molybdenum are listed in Table 11, Table 12, and Table 13, respectively. Additionally, the present experimental cross sections were compared with the evaluated cross section data from the TENDL-2019 [8], JENDL-5 [7], and ENDF/B-VIII.0 [1] libraries along with nuclear model calculations with the TALYS-1.96 and EMPIRE-3.2.3 nuclear codes in Table 14. In Figs. 5 to 21, the cross sections from the TENDL-2019 evaluation are represented by a green solid line, the JENDL-5 evaluation is represented by a blue solid line, the ENDF/B-VIII.0 evaluation is represented by a pink solid line, the EMPIRE-3.2.3 calculations are represented by a solid purple line, the TALYS-1.96 95% upper confidence level by a red solid line, the TALYS-1.96 95% lower confidence level by a black solid line, and the region between the above two dashed lines is filled. The experimental data plotted in Figs. 5 to 21 were normalized with respect to the evaluated cross section data for monitor reactions from the IRDFF-II library [51] for the experimental data where the monitor cross sections are reported.
Reaction Cross section (barns) Correlation matrix 70Zn(n, 2n)69Znm 0.62765 ± 0.10548 1 68Zn(n, p)68Cum 0.00451 ± 0.00036 0.057 1 68Zn(n, α)65Ni 0.00976 ± 0.00086 0.044 0.275 1 67Zn(n, p)67Cu 0.05075 ± 0.00588 0.034 0.082 0.064 1 66Zn(n, p)66Cu 0.05895 ± 0.00321 0.083 0.213 0.16 0.121 1 66Zn(n, 2n)65Zn 0.72351 ± 0.08509 0.033 0.082 0.065 0.048 0.316 1 64Zn(n, 2n)63Zn 0.15478 ± 0.00811 0.09 0.225 0.173 0.13 0.33 0.131 1 Table 11. Measured experimental cross section (barns) for the natZn sample at a neutron energy of 14.77 ± 0.17 MeV with the correlation matrix.
Reaction Measured cross section
(barns)Cross section evaluations (barns) at a neutron energy of 14.77 MeV TALYS-1.96 EMPIRE-3.2.3 TENDL-2019 JENDL-5 ENDF/B-VIII.0 70Zn(n, 2n)69Znm 0.62765 ± 0.10548 0.57404 ± 0.01741 0.49762 0.68383 ± 0.00986 0.62217 ±
0.00462- 68Zn(n, p)68Cum 0.00451 ± 0.00036 0.00349 ± 0.00039 - 0.00567 ± 0.00021 0.00515 ± 0.00025 - 68Zn(n, α)65Ni 0.00976 ± 0.00086 0.00786 ± 0.00125 0.01653 0.01778 ± 0.00025 0.00947 ± 0.00003 0.00899 ± 0.00004 67Zn(n, p)67Cu 0.05075 ± 0.00588 0.03913 ± 0.00376 0.05933 0.03603 ± 0.00048 0.03391 ± 0.00002 0.04580 ± 0.00037 66Zn(n, p)66Cu 0.05895 ± 0.00321 0.06049 ± 0.00867 0.04869 0.06333 ± 0.00076 0.05693 ± 0.00040 0.05525 ± 0.00075 66Zn(n, 2n)65Zn 0.72351 ± 0.08509 0.60318 ± 0.02135 0.82968 0.72203 ± 0.00401 0.89837 ± 0.00198 0.97720 ± 0.00557 64Zn(n, 2n)63Zn 0.15478 ± 0.00811 0.16347 ± 0.01232 0.23877 0.14225 ± 0.01143 0.16271 ± 0.01811 0.16762 ± 0.01157 89Y(n, 2n)88Y 0.93988 ± 0.07501 0.90406 ± 0.02986 0.86321 1.00347 ± 0.03026 1.03295 ± 0.03565 1.01569 ± 0.03662 89Y(n, γ)90Ym 0.00044 ± 0.00004 0.000414 ± 0.000016 0.000261 0.001060 ± 0.000012 0.000928 ± 0.000002 0.001784 ± 0.000064 100Mo(n, 2n)99Mo 1.56249 ± 0.07870 1.43135 ± 0.02721 1.52595 1.52624 ± 0.00185 1.40367 ± 0.00525 1.51327 ± 0.00376 98Mo(n, p)98Nbm 0.00339 ± 0.00031 0.00637 ± 0.00108 - 0.00797 ± 0.00034 0.00535 ± 0.00026 - 97Mo(n, p)97Nbg 0.01412 ± 0.00056 0.02108 ± 0.00383 0.02813 0.01675 ± 0.00057 0.01809 ± 0.00068 0.01882 ± 0.00067 96Mo(n, p)96Nb 0.02328 ± 0.00180 0.03074 ± 0.00559 0.03519 0.02229 ± 0.00063 0.02296 ± 0.00075 0.02409 ± 0.00062 94Mo(n, 2n)93Mom 0.00547 ± 0.00050 0.00599 ± 0.00046 0.00421 0.00711 ± 0.00068 0.01521 ± 0.00169 - 92Mo(n, p)92Nbm 0.06031 ± 0.00814 0.07863 ± 0.01565 0.13912 0.05696 ± 0.00294 0.06429 ± 0.00329 - 92Mo(n, α)89Zrm 0.00485 ± 0.00054 0.0049 6± 0.00049 0.01207 0.00712 ± 0.00012 0.00666 ± 0.00018 - 92Mo(n, α) 89Zrg 0.02216 ± 0.00284 0.01906 ± 0.00207 0.04751 0.02063 ± 0.00074 0.02088 ± 0.00082 - 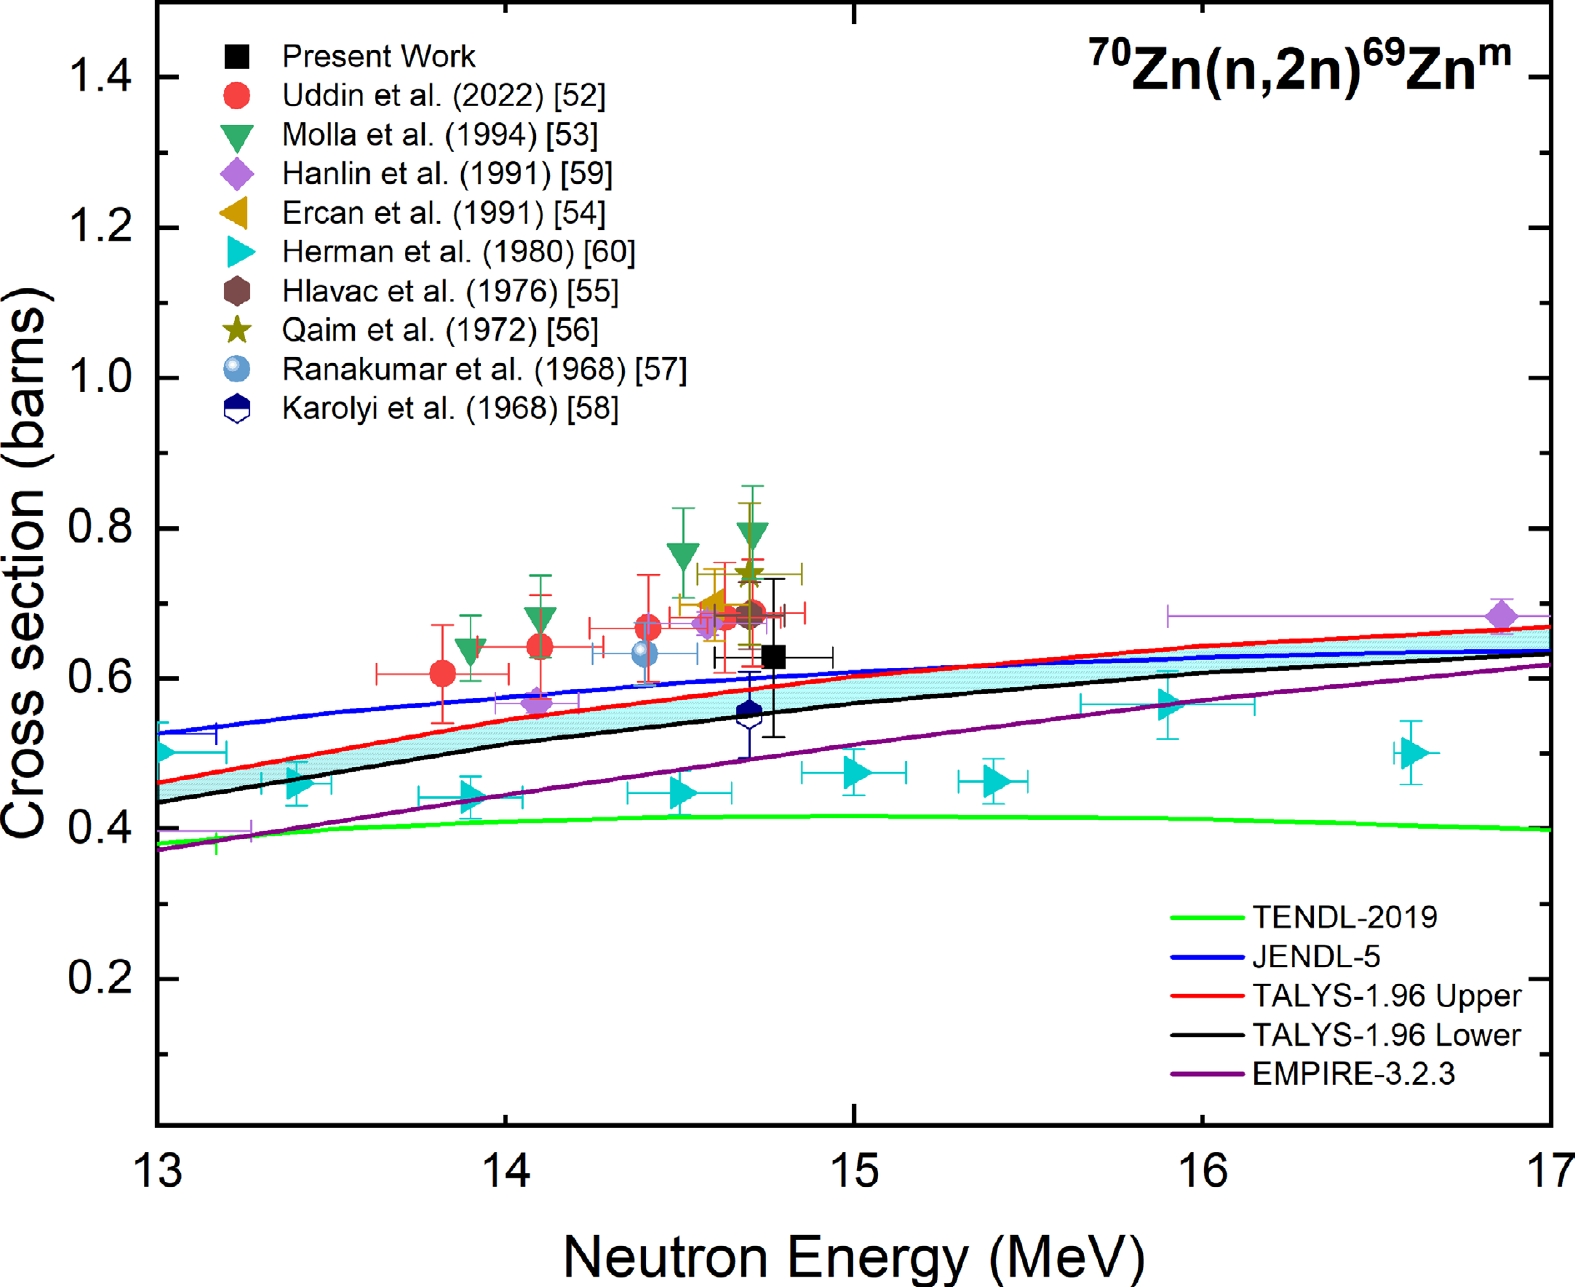
Figure 5. (color online) Measured experimental cross section for the 70Zn(n, 2n)69Znm reaction compared with EXFOR data, TALYS-1.96 calculations, and evaluated nuclear data.
Reaction Cross section (barns) Correlation matrix 89Y(n, 2n)88Y 0.93988 ± 0.07501 1 89Y(n, γ)90Ym 0.00044 ± 0.00004 0.091 1 Table 12. Measured experimental cross section (barns) for the natY sample at a neutron energy of 14.77 ± 0.17 MeV with the correlation matrix.
Reaction Cross section (barns) Correlation matrix 100Mo(n, 2n)99Mo 1.56249 ± 0.07870 1 98Mo(n, p)98Nbm 0.00339 ± 0.00031 0.168 1 97Mo(n, p)97Nbg 0.01412 ± 0.00056 0.33 0.216 1 96Mo(n, p)96Nb 0.02328 ± 0.00180 0.168 0.11 0.215 1 94Mo(n, 2n)93Mom 0.00547 ± 0.00050 0.151 0.092 0.181 0.092 1 92Mo(n, p)92Nbm 0.06031 ± 0.00814 0.095 0.063 0.123 0.062 0.052 1 92Mo(n, α)89Zrm 0.00485 ± 0.00054 0.113 0.076 0.146 0.074 0.062 0.071 1 92Mo(n, α) 89Zrg 0.02216 ± 0.00284 0.123 0.082 0.158 0.08 0.067 0.07 0.085 1 Table 13. Measured experimental cross section (barns) for the natMo sample at a neutron energy of 14.77 ± 0.17 MeV with the correlation matrix.
-
Figure 5 depicts the measured cross section of the 70Zn(n, 2n)69Znm reaction at a neutron energy of 14.77 ± 0.17 MeV compared with the experimental data from the EXFOR database, evaluated data from the TENDL-2019 and JENDL-5 libraries, and the TALYS-1.96 uncertainty calculations. The authors of Refs. [52–58] adopted the 27Al(n, α)24Na reaction as the monitor reaction. After normalization with the IRDFF-II evaluation of the 27Al(n, α)24Na reaction, the cross sections changed by 6% for Ref. [53], whereas for all the other Refs. [52–58], the change was less than 4 %. The authors of Ref. [59] adopted the 93Nb(n, 2n)92Nbm reaction as the monitor reaction, and upon normalization with the IRDFF-II evaluation, the cross sections changed by 6%. The authors of Ref. [60] adopted the 56Fe(n, p)56Mn reaction as the monitor reaction.
The measured cross section of the present study is in good agreement within the experimental uncertainty with the cross sections reported in the Refs. [52, 54–56, 58] as well as the JENDL-5 evaluation and TALYS-1.96 calculations. The TENDL-2019 evaluation and EMPIRE-3.2.3 calculations were lower than the measured cross section of the present study.
-
The measured cross section of the 68Zn(n, p)68Cum reaction at a neutron energy of 14.77 ± 0.17 MeV was compared with the experimental data from the EXFOR database, evaluated data from the TENDL-2019 and JENDL-5 libraries, and the TALYS-1.96 uncertainty calculations, as shown in Fig. 6. The cross section data reported in Refs. [61–68] were normalized with the IRDFF-II evaluation of the 27Al(n,α)24Na monitor reaction at the respective neutron energies. The change in the reported data due to normalization was 6% for Ref. [65] and less than 1% for all the other Refs. [61–64, 66–68]. The cross section data reported in Refs. [54, 69–71] were normalized with the IRDFF-II evaluation for the 27Al (n, p)27Mg reaction. The reported cross section data of Refs. [63, 66, 67, 69] were normalized for the gamma-yield per decay of the respective lines of 68Cum, and the change was found as 3%, 8%, 17%, and 5%, respectively.
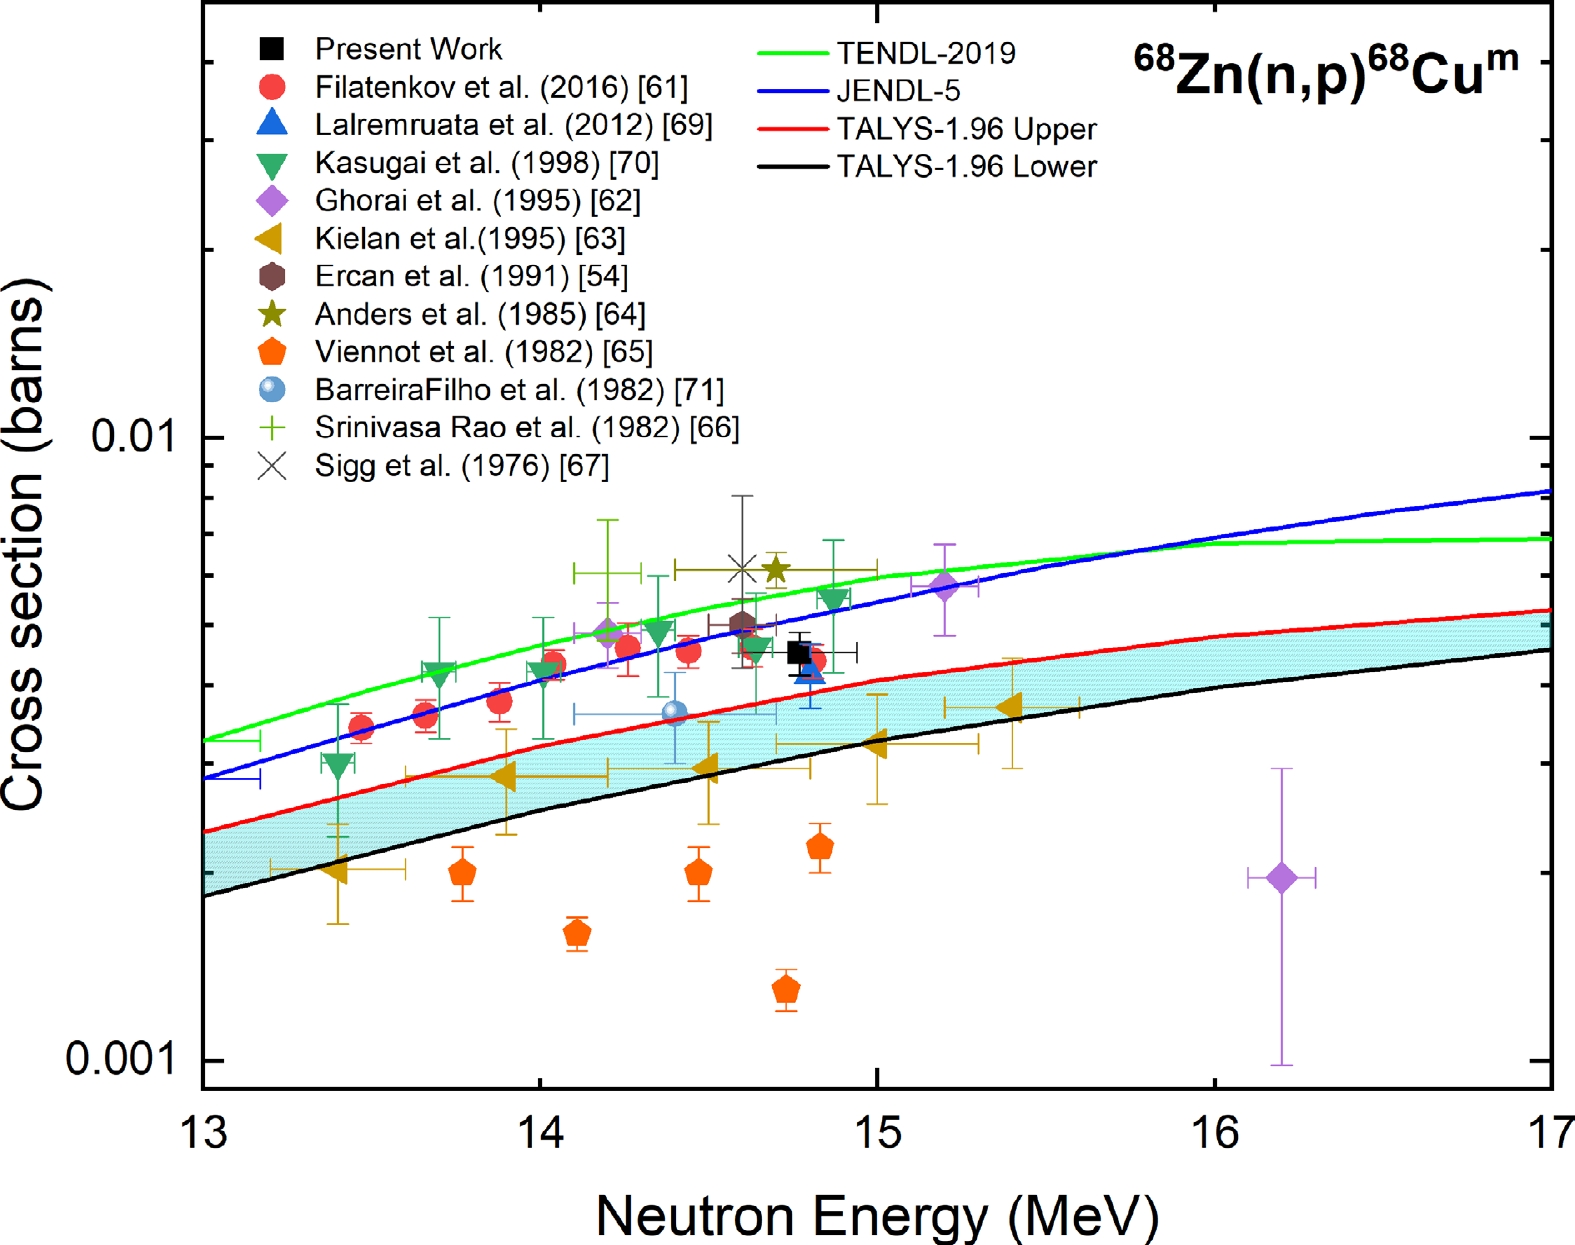
Figure 6. (color online) Measured experimental cross section for the 68Zn(n, p)68Cum reaction compared with EXFOR data, TALYS-1.96 calculations, and evaluated nuclear data.
The present result is in good agreement within the experimental uncertainty with the cross sections reported in Refs. [54, 61, 68–70]. The JENDL-5 and TENDL-2019 evaluations were higher than the measured cross section, whereas the TALYS-1.96 calculations were lower than the measured cross section.
-
Figure 7 shows the measured cross section of the 68Zn(n, α)65Ni reaction at a neutron energy of 14.77 ± 0.17 MeV along with the experimental data from the EXFOR database; evaluated data from the TENDL-2019, JENDL-5, and ENDF/B-VIII.0 libraries; and the TALYS-1.96 uncertainty calculations. The reported data of Refs. [53, 54, 57, 62, 71–75] were normalized with the IRDFF-II evaluation for the 27Al(n,α)24Na reaction. The reported cross section data of Ref. [53] changed by 3% after normalization for the gamma-yield per decay of the 1115.53 keV gamma line of 65Ni. The reported data of Refs. [76, 77] after normalization with the IRDFF-II evaluation for the 56Fe(n, p)56Mn reaction changed by 4%.
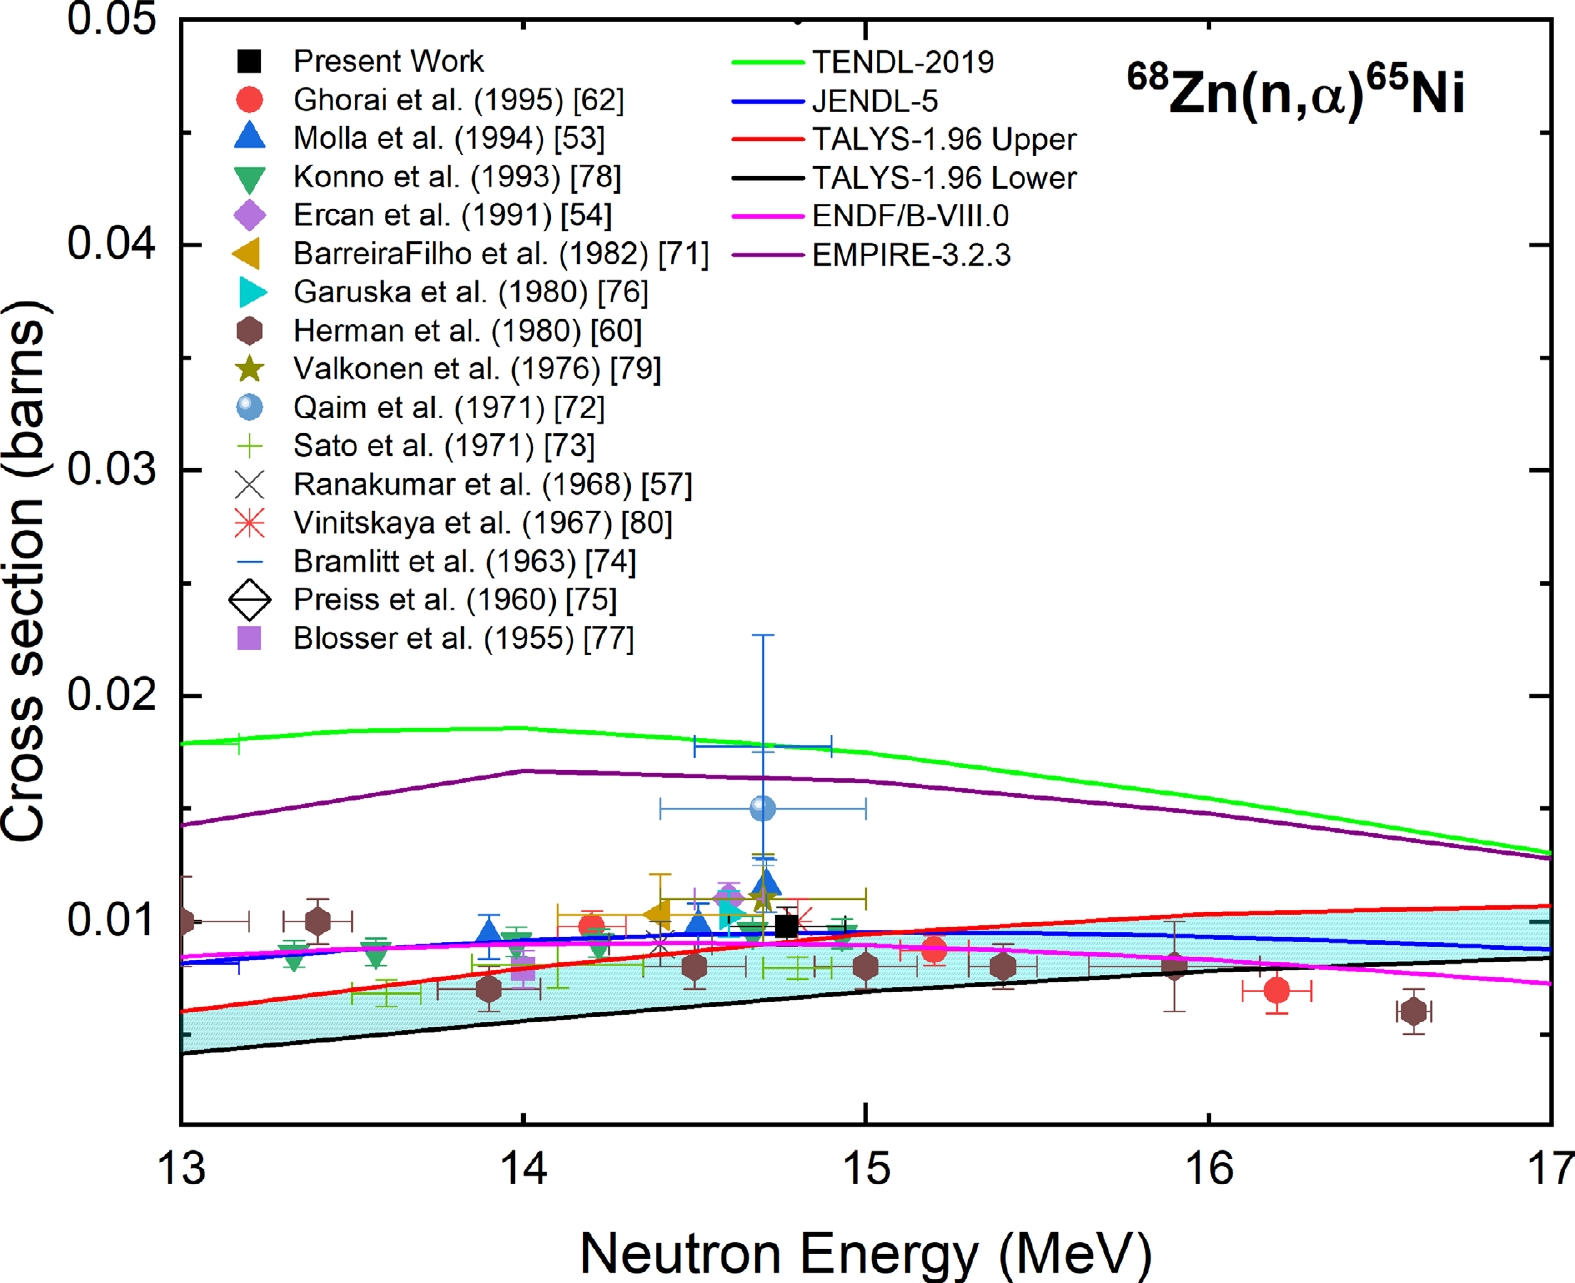
Figure 7. (color online) Measured experimental cross section for the 68Zn(n, α)65Ni reaction compared with EXFOR data, TALYS-1.96 calculations, and evaluated nuclear data.
The present result is in good agreement within the experimental uncertainty with the cross sections reported in Refs. [54, 76, 78–80], whose neutron energies overlapped with the present measurement. The measured cross section is in good agreement with the TALYS-1.96 calculations and JENDL-5 and ENDF/B-VIII.0 evaluations. The EMPIRE-3.2.3 calculations and TENDL-2019 evaluations were higher than the measured cross section.
-
The measured cross section of the 67Zn(n, p)67Cu reaction at a neutron energy of 14.77 ± 0.17 MeV was compared with the experimental data from the EXFOR database; evaluated data from the TENDL-2019, JENDL-5, and ENDF/B-VIII.0 libraries; and the TALYS-1.96 uncertainty calculations, as shown in Fig. 8. The reported cross section data of Ref. [81] upon normalization with the IRDFF-II evaluation of the 197Au(n, 2n)196Au monitor reaction changed by 2%. For the reported data in Refs. [54, 63, 78, 82], normalization was performed with the IRDFF-II data for the respective monitors, and the change was less than 1%.

Figure 8. (color online) Measured experimental cross section for the 67Zn(n, p)67Cu reaction compared with EXFOR data, TALYS-1.96 calculations, and evaluated nuclear data.
The measured cross section of the present study is in good agreement within the experimental uncertainty only with the cross section reported in Ref. [80], whose neutron energy overlapped with the present measurement and ENDF/B-VIII.0 evaluation.
-
The measured cross section of the 66Zn(n, p)66Cu reaction at a neutron energy of 14.77 ± 0.17 MeV was compared with the experimental data from the EXFOR database; evaluated data from the TENDL-2019, JENDL-5, and ENDF/B-VIII.0 libraries; and the TALYS-1.96 uncertainty calculations, as shown in Fig. 9. The reported experimental data of Refs. [57, 62, 63, 67, 83–88] were normalized with the IRDFF-II evaluations for their respective monitor data. The reported cross section data of Refs. [62, 63, 65, 67, 87, 89, 90] were normalized for the gamma-yield per decay of the 1039 KeV γ-line of 66Cu, and the change ranged from 3% to 20%.
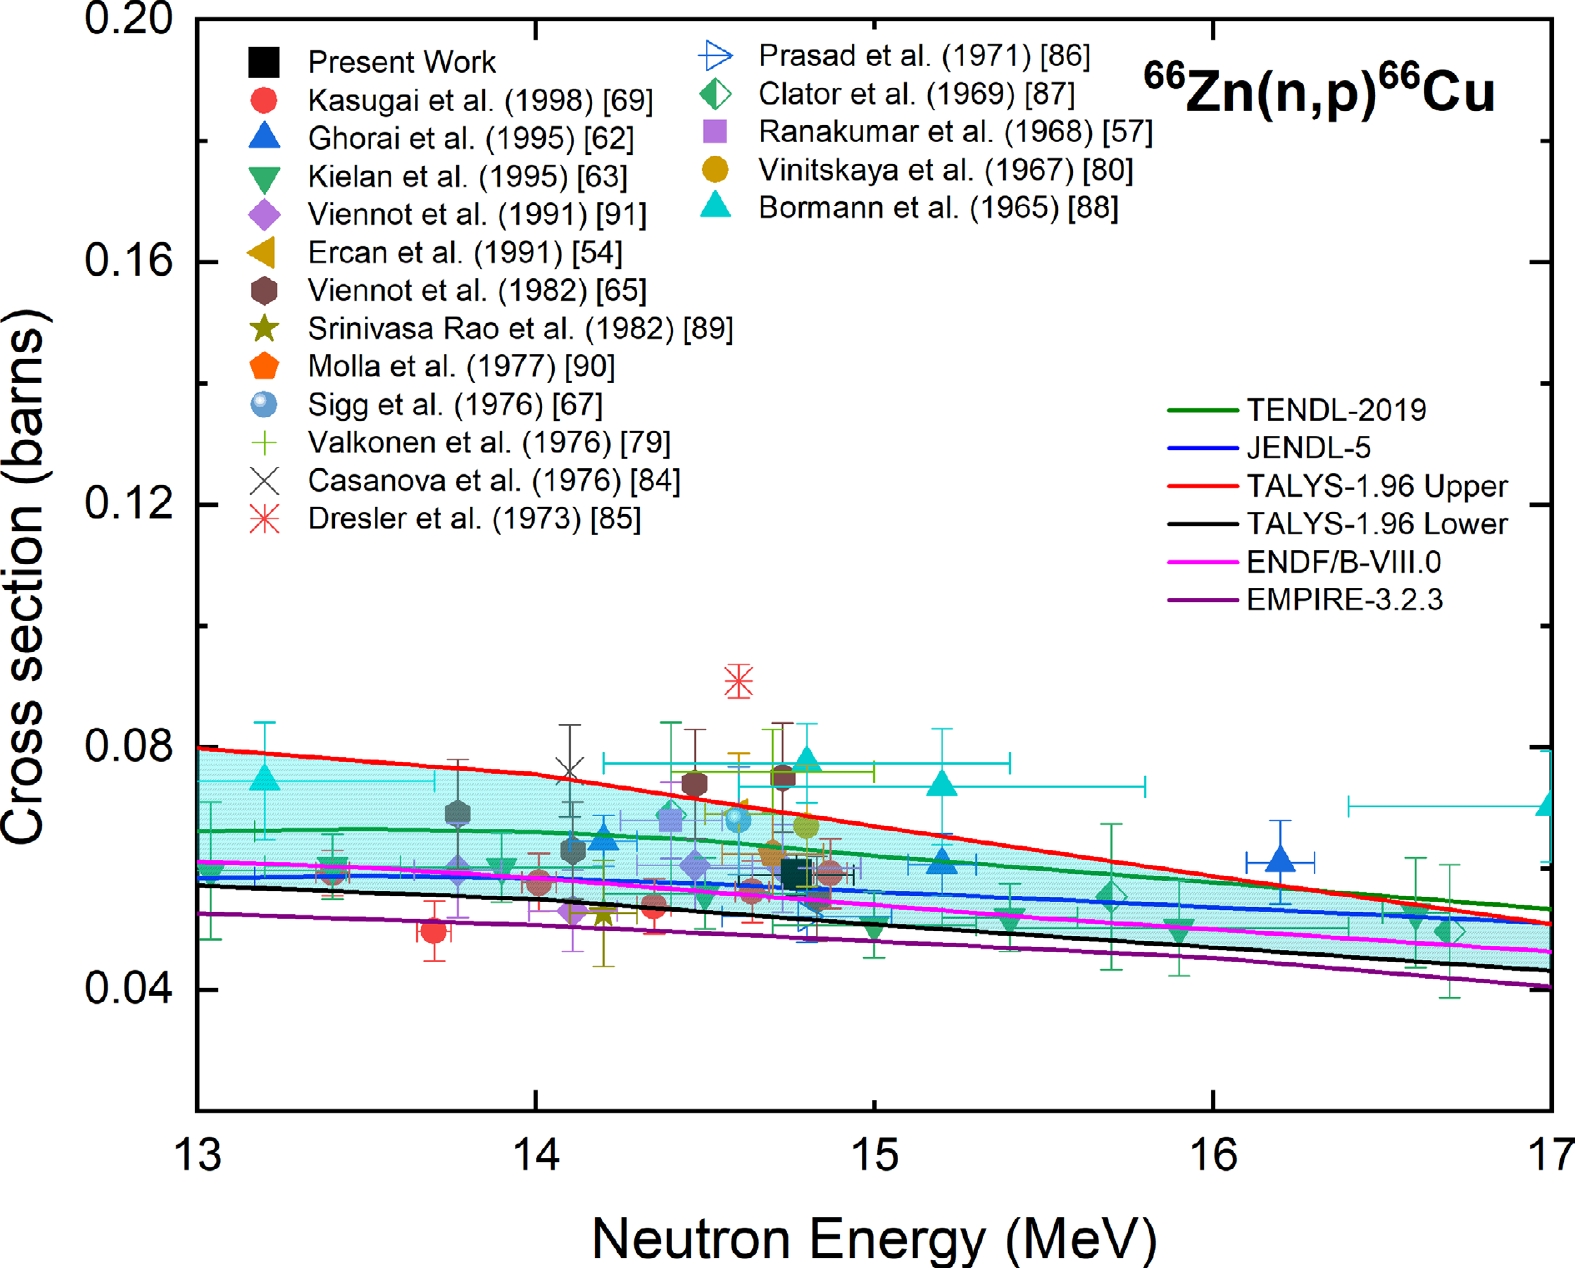
Figure 9. (color online) Measured experimental cross section for the 66Zn(n, p)66Cu reaction compared with EXFOR data, TALYS-1.96 calculations, and evaluated nuclear data.
From Fig. 9, the result of the present study is in good agreement within the experimental uncertainty with the cross sections reported in Refs. [54, 65, 67, 70, 80, 90, 91], whose neutron energies overlapped with the present measurement. The measured cross section is in good agreement with the JENDL-5 and TALYS-1.96 calculations within the experimental uncertainty, whereas the ENDF/B-VIII.0 evaluation was lower than the measured cross section.
-
The measured cross section of the 66Zn(n, 2n)65Zn reaction at a neutron energy of 14.77 ± 0.17 MeV was compared with the experimental data from the EXFOR database; evaluated data from the TENDL-2019, JENDL-5, and ENDF/B-VIII.0 libraries; and the TALYS-1.96 uncertainty calculations, as shown in Fig. 10. The experimental data of Refs. [54, 56, 57, 59, 78, 92–94] were normalized with the IRDFF-II evaluations for their respective monitor data. The reported cross section data of Refs. [56, 57, 59, 78, 82, 95] were normalized for the gamma-yield per decay of the 1115.539 KeV γ-line of 65Zn, and the change ranged from 1% to 3%.
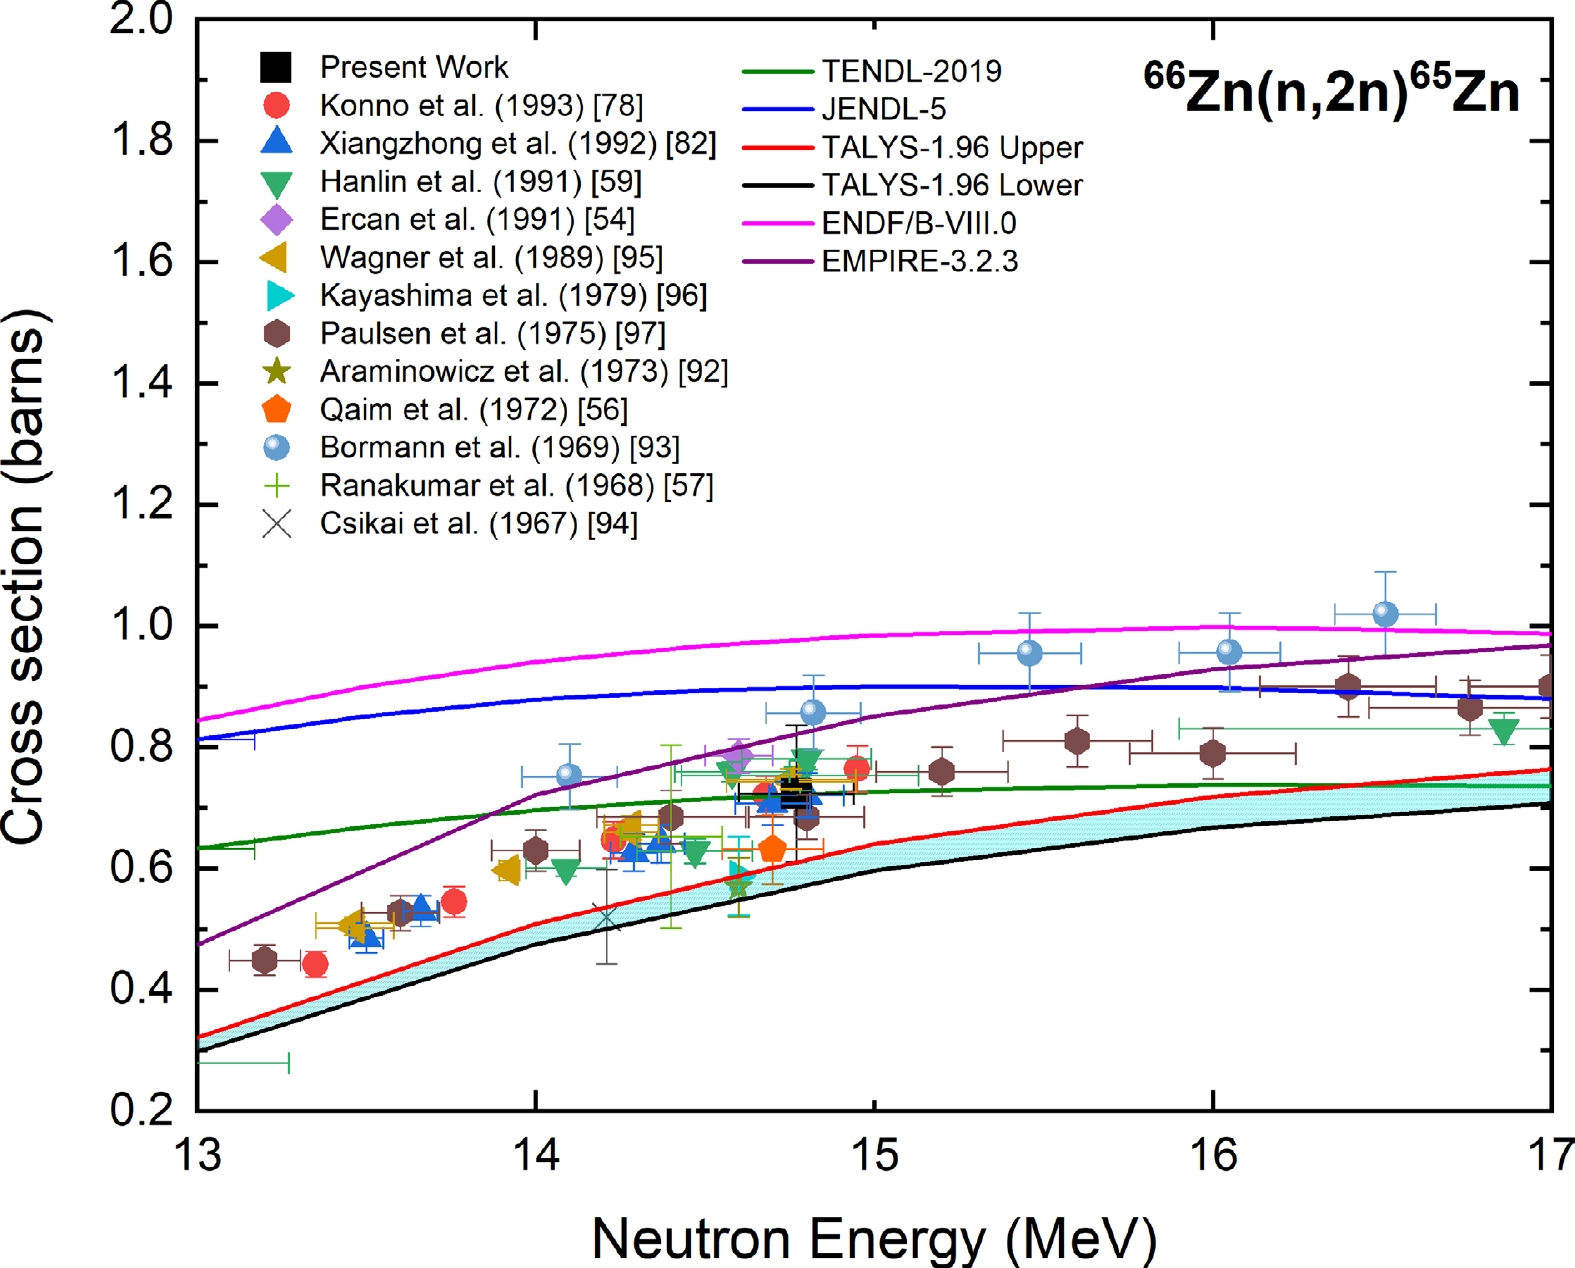
Figure 10. (color online) Measured experimental cross section for the 66Zn(n, 2n)65Zn reaction compared with EXFOR data, TALYS-1.96 calculations, and evaluated nuclear data.
The present results are in good agreement within the experimental uncertainty with the cross sections reported by Refs. [54, 56, 59, 78, 82, 92, 93, 95–97], whose neutron energies overlapped with the present measurement. The measured cross section is in good agreement with the EMPIRE-3.2.3 calculations and TENDL-2019 evaluation within the experimental uncertainty. The evaluations of ENDF/B-VIII.0 and JENDL-5 were higher than the measured cross section.
-
Figure 11 shows the measured cross section of the 64Zn(n,2n)63Zn reaction at a neutron energy of 14.77 ± 0.17 MeV along with the experimental data from the EXFOR database; evaluated data from the TENDL-2019, JENDL-5, and ENDF/B-VIII.0 libraries; and the TALYS-1.96 uncertainty calculations. The experimental data of Refs. [54, 61, 62, 78, 81, 91, 98, 99] were normalized with the IRDFF-II evaluations for their respective monitor data. The reported cross section data of Refs. [78, 91] were normalized for the gamma-yield per decay of the 669.62 KeV γ-line of 63Zn, and the change was 3%.
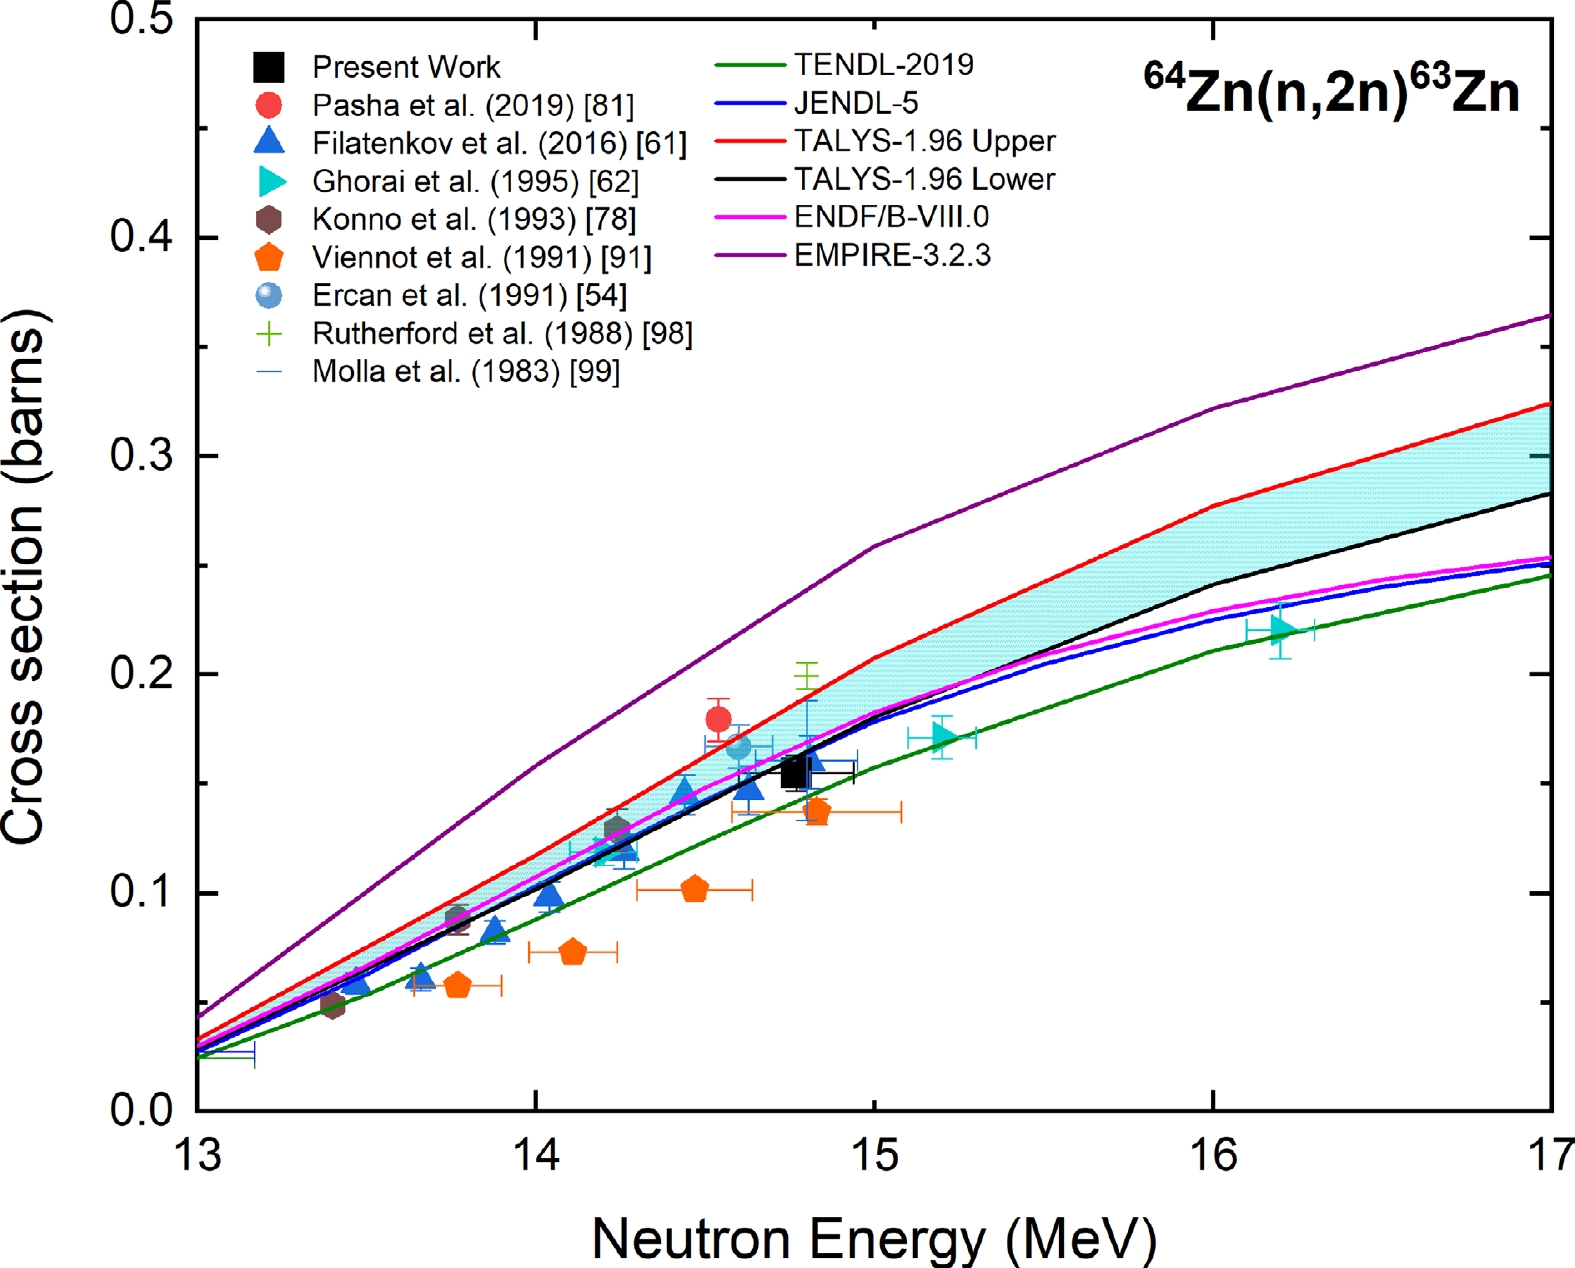
Figure 11. (color online) Measured experimental cross section for the 64Zn(n, 2n)63Zn reaction compared with EXFOR data, TALYS-1.96 calculations, and evaluated nuclear data.
The present results are in good agreement within the experimental uncertainty with the cross sections reported in Refs. [54, 61, 78], whose neutron energies overlapped with the present measurement. The measured cross section is in good agreement with the TALYS-1.96 calculations and the ENDF/B-VIII.0, JENDL-5, and TENDL-2019 evaluations within the experimental uncertainty.
-
The measured cross section of the 89Y(n, 2n)88Y reaction at a neutron energy of 14.77 ± 0.17 MeV was compared with the experimental data from the EXFOR database; evaluated data from the TENDL-2019, JENDL-5, and ENDF/B-VIII.0 libraries; and the TALYS-1.96 uncertainty calculations, as shown in Fig. 12. The reported data of Ref. [81] upon normalization with the IRDFF-II evaluation of the 197Au(n, 2n)196Au monitor reaction changed by 2%. The experimental data reported in Refs. [100–109] were normalized with the IRDFF-II evaluation of the 27Al(n, α)24Na monitor reaction at their respective neutron energies. The data of Refs. [108, 109] after normalization changed by 4% and 7%, respectively, whereas for Refs. [100–107], the changes were less than 2%. Refs. [61, 78, 95, 110–112] adopted the 93Nb(n, 2n)92Nbm reaction as the monitor reaction, and after normalization with the IRDFF-II evaluation, they varied by less than 1%.

Figure 12. (color online) Measured experimental cross section for 89Y(n,2n)88Y reaction compared with EXFOR data, TALYS-1.96 calculations, and evaluated nuclear data.
As shown in Fig. 12, the present results are in good agreement with the cross sections reported in Refs. [61, 78, 107–109, 112–114, 95, 100–106], whose neutron energies overlapped with the present measurement within the experimental uncertainty. The measured cross section is in good agreement with the TALYS-1.96 calculations and ENDF/B-VIII.0, JENDL-5, and TENDL-2019 evaluations within the experimental uncertainty. The EMPIRE-3.2.3 calculations underestimated the cross section at a neutron energy of 14.77 MeV.
-
Figure 13 shows the measured cross section for the 89Y(n, γ)90Ym reaction at a neutron energy of 14.77 ± 0.17 MeV in comparison with the experimental data from the EXFOR database; evaluated data from the TENDL-2019, JENDL-5, and ENDF/B-VIII.0 libraries; and the TALYS-1.96 uncertainty calculations. The reported data of Ref. [81] after normalization with the IRDFF-II evaluation of the 197Au(n, 2n)196Au monitor reaction decreased by 2%. The reported data of Ref. [110] after normalization with the IRDFF-II evaluation of the 93Nb(n, 2n)92Nbm monitor reaction changed by less than 1%. The data reported by Refs. [74, 115–117] were normalized with the IRDFF-II evaluation of the 27Al(n, α)24Na monitor reaction at their respective neutron energies. The data of Refs. [74, 115–117] upon normalization changed by less than 2% from the reported value.
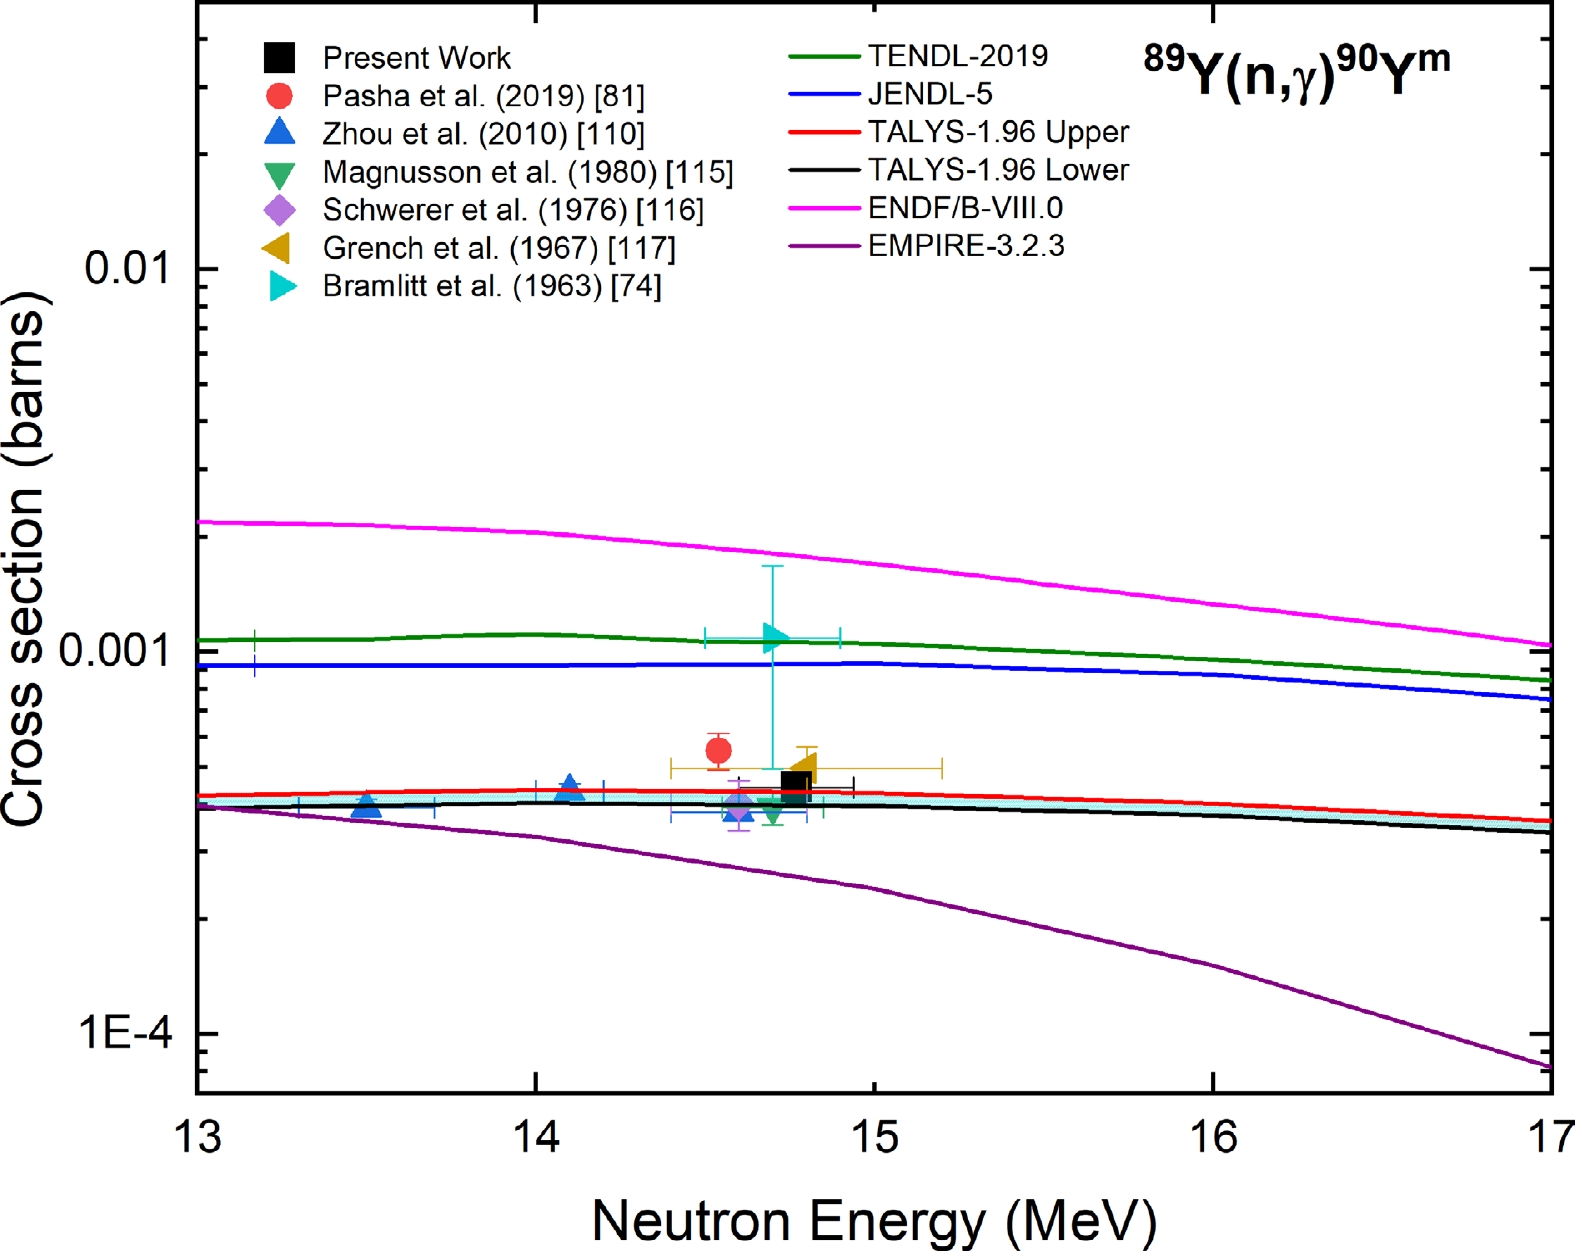
Figure 13. (color online) Measured experimental cross section for the 89Y(n, γ)90Ym reaction compared with EXFOR data, TALYS-1.96 calculations, and evaluated nuclear data.
As shown in Fig. 13, the present result is in good agreement within the experimental uncertainty with the cross sections reported by Refs. [115–117], whose neutron energies overlapped with the present measurement. The measured cross section is in good agreement with the TALYS-1.96 calculations within the experimental uncertainty. The ENDF/B-VIII.0, JENDL-5, and TENDL-2019 evaluations were higher than the measured cross section.
-
Figure 14 shows the measured cross section of the 100Mo(n, 2n)99Mo reaction at a neutron energy of 14.77 ± 0.17 MeV compared with the experimental data from the EXFOR database; evaluated data from the TENDL-2019, JENDL-5, and ENDF/B-VIII.0 libraries; and the TALYS-1.96 uncertainty calculations. Refs. [118, 119] adopted the 56Fe(n, p)56Mn reaction as the monitor reaction. Upon normalization with the IRDFF-II evaluation of the 56Fe(n, p)56Mn reaction, the cross sections changed by 16% and 9%, respectively. Refrences [56, 94, 120–130] adopted the 27Al(n, α)24Na reaction as the monitor reaction. After normalization with the IRDFF-II evaluation of the 27Al(n, α)24Na reaction, the cross sections changed by 7% for Refs. [56, 130], whereas for all the other Refs. [94, 120, 122–129], the changes were less than 4%. Additionally, after normalization for the gamma-yield per decay of the 1368.626 keV gamma line of 24Na, the reported data of Ref. [122] changed by 12%. Refrences [92, 131] adopted the 63Cu(n, 2n)62Cu reaction as the monitor reaction. Upon normalization with the IRDFF-II evaluation of the 63Cu(n, 2n)62Cu reaction, the cross sections changed by 2%–3 %. The reported cross section of Ref. [132] upon normalization with the IRDFF-II evaluation of the 65Cu(n,2n)64Cu monitor reaction changed by 2%. Refrences [133, 134] adopted the 93Nb(n, 2n)92Nbm reaction as the monitor reaction, and upon normalization with the IRDFF-II evaluation, they varied by less than 1%. The reported cross sections of Refs. [135–137] after normalization with the IRDFF-II evaluation of the 197Au(n, 2n)196Au monitor reaction changed by 0.5%. The contribution of 98Mo(n, γ)99Mo was subtracted from the measured cross section following the procedure given in Sec. II. D. of Ref. [69].
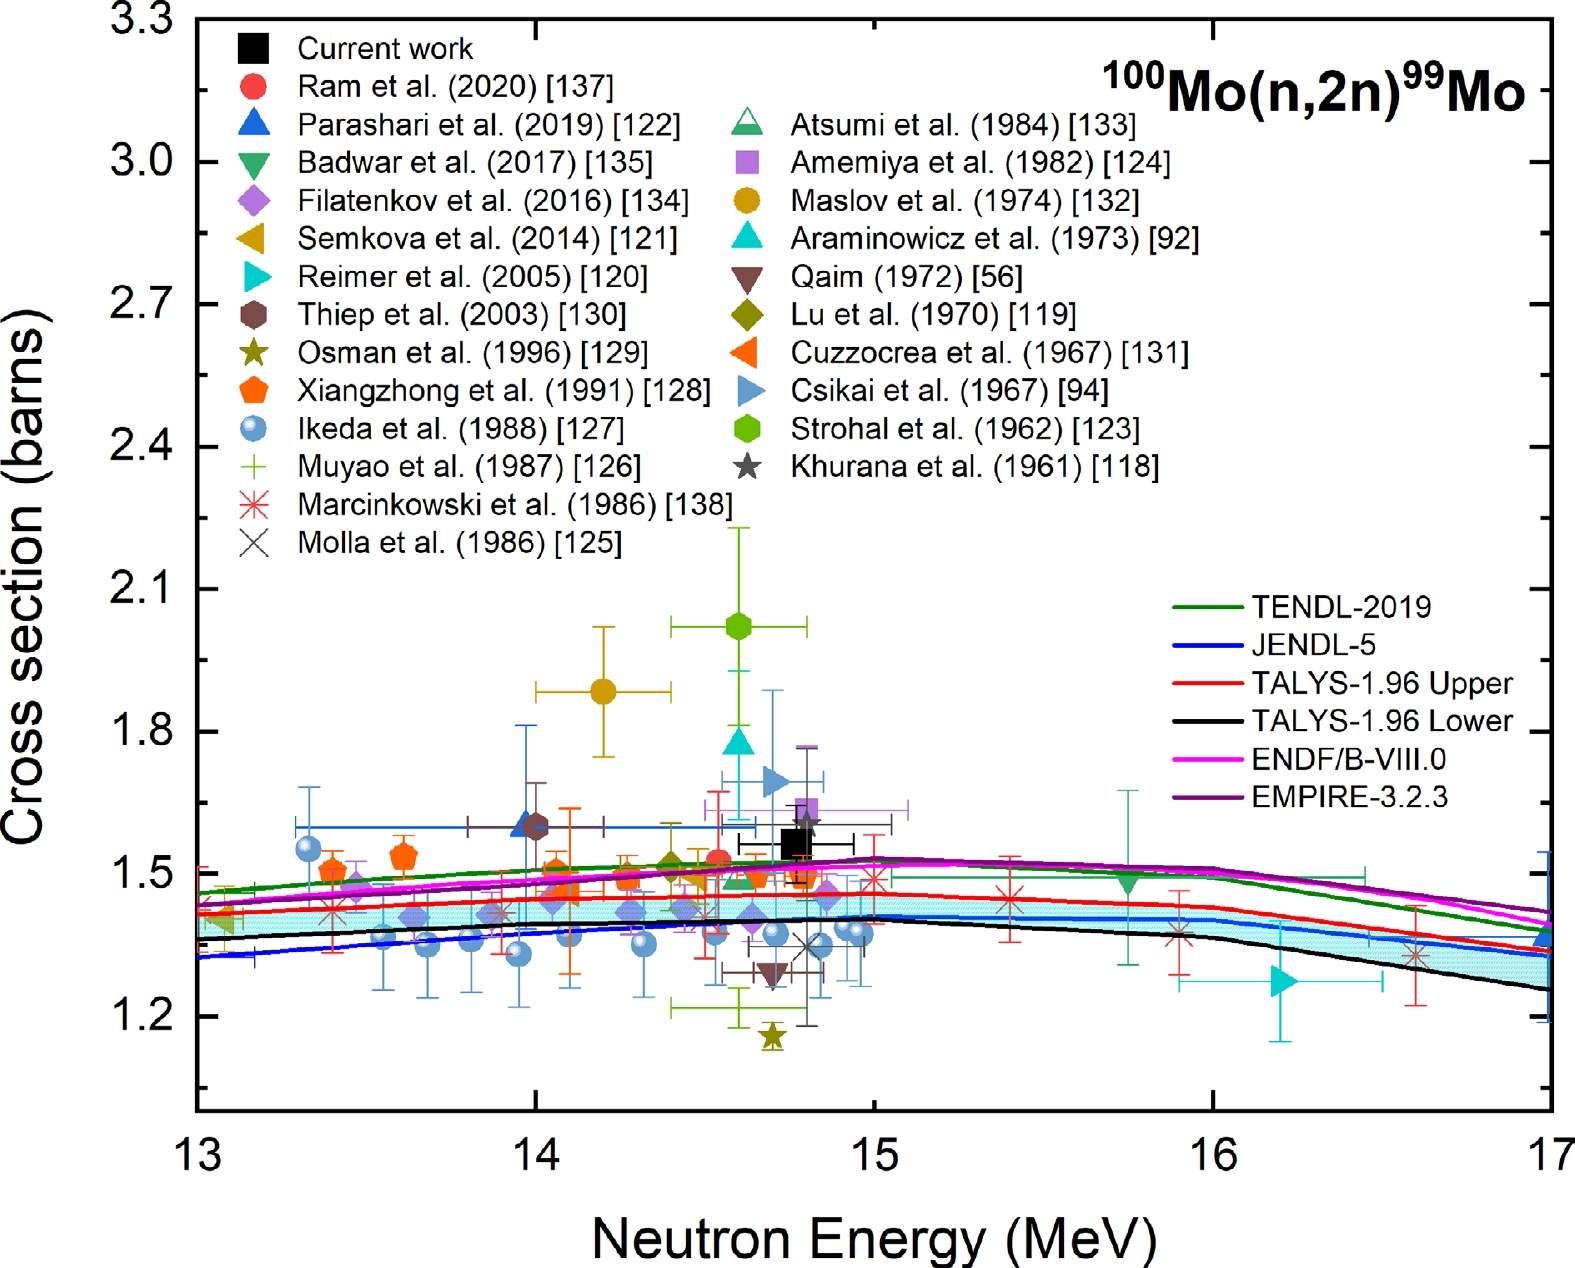
Figure 14. (color online) Measured experimental cross section for the 100Mo(n, 2n)99Mo reaction compared with EXFOR data, TALYS-1.96 calculations, and evaluated nuclear data.
The cross sections reported in Refs. [94, 118, 124, 125, 128], whose neutron energies overlapped with the present measurement, are in good agreement with the present result within the experimental uncertainty. The measured cross section does not agree with the data reported in Refs. [56, 92, 123, 127, 129, 134]. The measured cross section is in good agreement with the EMPIRE-3.2.3, ENDF/B-VIII.0, and TENDL-2019 evaluations within the experimental uncertainty. However, the TALYS-1.96 calculations and JENDL-5 evaluation underestimated the cross section at the 14.77 MeV neutron energy.
-
Figure 15 depicts the measured cross section of the 98Mo(n, p)98Nbm reaction at a neutron energy of 14.77 ± 0.17 MeV compared with the experimental data from the EXFOR database, evaluated data from the TENDL-2019 and JENDL-5 libraries, and the TALYS-1.96 uncertainty calculations. The reported experimental data of Refs. [86, 119, 138] after normalization with the IRDFF-II evaluation of the 56Fe(n, p) 56Mn reaction changed by 11%, 16%, and 5%, respectively. Refrences [48, 66, 112, 116, 117, 119–121, 126, 131–133, 139–141] adopted the 27Al(n, α)24Na reaction as the monitor reaction. The above data were normalized with the IRDFF-II evaluation of the 27Al(n, α)24Na reaction. The cross sections changed by 7% for Refs. [56, 139] after normalization, whereas for the other authors, the changes were less than 4%. Refrences [131, 142] adopted the 63Cu(n, 2n)62Cu reaction as the monitor reaction. Upon normalization with the IRDFF-II evaluation of the 63Cu(n, 2n)62Cu reaction, the cross sections changed by 1% and 7%, respectively.
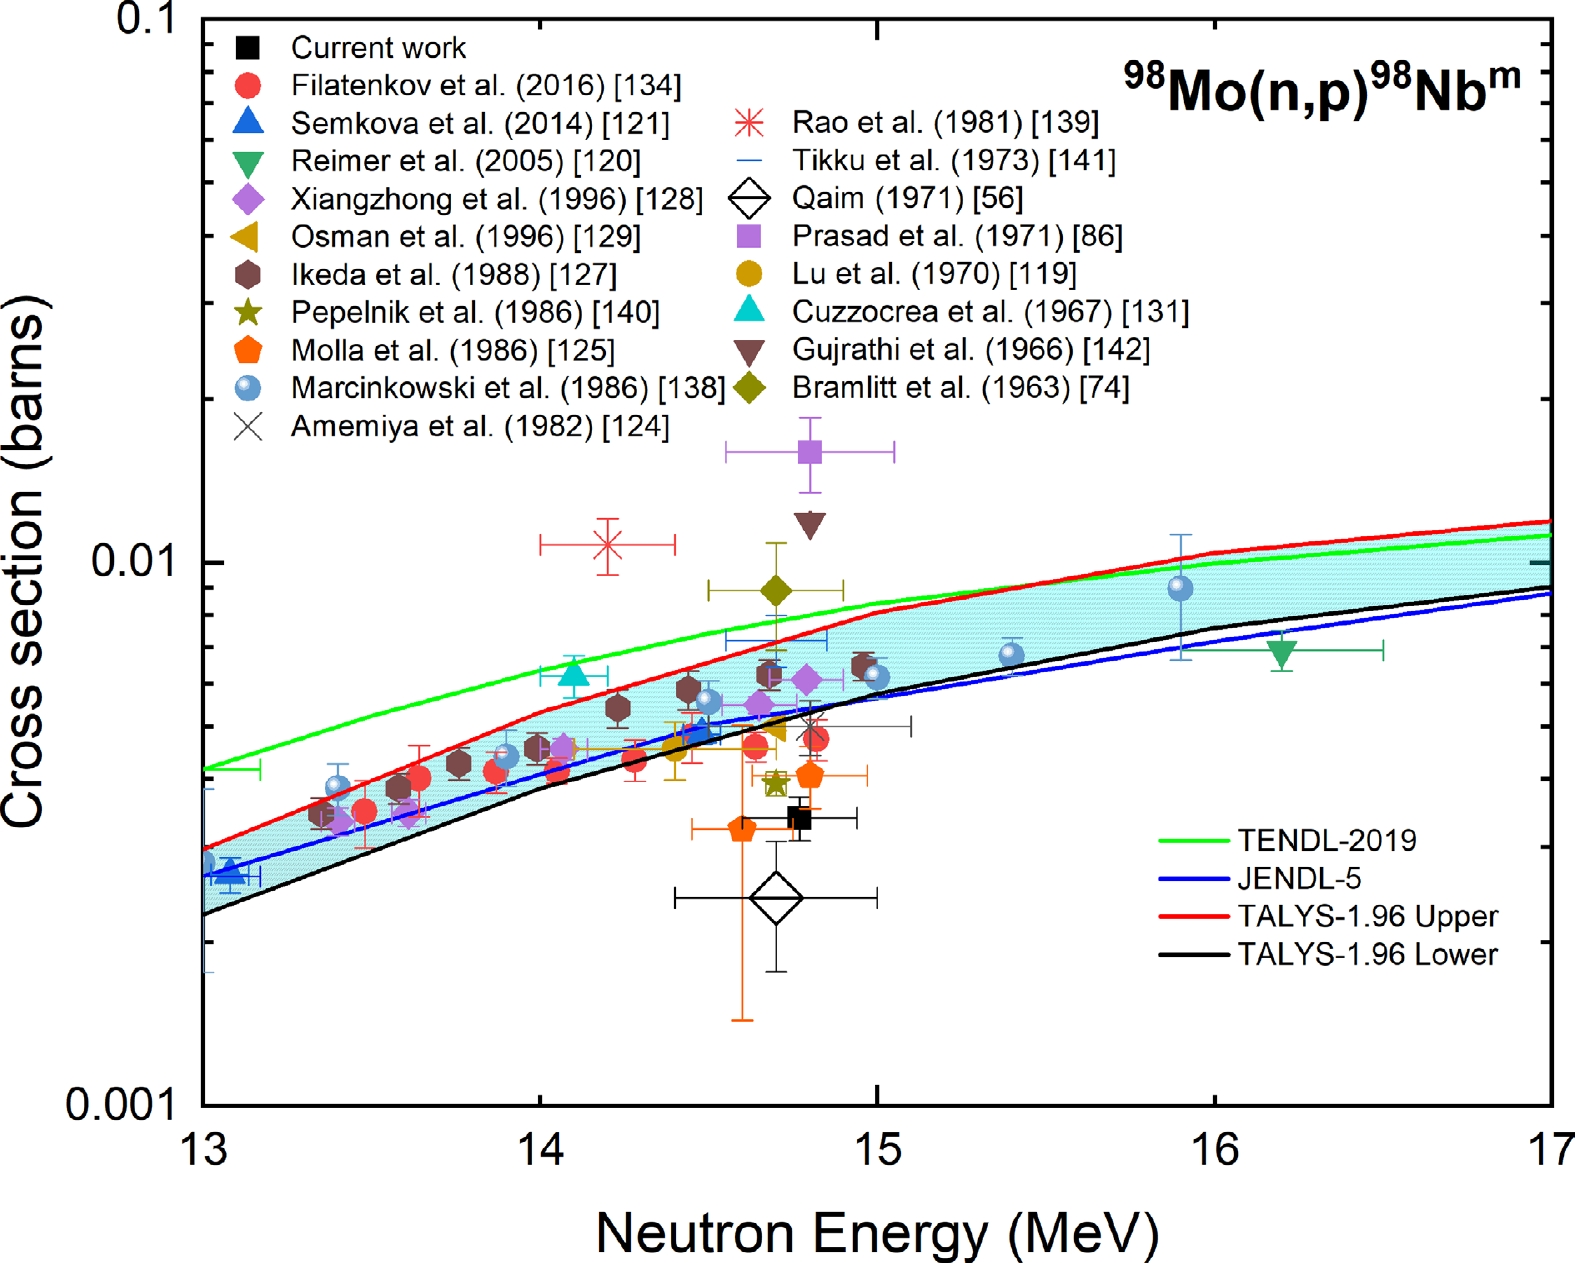
Figure 15. (color online) Measured experimental cross section for the 98Mo(n, p)98Nbm reaction compared with EXFOR data, TALYS-1.96 calculations, and evaluated nuclear data.
The cross section reported in Ref. [125], whose neutron energy overlapped with the present measurement, is in good agreement with the present result within the experimental uncertainty. The measured cross section was lower than the TALYS-1.96 calculations and JENDL-5 and TENDL-2019 evaluations.
-
Figure 16 shows the measured cross section of the 97Mo(n, p)97Nbg reaction at a neutron energy of 14.77 ± 0.17 MeV compared with the experimental data from the EXFOR database; evaluated data from the TENDL-2019, JENDL-5, and ENDF/B-VIII.0 libraries; and the TALYS-1.96 uncertainty calculations. The 27Al(n, α)24Na reaction was adopted as the monitor reaction in Refs. [69, 109, 120, 121, 123–125, 127–129, 141, 143, 144]. After normalization with the IRDFF-II evaluation of the 27Al(n, α)24Na reaction, the reported cross sections of Ref. [109] changed by 7%, whereas for Refs. [69, 120, 121, 123–125, 127–129, 141, 143, 144], the change was less than 4%. The reported data of Ref. [131] after normalization with the IRDFF-II evaluation of the 65Cu(n, 2n)64Cu monitor reaction decreased by 7%. The experimental data of Refs. [119, 138] after normalization with the IRDFF-II evaluation of the 56Fe(n, p)56Mn reaction changed by 10% and 2%, respectively. The same energy γ line (657.23 keV) and branching ratio used in the present study was reported by the authors of Refs. [69, 119, 121, 124, 125, 127, 129, 140, 144, 145]. However, the authors of Refs. [68, 109, 123, 131, 146, 147] did not state the decay data. Although an isomer, 97Nbm with a half-life of 58.7 s was produced after neutron irradiation; the contribution of the metastable state to ground state was neglected owing to a sufficient cooling time.
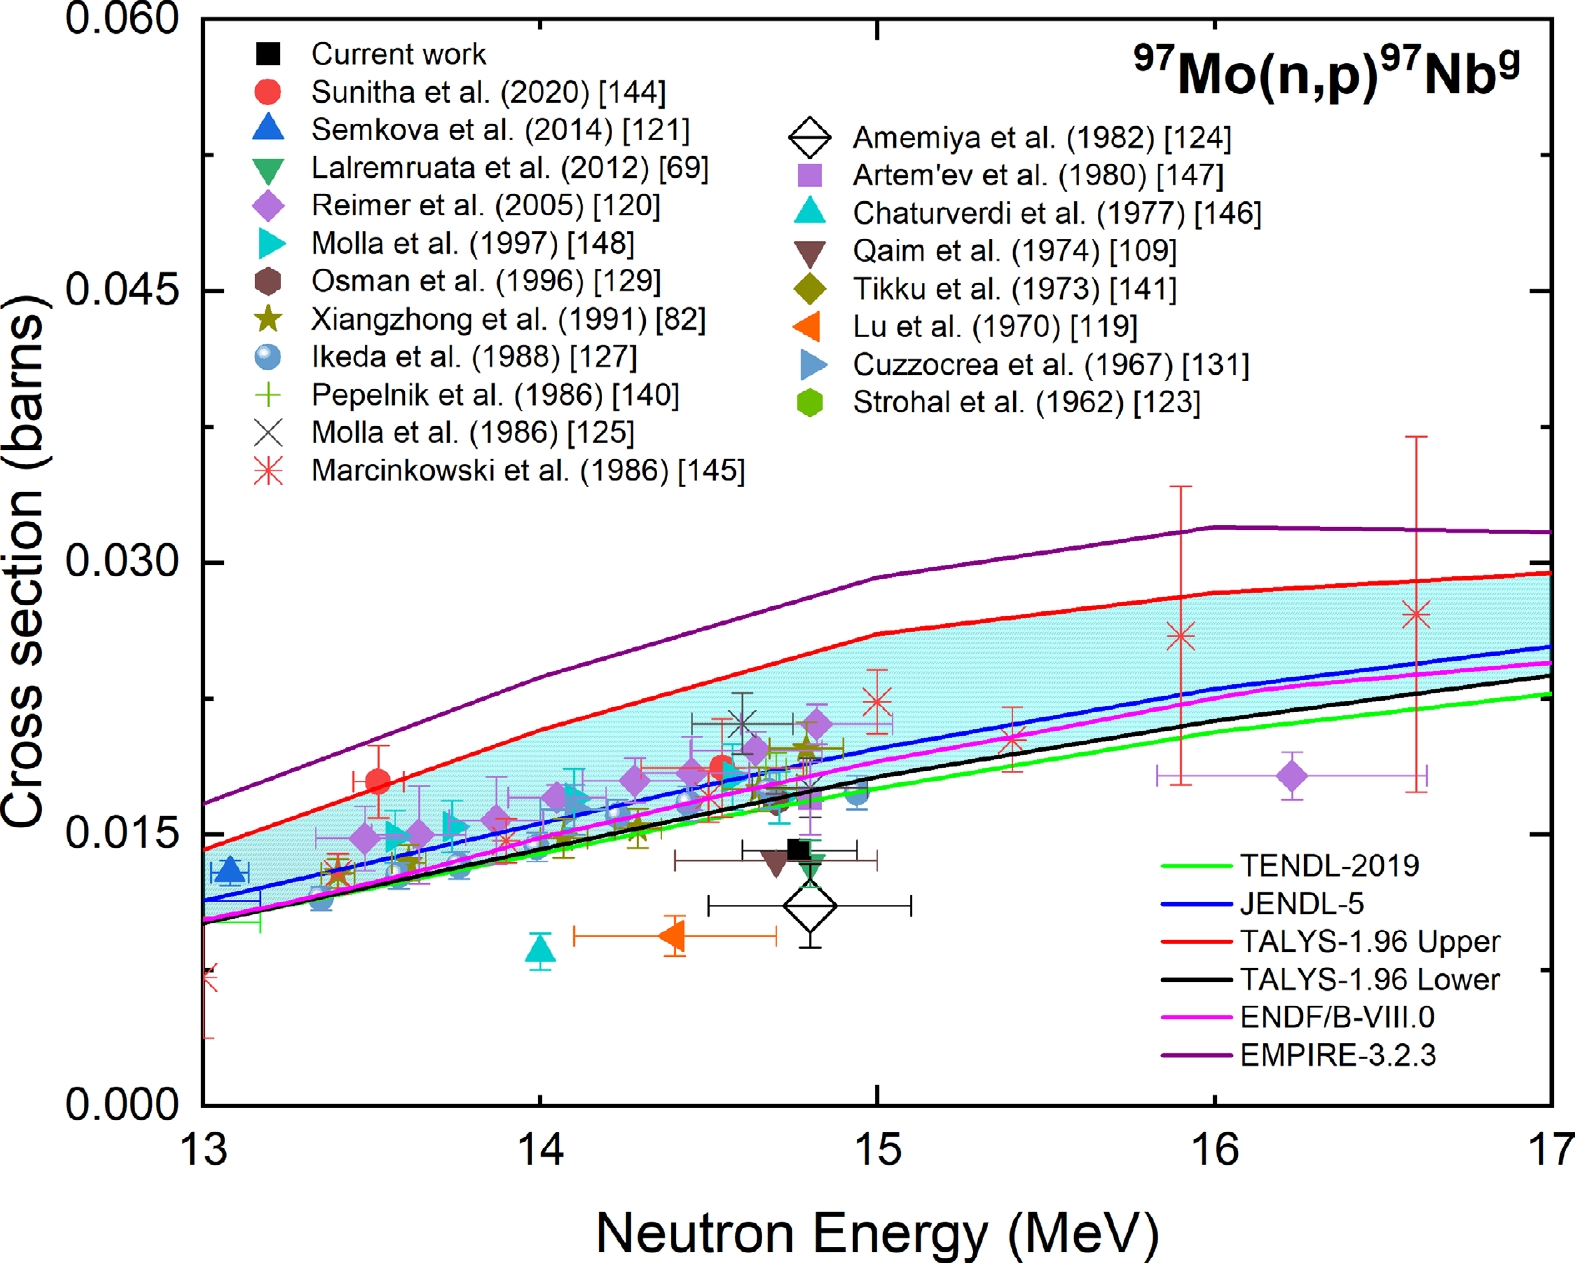
Figure 16. (color online) Measured experimental cross section for the 97Mo(n, p)97Nbg reaction compared with EXFOR data, TALYS-1.96 calculations, and evaluated nuclear data.
As shown in Fig. 16, the cross section reported in Refs. [69, 109], whose neutron energy overlapped with the present measurement, is in good agreement with the result within the experimental uncertainty. The measured cross section was lower than the TALYS-1.96 and EMPIRE.3.2.3 calculations and the evaluations of Refs. [1, 7, 8].
-
The measured cross section of the 96Mo(n, p)96Nb reaction at a neutron energy of 14.77 ± 0.17 MeV from the present study was compared with the experimental data from the EXFOR database' evaluated data from the TENDL-2019, JENDL-5, and ENDF/B-VIII.0 libraries; and the TALYS-1.96 uncertainty calculations, as shown in Fig. 17. The experimental data reported in Refs. [74, 109, 120, 123–125, 127–129, 139, 140, 148] were normalized with the IRDFF-II evaluation of the 27Al(n, α)24Na monitor reaction. The reported cross sections of Refs. [109, 139] changed by 7%, whereas for Refs. [74, 120, 123–125, 127–129, 140, 148], the changes were less than 5%. The reported data of Ref. [131] after normalization with the IRDFF-II evaluation of the 63Cu(n, 2n)62Cu monitor reaction changed by 3%. The experimental data reported in Refs.[138, 149] after normalization with the IRDFF-II evaluation of the 56Fe(n, p)56Mn reaction changed by 10% and 2%, respectively. The reported data of Refs. [133, 137] after normalization with their respective monitor data changed by 1%.
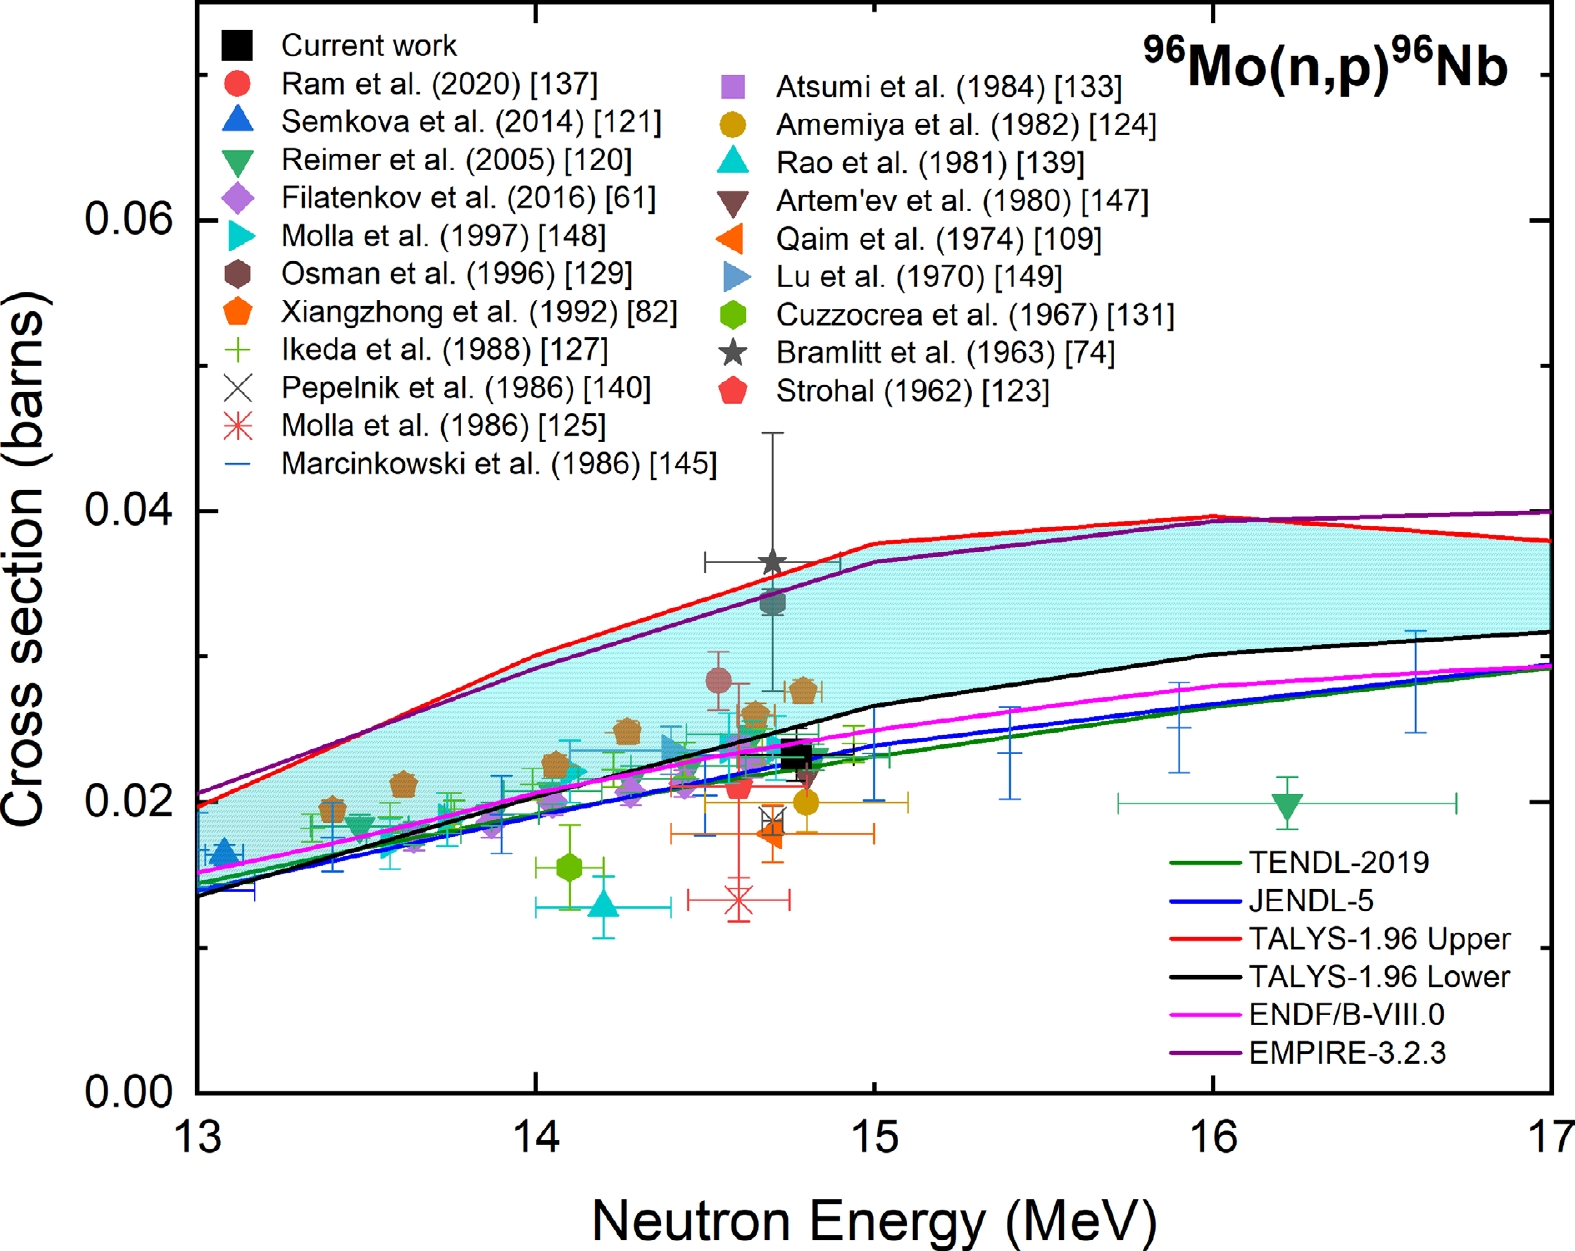
Figure 17. (color online) Measured experimental cross section for the 96Mo(n, p)96Nb reaction compared with EXFOR data, TALYS-1.96 calculations, and evaluated nuclear data.
As shown in Fig. 17, the present measurement is in good agreement with the reported data in Refs. [61, 120, 124, 147, 148] within the experimental uncertainty. The measured cross section is in good agreement with the TALYS-1.96 calculations and ENDF/B-VIII.0, JENDL-5, and TENDL-2019 evaluations within the experimental uncertainty. However, the EMPIRE-3.2.3 calculations overestimated the cross section at the 14.77 MeV neutron energy.
-
The measured cross section of the 94Mo(n, 2n)93Mom reaction at a neutron energy of 14.77 ± 0.17 MeV from the present study was compared with the experimental data from the EXFOR database, evaluated data from the TENDL-2019 and JENDL-5 libraries, and the TALYS-1.96 uncertainty calculations, as shown in Fig. 18. The experimental data reported in Refs. [120, 124, 127, 128, 134, 139, 148] were normalized with the IRDFF-II evaluation of the 27Al(n, α)24Na monitor reaction. The reported cross sections changed by 4% for Ref. [124], whereas for Refs. [120, 127, 128, 134, 139, 148], the changes were less than 3%. The experimental data of Ref. [138] after normalization with the IRDFF-II evaluation of the 56Fe(n, p)56Mn reaction changed by 2%. The reported data of Ref. [150] after normalization with IRDFF-II evaluation of the 93Nb(n, 2n)92Nbm monitor reaction changed by 2%.
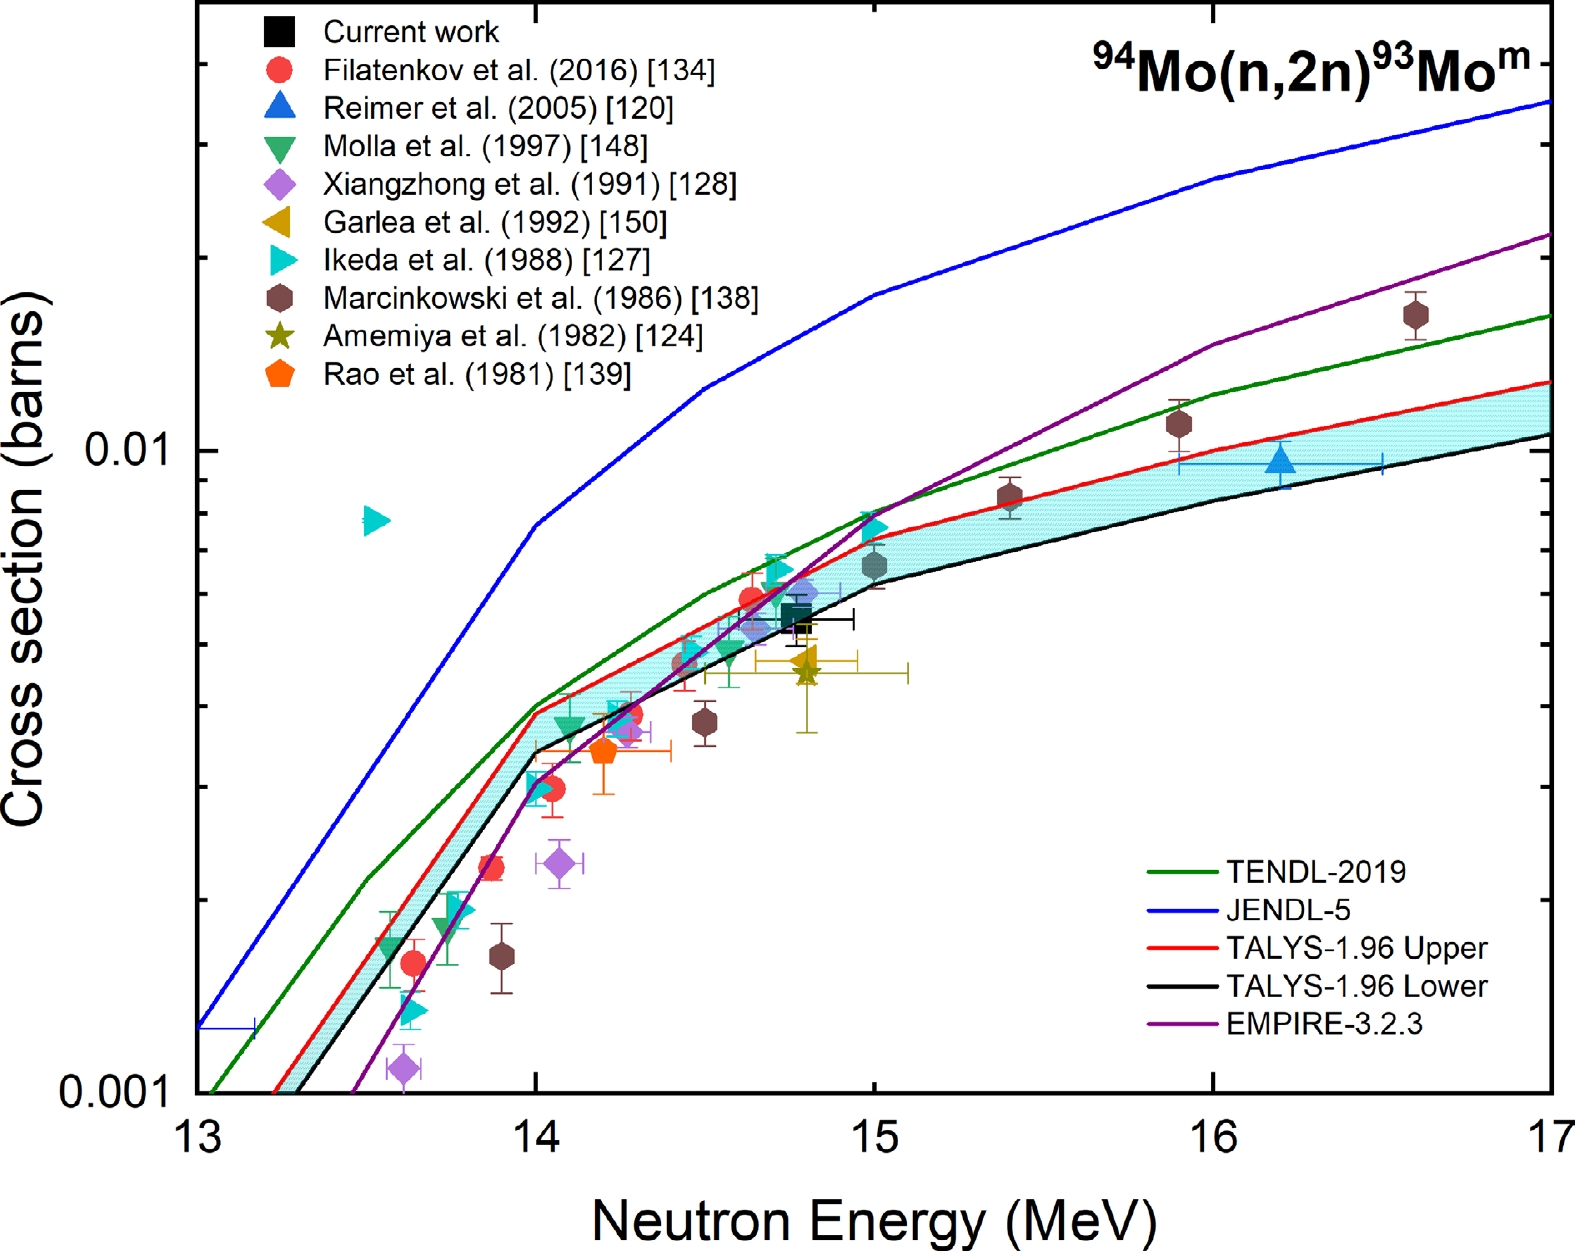
Figure 18. (color online) Measured experimental cross section for the 94Mo(n, 2n)93Mom reaction compared with EXFOR data, TALYS-1.96 calculations, and evaluated nuclear data.
As shown in Fig. 18, the present result is in good agreement with the reported data of Refs. [61, 124, 128, 148, 150] within the experimental uncertainty. The measured cross section is in good agreement only with the TALYS-1.96 calculations within the experimental uncertainty. The JENDL-5 and TENDL-2019 evaluations overestimated the cross section at the 14.77 MeV neutron energy.
-
The measured cross section of the 92Mo(n, p)92Nbm reaction at a neutron energy of 14.77 ± 0.17 MeV from the present study was compared with the experimental data from the EXFOR database, evaluated data from the TENDL-2019 and JENDL-5 libraries, and the TALYS-1.96 uncertainty calculations, as shown in Fig. 19. The experimental data reported in Refs. [61, 72, 74, 120, 121, 123, 124, 127–129, 140, 148, 151–153] were normalized with the IRDFF-II evaluation of the 27Al(n, α)24Na monitor reaction. The reported experimental data of Refs. [138, 149] were normalized with the IRDFF-II evaluation of the 56Fe(n, p)56Mn reaction, and the change after normalization was 10% and 2%, respectively. The reported data of Ref. [125] after normalization with the IRDFF-II evaluation of the 75As(n, 2n)74As monitor reaction changed by 6%. The experimental data of Refs. [133, 150, 154, 155] after normalization with the IRDFF-II evaluation of the 93Nb(n, 2n)92Nbm monitor changed by less than 2%. The experimental data of Refs. [156, 157] changed by 1% after normalization with the IRDFF-II evaluation of the 197Au(n, 2n)196Au monitor reaction. Refs. [147, 158, 159] did not provide details on the monitor reaction. Hence, the data of Refs. [147, 158, 159] were not plotted.
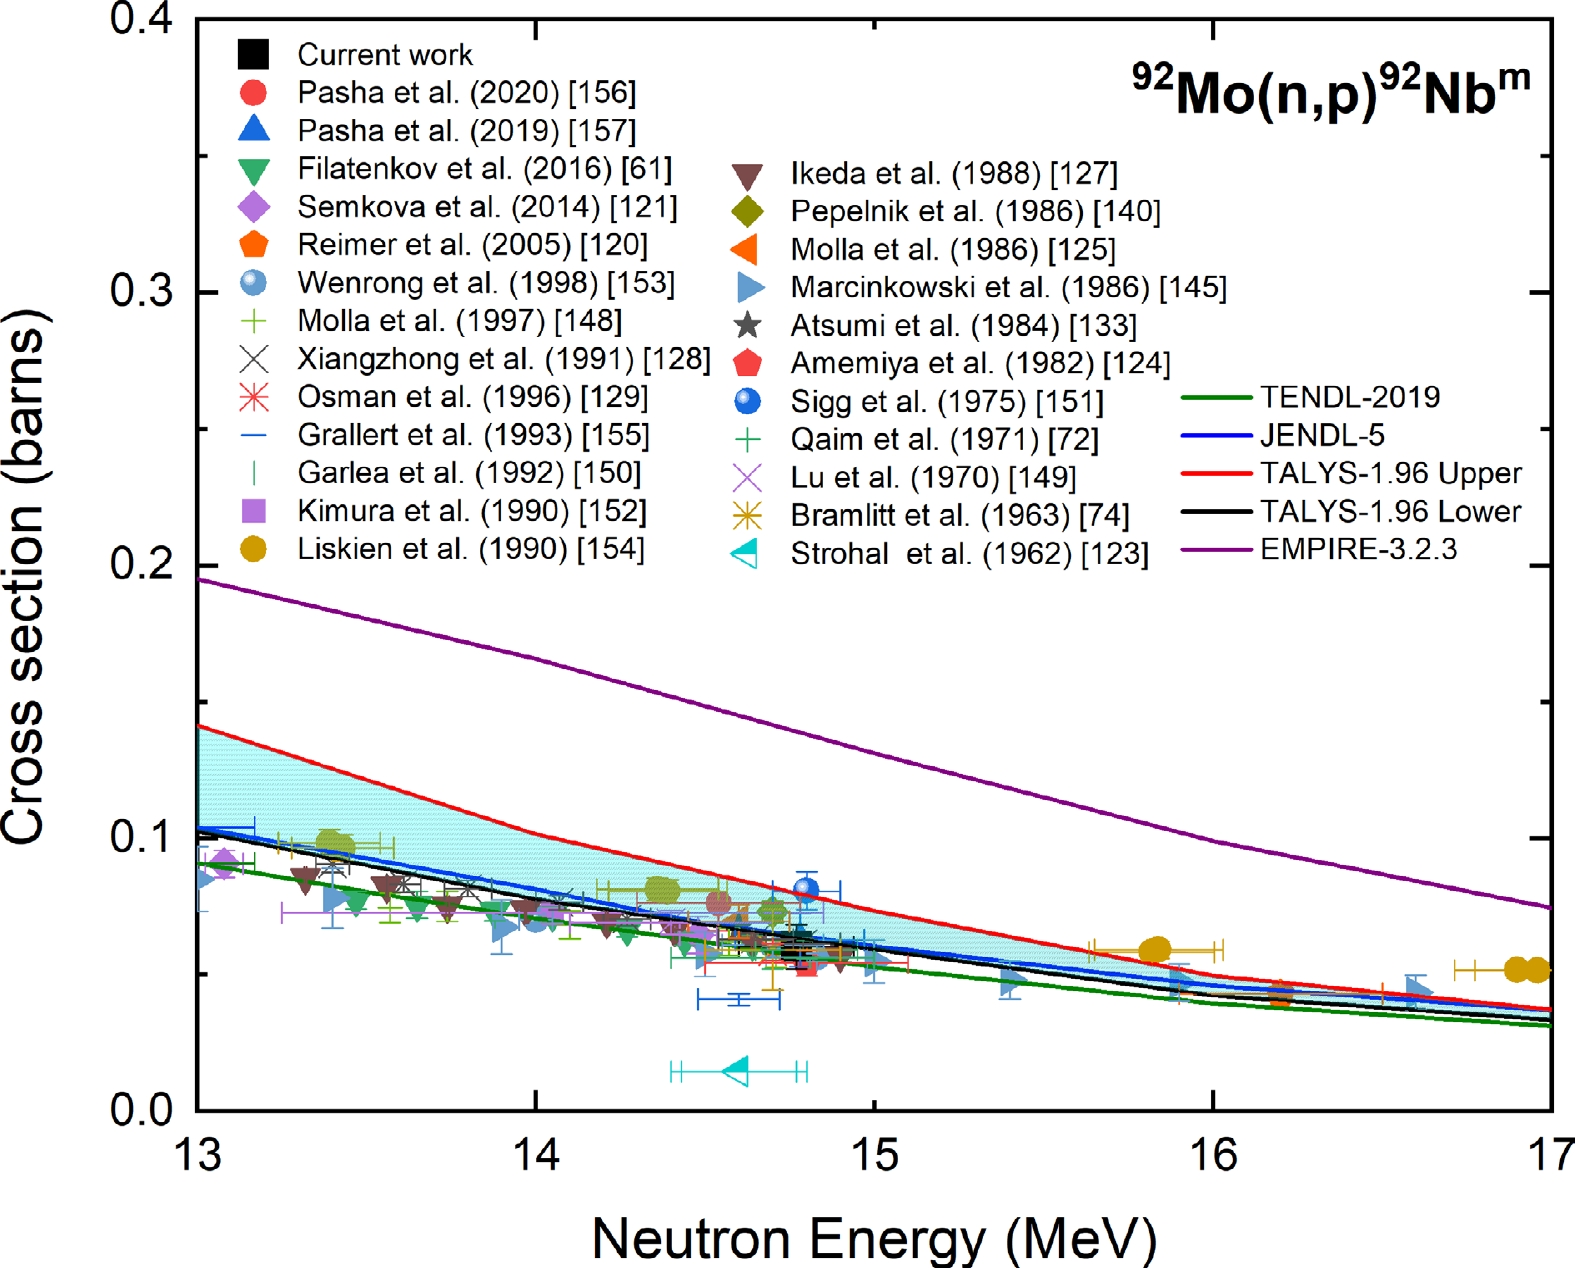
Figure 19. (color online) Measured experimental cross section for the 92Mo(n, p)92Nbm reaction compared with EXFOR data, TALYS-1.96 calculations, and evaluated nuclear data.
As shown in Fig. 19, the present results are in good agreement with most of the reported data within the experimental uncertainty. The measured cross section is in good agreement with the TALYS-1.96 calculations and JENDL-5 and TENDL-2019 evaluations within the experimental uncertainty.
-
Figure 20 shows the measured cross section of the 92Mo(n, α)89Zrm reaction at a neutron energy of 14.77 ± 0.17 MeV compared with the experimental data from the EXFOR database, evaluated data from the TENDL-2019 and JENDL-5 libraries, and the TALYS-1.96 uncertainty calculations. The experimental data reported in Refs. [61, 72, 120, 124, 127, 139, 151, 160] were normalized with the IRDFF-II evaluation of the 27Al(n, α)24Na monitor reaction. The experimental data of Ref. [150] after normalization with the IRDFF-II evaluation of the 93Nb(n, 2n)92Nbm monitor changed by 2%.
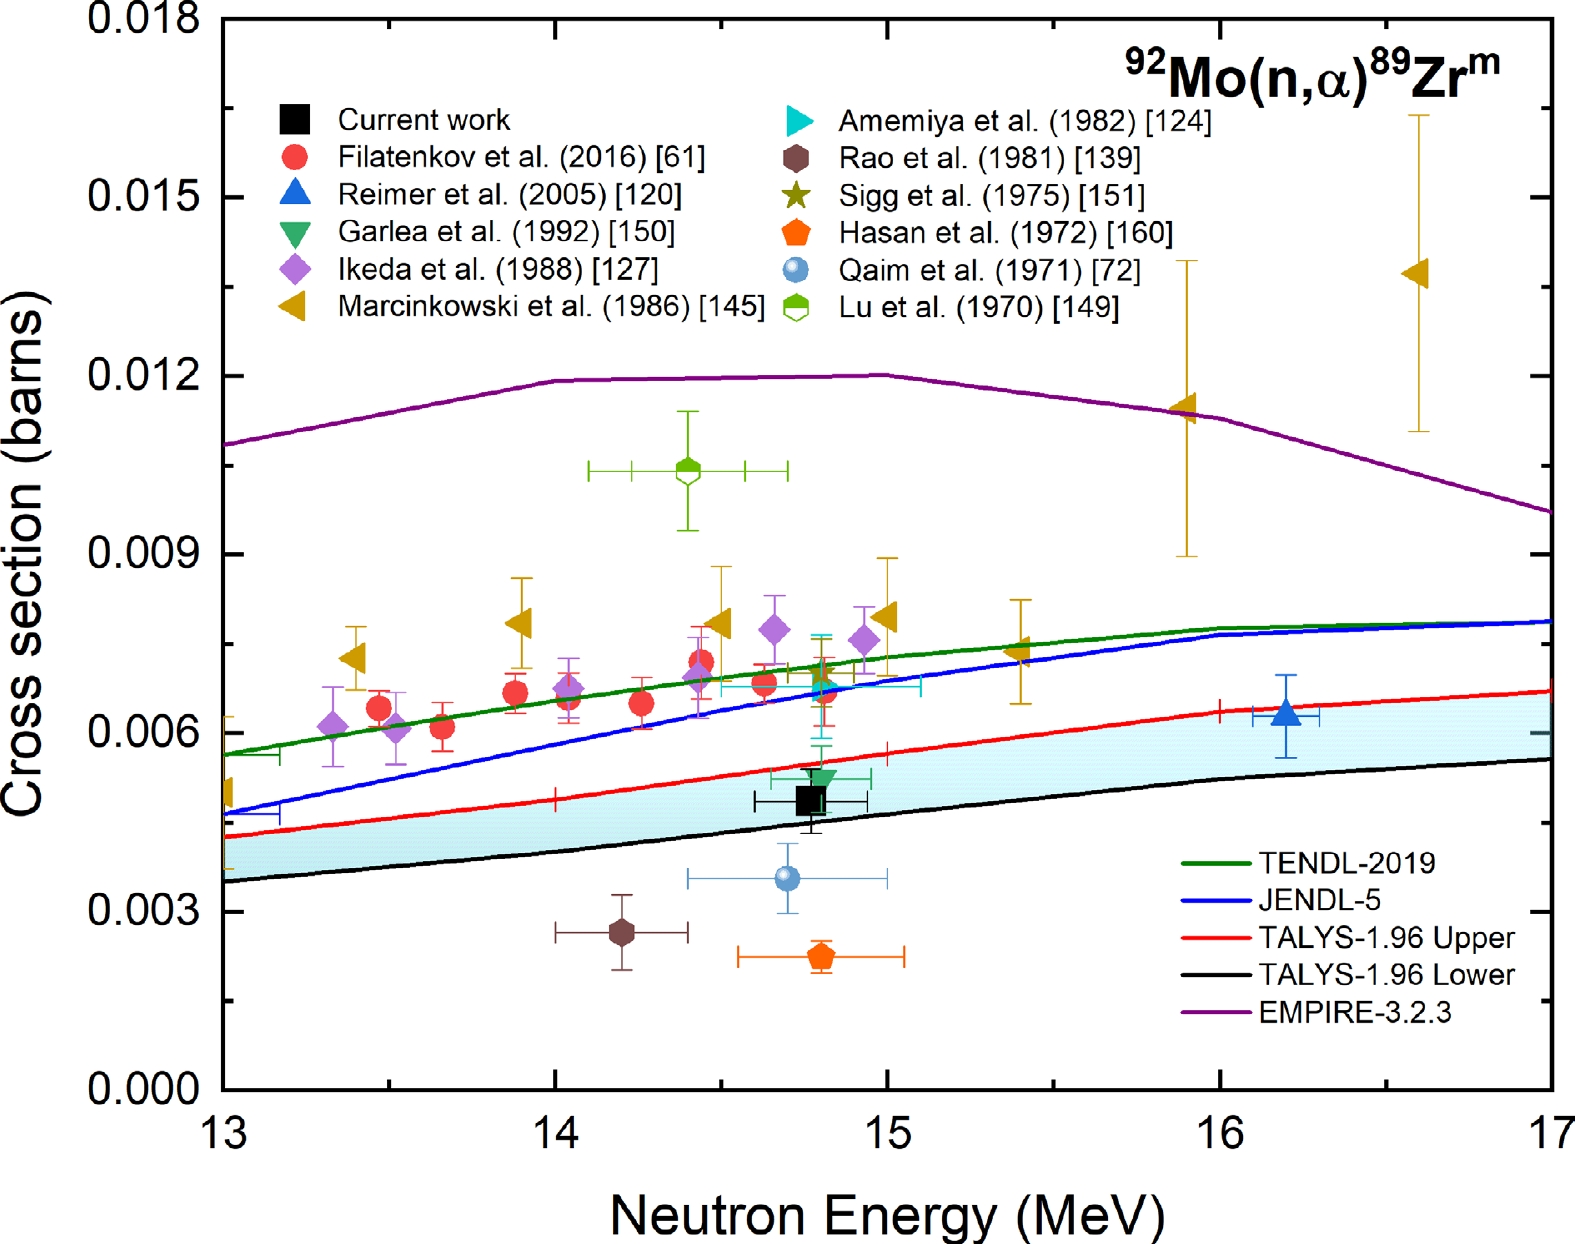
Figure 20. (color online) Measured experimental cross section for the 92Mo(n, α)89Zrm reaction compared with EXFOR data, TALYS-1.96 calculations, and evaluated nuclear data.
As shown in Fig. 20, the present results are in good agreement with only the data reported in Ref. [150] within the experimental uncertainty. The measured cross section is in good agreement with the TALYS-1.96 calculations within the experimental uncertainty. The JENDL-5 and TENDL-2019 evaluations were higher than the measured cross section and better represent the experimental trend.
-
The measured cross section of the 92Mo(n, α)89Zrg reaction at a neutron energy of 14.77 ± 0.17 MeV was compared with the experimental data from the EXFOR database, evaluated data from the TENDL-2019 and JENDL-5 libraries, and the TALYS-1.96 uncertainty calculations, as shown in Fig. 21. The experimental data reported in Refs. [72, 74, 121, 124, 127, 128, 140, 144, 148, 161, 162] were normalized with the IRDFF-II evaluation of the 27Al(n, α)24Na monitor reaction. The reported experimental data of Refs. [76, 138, 149] were normalized with the IRDFF-II evaluation of the 56Fe(n, p)56Mn reaction, and the change after normalization was 2%, 3%, and 10%, respectively.
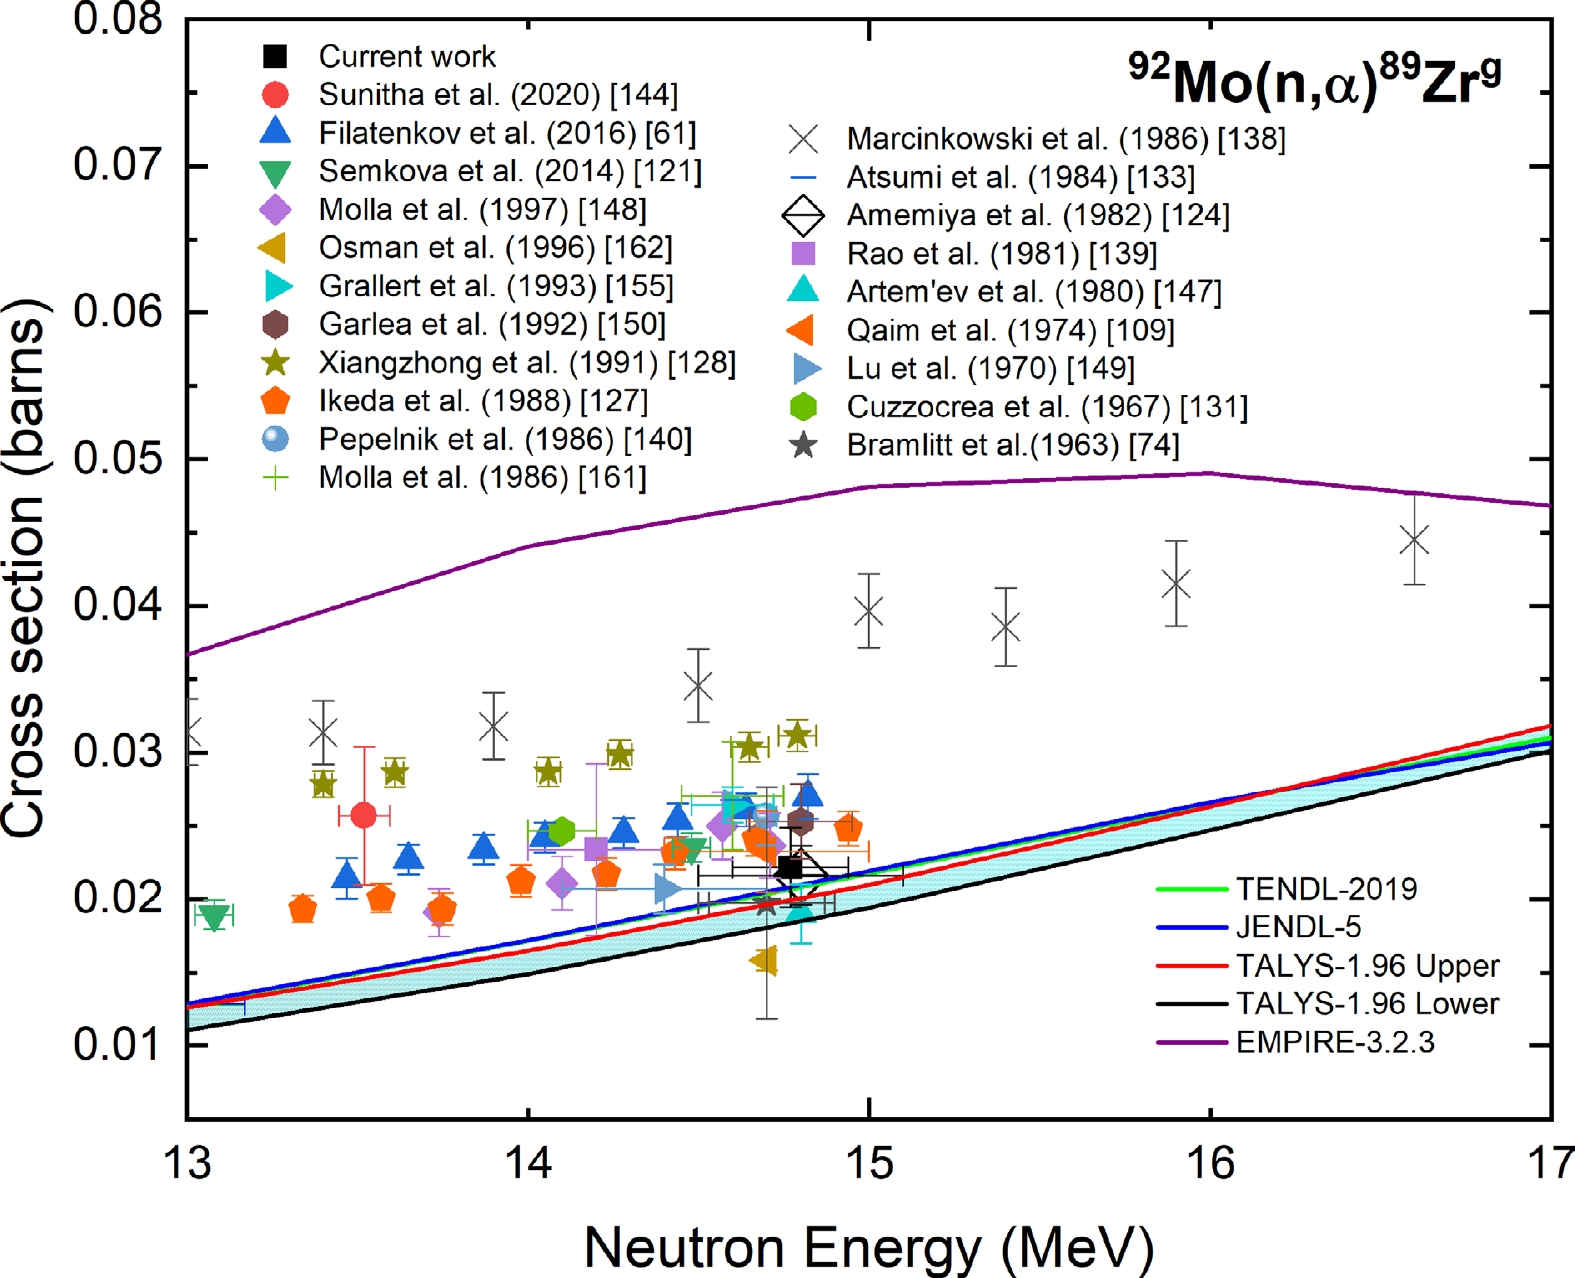
Figure 21. (color online) Measured experimental cross section for the 92Mo(n, α)89Zrg reaction compared with EXFOR data, TALYS-1.96 calculations, and evaluated nuclear data.
As shown in Fig. 21, the present results are in good agreement with most of the reported data within the experimental uncertainty. The measured cross section is in good agreement with the TALYS-1.96 calculations and JENDL-5 and TENDL-2019 evaluations within the experimental uncertainty. However, the evaluations underestimated the experimental trend for the 92Mo(n, α)89Zrg reaction.
-
In this study, the cross sections for the 70Zn(n, 2n)69Znm, 68Zn(n, p)68Cum, 68Zn(n, α)65Ni, 67Zn(n, p)67Cu, 66Zn(n, p)66Cu, 66Zn(n, 2n)65Zn, 64Zn(n, 2n)63Zn, 89Y(n, 2n)88Y, 89Y(n, γ)90Ym, 100Mo(n, 2n)99Mo, 98Mo(n, p)98Nbm, 97Mo(n, p)97Nbg, 96Mo(n, p)96Nb, 94Mo(n, 2n)93Mom, 92Mo(n, p)92Nbm, 92Mo(n, α)89Zrm, and 92Mo(n, α)89Zrg nuclear reactions at an incident neutron energy of 14.77 ± 0.17 MeV are reported with a detailed description of the uncertainty quantification and correlation matrix. The corrections due to the coincidence summing-effect and self-attenuation have been considered in γ-ray spectrometry analysis. Covariance analysis was performed to determine the uncertainty of the measured cross sections. The total uncertainty in the measured cross sections was found to be 4%–17%. The reported data in the EXFOR database was normalized with the latest IRDFF-II monitor data and ENDSF decay data for meaningful comparison. The present results agree with the experimental EXFOR data and evaluated data libraries.
14.77 MeV neutron-induced nuclear reaction cross sections for zinc, yttrium, and molybdenum targets
- Received Date: 2022-07-13
- Available Online: 2023-03-15
Abstract: The cross sections for neutron-induced nuclear reactions on natural zinc, yttrium, and molybdenum targets were measured at a neutron energy of 14.77 ± 0.17 MeV using the activation technique, offline gamma-ray spectrometry, and a detailed covariance analysis. The uncertainty in the statistical model calculations of cross sections for the (n, 2n), (n, p), (n, α), and (n, γ) reactions with natural zinc, yttrium, and molybdenum at neutron energies from 13 to 17 MeV was calculated using the TALYS-1.96 nuclear code. The measured cross sections of the present study were compared with the experimental cross sections reported in the EXFOR database, the cross sections were calculated with the TALYS-1.96 and EMPIRE-3.2.3 nuclear codes and the evaluated nuclear data from the TENDL-2019, JENDL-5, and ENDF/B-VIII.0 libraries.


 DownLoad: