-
The neutron magic number N = 126 is the largest magic number for stable nuclei. Historically, investigations of the isotopes around this shell played a key role in the foundation and development of the nuclear shell model. In the last decade, systematics in the laboratory of isotopes far from stability has provided the opportunity for understanding the structural evolution over a wide isospin region.
On the neutron-rich side around the N = 126 shell, much effort has been made toward searching for the r-process waiting point [1]. In this respect, steady progress was made at GSI. A hundred neutron-rich nuclei in the atomic number range of 60 ≤ Z ≤ 87 were identified by using the projectile fragmentation of a 238U beam at 1 GeV/nucleon [2, 3], while 26 new isotopes were produced using the abrasion of protons from a 208Pb projectile [4]. Another alternative reaction for producing heavy neutron-rich nuclei is multinucleon transfer [5]. Calculations based on the Langevin type dynamical equations of motion suggest the 136Xe + 208Pb reactions at energies around the Coulomb barrier, in which more than 50 unknown nuclei might be produced with cross sections not less than 1 μb [6]. Then, the isotopic, mass, and energy distributions of the fragments in those reactions were measured at Dubna and Argonne [7, 8], providing data to test models for multinucleon transfer, such as GRAZING, the Langevin model, the improved quantum molecular dynamics model [9, 10], and the dinuclear system model [11].
The systematics of the neutron-deficient isotopes near the magic neutron number N = 126 and measurements of their α decay systematics are crucial for explaining the shell evolution up to the proton drip line. To produce those isotopes, fusion-evaporation, multinucleon transfer, and projectile fragmentation were used. Using fusion-evaporation reactions, more than 20 isotopes in the region from lead to thorium were identified at GSI Darmstadt [12–19], and isotopes 219,220,223,234Np and 214U were observed by employing the gas-filled recoil separator at Lanzhou [20–25]. In those experiments, the lower limit cross sections reach 0.9 nb [20]. The cross sections in multinucleon transfer reactions are larger. Using the actinide target 248Cm and a 48Ca beam, the new isotopes 216U, 219Np, 223Am, 229Am, and 233Bk have been observed with cross sections that are more than 5 nb [26]. One expects to enhance the narrow acceptance angle so that other isotopes in the Am chain can be observed. Efforts were also made using the projectile fragmentation of 238U, in which the cross sections reach 0.7 nb for 208Th and 1.2 nb for 211Pa [27].
A large number of isotopes around the N = 126 shell have not been observed in the laboratory. More precisely, the Np isotopes with N < 129 except 219,220Np, the Pu isotopes with N < 134, the Am isotopes with N < 134 except 223Am, and the Cm isotopes with N < 137 have not been found. Candidate reactions to produce those isotopes are the fusion-evaporation reaction and multinucleon transfer reaction. However, one has to face the challenges of low cross sections. For example, the cross section to produce 223Np by the fusion reaction 40Ar + 187Re is about 0.9 nb [20]. The total cross sections of 5 nb are assessed for the newly observed isotopes produced in the multinucleon transfer reactions of 48Ca + 248Cm [26]. On the other hand, both experimental measurements [27] and theoretical calculations [28] have proven that a large number of neutron-deficient isotopes can be produced by the spallation (or projectile fragmentation) of 238U at 1 GeV/nucleon. Then, a natural expectation could be the productions of neutron-deficient isotopes by the spallation of transuranic targets such as 248Cm, 249Bk, and 252Cf [29, 30].
A number of models were developed to predict the residue-production for spallation reactions. These models are coupled with Monte-Carlo implementations of intranuclear cascade (INC) or quantum molecular dynamics (QMD) models in general and followed by a secondary decay model, which is used to describe the de-excitation stage [31]. Some models based on semi-empirical parametrizations were also developed to predict the residue-production produced in the spallation reaction, such as EPAX and SPACS [32–34]. Among machine learning technologies, the Bayesian neural network (BNN) also provides another great approach for solving prediction problems in nuclear physics including spallation reactions [35, 36].
In this work, the proton-induced spallations for 237Np, 239Pu, 241Am, 244Cm, 247Bk, and 252Cf are investigated by the IQMD-GEMINI++ model. The cross sections, kinetic energies, and emission angle distributions of the possible new isotopes in Np, Pu, Am, Cm, and Cf chains are predicted by the IQMD-GEMINI++ model. To assess the yields of the possible new isotopes, the energy loss and range of Np produced in the p + 241Am reaction are calculated. The paper is organized as follows. In Sec. II, the method is briefly introduced. In Sec. III, we present both the results and discussion. Finally, the summaries are given in Sec. IV.
-
A dynamic model followed by a statistical decay model is a common tool to study the heavy-ion collision at hundreds of megaelectronvolts per nucleon. An early review of the quantum molecular dynamics model can be traced back to 1991 [37]. We use the isospin-dependent quantum molecular dynamics (IQMD) model, whose relevant research was developed earlier [38], and the statistical decay model GEMINI++ to simulate the reaction process.
-
In the IQMD model, a single nucleon is represented by a Gaussian wave packet in the coordinate and momentum spaces. The N-body system can be described by the wave function
$ \phi _{i} ({\boldsymbol r},{\boldsymbol t} )= \frac{1}{(2\pi {L})^{3/4}} {\rm e}^{-\frac{[{{r}}-{{r}}_{i}({t} ) ]^2}{4L} }{\rm e}^{\frac{{{\rm i}}{{r}}\cdot {{p}}_{i}({t} ) }{\hbar } }, $

(1) where
$ r_{i} $ and$ p_{i} $ represent the average position and momentum of the ith nucleon, respectively, and the parameter L is related to the Gaussian wave packet for each nucleon. The phase space density can be obtained by the Wigner transformation, which is given as follows:$ {f} ({\boldsymbol r},{\boldsymbol p},{t}) = \sum\limits_{{i=1}}^{{N}} \frac{1}{{(\pi \hbar )}^3}{\rm e}^{-\frac{[{{r}}-{{r}}_{i}({t} ) ]^2}{2L} }{\rm e}^{-\frac{[{{p}}-{{p}}_{i}(t)]^2 \cdot 2{L} }{\hbar ^2} }. $

(2) The time evolutions of the coordinates and momenta of nucleons are determined by the Hamiltonian equations of motion, followed by the binary nucleon-nucleon collisions in each time step:
$ \dot{{\boldsymbol {r}}}_{i} = \nabla _{{p}_i }{H}, \dot{{\rm{{\boldsymbol{p}}}}}_i = -\nabla _{{r}_i}{H}. $

(3) The physics inputs in the time evolutions are the mean field and the differential cross sections of the nucleon-nucleon collisions. The Hamiltonian is composed of the kinetic energy, nuclear interaction, and Coulomb interaction. The nuclear potential energy of the asymmetric nuclear matter with density ρ and asymmentry δ is written as
$ \begin{aligned} V(\rho, \delta) = \frac{\alpha}{2} \frac{\rho^2}{\rho_0} + \frac{\beta}{\gamma+1} \frac{\rho^{\gamma+1}}{\rho_0^{\gamma}} + \frac{C_{{\rm sp}}}{2}\left(\frac{\rho}{\rho_{0}}\right)^{\gamma_{i}} \rho \delta ^{2}, \end{aligned} $

(4) where
$ \rho_0 $ is the normal density. The parameters α, β, γ,$ C_{{\rm sp}} $ and$ \gamma_{i} $ are independent of temperature. In Eq. (4), the first and second terms are relevant to the two-body and three-body interactions, which are commonly used in the transport models. The form of the symmetry potential is presented in the third term in Eq. (4). In this paper, the values of these parameters are α = –356.00 MeV, β = 303.00 MeV, γ = 7/6,$C_{{\rm sp}}$ = 38.06 MeV, and$ \gamma_i $ = 0.75. The process of nucleon-nucleon collisions applied to describe the effect of the short-range repulsive residual interaction and the stochastic change in the phase-space distribution is also contained in the IQMD model. The differential cross sections of nucleon-nucleon collisions can be given by$ \left(\frac{{\rm{d}} \sigma }{{\rm{d}} \Omega }\right)_{i} = \sigma _{i}^{{\rm free}} f_{i}^ {{\rm angl}} {f}_{i} ^{{\rm med}}, $

(5) where
$\sigma^{{\rm free}}$ ,$f^{{\rm angl}}$ , and${f}^{{\rm med}}$ represent the cross section of the nucleon-nucleon collisions in space, the angular distribution, and the in-medium corrections, respectively. The channels of the nucleon-nucleon collisions can be distinguished by the subscript$ {i} $ , including elastic proton-proton scattering ($ pp $ ), elastic neutron-proton scattering ($ np $ ), elastic neutron-neutron scattering ($ nn $ ), and inelastic nucleon-nucleon collisions ($ in $ ). The parametrization is isospin-dependent of$\sigma^{{\rm free}}$ and$f^{{\rm angl}}$ . The in-medium factor of elastic scattering is given by$ \begin{aligned}[b] f_{{\rm el}}^ {{\rm med}} =&\sigma _{\it{{\rm 0}}}/\sigma^{{\rm free}}\tan h(\sigma^{{\rm free}}/\sigma _{\it{{\rm 0}}}), \\ \sigma _{\it{{\rm 0}}}=&0.85\rho ^{-2/3}. \end{aligned} $

(6) The density dependence can be obtained from Eq. (6). Because
$\sigma^{{\rm free}}$ is related to the energy and isospin, the in-medium factor is also dependent on the energy and isospin. Moreover, owing to the weak effect of the in-medium modified cross sections for fragment observables, the in-medium correction of the inelastic NN collisions is neglected in the following work.In order to compensate for the fermionic feature, Pauli blocking and the method of the phase-space density constraint (PSDC) are considered in the IQMD model. On the basis of the PSDC, the space occupation probability
$ \overline{{f}_i} $ is calculated by integrating a hypercube of volume$ {h}^3 $ in the phase space around the$ {i} $ th nucleon at each time step. At each time step, the space occupation probability is judged by an adjustable value$ k_{{\rm fcon}} $ . If the phase-space occupation$ \overline{{f}_i} $ has a value greater than$ k_{{\rm fcon}} $ , the momentum of the$ {i} $ th nucleon is changed randomly by many-body elastic scattering. When the value of$ {{f}_i} $ in the final state is less than$ k_{{\rm fcon}} $ , the result of NN collision is accepted. In the actual calculations,$ k_{{\rm fcon}} $ is chosen to be 1.1. -
In this study, the calculation is described by a two-step model, which is promoted by the IAEA benchmark including dynamical and statistical codes. The dynamical part takes the responsibility of describing the excitation stage of the nucleus. The evolution by IQMD will stop when the excitation energies of the heaviest pre-fragment are less than a specified parameter
$ E_{{\rm stop}} $ , and the GEMINI++ model will be switched on. The$ E_{{\rm stop}} $ = 3 MeV/nucleon is taken. GEMINI++ is applied to simulate the the de-excitation process of the hot fragments, which is developed by Charity et al. [39, 40]. A sequential binary-decay is used to simulate the de-excitation process of the compound nucleus. All possible binary-decay modes, including light-particle evaporation, symmetric fission, asymmetric fission, and gamma emission, are chosen randomly according to the widths of these modes. The process will continue until the state of the fragments is almost in the ground state. The details of GEMINI++ are given in Ref. [40]. -
In our previous work [28], it has been demonstrated that the IQMD-GEMINI++ model can reproduce the cross sections (3282 data points) of productions in the reactions 238U + 9Be, d, and p at 1 GeV/nucleon within 1.5 orders of magnitude. A comparison between the data and the calculations has been made in detail; see Ref. [28]. Here, we continue the discussion about the reliability of the model for the 238U + p reaction. For the nuclides near the β stable line, the IQMD-GEMINI++ model can reproduce the data well. However, discrepancies appear on the neutron- and proton-rich sides of the stability line. On the neutron-rich side, in the region of projectile-like products (Z = 70–90), the calculations overestimate the data, while in a large part on the neutron-rich side, the calculations underestimate the data in general. Overall, on the proton-rich side, the calculations of the IQMD-GEMINI++ model are larger than the data, except the nuclides with 90 < N < 100. In the extremely neutron-deficient region (around Z = 90 and N = 140), the IQMD-GEMINI++ model overestimates the cross sections by approximately 1 to 2 orders of magnitude. The isotopic cross sections in the 238U + d and 9Be reactions at 1 GeV/nucleon were also calculated and compared with the available data. For these two reactions, the general logarithmic difference distributions caused by the direct reaction and shell effect are similar to that for the 238U + p reaction. In Fig. 1, we make a comparison focusing on the cross sections of neutron-deficient nuclei around N = 126, for which only the data for the 238U + 9Be reactions are available. The (blue) squares and triangles show the calculations of the IQMD-GEMNI++ model for 238U + p and 238U + 9Be, respectively. The available experimental data for the 238U + 9Be reactions at 1 GeV/nucleon are also shown in Refs. [2, 27, 41–45]. The dashed lines divide the panels into two parts. The right part is for the isotopes that have been discovered, and the left part is for the undiscovered isotopes. The cross sections in the reaction are displayed as a function of the mass number A of the isotopic nucleus.
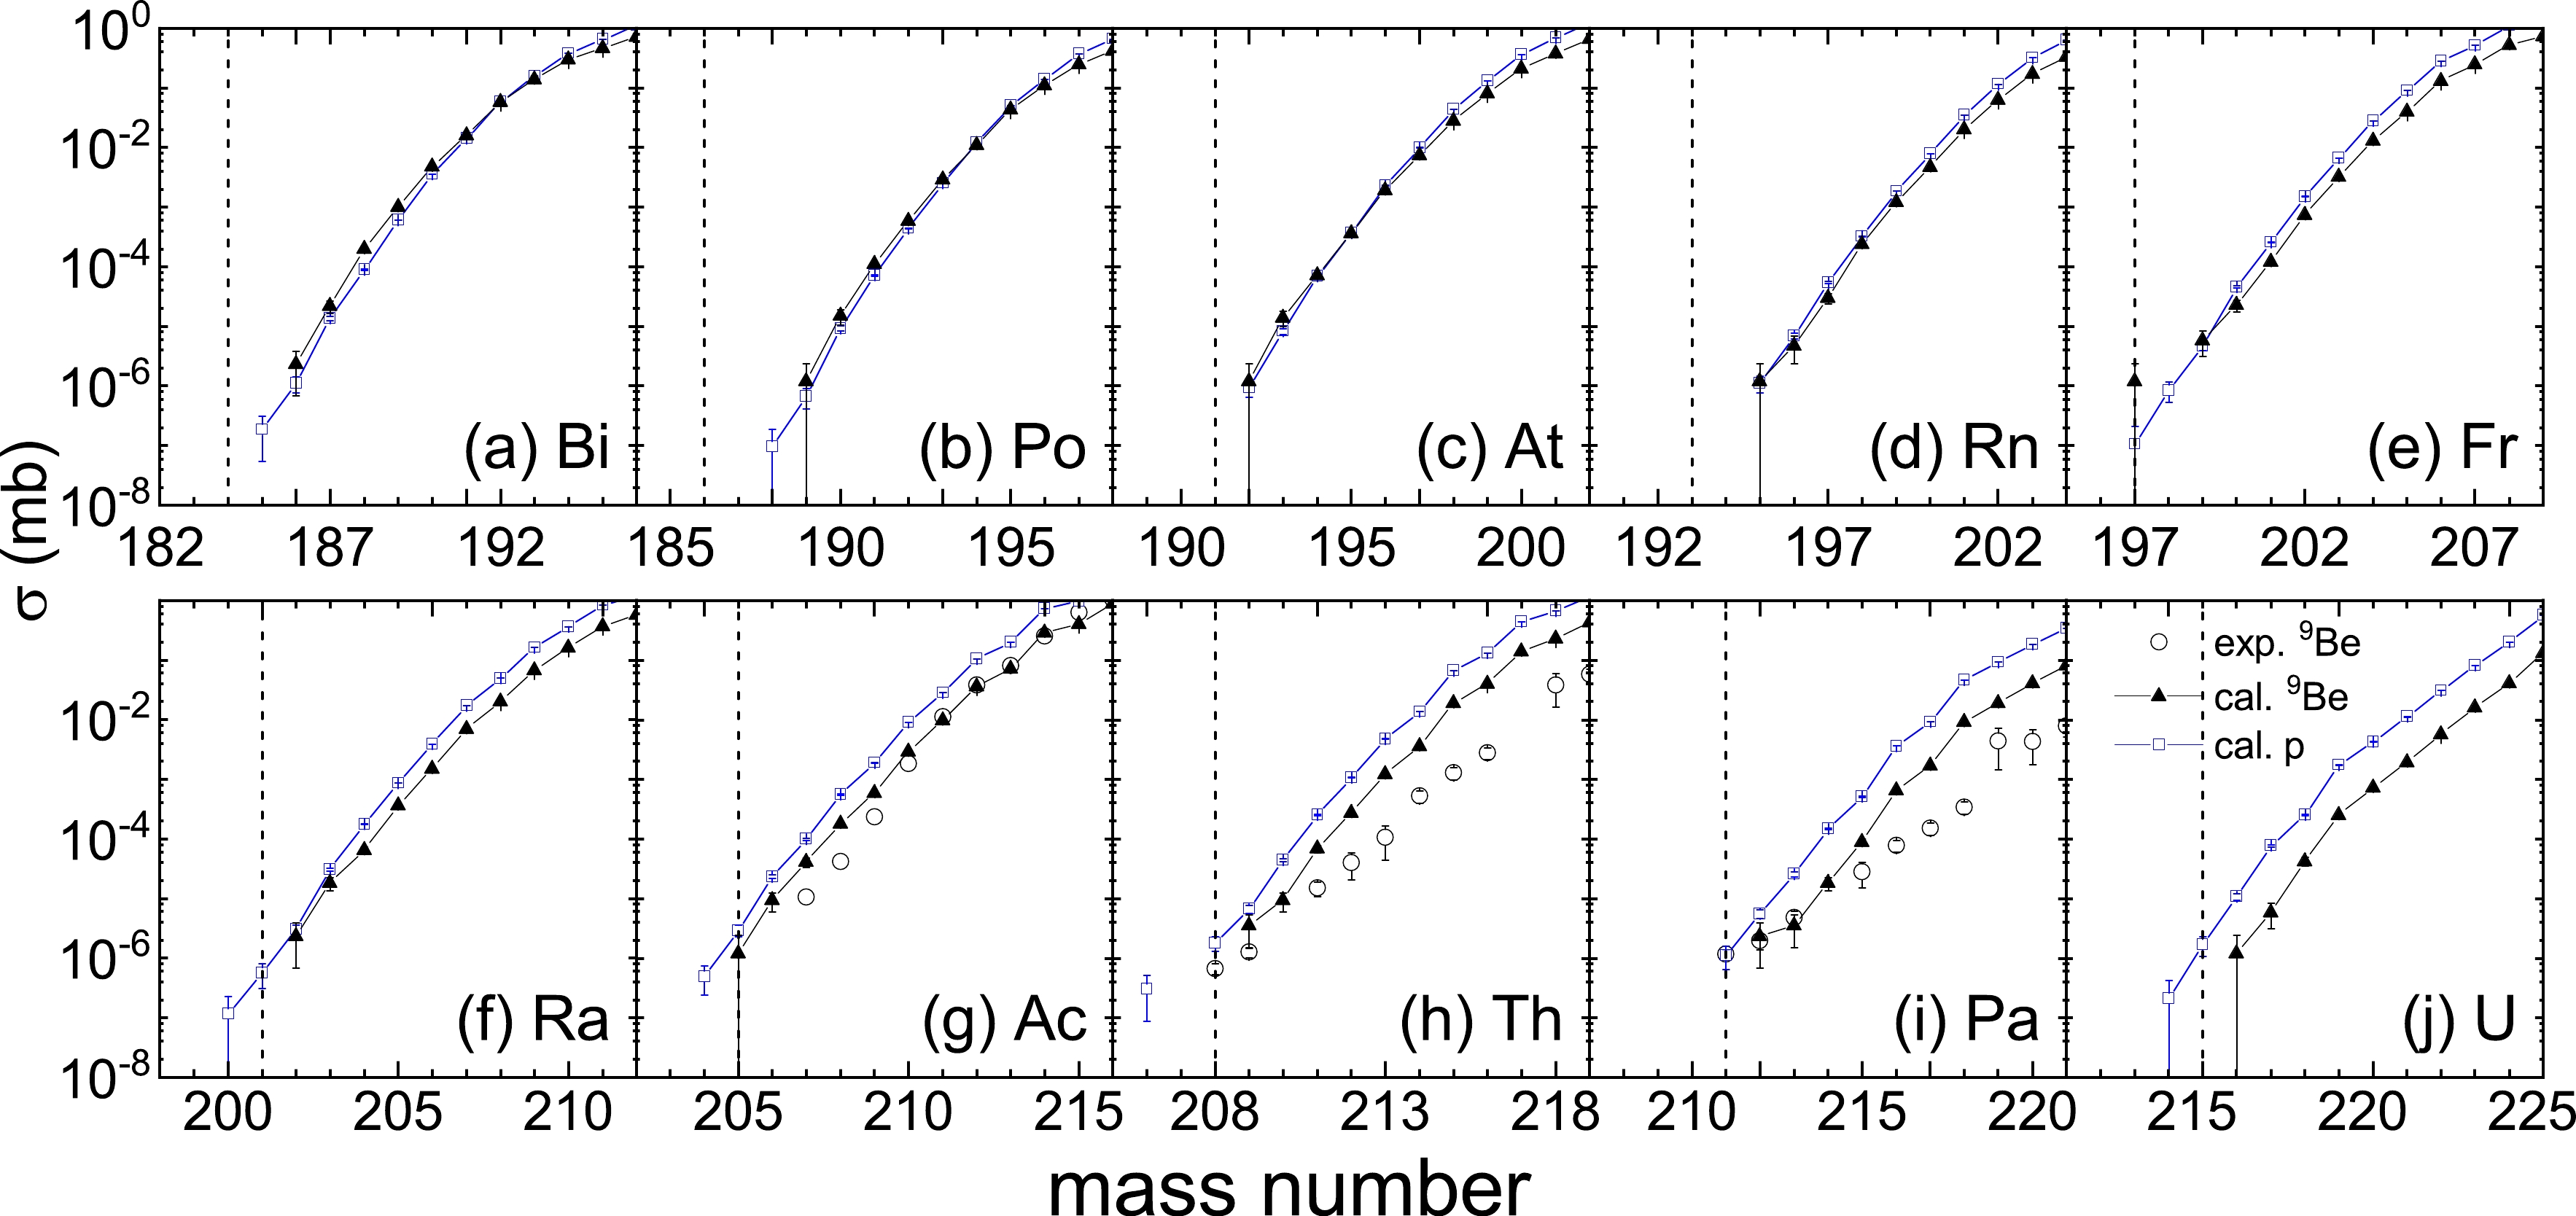
Figure 1. (color online) Cross sections as a function of the mass number of the neutron-deficient isotopes produced in spallation at 1 GeV/nucleon. The (blue) squares and triangles show the calculations of the IQMD-GEMNI++ model for 238U + p and 238U + 9Be, respectively. The open circles show the experimental data for 238U+9Be reactions taken from Refs. [2, 27, 41–45]. The dashed line divides the panels into two parts. The right part is for the isotopes that have been discovered, and the left part is for undiscovered isotopes.
It can be seen from the figure that the cross section shows a decreasing trend with decreasing mass number A. Compared with the available experimental data, the global agreement of the calculations of the IQMD-GEMINI++ model can be seen. The agreement of the IQMD-GEMINI++ model becomes worse for a large mass number. For example, the calculation for 209Th is 3.5×10⁻⁶ mb, which is close to the experimental data. However, for 214Th, the calculation is about 7 times larger than the experimental data. For the isotopes of Ac, the IQMD-GEMINI++ model has better performance for predicting the cross section than that for the isotopes of Th. The difference between the calculations and the experimental data for Ac in the 238U + 9Be reaction is tiny. The calculations are closer to the experimental data in the region near the undiscovered isotopes. Here, also taking Th as an example, for 212Th, the calculation is about 6.75 times larger than experimental data. However, for 209Th, it is only about 2.8 times. The calculation is consistent with the experimental data in terms of the change in trend. The law that the cross section increases monotonically with the mass number applies to both the experimental data and calculation. This phenomenon suggests that the IQMD-GEMINI++ model would be a valuable tool for predicting the cross sections.
Comparing the cross sections for two reactions, one can find the target dependence. The cross sections for the Ra, Ac, Th, Pa, and U isotope chains produced in the 238U + p reaction are larger than the corresponding values in the 238U + 9Be reaction within about 0.5 times. It is demonstrated that proton-induced spallation has a better performance than 9Be-induced spallation in producing neutron-deficient nuclei. Therefore, we take proton-induced spallation to produce undiscovered isotopes in this work. The undiscovered nuclei 200Ra, 204Ra, and 206Th can be produced in the 238U + p reaction at 1 GeV/nulceon with cross sections of 3.04±2.15, 5.0±2.57, and 1.15±1.15 × 10⁻⁷ mb, respectively.
In fact, a 238U beam at 1 GeV/nucleon bombarding a beryllium target has been applied to produce rare isotopes. Our calculations indicate that a 238U beam bombarding liquid hydrogen can produce rare neutron-deficient Ra, Ac, Th, and Pa with quite a large cross section. If we want to produce elements heavier than Pa, it is recommended to apply a beam heavier than 238U. However, owing to the limitations of existing technology, a beam heavier than 238U has not been reported, but a target material heavier than 238U can be obtained with current technology such as Cf, Bk, and Es. The mechanisms for the 238U + p and p + 238U reaction systems are equivalent. Furthermore, it is easier to obtain a beam with a sufficiently high intensity for protons than heavy nuclei. The proton-induced spallation of transuranium elements is studied in the following.
Figure 2 presents the cross sections of the neutron-deficient isotopes produced in the p + 252Cf reaction at 1 GeV/nucleon. The cross section is displayed as a function of the mass number of the production nucleus A. The solid circles represent discovered neutron-deficient nuclei. The open circles mean undiscovered nuclei. It is obvious that the cross sections become smaller as the mass number decreases. It is indicated that more neutron-deficient undiscovered nuclei are harder to produce. For example, the most neutron-deficient nucleus in the Np chain is 217Np, which is produced with a cross section of 3.5×10⁻⁷ mb. The cross sections of 218Np and 220Np are 7×10⁻⁷ mb and 2.1×10⁻⁶ mb, respectively. The minimum cross section for Pu is 7×10⁻⁷ mb. In the Am chain, the smallest cross section is 3.5×10⁻⁷ mb, and it is 1.4×10⁻⁷ mb in the Cm chain.
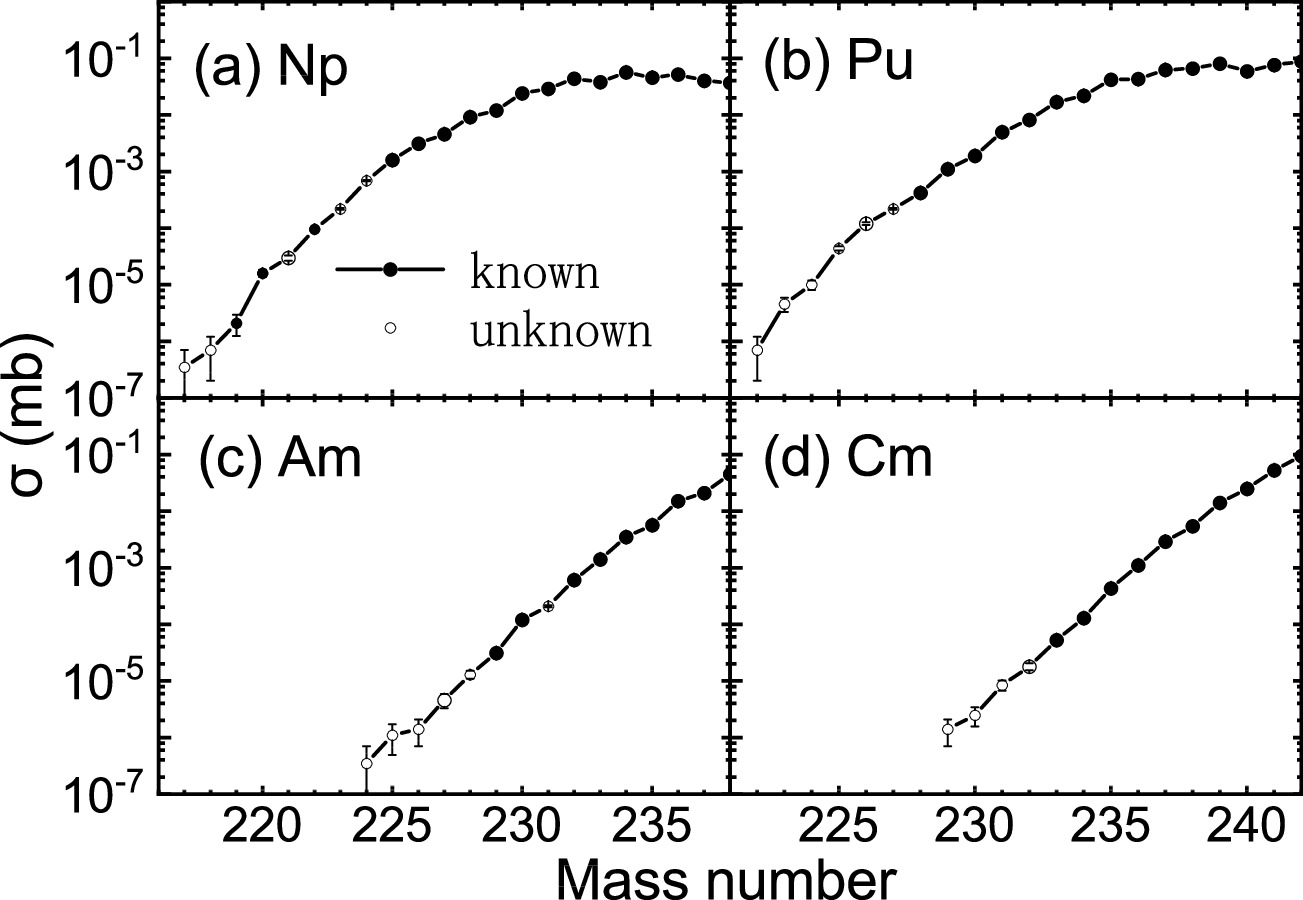
Figure 2. Cross sections of the neutron-deficient isotopes of Np, Pu, Am, and Cm produced in the p + 252Cf reaction at 1 GeV/nucleon plotted as a function of the mass number A. The calculations of the IQMD-GEMNI++ model are shown as circles. The solid circles represent discovered neutron-deficient nuclei. The open circles mean undiscover nuclei.
The cross sections of the rare isotopes produced in the proton-induced spallation of 237Np, 239Pu, 241Am, 244Cm, and 247Bk are also calculated by the IQMD-GEIMNI++ model; the results are shown in Fig. 3. We plot the cross sections of the undiscovered neutron-deficient nuclei as a function of the mass number for different reaction systems. It is worth noting that Pu and Am can also be produced in the p + 237Np reaction because of the effect of inelastic nucleon-nucleon collisions. It can be seen intuitively from the figure that the cross sections of most undiscovered isotopes of Np, Pu, and Am first rise and then fall as the atomic number of the target material increases. In the same reaction system, the cross section shows an upward trend as the mass number A of production increases. Compared to the other reaction system, the p + 243Cm reaction provides the largest cross section for 217Np, which is 2.5×10⁻⁶ mb. For 218Np and 221Np, the largest cross sections are 1.3×10⁻⁵ mb and 5×10⁻⁴ mb, respectively, for the p + 239Pu reaction. For 222Pu, the largest cross section is 1.8×10⁻⁵ mb, whereas it is 6.5×10⁻⁵ mb for 223Pu and 1.6×10⁻⁴ mb for 224Pu in the p + 241Am reaction. The largest cross section of 225Pu is 6.1×10⁻⁴ mb, while it is 0.002 mb for 226Pu and 0.0045 mb for 227Pu in the p + 239Pu reaction. It can be observed from the figure that the largest cross section of 224Am, 225Am is 2.5×10⁻⁶ mb in the p + 243Cm reaction and 7.3×10⁻⁶ mb in the p + 239Pu reaction. Further, it is 2.9×10⁻⁵ mb for 226Am and 8.5×10⁻⁵ mb for 227Am in the p + 241Am reaction. The calculations for those rare neutron-deficient isotopes are within the accuracy of existing detection technology [46]. Furthermore, by observing the calculations for the p + 238U reaction, we can notice that the cross section for undiscovered nuclei is smaller than 10−6 mb mostly. In the spallation of transuranic nuclei shown in Fig. 3, the cross sections of undiscovered nuclei are larger than those in the proton-induced spallation of 238U. It is indicated that the transuranic nuclei perform better in producing new isotopes. It is suggested that the proton-induced spallation of a transuranic target is a promising way to produce rare neutron-deficient isotopes near the N = 126 region.
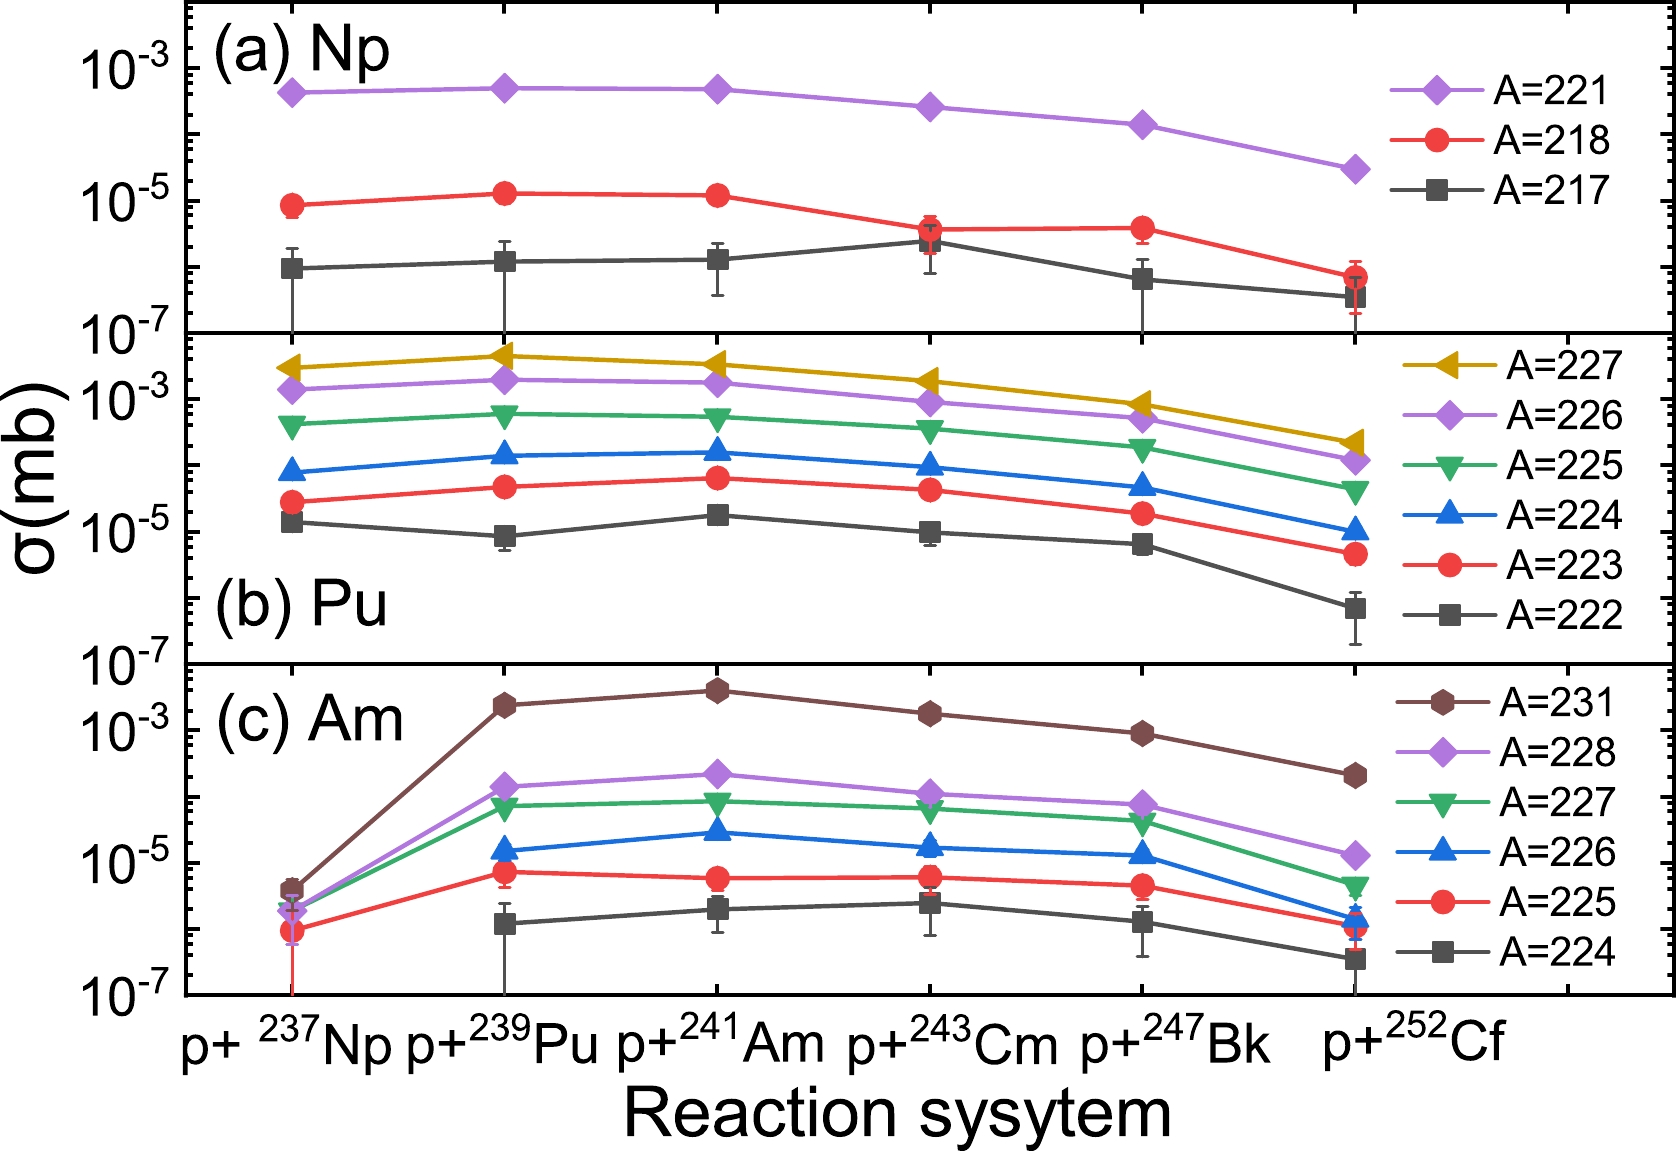
Figure 3. (color online) Cross sections of the neutron-deficient isotopes of Np, Pu, and Am for different proton-induced spallations at 1 GeV/nucleon. The solid lines in different colors represent the cross sections of different isotopes of certain nuclei produced in different reaction systems at 1 GeV/nucleon.
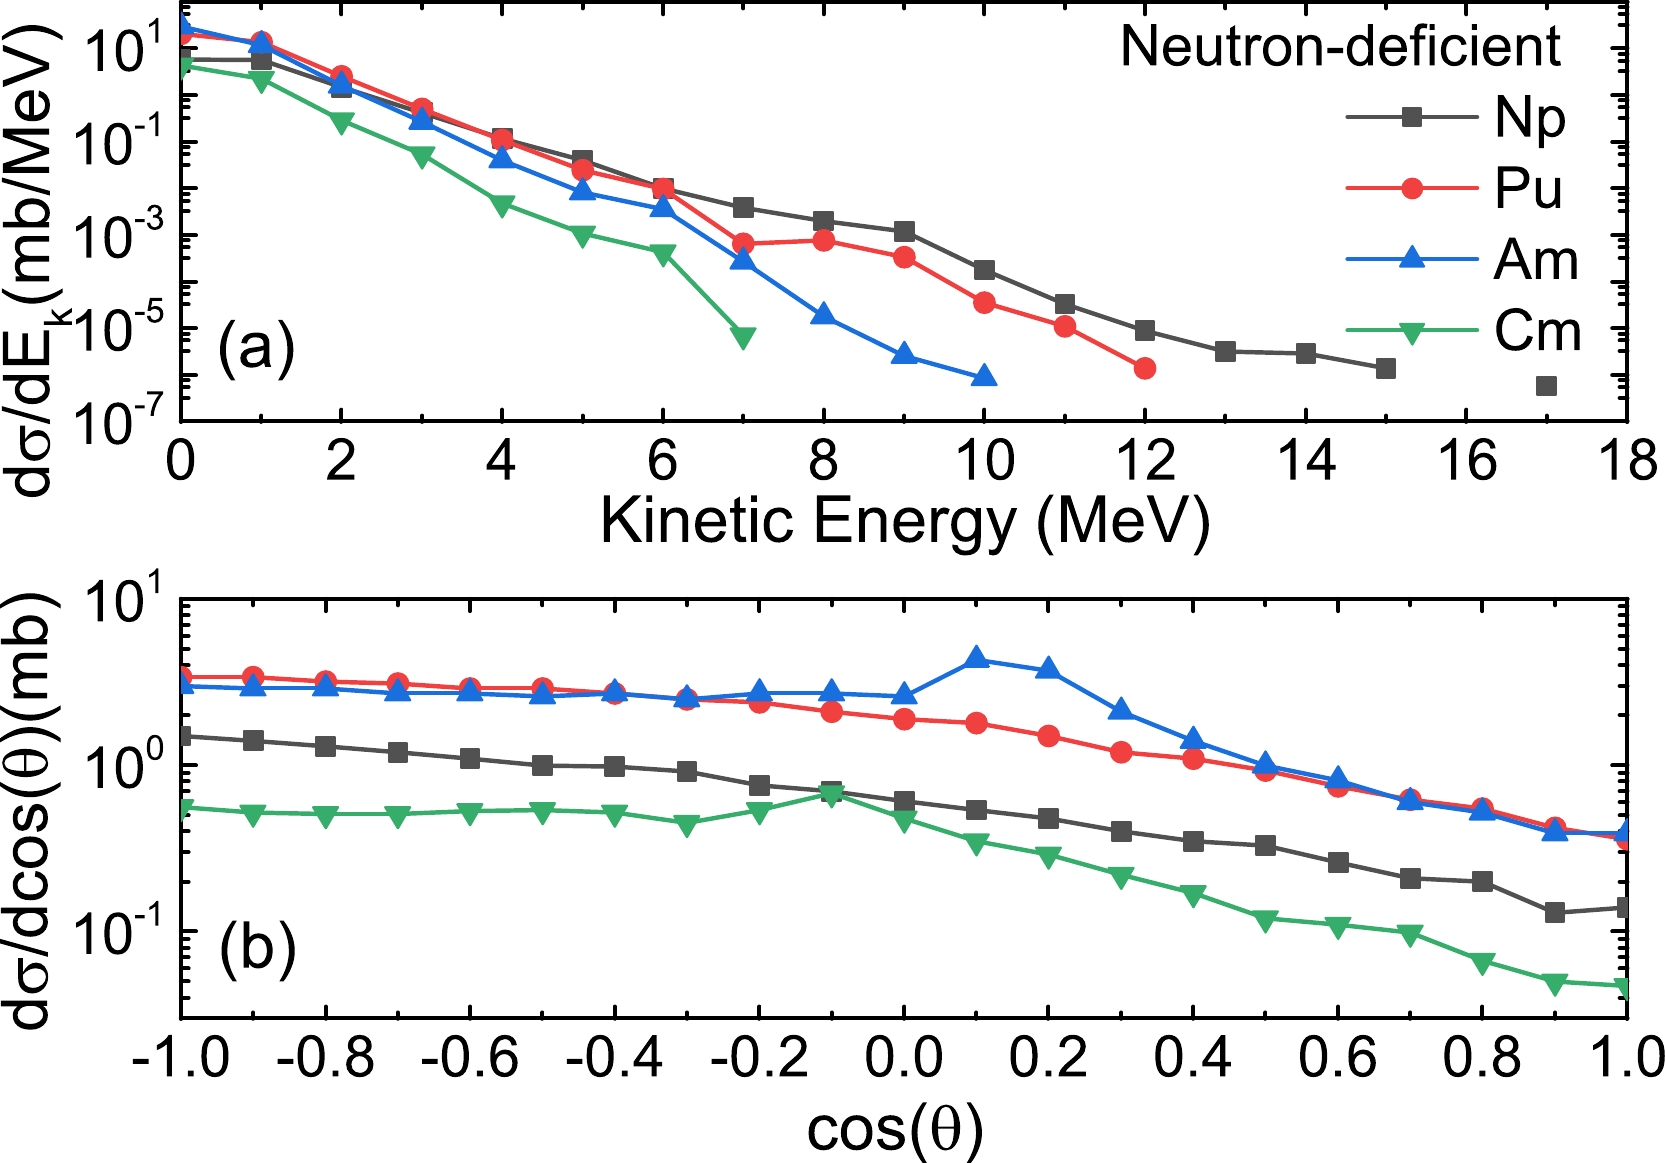
Besides the cross section, whether the production can pass through the target and be detected by the detector is also a factor that needs to be considered. In order to investigate the possibility for production passing through the target, we study the kinetic energy and angular distributions. The calculations for the p + 241Am reaction are taken as an example for analysis. Figures. 4(a) and (b) show the kinetic energy and angular distributions of the neutron-deficient isotopes of Np, Pu, Am, and Cm produced in the p + 241Am reaction, respectively. It can be seen from the figure that the cross sections of different productions show a downward trend as the kinetic energy increases. The largest energies of production are all less than 16 MeV. As shown in Fig. 4(b), the cross sections of different productions increase as the emission angle increases in general. It is indicated that the emission directions of the productions are at a backward angle mostly.
-
In fact, the target thickness must be considered to determine whether the productions can pass through the target and be detected by detectors. In order to make sure that a production can be detected, the thickness of the target should not be larger than the maximum range of the production. Therefore, the range of the production in the target is vital. The range of heavy ions in matter can be calculated by
$ R=\int_{\it{0}}^{E_{\it{0}} } \frac{{\rm{{\rm d}}}E }{-({\rm d}E/{\rm d}x)}, $

(7) where
$ E_{0} $ is the initial kinetic energy of a heavy ion and$ (-{\rm d}E/{\rm d}x) $ is the stopping power the matter to a heavy ion. According to Eq. (7), it is noted that the range is the integral of the reciprocal of the kinetic energy with respect to the kinetic energy. The kinetic energy distributions of Np, Pu, Am, and Cm are shown in Fig. 4(a). Therefore, we need to obtain a relationship between the energy loss and the kinetic energy.According to the energy distributions of Np, Pu, Am, and Cm, the energy per atomic unit corresponding to them is less than 0.2 MeV/nuclon. In this energy region, the stopping power is well represented by the parameter dE/dx, which is given as [47, 48]
$ \begin{aligned}[b] -{\left(\frac{{\rm{d}} E}{{\rm{d}} x}\right)_h} =&\gamma ^{2} \left [ -\left ( \frac{{\rm{d}} E}{{\rm{d}} x} \right ) \right ] _p \\& -\left(\frac{{\rm{d}} E}{{\rm{d}} x}\right)_p =z^{1/4}8\pi {\rm e}^{2} Na_{0} \frac{z\cdot Z}{(z^{\frac{2}{3} } +Z^{\frac{2}{3}})^{\frac{3}{2} }}\cdot \frac{v}{v_{0} }\\ \gamma =&1-1.034 {\rm exp}\left [ -\left ( \frac{v}{v_{0} } \right ) z^{-0.688} \right ], \end{aligned} $

(8) where z and Z represent the atomic numbers of a heavy ion and matter, respectively. N is the atomic density of matter, and v is the velocity of a heavy ion in cm/s. Here,
$ v_{0} $ and$ a_{0} $ represent the Bohr velocity and Bohr radius, respectively, and γ is the effective charge ratio of the production. The velocity-related terms in the formula can be converted into energy-related functional expressions used in our following calculations, written as$ f\left ( E \right ) =\frac{v_{0} }{v} =\sqrt{\frac{2E_{m} }{0.0496} }, $

(9) where
$ E_{m} $ represents the energy per atomic unit. Through this work, we have proposed Eqs. (8) and (9) to evaluate the stopping power for a heavy ion in matter at a low energy. First, we calculate the reduced stopping power of Np and Cm in aluminum based on the data of H and Fm. Then, we extended our study by fitting different target combinations. We choose Am as the target material here.We present the reduced stopping power of H, Np, and Fm in an aluminum target in Fig. 5(a). The relevant data of H and Fm are taken from a textbook. Based on Eq. (8) and the relevant data of H and Fm, the energy loss of Np can be obtained. As shown in Fig. 5, for certain nuclei, as the energy increases, the energy losses of H, Np, and Fm become larger in the energy region lower than 0.2 MeV/nucleon. Because of the close atomic numbers of Np and Fm, their reduced stopping powers are of the same order of magnitude. At the same energy, the reduced stopping power shows a decreasing trend as the atomic number of the isotope increases. The case for Np in an Am target is similar, as shown in Fig. 5(b). The reduced stopping power of Np is directly proportional to the energy.
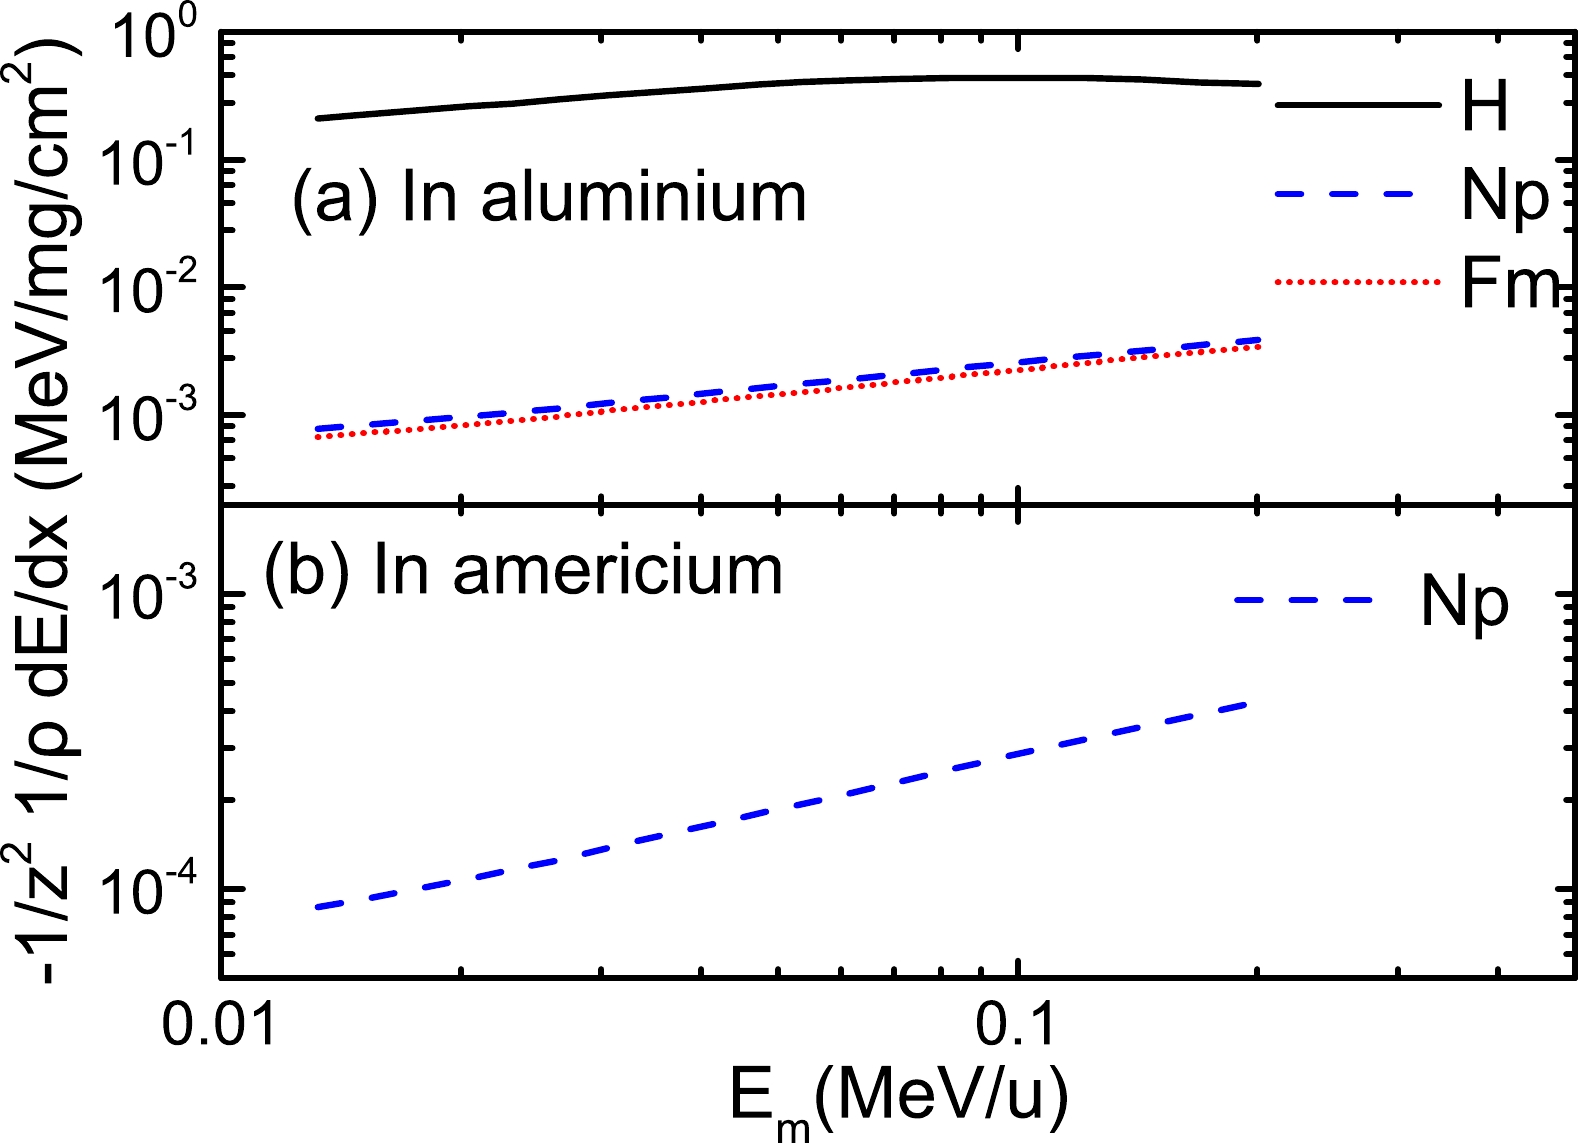
Figure 5. (color online) Reduced stopping powers of H, Np, and Fm in aluminum and americium displayed as a function of energy. The solid, dashed, and dotted lines represent H, Np, and Fm, respectively.
In Fig. 6, we show the ranges of Np, Pu, and Am in americium as a function of energy. It is found that the ranges are similar and increase with increasing energy. The ranges are on an order of magnitude of 10-7 to 10-8 cm. Such a thin target has difficulty enduring irradiation from high-energy beams directly. We also calculate the ranges of Np, Pu, and Am in an americium target using the lise++ toolkit, as shown in Fig. 6. It can clearly be seen from the figure that the results calculated by lise++ are 1–2 orders of magnitude larger than that obtained by Eq. (7). This may be caused by the application of lise++ to calculate the reactions in the high-energy region. There are some discrepancies in the calculations for the low-energy region reactions.
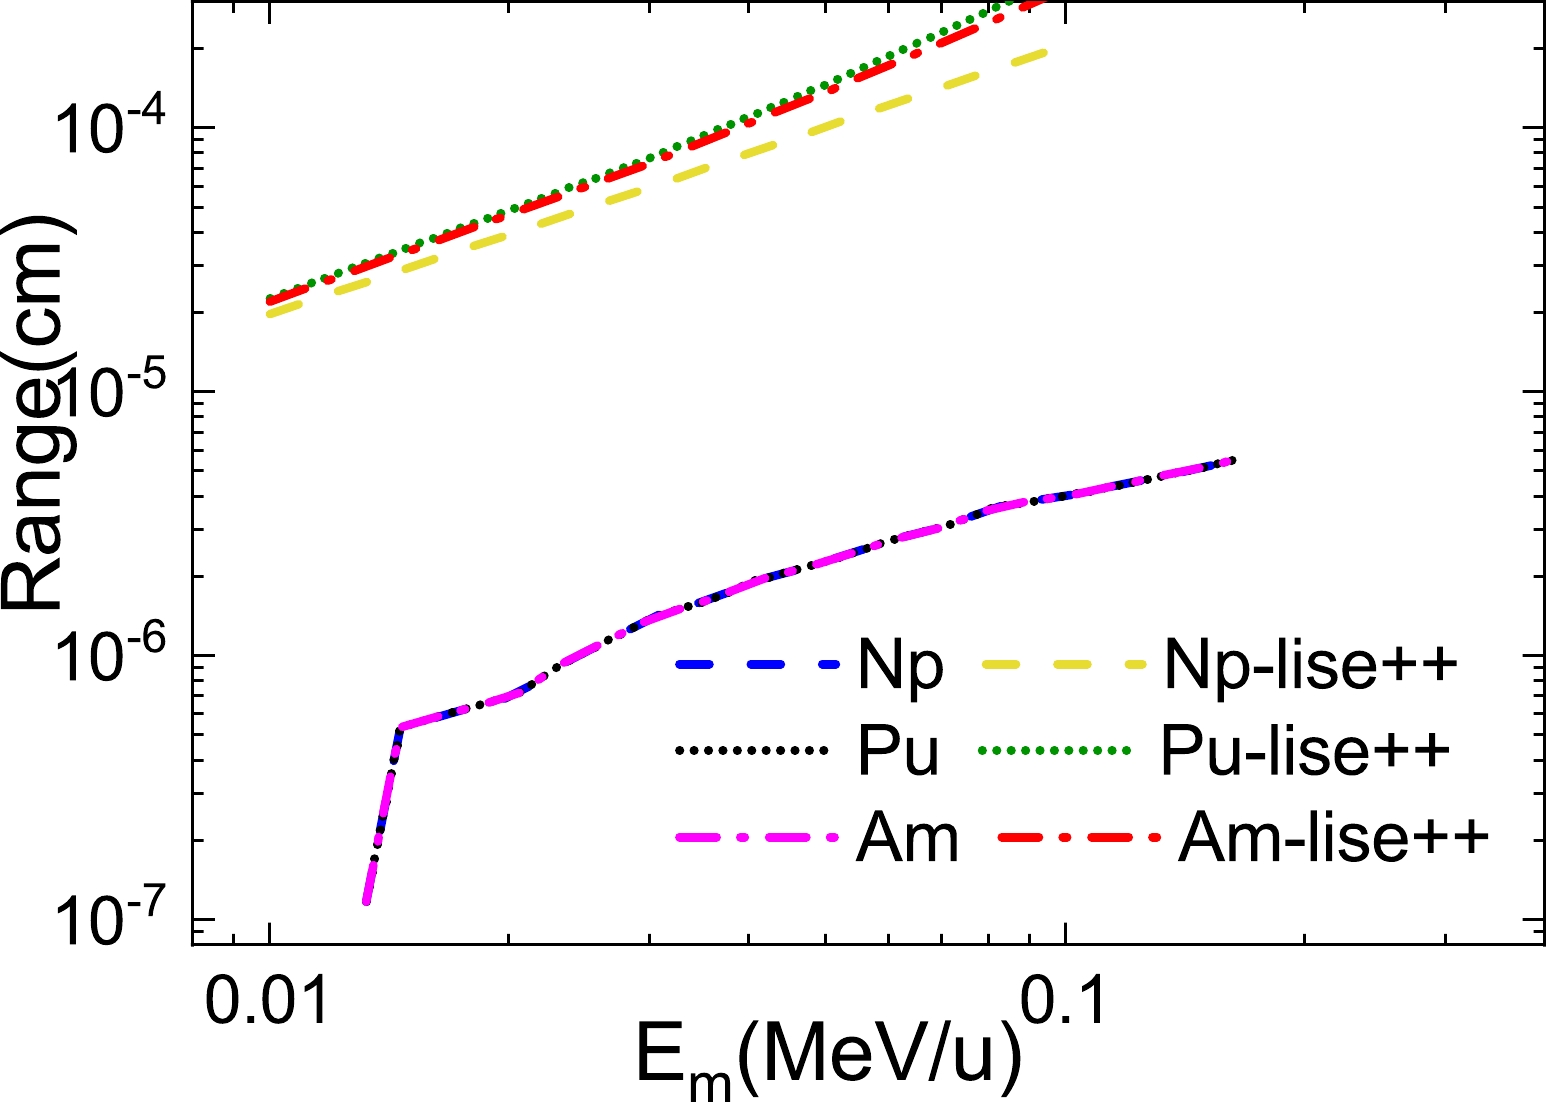
Figure 6. (color online) Ranges of Np, Pu, and Am in americium shown as a function of energy. The blue and yellow dashed curves are for the calculations for Np ions by Eq. (7) and lise++, respectively. The black and green dotted curves are the cases of Pu ions calculated by Eq. (7) and lise++, respectively. The pink and red dot-dash curves are the cases of Am ions calculated by Eq. (7) and lise++, respectively.
Considering the limitations of existing technology, the actinides or their oxides cannot be made into targets independently but are electroplated onto a base such as an aluminum sheet. As can be seen from Fig. 4(b), the emission angles of the productions are backward mostly. Thus, the actinides electroplated on aluminum sheets are placed toward the proton beam, and the proton beam can react with the actinide target first and then penetrate the aluminum sheets. In such a device arrangement, the generated neutron-deficient nuclei in the forward direction are stopped by the aluminum sheets, but those in the backward direction may be measured. The yield of the productions is taken into consideration:
$ {Y} =I\sigma N_{s}, $

(10) where I the is intensity of the incident beam, σ refers to the production cross-section, and
$ N_{s} $ is the surface density of the target. Taking the proton beam intensity$ I_{e} $ = 120 μA provided by TRIUMF as an example, the yields of the neutron-deficient nuclei produced in an 241Am target irradiated by a proton beam at 1 GeV/nucleon are estimated. On the TRIUMF accelerator, a proton beam at 1 GeV/nucleon bombards the target material with the following beam intensity:$ {I} =\frac{I_{e} }{N_{e}e } =\frac{120\times10^{-6} }{1\times1.6\times10^{-19} } =7.5\times10^{14} {\rm s}^{-1}. $

(11) As mentioned above, the ranges of Np, Pu, and Am are all on an order of magnitude from 10−7 to 10−5 cm. We take the minimum range of 10−7 cm for the calculation to obtain the minimum yield. The yields of the neutron-deficient isotopes of Np, Pu, and Am for 1 s irradiated by a proton beam at 1 GeV/nucleon at a 4π stereoscopic angle are listed in Table 1. It is shown that the yields are considerable. Some of the neutron-deficient isotopes can be produced with yields larger than 1 per second.
Isotope Reaction σ/nb Yield/ ${\rm s}^{-1}$ 

$\rm ^{217}{\rm{Np}} $ 

p+ $\rm ^{244}{\rm{Cm}} $ 

2.5 0.0055 $ ^{218}{\rm{Np}} $ 

p+ $ ^{239}{\rm{Pu}} $ 

13 0.028 $ ^{221}{\rm{Np}} $ 

p+ $ ^{239}{\rm{Pu}} $ 

500 1.10 $ ^{222}{\rm{Pu}} $ 

p+ $ ^{241}{\rm{Am}} $ 

18 0.039 $ ^{223}{\rm{Pu}}$ 

p+ $ ^{241}{\rm{Am}}$ 

65 0.14 $ ^{224}{\rm{Pu}} $ 

p+ $^{241}{\rm{Am}} $ 

160 0.35 $ ^{225}{\rm{Pu}} $ 

p+ $ ^{239}{\rm{Pu}} $ 

610 1.34 $^{226}{\rm{Pu}}$ 

p+ $^{239}{\rm{Pu}}$ 

2000 4.38 $ ^{227}{\rm{Pu}} $ 

p+ $ ^{239}{\rm{Pu}} $ 

4500 9.86 $ ^{224}{\rm{Am}} $ 

p+ $ ^{244}{\rm{Cm}} $ 

2.5 0.0055 $ ^{225}{\rm{Am}} $ 

p+ $ ^{239}{\rm{Pu}} $ 

7.3 0.016 $ ^{226}{\rm{Am}} $ 

p+ $ ^{241}{\rm{Am}} $ 

29 0.064 $ ^{227}{\rm{Am}} $ 

p+ $ ^{241}{\rm{Am}} $ 

85 0.19 $ ^{228}{\rm{Am}} $ 

p+ $ ^{241}{\rm{Am}} $ 

220 0.48 $ ^{231}{\rm{Am}}$ 

p+ $ ^{241}{\rm{Am}}$ 

4000 8.76 Table 1. Yields of rare neutron-deficient isotopes in the Np, Pu, and Am chains produced in the proton-induced spallation at 1 GeV/nucleon at a 4π stereoscopic angle. The proton beam intensity
$ I_{e} $ = 120 μA is applied in the calculations. -
In summary, the proton-induced spallations of transuranium elements are investigated by the IQMD-GEMINI++ model. The cross sections of Bi, Po, At, Rn, Fr, Ra, Ac, Th, Pa, and U isotope chains produced in the 238U + p and 9Be reactions at 1 GeV/nucleon are calculated and compared with the experimental data. It is shown that the IQMD-GEMINI++ model can provide great predictions of the cross sections of isotopes in spallation reactions. Especially, for undiscovered nuclei in the region close to N = 126, there is agreement with the experimental data within one order of magnitude. For the same isotope, the cross section in the 238U + p reaction is larger than that in the 238U + 9Be reaction. It is demonstrated that a proton as the target has better performance than 9Be in producing neutron-deficient nuclei. The undiscovered neutron-deficient nuclei of Ra, Ac, and Th are produced in the 238U + p reaction. The cross section of 200Ra is 1.48×10⁻⁷ mb. For 204Ac and 206Th, the cross sections are 5.6×10⁻⁷ and 2.8×10⁻⁷ mb, respectively.
We also simulate the proton-induced spallation of transuranium elements. These reactions can produce the undiscovered neutron-deficient nuclei of Np, Pu, Am, and Cm effectively. The production cross section ranges from 10-7 to 10-3 mb. It is within the accuracy of existing detectors. Taking the p + 241Am reaction as an example, the kinetic energy and emission angle distributions of Np, Pu, Am, and Cm are investigated. The kinetic energies of the productions are all less than 16 MeV, and the emission direction of the production is at a backward angle mostly. The range of the production in the 241Am target can be calculated according to LSS theory. The range of isotopes is from 10-7 to 10-5 cm, which is the effective target thickness for online identification of undiscovered isotopes. Finally, based on the thickness of the target and an intensity of 120 μA for a proton beam at 1 GeV/nucleon, the yields of undiscovered neutron-deficient isotopes are calculated. Productions of undiscovered isotopes by the proton-induced spallation of transuranic nuclei are feasible. However, the current technology for online identification of neutron-deficient nuclei produced in spallation needs to be developed.
-
The authors are grateful to Zhong Liu for helpful and detailed discussions.
Production of neutron-deficient nuclei around N = 126 by proton-induced spallation
- Received Date: 2022-08-15
- Available Online: 2023-01-15
Abstract: Many isotopes of Np, Pu, Am, and Cm around the N = 126 shell still have not been produced in the laboratory. This study aims to investigate the cross sections and yields of the neutron-deficient nuclei of Np, Pu, Am, and Cm produced in the proton-induced spallations of transuranium elements. The isospin-dependent quantum molecular dynamics (IQMD) model is applied to study the dynamical process of reaction, and the subsequent decay process is simulated by the GEMINI++ model. The IQMD-GEMINI++ model is applied to calculate the cross section, kinetic energy, and angular distribution of the isotopic productions around N = 126. The Lindhand, Scharff, and Schiott theory is applied to calculate the energy loss of different heavy nuclei in the target material. A comparison between the data and the calculations shows that the IQMD-GEMINI++ model can reproduce the production cross sections of the neutron-deficient nuclei in spallation within approximately 1.5 orders of magnitude. The maximum cross section of the undiscovered isotopes of Np, Pu, Am, and Cm is about 10−5 mb, while the kinetic energies of the productions are all less than 16 MeV. The angular distribution shows that the emission direction of production is mostly at a backward angle. The range of production in the target is within the range of 10−7 to 10−5 cm. This range is the effective target thickness for the online identification of undiscovered isotopes. Based on the effective thickness of the target and assuming an intensity of 120 μA for the proton beam, the yields of the undiscovered neutron-deficient nuclei are calculated. Productions of the undiscovered isotopes of Np, Pu, Am, and Cm by the proton-induced spallations of transuranium elements are feasible. However, experimental techniques for online identification of neutron-deficient nuclei produced in proton-induced spallation should be developed.


 Abstract
 HTML
HTML Reference
 Related
 PDF
PDF




 DownLoad: