


 Abstract
 HTML
HTML Reference
 Related
 PDF
PDF


-
Dark matter is one of the top mysteries in modern physics [1]. Weakly interacting massive particle (WIMP) is a promising candidate and predicted by many new physics models beyond the standard model, such as super-symmetric theories. Searches for WIMPs have been performed using various experimental approaches for decades [2, 3]. The PandaX experiment, located in the China Jinping Underground Laboratory (CJPL) [4–6], uses liquid xenon as the target to search for the scattering of WIMPs with xenon nuclei [7–10]. Recently, the multi-ton scale stage of the PandaX experiment, PandaX-4T, completed its commissioning run and released its first physics results [11], providing world-leading constraints on WIMP-nucleon spin-independent scattering cross sections for WIMP masses above 10 GeV/
$ {\rm c}^2 $ .The PandaX-4T detector is a cylindrical dual-phase xenon time projection chamber (TPC). It is sequentially enveloped in an inner cryogenic pressure vessel and outer pressure vessel, both composed of stainless steel (SS). The outer pressure vessel is immersed in an ultrapure water shielding tank. Two arrays of three-inch photomultiplier tubes (R11410 PMTs) are mounted on the top and bottom of the TPC. Four electrodes (an anode, gate, cathode, and bottom screen) are placed in the TPC to provide electric fields. The anode and bottom screen electrodes are grounded, and the gate and cathode electrodes are loaded with different negative high voltages. The TPC is surrounded by polytetrafluoroethylene (PTFE) panels for higher collection efficiencies, which divide the detector into several regions along with the four electrodes. Outside of the PTFE panels is the veto region for multi-scattering background rejection, where one-inch PMTs are installed [12]. The sensitive volume is confined within the PTFE panels and the gate and cathode electrodes, containing 3.7 tonnes of liquid xenon. The compartment between the cathode and bottom screen electrodes is the below-cathode region. An incident particle can generate a prompt scintillation signal
$ S 1 $ and delayed electroluminescence signal$ S 2 $ in the TPC, which are collected to reconstruct the event position and deposited energy [11].A robust evaluation of the neutron background contribution is crucial in dark matter searches. A WIMP particle is expected to elastically scatter off a xenon nucleus, which releases a single scattering nuclear recoil (SSNR) signal. However, neutrons, generated from the detector materials via an (α, n) or spontaneous fission (SF) reaction [13, 14], can also produce NR signals, mimicking WIMP particles. Based on the measured radioactivities of all the detector components, a Monte Carlo (MC) simulation can predict the neutron yields and their energy deposits in liquid xenon. However, this method relies on the accuracy of radioactivity measurement and the single scattering reconstruction algorithm in the TPC. In contrast with WIMPs, neutrons have a probability of scattering multiple times and finally getting captured by xenon nuclei. If a neutron is captured, the xenon nuclei would produce high energy gamma (HEG) rays through de-excitation. With these features, multiple scattering nuclear recoil (MSNR) events and HEG events in the data can be used to estimate the amount of neutron-induced SSNR contribution.
The aim of this paper is to describe the process of neutron-induced SSNR background evaluation in the PandaX-4T experiment. The rest of this paper is organized as follows. In Sec. II, NR calibration sources and detector response are introduced. In Sec. III, MC simulation processing and an SSNR background evaluation from the simulation are presented. The details of the two data-driven methods are introduced in Sec. IV, followed by a summary in Sec. V.
-
The detector response to neutron-induced NR events is modeled and validated through neutron calibration data. During the commissioning run of PandaX-4T, 241Am-Be (AmBe) and deuteron-deuteron (DD) neutron sources were deployed outside the TPC to generate NR events.
The AmBe source is a widely used NR calibration source in dark matter direct detection experiments. α particles are emitted from 241Am and captured by 9Be, consequently generating neutrons.
$ ^{9}{\rm{Be}}+\alpha \to {n}+^{12}{\rm{C}}^*\,. $

This is known as the (α, n) reaction [14, 15]. The final product 12C primarily lies in the ground state or first excited state. The latter case can emit a 4.4 MeV gamma ray. PandaX-4T calibration uses the same AmBe source as PandaX-II [16, 17]. The source is movable inside the calibration polyethylene tubes between the outer vessel and inner cryogenic vessel [18, 19] and is placed at certain positions during calibration data taking. The commissioning data were divided into five data sets according to different conditions [11]. Throughout the commissioning, two periods of AmBe calibration were performed, one between data sets 3 and 4, the other at the end of data set 5, accumulating a total calibration time of 174.2 h [11].
Monoenergetic neutrons can be generated from DD nuclear collisions,
$ {\rm{D}} + {\rm{D}} \to \; ^{3}{\rm{He}} + {n}\,. $

The kinetic energy of the product neutron depends on the deuteron energy and emission angle [20–22]. In the PandaX-4T experiment, the DD generator is placed near the outer surface of the ultrapure water shielding tank, where a SS pipeline is welded. The generated neutrons are guided by the pipeline and point to the center of the PandaX-4T detector. Two sets of DD NR calibration data are collected after data set 5, one with 2.2 MeV and the other with 2.45 MeV of neutron energy. These two conditions correspond to π and π/2 neutron emission angles. In total, the DD calibration live time is 86.0 h.
From NR calibration data, SSNR events with only one good pair of
$ S 1 $ and$ S 2 $ are selected to develop the fiducial volume (FV) cut, veto cut, several quality cuts, and the corresponding efficiencies, as described in Ref. [11]. These cuts and efficiencies are also necessary for SSNR background evaluation. The electron-equivalent energy E (unit keVee) is reconstructed from q$ S 1 $ (the charge of the$ S 1 $ signal in the unit of photoelectron, PE) and qS2b (the scintillation in$ S 2 $ collected by the bottom PMTs in the unit of PE). The same detector parameters in Ref. [11], i.e., the photon detection efficiency (PDE), electron extraction efficiency (EEE), and single electron gain (SEGb), are adopted. In total, 2721 AmBe SSNR events and 2606 DD SSNR events are selected in the energy range [0, 20] keVee. Based on these SSNR events and simulation, the signal response model is constructed and agrees with data within uncertainties [11].In addition, the MSNR and neutron-capture events in the calibration data provide validation of the simulation, which will be described later.
-
The MC method can simulate the decay of radioactive isotopes in detector materials and the consequent energy deposit in liquid xenon from the decay products, including neutrons and gamma, beta, and alpha particles [12, 23]. The radioactivities of the main materials, including SS, PTFE, PMTs, and readout bases, are measured using a high-purity germanium detector and are shown in Table 1. There are several differences compared with those in Ref. [12], which results from the update of the radioactivity according to real materials used in the PandaX-4T experiment. In particular, the PMT shell was not considered in previous studies [12, 16]. The neutron yields and neutron energy spectra of (α, n) and SF reactions are calculated by SOURCES-4A code [15]. The neutron yields are summarized in Table 2. With the above inputs, a full detector MC simulation utilizing the GEANT4 package [24] gives the neutron background estimation. The disequilibrium in the 238U and 232Th chains is considered in the simulation. 238Ue represents the early chain of 238U decay, which ends at 230Th, whereas 238Ul represents the late chain of 238U decay, which starts from 226Ra and ends at 206Pb. 232Thl represents the late chain of 232Th decay, which starts from 228Th and ends at 208Pb. The early chain of 232Th is not considered because the neutron yield from this part is negligible [16].
Component Quantity Radioactivity (mBq/kg or mBq/piece) 235U 232Thl 238Ue 238Ul Inner vessel barrel and dome (SS) 443.5 kg $ 0.32 \pm 2.67 $ 

$ 2.54 \pm 1.82 $ 

$ 30.23 \pm 41.16 $ 

$ 3.21 \pm 2.04 $ 

Outer vessel barrel (SS) 961.4 kg $ 5.26 \pm 2.71 $ 

$ 3.17 \pm 1.83 $ 

$ 40.87 \pm 22.77 $ 

$ 1.97 \pm 1.44 $ 

Outer vessel dome (SS) 396.6 kg $ 2.78 \pm 2.42 $ 

$ 4.89 \pm 1.72 $ 

$ 40.84 \pm 24.03 $ 

$ 2.84 \pm 1.33 $ 

Flange (SS) 1254.5 kg $ 2.81 \pm 1.90 $ 

$ 4.42 \pm 1.82 $ 

$ 0.00 \pm 15.81 $ 

$ 1.81 \pm 1.33 $ 

R11410 PMT 368 pieces $ 4.60 \pm 8.53 $ 

$ 2.46 \pm 0.96 $ 

$ 26.29 \pm 16.90 $ 

$ 3.23 \pm 1.18 $ 

PMT base 368 pieces $ 0.46 \pm 1.22 $ 

$ 0.28 \pm 0.18 $ 

$ 6.97 \pm 1.94 $ 

$ 0.84 \pm 0.22 $ 

PTFE 200.0 kg $ (0.10 \pm 0.10)\times 10^{-3} $ 

$ 0.04 \pm 0.04 $ 

$ 0.02 \pm 0.02 $ 

$ 0.02 \pm 0.02 $ 

Table 1. Radioactivity of materials used in this analysis. The different components of the cryostat (two vessels) are sampled and measured separately, as shown in the first four rows.
Component (α, n) SF 235U 232Thl 238Ue 238Ul 238Ue SS (cryostat) 3.4 × 10⁻⁷ 1.5 × 10⁻⁶ 8.3 × 10⁻¹⁰ 4.1 × 10⁻⁷ 1.1 × 10⁻⁶ PTFE 8.9 × 10⁻⁵ 8.7 × 10⁻⁵ 9.4 × 10⁻⁶ 5.2 × 10⁻⁵ 1.1 × 10⁻⁶ Kovar (PMT shell) 1.6 × 10⁻⁷ 9.0 × 10⁻⁷ 7.6 × 10⁻¹¹ 2.2 × 10⁻⁷ 1.1 × 10⁻⁶ SiO2 (PMT window) 1.5 × 10⁻⁶ 1.6 × 10⁻⁶ 9.5 × 10⁻⁸ 9.6 × 10⁻⁷ 1.1 × 10⁻⁶ Cirlex (PMT base) 2.2 × 10⁻⁶ 2.3 × 10⁻⁶ 3.5 × 10⁻⁷ 1.4 × 10⁻⁶ 1.1 × 10⁻⁶ SS (PMT electrode) 3.4 × 10⁻⁷ 1.5 × 10⁻⁶ 8.3 × 10⁻¹⁰ 4.1 × 10⁻⁷ 1.1 × 10⁻⁶ Al2O3 (PMT ceramic) 9.5 × 10⁻⁶ 1.1 × 10⁻⁵ 2.7 × 10⁻⁷ 6.2 × 10⁻⁶ 1.1 × 10⁻⁶ Table 2. Neutron yield of the radioactive decay chain of different materials in the unit of neutron/decay. SF is dominated by the 238U isotope.
The detector simulation records the number of scatterings, the deposited energy, and the position information of each deposit. Several improvements are adopted in this study, including a more detailed geometry, a more realistic veto energy cut, and the FV cut of the PandaX-4T commissioning run. The veto cut threshold in simulation is adjusted to 705 keVee by comparing the data and MC. Owing to the lower detection efficiency in the veto region, this threshold is higher than that in PandaX-II [12]. In the PandaX-4T experiment, this provides a reduction of approximately 20% in the SSNR event. The estimated neutron-induced SSNR event contribution is formalized as
$ N_{{\rm ssnr}} =\sum\limits_{i}\sum\limits_{j} \left( A_{ij} \times Y_{ij} \times M_i \times P_{{\rm ssnr},ij} \right) \times \epsilon \times T,$

(1) where
$ M_i $ is the mass of the material component i,$ A_{ij} $ is the measured radioactivity of the isotope j in the material i,$ Y_{ij} $ is the neutron yield, and$ P_{{\rm ssnr},ij} $ is the probability of a neutron leading to the final SSNR background, which is based on detector MC simulation. The detection efficiency ϵ is different between data sets and types, as shown in Fig. 1. T is the duration of dark matter searches.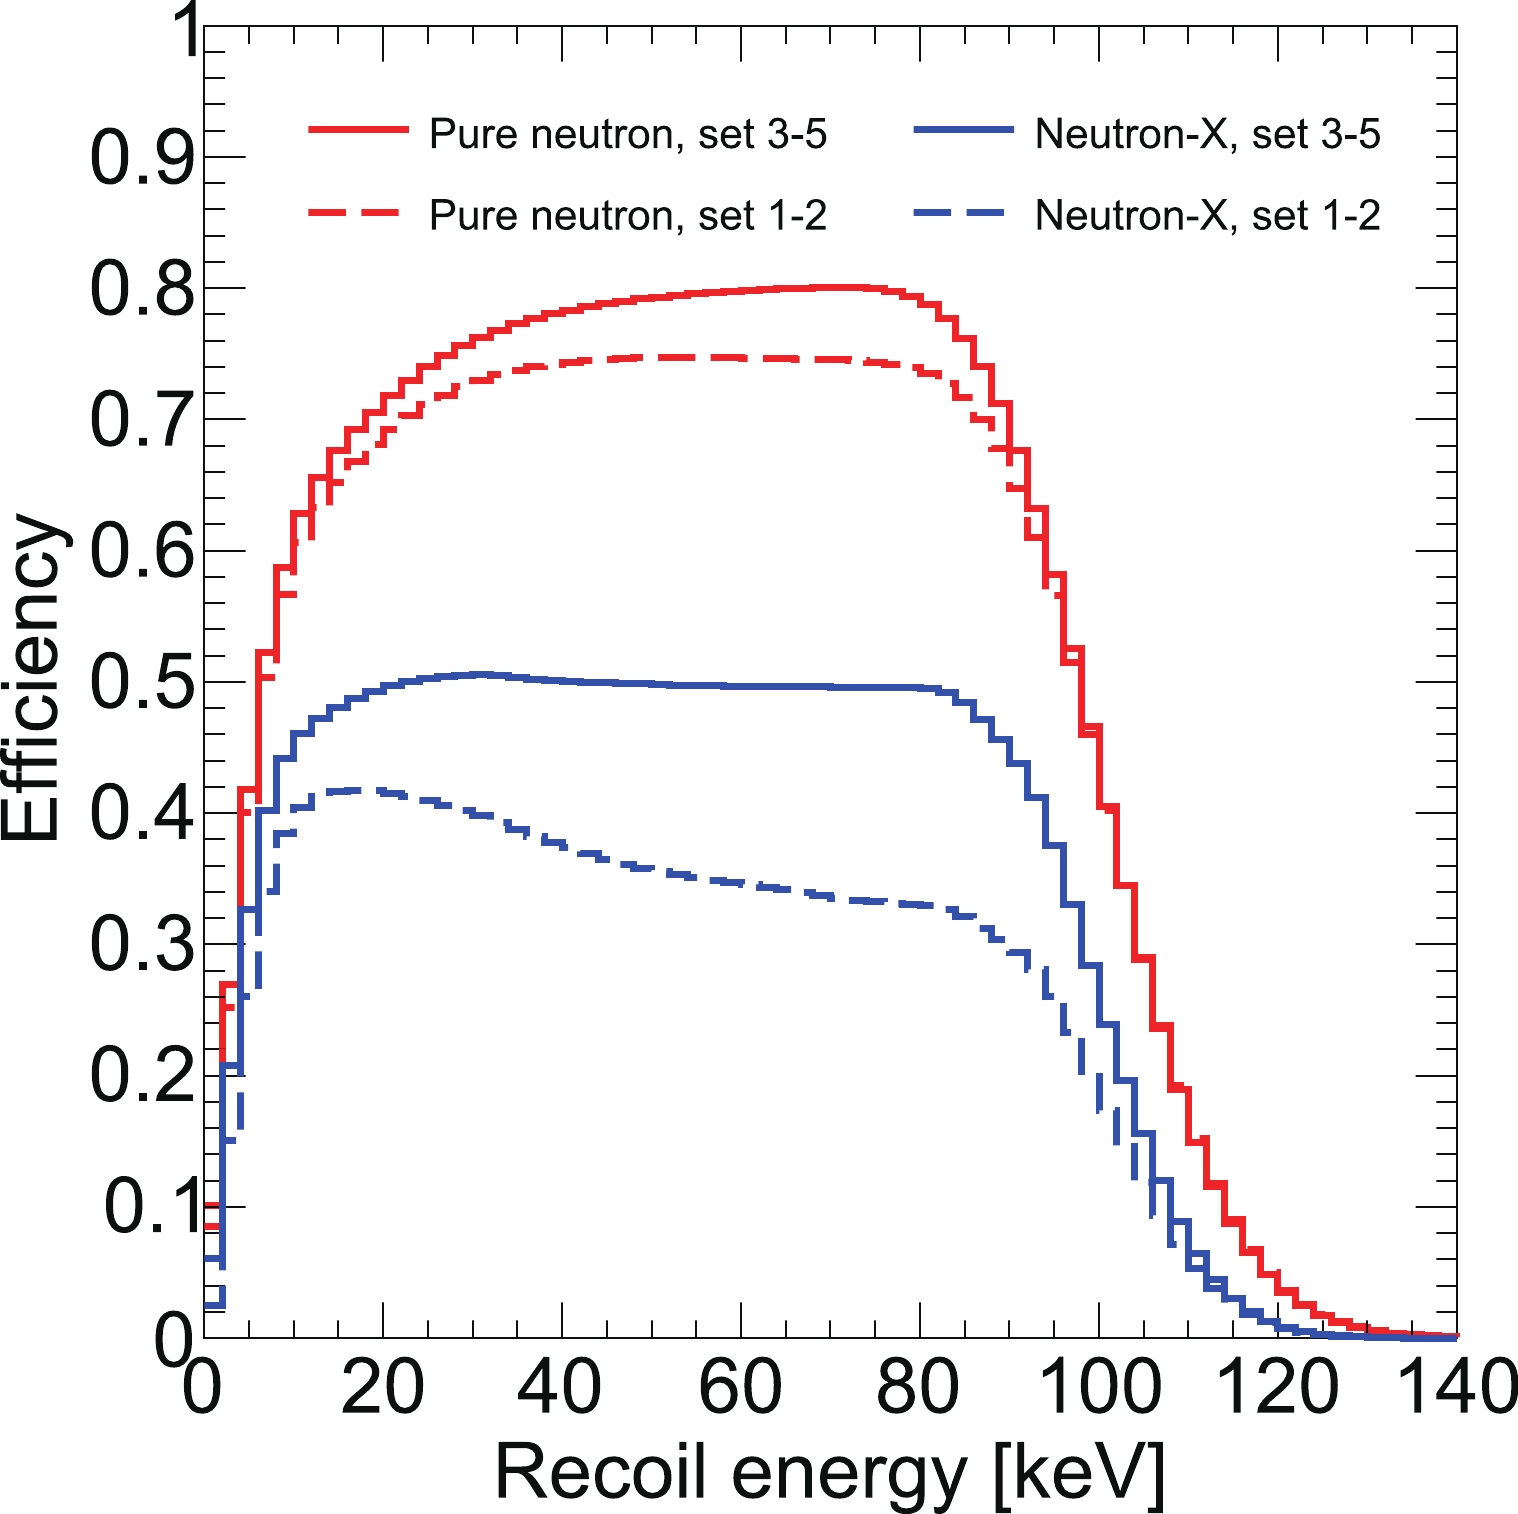
Figure 1. (color online) Selection efficiency as a function of nuclear recoil energy from the signal model. The dashed and solid curves represent the efficiencies in the different data sets. Pure neutron and neutron-X are the two types of neutron-induced SSNR backgrounds. The region of interest cuts have selection boundaries, i.e., qS1 < 400 PE and qS2 < 20000 PE. This leads to a decrease in the efficiency curves toward higher energies. The cuts are kept consistent over different data sets, whereas the signal yields are different. The NR acceptance cut makes the efficiency of data sets 1–2 lower than that of other data sets. Moreover, it leads to a smaller efficiency for neutron-X.
There is a fraction of neutrons that deposit part of their energy in the below-cathode region and part in the active volume. Owing to the inverse field below the cathode, the ionized electrons are unable to drift upward to the gas xenon region and produce
$ S 2 $ signals. However, prompt$ S 1 $ signals are collected. These events can also contribute to the SSNR background and are called "neutron-X" events. The PandaX-4T detector is not capable of distinguishing them from "pure neutron" events, in which neutrons only deposit their energy in the active volume. These two types of SSNR events have different distributions in the$ \log_{10} ({\rm q}S 2_{\rm b}/{\rm q}S 1) $ versus q$ S 1 $ parameter space, which is critical for background fitting [11]. In the simulation, neutron-X events can be identified, and their contribution can be calculated separately.The simulation is validated with AmBe and DD calibration data. In the simulation, the energy deposits are grouped in the same manner as the data clustering algorithm. Then, neutron events are classified according to the number of grouped deposits (SSNR and MSNR). In addition, the associated HEGs from neutron capture are simulated. The selection of these MSNR and HEG events are described in Sec. IV. Table 3 gives a comparison of the MSNR-to-SSNR and HEG-to-SSNR ratios between data and MC simulation. The largest difference, 33%, is adopted as the simulation uncertainty.
Event count DD data DD MC AmBe data AmBe MC SSNR 2606 2606 2721 2721 MSNR (N=2) 3340 3444 3082 3489 MSNR (N=3) 1953 2335 1541 2313 MSNR (N=4) 1138 1439 751 1527 MSNR (N=5) 519 858 397 1019 MSNR (N≤5) 6950 8077 5771 8350 HEG 71457 75036 98450 93464 R=MSNR/SSNR 2.7 3.1 2.12 3.1 R=HEG/SSNR 27.4 28.8 36.2 34.3 Table 3. Event number comparison between NR calibration data and MC simulation. The SSNR, MSNR, and HEG events and their relative ratios R are listed. Forty million DD neutron events and 28 million AmBe neutron events are generated in the simulation. The event numbers in MC are normalized to the SSNR event numbers in data. Note that the SSNR events in this table are within the energy range [0–20] keVee. Furthermore, the event selection volumes for SSNR, MSNR, and HEG are not same (introduced later); however, they are all consistent in data and MC simulation.
The energy spectra for pure neutron and neutron-X events and their total spatial distribution are shown in Fig. 2. For the MC method, the uncertainty mostly originates from the radioactivity measurement and simulation. Based on Table 1, the radioactivity measurement uncertainty is calculated as 37%. The uncertainty from the SOURCES4A calculation is approximately 17% [15]. In total, the uncertainty on the MC method is 52%. The predicted neutron-induced SSNR background events are 0.12 ± 0.06 (pure neutron in data sets 1–2), 0.62 ± 0.32 (pure neutron in data sets 3–5), 0.02 ± 0.01 (neutron-X in data sets 1–2), and 0.15 ± 0.08 (neutron-X in data sets 3–5). The detailed values from different component are listed in Table 4.
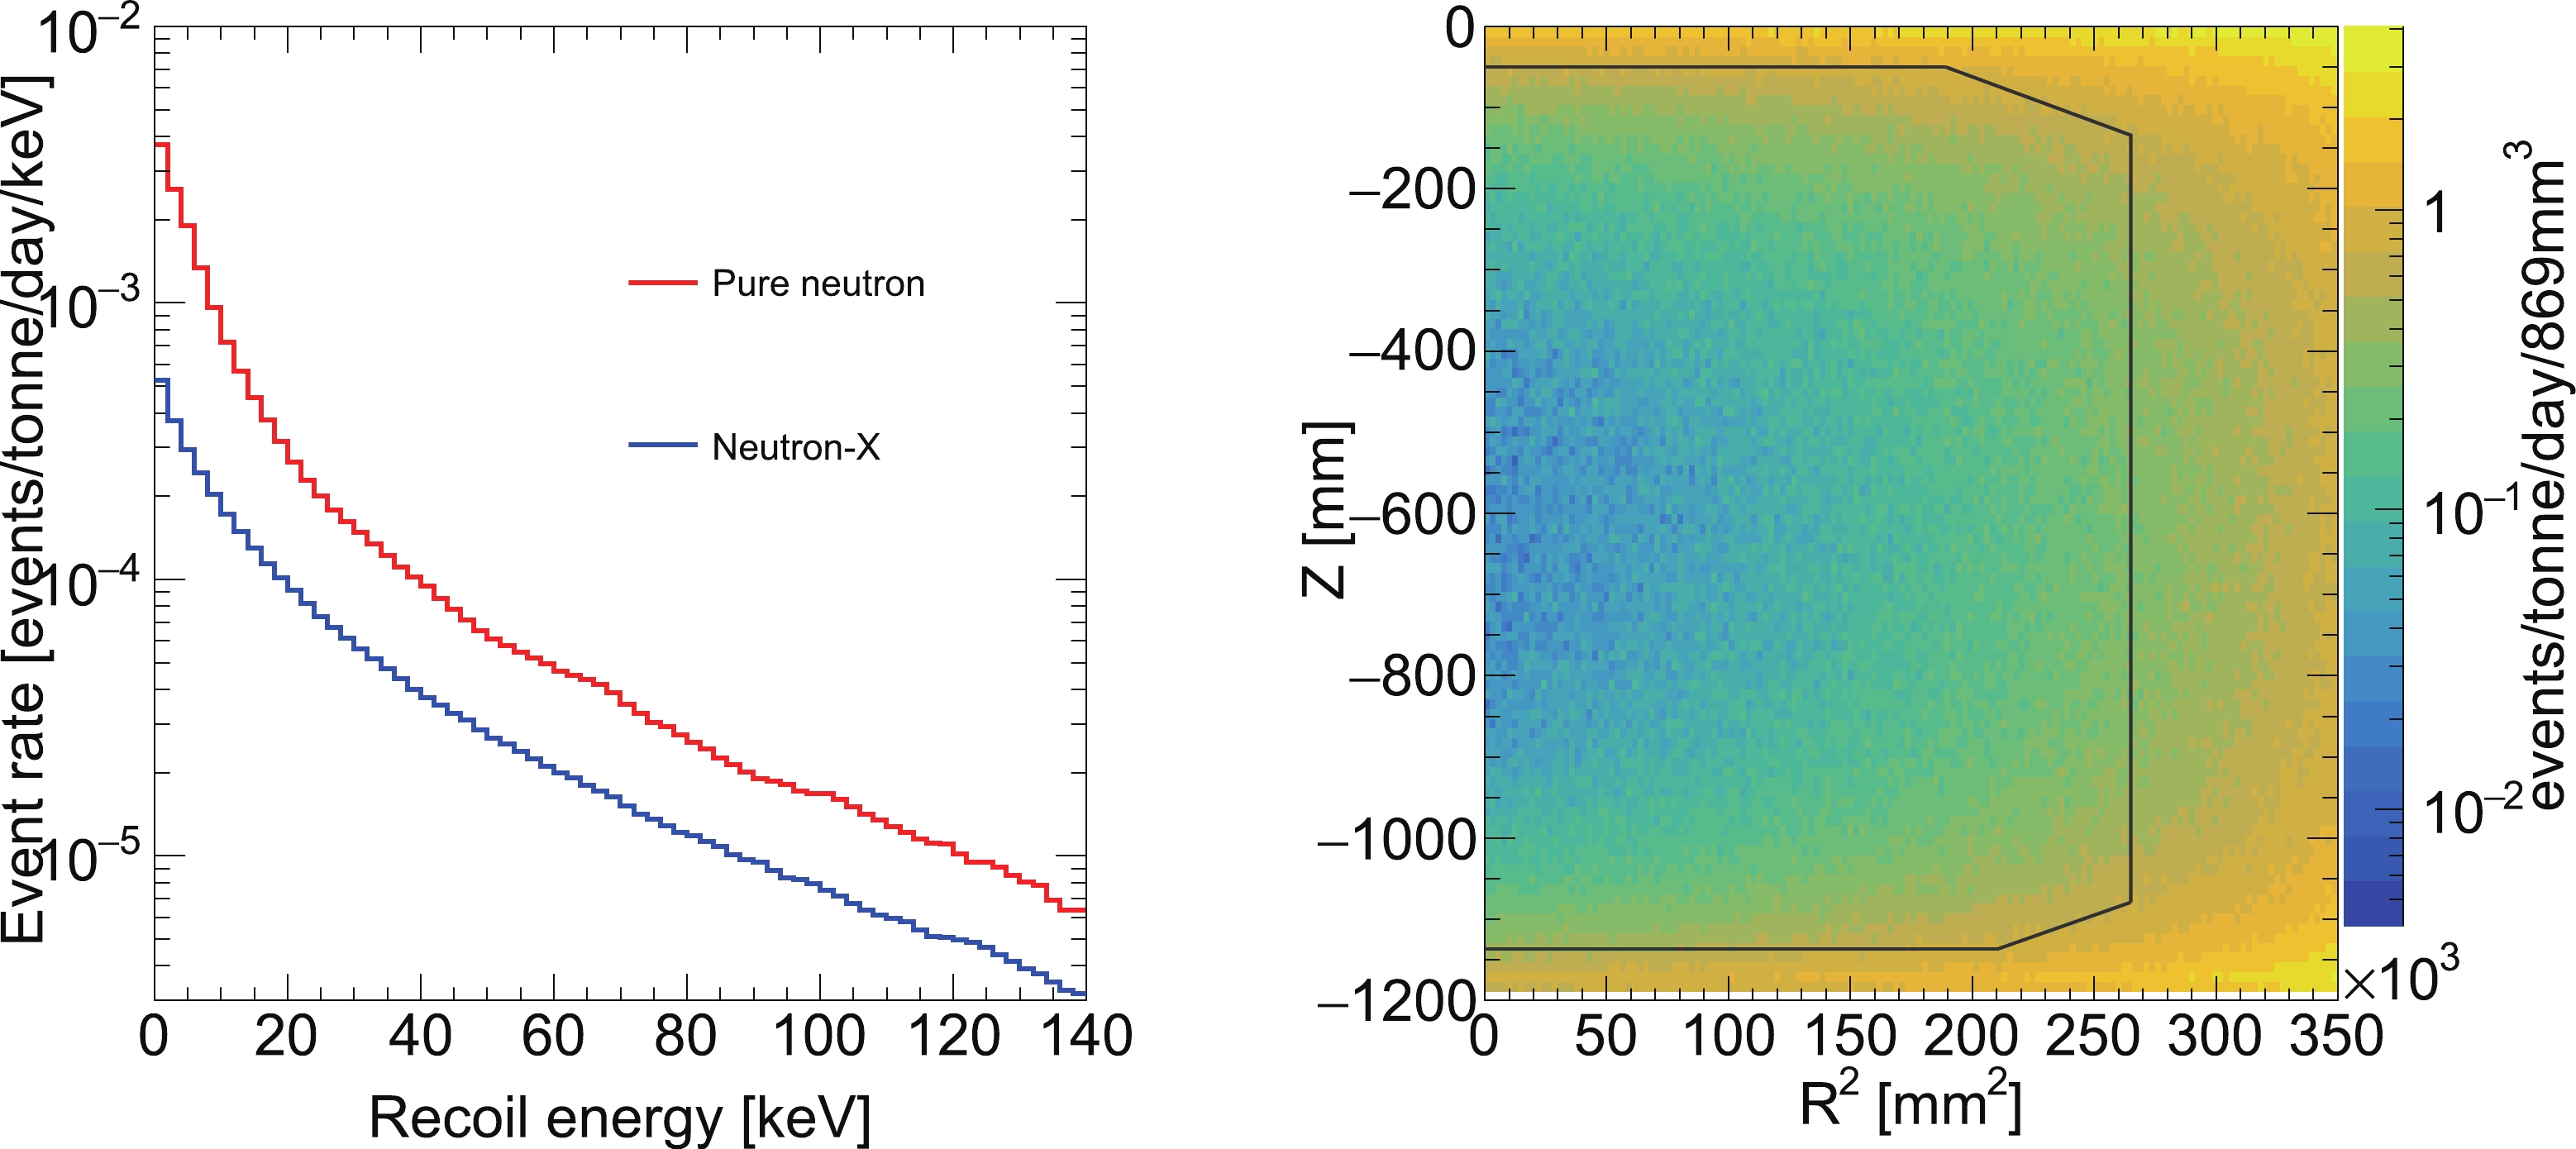
Figure 2. (color online) (left) Energy spectra for neutron background events inside the FV. (right) Total spatial distribution for neutron background events from MC simulation. The solid black lines represent the FV boundaries, resulting in an FV mass of 2.67 tonnes.
Data sets Sets 1–2 Sets 3–5 Duration 14.0 days 72.0 days Rate (counts/day) Pure neutron Neutron-X MSNR HEG Pure neutron Neutron-X MSNR HEG Inner vessel 2.1 × 10⁻³ 2.0 × 10⁻⁴ 1.0 × 10⁻² 6.5 × 10⁻² 2.2 × 10⁻³ 2.6 × 10⁻⁴ 1.0 × 10⁻² 6.5 × 10⁻² Outer vessel 4.2 × 10⁻³ 4.6 × 10⁻⁴ 2.0 × 10⁻² 1.4 × 10⁻¹ 4.4 × 10⁻³ 5.9 × 10⁻⁴ 2.0 × 10⁻² 1.4 × 10⁻¹ PTFE 1.4 × 10⁻⁴ 1.8 × 10⁻⁵ 1.0 × 10⁻³ 5.9 × 10⁻³ 1.5 × 10⁻⁴ 2.2 × 10⁻⁵ 1.1 × 10⁻³ 5.9 × 10⁻³ R11410 PMT 1.2 × 10⁻³ 6.2 × 10⁻⁴ 7.3 × 10⁻³ 3.1 × 10⁻² 1.3 × 10⁻³ 7.8 × 10⁻⁴ 7.6 × 10⁻³ 3.1 × 10⁻² PMT base 6.1 × 10⁻⁴ 3.5 × 10⁻⁴ 3.7 × 10⁻³ 2.3 × 10⁻² 6.6 × 10⁻⁴ 4.4 × 10⁻⁴ 3.9 × 10⁻³ 2.3 × 10⁻² Total 8.2 × 10⁻³ 1.6 × 10⁻³ 4.1 × 10⁻² 2.6 × 10⁻¹ 8.7 × 10⁻³ 2.1 × 10⁻³ 4.3 × 10⁻² 2.6 × 10⁻¹ RMC pure neutron − − 5.0 32.1 − − 5.0 30.3 RMC neutron-X − − 25.0 160.2 − − 20.8 126.1 Table 4. Predicted event rate for different materials from the MC simulation. Additionally, the ratios between MSNR/HEG and pure neutron/neutron-X are listed in the last two rows.
-
To better estimate the neutron background in the data, various data driven methods have been developed [16, 25]. Besides SSNR events, MSNR and HEG events [16, 25, 26] are also features of neutrons that are distinguishable signals in data. Therefore, neutron background can be evaluated using
$ N_{\rm{ssnr}} =\frac{N_{\rm{feature}}}{ R_{\rm{MC}}},$

(2) where
$ N_{\rm{feature}} $ refers to the number of MSNR or HEG events, and$ R_{\rm{MC}} $ is the ratio between the featured events and SSNR events obtained from simulation (last two rows in Table 4). -
Neutrons are likely to scatter multiple times in the PandaX-4T detector, which results in MSNR events. The kinetic energy of fast neutrons is several MeV, the neutron velocity is
$ \sim 0.1\; c $ , and the mean free path is several centimeters [26, 27]. The average time separation of adjacent scatterings is several nanoseconds. Prompt light travels meters in the PandaX-4T detector before reaching the PMTs, and the width of the$ S 1 $ signal can reach$ \sim 100 $ ns. Therefore,$ S 1 $ signals in MSNR events are reconstructed as a single$ S 1 $ . However, if multiple scatters occur at different vertical positions, which is true in most cases, these$ S 2 $ signals do not overlap each other and can be identified. The horizontal position of each scatter is reconstructed through the light pattern of the top PMT array [28]. The vertical positions are determined by the time separation between the$ S 2 $ s and the combined$ S 1 $ .After 3-D uniformity correction is applied on the
$ S 1 $ and$ S 2 $ s, the combined electron-equivalent energy of the MSNR event,$ E_{\rm{MSNR}} $ , is reconstructed, which follows the SSNR energy reconstruction formula. The correction for the S1 signal is solely based on the position of the largest S2, and the resulting uncertainty on Σq$ S 1 $ is less than 10%. This uncertainty is incorporated in the comparison between calibration data and MC. The energy region of interest for MSNR is set as 1< $E_{\rm{MSNR}} < $ 25 keVee, and the number of scatters should be larger than one and less than six so that they cover more than 80% of all MSNR events in data and MC simulation. To collect more MSNR events, a larger fiducial volume (LFV) is defined, resulting in a target xenon mass of 3.04 tonnes. The position radius square of the scattering with the maximum$ S 2 $ is confined within$ 3 \times 10^{5} $ mm2. The vertical position confinement of this maximum$ S 2 $ follows that of the SSNR, i.e., 52 mm below the gate and 58 mm above the cathode. There is no restriction on the positions of other scatterings.Figure 3 shows the double scattering NR event distribution of
$ \log_{10}(\sum{{\rm q}S 2_{\rm b}}/\sum{{\rm q}S 1}) $ versus$ \sum{{\rm q}S 1} $ from AmBe and DD calibration data. The 99% upper quantiles of this distribution can be derived and are also plotted. These so-called 99% acceptance cuts are applied to the MSNR candidate selection to suppress multiple scattering electron recoil (ER) events. For number of scatterings larger than three, the statistic is not sufficient. However, the ER MC simulation shows that the multiple-scatter ER contamination is negligible in this region. Thus, the 99% acceptance cuts are not necessary.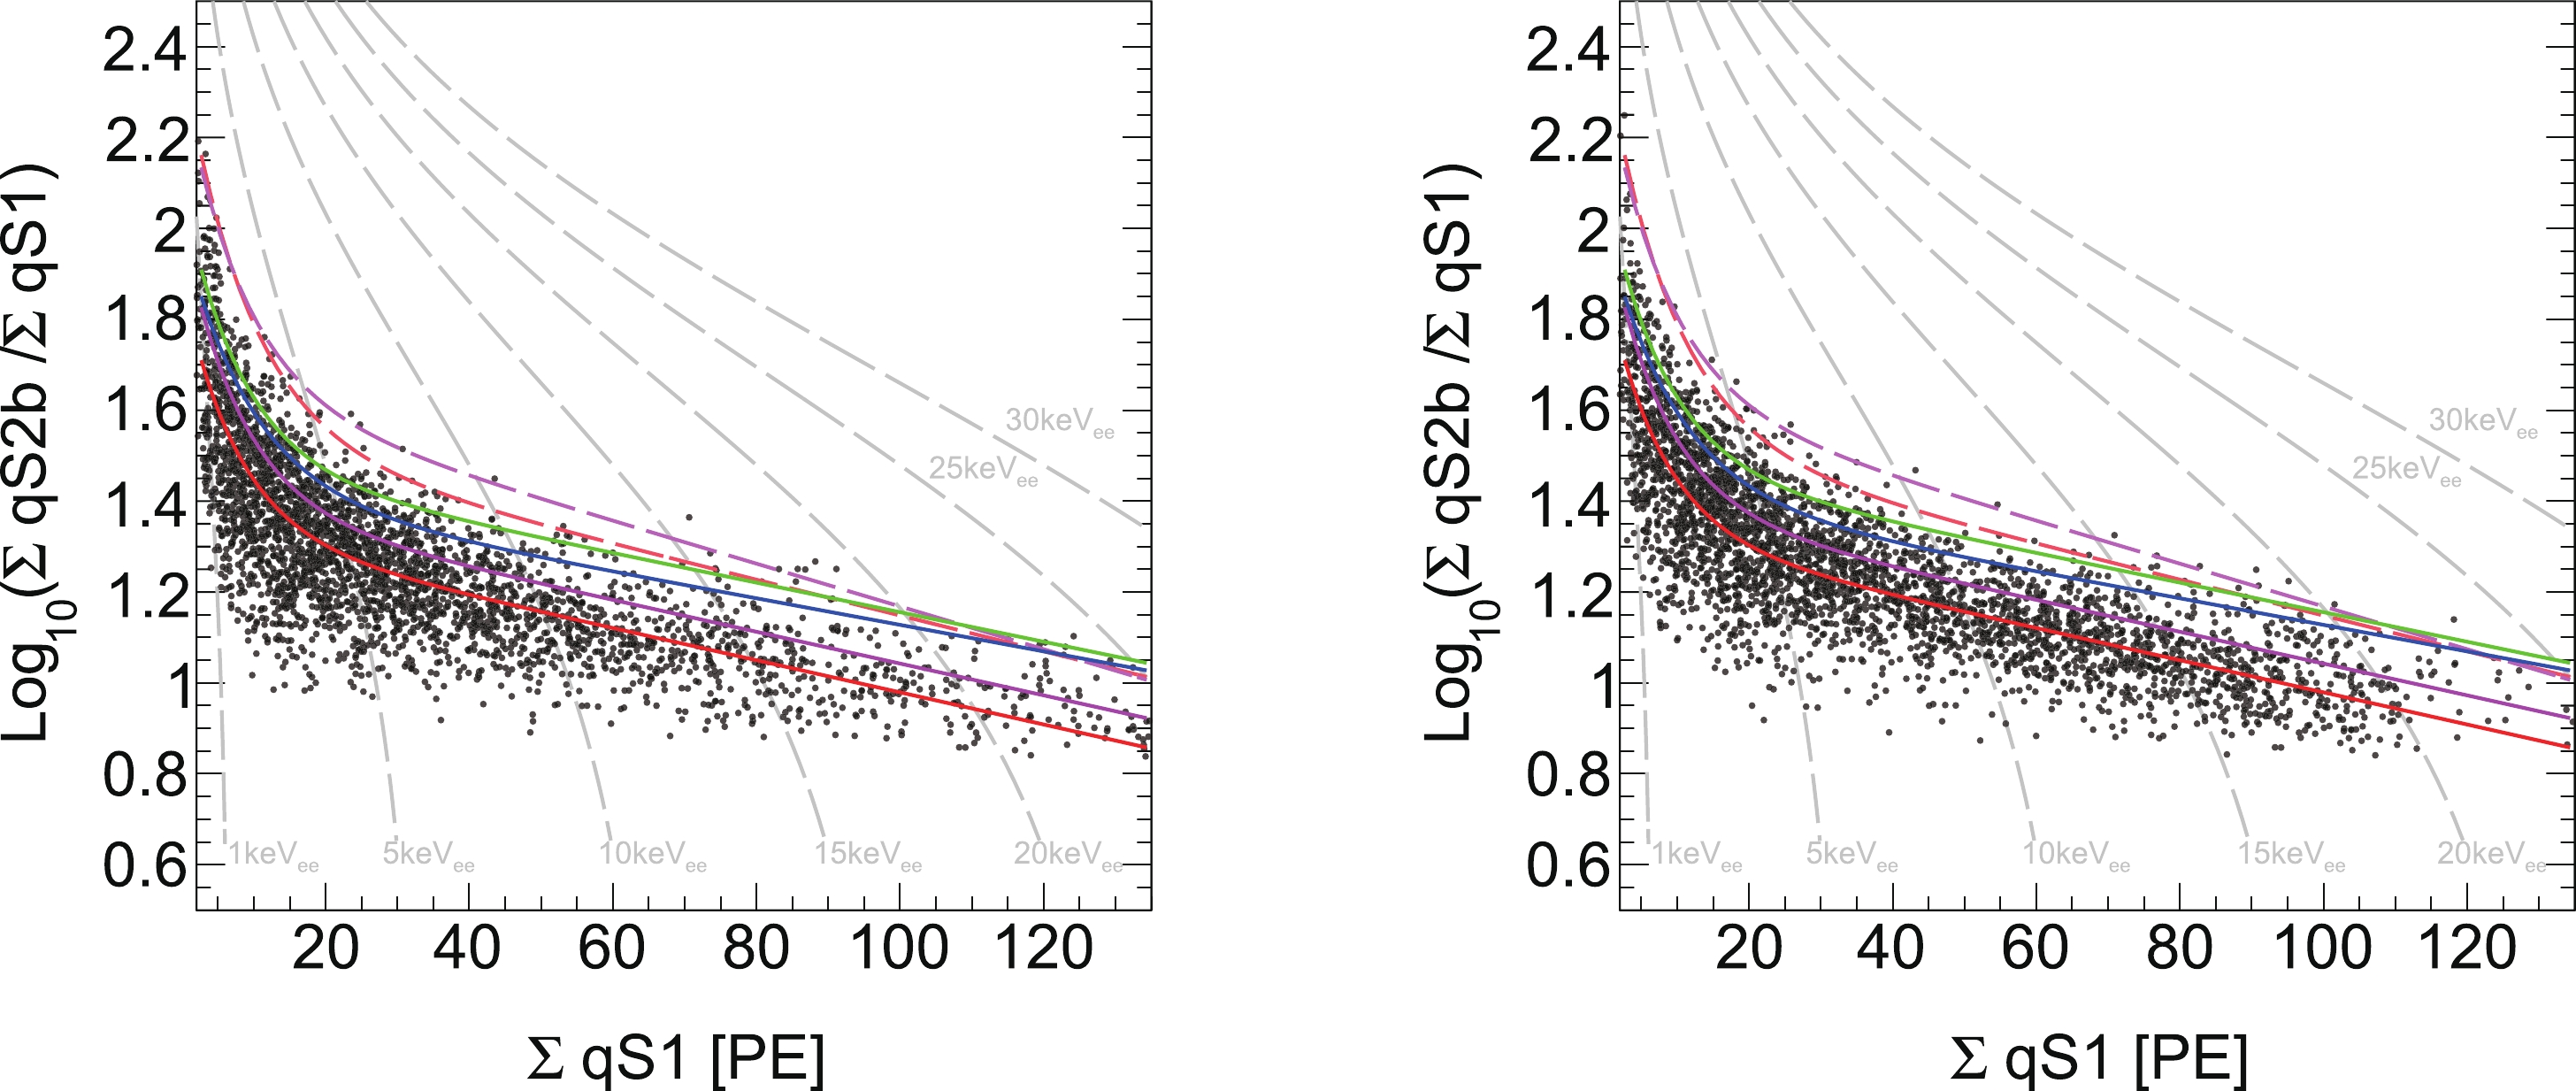
Figure 3. (color online) Distribution of
$ \log_{10}(\sum{{\rm q}S 2_{\rm b}}/\sum{{\rm q}S 1}) $ versus$ \sum{{\rm q}S 1} $ of double scattering NR events in AmBe data (left) and DD data (right). The red, magenta, blue, and green solid lines represent the DD and AmBe combined MSNR median curve for two, three, four, and five scattering NR events, respectively. The red and magenta dashed lines show the 99% upper quantile boundaries for two and three scattering NR events, respectively. The electron equivalent recoil energy in keVee is indicated by gray dot dashed lines. A clear shift in the median curves are shown, which is typical for multiple scattering events.In PandaX-4T commissioning data, null MSNR candidates are found in data sets 1–2, and three MSNR candidates are found in data sets 3–5. The statistical uncertainty is ± 1.29 [29] and ± 1.73 for data sets 1–2 and 3–5, respectively. The distribution of these three MSNR candidates for
$ \log_{10}(\sum{{\rm q}S 2_{\rm b}}/\sum{{\rm q}S 1}) $ versus$ \sum{{\rm q}S1} $ and the spatial distribution are shown in Fig. 4.$ R_{\rm MC} $ (MSNR-to-SSNR) in different data sets is calculated based on MC simulation and listed in Table 4 (5.0 for a pure neutron in data sets 1–2, 25.0 for neutron-X in data sets 1–2, 5.0 for a pure neutron in data sets 3–5, and 20.8 for neutron-X in data sets 3–5). Similar to the MC method, the systematic uncertainty on$ R_{\rm MC} $ originates from the simulation and radioactivity measurement. For the MSNR estimator, the simulation uncertainty is quantified by the difference between NR calibration data and NR MC simulation as 33%. The$ +1\; \sigma $ upper limit of radioactivity gives an approximately 21% increment in$ R_{\rm MC} $ (MSNR-to-SSNR). In total, the systematic uncertainty on$ R_{\rm MC} $ (MSNR-to-SSNR) is 40%. The predicted neutron-induced SSNR background events from the MSNR data-driven method are 0.00 ± 0.26 (pure neutron in data sets 1–2), 0.60 ± 0.42 (pure neutron in data sets 3–5), 0.00 ± 0.05 (neutron-X in data sets 1–2), and 0.14 ± 0.10 (neutron-X in data sets 3–5).
Figure 4. (color online) (left) MSNR candidate distribution for
$ \log_{10}(\sum{{\rm q}S 2_{\rm b}}/\sum{{\rm q}S 1}) $ versus$ \sum{{\rm q}S 1} $ . Three double scattering MSNR events (labeled as red dots) remain after MSNR 99% upper acceptance cuts (red and magenta dashed lines) are applied. The dark matter search data (single scattering events) in data sets 4 and 5 are also shown as black dots. (right) MSNR candidate spatial distribution. The black and blue solid lines are the boundaries for the FV [11] and LFV, respectively. The solid circles represent the recoiling position that generates the largest$ S 2 $ . The hollow circles show the other recoiling position. The dashed lines connect the scatters that belong to the same event. Moreover, single scattering events inside (outside) the FV are shown as black (gray) dots. -
Compared with SSNR and MSNR events, the number of HEG events is considerable in the PandaX-4T detector, which indicates that HEGs are a good estimator for SSNR background. The HEGs from neutron capture can have energies of several MeV, i.e., significantly higher than those of ER events produced by radioactive isotopes in the detector materials. In addition, a HEG event may consist of many gamma particles, and each gamma particle can scatter multiple times in the detector, which results in multiple
$ S 1 $ s and$ S 2 $ s. Specifically, the drift time of a HEG event is defined by the time separation of the maximum$ S 1 $ and maximum$ S 2 $ .The energy reconstruction formula of SSNR is used for HEG events, with summation of all q
$ S 1 $ and q$ S 2_{\rm b} $ . In contrast with the low energy region, it is common for PMTs to saturate when the energy deposit reaches the MeV scale or above. To correct for the S2 after-pulsing effect and PMT saturation effect, an extra nonlinear correction factor is applied, which is derived from the difference between the reconstructed energy and the true energy of the characteristic gamma rays in AmBe data, including 2.6 MeV (208Tl), 4.4 MeV (12C*), and 9.3 MeV (130Xe*).To select the HEG candidates, the corrected energy
$ E_{\rm{cor}} $ should be limited to between 6 and 20 MeV, which is similar to a previous study [16]. In the high energy region, multiple$ S 2 $ s sometimes overlap in the waveform. Stray electrons, following the large$ S 2 $ signals, can cause a long tail in the waveform. Moreover, PMT saturation may change the PMT charge distribution. Therefore, the reconstructed position is biased. An extended fiducial volume (EFV) cut is adopted for HEG selection, the upper constraint on the position radius square$ R^2 $ is extended to$ 3.5 \times 10^5 $ mm2, and the z position must be 24 mm below the gate electrode and 100 mm above the cathode electrode. The target mass of the EFV is approximately 3.50 tonnes. Figure 5 shows the energy spectra in the EFV for the data and MC simulation. The red, black, blue, and green dots represent the PandaX-4T commissioning data, NR calibration data, NR calibration data with PandaX-4T commissioning data subtracted, and the MC simulation, respectively. The overall shape of the MC simulation agrees with that of the data. The prediction of HEG candidates from MC simulation is validated through AmBe and DD calibration data, and the MC simulation is consistent with data within 5%, as shown in Table 3.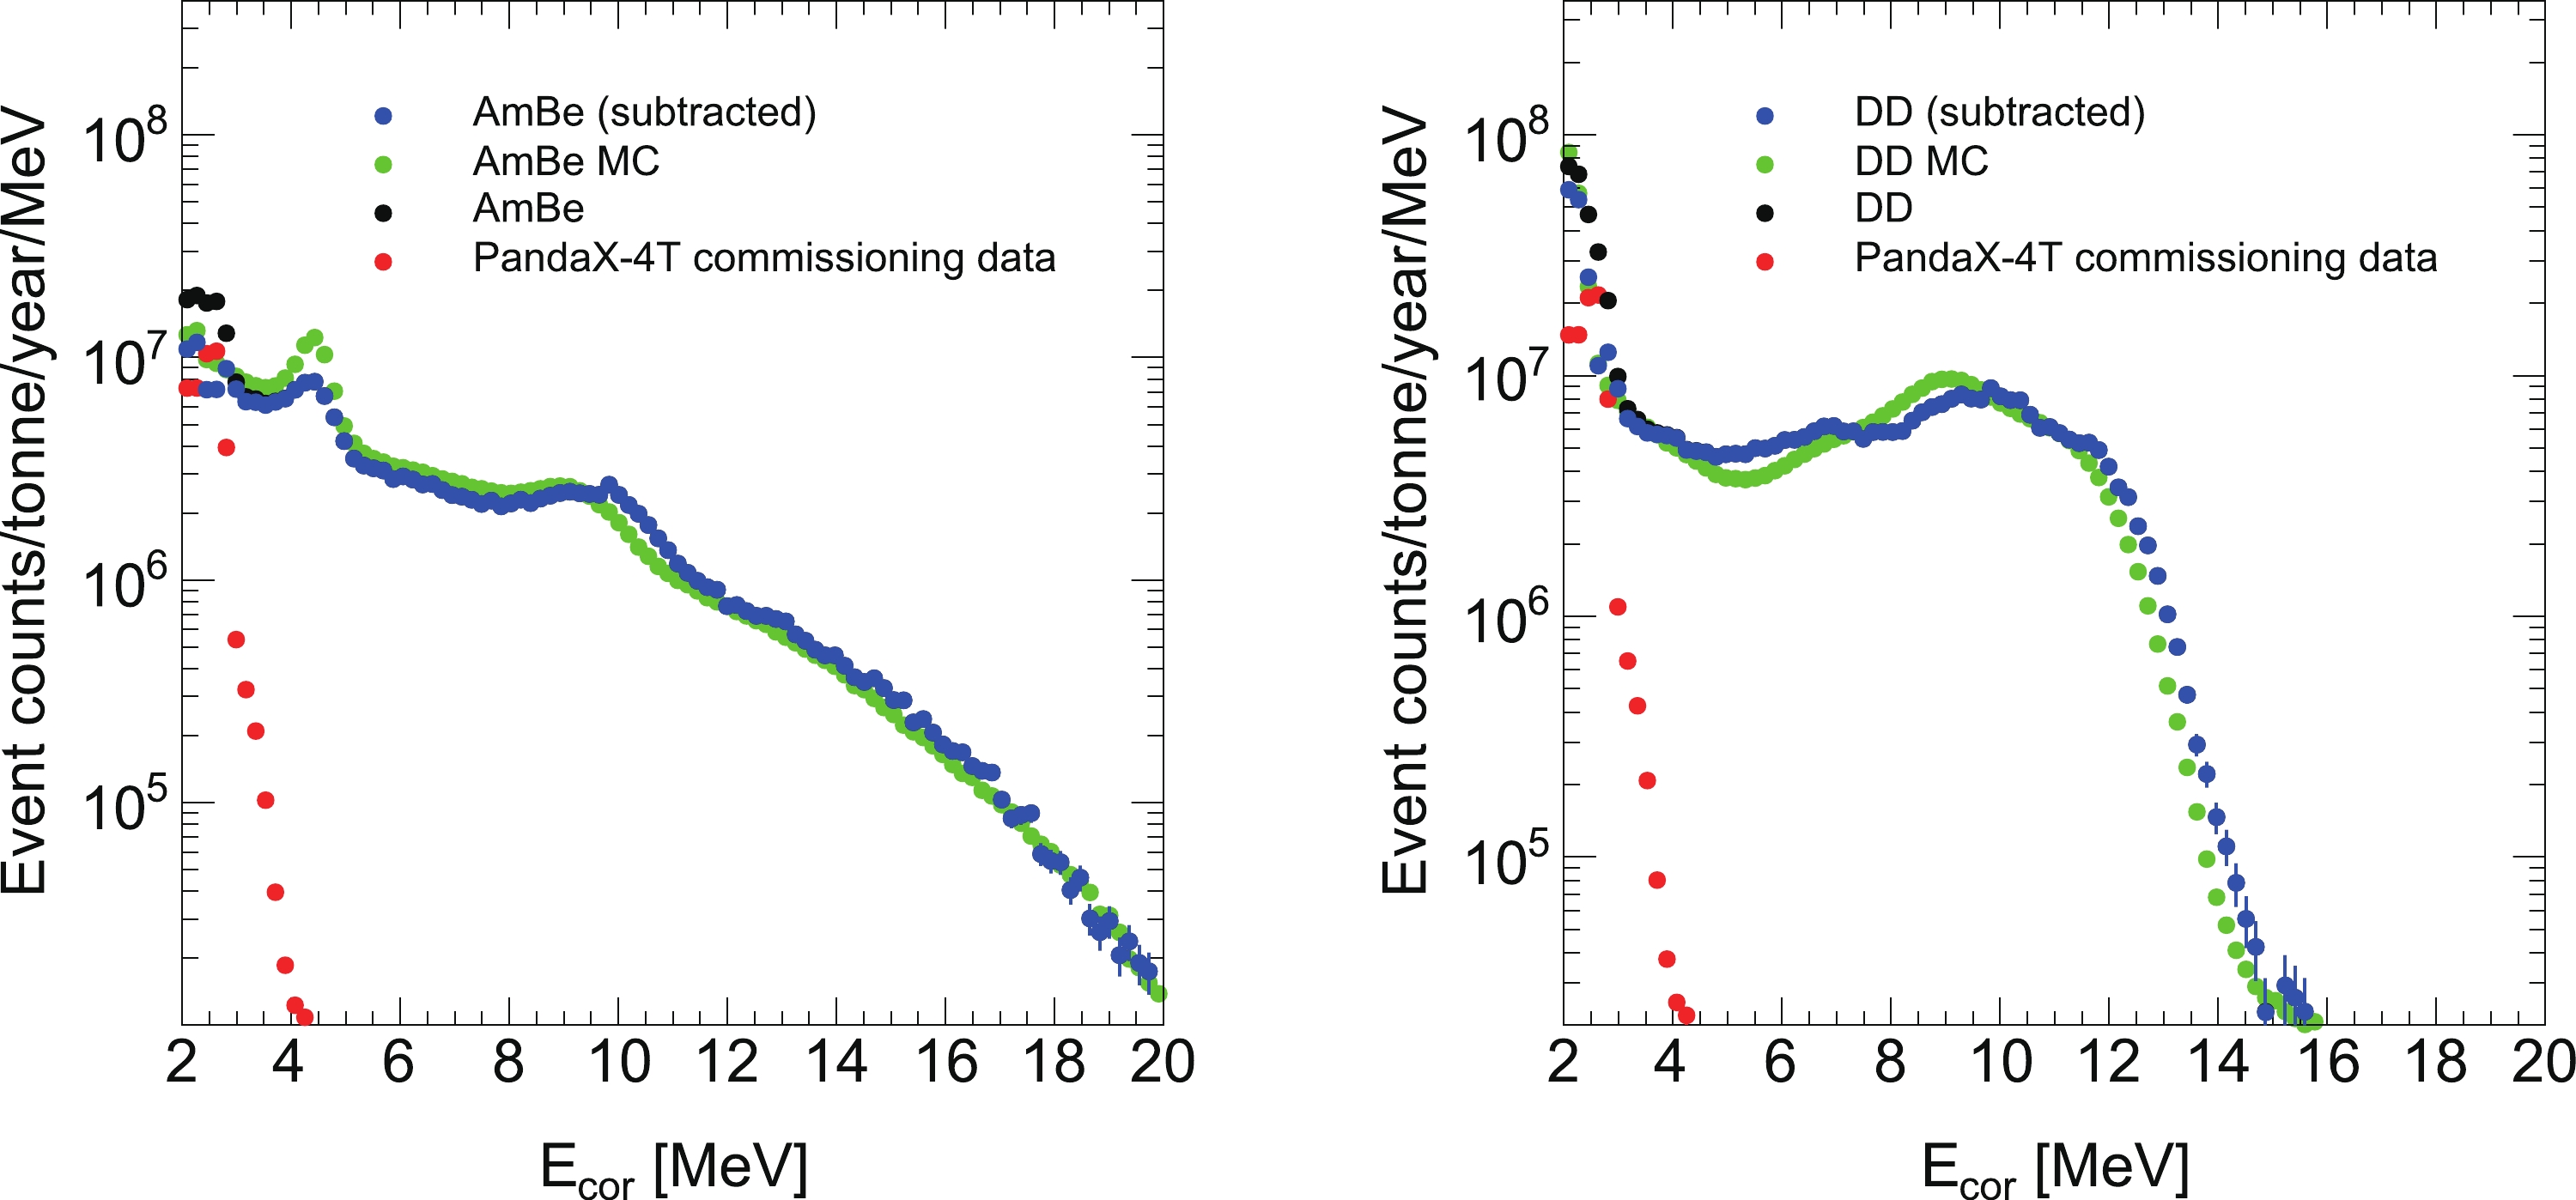
Figure 5. (color online) AmBe data (left), DD data (right), and MC high energy spectra comparison. The black dots represent raw AmBe data or raw DD data. The red dots represent the PandaX-4T commissioning data. The blue spectra are obtained by subtracting the PandaX-4T commissioning data from raw AmBe data or raw DD data. The MC simulation energy spectra are shown in green.
Figure 6 shows the distribution of
$ \log_{10}(\sum{{\rm q}S 2_{\rm b}}/ \sum{{\rm q}S 1}) $ versus$ E_{\rm{cor}} $ from NR calibration data. The HEG candidates from neutron capture are located in the typical ER band with$ \log_{10}(\sum{{\rm q}S 2_{\rm b}}/\sum{{\rm q}S 1}) $ between 1.1 and 1.7. In the high energy region, there are also some α related events, labeled as bulk α, wall α, and α-ER-mixed [16]. In contrast with HEGs, α-ER-mixed events arise from a combination of α and gamma emissions (mainly with an energy of 2.6 MeV) from long lived radioisotopes in the detector materials. α-ER-mixed events have$ \log_{10}(\sum{{\rm q}S 2_{\rm b}}/\sum{{\rm q}S 1}) $ mainly between 0.1 and 0.9 and can have leakage into the selection region of HEG candidates.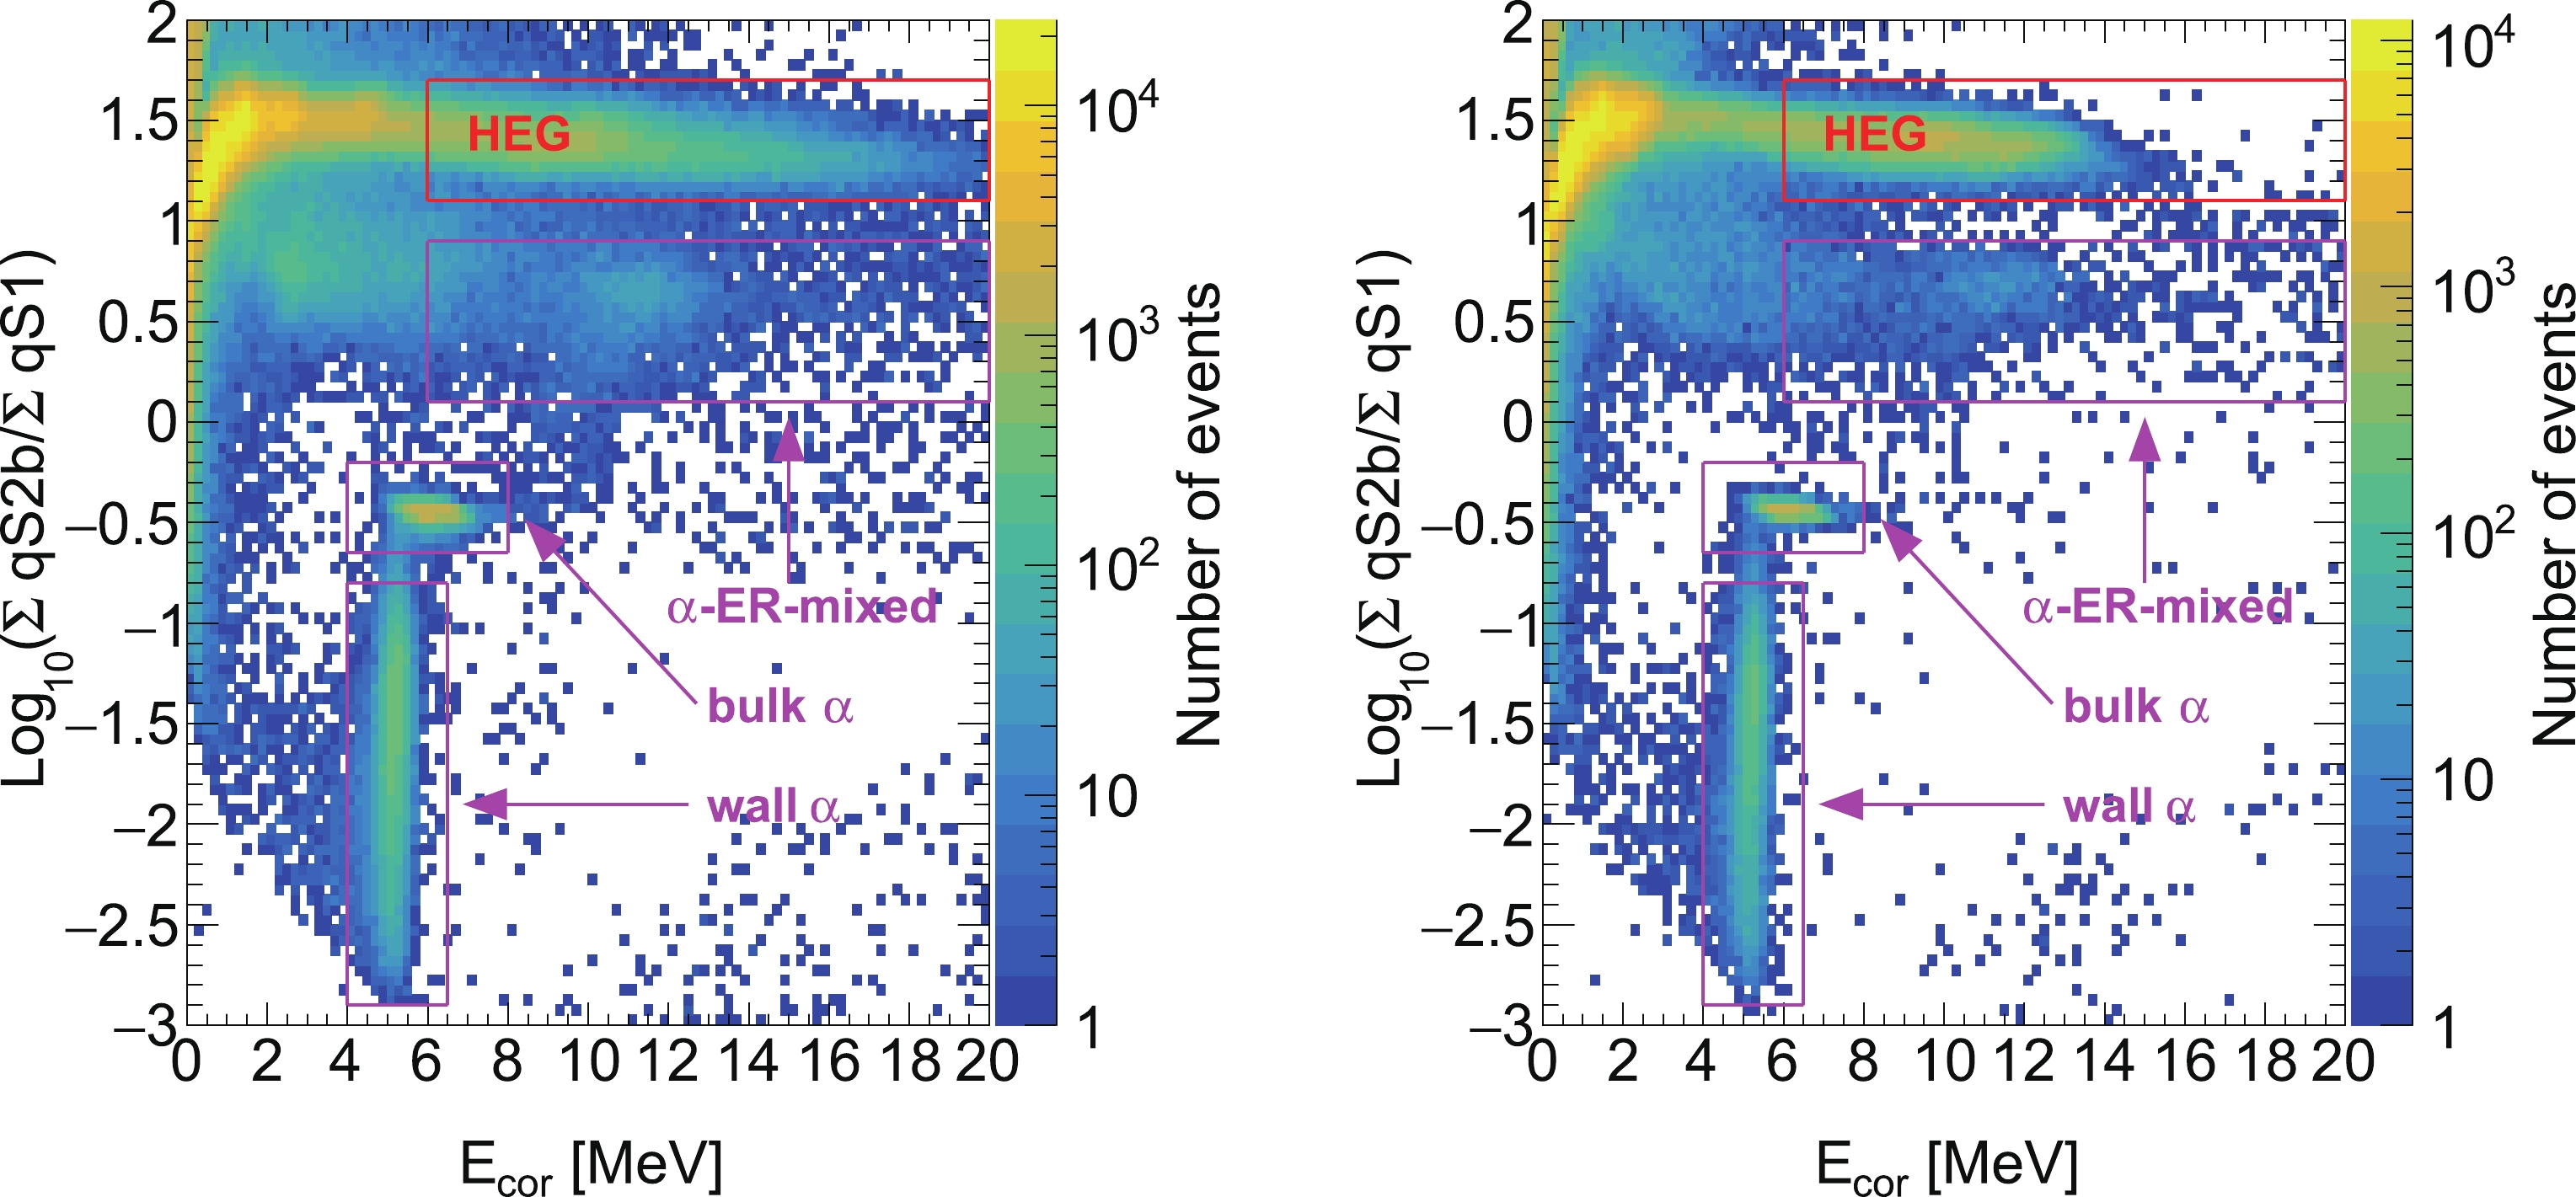
Figure 6. (color online) Distribution of events in
$ \log_{10}(\sum{{\rm q}S 2_{\rm b}}/\sum{{\rm q}S 1}) $ versus$ E_{\rm{cor}} $ in the AmBe data (left) and DD data (right). The HEG events located in the red box with the y-axis within [1.1, 1.7] are distinguishable from other α events in the magenta boxes. The α-ER-mixed events have the y-axis within [0.1, 0.9].A typical waveform of a HEG event is shown in Fig. 7. Several new waveform-based variables are defined and used for α-ER-mixed event rejection later. From the multiple
$ S 2 $ signals, the highest peak pulse is identified. The FWHM-width$ w_{\rm fwhm} $ is defined as the full width at half maximum height of the highest peak pulse. Another width variable$ w_{3\sigma} $ is calculated from the signal start time to the equivalent +3σ Gaussian width of the highest peak pulse. Correspondingly, the charge can be obtained by integrating the relevant interval of the signal waveform. q$ S 2_{\rm b3\sigma} $ is the charge collected by the bottom PMT array by integrating over the$ w_{3\sigma} $ interval of the$ S 2 $ waveform. Generally, stray electrons do not contribute to q$ S 2_{\rm b3\sigma} $ .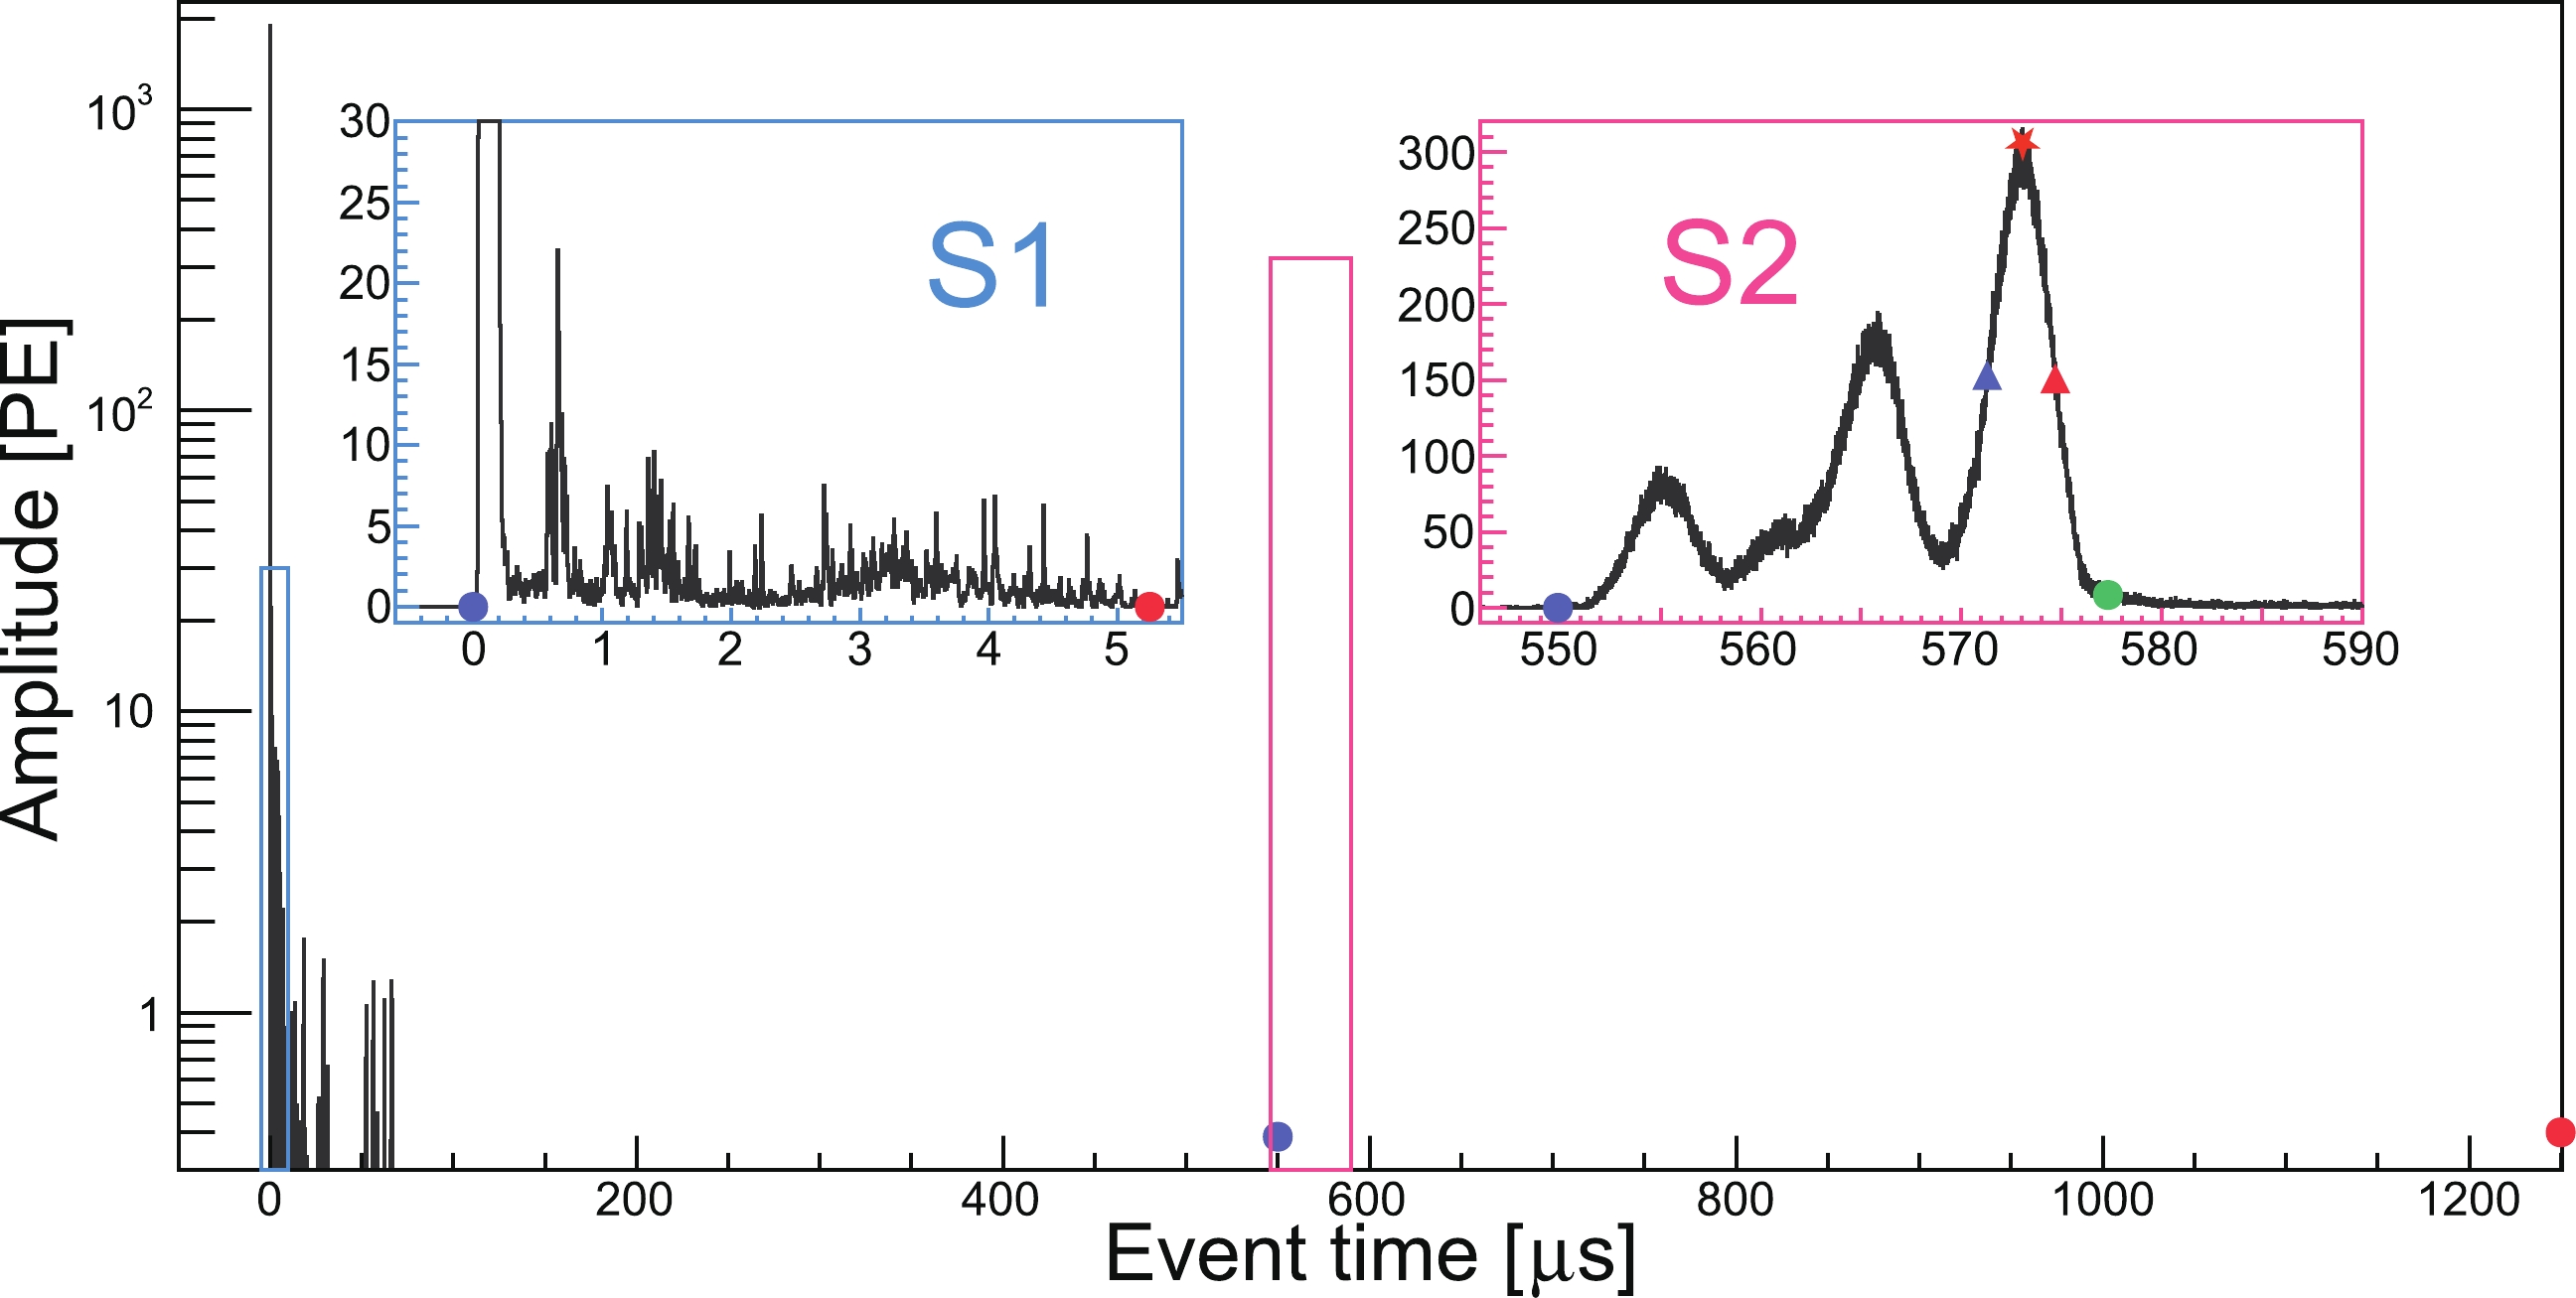
Figure 7. (color online) Typical HEG event waveform. The identified maximum
$ S 1 $ and$ S 2 $ are shown in the zoomed in blue and pink insets, respectively. The violet and red dots indicate the start and end times of each signal. They are not shown in the main graph for the maximum$ S 1 $ for the sake of clarity. For the maximum$ S 2 $ , the$ w_{3\sigma} $ end boundary, peak time, start boundary of$ w_{\rm fwhm} $ , and end boundary of$ w_{\rm fwhm} $ are also plotted in the insets as a green dot, red star, violet triangle, and red triangle, respectively.To identify the suspicious α-ER-mixed event in PandaX-4T commissioning data, a boosted decision tree (BDT) technique is developed, utilizing the Toolkit for Multivariate Data Analysis (TMVA) package in ROOT [30]. The BDT inputs are based on the signal shape differences among α candidates, 2.6 MeV ER candidates, and HEG candidates, as listed in Table 5.
Variable Unit Explanation chargeRatio 1 Logarithm of the charge ratio to the base 10 ( $ \log_{10}(\sum{\rm q}S 2_{\rm b}/\sum{\rm q}S 2_{{\rm b}3\sigma}) $ )

ratioTSignal 1 Time window percentage of all signals in the event waveform wS1 sample (4 ns) Width of the largest $ S 1 $ 

qS1 PE Raw charge of the largest $ S 1 $ 

qS1_2nd PE Raw charge of the second largest $ S 1 $ 

widthTen $ S 1 $ 

sample (4 ns) Width of portion exceeding 10%-height of the largest $ S 1 $ 

w $ S 1 $ CDF

sample (4 ns) Width of the largest $ S 1 $ waveform enclosing 10% to 90% cumulative charge

h $ S 1 $ 

PE/sample Height of the largest $ S 1 $ 

q $ S 2 $ 

PE Raw charge of the largest $ S 2 $ 

w $S 2$ 

sample (4 ns) Width of the largest $ S 2 $ 

widthTen $ S 2 $ 

sample (4 ns) Width of portion exceeding 10%-height of the highest peak in the largest $ S 2 $ 

w $ S 2 $ CDF

sample (4 ns) Width of the largest $ S 2 $ waveform enclosing 10% to 90% cumulative charge

h $ S 2 $ 

PE/sample Height of the largest $ S 2 $ 

$ S 1 $ Asy

1 Ratio of top and bottom charge difference over the total charge for the maximum $ S 1 $ 

$ S 2 $ Asy

1 Ratio of top and bottom charge difference over the total charge for the maximum $ S 2 $ 

Table 5. BDT input variables.
The events inside the HEG selection region (top red box in Fig. 6) in 21.6 h AmBe data are used for HEG training. Additionally, events within the α-ER-mixed event region (top magenta box in Fig. 8) in the 30 days data of PandaX-4T commissioning data set 4 are used for α-ER-mixed event training. The remaining NR calibration data and other PandaX-4T commissioning data are selected to derive the HEG selection efficiency and α-ER-mixed event rejection power, respectively. The BDT variable distribution, their correlation matrices, and the BDT performance are shown in the appendix (Fig. 9, Fig. 10, and Fig. 11). In the BDT model training process, a strict
$ S2 $ Asy cut is applied, as shown in Fig. 9. This ensures the purity of the HEG training samples. However, it is not applied to the testing samples. Furthermore, it can be identified that α-ER-mixed events have two components from the α decay of 222Rn and 218Po, which release α particles with energies of 5.5 and 6 MeV, respectively. The most powerful variables are q$ S 2 $ , w$ S 2 $ , h$ S 1 $ , and qS1_2nd. Owing to the significant difference in signal shape and$ S 2 $ charge, over 99.9% of α-ER-mixed events are rejected while maintaining an almost 100% efficiency for HEG events.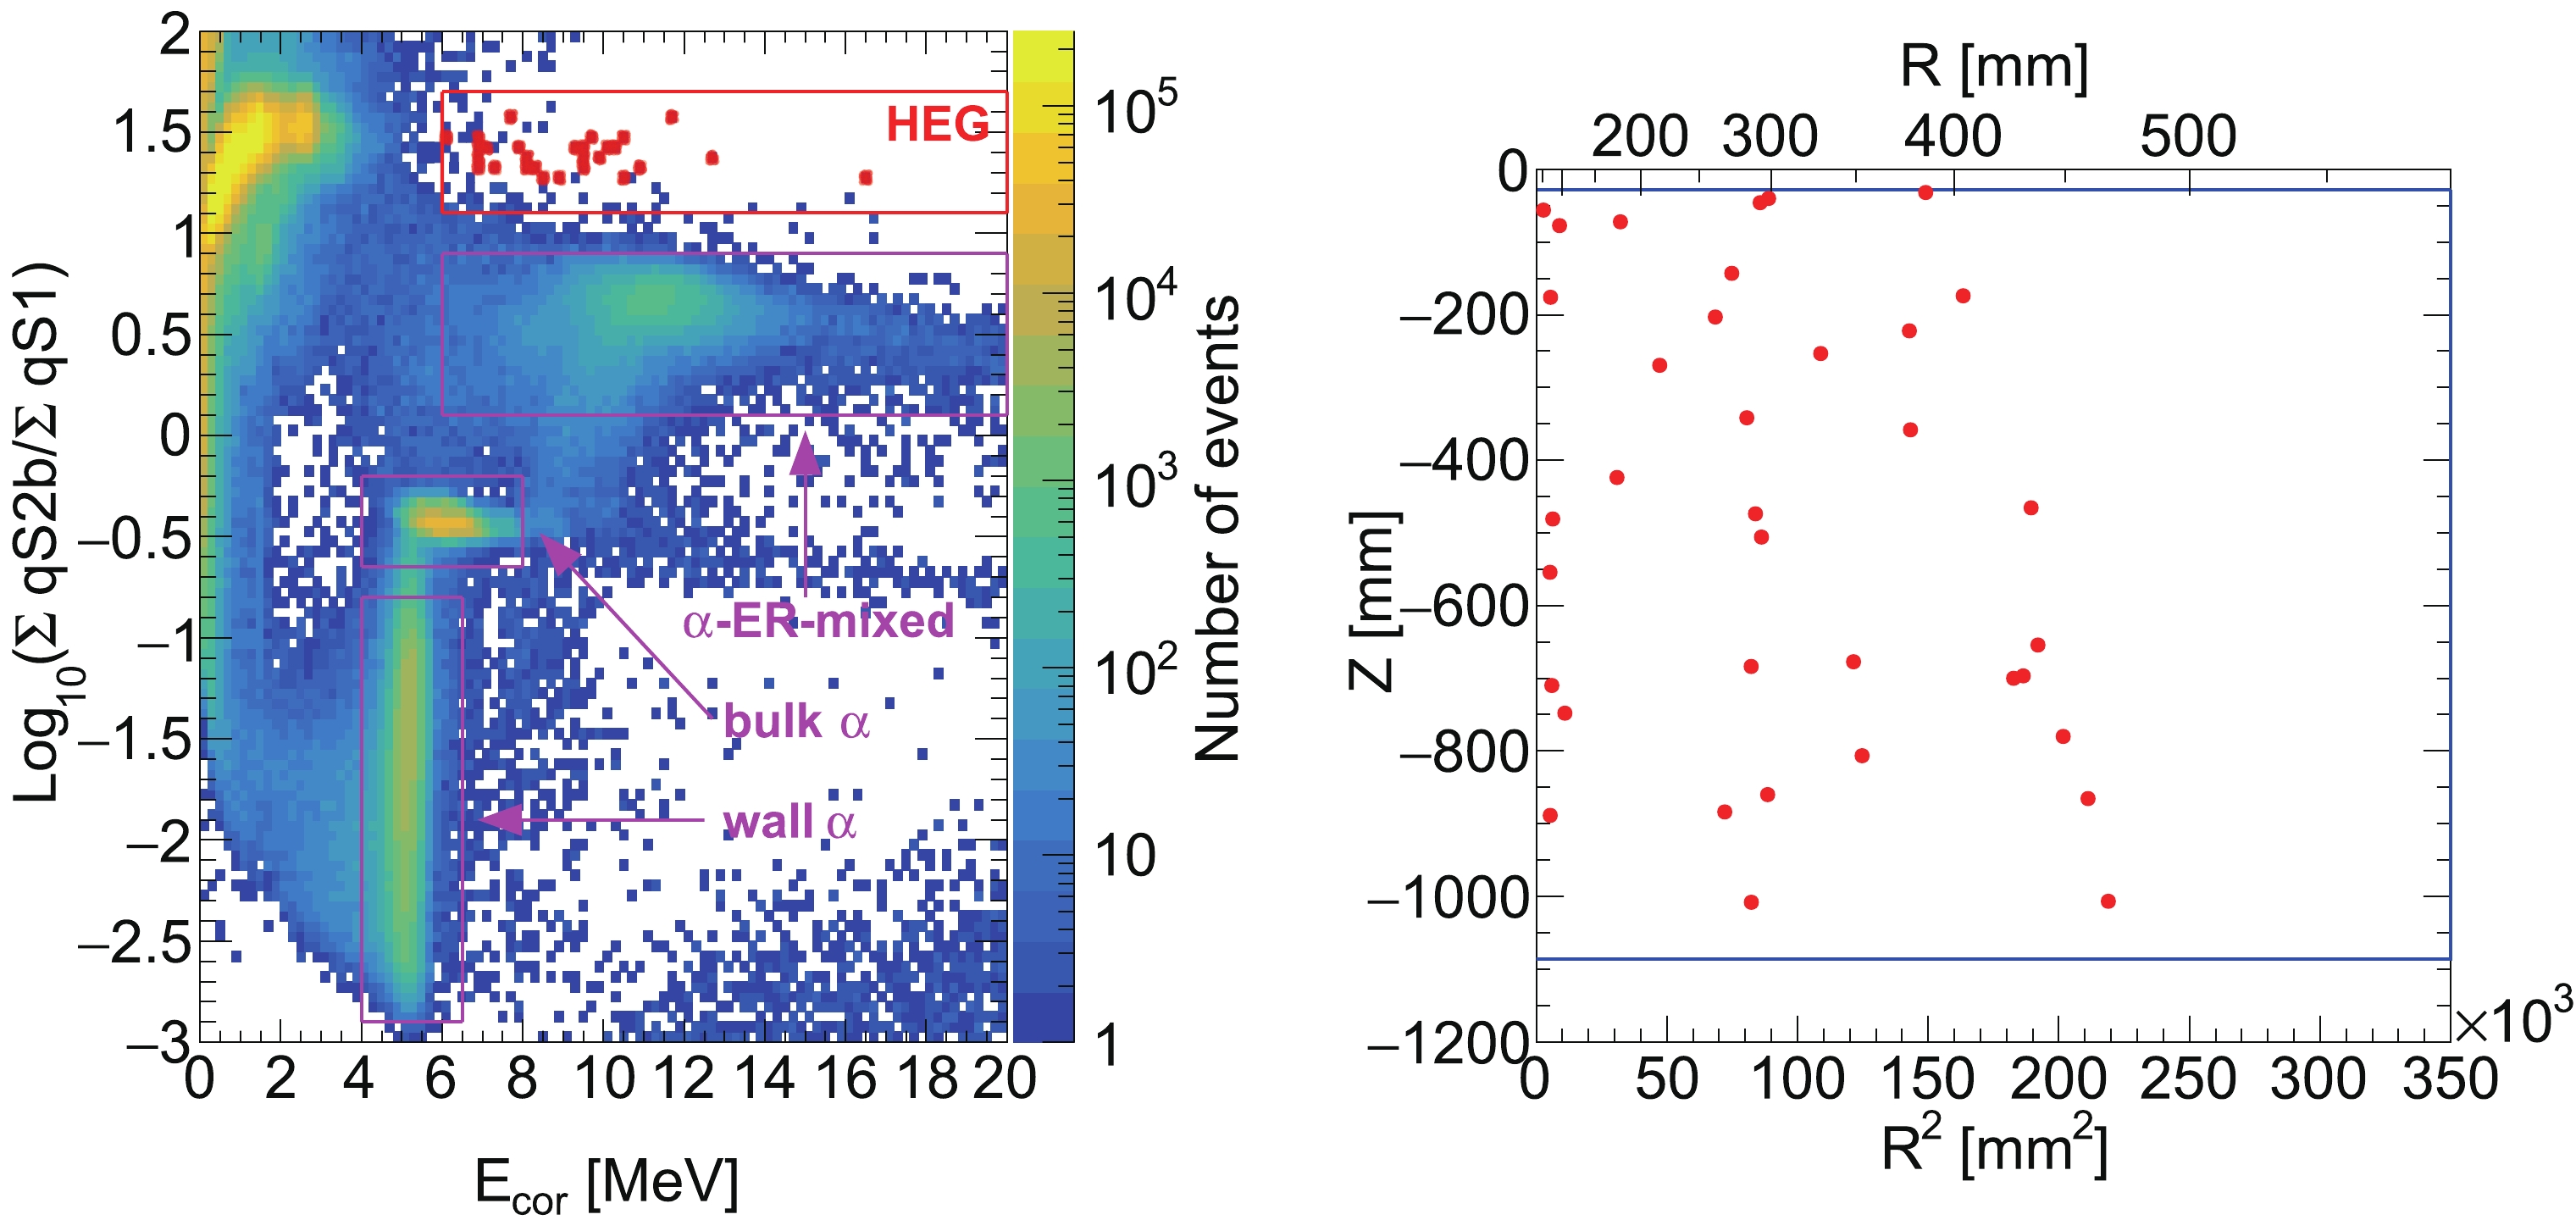
Figure 8. (color online) (left) Event distribution for
$ \log_{10}(\sum{{\rm q}S 2_{\rm b}}/\sum{{\rm q}S 1}) $ versus$ E_{\rm{cor}} $ in all PandaX-4T commissioning data before the BDT cut is applied. The red box indicates the HEG event selection region, and the magenta boxes represent the α relevant event selection regions. The HEG events after the BDT cut are highlighted by red dots. (right) Position distributions for the HEG events. Only the positions that are calculated from the largest$ S 1 $ and$ S 2 $ are shown. The blue solid lines indicate the EFV boundaries.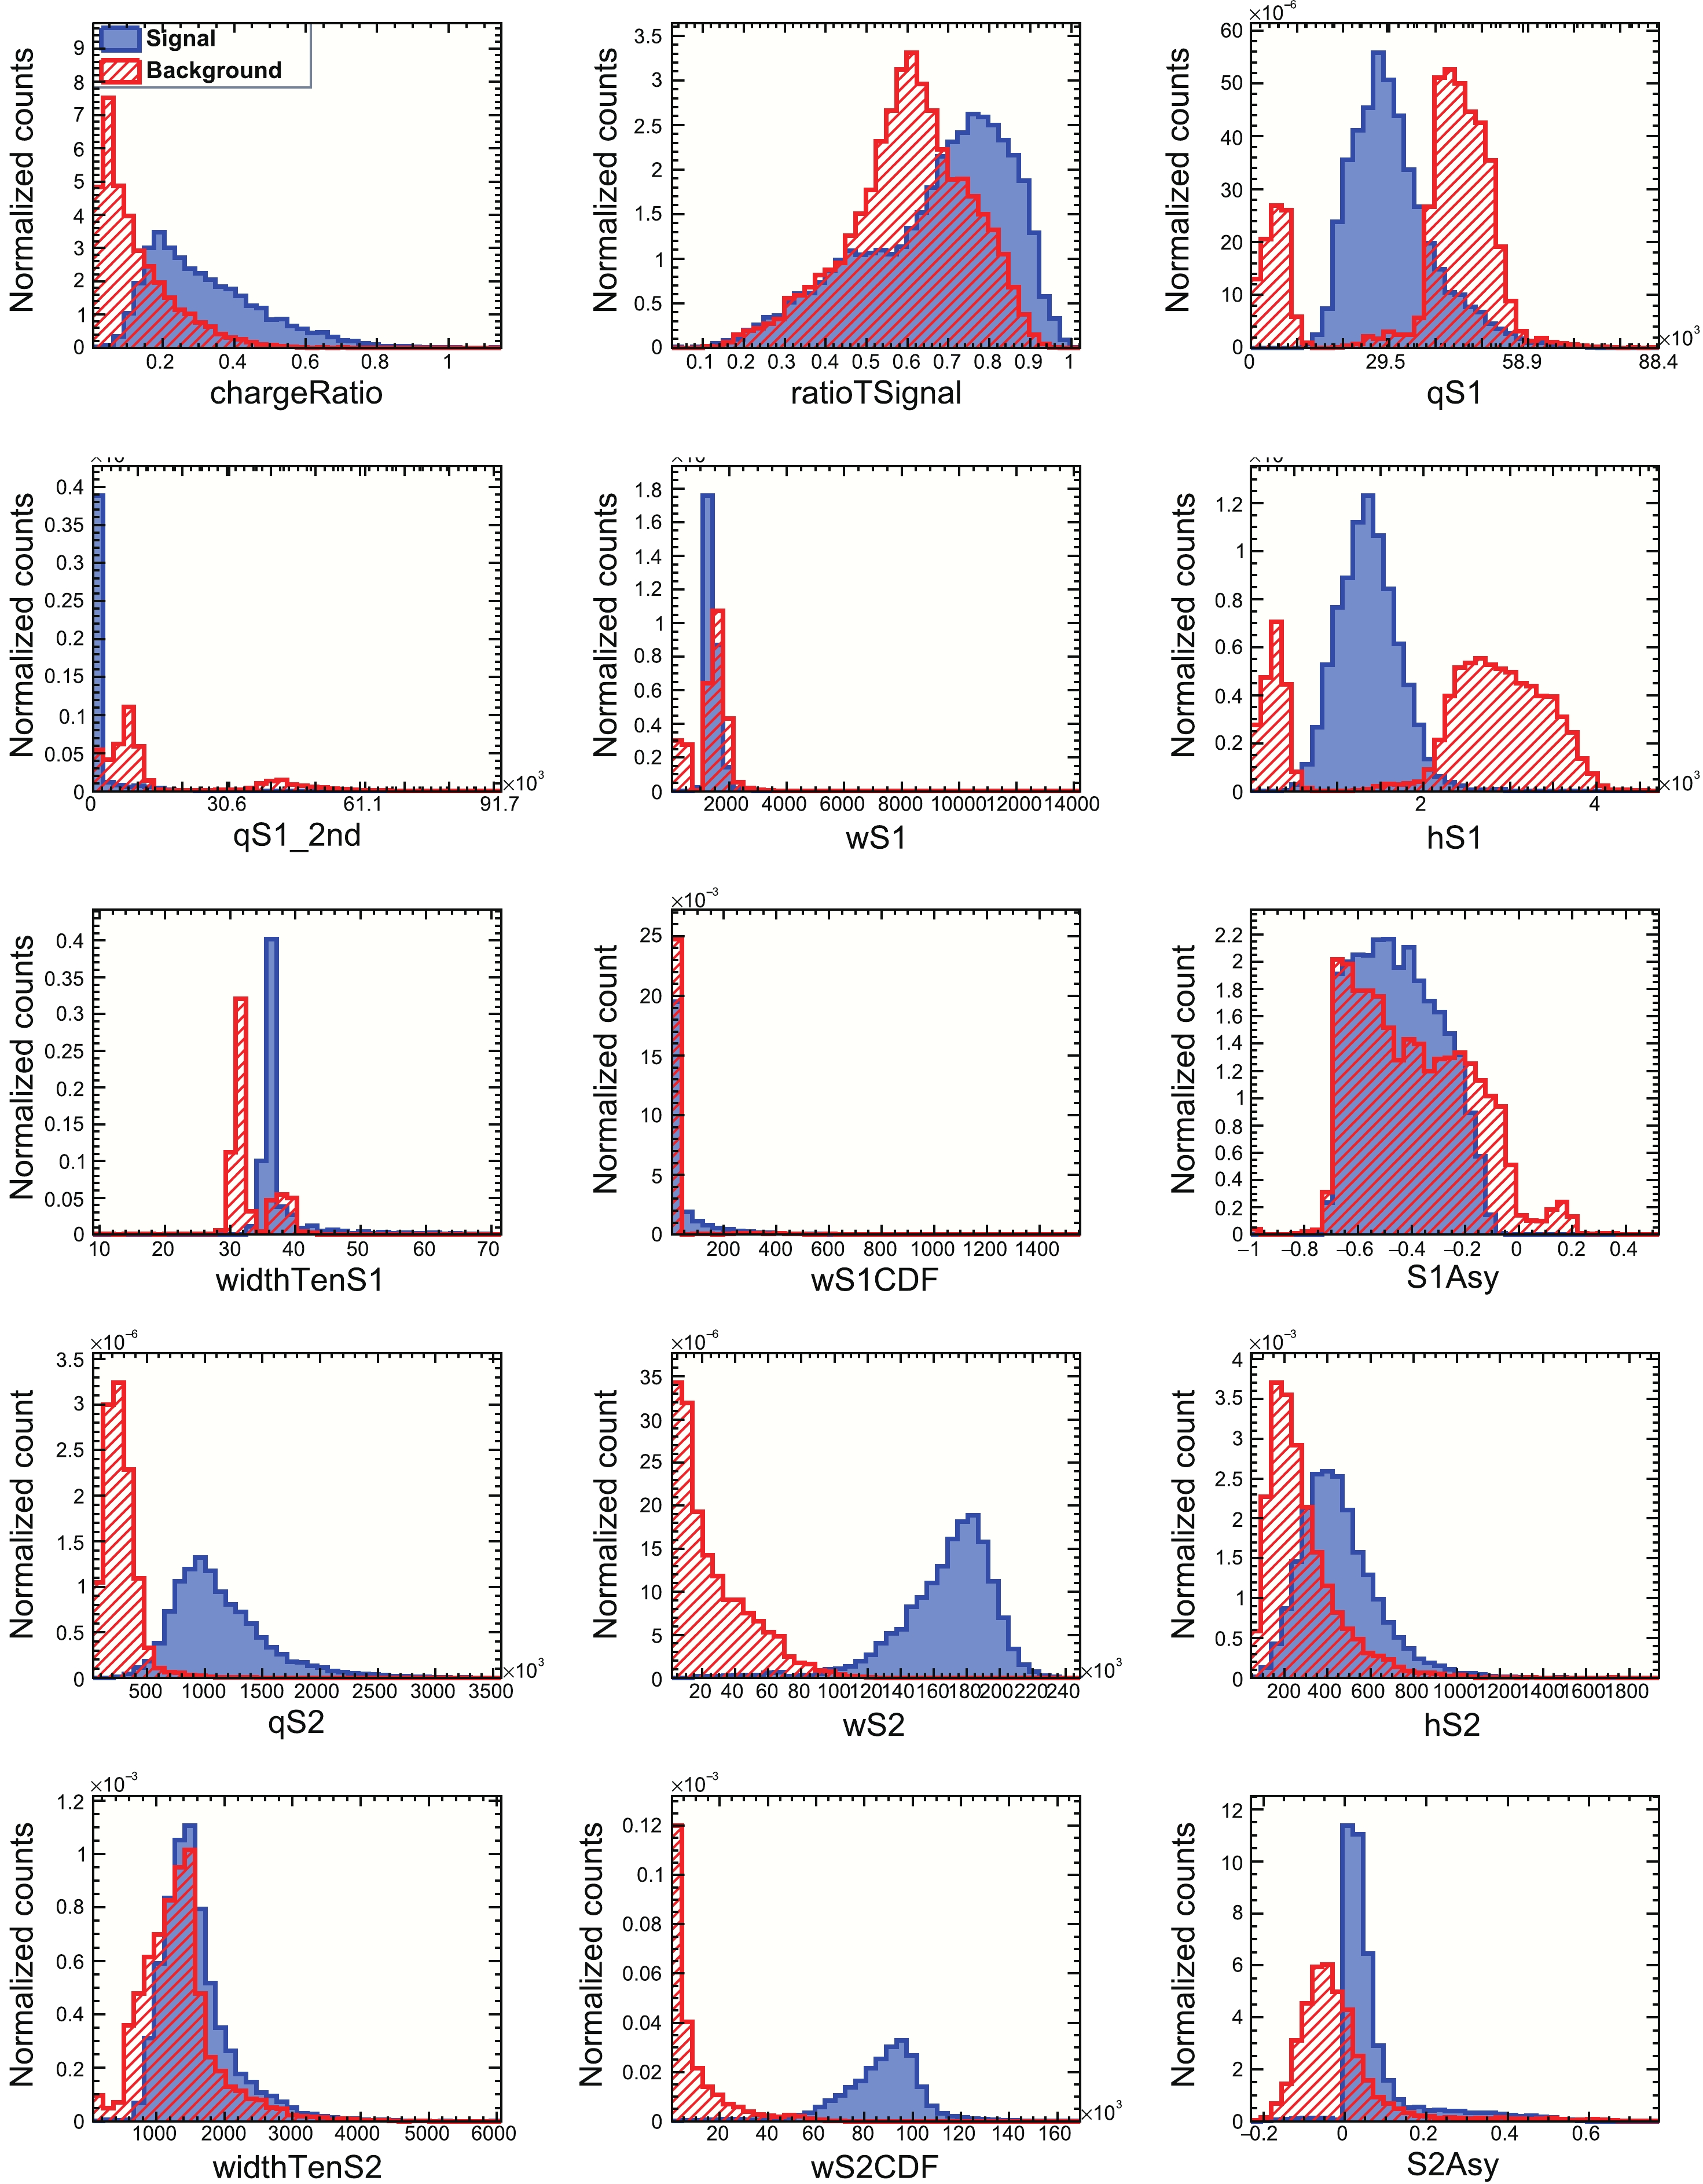
Figure 9. (color online) Distribution of the selected variables from HEG events (signal) and α-ER-mixed events (background). The HEG event distribution is shown in solid blue, and the α-ER-mixed event distribution is shown in hatched red.
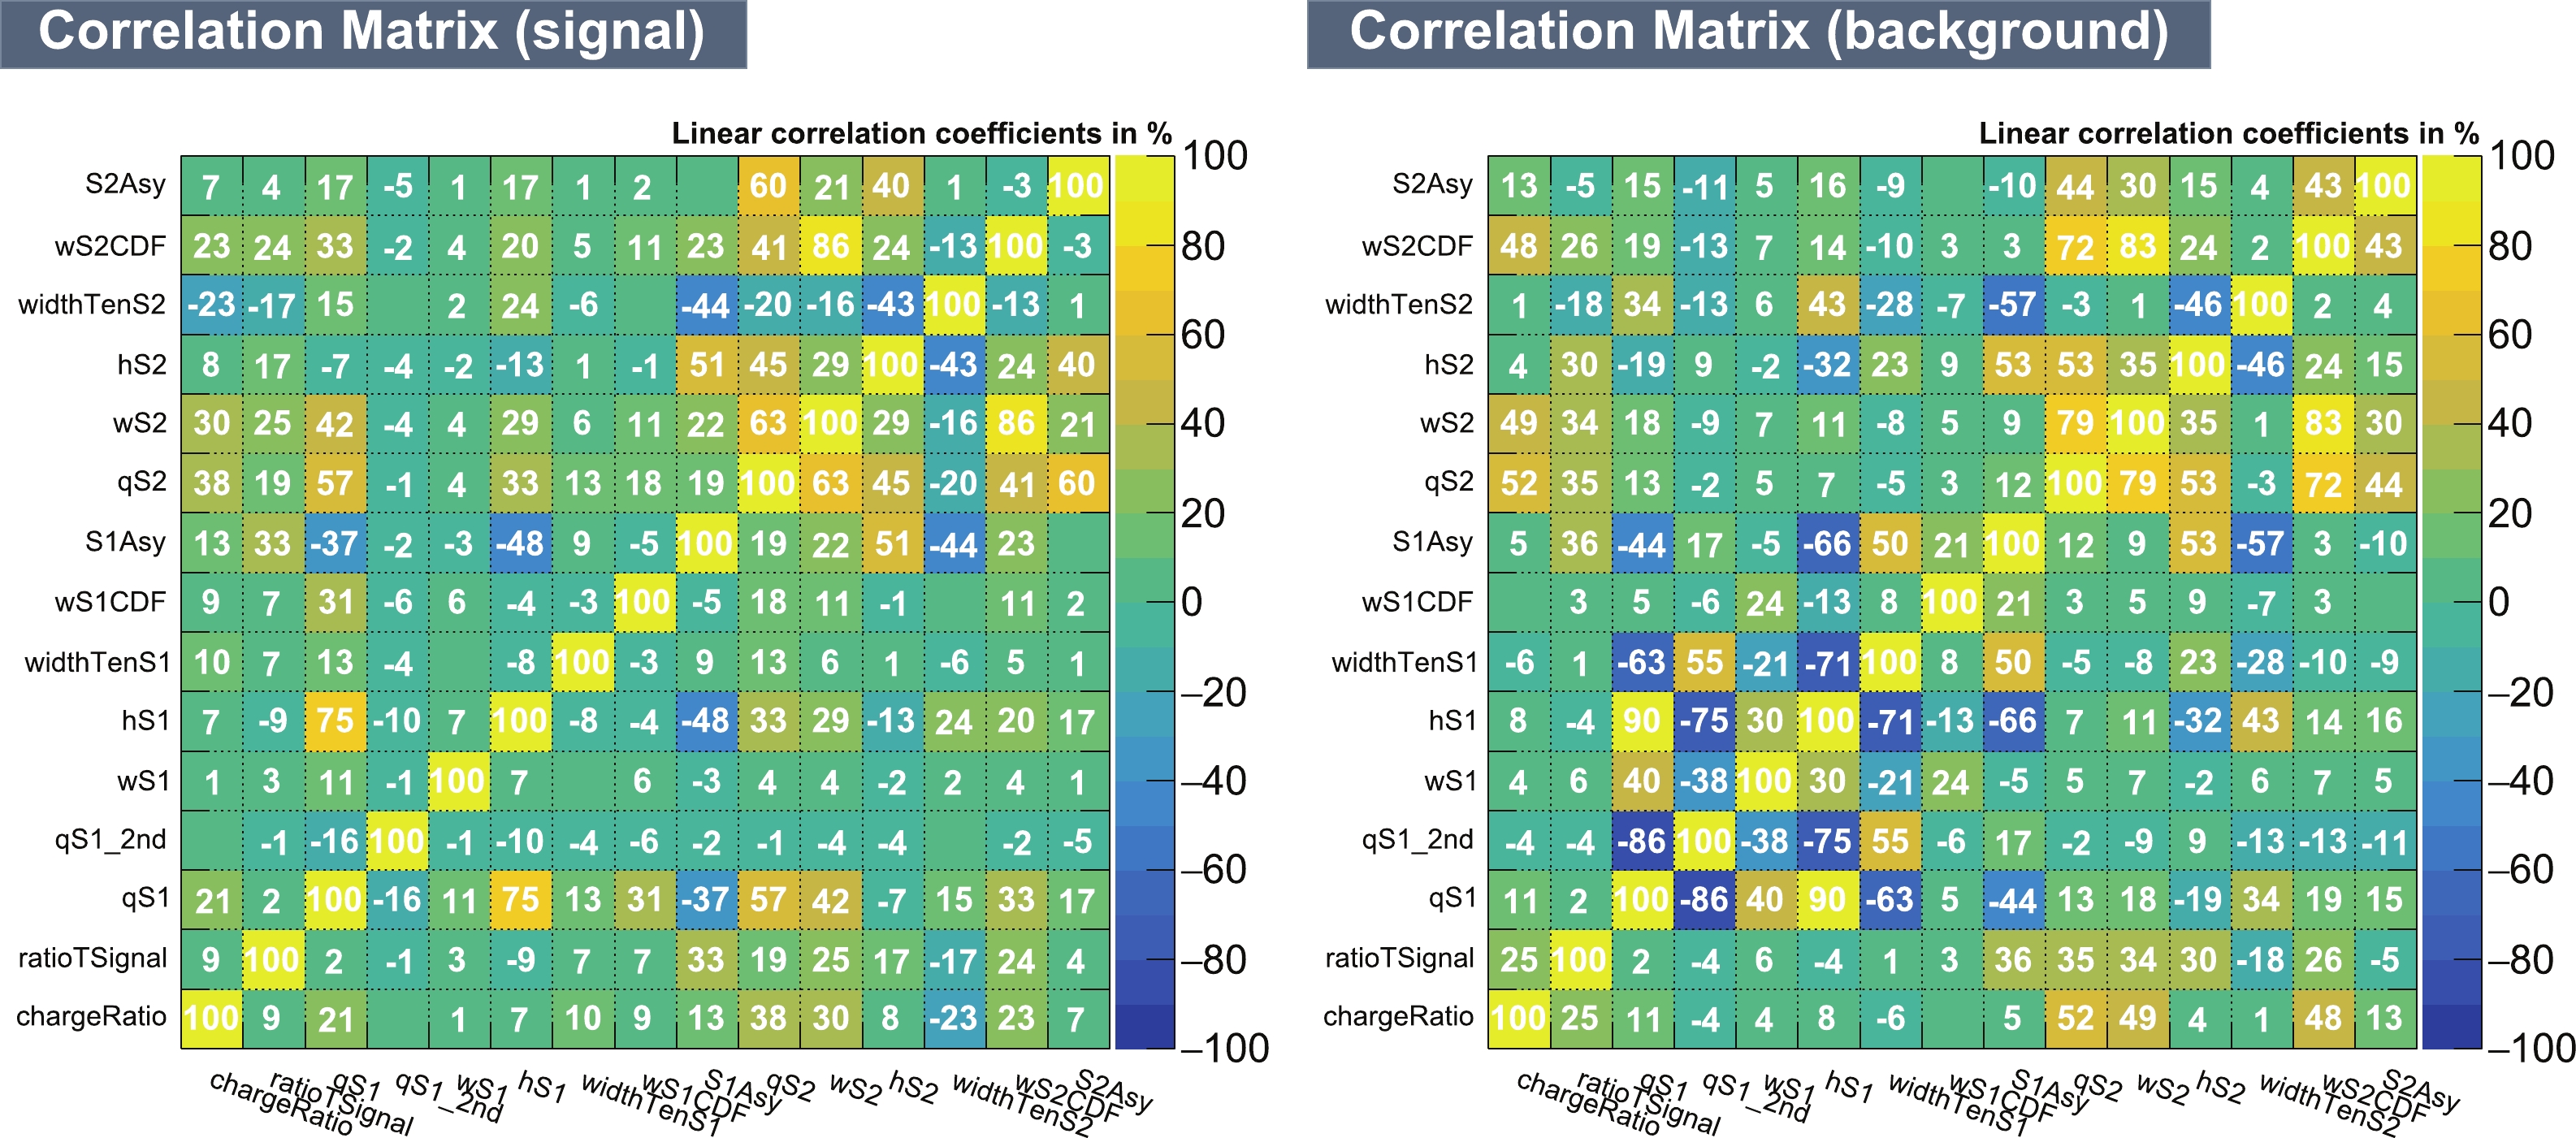
Figure 10. (color online) Correlation matrices of the signal and background samples.
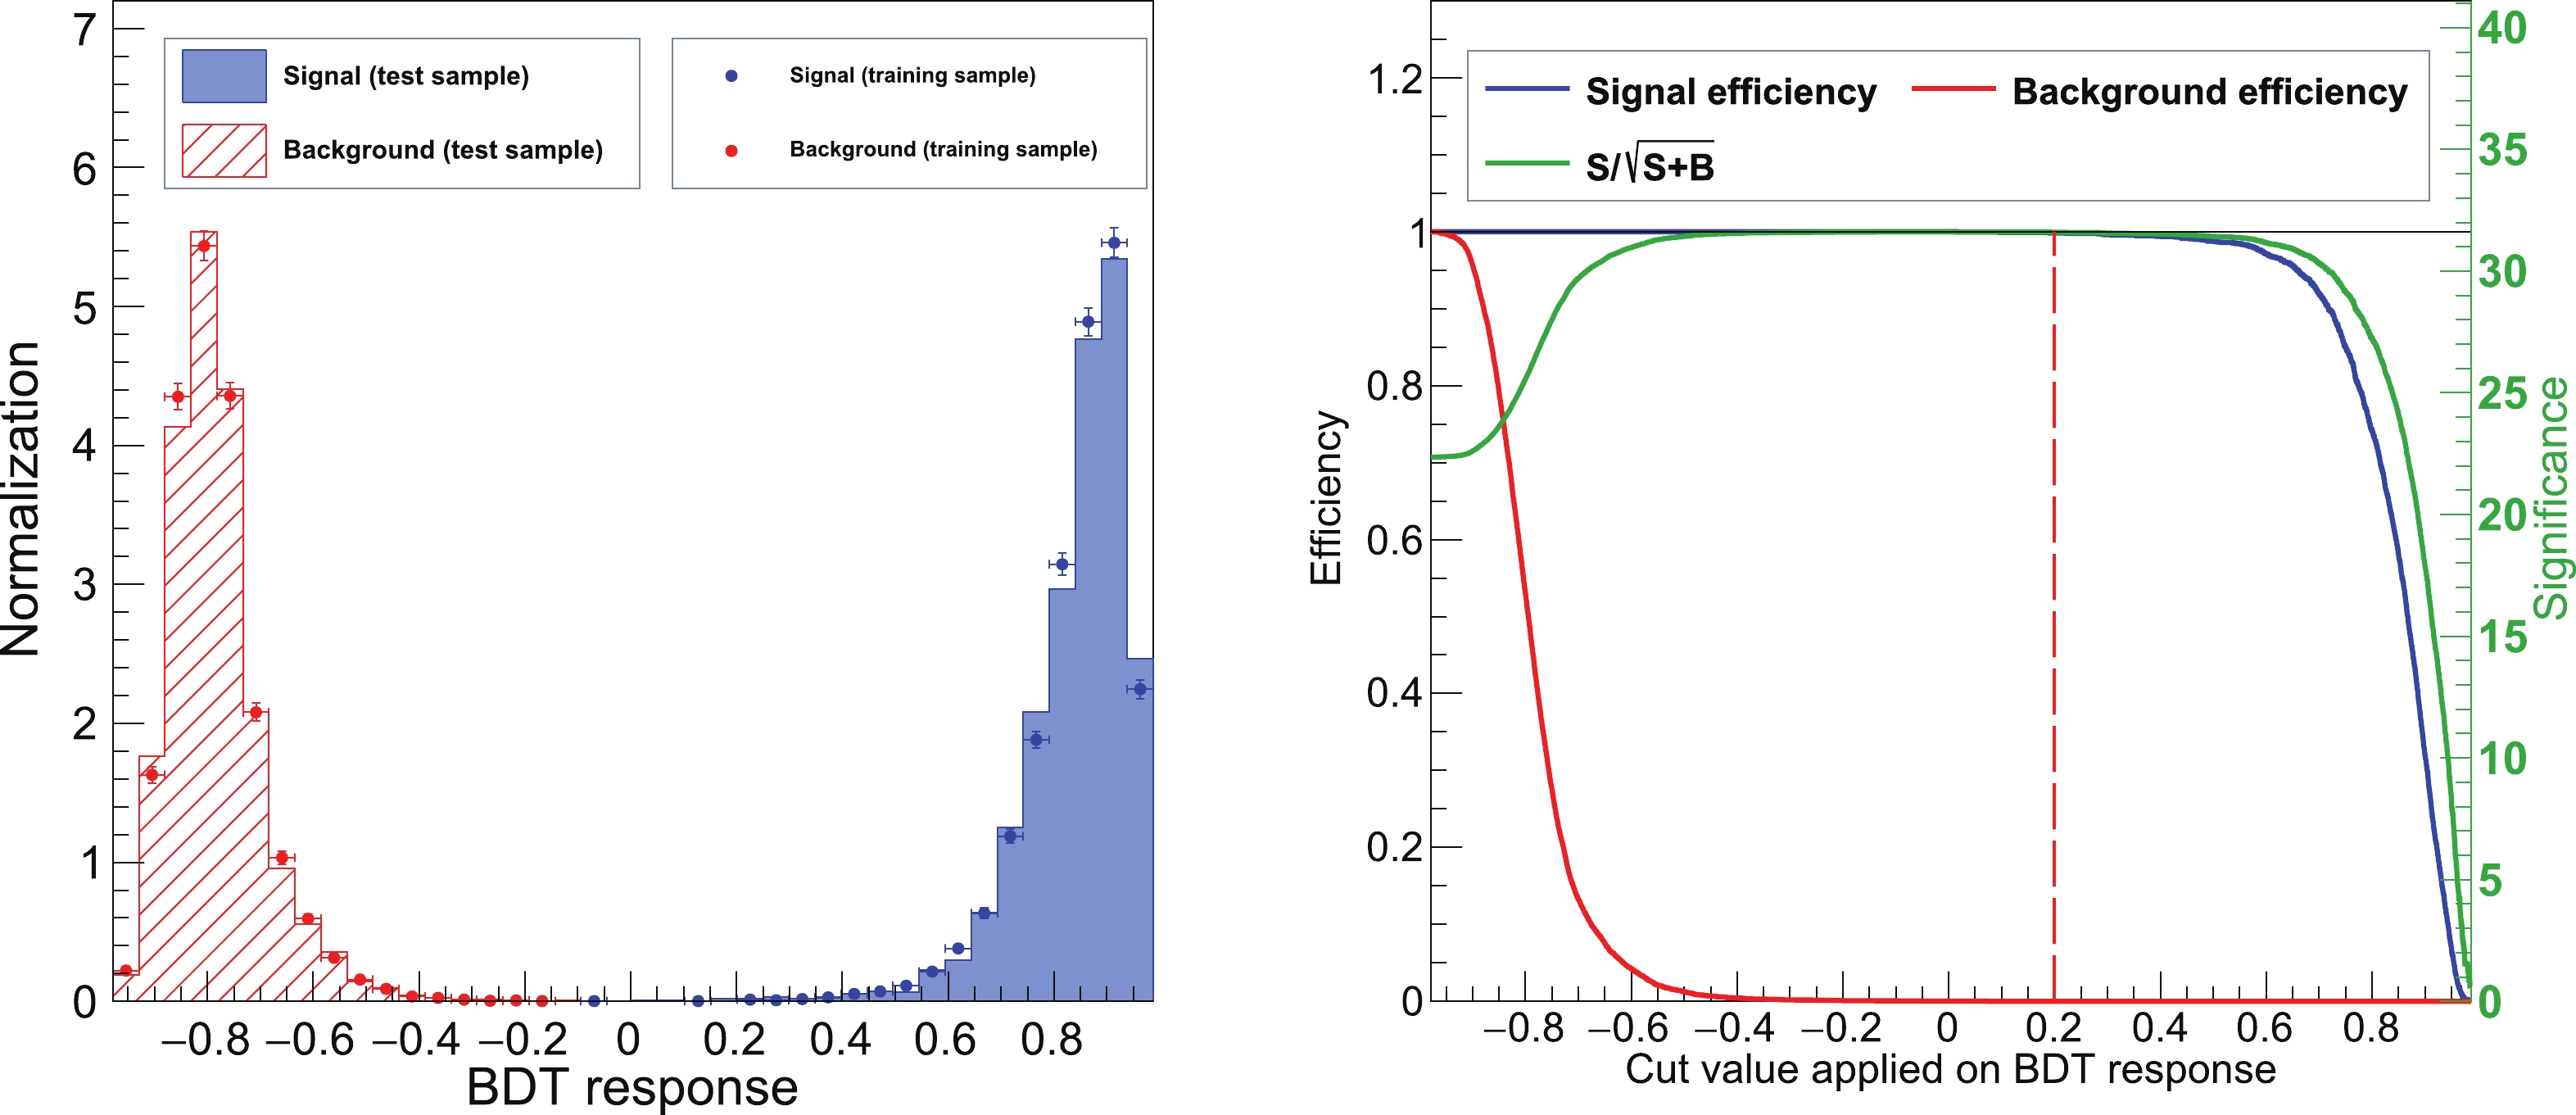
Figure 11. (color online) (left) Distribution of the TMVA discriminator for the HEG and α-ER-mixed event samples. (right) Signal efficiency, background efficiency, and discrimination significance
$ (S/\sqrt{S+B}) $ versus the BDT response cut values. The final BDT cut value is overlaid, as shown by the red dashed line.The PandaX-4T commissioning data event distribution for
$ \log_{10}(\sum{{\rm q}S2_{\rm b}}/\sum{{\rm q}S 1}) $ versus$ E_{{\rm cor}} $ is plotted in Fig. 8. Note that the electric field condition of the first two data sets in PandaX-4T commissioning data is different from that of other data sets. The corresponding charges of$ S 2 $ s in these two data sets are scaled for consistency, depending on the SEG$ \times $ EEE ratio in Ref [11]. In total, 102 high energy events are inside the HEG selection region. After the BDT cut is applied, only 36 HEG candidates survive, four of which are from data sets 1–2 and 32 of which are from data sets 3–5. The reconstructed position distribution of these HEG events is also shown in Fig. 8. Owing to the multiple-pulse S2 waveform and saturation effect, the reconstructed positions in the$ R^2 $ direction are biased. The statistical uncertainty for the HEG method is$ \pm\; 2 $ and ± 5.66 for data sets 1–2 and 3–5, respectively.$ R_{\rm MC} $ (HEG-to-SSNR) in different data sets are calculated based on MC simulation and listed in Table 4 (32.1 for a pure neutron in data sets 1–2, 160.2 for neutron-X in data sets 1–2, 30.3 for a pure neutron in data sets 3–5, and 126.1 for neutron-X in data sets 3–5). The systematic uncertainty on$ R_{\rm MC} $ (HEG-to-SSNR) originates from radioactivity measurement and simulation. Following the MSNR method, the measurement uncertainty on$ R_{\rm MC} $ (HEG-to-SSNR) is 19%, whereas the simulation uncertainty on$ R_{\rm MC} $ (HEG-to-SSNR) is only 5%, as shown in Table 3. The total systematic uncertainty on$ R_{\rm MC} $ (HEG-to-SSNR) is 20%. The predicted neutron-induced SSNR background events using the HEG data-driven method are 0.12 ± 0.076 (pure neutron in data sets 1–2), 1.06 ± 0.28 (pure neutron in data sets 3–5), 0.03 ± 0.01 (neutron-X in data sets 1–2), and 0.25 ± 0.07 (neutron-X in data sets 3–5) and are summarized in Table 6.Data sets Sets 1–2 Sets 3–5 Total Average Pure neutron MC method 0.12 ± 0.06 0.62 ± 0.32 0.74 ± 0.38 0.93 ± 0.46 MSNR method 0 ± 0.26 0.60 ± 0.42 0.60 ± 0.68 HEG method 0.12 ± 0.07 1.06 ± 0.28 1.18 ± 0.35 Neutron-X MC method 0.02 ± 0.01 0.15 ± 0.08 0.17 ± 0.09 0.22 ± 0.11 MSNR method 0 ± 0.05 0.14 ± 0.10 0.14 ± 0.15 HEG method 0.03 ± 0.01 0.25 ± 0.07 0.28 ± 0.08 Table 6. Predicted neutron background events in PandaX-4T commissioning data in the unit of counts. In a conservative manner, the uncertainties in the "Total" column are summations of the uncertainties in each data set because they are not completely independent. Moreover, the final uncertainties in the "Average" column are assumed to be 50%.
-
In summary, a robust neutron background estimation for PandaX-4T commissioning data is implemented based on MC simulation and neutron relevant feature events. The MC simulation method is conventional and straightforward, while the data-driven methods further make use of the feature events, MSNR, and HEG in the data. These data-driven results and MC estimations agree within uncertainties. Their weighted averages give the neutron backgrounds, i.e.,
$ 0.93 \pm 0.46 $ for pure neutron and$ 0.22 \pm 0.11 $ for neutron-X.Compared with previous work [12, 16], this analysis provides more credible results. Considering other backgrounds [11], this result shows that the neutron background is subdominant and well controlled in the PandaX-4T experiment.
-
We are grateful for support from the Double First Class Plan of Shanghai Jiao Tong University and the sponsorship of the Chinese Academy of Science Center for Excellence in Particle Physics (CCEPP), the Hongwen Foundation in Hong Kong, the Tencent Foundation in China, and the Yangyang Development Fund. Finally, we thank the CJPL administration and the Yalong River Hydropower Development Company Ltd. for indispensable logistical support and other help.
Neutron-induced nuclear recoil background in the PandaX-4T experiment
- Received Date: 2022-06-14
- Available Online: 2022-11-15
Abstract: Neutron-induced nuclear recoil background is critical to dark matter searches in the PandaX-4T liquid xenon experiment. In this study, we investigate the features of neutron background in liquid xenon and evaluate its contribution in single scattering nuclear recoil events using three methods. The first method is fully based on Monte Carlo simulations. The last two are data-driven methods that also use multiple scattering signals and high energy signals in the data. In the PandaX-4T commissioning data with an exposure of 0.63 tonne-year, all these methods give a consistent result, i.e., there are


 DownLoad: