


 Abstract
 HTML
HTML Reference
 Related
 PDF
PDF


-
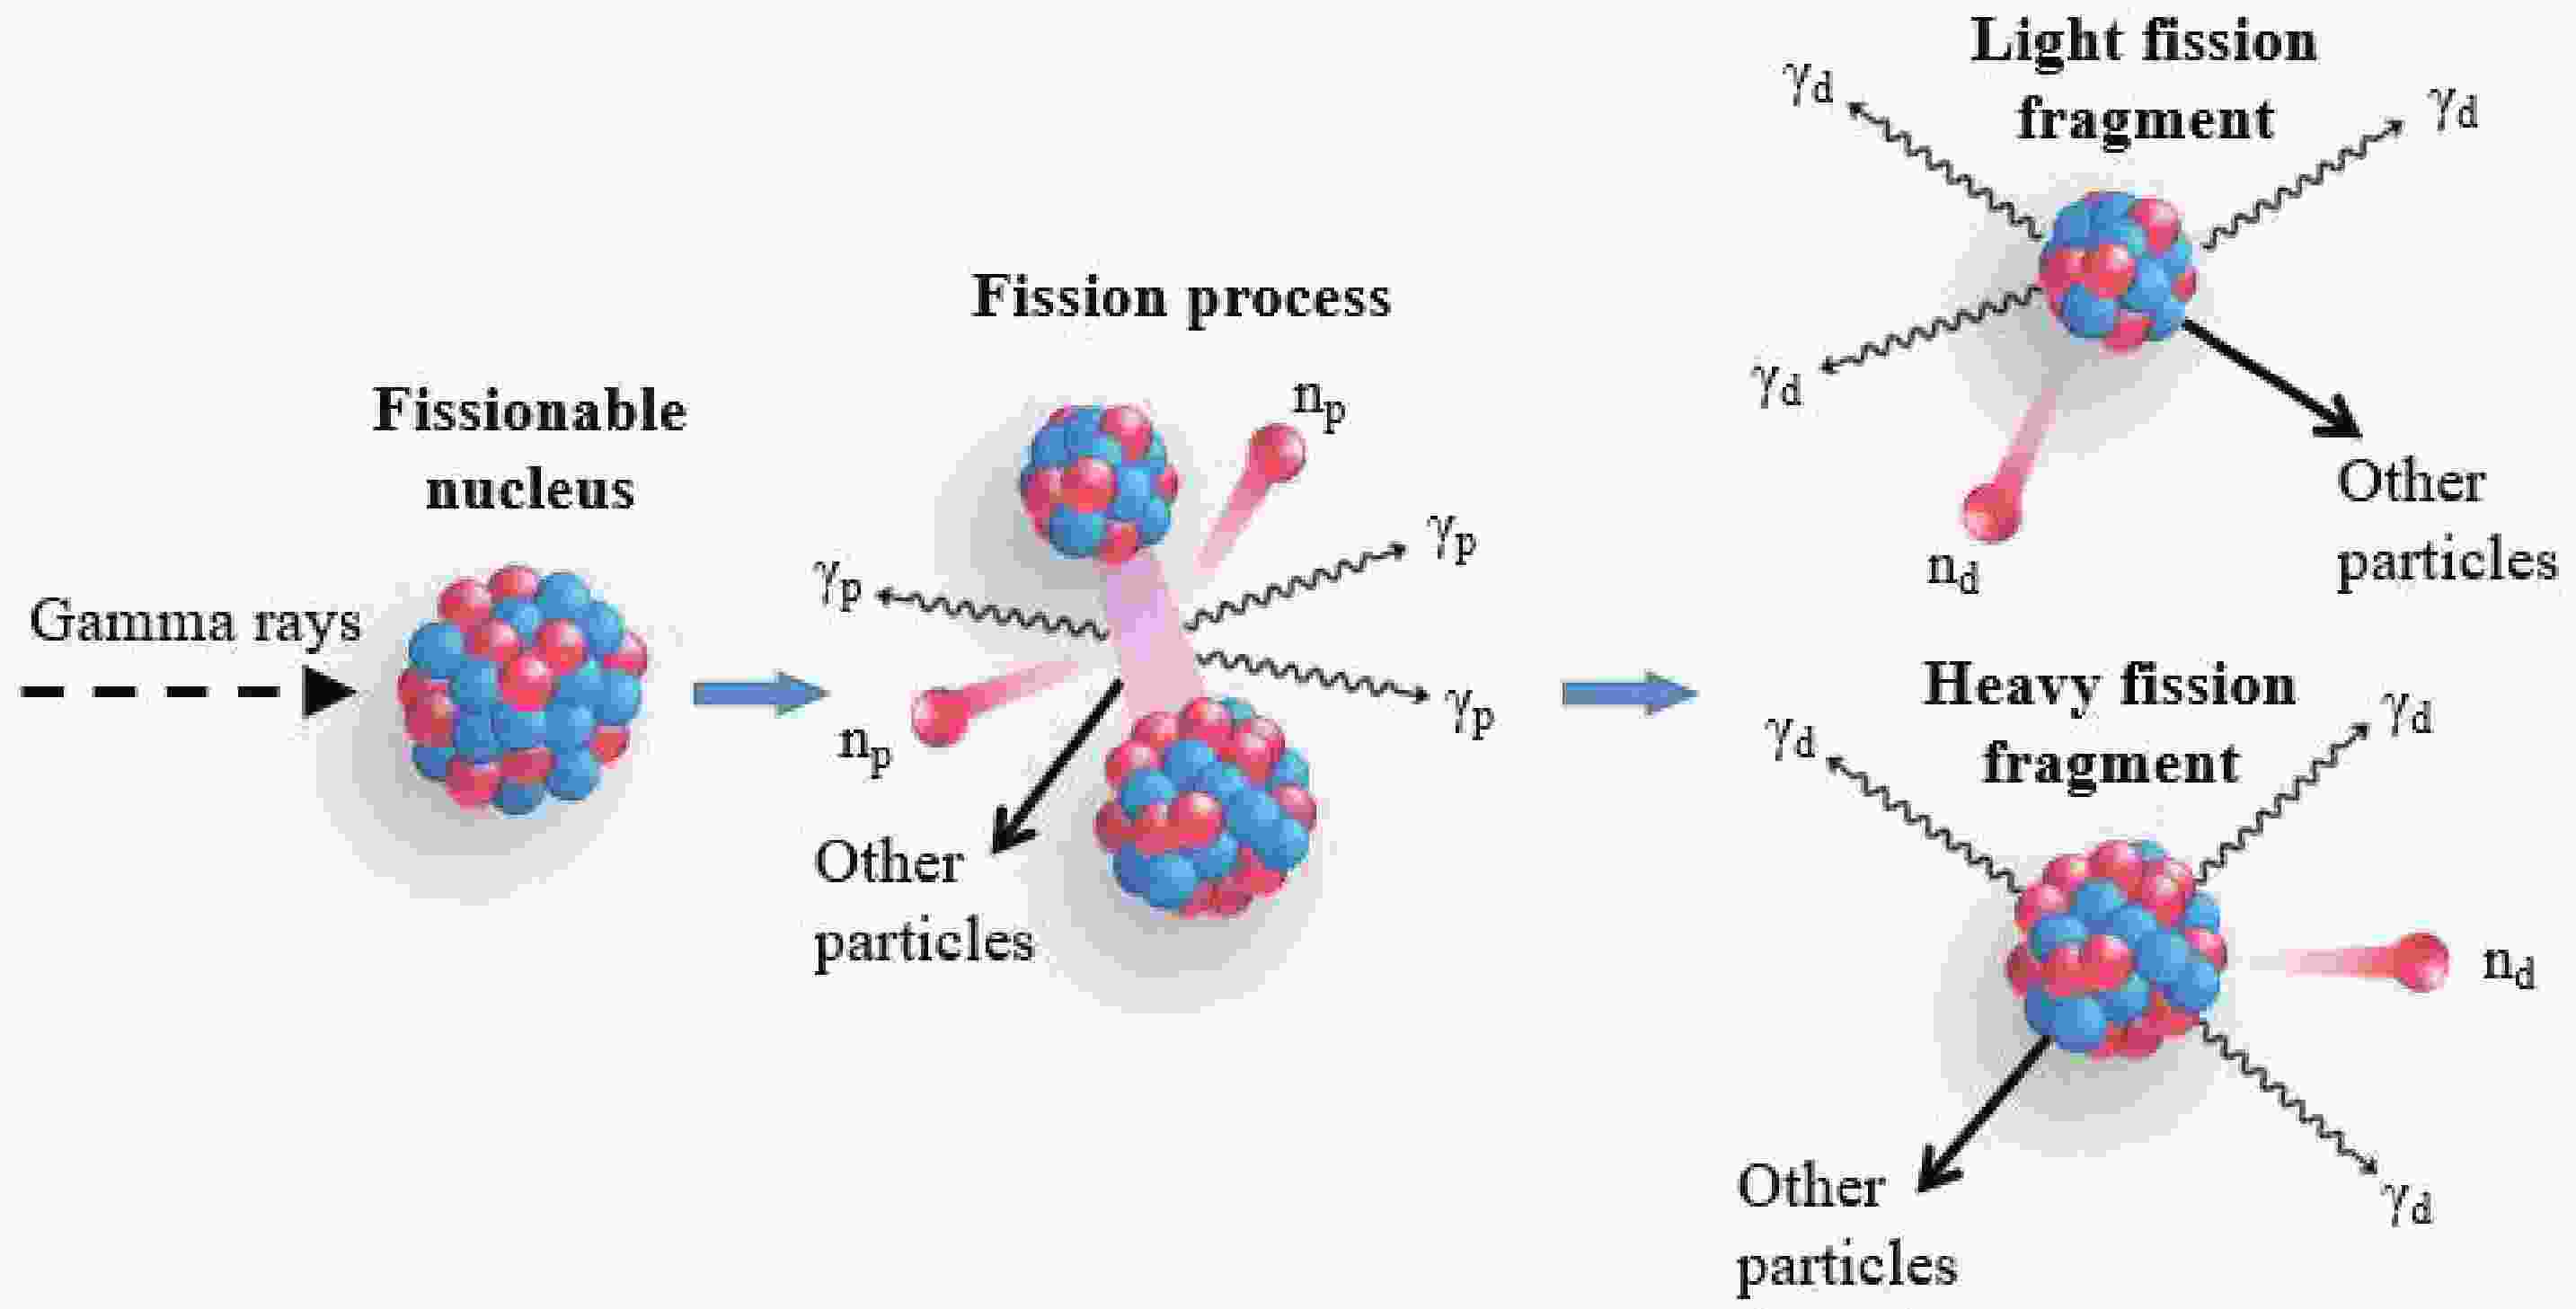
Photofission of actinides is the process in which a heavy nucleus disintegrates into two fragments of similar masses after absorbing an energetic photon. Although the photo-induced fission has been studied for a few decades, it continues to be of great interest. The photon-induced fission and subsequent particle emissions (see Fig. 1) provide a large number of photofission observables such as mass yield distributions (MYD), isobaric charge distributions (ICD), and multiplicity and energy distributions for prompt and delayed neutrons and γ rays. Hereinafter, the prompt neutrons are simply referred to as np , and the prompt γ rays as γp. The investigation of these observables is of paramount importance not only to obtain a better understanding of the fission mechanism itself but also for a variety of current or emerging applications. These applications include neutron-rich exotic nuclei production [1], medical radioisotopes production [2–4], reprocessing of nuclear waste [5], and nuclear safeguards and inspection [6–8]. They generally require a comprehensive knowledge of photofission, especially in the absence of experimental data, which characterize the photofission process; however, at present, they are not fully available. In addition, photofission observables are regarded as a necessity for the development of a new IAEA Photonuclear Data Library [9].

Figure 1. (color online) Illustration of the photofission process and the emission of associated particles (neutrons and γ rays). The fissionable nucleus splits into two large fragments (light and heavy fission fragments) following the absorption of an incident photon. Two or three np and several γp are emitted during a photofission event or within a very short time afterward, generally a few nanoseconds. A few seconds after the photofission, beta-delayed radiations are further emitted. These radiations include delayed neutrons and γ rays.
For the description of fission MYD, various systematic neutron models have been developed in the framework of the multi-modal fission model. A sum of several (3–7) Gaussians is used to describe the MYD of fission fragments. However, the extraction of the Gaussian parameters depends on the availability of experimental data. Furthermore, most of the Gaussian fitting results are limited to a fixed incident photon energy (for example, the average excitation energy of 13.7 MeV) [10] or a specific compound nucleus [11, 12]. The dependency of Gaussian parameters on the incident photon energy and nucleon composition of the fissionable nucleus have not been established. In order to provide a general description of MYD from photofission, three systematics neutron models, i.e., the Fu-cheng model [13], the Gorodisskiy model [14] and the Mills model [15], have been investigated for the actinide isotopes, which do not need to fit with experimental data [16]. It has also been shown that these neutron-induced models cannot reproduce the total set of experimental photofission data because of the neutron binding energy [16]. To predict the photofission ICD, an empirical parametrization was proposed in the particular case of 238U(γ, f) [17]. Such parametrization combines the five-Gaussian MYD with the most probable charge model to achieve the charge distribution of photofission fragments. Since these empirical parameters highly depend on numerous reliable experimental data from 238U(γ, f) reactions at relative low energies, this parametrization can hardly be applied in other photofission cases that lack experimental data. Driven by the demand of nuclear material inspection, significant attention has been paid to the studies of neutron and γ-ray emissions from individual fission reactions [6]. More recently, the Lawrence Livermore National Laboratory Fission Library 2.0.2 was developed successfully to describe the particle emissions from photofission [18]; however, it cannot provide information about fission fragments. GEF [19] and FIPRODY [20] are regarded as two general fission models for predicting the manifold fission observables in various fission systems. However, their predictive capability for photofission fragment yield has not been verified [17].
The general framework presented in this study aims at describing the photofission observables for actinides (for example 232Th, 235, 238U and 240Pu) over the giant dipole resonance (GDR) region. This is driven by the fact that the available experimental data for photofission observables are limited, and the existing models and programs have been mainly developed for neutron-induced fission processes. We performed theoretical evaluations on photofission observables by applying Bohr hypothesis [21] to neutron-induced fission models and empirical models. In this study, the construction of the general framework is introduced in detail, and extensive benchmarks are performed against the limited experimental data, which validate our proposed framework for predicting fragmentation and prompt emission characteristics from photofissions on actinides below excitation energy
$ {E}^{*} $ = 30 MeV. In the current study, the MYD of photofission for 232Th, 235, 238U and 240Pu isotopes are calculated. The ICD calculations are performed for 232Th and 238U isotopes, and the multiplicity and spectral distributions of prompt particles are evaluated for 235U and 240Pu isotopes. By utilizing this general framework, we further predicted the productions of neutron-rich exotic nuclei and the emissions of prompt particles from 232Th(γ, f) and 238U(γ, f). -
The framework is mainly constructed on the basis of systematic neutron models and empirical models considering the Bohr hypothesis [21], which state that for a given excitation energy, spin, and parity, the decay of a compound nucleus is independent of its formation. According to the Bohr hypothesis, as long as the excitation levels are the same, the compound nuclei would undergo fission in a certain way but loses memory about its formation. The compound nucleus
$ _{{{Z}_{cn}}}^{{{A}_{cn}}}{{X}^{*}} $ formed by capturing either a neutron or a photon can be expressed as follows:$ \left\{\begin{array}{c}n+_{{{Z}_{cn}}}^{{{A}_{cn}}-1}X\to _{{{Z}_{cn}}}^{{{A}_{cn}}}{{X}^{*}}\\ \gamma +_{{{Z}_{cn}}}^{{{A}_{cn}}}X\to _{{{Z}_{cn}}}^{{{A}_{cn}}}{{X}^{*}}\end{array}\right.. $

(1) In the neutron-induced fission, the
$ _{{{Z}_{cn}}}^{{{A}_{cn}}-1}X $ nucleus first captures the neutron with an energy$ {E}_{n} $ and then forms an excited$ _{{{Z}_{cn}}}^{{{A}_{cn}}}{{X}^{*}} $ nucleus. In the case of photofission, in order to induce an identical compound nucleus ($ _{{{Z}_{cn}}}^{{{A}_{cn}}}{{X}^{*}} $ ), the photon excitation energy,$ {E}^{*} $ , should be satisfied by$ {E}^{*}-{S}_{n}\approx {E}_{n}, $

(2) where
$ {S}_{n} $ is the neutron separation energy of$ _{{{Z}_{cn}}}^{{{A}_{cn}}}X $ . The reduction of$ {S}_{n} $ allows to account for the extra energy that the incident neutron brings in when it is captured by$ _{{{Z}_{cn}}}^{{{A}_{cn}}-1}X $ . According to Eqs. (1) and (2), one can readily modify neutron-induced fission models based on the Bohr hypothesis to make them suitable for describing photofission process.In order to obtain the photofission MYD, we introduce three systematic neutron models [13–15] that consider the Bohr hypothesis, namely Bohr-substitution F, G, and M models. It should be noted that the shell effects are not considered in these Bohr-substitution models since they have been incorporated into the systematic neutron models. In order to predict the photofission ICD, the liquid-drop (LD) model [22] and the systematic model [23] are then implemented into the framework. Finally, particle emissions from the photofission of actinides are depicted with empirical models [24–28]
incorporating the Bohr hypothesis. In the following subsections, we introduce in detail these models for describing the observables MYD, ICD, and np and γp. -
In order to predict the MYD of neutron-induced fission fragments, considerable efforts have been made to develop the systematic neutron models on the basis of a multi-Gaussian model. Among these, the Fu-cheng model [13], Gorodisskiy model [14] and Mills model [15] are representative, and the MYD can be described in terms of a two-modal (symmetric and asymmetric) approximation. Although these models can reproduce well the experimental MYD from the neutron-induced fissions, they cannot properly describe those experimental data for the photofission of actinide nuclei, as discussed above. In our case, we use Bohr-substitution models to describe the MYD in a simple way, so as to reproduce the overall features of the experimental photofission data. In the Bohr-substitution G model, the MYD of heavy fragments are described as a sum of Gaussian distributions for symmetric and asymmetric fission modes [14]:
$ {Y}_{H}=\frac{1}{\sqrt{2\pi }}\left[\frac{{Y}_{s}\exp(-{{u}_{s}}^{2}/2)}{{\sigma }_{s}}+\frac{{Y}_{a}\exp(-{{u}_{a}}^{2}/2)}{{\sigma }_{a}}f\left({u}_{a}\right)\right]. $

(3) Here,
$ {Y}_{s} $ and$ {Y}_{a} $ are the relative contributions of the symmetric and asymmetric modes of fission,${\sigma }_{s}= 0.031{(A}_{cn}-1)\sqrt[4]{{(E}^{*}-{S}_{n})}/{\left(90.54-1.9{{Z}_{cn}}^{2}/{A}_{cn-1}\right)}^{1/2}+9.64$ and${\sigma }_{a}= {(A}_{cn}-1\left)\right({Z}_{cn}-73)\left[0.074+0.0296\sqrt[4]{{(E}^{*}-{S}_{n})}\right]/{Z}_{cn}$ are the mass yield variances for symmetric and asymmetric fission modes, respectively,$ {S}_{n} $ is the neutron binding energy,$ {Z}_{cn} $ and$ {A}_{cn} $ are the charge and mass number for the compound nucleus, respectively,$ f\left(u\right)=1-{\gamma }_{1}(u/2- {u}^{3}/6)+ {\gamma }_{2}({u}^{4}/24-{u}^{2}/4+1/8) $ is the Charlier’s distribution with$ {\gamma }_{1} $ and$ {\gamma }_{2} $ being the coefficients of dissymmetry and excess of the MYD for asymmetric fission (see Table 1 of Ref. [14]),$ {u}_{i} $ is defined as$ \left(A-{A}_{i}\right)/{\sigma }_{i} $ (i = s, a), where$ {A}_{s} $ and$ {A}_{a} $ are the average mass of heavy symmetric and asymmetric fission fragments, respectively.$ {A}_{s}=\left({A}_{cn}-1\right)/2 $ .$ {A}_{a} $ can be expressed as$ \begin{array}{*{20}{l}}{A}_{a}=\left\{\begin{array}{*{20}{l}}54\dfrac{{A}_{cn}-1}{{Z}_{cn}}&{Z}_{cn}=90~~\text{or}~~91\\ 28.6\dfrac{{A}_{cn}-1}{{Z}_{cn}}+0.708{Z}_{cn}&{Z}_{cn}\ge 92\end{array}\right.. \end{array} $

(4) To solve Eq. (3), one should obtain the exact expressions for
$ {Y}_{a} $ and$ {Y}_{s} $ . According to Ref. [14],${Y}_{a}= 200{\left(\delta +2\right)}^{-1}$ and$ {Y}_{s}=200-2{Y}_{a} $ . Here, δ can be obtained from$\begin{aligned}[b]\delta =&1.244\sqrt[4]{({E}^{*}-{S}_{n}})\left\{1-\exp\left[-0.0027{\left(\left|{E}^{*}-{S}_{n}-5.7\right|\right)}^{3/2}\right]\right\} \\& \times \left[1+\frac{100}{\sqrt{{E}^{*}-{S}_{n}}}\left(\frac{{Z}_{cn}}{{A}_{cn}-1}-0.4\right)\right]. \end{aligned} $

(5) Similar to heavy fragments, the MYD of light fragments can be readily obtained from
$ {Y}_{L\left(A\right)}={Y}_{H({A}_{cn}-A)} $ . For a given mass number A, the total MYD (per 100 photofission events) is$ Y\left(A\right)={Y}_{L}+{Y}_{H} $ . Similarly, the expressions of$ Y\left(A\right) $ can be obtained from the Bohr-substitution F and M models. The details are presented in Appendix A. -
Once
$ Y\left(A\right) $ is figured out according to Eq. (3), the independent yield of the photofission fragment with mass A and charge Z (per 100 photofission events) can be expressed by$ Y\left(A,Z\right)=\frac{Y\left(A\right)}{\sqrt{2\pi }{\sigma }_{z}}\exp\left[-\frac{{\left(Z-{Z}_{p}\left(A\right)\right)}^{2}}{2{{\sigma }_{z}}^{2}}\right], $

(6) where
$ {\sigma }_{z} $ indicates the width of the charge distribution for the isobaric chain, and$ {Z}_{p}\left(A\right) $ is the most probable charge number of the photofission fragment. The photofission ICD has a Gaussian dispersion [17]. In order to make the formula more universal,$ {\sigma }_{Z} $ should be replaced by the average value$ \left\langle{{\sigma }_{Z}}\right\rangle $ for all the isobaric chains. For a compound nucleus with the same proton number,$ \left\langle{{\sigma }_{Z}}\right\rangle $ can be assumed as a constant of 0.55 [29].Two models, namely the LD model [22] and the systematic model developed by Umezawwa et al. [23], are employed to describe
$ {Z}_{p}\left(A\right) $ . The LD model is based on the liquid drop model mass formula, in which the nucleus is considered as an incompressible droplet and all nuclei have the same density [22, 30]. The systematic model is based on the assumption that the ratio between the numbers of protons and neutrons in light and heavy fission fragments is identical to that in the fissioned nucleus [23, 31]. In the LD model,$ {Z}_{p}\left(A\right) $ =$ {Z}_{s}\left(A\right) $ −3.8 with$ {Z}_{s}\left(A\right) $ being the most stable isotope of fission fragments.$ {Z}_{s}\left(A\right) $ can be obtained by keeping A constant while differentiating the liquid-drop mass formula [30] and setting the term$\partial {M}_{\rm nucleus}\left(A,Z\right) / \partial {\left.Z\right|}_{A}$ to zero [22]. According to Ref. [32], one can obtain$ {Z}_{s}\left(A\right)=\frac{A+\left({a}_{c}{A}^{2/3}\right)/\left(2x\right)}{\left(4{a}_{\rm sym}/x\right)+\left({a}_{c}{A}^{2/3}\right)/x}, $

(7) where
$ x=2{a}_{\rm sym}+({m}_{n}-{m}_{p})/2 $ ,$ {a}_{\rm sym} $ and$ {a}_{c} $ are the symmetry energy and Coulomb coefficients, respectively, and$ {m}_{p} $ and$ {m}_{n} $ are the masses of proton and neutron, respectively.In the systematic model, the
$ {Z}_{p} $ values of individual mass chain (A) for the above fission systems are calculated as follows[31]:$ {Z}_{p}\left(A\right)={Z}_{\rm UCD}\left(A\right)\pm \Delta {Z}_{p}\left(A\right). $

(8) Here,
${Z}_{\rm UCD}\left(A\right)=({Z}_{F}/{A}_{F})(A+{n}_{\rm post})$ is the most probable charge based on the unchanged charge density distribution,$ {Z}_{F} $ and$ {A}_{F} $ are the mass and charge of the fission system, respectively,${A}_{F}={A}_{cn}-{n}_{\rm pre}$ ,${n}_{\rm post}$ and${n}_{\rm pre}$ are post- and pre-fission neutrons, respectively, and$ \Delta {Z}_{p}\left(A\right) $ is the charge-polarization parameter, which can be determined from the systematic behavior of the neutrons emitted before${(n}_{\rm post})$ and after${(n}_{\rm pre})$ the fission [23]. The + and − signs for$ \Delta {Z}_{p}\left(A\right) $ are applied to the light and heavy fragments, respectively. The exact expressions for${n}_{\rm pre}$ ,${n}_{\rm post}$ , and$ \Delta {Z}_{p}\left(A\right) $ are given in Ref. [23]. -
For the photofission, the np emission can be regarded as a stochastic process. The probability
$ {P}_{n} $ of the observing ν neutrons from fission can be approximated by a Gaussian-like distribution [24]:$ \sum _{n=0}^{\nu }{P}_{n}=\frac{1}{\sqrt{2\pi }}{\int }_{-\infty }^{\textstyle\frac{\nu -\stackrel-{\nu }+\frac{1}{2}+d}{\sigma }}\exp\left(-\frac{{t}^{2}}{2}\right){\rm d}t, $

(9) where σ is the width of the distribution,
$ \bar{\nu } $ is the average number of np depending on the excitation energy, and d is a small correction factor (for example, d < 0.01) that ensures the correct average$ \bar{\nu } $ for the discrete probability distribution. This model is based on reasonable assumptions about the distribution of excitation energy among fission fragments. These assumptions are: (1) the emission of any neutron from fission fragment reduces its excitation by the sum of the binding energy and kinetic energy of the emitted neutron, and (2) the total excitation energy of the two primary fragments from binary fission has a Gaussian or normal distribution. An empirical formula [25] was developed to estimate the np multiplicity for actinides as a function of the incident neutron energy. According to the Bohr hypothesis,$ \bar{\nu } $ can be expressed as$\begin{aligned}[b] \bar{\nu }=&(0.27318{Z}_{cn}-22.7734)+\left[0.0013\right({A}_{cn}-1)\\&-0.1636]{(E}^{*}-{S}_{n}). \end{aligned}$

(10) The energy distribution of the np emitted by photofission of a nucleus with mass number
$ {A}_{cn} $ and atomic number$ {Z}_{cn} $ is assumed to be the Watt spectrum, which is taken from the Evaluated Nuclear Data Library [26] and can be written as$ W\left({E}_{n}^{\prime}\right)=\sqrt{\pi \frac{b}{4a}}\frac{\mathrm{exp}\left(\frac{b}{4a}\right)}{a}\exp\left[-a{E}_{n}^{\prime}\right]{\rm sinh}\left(\sqrt{b{E}_{n}^{\prime}}\right), $

(11) where
${E}_{n}^{\prime}$ is the energy of np. In this study, we set the parameters as b = 1.0 and$ a={a}_{0}+{a}_{1}{(E}^{*}-{S}_{n})+ {a}_{2}{{(E}^{*}-{S}_{n})}^{2} $ [18] for a nucleus with one less neutron than the photofission target. The values of$ {a}_{0} $ ,$ {a}_{1} $ , and$ {a}_{2} $ for neutron-induced fission on 40 isotopes can be found in Ref. [18]. As a result, the prompt neutron spectra of photofission on typical actinides can be predicted successfully. -
Currently, experimental data are not available for both the multiplicity and energy distributions of γp. The probability of emitting G fission photons is estimated [27], and such probability obeys the negative binomial distribution:
$ \prod \left(G\right)=\left(\begin{array}{c}\alpha +G-1\\ G\end{array}\right){\left(p\right)}^{\alpha }{\left(1-p\right)}^{G}. $

(12) Here, the parameter
$ p=\alpha /(\alpha +\bar{G}) $ , α is approximately 26, and$ \bar{G} $ is the average number of γp per fission and is approximated by $ {\bar{G}=E}_{t}/\bar{E} $ , where${E}_{t}= \Big[2.51- 1.13\cdot {10}^{-5} {{Z}_{cn}}^{2}\sqrt{{A}_{cn}-1}\Big]\bar{\nu }+4.0.$ and$\bar{E}=-1.33+ 119.6\cdot {{Z}_{cn}}^{1/3}/ \left({A}_{cn}-1\right)$ are the total and average γp energies, respectively.For the photofission of actinides, the γp energy spectra could be obtained supposing that they are similar to those from other types of fissions. Such hypothesis is supported by the fact that the measured γp spectra are very closed to other types of fission [33], such as spontaneous fission of 252Cf and neutron-induced fission of 235U. Consequently, we use the following analytic expression [28] to describe the γp energy distribution:
$ N\left({E}_{\gamma }^{\prime}\right)=\left\{\begin{array}{*{20}{l}}38.13\left({E}_{\gamma }^{\prime}-0.085\right)\mathrm{exp}\left(1.648{E}_{\gamma }^{\prime}\right)\quad {E}_{\gamma }^{\prime} < 0.3~{\rm MeV}\\ 26.8\mathrm{exp}\left(-2.30{E}_{\gamma }^{\prime}\right)\quad 0.3 < {E}_{\gamma }^{\prime} < 1.0~{\rm MeV}\\ 8.0\mathrm{exp}\left(-1.10{E}_{\gamma }^{\prime}\right)\quad 1.0 < {E}_{\gamma }^{\prime} < 8.0~{\rm MeV}\end{array}\right.. $

(13) Here,
$ {E}_{\gamma }^{\prime} $ indicates the γp energy. It is seen that Eq. (13) is a universal expression, which is independent of the fission type and excitation energy. -
The MYD of photofission on 232Th, 235, 238U and 240Pu are predicted with the Bohr-substitution F, G, and M models and compared to the experimental data [29, 34–37]. The benchmarking results against experimental data are shown in Fig. 2. Compared to the Bohr-substitution F and M models, the Bohr-substitution G model shows better agreement with experimental values at
$ {E}^{*} $ = 9.7, 13.5, and 14.1 MeV [Figs. 2(d)–(f)]. The Bohr-substitution M model predicts two Gaussian functions for either light or heavy fragments, resulting in visible sawtooth patterns in most photofission cases (see Fig. 2). Since the prediction of this model is independent of$ {E}^{*} $ and$ {Z}_{cn} $ (see Appendix A), these Gaussian functions for light and heavy fragments have almost constant amplitudes, whereas the experimental amplitudes strongly depend on the average excitation energy. As a result, the Bohr-substitution M model is not in line with the experimental data.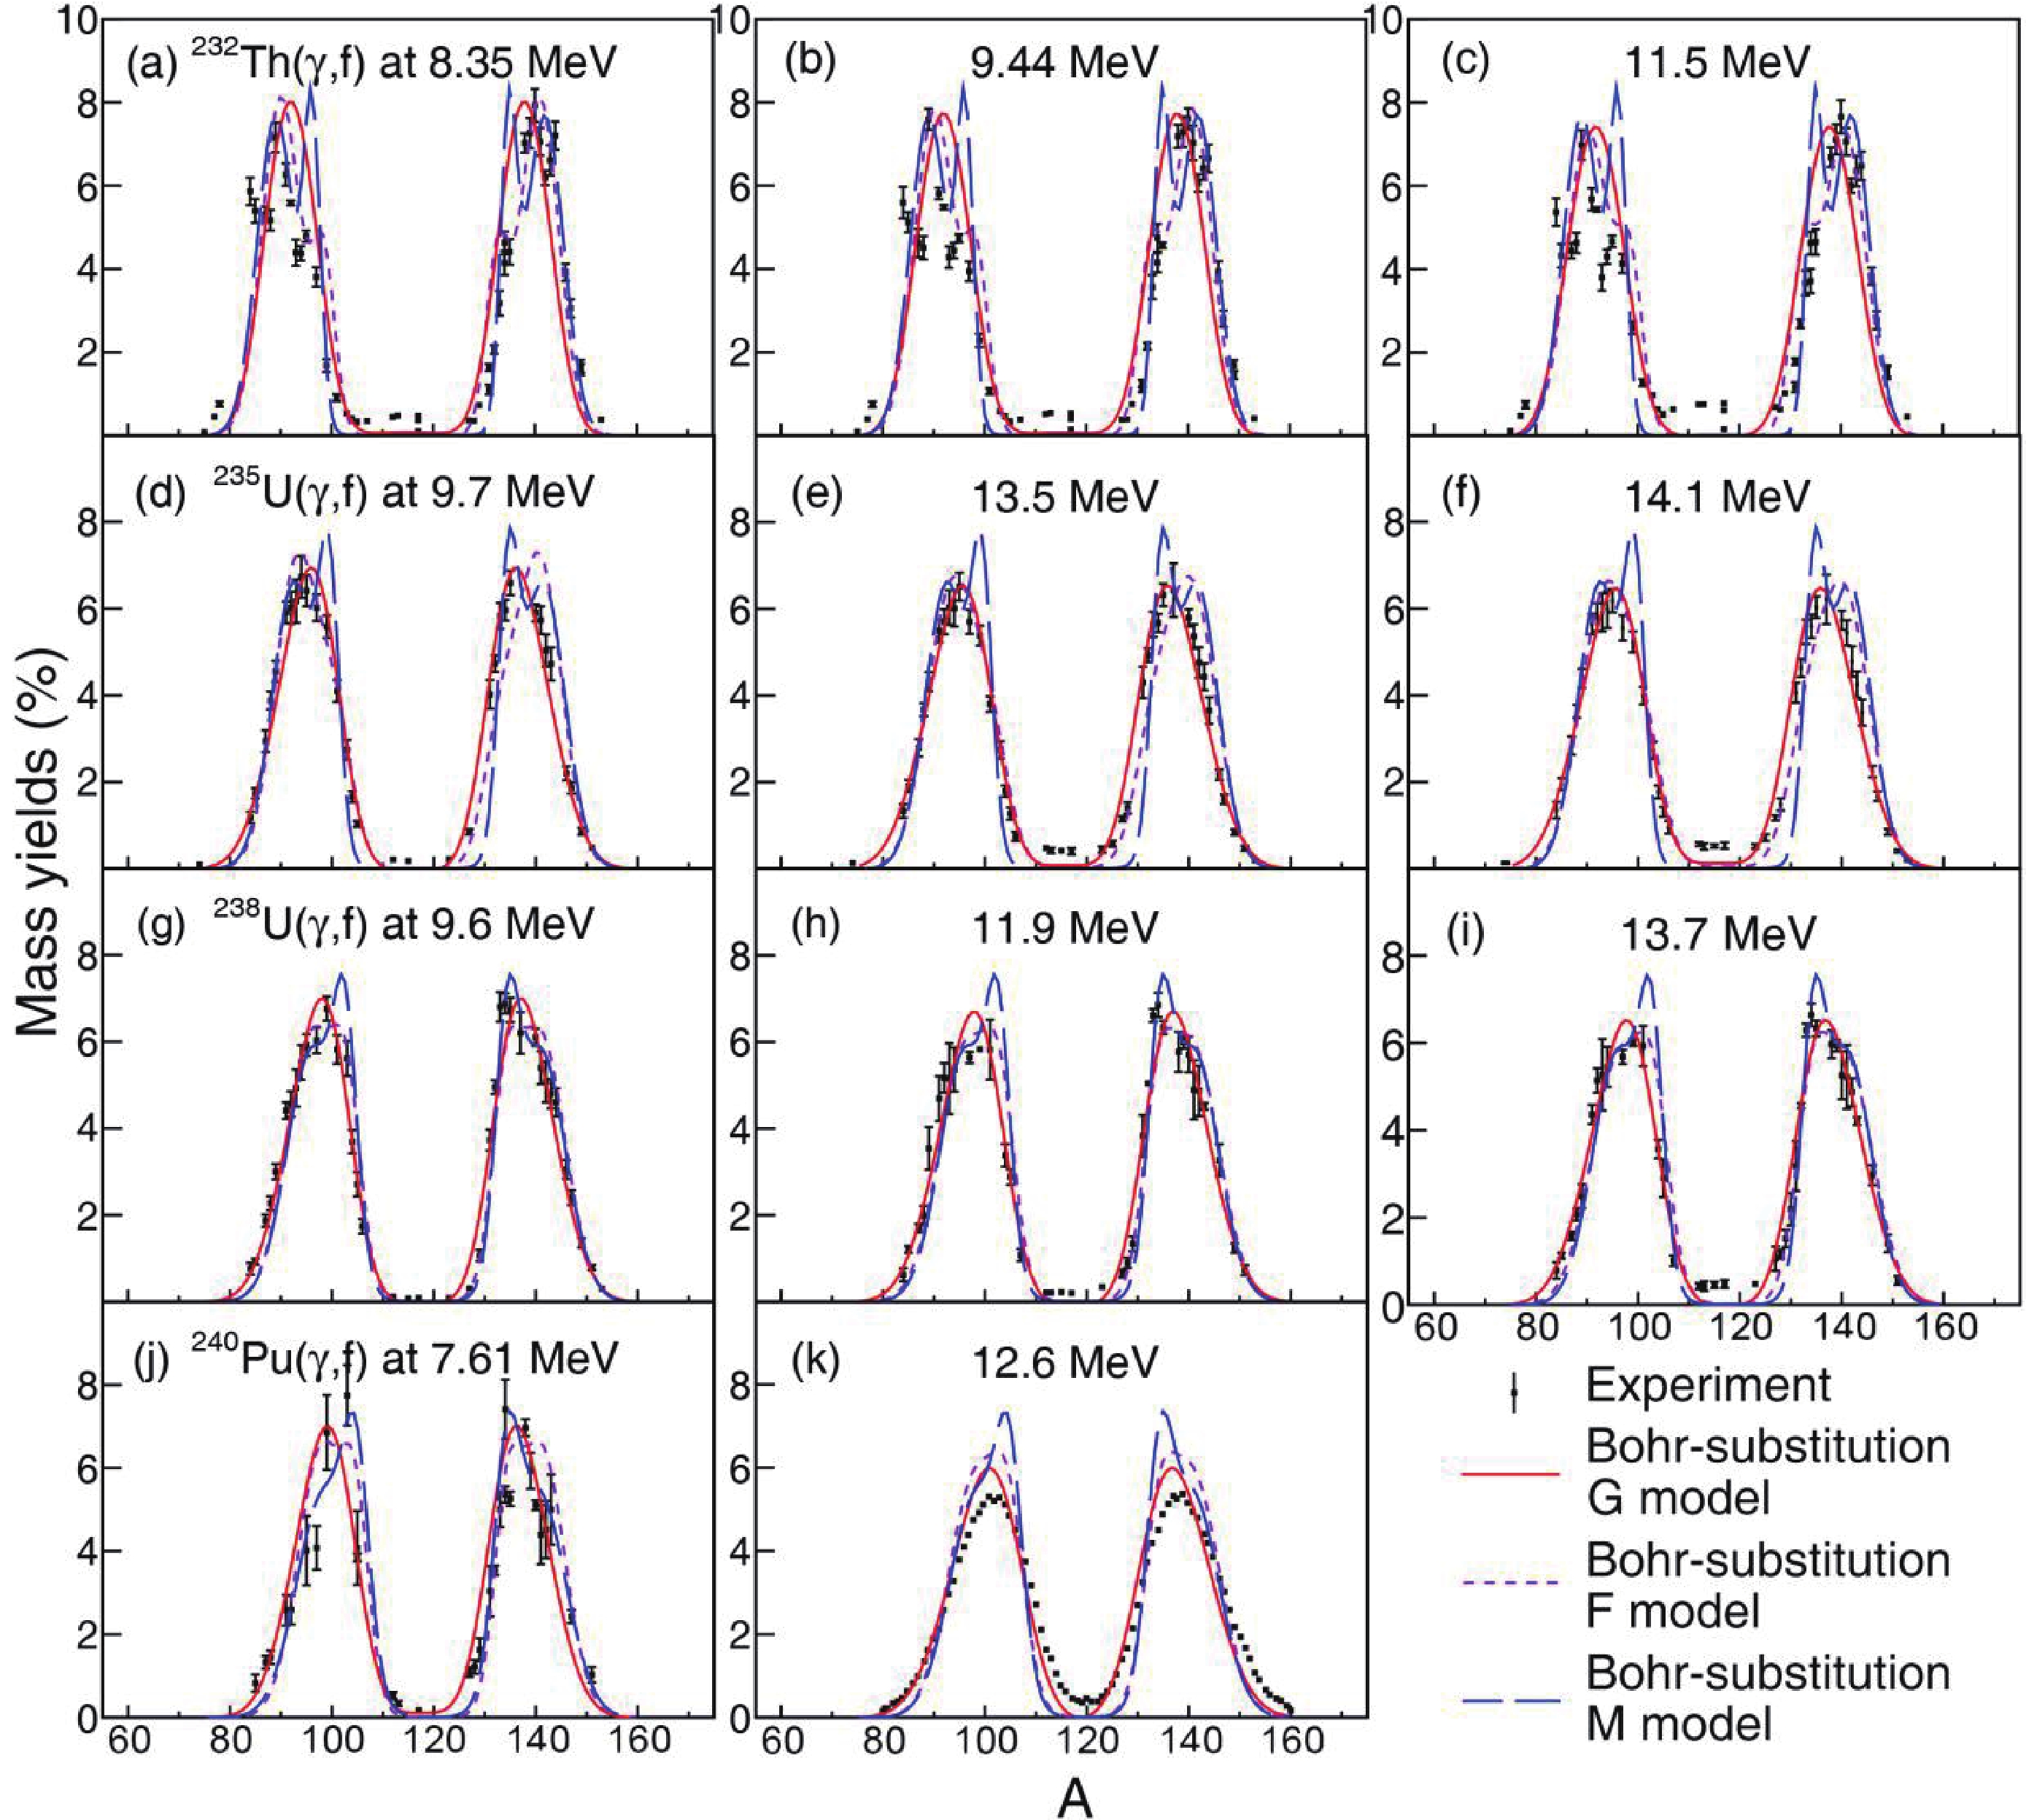
In the case of 232Th and 238U, the predictions from the Bohr-substitution F model are very close to the experimental values, especially for the heavy fragments [see Figs. 2(a)–(c) and Figs. 2(g)-(i)]. However, the result of Bohr-substitution F on 235U shows a different trend, since the average mass,
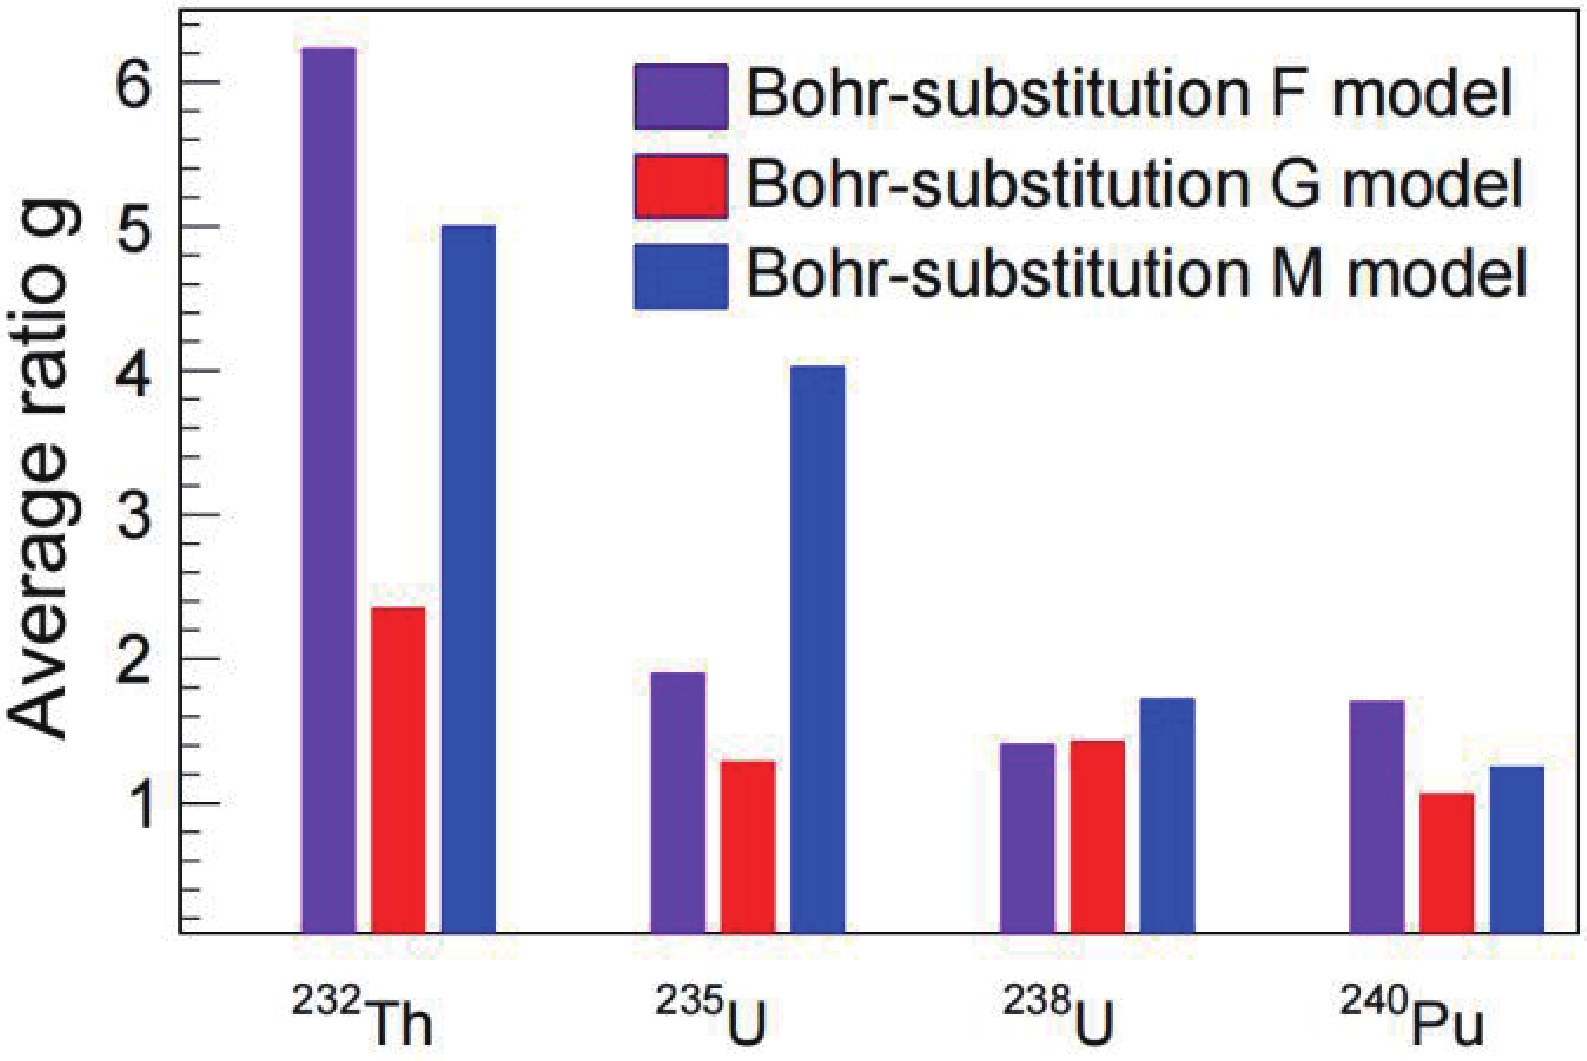
$ {A}_{a} $ , of heavy asymmetric fission fragments was proved to be independent of the energy of incident particles [14], which is correctly set to describe$ {A}_{a} $ in the Bohr-G model. The corresponding parameters in the Bohr-F model are set as a function of excitation energy. As a result, the peak position of the Bohr-substitution-F model in the heavy fragments fields shows visible deviation from experimental data, while the Bohr-G model predicts the peak position well [see Figs. 2(d)–(f)]. Furthermore, the Bohr-F model overestimates the experimental values at$ {E}^{*} $ = 12.6 MeV [see Fig. 2(k)]. We should note that all the three Bohr-substitution models underestimate the experimental MYD in the symmetric mode (i.e., the valley between two peaks). This is due to the fact that these models use$ {S}_{n} $ to reduce$ {E}^{*} $ , while the yields for symmetric mode drop quickly with decreasing$ {E}^{*} $ [13].The agreement between the MYD calculations and the experiments can be quantitatively evaluated by the average ratio g [38]:
$ g=\exp{\left[\frac{1}{n}\sum \limits_{i-1}^{n}{\left(\mathrm{l}\mathrm{n}\frac{{Y}_{\rm calc}^{i}\left(A\right)}{{Y}_{\exp}^{i}\left(A\right)}\right)}^{2}\right]}^{1/2}, $

(14) where
${Y}_{\exp}^{i}\left(A\right)$ are the experimental mass yields [29, 34–37] and${Y}_{\rm calc}^{i}\left(A\right)$ are the theoretical ones for the i-th isotope. Figure 3 shows the average ratio g for the (γ, f) cases of 232Th, 235, 238U, and 240Pu. For 232Th, the g value obtained from the Bohr-substitution G model is two times smaller than those obtained from the Bohr-substitution F and M models. In the case of 235U, the Bohr-substitution M model has a g value higher than 4, while those for the other two models are smaller than 2. The mass yields of 238U fragments are reproduced well by the three models. For 240Pu, the deviations between the model calculation and the experiment are acceptable, whereas the g value for the Bohr-substitution F model is slightly higher than other calculations. In general, Bohr-substitution F and M models employ the sum of three fission modes (2 asymmetric modes and 1 symmetric mode). In order to characterize the fine structure of the MYD, both the Bohr-substitution F and M models employ two more Gaussian distributions compared to the Bohr-substitution G models, which use only three Gaussian functions. Consequently, they can reproduce the multi-peak shape around A = 133 and 143 caused by the presence of spherical N = 82 and deformed N = 88 shells (see Fig. 2). The Bohr-substitution G model considers only one symmetric mode and one asymmetric mode to reduce the uncertainty of fitting results caused by parameter interference, and hence it can hardly reproduce the multi-modal structure of the MYD. However, this model can perform curve smoothing and provide a more reasonable prediction of the experimental results compared to the other two models (see Fig. 3), supporting the good capability to estimate the photofission MYD. As a result, the Bohr-substitution G model is considered as an optimal option for constructing the general framework. -
To perform reasonable predictions on photofission ICD, it is necessary to consider invoking the LD model [22] and the systematic model [23] in the framework. The results calculated by both the LD model and the systematic model are compared with the fractional, elemental, and isotopic yields measured in photofission experiments. According to Eq. (6), the fractional yield is given by
$DY\left(A,Z\right) \equiv Y\left(A,Z\right)/Y\left(A\right)=1/\left(\sqrt{2\pi }{\sigma }_{z}\right)\exp\left\{{\left[Z-{Z}_{p}\left(A\right)\right]}^{2}/\left(-2{{\sigma }_{z}}^{2}\right)\right\}$ . Figure 4 compares the calculated$ DY(A,Z) $ against the experimental ones for 232Th(γ, f) and 238U(γ, f) reactions [39–42].$ {Z}_{p}\left(A\right) $ of each mass chain corresponds to the charge number that leads to the peak of$ DY(A,Z) $ . In the calculations, the width$ \left\langle{{\mathrm{\sigma }}_{\mathrm{Z}}}\right\rangle $ is fixed to 0.55, and the values of$ {Z}_{p} $ are obtained from Eq. (7) for the LD model and from Eq. (8) for the systematic model. For the heavy fragments, the systematic model can match the experimental data well within the mass number of 131 < A < 139. Within the region of light fragments such as A = 96 and 97, it can be seen that$ DY(A,Z) $ calculated with the LD model are in better agreement with the experimental values. Therefore, it can be supposed that the LD model and the systematic model are able to describe$ {Z}_{p}\left(A\right) $ of light and heavy fragments, respectively. However, since the experimental$ DY(A,Z) $ are scarce, this assumption needs to be further validated with other experimental data such as the elemental and isotopic yields.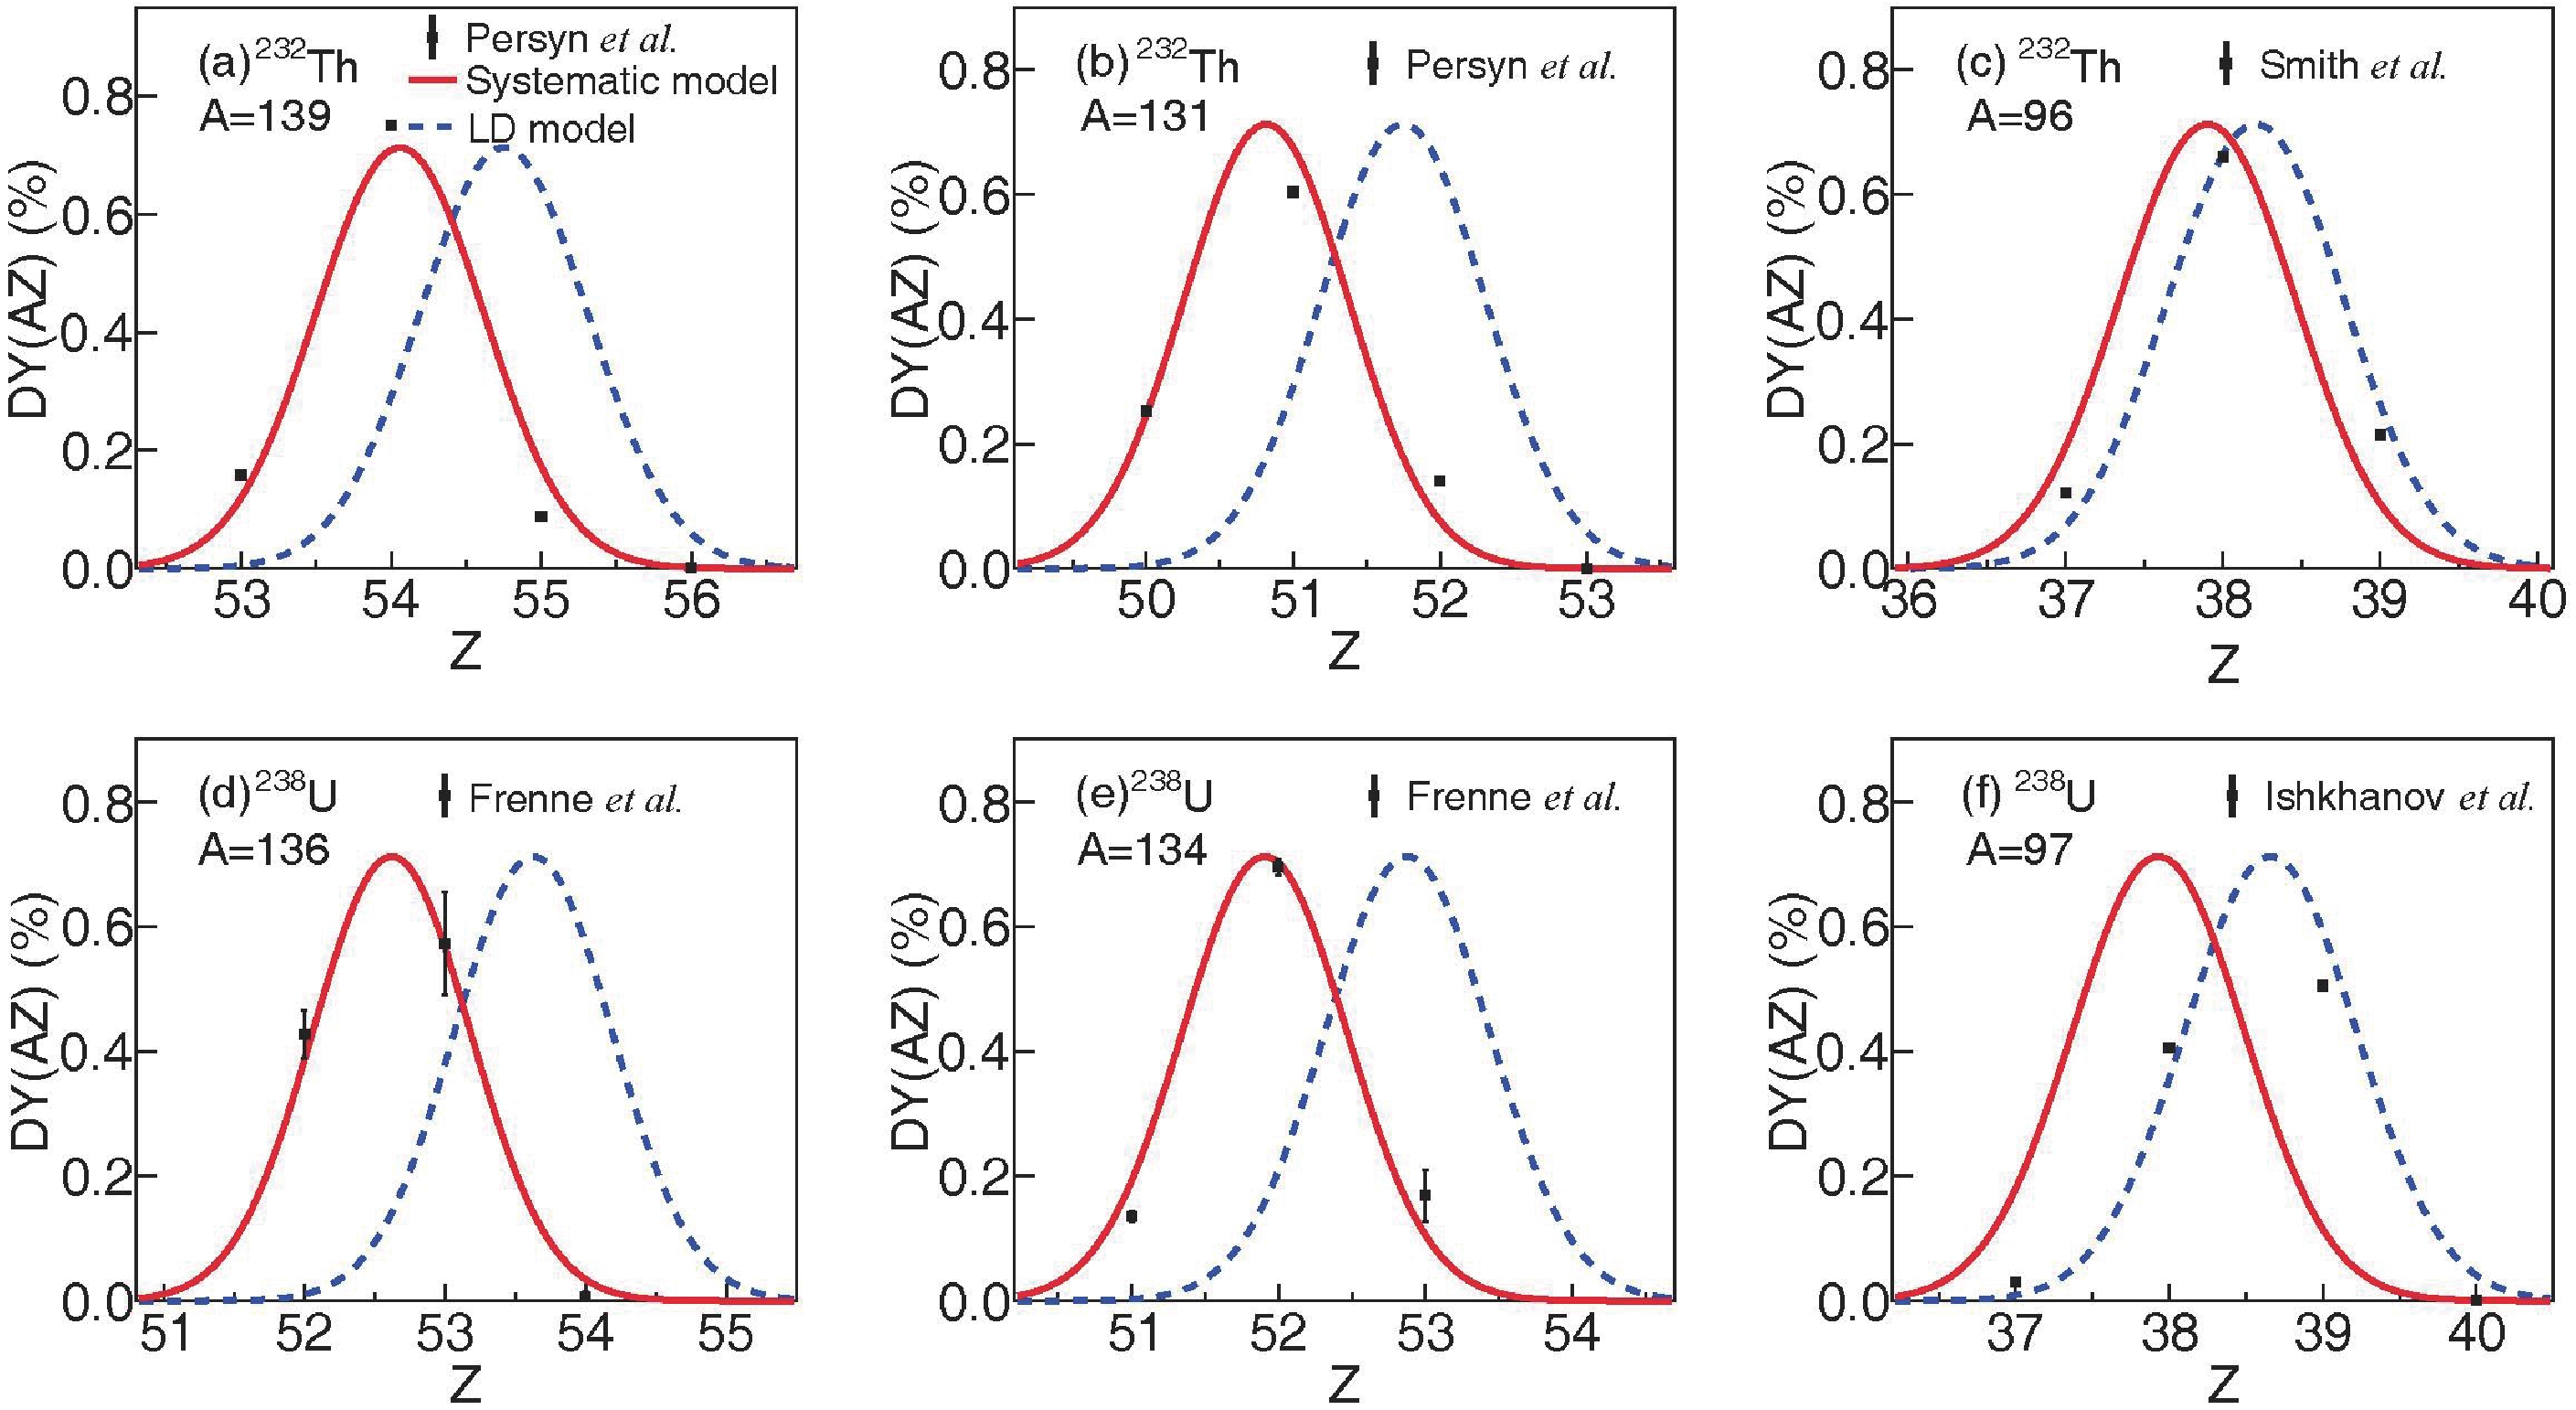
Figure 4. (color online) Calculated fractional yields of photofission on 232Th and 238U together with experimental data. The dashed and solid lines represent the calculations from the LD model and the systematic model, respectively. For 232Th isotope, the data with A = 139, 131 and A = 96 are taken at E* = 8.35 MeV [39] and 15 MeV [40], respectively. For 238U isotope, the experimental data of fragments with A = 136, 134 and A = 97 are taken at E* = 9.7 MeV [41] and 13.7 MeV [42], respectively.
The elemental yields can be obtained from
$ Y\left(Z\right)= \sum _{A}Y(A,Z) $ , in which$ Y\left(A\right) $ is predicted by the Bohr-substitution G model. The comparison of$ Y\left(Z\right) $ measured in the 238U photofission experiments at different$ {E}^{\mathrm{*}} $ [43, 44] with the calculations by the LD model and the systematic model is shown in Fig. 5. For light fragments,$ Y\left(Z\right) $ calculated by the two models are in an excellent agreement with the experimental data within the uncertainties. For heavy fragments, the peak position predicted by the LD model falls into the region of 53 < Z < 55, which deviates slightly from the experimental data. These results indicate that both the LD model and the systematic model can be used to describe$ {Z}_{p} $ of 238U photofission fragments.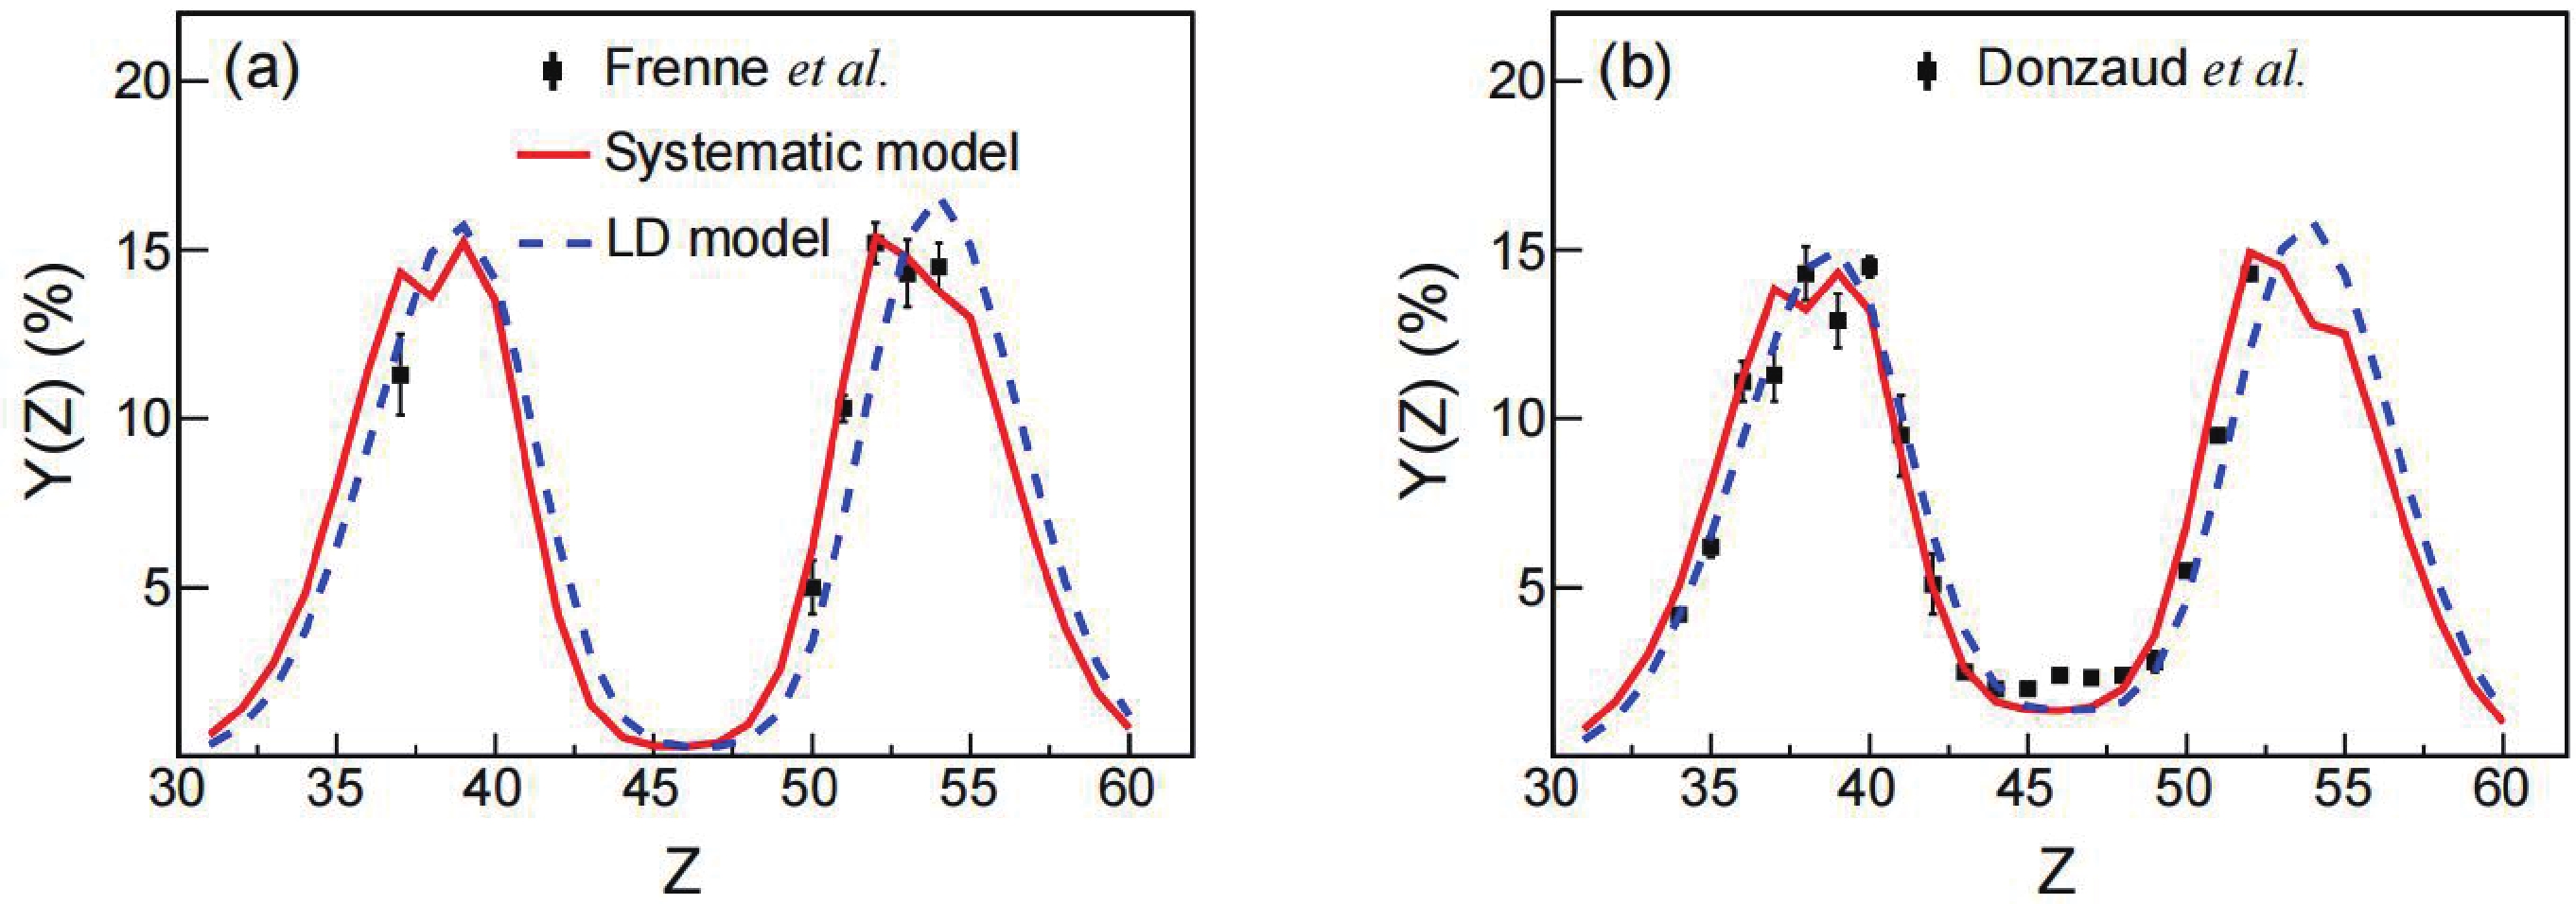
The validity of the LD model and the systematic model can be visualized quantitatively with the relative difference of the calculated
$ Y(A,Z) $ to the experimental ones, and this difference is presented in Fig. 6. The shadow area in Fig. 6 indicates that the relative difference between the model calculations and the experimental data are less than 0.3. The experimental data are obtained from photon-induced fission reaction on 238U at$ {E}^{*} $ $ = $ 19 MeV [44]. Considering that a very small$ Y(A,Z) $ hardly impacts the mass yield, in Fig. 6 we only show the photofission fragments with experimental$ Y(A,Z) $ larger than 0.01. For A < 105, the relative difference between the LD model calculations and the experimental data are generally smaller than 0.3, as shown in the shaded area of Fig. 6. However, a significant discrepancy is observed in the LD model for A > 130, where the systematic model shows better predictions. This is mainly attributed to the nuclear shell effect superimposed on the so-called liquid-drop nature [23]. This finding validates the aforementioned assumption that the LD model and the systematic model are suitable for describing light and heavy photofission fragments, respectively. Therefore, we recommend using the LD model and systematic model in the framework for describing the light (A$ \le $ $ {A}_{cn}/2 $ ) and heavy (A >$ {A}_{cn}/2 $ ) photofission fragments, respectively.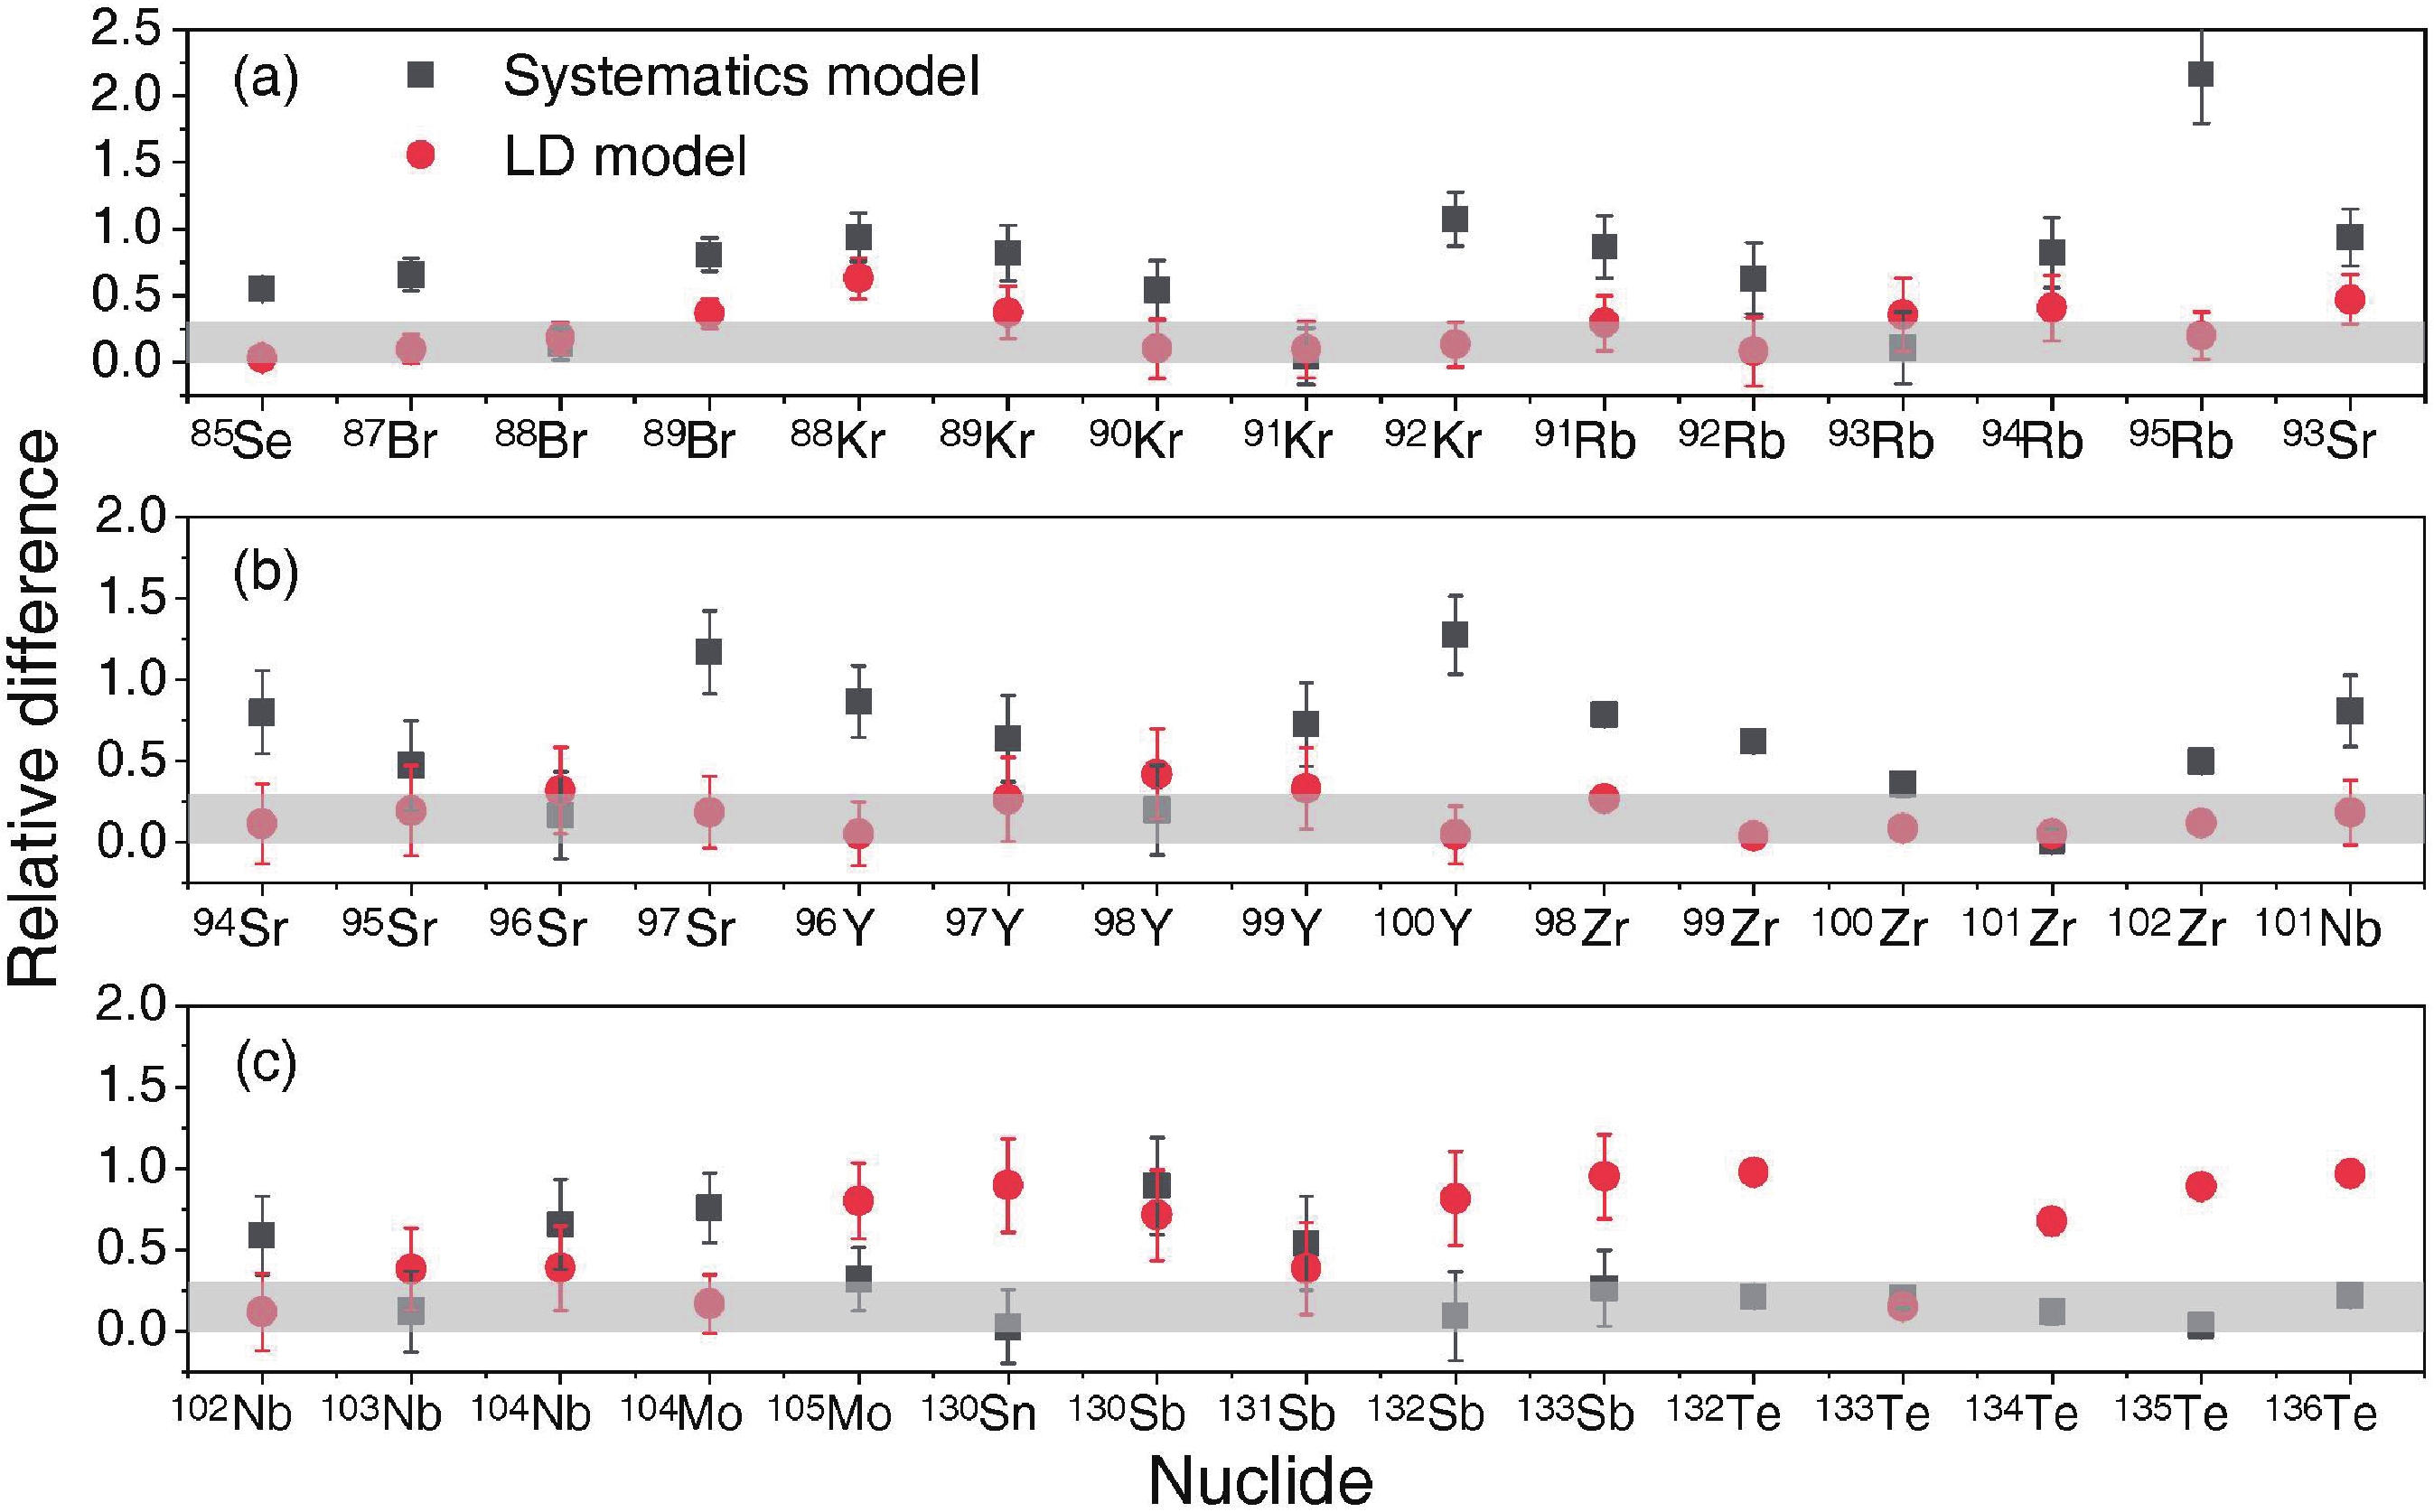
Figure 6. (color online) Relative difference between the calculated and the experimental
$ Y(A,Z) $ for photofission on 238U at E* = 19 MeV [44].The production cross section of a specific fragment with mass number A and atomic number Z can be written as
$ \sigma (A,Z)={\sigma }_{f}\left({E}^{*}\right)Y(A,Z)/100 $ , where$ {\sigma }_{f}\left({E}^{*}\right) $ is the photofission cross section at given$ {E}^{*} $ [45]. Many current and future radioactive beam facility experiments aim at producing and investigating neutron-rich exotic nuclei, especially those close to the r-process path, by means of 238U photofission with different excitation energies [17]. It is essential to estimate$ \sigma (A,Z) $ of these neutron-rich exotic nuclei for such experiments. Figure 7 shows the calculated$ \sigma (A,Z) $ for photofission on 232Th and 238U by using the models recommended above. It is found that the$ \sigma (A,Z) $ of neutron-rich exotic nuclides of 232Th are generally lower than that of 238U at the same$ {E}^{*} $ . For 232Th(γ, f), the averaged values of$ \sigma (A,Z) $ for 80-82Ge and 85-87Se around the closed shell N = 50 at$ {E}^{*} $ = 14 MeV are roughly 0.35 and 1.11 mb, respectively, while those of 132Sn and 134Te around the closed shell N = 82 are about 0.09 mb and 2.37 mb, respectively. At$ {E}^{*} $ = 19 MeV, the$ \sigma (A,Z) $ of these nuclides mentioned above dropped by an order of magnitude. For 238U(γ, f), it is found that the averaged values of$ \sigma (A,Z) $ for 80-82Ge and 85-87Se at$ {E}^{*} $ = 14 MeV are roughly 0.35 and 1.43 mb, respectively, while those of 132Sn and 134Te are about 0.34 and 7.27 mb, respectively. At$ {E}^{*} $ = 19 MeV, the predicted averaged$ \sigma (A,Z) $ of 80-82Ge and 85-87Se are roughly 0.22 and 0.63 mb, respectively. The latter is consistent with the experimental value$ \sigma (A,Z) $ = 0.65$ \pm $ 0.04 mb [44]. For 132Sn and 134Te, the values of$ \sigma (A,Z) $ are predicted to be about 0.07 and 2.52 mb, respectively. The calculated results reveal that 238U(γ, f) is more suitable than 232Th(γ, f) for producing many neutron-rich exotic nuclei and that E* has a great influence on the$ \sigma (A,Z) $ of the neutron-rich nuclei.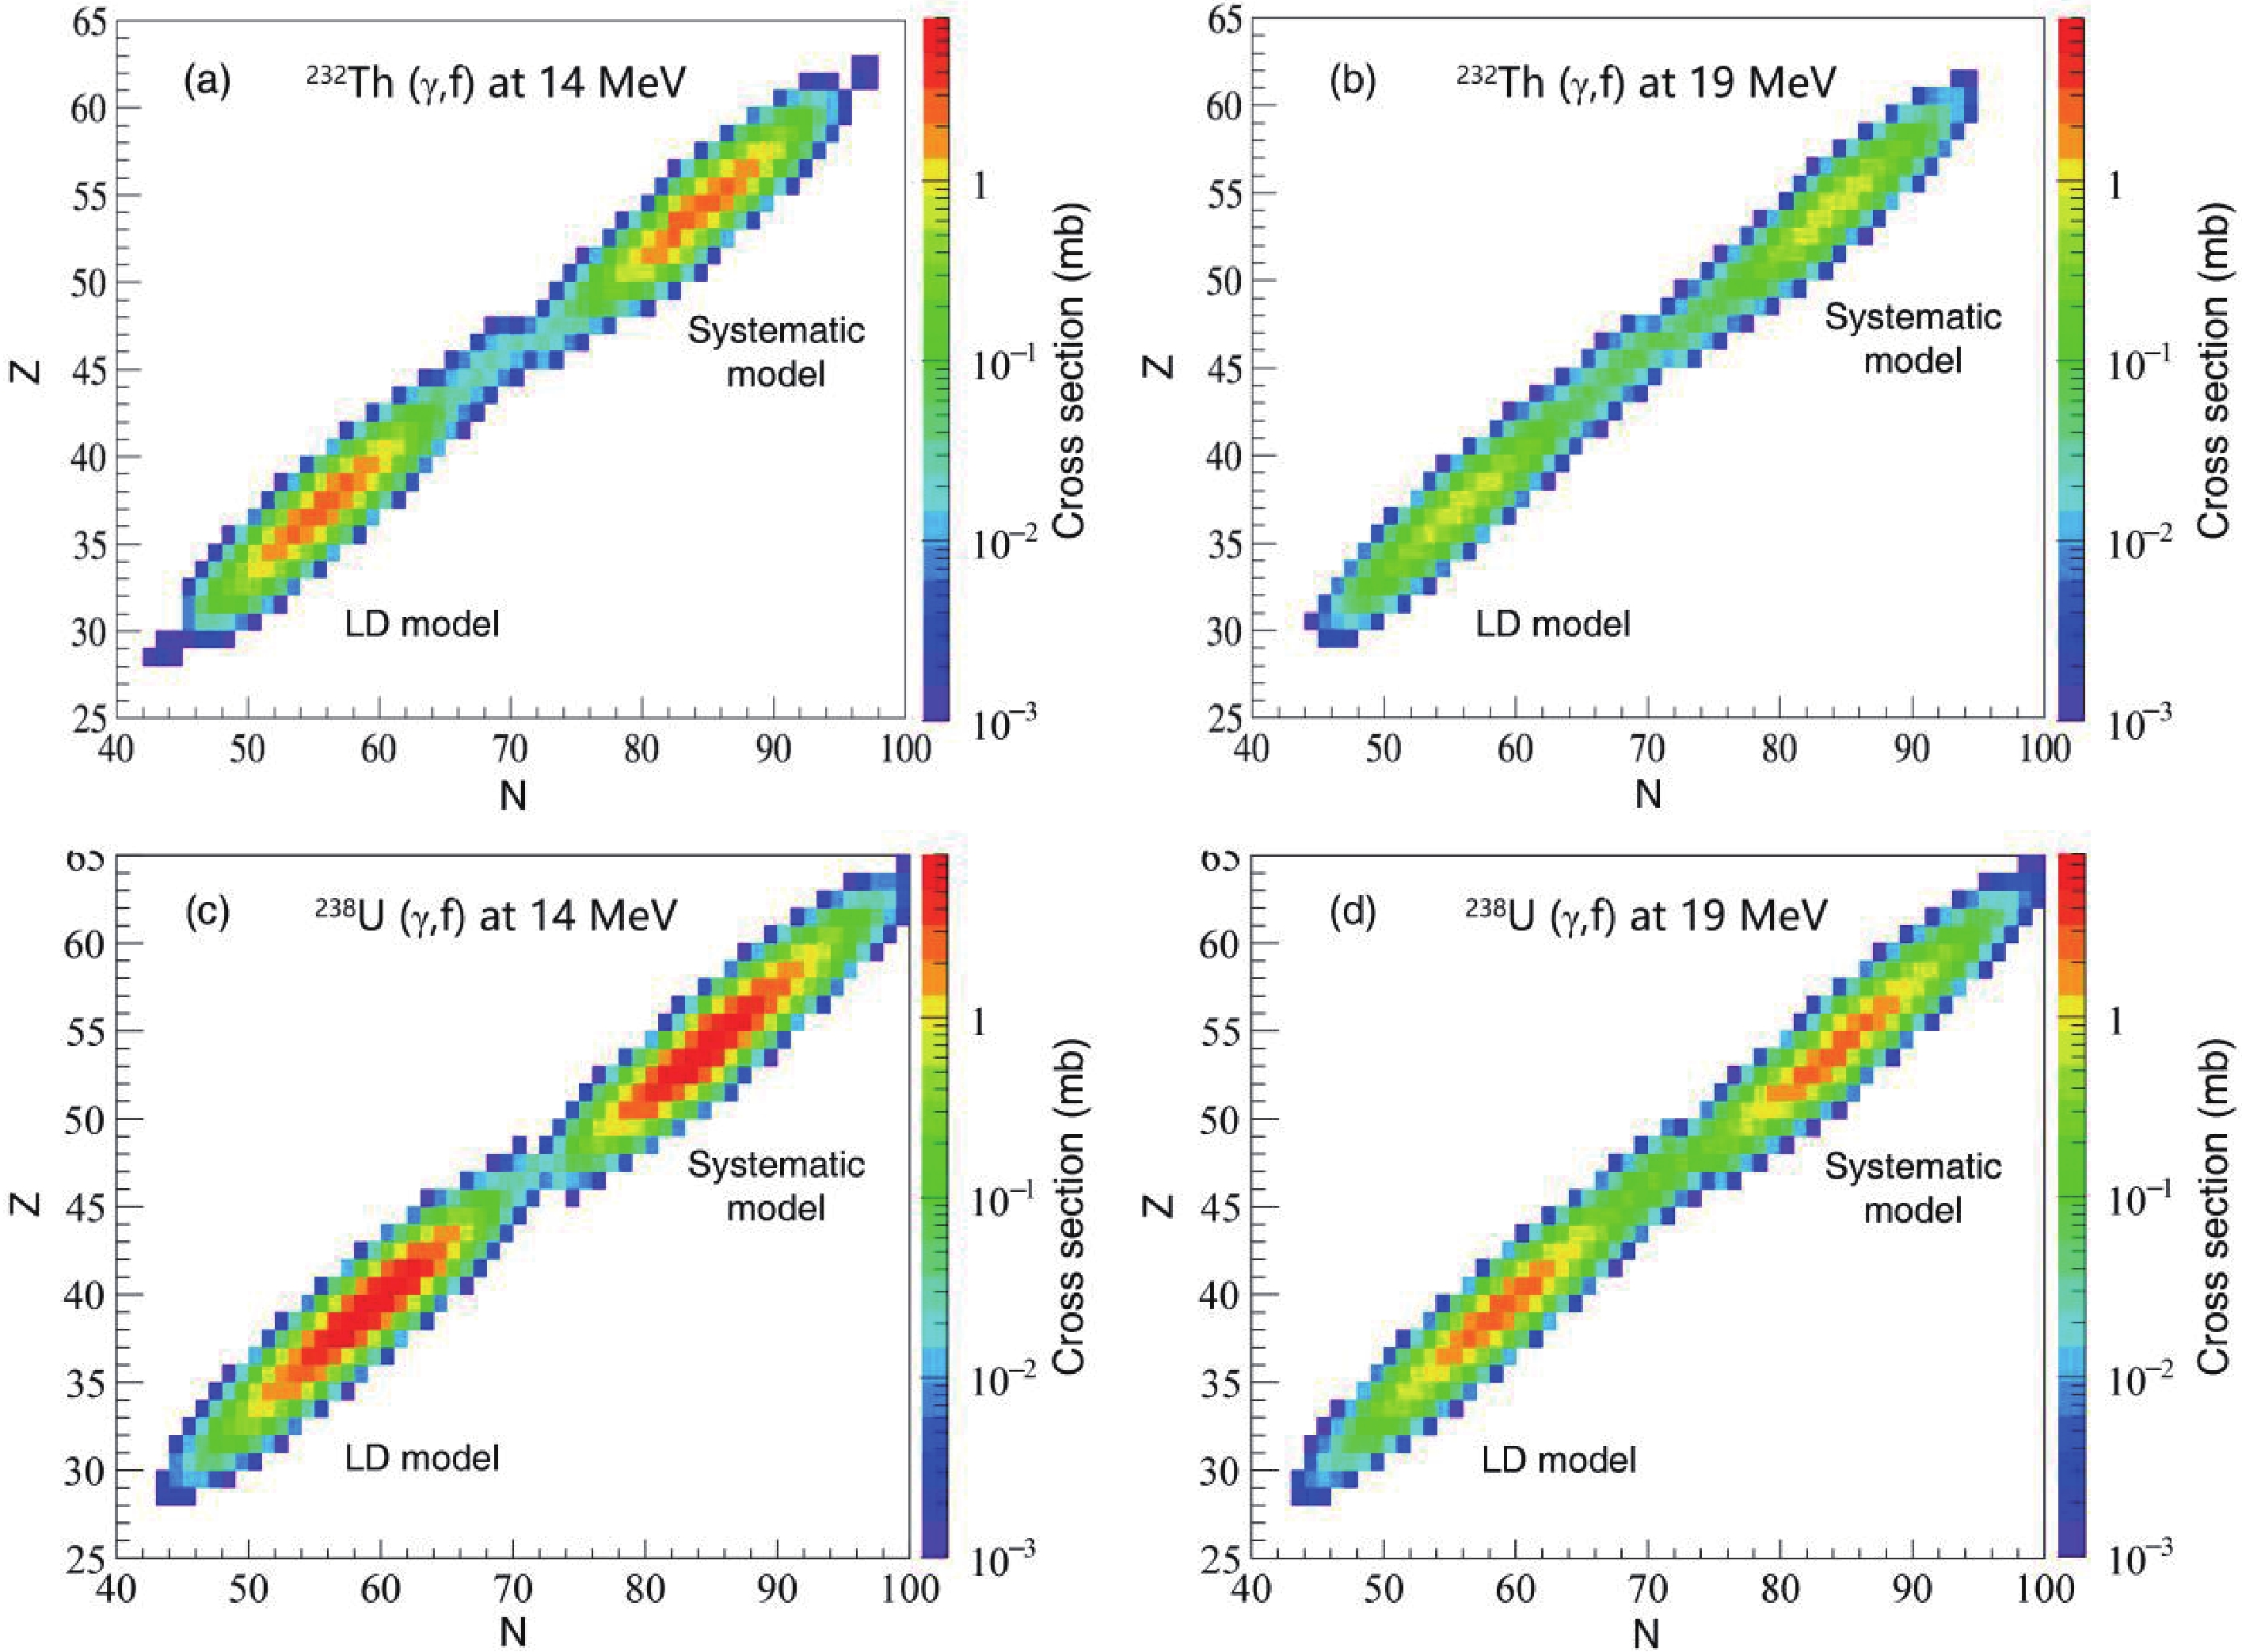
Figure 7. (color online) Calculated
$ \sigma (A,Z) $ of photofission fragments of 238U using photon beam at E* = 14 MeV (a) and 19 MeV (b). The LD model is used to describe the distributions of photofission fragments with A$ \le $ $ {A}_{cn}/2 $ , while the systematic model is employed to calculate those with A >$ {A}_{cn}/2 $ . -
The np multiplicity distribution is calculated with Eq. (10), which is verified by the comparison with experimental data and existing evaluations for 232Th, 235, 238U, and 240Pu [46, 47]. Figure 8 shows the benchmark results for
$\bar{\nu }$ as a function of$ {E}^{*} $ . For 232Th, the calculations are in line with the experimental data when$ {E}^{*} $ is smaller than 14 MeV, above which a slight discrepancy appears. For 235U, the present formula is in accordance with the experimental values within the GDR energy region; in particular, a good agreement is found at$ {E}^{*} $ > 11 MeV. For 238U, the calculation with Eq. (10) underestimates the experimental data at relatively low$ {E}^{*} $ < 10 MeV. This is because Eq. (10) is a universal formula and the parameters involved were determined empirically on the basis of the data in the narrow (U-Pu) region [25]. Therefore, it would be acceptable when the calculation does not reproduce the experimental data well in rare cases. Although the evaluated data from Evaluated Nuclear Data File, format B, version VII.1 (ENDF/B-VII.1) agree with the experimental data, our formula provides an overall good representation without any parametric adjustment. Hence, it can be used to predict the$\bar{\nu }$ for those nuclei for which no or scarce data are available. As an example, we predict the$\bar{\nu }$ of photofission on 240Pu as shown in Fig. 8(d), which is required for accurately modeling neutronic characteristics in the advanced burner reactor [9]. A slight discrepancy between the calculation and evaluation is observed at relatively high$ {E}^{*} $ . This discrepancy needs further experimental validation.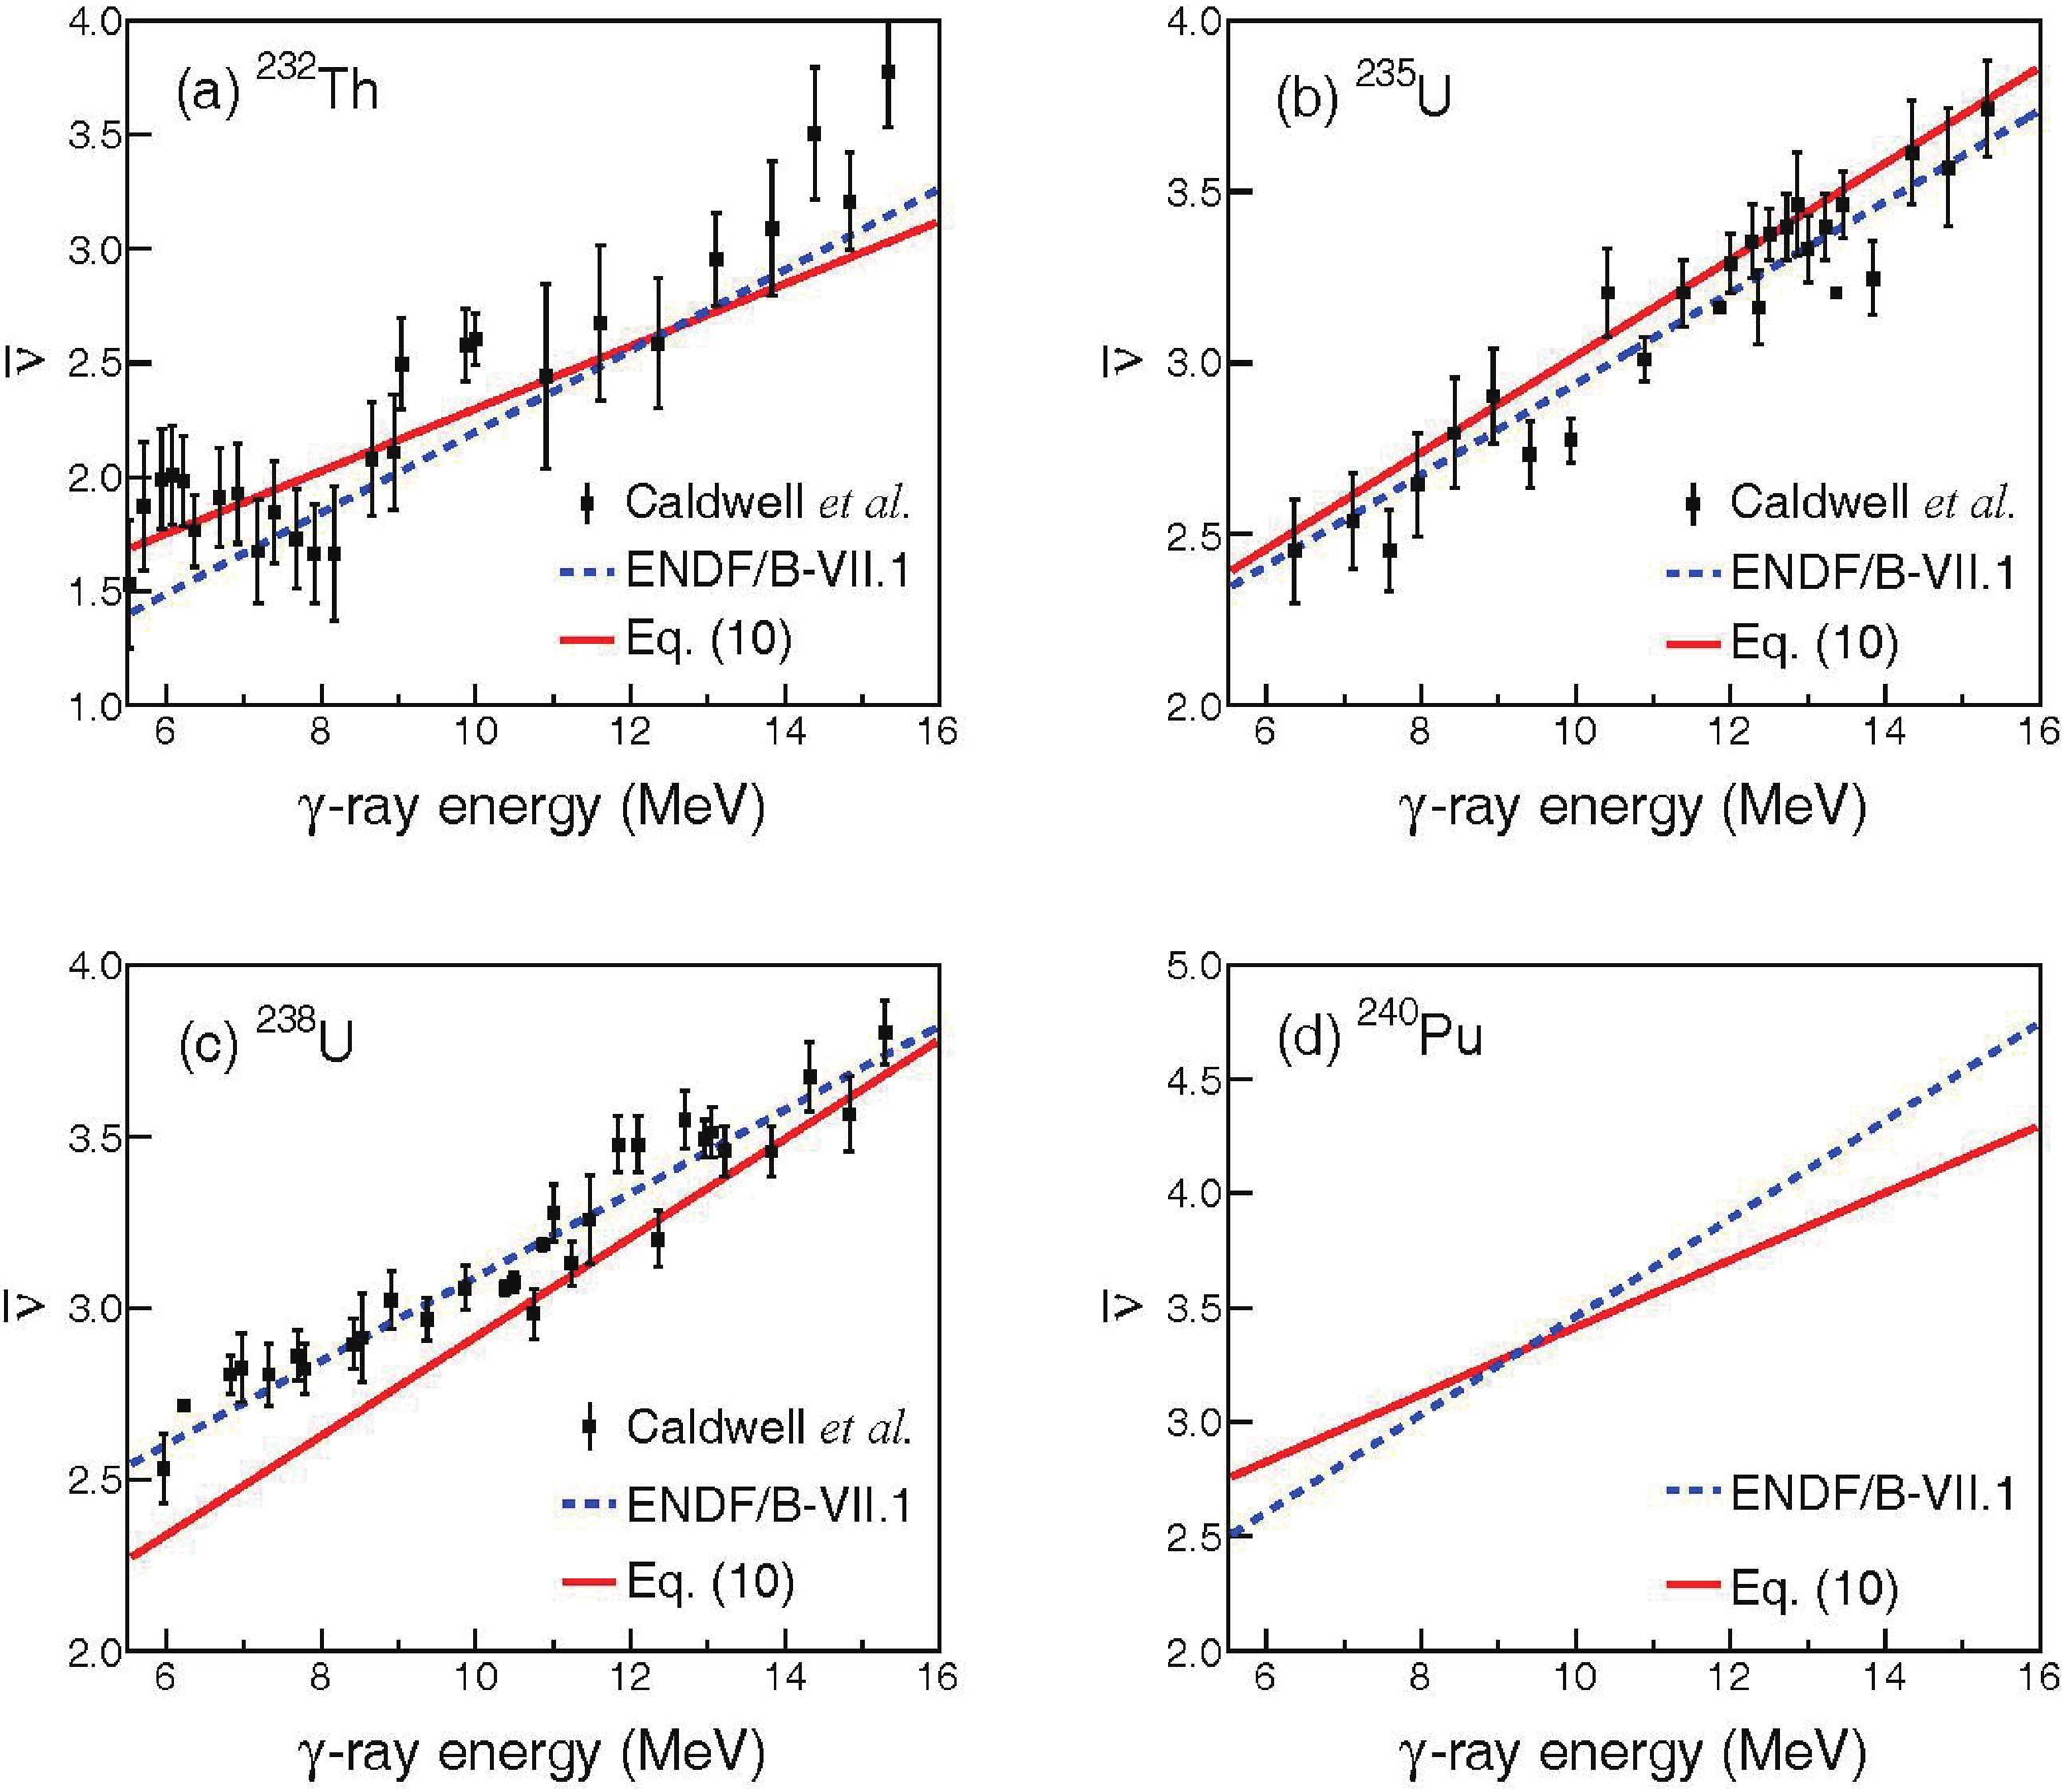
Figure 8. (color online) Average
$ \bar{\mathrm{\nu }} $ from photofission on 232Th (a), 235U (b), 238U (c), and 240Pu (d). The calculation is given by Eq. (10), and the experimental data are taken from Ref. [46].Furthermore, we investigate the validity of the multiplicity and energy distributions for np. The results for the photofission on 235U are shown in Fig. 9, and the experimental data at E* = 16 MeV [48] are also presented for comparison. The calculation of neutron multiplicity can match the experimental measurement well. It can be seen that
$ \stackrel{-}{\mathrm{\nu }} $ is about 3.86, which is in accordance with the experimental value of$\bar{\nu }$ = 3.8$ \pm $ 0.8. According to Eq. (11), one can obtain the normalized distribution of neutron energy spectrum, as shown in Fig. 9(b). Both the experiment and calculation show that the neutron energy ranges from 0 to less than 10 MeV. Owing to the detection limit, data from the experiment are only available in the range from 1 MeV to 7.5 MeV. The calculation shows that the average neutron energy is about 2.20 MeV, which is slightly higher than the measured value of 1.90$ \pm $ 0.19 MeV. This small difference is reasonable since the energy of neutrons emitted from the photofission process will be softened with the increasing neutron multiplicity. This effect has been observed in [48].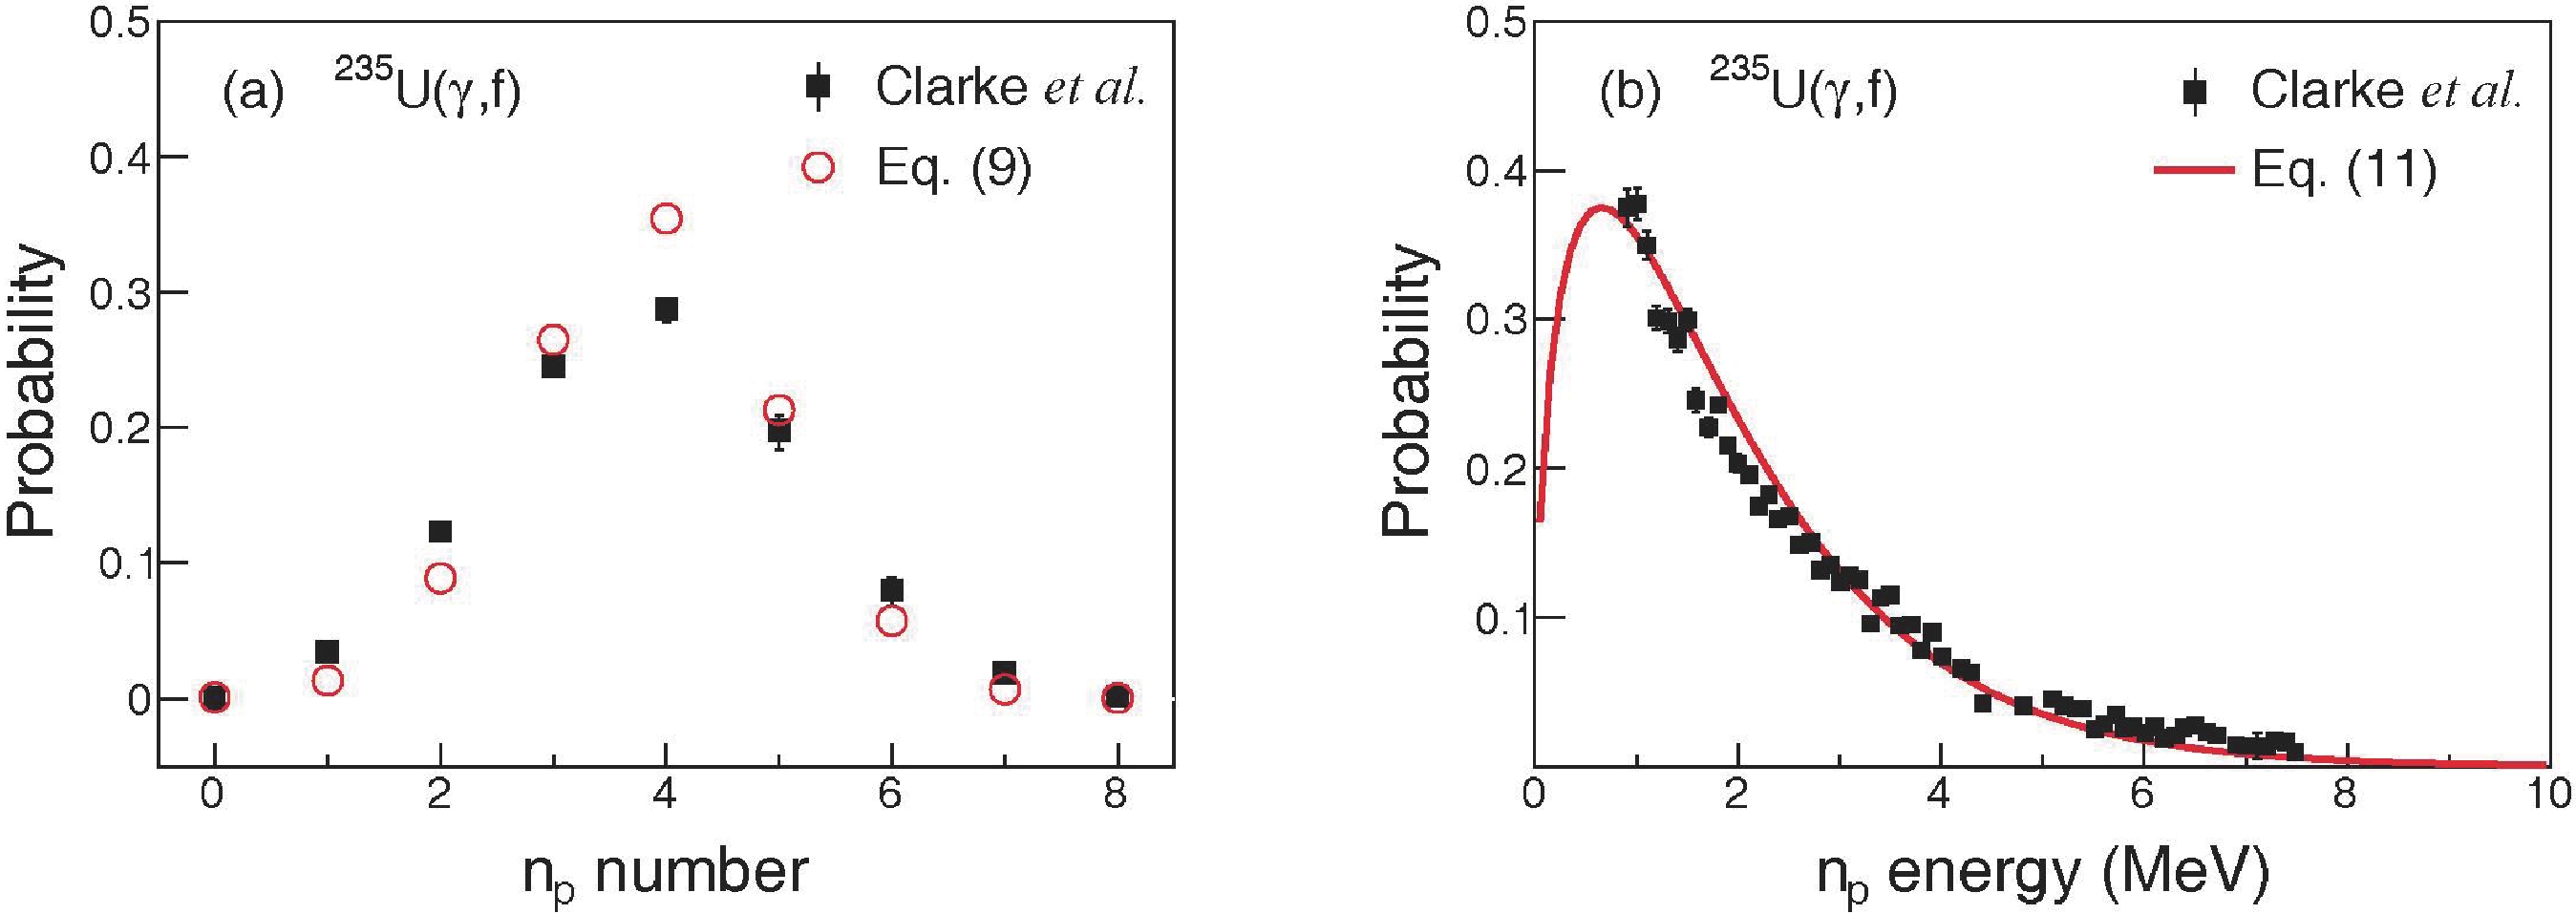
Figure 9. (color online) The calculated and experimental np multiplicity (a) and spectral distributions (b) at
$ {E}^{*} $ = 16 MeV. The experimental data with statistical uncertainty are taken from [48]. The neutron multiplicity is calculated with Eq. (9) and the spectral distribution is calculated with Eq. (11).The np emission from 232Th(γ, f) and 238U(γ, f) are further predicted. Fig. 10 (a-b) shows the np multiplicity distribution depending on
$E^* $ . It is found that the average number of np increases with$E^* $ , albeit the width remains almost the same. Watt spectra are obtained for 232Th(γ, f) and 238U(γ, f) at different$E^* $ , as shown in Fig. 10 (c–d). It can be seen that for different$E^* $ , the resulting spectral distributions have the same cross point at np energy of ~ 2 MeV. The peak value of the probability decreases with increasing$E^* $ . The maximum energy of np can approach 8 MeV, albeit the corresponding probability becomes sufficiently small.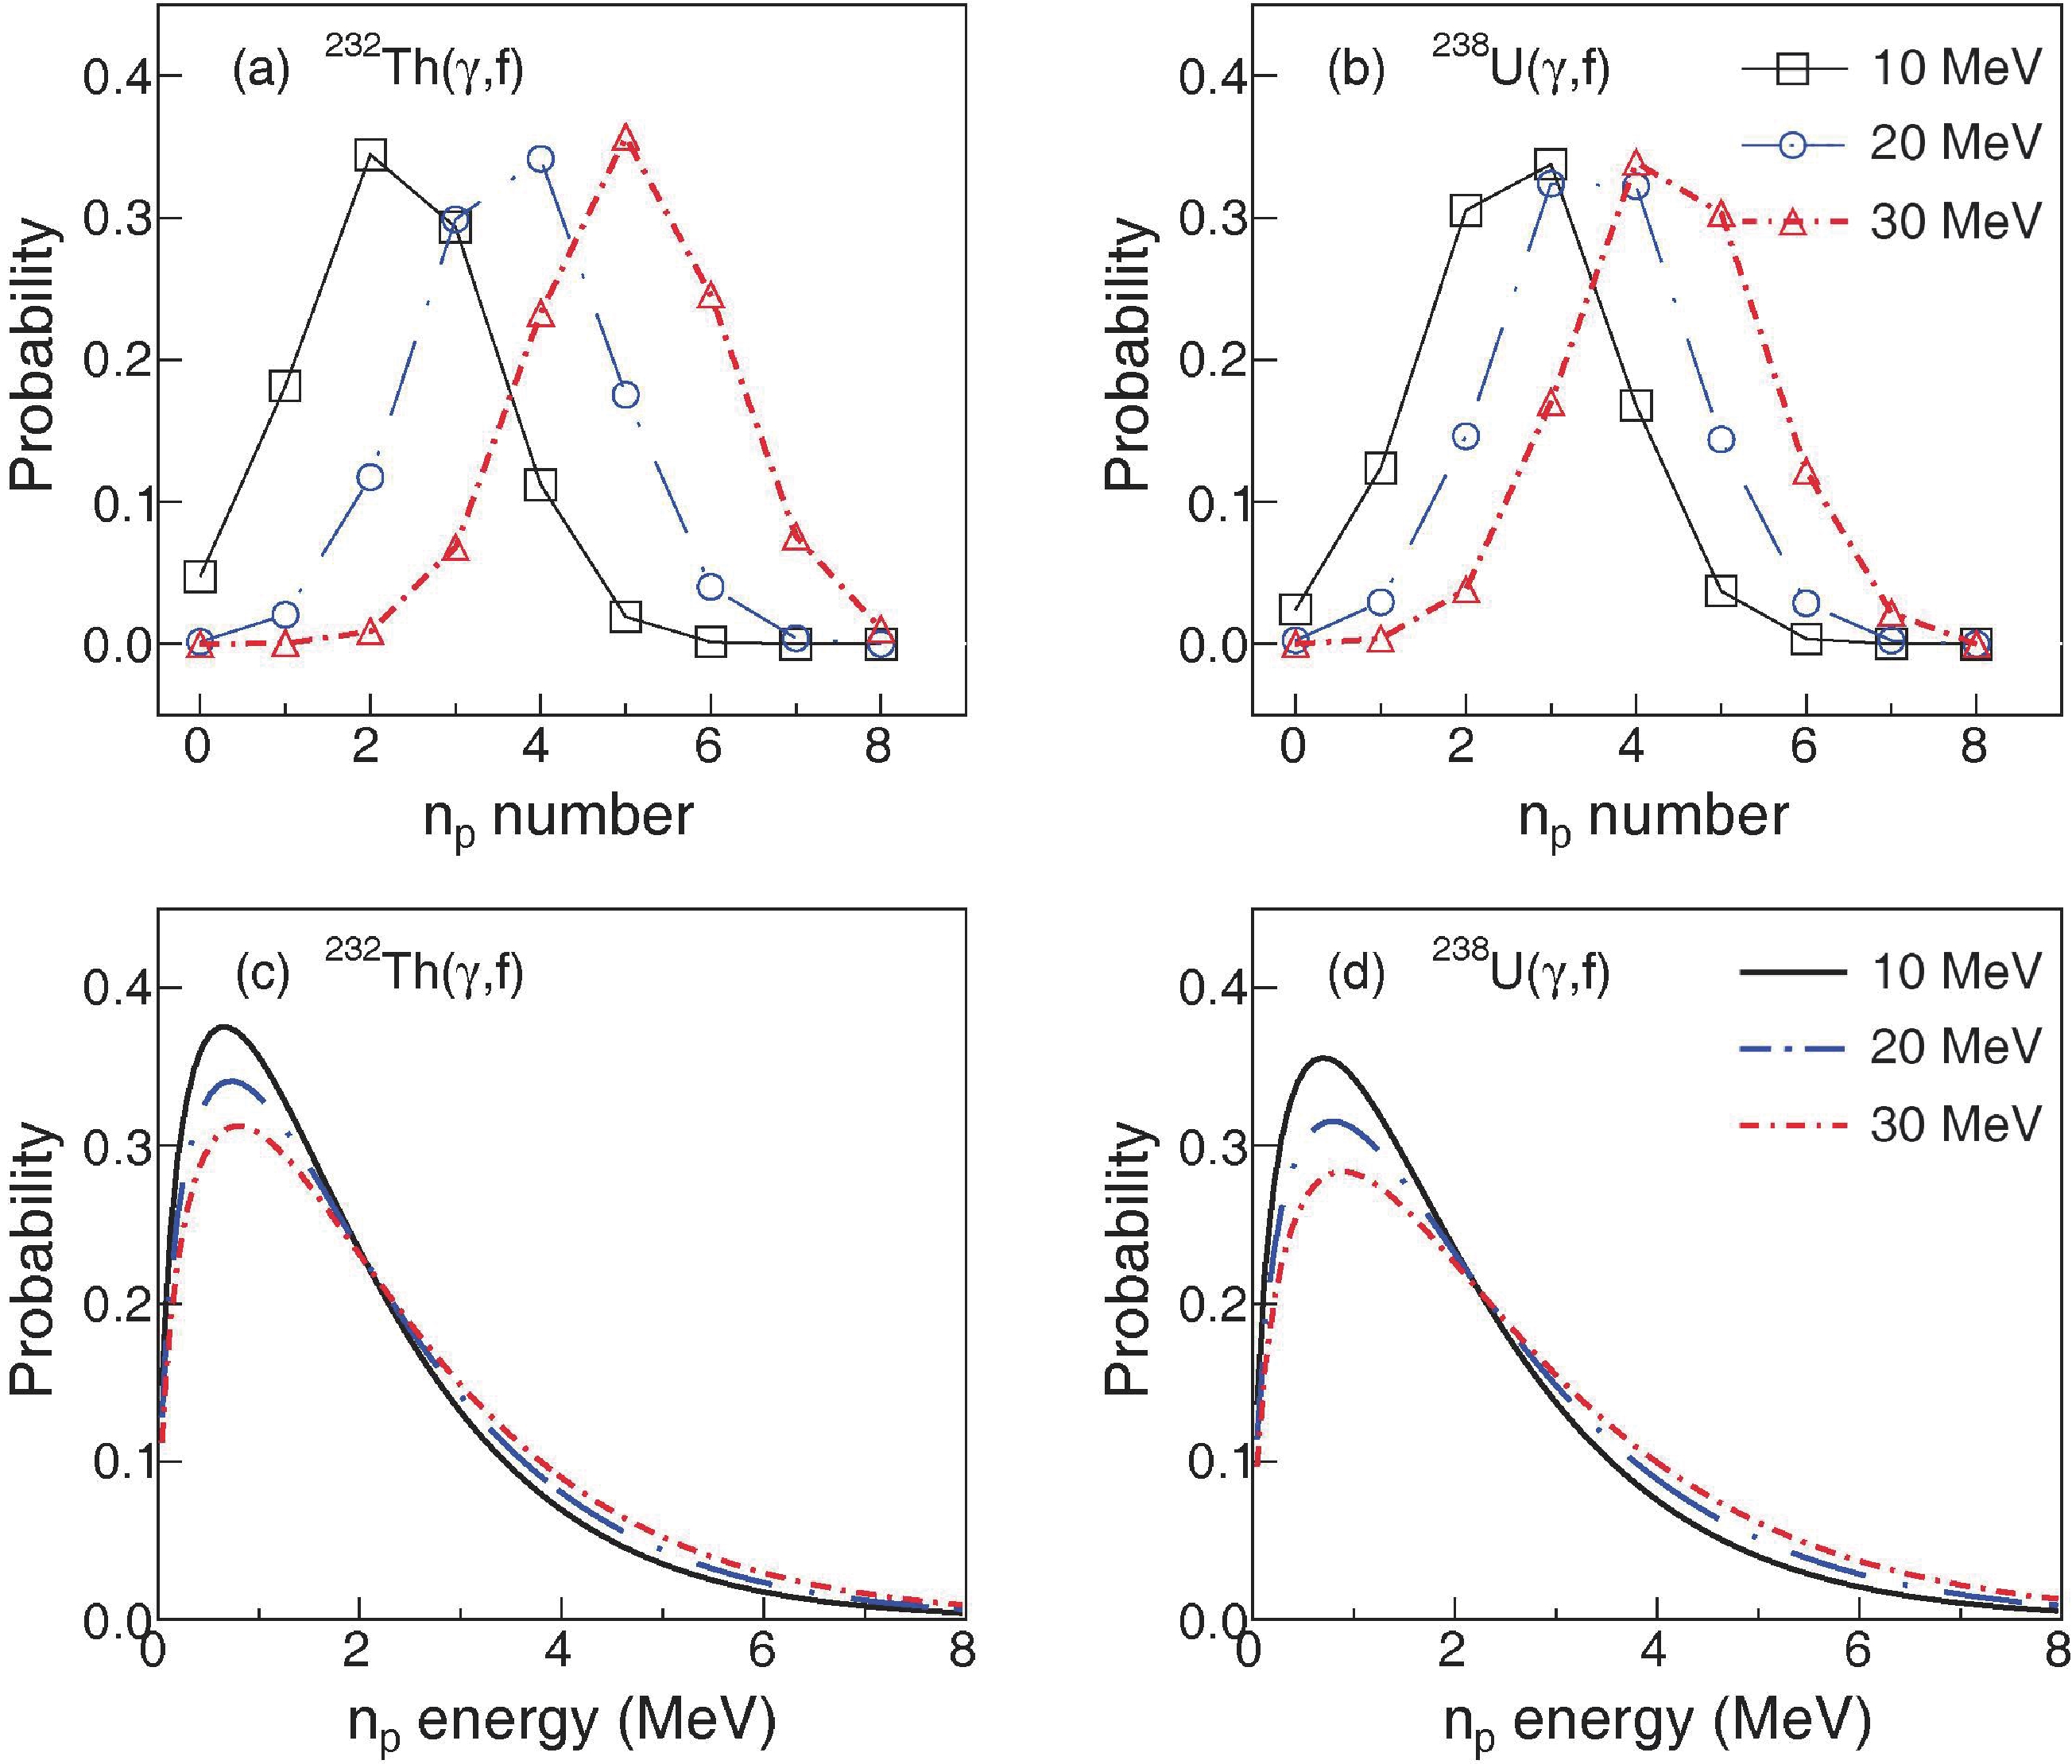
Figure 10. (color online) The predicted np multiplicity and spectral distributions. The Pad (a) and (c) shows the results for 232Th and the Pad (b) and (d) presents the results for 238U.
-
There is a lack of experimental data for γp from photofission, because γp are buried by the much more intense probing photons. In our case, we evaluate the empirical models for γp multiplicity distribution by comparing the experimental data of 239Pu(n, f) [49] with the calculated result of 240Pu(γ, f). The 239Pu(n, f) data is obtained from the integration over the incident neutron energy from thermal point to about 100 keV [49]. Considering the difference of 6.5 MeV in binding energy between 239Pu and 240Pu,
$E^* $ = 6.6 MeV is set for the multiplicity calculations of 240Pu(γ, f) to match the 239Pu(n, f) reaction at En$ \le $ 100 keV, ensuring the formation of 240Pu compound nuclei with the same excitation energy. It is shown in Fig. 11(a) that such multiplicity has a negative binomial distribution, which is calculated by Eq. (12). Such distribution can reproduce well the experimental one. The mean multiplicity is equal to 7.21 and is in good agreement with the experimental value (7.50$ \pm $ 0.3) within statistical uncertainty. Figure 10(b) shows the calculated and experimental γp energy distributions. Since there is no experimental data from photofission, the measured data from 235U(n, f), 239Pu(n, f), and 252Cf(s.f.) [50] are used in the benchmarking process. Although the spectral distribution is calculated with Eq. (13), which is a universal expression, it reproduces the experimental spectra well, thus validating the performance of the framework in making γp predictions.
Figure 11. (color online) The calculated and experimental γp multiplicity (a) and spectral distributions (b). The experimental γp multiplicity and spectral distributions from neutron-induced fissions and spontaneous fission (s.f.) are taken from Ref. [49] and [50], respectively. The γp multiplicity is calculated with Eq. (12) and the spectral distribution is with Eq. (13).
By utilizing this general framework, we further described the γp multiplicity in the cases of 232Th(γ, f
) and 238U(γ, f). The results are shown in Fig. 12. For fixed $E^* $ , the peak value of the probability for 232Th is slightly higher than that for 238U. As a result, 232Th has a lower average number of γp than 238U. It is obvious that both the average multiplicity and width increase with$E^* $ . This effect can be explained by the competition in the emission of γp and np from the de-excitation of fission fragments. Figure 12 shows that at$E^* $ = 10, 20, and 30 MeV, the average number of γp from 232Th(γ, f) are calculated to be 6.63, 8.15, and 9.60, while those from 238U(γ, f) are 7.40, 8.93 and 10.31, respectively.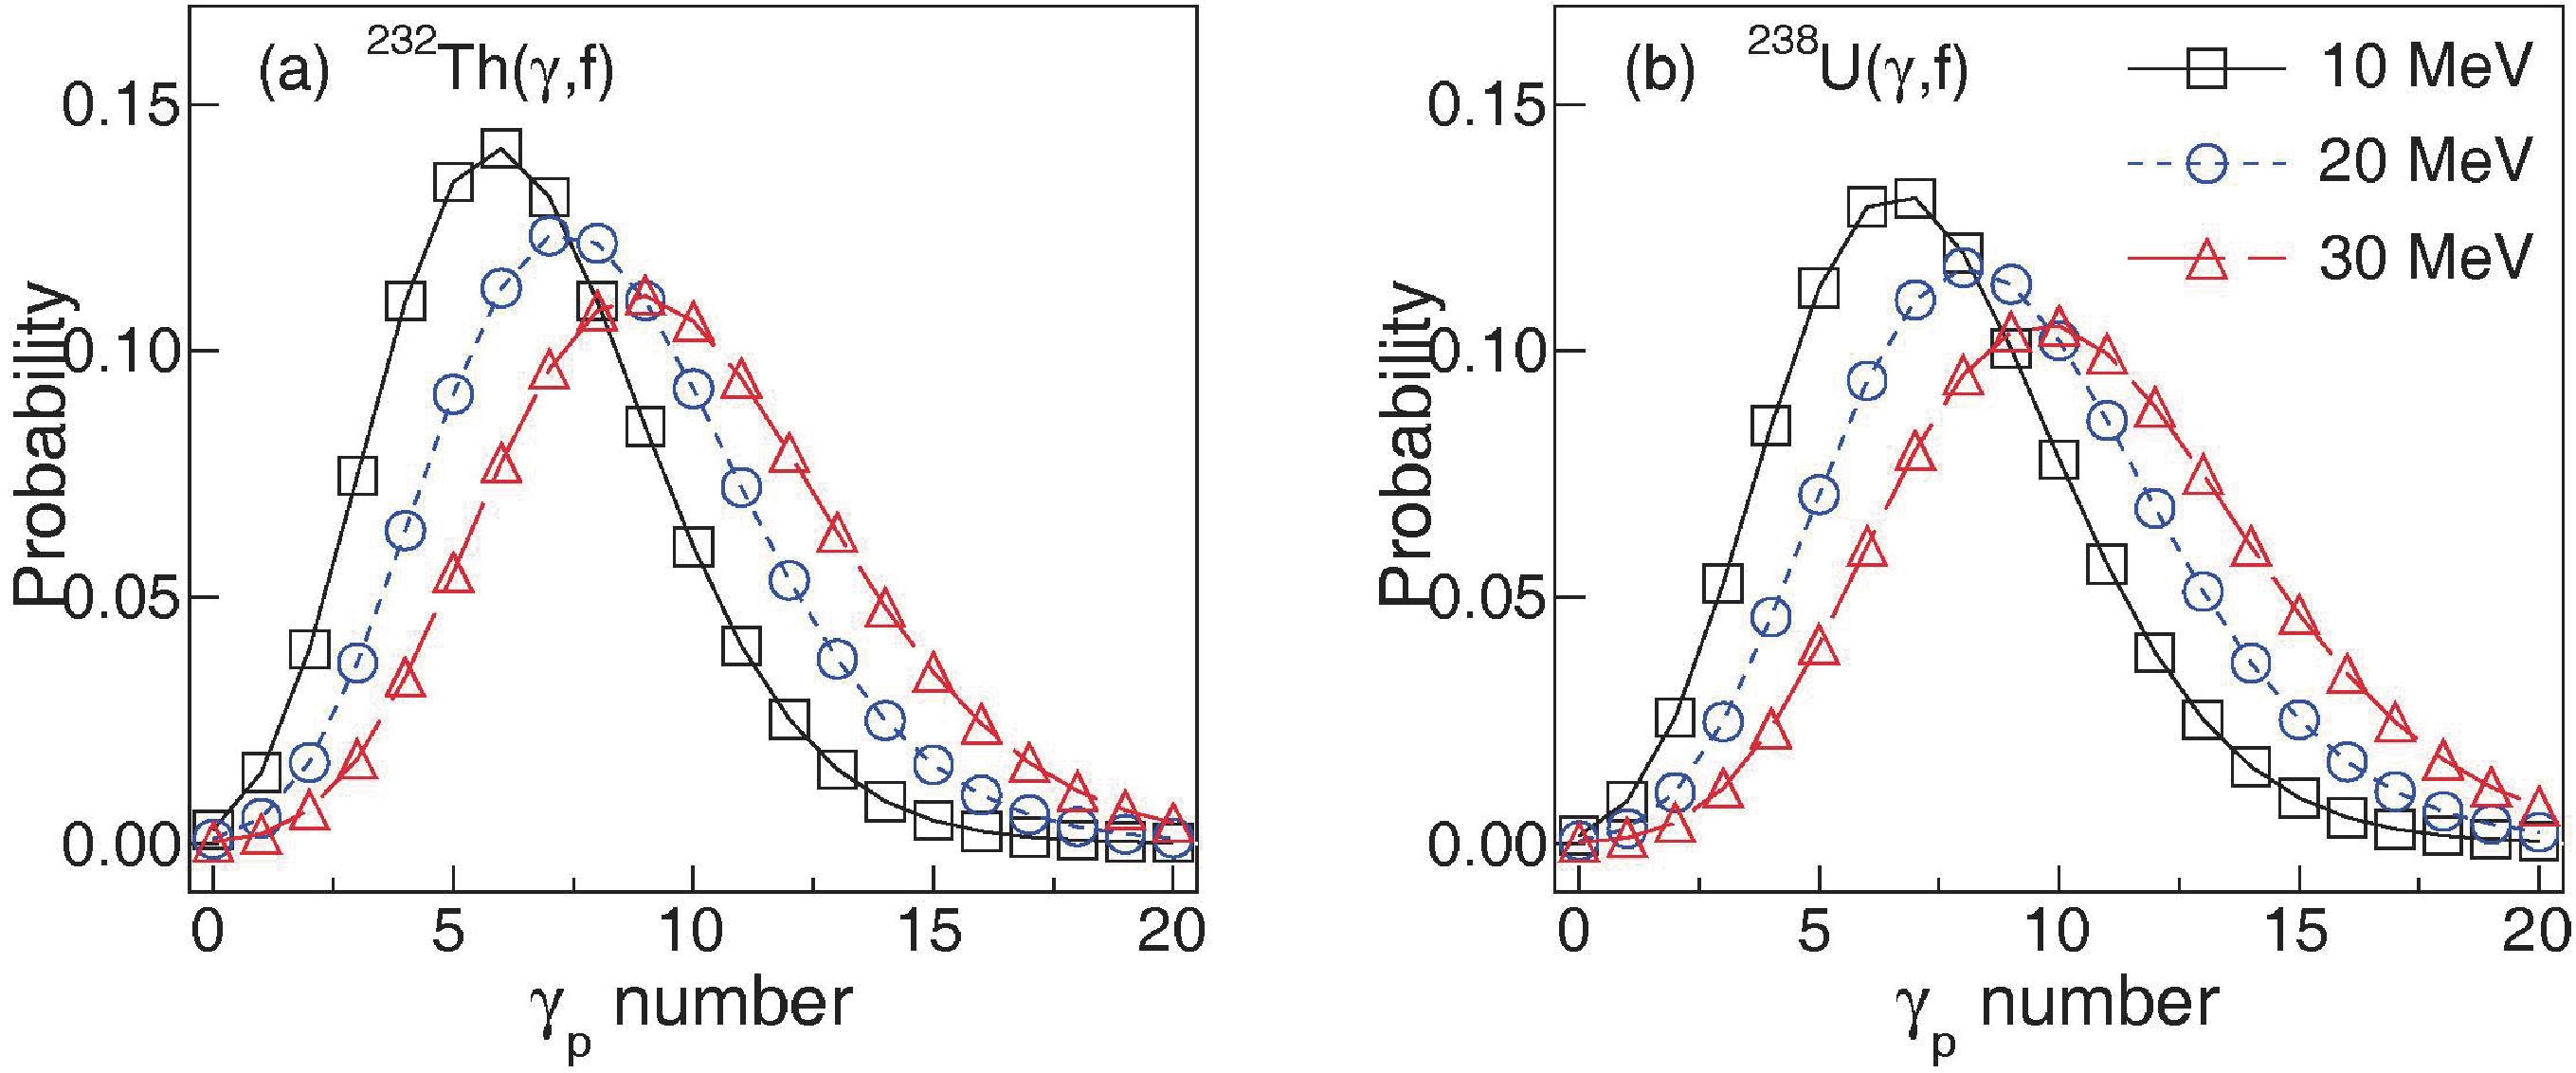
Figure 12. (color online) The predicted γp multiplicity for 232Th (a) and 238U (b).
-
In summary, a general framework has been successfully constructed to predict photofission observables for actinide nuclides at an average excitation energy below 30 MeV. The construction process of this framework is as follows: (1) three systematic neutron fission models on the basis of the Bohr hypothesis are considered to describe the photofission MYD over a broad mass range; (2) two most probable charge models, i.e., the LD model and the systematic model, are used to characterize the ICD of photofission; (3) a few empirical models are employed to predict the multiplicity and energy distributions of np and γp. The results show that the Bohr-substitution G model is more suitable than the F and M models for describing the MYD of the photofission fragments. The most probable charge number of 238U photofission fragments is predicted with both the LD model and the systematic model. The comparison shows that the LD model has a good capability to describe the light fragments (A
$ \le $ $ {A}_{cn}/2 $ ) while the systematic model could predict the heavy fragments (A >$ {A}_{cn}/2 $ ) more reasonably. The empirical models encompassed in the framework describe well the multiplicity and energy distributions of np and γp. These benchmark results suggest that the proposed framework can describe the photofission observables for actinides of interest in a reasonable and reliable way. By utilizing this framework, the$ \sigma (A,Z) $ of neutron-rich exotic nuclei from 232Th(γ, f) and 238U(γ, f) are calculated. It is found that$E^* $ has a great influence on the corresponding$ \sigma (A,Z) $ and 238U(γ, f) is more suitable than 232Th(γ, f) for producing neutron-rich exotic nuclei. The predicted results further show that the average multiplicity number of np and γp increase with average excitation energy, and the width of np multiplicity distribution remains the same while that of γp increases.It should be noted that the construction of such a general framework for photofission is of paramount importance in the following nuclear application scenarios. Firstly, an accurate knowledge of the mass yield and isobaric charge distributions of the fission fragments is essential for guiding the production of neutron-rich nuclides and medical isotopes. Secondly, the emission characteristics of np and γp are of particular interest in nondestructive detection, identification, and quantification of concealed fissionable materials. In addition, a good understanding on γp of photofission is desirable for the design and testing of reactor systems. Consequently, the proposed framework would be a good toolkit for studying the photofission physics of actinides as well as nuclear applications.
-
The authors thank Prof. Xiaohua Li for providing valuable comments and suggestions on this paper.
-
In the Bohr-substitution F model, the photofission MYD is presented by a superposition of three modes of fission:
$ \begin{aligned}[b]Y\left(A\right)=&{C}_{S}G(A,{A}_{cn}/2,{\mu }_{s}\sigma )+{C}_{d}\left[G\right(A,{A}_{d},\sigma )\\&+G(A,{A}_{cn}-{A}_{d},\sigma \left)\right]+ {C}_{m}[G\left(A,{A}_{m},{\mu }_{m}\sigma \right)\\&+G\left(A,{A}_{cn}-{A}_{m},{\mu }_{m}\sigma \right), \end{aligned}\tag{A1}$

where
$ \begin{aligned}[b]G(x,\bar{x},\sigma )=&{\left(\sigma \sqrt{2\pi }\right)}^{-1}\exp[-{\left(x-\bar{x}\right)}^{2}/2{\sigma }^{2}\\{A}_{d}=& 141.0- 0.053\left({E}^{*}-{S}_{n}\right)\\{A}_{m}=&82.3+0.293({N}_{cn}-1)+ 0.1\cdot {Z}_{cn}-0.03\left({E}^{*}-{S}_{n}\right) \end{aligned}$

are the average mass of two heavy asymmetric fission fragments, and three parameters of mass variances
$ \begin{aligned}[b] {\mu }_{s}=&1.4\\{\mu }_{m}=&1.884+0.114\exp[-|\left({N}_{cn}-1\right)- 146.8|]\\&+ 0.267\exp\left\{-{\left[\left({N}_{cn}-1\right)-142.5\right]}^{2}\right\}-0.0094\left({N}_{cn}-1\right)\\ \sigma =&5.7-0.24· \left[149.9-\left({N}_{cn}-1\right)\right]+0.12\left({E}^{*}-{S}_{n}\right)\end{aligned}$

with
$ {N}_{cn} $ being the neutron number of the compound nucleus. The Gaussian parameter$ {C}_{S}=0.01\exp \left[0.46\left({E}^{*}-{S}_{n}\right)\right]$

represents the magnitude of the symmetric fission mode
$ \begin{aligned}[b] {C}_{d}=&2.66\left[169.9-\left({N}_{cn}-1\right)\right]+0.19({A}_{cn}-232.6)\left({E}^{*}-{S}_{n}\right)\\{C}_{m}=&59.3-0.263· \left({N}_{cn}-1\right)-0.017· ({A}_{cn}-235.7) ({E}^{*}- {S}_{n}) \end{aligned}$

are the magnitudes of two asymmetric fission modes, respectively. In addition, the MYD calculation is normalized by a factor C where
$ C=100/\left({C}_{S}/2+{C}_{d}+{C}_{m}\right) $ .In the Bohr-substitution M model, the MYD is expressed as follows:
$\begin{aligned}[b] Y\left(A\right)=&\frac{{n}_{1}}{{\sigma }_{1}\sqrt{2\pi }}\left\{\exp\left[-\frac{{\left(A - \bar{A} - {d}_{1}\right)}^{2}}{2{{\sigma }_{1}}^{2}}\right]\right.\left. +exp\left[-\frac{{\left(A - \bar{A} + {d}_{1}\right)}^{2}}{2{{\sigma }_{1}}^{2}}\right]\right\}\\ &+\frac{{n}_{2}}{{\sigma }_{2}\sqrt{2\pi }}\left\{\exp\left[-\frac{{\left(A-\bar{A}-{d}_{2}\right)}^{2}}{2{{\sigma }_{2}}^{2}}\right]\right.\\ &\left.+\exp\left[-\frac{{\left(A-\bar{A}+{d}_{2}\right)}^{2}}{2{{\sigma }_{2}}^{2}}\right]\right\} +\frac{{n}_{3}}{12\sqrt{2\pi }}\exp\left(\frac{{-\left(A-\bar{A}\right)}^{2}}{288}\right). \end{aligned}\tag{A2} $

Here
$ \bar{A}={(A}_{cn}-1)/2 $ ,$ {n}_{1}=0.00038({A}_{cn}-1)+0.6215 $ ,$ {n}_{2}=0.286 $ and$ {n}_{3}=2-2{n}_{1}-2{n}_{2} $ are the magnitudes of one symmetric and two asymmetric fission modes,$ {\sigma }_{1}=0.2017({A}_{cn}-1)-42.906 $ and$ {\sigma }_{2}=0.1125({A}_{cn}-1)- 24.375 $ are the widths of two asymmetric fission modes, and$ {d}_{1}=183.1136-0.67832\left({A}_{cn}-1\right)+0.01366[\left({\mathrm{A}}_{\mathrm{c}\mathrm{n}}-1\right)- 230]^{2} $ and$ {d}_{2}=156.750-0.595({A}_{cn}-1)+0.00125[({\mathrm{A}}_{\mathrm{c}\mathrm{n}}- 1)-230]^{2} $ are the positions from center.
A general framework for describing photofission observables of actinides at an average excitation energy below 30 MeV
- Received Date: 2022-01-31
- Available Online: 2022-08-15
Abstract: A reasonable prediction of photofission observables plays a paramount role in understanding the photofission process and guiding various photofission-induced applications, such as short-lived isotope production, nuclear waste disposal, and nuclear safeguards. However, the available experimental data for photofission observables are limited, and the existing models and programs have mainly been developed for neutron-induced fission processes. In this study, a general framework is proposed for characterizing the photofission observables of actinides, including the mass yield distributions (MYD) and isobaric charge distributions (ICD) of fission fragments and the multiplicity and energy distributions of prompt neutrons (np) and prompt γ rays (γp). The framework encompasses various systematic neutron models and empirical models considering the Bohr hypothesis and does not rely on the experimental data as input. These models are then validated individually against experimental data at an average excitation energy below 30 MeV, which shows the reliability and robustness of the general framework. Finally, we employ this framework to predict the characteristics of photofission fragments and the emissions of prompt particles for typical actinides including 232Th, 235, 238U and 240Pu. It is found that the 238U(γ, f) reaction is more suitable for producing neutron-rich nuclei compared to the 232Th(γ, f) reaction. In addition, the average multiplicity number of both np and γp increases with the average excitation energy.


 DownLoad: