


 Abstract
 HTML
HTML Reference
 Related
 PDF
PDF


-
Spallation reactions play an important role in various fields ranging from the design of accelerator-driven systems, radiation protection, radioactive ion-beam facilities, detector set-ups, and spallation targets for neutron-sources for experiments in nuclear physics, astrophysics, and particle physics [1–3]. During the spallation reaction, the projectile with energy of 60–3000 MeV/nucleon reacts intensively with the target nucleus and produces excited pre-fragments. The residual nuclei are eventually formed by de-excitation of pre-fragments. In 2008, the benchmark of spallation models was promoted by the International Atomic Energy Agency (IAEA) [1, 3]. There are 17 participating spallation models generally coupling Monte-Carlo implementations of intra-nuclear cascade (INC) or quantum molecular dynamics (QMD) models and a statistical-decay model. Some of these models, such as INCL45-GEMINI++ model and INCL45-Abla07 model, reproduce the data with relatively good quality [1, 4–8]. In addition to the two-step models in IAEA benchmark, Geant4-based models such as the MCADS were also developed to study spallations [9]. Because spallation model calculations can be quite time consuming, some fast and accurate empirical parameterizations, such as EPAX [10] and FRACS [11], were also developed to study the residue-production cross sections in spallation.
The three main mechanisms for the de-excitation of pre-fragments in spallation reactions are evaporation, fission, and multifragmentation. Fission has been widely used to produce nuclides far from the β-stability line with the purpose of studying the properties in the isospin degree of freedom [12, 13]. A series of studies have shown that fission is the most efficient production mechanism for medium-mass neutron-rich nuclei [14–21]. Therefore, in next-generation radioactive-beam facilities based on isotope separation online or in-flight separation techniques, the fission of heavy nuclei like 238U will be used to populate the neutron-rich region of the nuclide chart [22, 23]. Projectile-like products in spallation are also of great interest to experimentalists. The spallation of 238U is expected to produce new nuclides such as 207Th and 210Pa in the region of A = 200–220 [24, 25]. To select targets in new nuclide generation experiments, the target dependence of the isotopic cross sections produced in the spallations of 238U need to be studied.
To this end, the production cross sections in the spallation reactions of heavy nuclei have been systematically measured. For example, 238U + p at 1 A GeV [3, 26–28], 238U + d at 1 A GeV [29–33] and 238U + 9Be at 0.95-1 A GeV [23, 25, 34] were studied experimentally. Data of the 238U + p and 238U + d reactions are relatively rich, and the minimal magnitude of measured cross section is about 10
$ ^{-3} $ mb. The 238U + 9Be reaction has less data, especially for some neutron-rich nuclei; however, the lowest measured cross section reached 10$ ^{-6} $ mb.In the spallation models benchmark promoted by the IAEA, only 238U + p was investigated. The INCL45-GEMINI++ model and INCL45-Abla07 models are two of the best performing models [1, 3]. However, difficulties still exist in predictions by these models because spallation reactions occur in a large range of incident energies and systems, and residues are distributed over a wide range of charge and mass numbers [35]. It is still an open question whether those difficulties are due to the missing mean fields in the cascade model INCL45. Meanwhile, more experimental data are measured after the IAEA benchmark. Thus, in this work, the isospin-dependent quantum molecular dynamics (IQMD) model, where the mean fields are considered, is used to study the non-equilibrium thermalization of 238U nuclei and the fragmentation of the hot system. The GEMINI++ model is applied to simulate the subsequent decay of the pre-fragments.
Recently, the Bayesian neural network (BNN) method has been applied to solve prediction problems in nuclear physics. It has been proposed that the BNN can fine tune physics motivated models by modeling the residuals. For example, the BNN method has achieved considerable success in predicting nuclear mass [36, 37], nuclear charge radii [38], and neutron drip line [39]. In Ref. [35], the BNN method was also proved to be an effective method for predicting the residue-production cross sections in proton induced spallation reactions. In this work, the two-step model and the BNN algorithm were combined to calculate the isotopic cross sections produced in reactions of 238U + p, d and 9Be at 1 A GeV. The target dependence of the isotopic cross sections produced in the spallation is studied on the basis of the available experimental data and calculations by the IQMD-GEMINI++-BNN model. This paper is organized as follows. In Sec. II, the theoretical framework is described. In Sec. III, both the results and discussions are presented. Finally, Sec. IV presents the conclusions and perspectives for future studies.
-
The early review of the quantum molecular dynamics model dates back to 1991 [40]. The isospin-QMD (IQMD) model was developed earlier [41]. The code version in this work is IQMD-BNU (Beijing Normal University), which has been introduced and compared to other versions within the transport model evaluation project [42–45]. During the recent decade, the IQMD-BNU model has been developed in several aspects to study the mechanism of the fragmentation [46, 47]. By coupling with the GEMINI code, it has been applied to predict the cross sections in the spallation [48, 49]. In order to study the spallation reactions 238U + p, d and 9Be at 1 A GeV, where the fission is significant, the IQMD-BNU code is coupled with the improved version GEMINI++ in this work.
-
In the IQMD model, the wave function of a single nucleon is represented by a Gaussian wave packet:
$ \phi({\boldsymbol{r}},t) = \prod\limits_{i=1}^{N} \frac{1}{(2\pi L)^{3/4}} {\rm e}^{-{[{\boldsymbol{r}}-{\boldsymbol{r}}_{i}(t)]^2}/{4L}} {\rm e}^{ {{\rm i}{\boldsymbol{r}}\cdot{\boldsymbol{p}}_{i}(t)}/{\hbar}}, $

(1) where
$ {\boldsymbol{r}}_{i} $ and$ {\boldsymbol{p}}_{i} $ represent the average position and the mean momentum of the i-th nucleon, respectively, and the parameter L is relevant to the square of the width of the Gaussian wave packet for each nucleon. For the actual calculation, L is 1 fm2.An N-body wave function is used to describe the nucleus system, which is assumed to be the direct product of these Gaussian wave packets. By applying the Wigner transformation to the N-body wave function, the N-body phase space density function can be obtained [40, 50, 51],
$ f({\boldsymbol{r}},{\boldsymbol{p}},t) = \sum\limits_{i=1}^{N}\frac{1}{(\pi\hbar)^3} {\rm e}^{{-{[{\bf{r}}-{\boldsymbol{r}}_{i}(t)]^2}/{2L}}} {\rm e}^{{-{[{\boldsymbol{p}}-{\boldsymbol{p}}_{i}(t)]^2 \cdot 2L}/{\hbar^2}}}. $

(2) The local density can be calculated by integrating the momentum of the phase-space density function,
$ \rho({\boldsymbol{r}},t) = \frac{1}{(2\pi L)^{3/2}} \sum\limits_{i=1}^{N} {\rm e}^{{-{[{\boldsymbol{r}}-{\boldsymbol{r}}_{i}(t)]^2}/{2L}}}. $

(3) Then, the Hamiltonian of baryons can be expressed as the density functional,
$ H = T + U_{\rm Coul} + \int V [\rho ({\boldsymbol{r}})] {\rm d}{\boldsymbol{r}}, $

(4) where T is the kinetic energy,
$ U_{\rm Coul} $ is the Coulomb potential energy, and the last term is the nuclear potential energy. The nuclear potential energy density V of the asymmetric nuclear matter is the function of density ρ and asymmetry δ,$ V(\rho, \delta) = \frac{\alpha}{2} \frac{\rho^2}{\rho_0} + \frac{\beta}{\gamma+1} \frac{\rho^{\gamma+1}}{\rho_0^{\gamma}} + \frac{C_{sp}}{2}\left(\frac{\rho}{\rho_{0}}\right)^{\gamma_{i}} \rho \delta ^{2}, $

(5) where
$ \rho_0 $ is the normal density. The parameters used in this paper are α = −356.00 MeV, β = 303.00 MeV, γ = 7/6,$ C_{sp} $ = 38.06 MeV, and$ \gamma_{i} $ = 0.75.Under the self-consistently generated mean field, the time evolution of the nucleons in the system is determined by Hamiltonian equations of motion,
$ \dot{{\boldsymbol{r}}}_{i} = \nabla_{{\boldsymbol{p}}_{i}} H , \dot{{\boldsymbol{p}}}_{i} = -\nabla_{{\boldsymbol{r}}_{i}} H . $

(6) In order to simulate the effect of the short-range repulsive residual interaction together with the stochastic change of the phase-space distribution, the binary nucleon-nucleon (NN) collisions are included in the IQMD model. The differential cross section of the NN collisions is written as
$ \left( \frac{{\rm d} \sigma}{{\rm d} \Omega} \right)_{i} = \sigma _{i}^{\rm free} f_{i}^{\rm angl} f _{i}^{\rm med}, $

(7) where
$ \sigma^{\rm free} $ is the cross section of the NN collisions in free space,$ f^{\rm angl} $ is the factor of the angular distribution and$ f^{\rm med} $ is the in-medium correction factor. The subscript i represents different channels of the NN collision: proton-proton scattering ($ i = pp $ ), elastic neutron-neutron scattering ($ i = nn $ ), elastic neutron-proton scattering ($ i = np $ ), and inelastic NN collision including NNNΔ and NΔNN channels. The isospin-dependent parametrization of$ \sigma^{\rm free} $ and$ f^{\rm angl} $ adopted in this work is referred from Ref. [52]. The in-medium factor for elastic scatterings taken from Ref. [53] is written as$ \begin{aligned}[b] f _{el}^{\rm med} = \sigma _{0} / \sigma _{i}^{\rm free} {\rm tanh}(\sigma _{i}^{\rm free} / \sigma_{0}), \quad \sigma _{0} = 0.85 \rho^{-2/3}. \end{aligned} $

(8) In order to enhance the stability and mimic the fermionic nature of the N-body system, the method of the phase-space density constraint (PSDC) in the constrained molecular dynamics model [54] and the Pauli blocking are applied in the IQMD model. According to PSDC, the integration is performed at each time step on a hypercube with volume
$ h^{3} $ , centered around the i-th nucleon ($ r_i $ ,$ p_i $ ) in the phase space. The phase space occupancy probability$ f_i $ of the i-th nucleon is calculated as follows:$ \overline{f}_{i} = \sum\limits_{n} \delta _{\tau_{n},\tau_{i}} \delta _{s_{n},s_{i}} \int _{h^{3}} \frac{1}{\pi ^{3} \hbar ^{3}} {\rm e}^{ -\frac{(\boldsymbol{r}-\boldsymbol{r}_{n})^{2}}{2L} -\frac{(\boldsymbol{p}-\boldsymbol{p}_{n})^{2}L}{\hbar ^{2}} } {\rm d}^{3}r{\rm d}^{3}p, $

(9) where
$ \tau_i $ and$ s_i $ represent the isospin degree of freedom and the spin projection quantum number, respectively. In the IQMD model,$ f_i $ is judged by an adjustable value$k_{\rm fcon}$ at each time step. If$ f_i > k_{\rm fcon} $ , the momenta of the i-th nucleon will be changed by applying the momentum exchange between multiple particles. The NN collisions result is accepted only when the$ f_i $ of each nucleon in the final state is less than$ k_{\rm fcon} $ . In actual calculations,$ k_{\rm fcon} $ = 1.15 was used. -
The calculation in this study is a two-step process, which includes both dynamical and statistical codes. When the excitation energies of the heaviest prefragment are less than a specified parameter
$ E_{\rm stop} $ , the simulation of IQMD will stop. The prefragments are formed, and the GEMINI++ code will be switched on. The GEMINI++ model was developed by R. J. Charity [6–8]; it is the improved version of the GEMINI statistical decay model. GEMINI++ aims at describing the formation of complex fragments in heavy-ion fusion experiments. A sequence of binary-decays is used to simulate the de-excitation process of the compound nucleus. It allows binary decays including light-particle evaporation and symmetric fission. The binary-decay will not stop until the particle emission becomes energetically forbidden or impossible due to competition with γ-ray emission. In this study, the$ a_{f}/a_{n} $ ratio is 1.036, the transient time (fission delay) is 1 zs, and the fission barrier is 1 MeV. For the mode used for evaporation, the widths and the kinetic energy of particle are calculated from Weisskopf-Ewing evaporation formalism, but the spin and orbital angular momentum are calculated from Hauser-Feshbach formalism. The GEMINI++ parameters used in this study are referred from Ref. [7]. -
The foundation in the area of BNN can be found in Ref. [55]. Here it is introduced briefly. The neural network with hidden layers is established to map the input layer X to the output layer Y. In the case of one hidden layer, the mapping relationship is
$ Y(X, \theta) = a+\sum\limits_{j=1}^{H}b_j{\rm{logsig}}\left(c_j+\sum\limits_{i=1}^{l}d_{ji}X_i\right), $

(10) where
$ \theta = \{a, b_j, c_j, d_{ji}\} $ are the parameters in the neural network,$ \{a, c_j\} $ are biases, and$ \{b_j, d_{ji}\} $ are weights. The sigmoid function$ {\rm{logsig}} $ is used as the activation function. H is the number of hidden neurons, and l is the number of the input neurons. The activation function was calculated on each hidden neuron after the linear combination of inputs, and then the results were propagated to the output layer by linear transformation. In this work, the output layer Y is one-dimensional, i.e., the deviation of the cross section between the data and the calculations by IQMD-GEMINI++ model. Because the projectile nucleus (238U) and the incident energy (1 A GeV) are the same for the three involved reactions, the cross section data are indexed by the mass number of target$ A_t $ , the charge number$ Z_f $ and mass number$ A_f $ of the fragments. However, from a physical standpoint, the geometric cross section depends on the radius$ r_t $ rather than the mass number, whereas the cross sections of the fragments are related to their ground-states properties. It has been shown in our previous work that using ground-states properties in the input layer could provide physics guides in Bayesian neural networks for learning the data of giant dipole resonance [56]. After selecting by the deviation analysis, we set the inputs as X =$ \{X_1,X_2,...,X_l\} $ =$ \{r_t,N_f,\delta_f,Q_{p\alpha},B, E_{sh},\beta_2,Q_{\beta n}\} $ , where$ N_f $ is the neutron number,$ \delta_f $ is isospin asymmetry,$ Q_{p\alpha} $ is the Q-value of (p, α) reaction, B is the binding energy per nucleon,$ E_{sh} $ is the shell correction,$ \beta_2 $ is the quadrupole deformation, and$ Q_{\beta n} $ is the Q-value of ($ \beta^{-} $ , n) reaction. The training data of the above ground-states properties of the fragments are taken from [57–60].Using the Bayesian probabilistic model, the parameters θ in the neural network are expanded to random variables with distributions. The posterior distribution of parameters θ given data set D is expressed as follows:
$ P(\theta|D) = \frac{P(D|\theta)P(\theta)}{\int P(D|\theta)P(\theta){\rm{d}}\theta}, $

(11) where
$ P(\theta) $ is the prior distribution of θ, and$ P(D|\theta) $ is the likelihood of D given θ. The integral in the denominator is called evidence and can be considered as prior distribution of D. Eq. (11) is the fundamental theorem in probability theory and statistics, which describes the probability of an event based on prior knowledge of conditions. Here, an event is a set of parameters θ in the neural network, and the prior knowledge is the experimental data in the 238U + p, d and 9Be reactions near 1 A GeV. The given dataset$ D = \{X^{(n)},Y^{(n)}\}_{n=1}^{N_{d}} $ includes the available experimental data of the production cross sections in the reactions and the ground-states properties of the corresponding targets. In total, there are 3282 datasets, i.e.,$ N_{d} $ = 3282.The prediction of output variable
$ Y^{*} $ given the input variables$ X^{*} $ is as follows:$ P(Y^{*}|X^{*}, D)= \int P(Y^{*}|X^{*}, \theta)P(\theta|D){\rm d}\theta. $

(12) We relied on the Monte Carlo (MC) techniques to calculate the above integration. In MC, the samples are drawn from the posterior distributions:
$ \begin{aligned}[b] P(Y^{*}|X^{*}, D)&=E_{P(\theta|D)}P(Y^{*}|X^{*}, \theta)\\ &\approx\frac{1}{N_s}\sum\limits_{i}^{N_s}P(Y^{*}|X^{*}, \theta^{(i)}), \end{aligned} $

(13) where
$ \theta^{(i)} $ ($ i=1,2,\ldots, N_s $ ) are the samples drawn from$ P(\theta|D) $ , and$ P(Y^{*}|X^{*}, \theta^{(i)}) $ is the estimated value of$ Y^{*} $ given the neural network as shown in Eq. (10).As the computation of the posterior distribution
$ P(\theta|D) $ is intractable due to the high dimension of parameters, we applied the Variation Inference (VI) to find an approximation of$ P(\theta|D) $ . Compared to Markov Chain Monte Carlo (MCMC), VI is computationally faster and has an explicit objective function [61]. VI tries to find κ so that$ q(\theta|\kappa) $ is of minimum distance from$ P(\theta|D) $ measured by KL divergence:$ \begin{aligned}[b] \theta =&\arg\min{\rm{KL }}[q(\theta|\kappa)||P(\theta|D)] \\ =&\arg\min E_{q(\theta|\kappa)}\left[\log \frac{q(\theta|\kappa)}{P(\theta|D)}\right] \\ =&\arg\min E_{q(\theta|\kappa)}\left[\log \frac{q(\theta|\kappa)P(D)}{P(D|\theta)P(\theta)}\right] \\ =&\arg\min \sum\limits_{i}\big[\log q(\theta^{(i)}|\kappa) - \log P(\theta^{(i)}) \\ &- \log P(D|\theta^{(i)})\big], \end{aligned} $

(14) where
$ D={(X, Y)} $ ,$ P(\theta) $ is the prior distribution of the parameters, and$ P(D|\theta) $ is the likelihood of the data Y given the parameters θ and X.There were 3282 datasets. One hidden layer with 30 neurons was employed. The standard normal distribution was used as the prior of weights. Then, 8000 iterations were considered for the variation inference, and 10000 samples were drawn for each predicted variable.
-
Generally, the decay mechanisms of the hot nuclei produced in the spallation include light particle evaporation, fission, and multifragmentation, which can be exhibited in the charge or mass distribution of the productions. As an example, Fig. 1 shows the cases of 238U + p reaction at 1 GeV and the main regions contributed by the three reaction mechanisms are marked. The calculations by the IQMD-GEMINI++ model are compared with the experimental data. In the benchmark of spallation model promoted by IAEA [1, 3], the INCL45-GEMINI++ and INCL45-Abla07 models are two of the best performing models [1, 4]. The corresponding calculations and the Root Mean Squared Error (RMSE) of the mass distribution for the three models are also shown in the figure. A significant difference between INCL45 and IQMD models is that the mean field is missing in the INCL45 model, while it is an important input in the IQMD model. The impact of the mean field will be shown in the following comparison.

Figure 1. (color online) (a) Charge and (b) mass distribution of productions in 238U + p reaction at 1 A GeV. The (red) solid curves represent the calculations by the IQMD-GEMINI++ model. The (blue) dashed curves and (green) dash-dotted curves represent respectively those by the INCL45-GEMINI++ model and INCL45-Abla07 model, which are taken from Refs. [1, 3]. The circles are the experimental data, which are taken from Refs. [2, 26–28]. The Root Mean Squared Error (RMSE) of the mass distribution for the three models are marked.
Projectile-like products with Z = 70–92 or A = 170–240 are mainly produced by the light particle evaporation. In the evaporation process, the excited nucleus, which is formed after part of the incident energies are dissipated, will release one or more light particles (including n, p, 4He, and so on) to generate residual nuclei with a mass number slightly less than the projectile. In this region, the IQMD-GEMINI++ model reproduces experimental data better than the INCL45-GEMINI++ and the INCL45-Abla07 models. Both the INCL45-GEMINI++ and the INCL45-Abla07 models give an observable valley at A = 200–220, which caused the difference here to increase sharply. At the valley near A = 170, these two models also underestimate the cross sections. In the above two regions, the IQMD-GEMINI++ model reproduces the experimental data better. The yield of fragments with A = 200–220 is of great interest to those who plan to produce rare isotopes near the neutron shell N = 126 using the 238U beam [24, 25]. Our model helps in providing a precise prediction of these yields.
Residuals with Z = 20–70 or A = 50–170 are mainly produced by fission. During the fission process, the excited nucleus splits into two fragments accompanied by neutron emission. The fission can be asymmetric or symmetric. The fission of 235U induced by thermal neutrons is typically asymmetric. In the case of high excitation energy, the symmetric fission is more likely to occur. Thus, the fission in 238U + p reaction at 1 A GeV produced a high and wide single peak. However, the peak is not completely symmetric. Near A = 132, the experimental data display a sub-peak, which is not obvious but visible. This phenomenon is caused by the shell of Z = 50 and N = 82. All three models reproduce the overall trend, but only the calculations by the INCL45-Abla07 model are asymmetric. Concerning the main peak of experimental data, the IQMD-GEMINI++ model reproduce the width and the peak position but underestimated its value. The INCL45-GEMINI++ and INCL45-Abla07 models reproduce the peak value, but overestimate in the cross sections near A = 80.
The intermediate-mass fragments (IMFs) with Z = 3–20 and A = 10–50 are mainly produced by the multifragmentation. The multifragmentation is generally considered as a quasisimultaneous process and occurs only when the mother nucleus is highly excited. It is proposed in Ref. [62] that the threshold energy for the multifragmentation is about 3 MeV/nucleon. During this process, the mother nucleus quasi-simultaneously breaks up into multiple clusters and nucleons. It is shown that the IQMD-GEMINI++ model underestimates the cross sections of IMFs. Therefore, further study of the multifragmentation and improvement of the IQMD-GEMINI++ model are needed.
In general, from the distribution in Fig. 1 and the RMSE, it can be seen that the performance of the INCL45-Abla07 model is the best in the entire range. However, following the same decay model GEMINI++, the IQMD model reproduces the data better than the INCL45 model. The IQMD model and INCL45 model differ in a number of ways, and one of the main contributors to the differences in calculations is the mean field. Other comparisons may be a more interesting question.
The IQMD-GEMINI++ model is evaluated in detail using the isotope distributions of the productions. Some examples are shown as sub-figures in Fig. 2, where the calculations by the IQMD-GEMINI++ and INCL45-GEMINI++ models are compared with experimental data. The advantages of the IQMD-GEMINI++ model can be observed from the isotope distributions of the At, Pb, Yb, and Tb chains [Fig. 2(b)–(e)]. For other isotope chains, the disparities still exist. The logarithmic difference
$ {\rm dlog}(Z,N) $ between data and calculations is defined,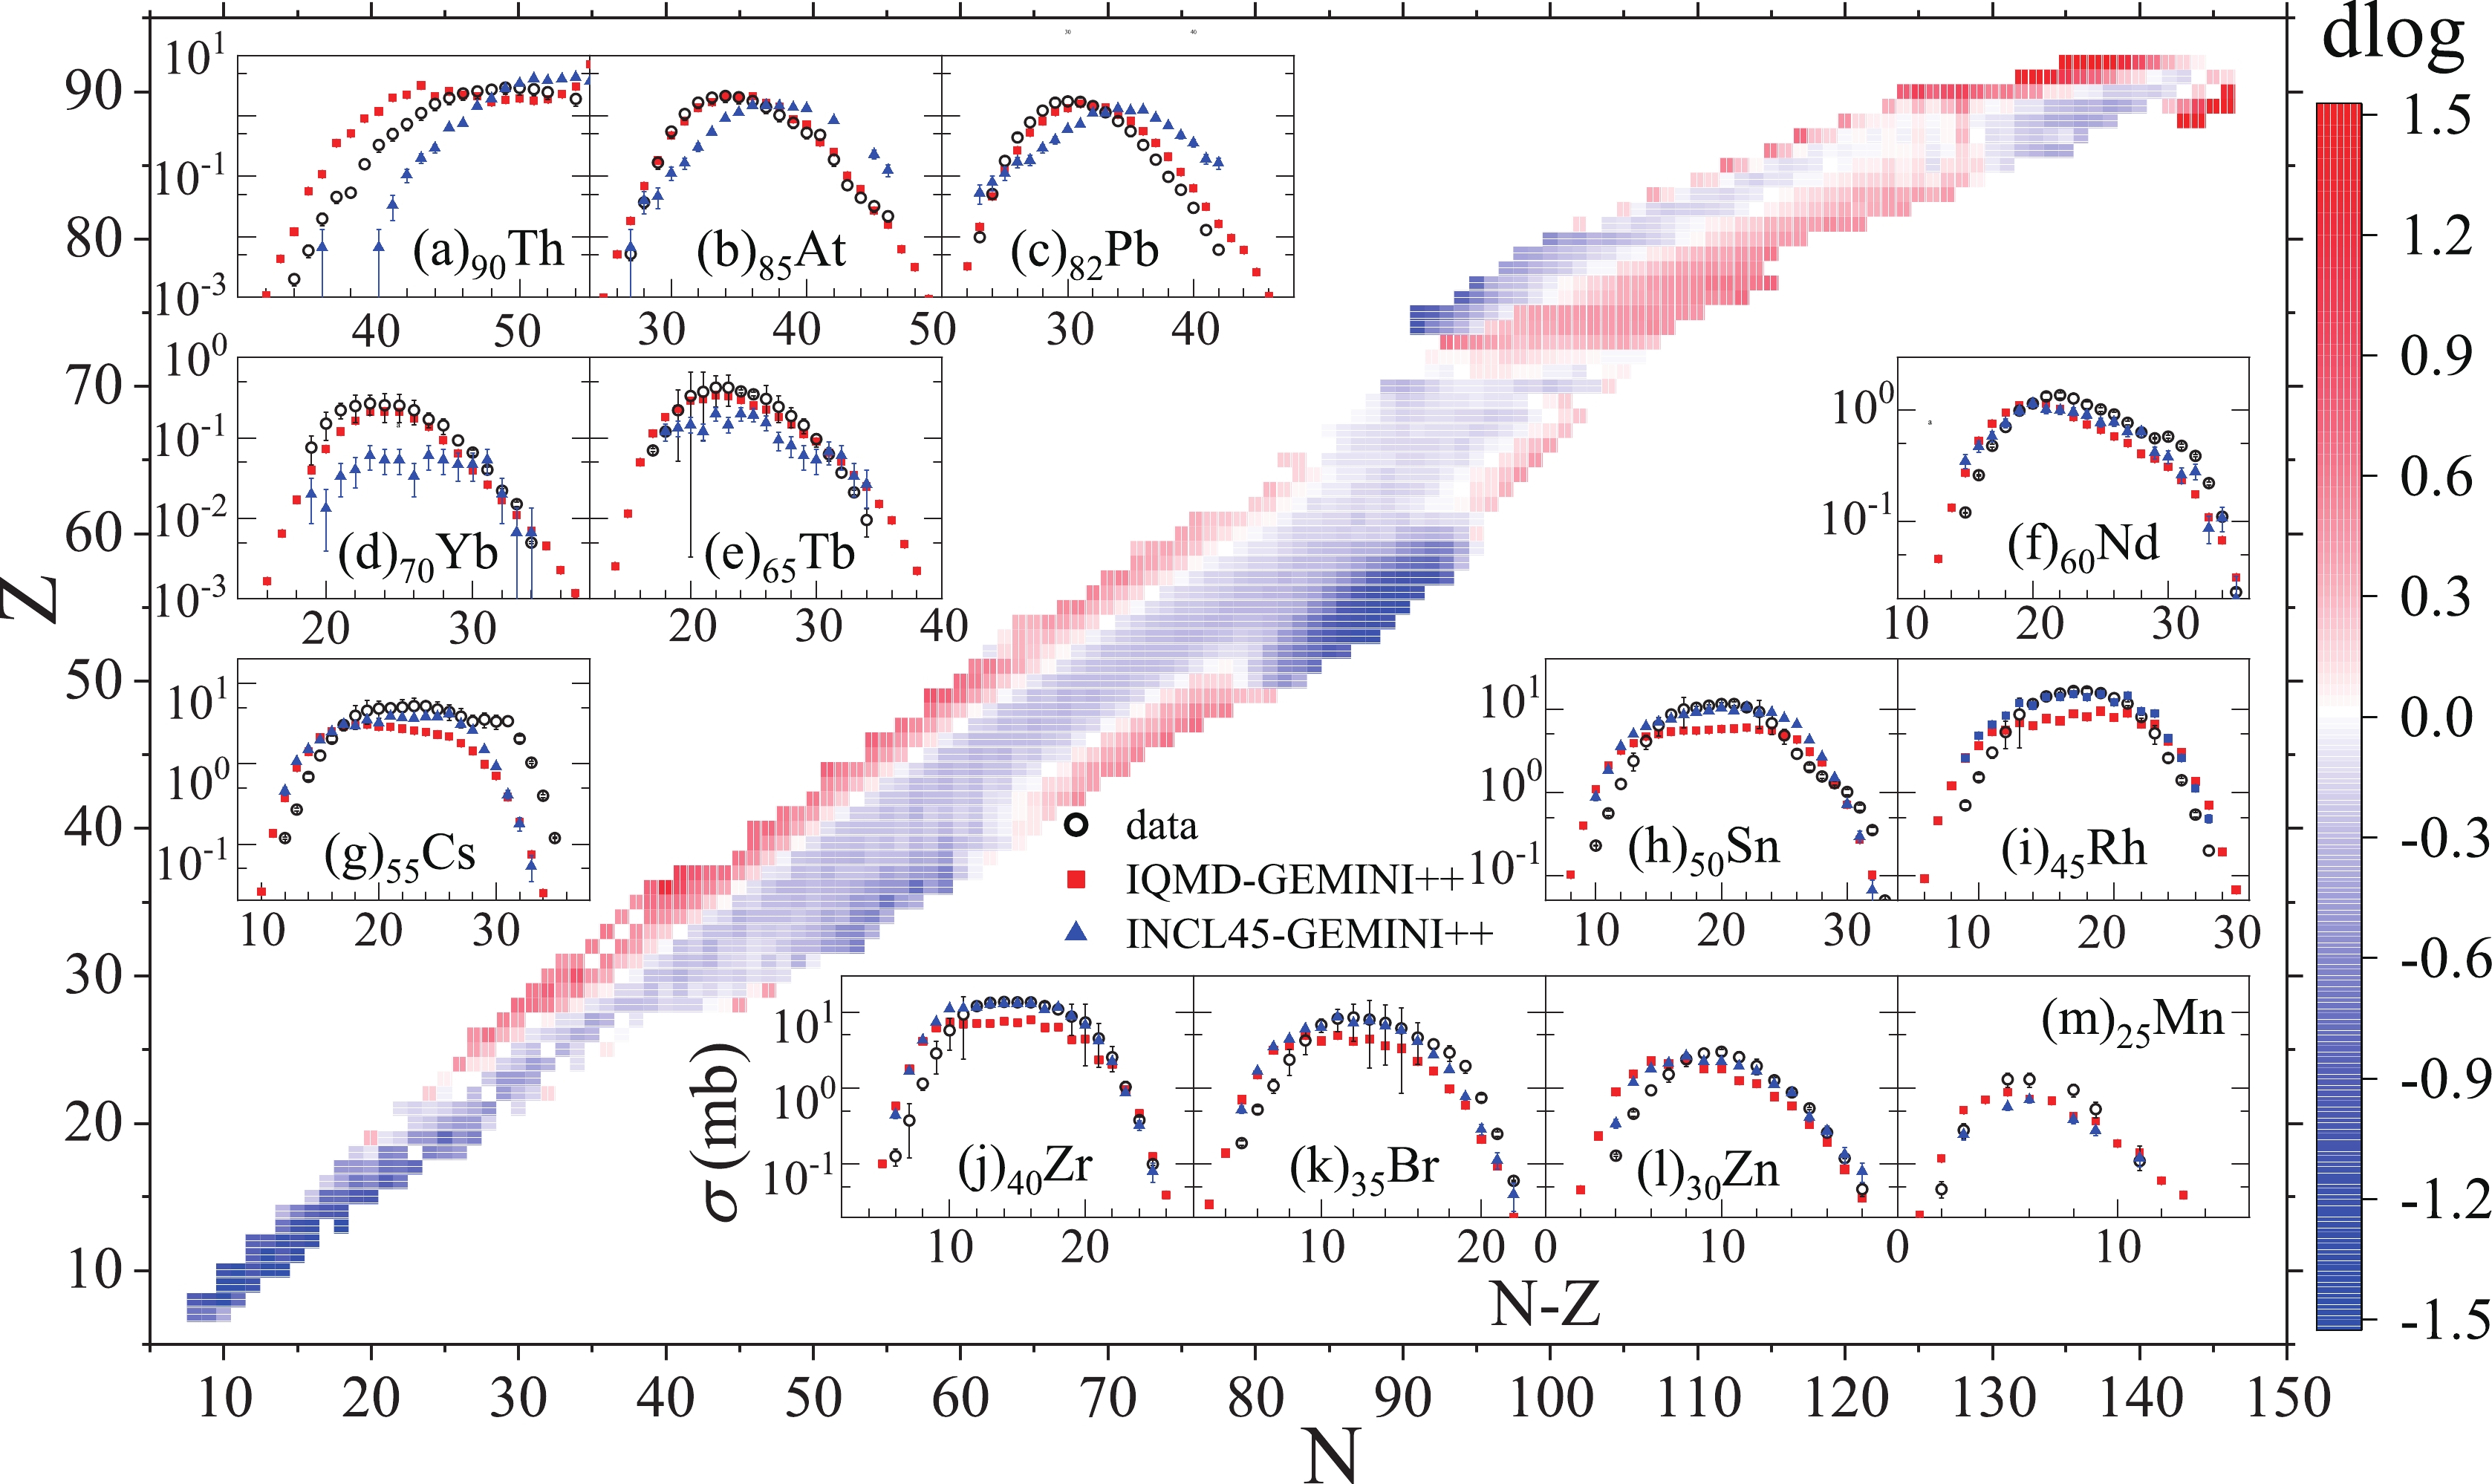
Figure 2. (color online) Two-dimensional nuclide chart to display logarithmic difference
$ {\rm dlog}(Z,N) $ between experimental data and calculations by IQMD-GEMINI++ model for the 238U + p reaction at 1 A GeV. (Blue) squares with horizontal lines represents negative$ {\rm dlog}(Z,N) $ , while (red) squares with vertical lines represents positive$ {\rm dlog}(Z,N) $ . The gray level (or color depth for online version) is proportional to the absolute value of$ {\rm dlog}(Z,N) $ . The sub-pictures (a)-(m) display the isotope distributions of some representative elements. The (red) square dots and (blue) triangles represent the calculations by the IQMD-GEMINI++ and INCL45-GEMINI++ models, respectively. Black circles represent the corresponding experimental data, which are taken from Refs. [2, 26–28].$ {\rm dlog}(Z,N) = {\rm log}[\sigma_{\rm cal}(Z,N)] - {\rm log}[\sigma_{\rm exp}(Z,N)], $

(15) where
$ \sigma_{\rm cal}(Z,N) $ is the calculated cross section of the isotope with charge number Z and neutron number N, and$ \sigma_{\rm exp}(Z,N) $ is the experimental data.In Fig. 2,
$ {\rm dlog}(Z,N) $ is displayed as a two-dimensional (color) nuclide chart for the case of 238U + p reaction at 1 A GeV. It can be seen that the differences between the calculations and data are generally less than 1.5 orders of magnitude. At around Z = 92 and N = 146, the IQMD-GEMINI++ model clearly overestimates the cross sections, as seen in Fig. 2(a). The production with mass number near 238 is related to the direct reaction, where a few nucleons are knocked off and the remaining nuclear system has a low excitation energy. The cross sections of those productions depend on their ground-state properties, which are not well described by neither the mean field model IQMD nor the cascade model INCL45.In the region of projectile-like products (Z = 70–90), taking At [Fig. 2(b)] and Pb [Fig. 2(c)] as examples, the calculations by the IQMD-GEMINI++ model agree generally well with the data, although the peak position has a slight deviation to the left. For the INCL45-GEMINI++ model, the deviation is more serious. In the fission region (Z = 20–70), the special case can be seen near Z = 55 and Z = 35, where the cross sections of the neutron-deficient isotopes are greatly underestimated. For example, the experimental data of the isotope distribution of Cs [Fig. 2(g)] have a plateau for N–Z = 22–30, which is caused by the stability of the isotopes near the shell of Z = 50 and N = 82.
Combining Figs. 1 and 2, it can be seen that the shell effect is the most obvious at Z = 54 and N = 86. Both the charge and neutron numbers are larger by 4 than the magic number Z = 50 and N = 82 in the ground-state. There are also similar phenomena near Z = 32 and N = 54, and the corresponding magic numbers in the ground-state are Z = 28 and N = 50. The position of the shell effect in the figure is not the same as the position of the ground state shell. This is due to the fact that the fragments are still in an excited state after the fission process of the nuclear system with high excitation energy. The relatively abundant productions near Z = 54 and N = 86 (and Z = 32 and N = 54) indicate that the excited nuclei are relatively stable near this region. These phenomena imply some shift in the position of the shell under the influence of the excitation energy, which could be an evidence for the excitation energy dependence of the shell. The energy dependence of the shell effect has also been studied and confirmed in some reported works [63–65], and the mechanism still needs more research and explanation.
Following the same decay model GEMINI++, the IQMD model reproduces the data better than the INCL45 model. It is noted that the IQMD model takes into account the mean field, while the INCL45 model does not. The consideration of the mean field allows the initial Fermi movement of nucleons, which is more in line with the physical reality. To demonstrate the impact of the mean field, the neutron spectra with and without mean field at different evolution-times are shown in Fig. 3. The figure shows that the emission of the free neutrons mainly occur in the beginning 90 fm/c, when nucleons collide violently. After 90 fm/c, the neutron spectra are similar. For both 238U + p and 238U + 9Be reactions, more high-energy neutrons are produced in the case with mean field than that without mean field. The emission of the high-energy neutrons plays a role in cooling the nuclear system after the spallation. More high-energy neutrons in the case with mean field result in lower excitation energy of the remaining pre-fragment. The projectile-like products are mainly produced by the evaporation of pre-fragment with low excitation energy. Thus, the model with mean field provide more projectile-like products. This could be observed in Figs. 1 and 2. The difference between the low-energy neutrons with and without mean field are tiny in the 238U + p reaction but visible in the the 238U + 9Be reaction. It is indicated that the missing of the mean field in simulation of the 238U + 9Be reaction will cause a larger system error than that in the 238U + p reaction. The cascade models are suggested in the IAEA benchmark where the neutron-driven and proton-driven spallations are considered. However, the mean field model is necessary in this work, because the 238U + p, d, and 9Be reactions are studied.

Figure 3. (color online) The neutron spectrum with and without mean field at different time. The (black) solid curves represent the calculations by the IQMD model without mean field. The (red) dashed curves represent those with mean field. The horizontal axis represents the neutron kinetic energy in the center-of-mass frame. The vertical axis represents the count of neutron.
We calculated the isotopic cross sections in the 238U + d and 9Be reactions at 1 A GeV and compared them with the available data. Because the amount of experimental data for the 238U + 9Be reaction at 1 GeV is small, we used a part of data for the 238U + 9Be reaction at 0.95 GeV for comparison. Two-dimensional nuclide charts to display the logarithmic differences are shown in Fig. 4(b) and (c). Some magic numbers of the ground state are marked in these two figures. For both reactions, the overall logarithmic difference distributions are similar to the 238U + p reaction. From the limited data, we can still see the difference caused by direct reaction (near A = 238) and the shell effect (near Z = 54 and N = 86) in these two reactions. For the 238U + d reaction, the overall logarithmic difference distribution is similar to that for the 238U + p reaction. For example, around N = 50 and N = 82, Z = 50,
$ {\rm dlog}(Z,N) $ are clearly negative, which means that the model underestimated the cross sections. From Fig. 2, it can be seen that the shell displayed by the isotopic cross sections is different from the position of the ground state shell. This phenomenon is affirmed in Fig. 4, where the available data are more abundant. The distribution of$ {\rm dlog} $ for all three reactions is shown in Fig. 4(a). It is shown that the majority of$ {\rm dlog} $ are in the interval of [–1.5,1.5]. This demonstrates that the IQMD-GEMINI++ model can give appropriate predictions for 238U + p, d and 9Be reactions simultaneously, making the comparison of these three reactions possible.
Figure 4. (color online) (a) Distribution of logarithmic differences between calculation by the IQMD-GEMINI++ model and experimental data for 238U + p, d and 9Be at 1 A GeV. (b) Two-dimensional nuclide chart to display logarithmic difference
$ {\rm dlog}(Z,N) $ for the 238U + d reaction at 1 A GeV. (c) Same as (b) but for the 238U + 9Be reaction at 1 A GeV. The experimental data for comparison comes from Refs. [2, 23, 25, 26–34]. -
The residue fragments are distributed over a large range of mass and charge numbers. Although the IQMD-GEMINI++ model has provided relatively better results than the INCL45-GEMINI++ model, the experimental data cannot be reproduced well in many areas. The calculations for all three reactions will deviate to some degree from experimental data in the vicinity of the shell, because the IQMD-GEMINI++ model can not reproduce the shell effects. For the region of IMFs, the IQMD-GEMINI++ model also produces large differences because the main IMF production mechanism, multifragmentation, is not well modeled.
To address the current shortcomings of the IQMD-GEMINI++ model and to reduce the errors of predictions, the BNN is used to learn the logarithmic differences
$ {\rm dlog}(Z,N) $ between the data and the calculations by the IQMD-GEMINI++ model. A clear illustration of the underlying philosophy behind the implementation of the BNN approach originally appears in the works by Utama et al., which present theoretical predictions of the nuclear masses [36] and nuclear charge radii [38]. In those works, the final calculation is expressed as$ A = A_{m} +\Delta A, $

(16) where
$ A_{m} $ is the prediction by the physics model (IQMD-GEMINI++ model in this work), and$ \Delta A $ is the residual error. The BNN is applied to perform regression analysis of the residual error using the numerical algorithm. Unlike that in the existing works in Refs. [35, 36, 38, 66], which generally used the Z and N as input layer, in this study the correlation between the production cross sections and the ground state qualities is taken into account in order to have more physically meaningful parameters and avoid the over-fitting.It is found that the best predictions can be obtained when we use the following input layer, X =
$ \{r_t,N_f,\delta_f, Q_{p\alpha},B,E_{sh},\beta_2,Q_{\beta n}\} $ , where$ r_t $ is radius of target,$ \delta_f $ is isospin asymmetry,$ Q_{p\alpha} $ is the Q-value of (p,α) reaction, B is the binding energy per nucleon,$ E_{sh} $ is the shell correction,$ \beta_2 $ is the quadrupole deformation, and$ Q_{\beta n} $ is the Q-value of ($ \beta^{-} $ ,n) reaction.Specifically, the logarithmic differences
$ {\rm dlog}(Z,N) $ were set as$ Y^{(n)} $ of the training data, while the corresponding radius of the target and ground-states properties of the fragments were set as$ X^{(n)} $ of the training data. Here, the BNN algorithm takes the three targets simultaneously in its convergence criterion, and there are totally 3282 datasets for three reactions. Then, the BNN after training is applied to calculate the values of$ {\rm dlog}_{B}(Z,N) $ for all fragments. The calculations of the cross sections by the IQMD-GEMINI++-BNN model, i.e.$ \sigma_{\rm IGB} $ can be expressed as$ \sigma_{\rm IGB}(Z,N) = \sigma_{\rm IG}(Z,N)10^{-{\rm dlog}_{B}(Z,N)}, $

(17) where
$ \sigma_{\rm IG} $ represents the calculations by the IQMD-GEMINI++ model, and$ {\rm dlog}_{B} $ is the logarithmic difference predicted by the BNN algorithm.The calculations of IQMD-GEMINI++ model are improved using the BNN algorithm, and the confidence intervals are given. Figure 5(a) shows the logarithmic differences between the experimental data and calculations by the IQMD-GEMINI++-BNN model. It is shown that 95% of the logarithmic differences are in the region of [–0.4, 0.4], and 80% of them are in [–0.2, 0.2]. As an example, the logarithmic differences for the 238U + d reaction at 1 A GeV are shown as a two-dimensional nuclide chart in Fig. 5. It is shown that the effect related to the direct reaction (near A = 238) and the shell effect (near Z = 54 and N = 86) have been compensated.

Figure 5. (color online) Two-dimensional nuclide chart to display logarithmic differences between the calculations by the IQMD-GEMINI++-BNN model and the experimental data for 238U +d reaction at 1 A GeV. (a) Distribution of logarithmic differences for 238U +p, d, and 9Be at 1 A GeV. The sub-pictures (b)–(g) display the isotope distributions of some representative elements produced in 238U +d reaction at 1 A GeV. (Red) shadows show the confidence interval of the calculations by the IQMD-GEMINI++-BNN model
Figures 5(b)–(g) display the isotope distributions for some representative elements produced in the 238U + d reaction at 1 A GeV. It is shown that the calculations agree with the experimental data, and the confidence intervals are narrow for the region with data. For example, in Fig. 5(e), the calculations with a confidence interval agree well with the experimental data, and the missing of the shell effect in the IQMD-GEMINI++ model has been well compensated by the BNN method.
In the regions where there are no experimental data, the confidence intervals given by the BNN do not diverge significantly. This is made possible by the input of physical parameters that allow the BNN model to contain physical constraints and avoid over-fitting. In brief, the BNN algorithm with physical constraints can both address the current shortcomings of IQMD-GEMINI++ model and avoid over-fitting. This could be useful for a more accurate discussion of target dependence of the isotopic cross sections.
-
The spallation of 238U has been widely applied to produce short-lived nuclei and rare isotopes, including neutron-deficient nuclei in region of A = 200–220 [24, 25] and neutron-rich fission products [22, 23]. In order to choose the target to produce the exotic isotopes with high production yields, we investigated the target dependence of cross sections in 238U spallation. For the 238U + p, d and 9Be reaction at 1 A GeV, the target dependence is first discussed on the basis of the available data. Then, the discussion is extended to a wide region in the nuclide chart with the help of the IQMD-GEMINI++-BNN model.
Among all the isotopes produced with the experimental data in all three reactions, the most neutron-rich isotope for each element is selected. Most of these selected isotopes are fission products. Their production cross sections in three reactions are displayed as a function of the mass number of the target nucleus
$ A_{p} $ . As presented in Figs. 6(a), (b), and (c), the production cross sections as a function of$ A_{p} $ display three main trends. In Fig. 6(a), the production cross section for each nuclide in 238U + 9Be reaction is significantly lower than that in the other two reactions. The charge numbers Z of the nuclei that conform to this rule range from 31 to 37. Figure 6(b) shows that the production cross sections for nuclei with charge number Z = 38–48 in the three reactions are approximately the same. For each nucleus with charge number larger than 50, as shown in Fig. 6(c), the production cross sections in 238U + d reaction are the lowest. Interestingly, these nuclei with the same trend also have a certain pattern of distribution in the nuclide chart. Figure 6(d) presents the nuclide chart for the above mentioned nuclei. The distribution of these nuclei is divided into three areas.
Figure 6. (color online) This figure is based on the experimental data taken from Refs. [2, 23, 24, 26-35]. In (a)–(c), the horizontal axis represents the mass number of the target nucleus
$ A_{p} $ .$ A_{p} $ = 1, 2 and 9 for 238U + p, d and 9Be reaction, respectively. The vertical axis represents the experimental residue-production cross sections. (d) shows the position of the produced nuclides presented in (a)–(c) in the nuclide chart.In order to show the target dependence in a wider region, the IQMD-GEMINI++-BNN model is applied to calculate the isotopic cross sections in 238U + p, d, and 9Be reaction at 1 A GeV. For neutron-rich fission products, we choose the two most neutron-rich nuclei for each element in the range of Z = 32–57, and display the isotopic cross section as a function of mass number
$ A_{p} $ in Fig. 7(a)–(c). Three trends for the cross section as a function of$ A_{p} $ , which has been shown in Fig. 2, can also be distinguished. For neutron-deficient nuclei in the region of A = 200–220, Fig. 7(d) presents the two most neutron-deficient nuclei for each element in the range of Z = 89–92. It can be seen that with the increase in$ A_{p} $ , σ shows a downward trend. 238U + p reaction has an obvious advantage over the other two reactions.
Figure 7. (color online) This figure is based on the calculation by IQMD-GEMINI++-BNN model. In the nuclide chart, each square represents a produced nuclide. The color of the square is blue, which means that the 238U + p reaction has the largest production cross section for this nuclide. Similarly, red corresponds to the 238U + d reaction and black corresponds to the 238U + 9Be reaction. (a)–(d) are same as Fig. 6 (a)–(c) but for some nuclides that have not been measured experimentally.
Then, the calculations in those three reactions 238U + p, d, and 9Be are compared. If the cross section of a specific nuclide production in reaction 238U + p is the largest, we call it p-dominant. The definitions for d-dominant and 9Be-dominant are similar. Fig. 7 presents the dominant regions of the three reactions. The region of heavy projectile-like products (Z
$ \approx $ 90) is p-dominant. For light nuclei (Z = 15–25), 9Be target is dominant. In the intermediate region, except near the shell of Z = 50, N = 82, neutron-deficient nuclei are d-dominant, whereas for neutron-rich nuclei, the situation is much more complicated. The target dependence is variable for neutron-rich nuclei in this region, and all three reactions are possibly dominant. This phenomenon also coincides with what is shown in Fig. 7(a)–(c). The region near the shell of N = 82 and Z = 50 is relatively simple, which is partly p-dominant and partly 9Be-dominant.In fact, the selection of the target needs to take into account not only the production cross section but also the atomic density of the target. The yield of product can be calculated simply,
$ Y = I \sigma N_{s} $

(18) where I is the intensity of the 238U beam, σ is the production cross section, and
$ N_{s} $ is the surface density of the target nuclei. The yield is proportional to the atomic density of the target when the target thickness and the beam intensity remain constant. Among liquid hydrogen, liquid deuterium, and beryllium, liquid hydrogen has the lowest atomic density. The atomic density of liquid deuterium is about 1.2 times that of liquid hydrogen, and the atomic density of beryllium is 2.9 times that of liquid hydrogen. Taking into account the atomic density and the production cross section, it can be seen that for the production of neutron-deficient nuclei in the region of A = 200–220 [Fig. 7(d)], the liquid hydrogen target is the best in most cases, the beryllium target is slightly worse, and the liquid deuterium target is not good. For the neutron-rich fission products in [Fig. 7(b), (c)], the beryllium target is the best. For the fission products in [Fig. 7(a)], the liquid deuterium target and the beryllium target are comparable in most cases, while the liquid hydrogen target is the worst.The trends in Fig. 7(a)–(d) and the dominant regions of the three reactions are mainly influenced by three factors: the excitation energy of the fission system, the mass number of the fission systems, and the radius of the target nucleus. For example, it can be seen in Fig. 7 that the region of heavy projectile-like products (Z
$ \approx $ 90) is p-dominant. Heavy projectile-like products are generally produced from pre-fragments with lower excitation energies. As illustrated in Fig. 8(a)–(c), the p reaction produce more heavy pre-fragments, and the excitation energies of these pre-fragments are also generally low. This phenomenon can also be seen in Fig. 8(d), where the p reaction produces more low excitation energy pre-fragments, which decayed mainly by nucleon evaporation. This ultimately causes the p-reaction to produce more heavy projectile-like products than the other two reactions. Similarly, the d reaction will produce more heavy projectile-like products than the 9Be reaction. The curves in Fig. 7(d) therefore shows a downward trend.
Figure 8. (color online) (a), (b) and (c) present distributions of pre-fragments for 238U + p, d, and 9Be reactions. The colour represents the count of pre-fragments with charge Z and excitation energy E*, in
$ {\rm d}\sigma/{\rm d}E/{\rm d}Z $ (mb/MeV). (d) has one less dimension, which presents the count of pre-fragments with excitation energy E* and main decay mechanisms of pre-fragmentation. (e) presents the charge distribution of projectile-like products.The pre-fragments with high excitation energy but not reaching the multifragmentation threshold decay mainly by the fission. As shown in Fig. 8(d), the d reaction and 9Be reaction produced more of this kind of pre-fragments, which makes the region of fission products mainly d-dominant or 9Be-dominant. Light nuclei (Z = 15–25) are generally produced by the multifragmentation of compound nuclei with higher excitation energies. The 9Be target provides considerably more energy in the reaction than proton and deuteron, which caused the pre-fragments to reach the multifragmentation threshold of 3 MeV/nucleon. Thus, the 238U + 9Be reaction is obviously dominant in the production of light nuclei.
-
In summary, the isotopic cross sections in 238U + p, d and 9Be reactions at 1 A GeV are investigated and two main results were achieved. First, a physical model dependent IQMD-GEMINI++-BNN framework, which can provide a more accurate evaluation of the production cross sections was built. Second, on the basis of more accurate production cross section predictions, the target dependence of the cross sections of the isotopes produced in these three reactions was studied.
It is shown that the IQMD-GEMINI++ model, in which the mean field is considered, reproduces the data in 238U + p reaction better than the IAEA benchmark models INCL45-GEMINI++, where the mean field is ignored. To demonstrate the impact of the mean field, the neutron spectra by the IQMD model with and without mean field are compared. It is found that the consideration of the mean field allows the initial Fermi movement of nucleons, which results in more emissions of the high-energy neutrons and less emissions of the low-energy neutrons. This phenomenon is more obvious for the 238U + 9Be reaction. It is indicated that the mean field model is necessary in this work, and the cascade models are suggested in the IAEA benchmark where the neutron-driven and proton-driven spallations are considered.
In comparison, it is found that the difference between the calculations and experimental data is within 1.5 orders of magnitude. After fine tuning using the BNN method, the difference between calculations and data are reduced to within 0.4 orders of magnitude, and there is no obvious over-fitting in the extrapolated areas where experimental data are not available. Thus, it is demonstrated that the IQMD-GEMINI++-BNN model can provide a good prediction of the isotopic cross sections in spallation reactions, which could be helpful for studying the mechanism of spallation and predicting the cross section of rare isotopes.
The spallation of the 238U has been widely applied to produce short-lived nuclei, including neutron-deficient nuclei in the region of A = 200–220 [24, 25] and neutron-rich fission products [22, 23]. Based on the available experimental data and calculations by the IQMD-GEMINI++-BNN model, the target dependence of the cross sections of the isotopes produced in the spallations of 238U at 1 A GeV was studied to help select the target in a new experiment. According to the largest production cross sections, the dominant target for the production of a certain isotope was predicted. After considering the cross sections and the atomic density, beryllium target is recommended for the generation of the neutron-rich fission products. The 238U + p reaction has an obvious advantage over the other two reactions, and liquid hydrogen target is recommended for the generation of the neutron-deficient nuclei in the region of A = 200–220. Finally, based on the excitation energy distribution of the excited prefragments for the three reactions, the physical mechanisms of target dependence are studied.
Target dependence of isotopic cross sections in the spallation reactions 238U + p, d and 9Be at 1 A GeV
- Received Date: 2022-01-04
- Available Online: 2022-07-15
Abstract: The spallation of 238U is an important way to produce rare isotopes. This work aims at studying the cross sections of isotopes produced in 238U + p, d and 9Be reactions at 1 A GeV and their target dependence. (1) A physical model dependent (Bayesian neural network) BNN, which includes the details of IQMD-GEMINI++ model and BNN, was developed for a more accurate evaluation of production cross sections. The isospin-dependent quantum molecular dynamics (IQMD) model is used to study the non-equilibrium thermalization of the 238U nuclei and fragmentation of the hot system. The subsequent decay of the pre-fragments is simulated by the GEMINI++ model. The BNN algorithm is used to improve the prediction accuracy after learning the residual error between experimental data and calculations by the IQMD-GEMINI++ model. It is shown that the IQMD-GEMINI++ model can reproduce the available experimental data (3282 points) within 1.5 orders of magnitude. After being fine tuned by the BNN algorithm, the deviation between calculations and experimental data were reduced to within 0.4 order of magnitude. (2) Based on the predictions by the IQMD-GEMINI++-BNN framework, the target dependence of isotopic cross sections was studied. The cross sections to produce the rare isotopes by the 238U + p, d and 9Be reactions at 1 A GeV are compared. For the generation of neutron-rich fission products, the cross sections for the 238U + 9Be are the largest. For the generation of neutron-deficient nuclei in the region of A = 200–220, the cross sections for 238U + p reaction are the largest. Considering the largest cross sections and the atomic density, the beryllium target is recommended to produce the neutron-rich fission products by the 238U beam at 1 A GeV, while the liquid-hydrogen target is suggested to produce the neutron-deficient nuclei in the region of A


 DownLoad: