-
Carbon fusion is a key reaction in the late evolution of massive stars and explosive astrophysical scenarios such as Type Ia supernovae and X-ray superbursts [1–7]. The Gamow energy region of this reaction is extremely low, ranging from several hundred keV to 3 MeV, and is much lower than the Coulomb barrier of approximately 5.5 MeV. As the energy decreases, the fusion cross section falls rapidly, resulting in great challenges for experimental measurements. Moreover, the appearance of resonance in this reaction makes it difficult to obtain reliable results by theoretical extrapolations.
Experimentally, the direct measurement of
$ { }^{12} \mathrm{C}+{ }^{12} \mathrm{C} $ reactions below Coulomb barrier is carried out by detecting characteristic γ-rays or light charged particles. In principle, all reaction channels are investigated by measuring charged particles. However, as the energy decreases, protons and α particles corresponding to excited fusion residues with small kinetic energies cannot be measured due to the limited energy resolution and low-energy detection threshold. Patterson et al. performed the first particle spectroscopy experiment by using a$ \Delta E-E $ telescope, where the total fusion cross sections in the center-of-mass energy range 3.23 – 8.75 MeV were obtained [8]. Mazarakis$ et\; al. $ repeated the experiment from 5 MeV down to 2.45 MeV in the center-of-mass frame and observed a rise in the nuclear factor at low energies, which were interpreted as absorption under the barrier [9]. In contrast, the result measured by Becker$ et\; al. $ in$ E_{\text {c.m. }} = 2.8-6.3\; \mathrm{MeV} $ did not show a strong increase at low beam energies [10]. Recently, by using a highly ordered pyrolytic graphite (HOPG) carbon target, Zickefoose$ et\; al. $ extended the measurement of$ { }^{12} \mathrm{C}\left({ }^{12} \mathrm{C}, \mathrm{p}_{0,1}\right)^{23} \mathrm{Na} $ for$ E_{\text {c.m.}} $ from 2.00 MeV to$ 4.00\; \mathrm{MeV} $ [11]. It is pointed out that any extrapolation to the astrophysical energy range remains uncertain based on available experimental data.As for the detection of characteristic γ-rays, the most common channels are 440 keV for
$ { }^{23} \mathrm{Na} $ and 1634 keV for$ { }^{20} \mathrm{Ne} $ . The uncertainty at low energies is mainly due to the background arising from$ { }^{1} \mathrm{H} $ and$ { }^{2} \mathrm{H} $ contamination in the C target. High$ et\; al. $ first measured the above γ-rays in$ E_{\mathrm{c.m.}} = 2.46-5.88\; \mathrm{MeV} $ . The results indicated that the rise below 3.5 MeV was dominated by two or more resonances and did not support the absorption under the barrier [12]. Later, Kettner$ et\; al. $ showed comparable results measured in$ E_{\mathrm{c.m.}} = 2.45-6.15 \mathrm{\; MeV} $ , which observed no strong increase at low energies [13]. However, the new measurement performed by Barrón-Palos$ et\; al. $ showed that the S-factor increased as the energy decreased below 3 MeV in the center of mass [14]. To interpret the discrepancies between previous works, Aguilera$ et\; al. $ measured the fusion excitation functions at center-of-mass energies between 4.42 MeV and$ 6.48 \mathrm{\; MeV} $ by using a new absolute normalization method, which allows one to simultaneously monitor the carbon buildup at the target. It was found that the main source of the discrepancies was the absolute energy scale [15]. Besides the total γ-ray yield measurements, Dasmahapatra$ et\; al. $ demonstrated some new$ { }^{12} \mathrm{C}+{ }^{12} \mathrm{C} $ resonances between$ E_{\mathrm{c.m.}} = $ $ 4.5-6 \mathrm{\; MeV} $ [16]. With a plastic veto detector and a high intensity beam current, Spillane$ et\; al. $ extended the energy down to 2.1 MeV, which exhibited new resonances at$ E_{\mathrm{cm}}<3 $ MeV, in particular, a strong resonance at$ E_{\mathrm{cm}} = 2.14 $ MeV [17].To further suppress the beam-induced and cosmic-ray background, Jiang
$ et\; al. $ developed the particle-γ coincidence experiment, which minimized the backgrounds that affected the earlier experiments [18]. With the same method, two newly measured results at Gamow energy region were reported: the data measured by Fruet$ et\; al. $ at$ E_{\text{c.m.}} = 2.16-5.35\; \mathrm{\; MeV} $ provided evidence for the resonance in$ E_{\mathrm{cm}} = 2.14 $ MeV observed before [19]; however, the results of Tan$ et\; al. $ disagreed with the much stronger$ \alpha_{1}\; S^{*}(E) $ factor at$ E_{\text {c.m.}} = 2.16\; \mathrm{MeV} $ observed by Fruet [20].In general, when the energy was above 3 MeV, consistency was observed among different direct experimental data. However, in the lower energy region, the experimental error rapidly increased and discrepancies between experimental data emerged. To corroborate existing results and push direct measurements down to astrophysical energies, additional experimental work is desired in the future.
In addition to direct measurements, indirect methods have been developed. In particular, the Trojan Horse Method (THM) which was originally suggested by Baur [21] is a powerful and unique indirect technique that allows one to measure the astrophysical factors of the resonant reactions at low energies. A recent indirect measurement of the
$ S^\star $ factor using the THM suggested a sharp increase for energies lower than 2.5 MeV, which was inconsistent with the gentle behavior of the direct measurement data [22, 23]. A reanalysis indicated that the steep rise was the result of using the plane-wave approach in which Coulomb-nuclear interactions were neglected [6]. In contrast, the results obtained within the framework of a time-dependent Hartree-Fock-based classical model using the Feynman path-integral method were in some agreement with the THM data when including$ 0^{+} $ resonances [24].The isotope fusion reaction
$ { }^{12} \mathrm{C}+{ }^{13} \mathrm{C} $ offers an opportunity to constrain the$ { }^{12} \mathrm{C}+{ }^{12} \mathrm{C} $ due to the strong correlation between the two systems, which has been explained by coupled channel calculations and the different level densities of the compound states [25]. Therefore, the$ { }^{12} \mathrm{C}+{ }^{13} \mathrm{C} $ reaction was measured recently by N.T. Zhang$ et\; al. $ The results ruled out the existence of the astrophysical$ S^\star $ factor maximum predicted by the hindrance model [18, 26] and confirmed the rising trend towards lower energies. It also set an upper limit for the$ { }^{12} \mathrm{C}+{ }^{12} \mathrm{C} $ fusion at stellar energies by normalizing the model predictions with their data [27].There have been various theoretical analyses on the
$ { }^{12} \mathrm{C}+{ }^{12} \mathrm{C} $ reaction, while contradictory conclusions were derived on the trend of$ S^\star $ factor at the low-energy region. Many theories predict that the$ S^\star $ factor does not decrease remarkably in the low-energy region. For instance, the carbon fusion reaction has been analyzed by the coupled-channels calculations based on the M3Y plus repulsion interaction. The fusion cross sections are larger than the measured results, but they are consistent with the maxima of some of the observed peak cross sections. [28]. With the potential obtained from the density-constrained frozen Hartree-Fock and density constrained time-dependent Hartree-Fock framework, no extreme sub-barrier hindrance is predicted at low energies by solving the Schrödinger equation based on the incoming wave boundary condition [29]. Recently, the coupled-channels calculation that adopted the improved boundary condition and the advanced finite element method was also performed on this reaction, and the result indicated that the$ S^\star $ factor changed gently in the low-energy area [30].The condition became more complicated when the resonances were considered. Based on the time-dependent wave-packet dynamics within a nuclear molecular picture, the fusion imaginary potential proved to be critical for understanding the appearance of resonances in this fusion reaction [31]. The resonance behavior of this reaction was also investigated by a microscopic antisymmetrized molecular dynamics model recently [32]. The above works concluded that there was no low-energy suppression of the
$ S^\star $ factor. In contrast, the hindrance model proposed by Jiang$ et\; al. $ predicted that the reaction$ S^\star $ factor would drop rapidly as energy decreased to the deep sub-barrier region, which could be several orders of magnitude lower than those of other results [18, 26]. A similar conclusion was drawn based on an extended quantum diffusion approach [33].Recently, Bayesian methods have been extensively used in the field of nuclear physics. For instance, the approach has been adopted to predict the nuclear mass [34], β decay half-lives [35], incomplete fission yields [36], symmetry energy [37, 38], isospin splitting [39], and so on. In low-energy nuclear reactions, the method had been tested against the traditional frequentist method for the study of the optical potentials in the elastic scattering. It is proved that the Bayesian method is more flexible in exploring the parameter space and its uncertainties represent reality more accurately than the much narrower uncertainties obtained using the standard frequentist approach [40]. In our previous work, we also adopted the Bayesian approach in the transfer reaction
$ { }^{208}\mathrm{Pb}\left({ }^{7}\mathrm{Li},{ }^{6} \mathrm{He}\right){ }^{209} \mathrm{Bi} $ , to investigate the dispersion relationship for the neutron halo system$ { }^{6} \mathrm{He}+{ }^{209} \mathrm{Bi} $ , and it was found that the Bayesian statistics strongly depended on the imposed prior distributions [41]. To reduce this dependency, uniform prior distribution is recommended.For the carbon fusion reaction, it remains an open question whether the
$ S^\star $ factor drops down sharply or not in the low-energy region. In most previous theoretical studies on this reaction, no theoretical errors were provided for reference when making explorations. Considering the flexibility in searching for the parameters and the advantage in determining the confidence interval of the Bayesian approach [40], it is employed with the coupled-channels approach for the first time to investigate the non-resonant behavior of existing direct measured experimental data of$ { }^{12} \mathrm{C}+{ }^{12} \mathrm{C} $ fusion at the deep sub-barrier energy region. The remainder of the paper is structured as follows. Sec. II discusses the theoretical framework. Sec. III presents the results of the numerical calculations of the carbon fusion reaction within the Bayesian approach. Sec. IV summarizes our work. -
The fusion cross sections of two identical nuclei
$ {}^{12} {\rm{C}}$ decomposed over partial waves have the following form$ \sigma(E) = \frac{\pi\hbar^2}{2\mu E}\sum\limits_{l}^{\infty}(2l+1)P_{l}(E)(1 + (-1)^l)\,. $

(1) The identical particle effects have been considered here. In the above formula, E is the center-of-mass energy in the center of mass coordinate.
$ \mu = A_P A_T/(A_P+A_T) $ is the reduced mass.$ A_{P(T)} $ is the mass of the projectile (target) nucleus. l is the orbital angular momentum. The barrier penetration coefficients$ P_{l}(E) $ could be obtained by solving the coupled-channels equations for the radial wave function under the iso-centrifugal approximation. For the carbon fusion, the$ S^\star $ factor was set as the commonly used form [20, 42].$ S^\star(E) = \sigma(E) E \; \exp(87.21/\sqrt{E}+0.46 E). $

(2) We consider the potential between the projectile and the target as a function of the relative distance r between them:
$ V(r) = V_N(r)+V_C(r)\,. $

(3) The potential contains the Coulomb term
$V_C = $ $ Z_PZ_Te^2/r$ and a phenomenological nuclear potential.$ Z_{P(T)} $ is the charge number of the projectile (target) nuclei. The Woods-Saxon form is used here$ V_N(r) = -\frac{V_0}{1+\exp[(r-R_0)/a]}\,, $

(4) where
$ R_0 = r_0(A_P^{1/3}+A_T^{1/3}) $ . The three potential parameters$ V_0,r_0,a $ are the potential depth, potential radius, and diffuseness, respectively.According to the Bayesian theorem [41], the posterior probability distribution functions (PDFs) of model parameters could be written as
$ P(x \mid D) = \frac{P(D \mid x) P(x)}{P(D)} . $

(5) $ P(x) $ is the prior distribution of the model parameter x in the absence of the given data D, which means the prior understanding of the parameter set.$ P(D \mid x) $ is the likelihood function, where a Gaussian distribution is adopted to compare the model values to the corresponding experimental observations.$ P(D) $ is the normalization constant, which ensures the posterior distribution is a valid probability density and integrates to 1. The posterior distribution,$ P(x \mid D) $ , demonstrates the likely distribution of the parameters, which could be obtained by sampling using the Markov chain Monte Carlo algorithm (MCMC) [43]. Similar to Refs. [34, 44], the prediction value of a function$ S(x) $ of the model parameters could be obtained by taking its expectation values over the posterior distribution, namely$ <S> = \int S( x) P(x \mid D) {\rm d} x. $

(6) An estimate of uncertainty in the theoretical predictions is obtained naturally as
$ \Delta S = \sqrt{\langle S^2 \rangle - \langle S \rangle^2}. $

(7) In this work, the prior distributions of the three potential parameters in Eq. (4) are set as uniform distributions. The likelihood function employs a Gaussian distribution.
There are many MCMC techniques available in the literature. In this work, we adopted the
$ emcee $ algorithm, which is a Python implementation of the affine-invariant Metropolis-Hastings MCMC ensemble sampler [44]. The method has been used in astrophysical studies [45–47]. This algorithm depends on few tuning parameters and is easily used to take advantage of multiple CPU cores. The Gaussian process could also be inserted in this algorithm to obtain the posterior distribution if the model calculations require a long time [47].The commonly used coupled-channels model CCFULL [48] has noncontinuous problems when collective excitations are considered for carbon fusion at low-energy regions. In this study, we adopt the coupled-channels method CCFULL-FEM used in our previous studies [30, 49, 50]. This novel approach improves the incoming wave boundary conditions by considering the non-diagonal elements of the coupled matrix based on the linear transformation method. The advanced finite element method KANTBP is adopted to solve the multidimensional Schrödinger equation [51, 52]. The coupling radius parameter for the collective vibrations is set to 1.2 fm. For 12C, the rotation coupling with deformation
$ \beta_2 = -0.57 $ and the excitation$ E_{2^+} = 4.44 $ MeV are adopted. For the$ emcee $ calculation, the ensemble members$ nwalker = 128 $ , burn-in steps$ nburn = 200 $ , and running steps$ niters = 1000 $ are used. A large uniform prior distribution is employed, with$ V_0 $ ranges from 2 MeV to 200 MeV,$ r_0 $ ranges from 0.55 fm to 2.18 fm, and a ranges from 0.1 fm to 2.0 fm. -
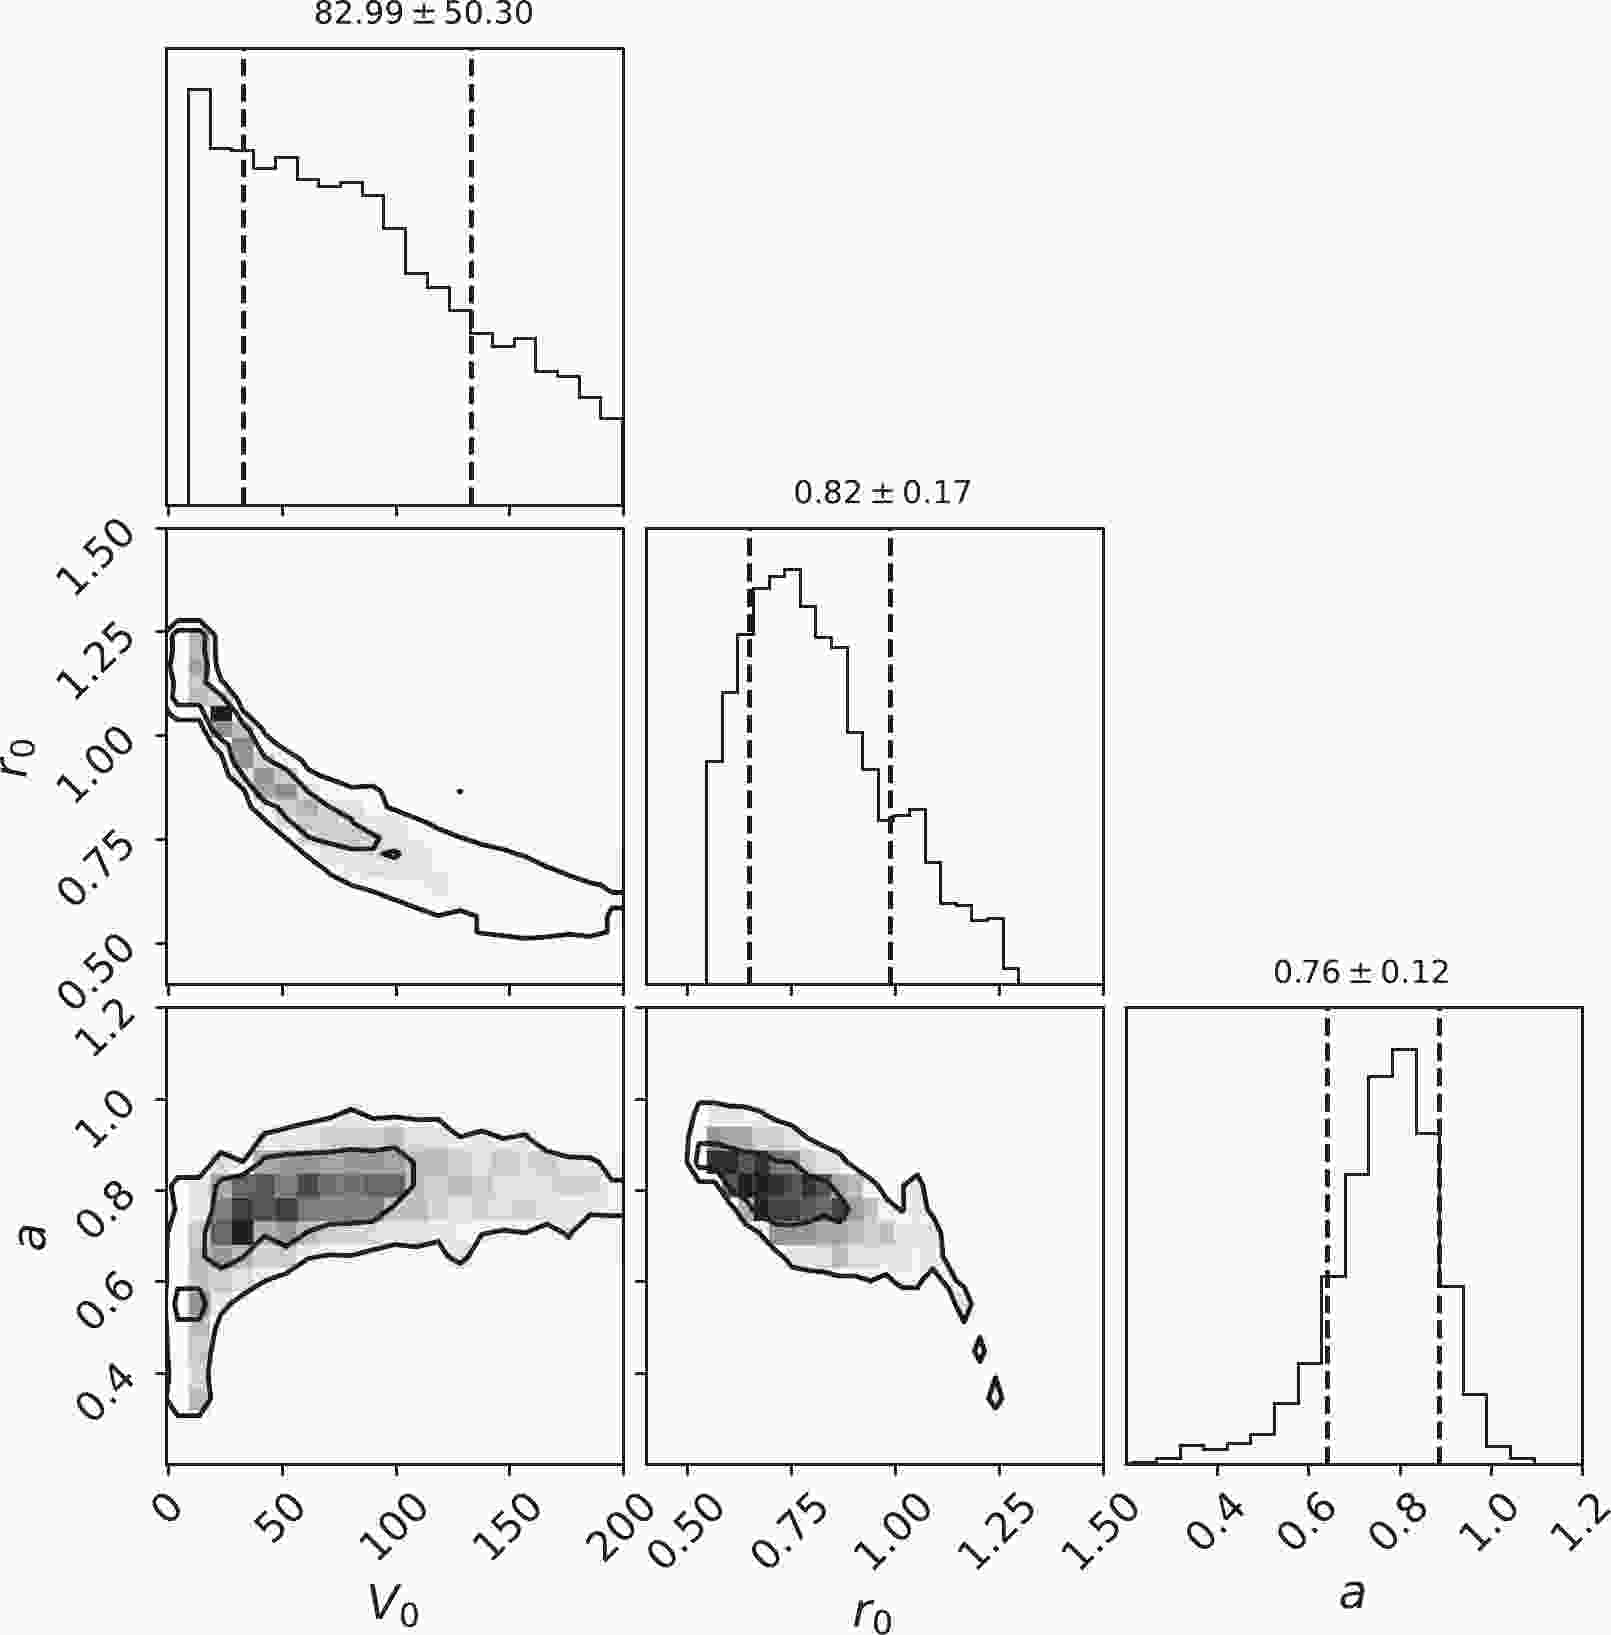
In a previous work, we studied the carbon fusion reaction with the rotational couplings based on the experimental data by Jiang et al. [18, 30]. Based on these data, the hindrance model was proposed [18, 26]. We are concerned about whether the same hindrance effect can be obtained by using the latest version of the coupled-channels model CCFULL-FEM combined with Bayesian analysis. In Ref. [30], the fit of the three Woods-Saxon potential parameters was performed by using the MIGRAD algorithm implemented within the popular Minuit program [53]. The MIGRAD algorithm is the most efficient and complete single method within Minuit, recommended for general functions. In this study, we take Jiang's experimental data to compare with our previous studies by using the Bayesian method. In Fig. 1, we plot the marginal posterior distributions (diagonal) for the Woods-Saxon potential parameters, and the correlations between parameters for
$ ^{12}{\rm{C}} $ +$ ^{12}{\rm{C}} $ fusion reaction. This figure is generated using the widely used Python package CORNER [46, 47, 54]. The expectation value of the potential parameters according to Eq. (6) by replacing the function$ S(x) $ with the potential parameters are$V_0 = $ $ 82.99^{\pm 50.30}$ MeV,$ r_0 = 0.82^{\pm 0.17} $ fm,$ a = 0.76^{\pm 0.12} $ fm. They are labeled on the top of the diagonal panel for reference. It was seen from the two-dimensional probability distribution graph that the three parameters were scattered in a large area. This was because there were few experimental energy points and large error bars. The$ S^\star $ factor was calculated with many parameter combinations that met the experimental data. We saw from the figure that the parameter range selected in this calculation covered the main probability distributions. For$ r_0 $ and a, an apparent single peak was seen from the diagonal plot, and the position of the average value was close to the peak. The 68.3% confidence intervals of these two parameters shown in the figure cover the main part of the peak. However, for$ V_0 $ , the top panel shows that its distributions were different from the other two. However, for$ V_0 $ , the top panel shows that its distributions were different from the other two. The maximum peak was outside the 1σ confidence interval, which was at$ V_0 = 10.27 $ MeV. The mean position where$ V_0 $ = 82.99 MeV was far from its maximum value.
Figure 1. Two-dimensional joint posterior densities (off-diagonal) and the marginal posterior distributions for the parameters (diagonal) of potential parameters for
$^{12}{\rm{C}}$ +$^{12}{\rm{C}}$ fusion reaction. Depth ($V_0$ ) is in MeV. Radii ($r_0$ ) and diffuseness (a) are in fm. The expectation value of the potential parameters according to Eq. (6) by replacing the function$S(x)$ with the potential parameters are labeled on the top of the diagonal panel for reference. The$1\sigma$ interval of the parameters are shown as the vertical dashed lines.The theoretical prediction for the
$ S^\star $ factor based on Jiang's experimental data is plotted in Fig. 2. The mean prediction and the 1σ (2σ) confidence interval around it based on the Bayesian method are displayed with the solid line and the shadow gray (blue) area. In Ref. [40], the 2σ confidence interval was used as a comparison with the experimental data. Considering that the errors of experimental incident energy and other statistical error of experimental data are not included in their publications, the actual experimental error could be larger. We have also shown the 2σ confidence interval as a comparison in this figure. The large-scale distribution of the three potential parameters in Fig. 1 resulted in a wide distribution of the$ S^\star $ factor in Fig. 2. We saw that the average result of the Bayesian method was smooth. However, due to the few parameter points, there was a certain error band. Especially when the energy was less than 2.5 MeV, the theoretical error band became wider when there were no experimental data points as reference. However, we saw that the$ S^\star $ factor did not decrease rapidly when the incident energy was 1 MeV to 3 MeV.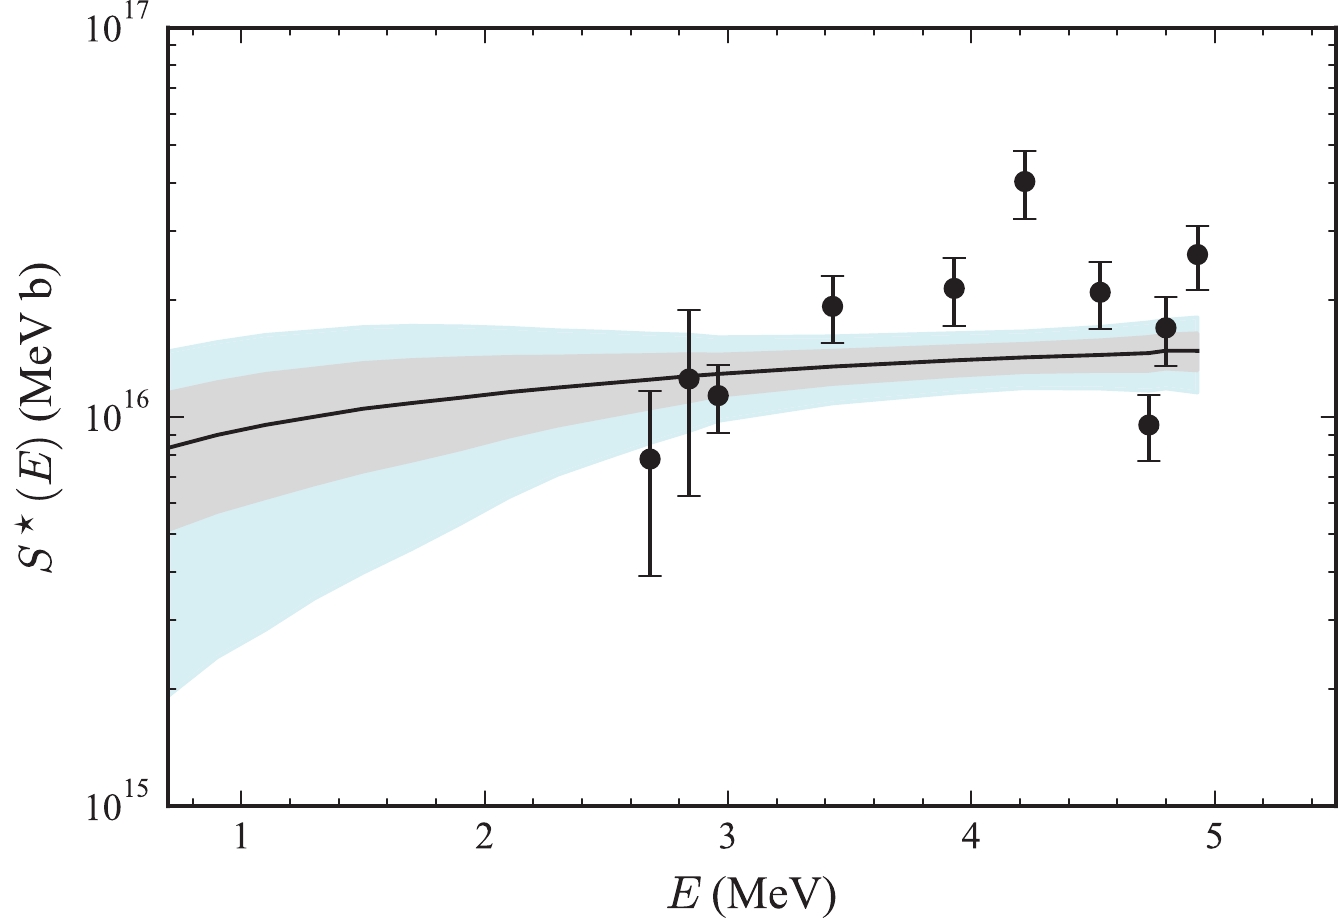
Figure 2. (color online) Results for the
$S^\star (E)$ -factor. Experimental data (Exp) are taken from Ref. [18]. The solid line and shadow gray (blue) area are the mean predictions and its$1\sigma$ ($2\sigma$ ) confidence level based on the Bayesian method.Because the Bayesian method adopted the MCMC method, only when the calculation amount was large, it could search within a tiny parameter range near a local minimum. Since the marginal distribution of
$ V_0 $ was different from that of the other two parameters, we used the MIGRAD method to further study the influence of the potential depth$ V_0 $ . We chose three parameter sets, including the f1 ($ V_0 = 82.99 $ MeV,$ r_0 = 0.82 $ fm,$ a = 0.76 $ fm), f2 ($ V_0 = 10.27 $ MeV,$ r_0 = 1.24 $ fm,$ a = 0.37 $ fm), and f3 ($ V_0 = 120.01 $ MeV,$ r_0 = 0.61 $ fm,$ a = 0.90 $ fm) and substituted them as the initial values of the MIGRAD method in the Minuit program. f1 is the expectation parameters based on the Bayes method.$ V_0 $ of f2 is the peak value of its marginal distribution, while the$ r_0 $ and$ a_0 $ were chosen from the parameter chain to have a small$ \chi^2 $ . f3 is the one with$ V_0 $ at larger energy region and the other two potential parameters were chosen from the parameter chain. In Fig. 3 (upper panel), we show the results of the$ S^\star $ factor calculated in the second search in Fig. 2. It was found that the search based on the MIGRAD method was easily trapped in the local minimums near the initial value. Finally, three minima were named as F1 ($ V_0 = 73.48^{\pm 9.16} $ MeV,$ r_0 = 0.77^{\pm 0.04} $ fm,$ a = 0.82^{\pm 0.04} $ fm), F2 ($ V_0 = 10.43^{\pm 0.32} $ MeV,$ r_0 = 1.24^{\pm 0.01} $ fm,$ a = 0.43^{\pm 0.04} $ fm), and F3 ($ V_0 = 188.17^{\pm 23.61} $ MeV,$ r_0 = 0.58^{\pm 0.01} $ fm,$ a = 0.83^{\pm 0.01} $ as fm) respectively. It was seen that the$ S^\star $ factor in the low-energy region, especially when the energy was less than 3 MeV, the results calculated using the F1, F3, and F2 parameters had different trends with the decrease in energy. F1 and F3 changed gently, while F2 dropped sharply to zero showing the characteristics of the hindrance. In our previous works, we obtained results close to line produced by the F1 parameter set [30].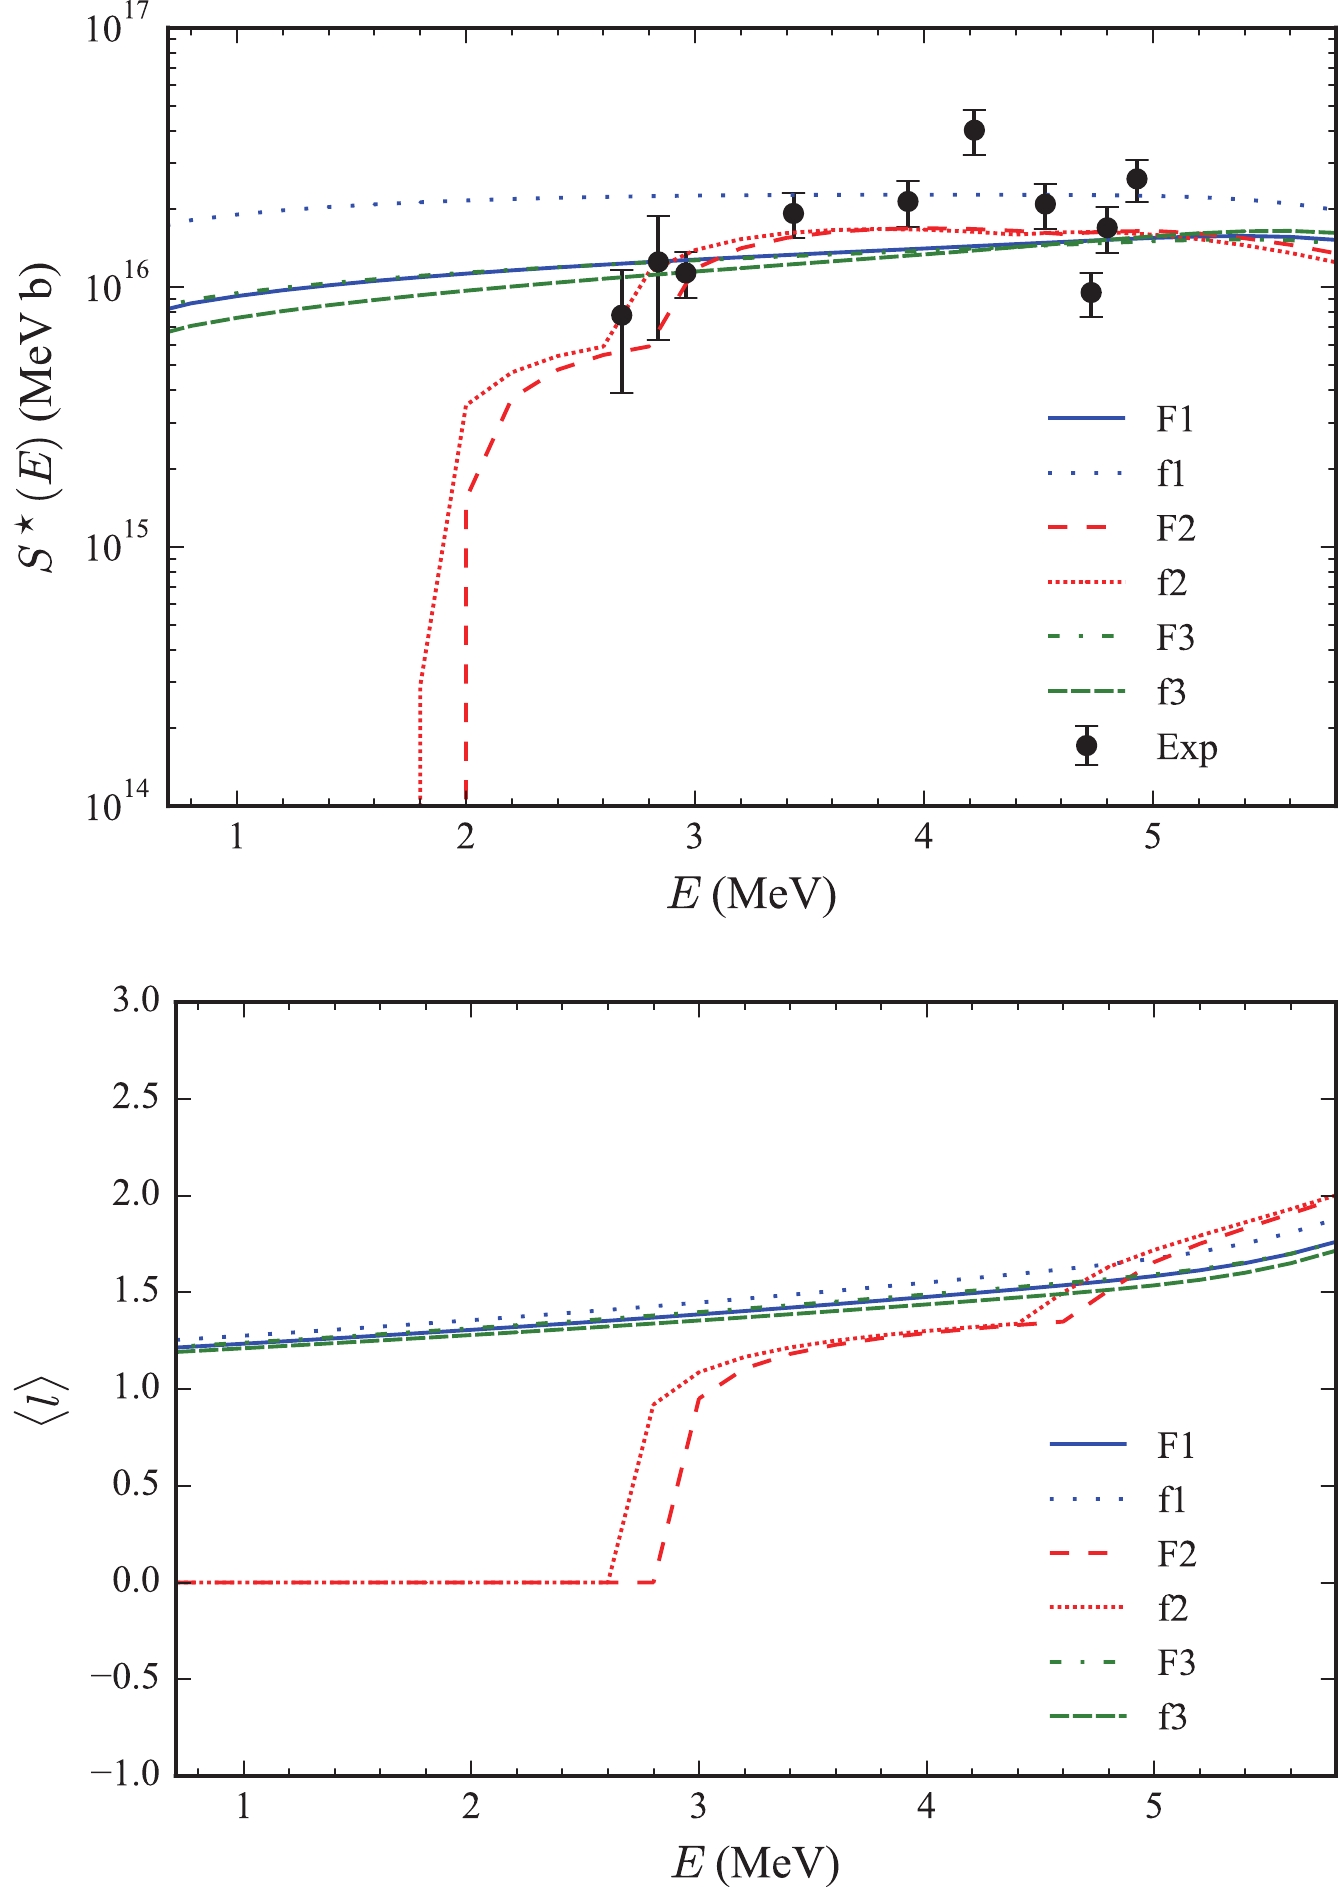
Figure 3. (color online) Results for the
$S^\star (E)$ -factor (upper panel) and mean angular momentum$\langle l \rangle$ (lower panel). The experimental data (Exp) are taken from Ref. [18]. The F1 (solid line), F2 (dashed line) and F3 (dash-dotted line) are calculated by the MIGRARD method using the f1 (dotted line), f2 (densely dotted line), and f3 (densely dashed line) parameters as input value, respectively.The hindrance that appears for the F2 can be explained by the rules introduced in our previous work [30]. The average angular momentum
$ \langle l \rangle $ calculated from these two sets of parameters is shown in Fig. 3 (lower panel). For the carbon fusion reaction with identical bosons participated, according to the identical particle effect, only angular momentum l = 0, 2, 4$ \ldots $ was allowed. For these two sets of parameters F1 and F2, when the incident energy was less than 4 MeV, only the partial wave with l = 0,2 participated in the fusion reaction. Under the F2 parameter, the potential pocket was shallower. When the incident energy was close to the bottom of the potential, the$ \langle l \rangle $ decreased to 0 at E = 2.7 MeV, resulting in rapid cross-section, and the$ S^\star $ factor declined. If future experiments could measure whether$ \langle l \rangle $ drops rapidly, we can distinguish further between different hindrance mechanisms. Based on the above results, it was seen that the Bayesian method was more flexible than the MIGRAD approach in exploring the multidimensional parameter space. However, it was still difficult to tell whether there was a sharp decrease of the$ S^\star $ factor at the low-energy region based on the experimental data from Ref. [18].In Ref. [55], the method of obtaining the error of theoretical models was introduced. The adopted errors should be both experimental and theoretical errors due to the inherent deficiencies of the model. The current coupled-channels model also has several limitations. The CCFULL-FEM model could not describe the resonance behavior, and there are other possible unknown reaction channels for carbon fusion. In case of statistical fluctuations, it requires that the total penalty function at the minimum to be normalized to
$ N_d - N_p $ , with$ N_d $ and$ N_p $ being the number of data points and parameters. Namely, the average$ \chi^2 ( {\bf{P_0}}) $ per degree of freedom should be one.$ {\bf{P_0}} $ is the optimum parametrization that minimizes the$ \chi^2 $ function. A global scale factor s is suggested to mimic the theoretical error as$ \chi^2_{\mathrm{norm}} = \chi^2 ( {\bf{P_0}}) /s = $ $ N_d - N_p $ . In the following calculations, we add the scale factors s to consider the model error due to its deficiencies.For the experimental data in Ref. [18], we use the
$ s = 4.88 $ as an estimation of the model error, which is obtained based on one of the optimum parameterizations based on the MIGRAD method. In Fig. 4 and Fig. 5, we show the results considering the model error. The comparison between the corner plot Fig. 4 and Fig. 1 demonstrate that the posterior distribution became wider when the model error was considered. The peak position of$ V_0 $ also changed from about 10 MeV in Fig. 1 to the right of about 35 MeV in Fig. 4. This was to be expected, as larger errors gave the parameters more space to be tuned. We saw that the confidence interval became larger in Fig. 5 compared to that in Fig. 2. The$ S^\star $ factor did not decrease rapidly at 1 MeV to 3 MeV inside the 1σ area, while the results could decrease within the 2σ interval in Fig. 2. It is difficult to draw reliable conclusions about the hindrance from the current experimental results.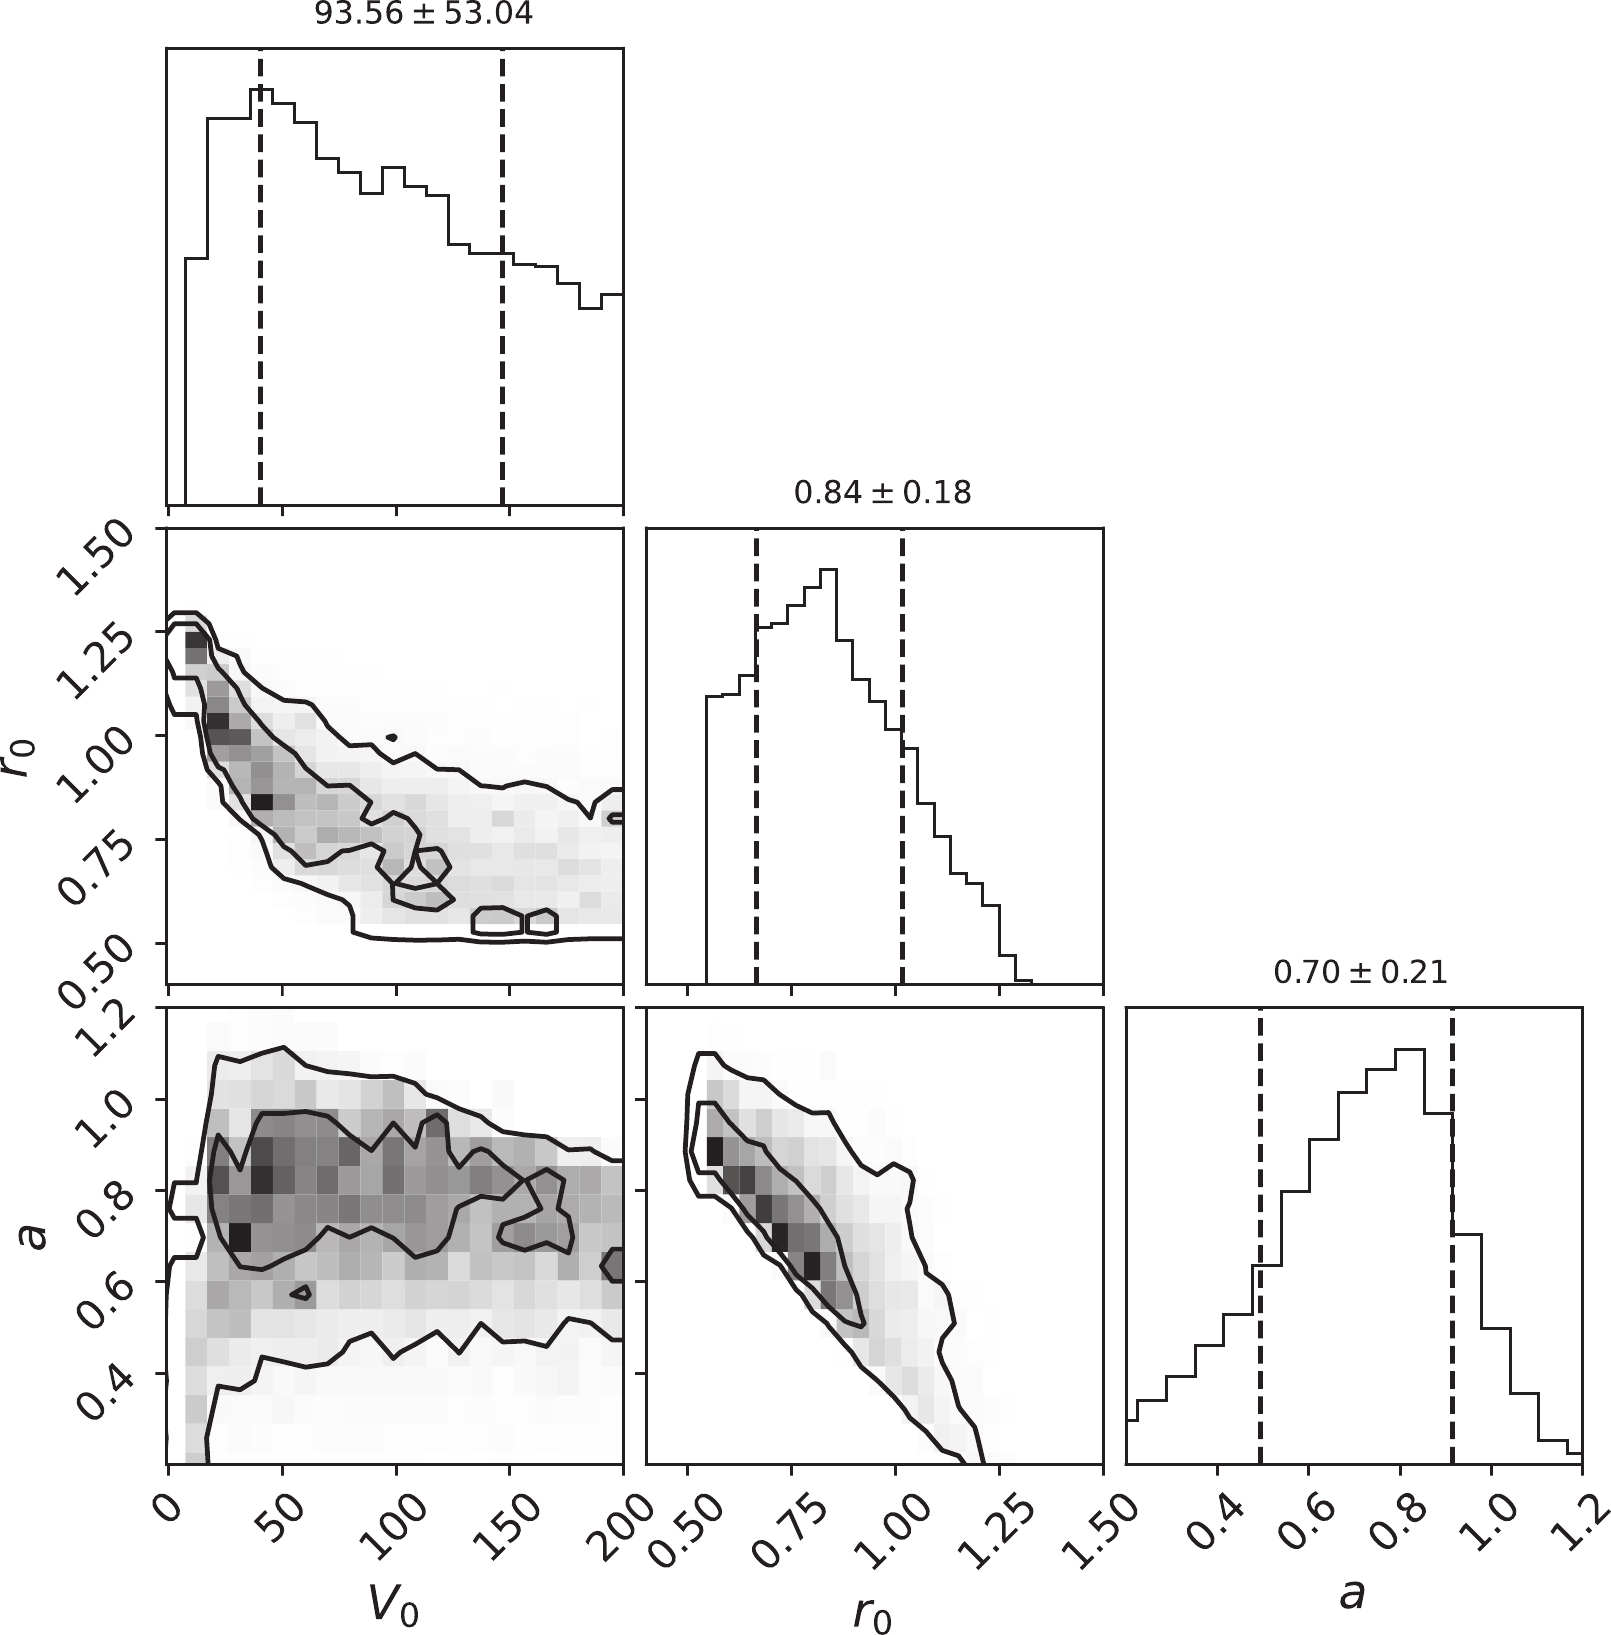
Figure 4. Similar to Fig. 1 for fusion reaction
$^{12}{\rm{C}}$ +$^{12}{\rm{C}}$ but considering model error in the calculations.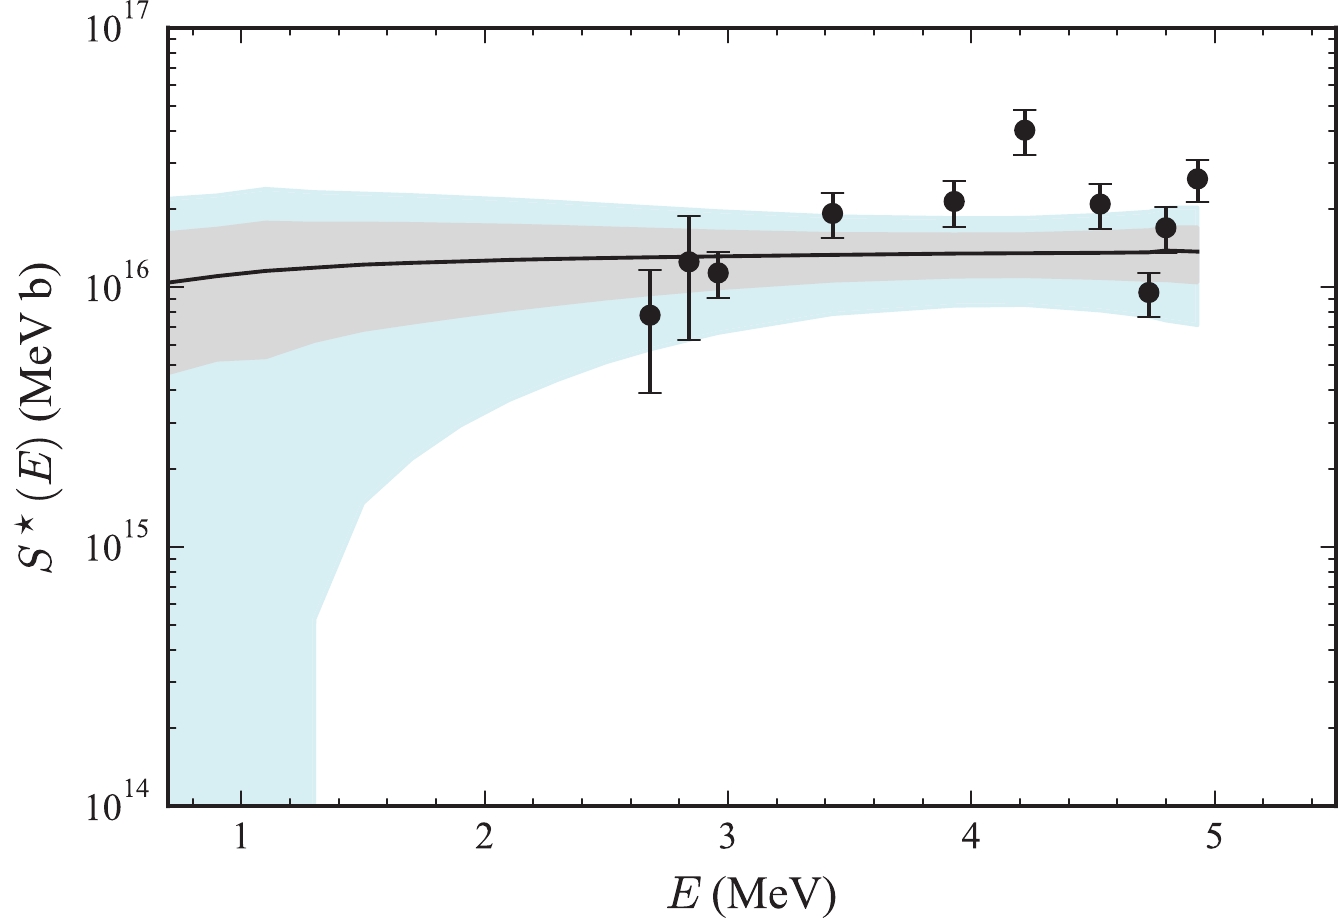
Figure 5. (color online) Similar to Fig. 2 for fusion reaction
$^{12}{\rm{C}}$ +$^{12}{\rm{C}}$ but considering model error in the calculations.To obtain more reliable conclusions, we employed more experimental data in the following calculations. We collected most of the existed experimental carbon fusion cross sections, which was measured down to the sub-barrier energy region [8, 9, 12, 14, 15, 17–20, 56]. In Fig. 6, we plot the marginal posterior distributions and the correlations of the three potential parameters. The Bayesian predictions on the
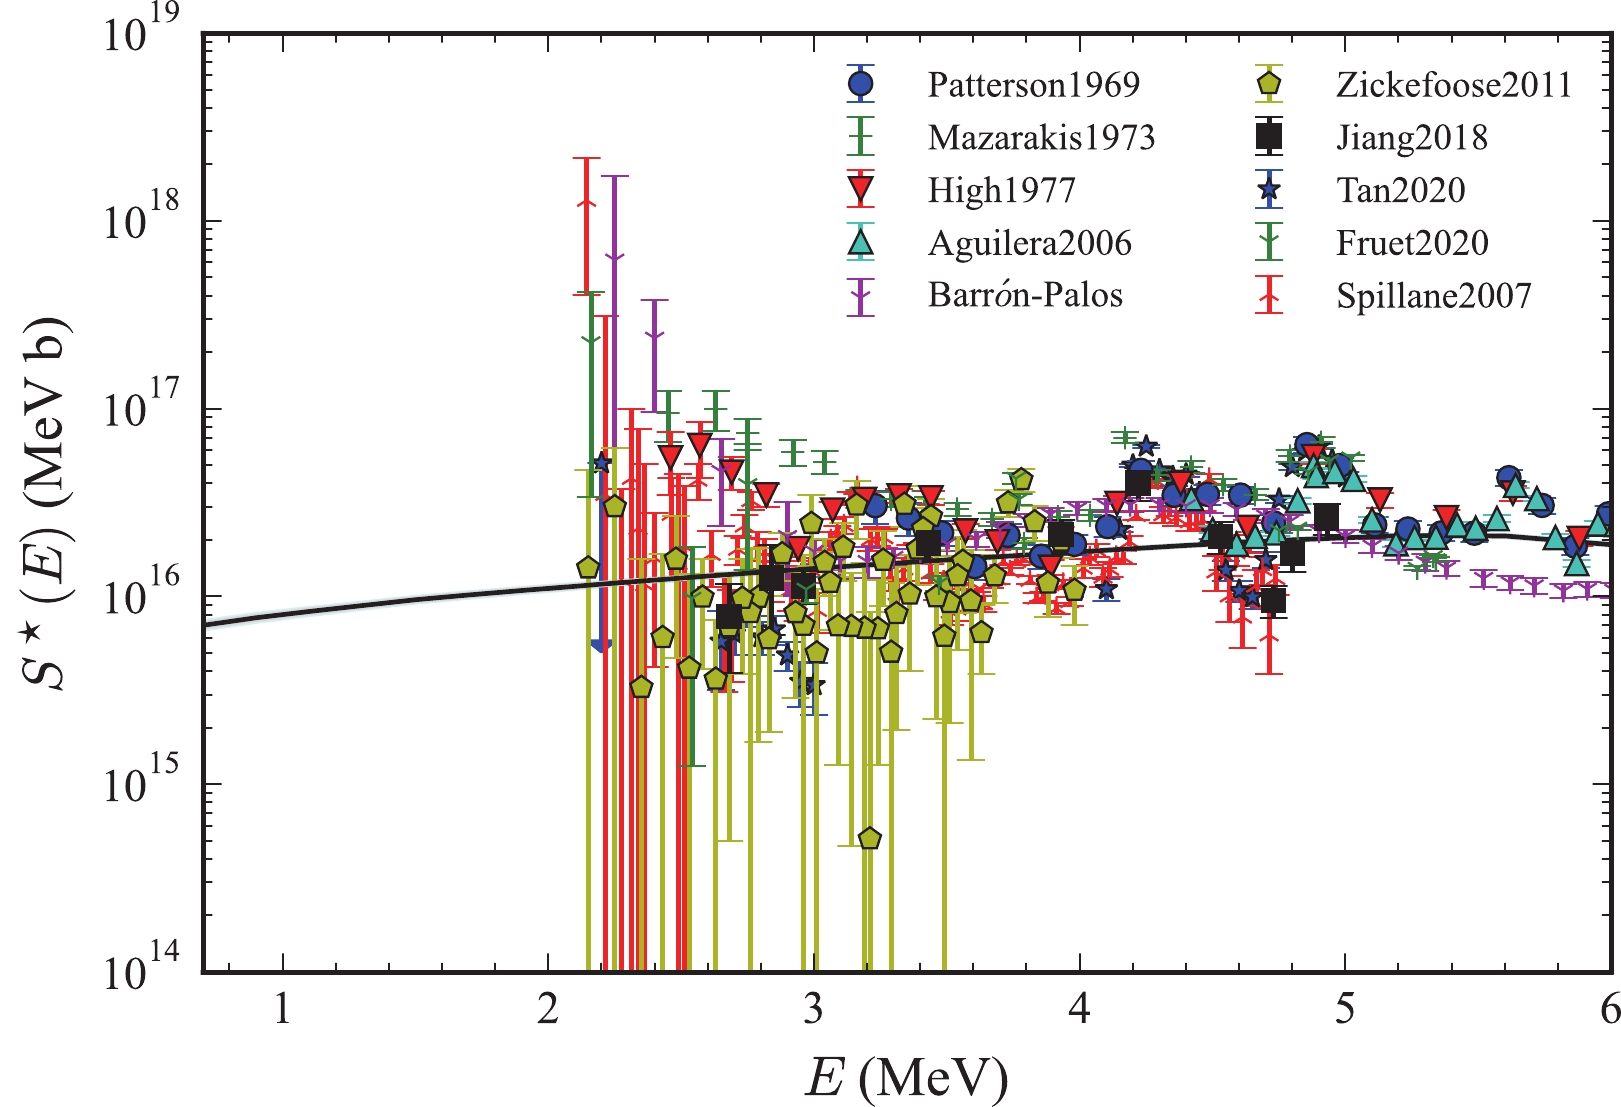
$ S^\star $ factor are displayed in Fig. 7. A total of 334 experimental fusion energies were considered here. The scaling factor$ s = 46.57 $ was adopted to estimate the model errors based on the minimum parameters searched by the MIGRAD method. Since the incident energies of many experimental were close, we used the cubic interpolation method to save the large calculation cost. Considering that$ S^\star $ factor changed slowly, we calculated it with every 0.4 MeV and 0.2 MeV energy at above and below 3.2 MeV. Many experimental data could impose stringent constraints on the parameters. Fig. 6 shows that the range of the marginal posterior distribution and the two-dimensional probability distribution are narrow compared to the result shown in Fig. 1. The potential parameters are almost pinned down to definite values with$ V_0 = $ $ 30.38 ^{\pm 0.50} $ MeV,$ r_0 = 0.94^{\pm 0.01} $ fm, and$ a = 0.84 ^{\pm 0.01} $ fm. Moreover, the error bands shown in Fig. 7 are also narrow due to the limited parameter range. For example, the$ S^\star $ factor is$ 7.71 \times 10^{15} $ MeV$ \cdot $ b at 0.9 MeV, and the 1σ (2σ) error bar is$ 1.75 \times 10^{14} $ ($ 3.50 \times 10^{14} $ ) MeV$ \cdot $ b. The 1σ (2σ) error bar is approximately 2.3% (4.5%) of the value, which is not obvious from this logarithmic scale plot. A reason for the small theoretical error bar is that different sets of experimental data are considered here. The experimental data varied between different research groups. In some cases, under the same energy, separate groups had two different sets of cross sections and different experimental error bars. Therefore, the final theoretical prediction can only take an intermediate value between these experimental data, and there is a small error band. Similar to the results in Fig. 2, the predicted$ S^\star $ factor was stable at the low-energy region, and there was no obvious hindrance feature.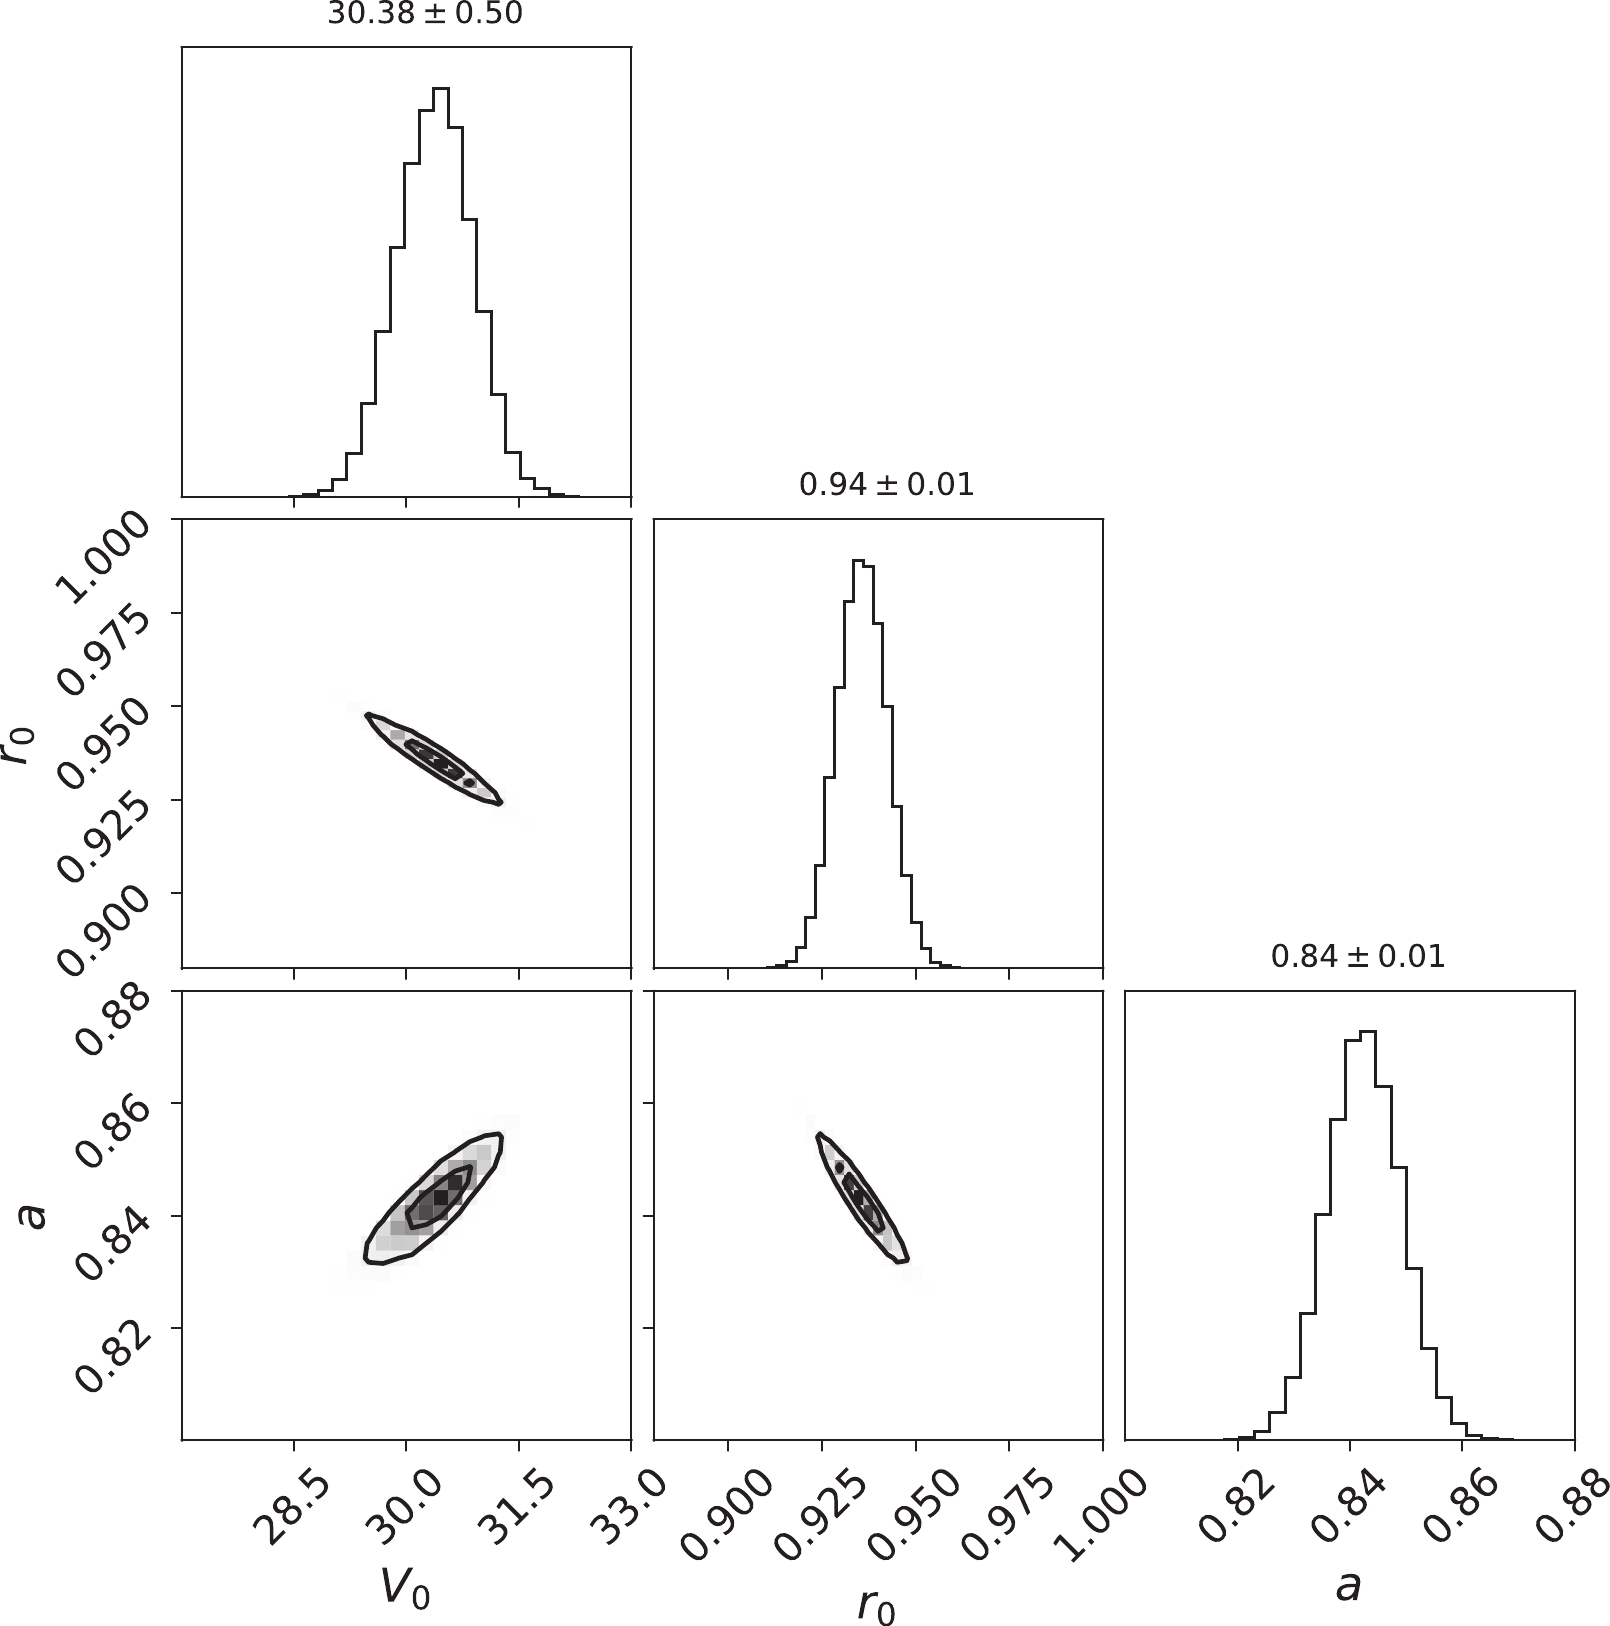
Figure 6. Similar to Fig. 1 for fusion reaction
$^{12}{\rm{C}}$ +$^{12}{\rm{C}}$ but considering all the available experimental data. The vertical dashed lines represent the$1\sigma$ are not shown due to the narrow range of each parameter.In Ref. [42], the existed experimental
$ S^\star $ data sets were analyzed with some corrections, and it was found that the current experimental data did not favor any model. In this work, the obtained error bands by the Bayesian method and the CCFULL-FEM were quite small when all the available experimental data were considered, which demonstrated that the method used in this work was suitable to describe the non-resonant behavior of this reaction. As seen from the above analysis, the Bayesian method had more advantages in exploring parameter distributions than the traditional method. Given that the current coupled-channels model could only consider non-resonant behavior, it was promising that the carbon fusion reaction could be further explored in the future by combining the Bayesian method with the development of the coupled-channels model or other models, such as the R-matrix model, which could consider the resonant behavior [22]. -
In summary, for the first time, we employed the Bayesian method
$ emcee $ , combined with the newly developed coupled-channels model CCFULL-FEM, to conduct a systematic theoretical study on the non-resonant behavior of$ {}^{12} \mathrm{C}+{}^{12} \mathrm{C} $ fusion reaction. This research paid particular attention to the hindrance characteristics of the$ S^\star $ factor in the low-energy region. By studying the experimental data of Jiang et al. [18], we found that the posterior distribution of parameter$ V_0 $ had different shapes compared with$ r_0 $ and a. The expectation value and its 1σ confidence interval could not cover the peak value. Moreover, the$ S^\star $ factors calculated from the two parameter sets f1 and f2, which corresponded to the mean likelihood and that contained the maximum likelihood of$ V_0 $ leading to opposite behavior as the energy decreased. The parameter set f3 with a larger$ V_0 $ was also considered. The result predicted by the f2 had the hindrance characteristic, while the results by f1 and f3 did not have this feature. The hindrance could be explained by the rapid decrease of the average angular momentum$ \langle l \rangle $ when the incident energy approached the bottom of the potential pocket as in our previous work [30]. It was suggested that the$ \langle l \rangle $ could be measured in the future to distinguish the hindrance mechanism, which could be easier for this light reaction since only limited angular momenta were involved. Based on these results, it was concluded that the Bayesian method was more flexible than the MIGRAD approach in exploring the multidimensional parameter space. When the model error was considered, both the posterior distributions and the confidence interval became larger. The$ S^\star $ factor did not decrease rapidly at 1 MeV to 3 MeV inside the 1σ area, while the results could decrease within the 2σ interval. Moreover, it was difficult to determine the existence of hindrance at the low-energy region based on the single experimental data from Ref. [18]. By considering more experimental results that include sub-barrier data from Refs. [8, 9, 12, 14, 15, 18, 20, 56], more stringent constraints can be imposed on the parameters. In this case, the$ S^\star $ factor does not show obvious hindrance characteristics. -
We thank Prof. Xiao-Dong Tang for providing some experimental data.
Bayesian analysis on non-resonant behavior of 12C + 12C fusion reaction at sub-barrier energies
- Received Date: 2021-12-31
- Available Online: 2022-06-15
Abstract: Controversies exist among experiments and theories on the


 Abstract
 HTML
HTML Reference
 Related
 PDF
PDF





 DownLoad: