


 Abstract
 HTML
HTML Reference
 Related
 PDF
PDF


-
Radiative neutron capture cross section (
$ \sigma_{n\gamma} $ ) is crucial in studies of stellar nucleosynthesis, designs of advanced nuclear reactors, and applications of nuclear technology. Taking the rare-earth element thulium (Tm) as an example, the neutron capture cross section of$ ^{170,171} $ Tm is essential for understanding the dynamics of the slow neutron capture process (s-process) in the Er-Tm-Yb region [1, 2]. The stable isotope of thulium, 169Tm, is one of the fission product poisons, making the accurate neutron capture cross section of 169Tm significant for fission and fusion reactor design. In addition, the radioactivity induced by the reactions of 169Tm$ (n, \gamma)^{170} $ Tm and 170Tm$ (n, \gamma)^{171} $ Tm makes the 169Tm an ideal spectrum-sensitive activation detector for the neutron intensity diagnosis, in which the precise neutron capture cross section is of critical importance. However, there are still non-negligible discrepancies between the values recommended by different evaluated nuclear data libraries for the neutron capture cross section of 169Tm, although they have been carefully measured and evaluated before [3-8]. In the energy region above 100 keV, the capture cross sections of 169Tm measured by the activation method [6] are systematically lower than those measured with the prompt γ-ray method [5], and there is as much as 20% difference between the evaluated values in ENDF/B-VIII.0 [9] and those in JEFF-3.3 [10].To verify the capture cross section of 169Tm in the energy region of tens to hundreds of keV, a measurement of the 169Tm
$ (n, \gamma)^{170} $ Tm reaction was carried out at the back streaming white neutron beam-line (Back-n) [11] of the China Spallation Neutron Source (CSNS) [12] with four C6D6 liquid scintillation detectors. Furthermore, the 197Au$ (n, \gamma)^{198} $ Au reaction was measured in the same experiment to examine the detection system and the data processing routine since the neutron capture cross sections of 197Au are standard cross sections at thermal energy and in the 0.2 – 2.8 MeV energy range.In this study, the experimental data of 169Tm and 197Au
$ (n, \gamma) $ reactions measured with the C6D6 detection system at Back-n in the energy region from 1 eV up to 400 keV were analyzed simultaneously, considering the experimental backgrounds, normalization, dead time correction, and correction for multiple scattering and self-shielding of the sample. In the energy region between 1 eV and 10 eV, the R-matrix code SAMMY (version M5) [13] was used to normalize the experimental yields by fitting the saturated resonance peaks of 169Tm and 197Au$ (n, \gamma) $ reactions. The$ \sigma_{n\gamma} $ of 169Tm in the resonance energy region was not derived from this measurement since the incident neutron flux of Back-n at the sample position of this measurement was only measured with a 235U fission chamber which also had many resonances in this energy region [14]. The average capture cross sections of 169Tm were determined by relative measurement with the experimental result of the 197Au$ (n, \gamma) $ reaction between 30 keV and 300 keV to avoid the effect of the uncertainty of the incident neutron flux. After comparing the capture cross sections of 169Tm obtained in the current measurement with the existing data and evaluated values, the point-wise capture cross sections in the energy between 30 and 300 keV were reported in this paper with careful consideration of the overall uncertainty. -
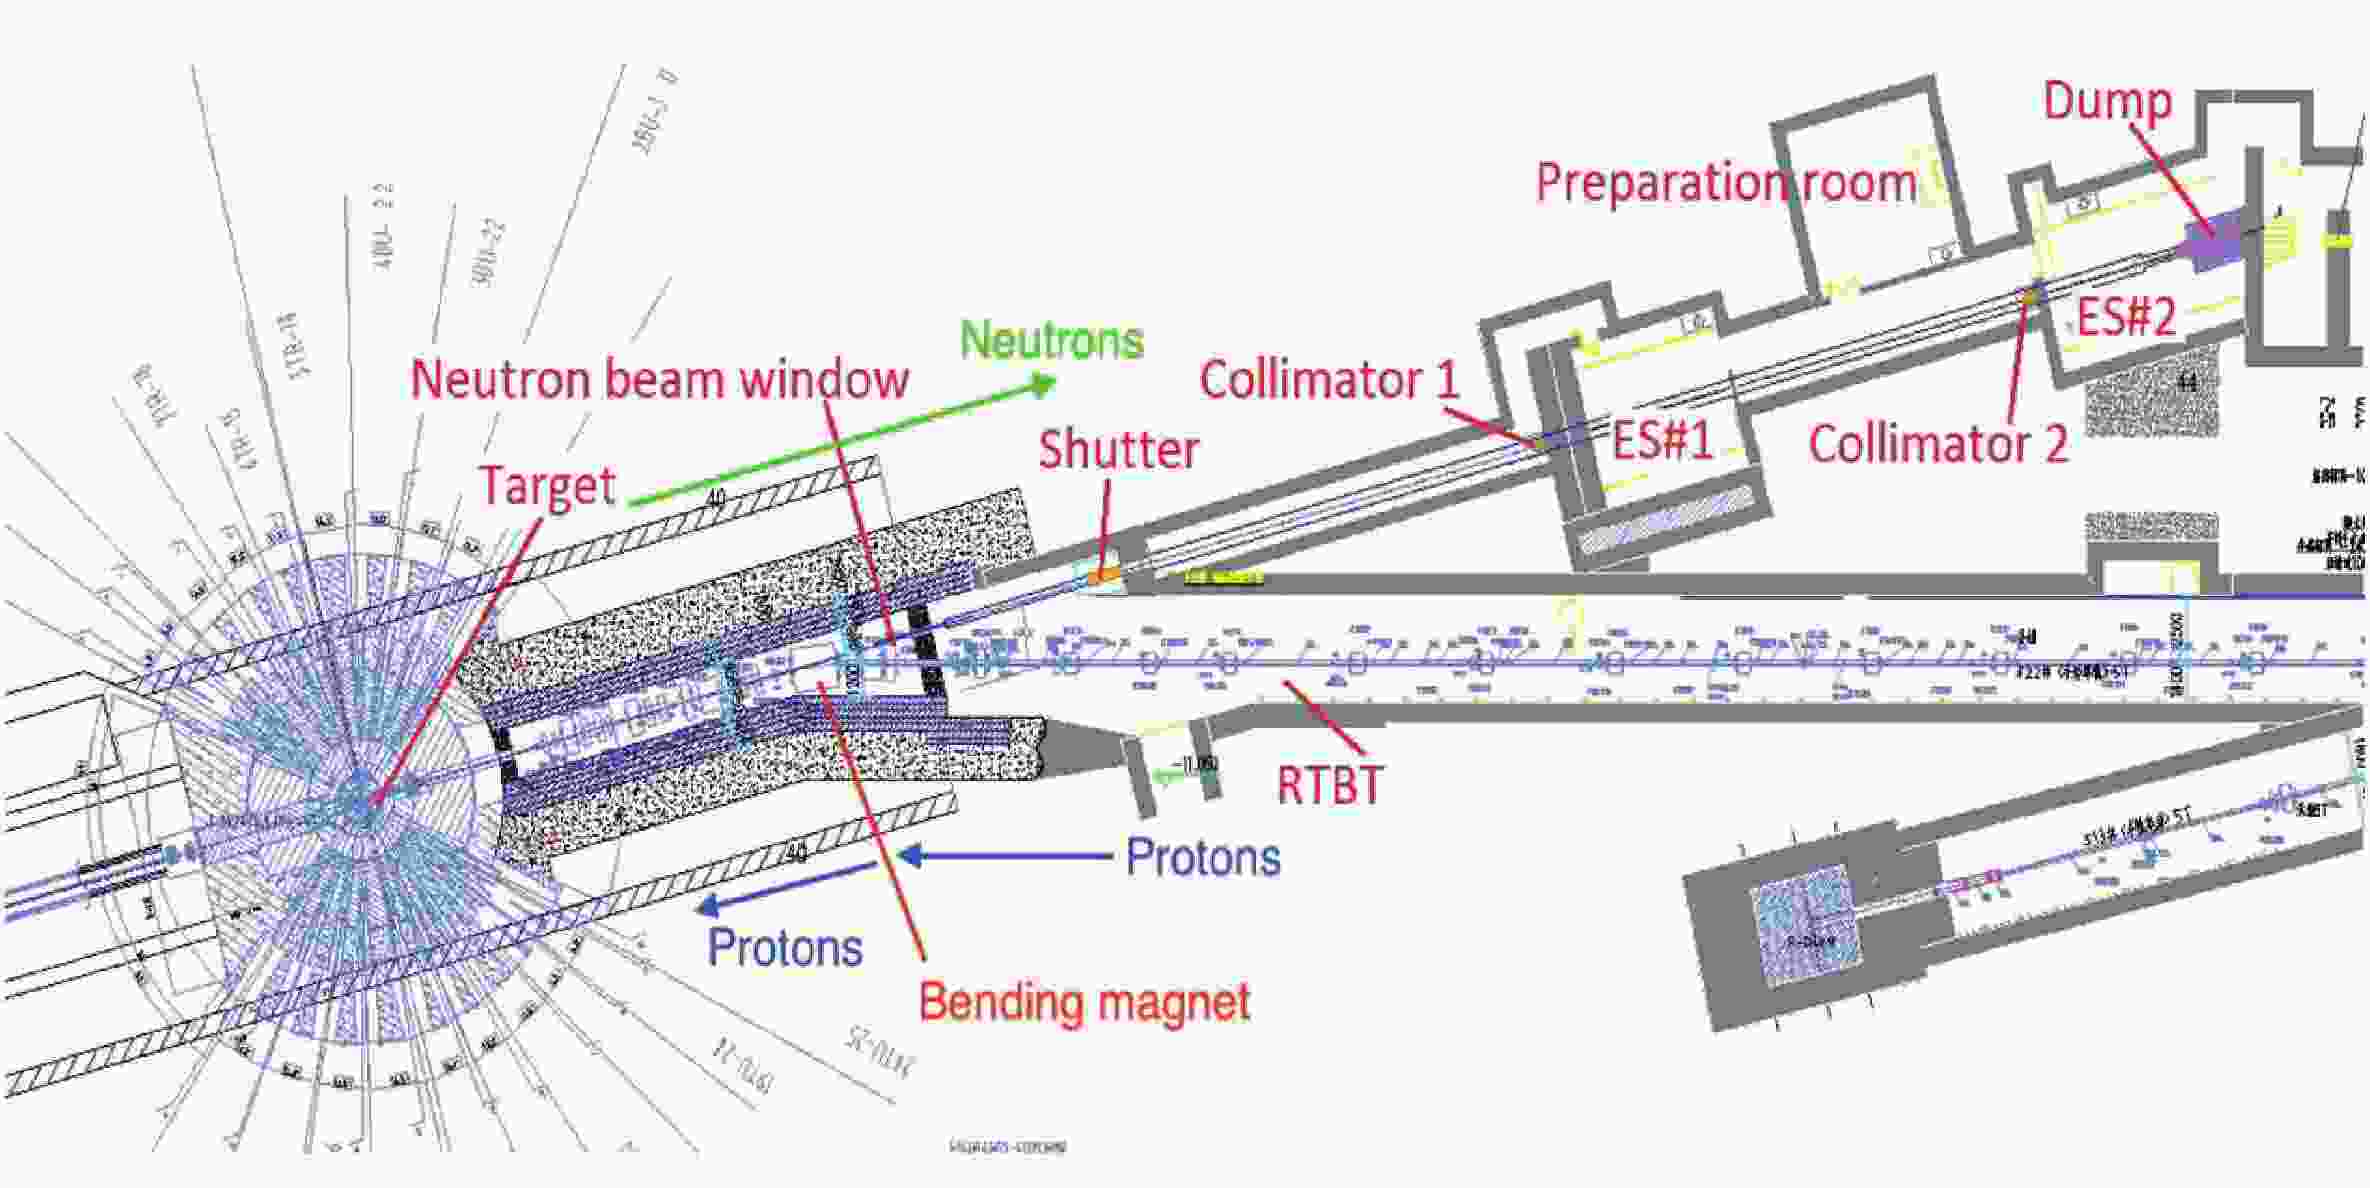
At the Back-n of CSNS, neutrons are produced by slamming 1.6 GeV/c proton beam, with double bunches per pulse, onto a tungsten target with a typical repetition rate of 25 Hz. The pulse width of each bunch is 41 ns, and the interval between the two bunches is 410 ns [15, 16]. Along the neutron beam-line, there are two experimental stations: the near station (ES#1),
$\sim $ 56 m from the spallation target to the sample, and the far station (ES#2), ~ 20 m further than ES#1. The neutron flux from thermal to 400 MeV can reach$ 10^7\ {\rm cm}^{-2} {\rm s}^{-1} $ at the experimental stations, when the proton bunches power of the CSNS is 100 kW. Fig. 1 shows the layout of Back-n. Three collimators located at$ \sim $ 24, ~50, and ~70 m from the spallation target are used to shape the neutron beam spot to obtain different beam profiles at the sample positions. Alternatively, the first collimator can be used as a beam shutter. For the neutron capture cross section measurements, the inner diameters of the three collimators are 50.0, 15.0, and 40.0 mm, which provide a circle neutron beam spot with$ \sim$ 30 mm diameter and$ \sim $ $ 2.0\times10^6\ {\rm cm}^{-2} {\rm s}^{-1} $ intensity at the center of the ES#2.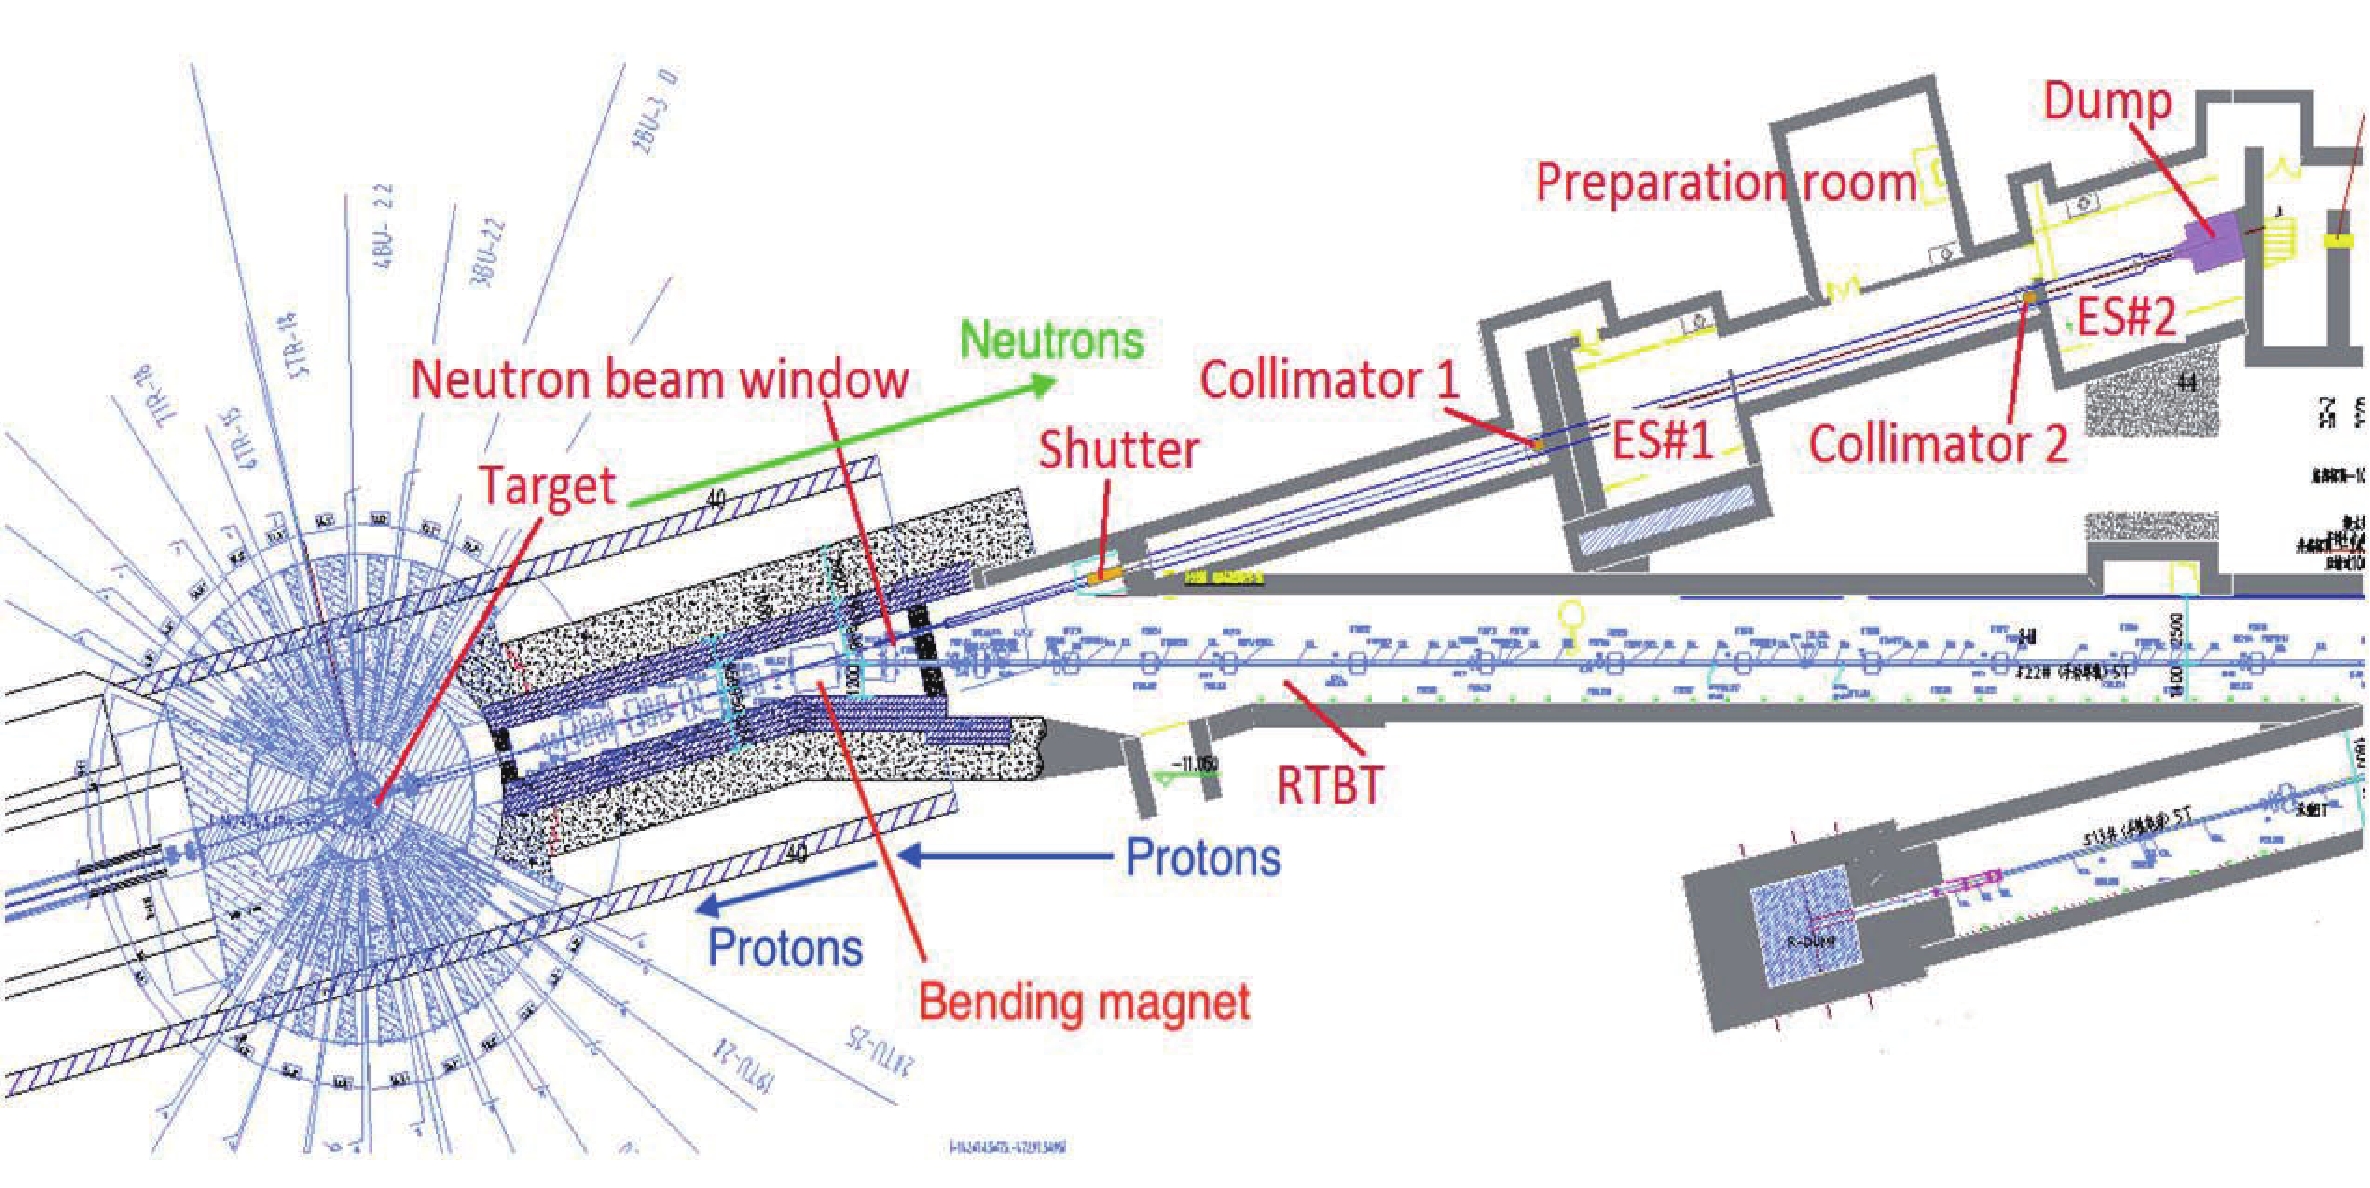
Figure 1. (color online) Layout of Back-n at CSNS.
For most neutron-induced reaction measurements, incident neutron flux should be monitored for cross section normalization. Two methods were provided at Back-n for online neutron flux monitoring. One uses the proton beam intensity measured by a current integrator in the proton beam-line, which is proportional to the yield of the spallation neutrons. The other is a real-time neutron monitor based on a 6LiF-silicon detector array installed on the beam-line in ES#1 of Back-n, approximately 54 m away from the spallation target [17].
The neutron flux of Back-n at ES#2 was measured with a 235U loaded multi-layer fission chamber (MFC) [14]. However, 235U used as a neutron converter in the MFC has many resonances in the energy region between 1 eV and 5 keV, and the fission cross section of 235U in the energy region below 150 keV is not a standard cross section. Therefore, the neutron flux in the resonance energy region of Back-n was performed with the 6LiF-silicon detector, which has been normalized to the MFC in the energy region between 10 and 20 keV [17]. The combined energy spectrum used in this study is shown in Fig. 2. The energy bins in the neutron flux spectrum were defined with equal intervals in the linear coordinate, which was 0.1 eV in the energy region between 1 and 10 eV, 1 eV in the energy region 10 – 100 eV, 10 eV in the energy region 100 eV – 5 keV, 1 keV in the energy region from 5 to 500 keV, and 500 keV in the region between 500 keV and 100 MeV.
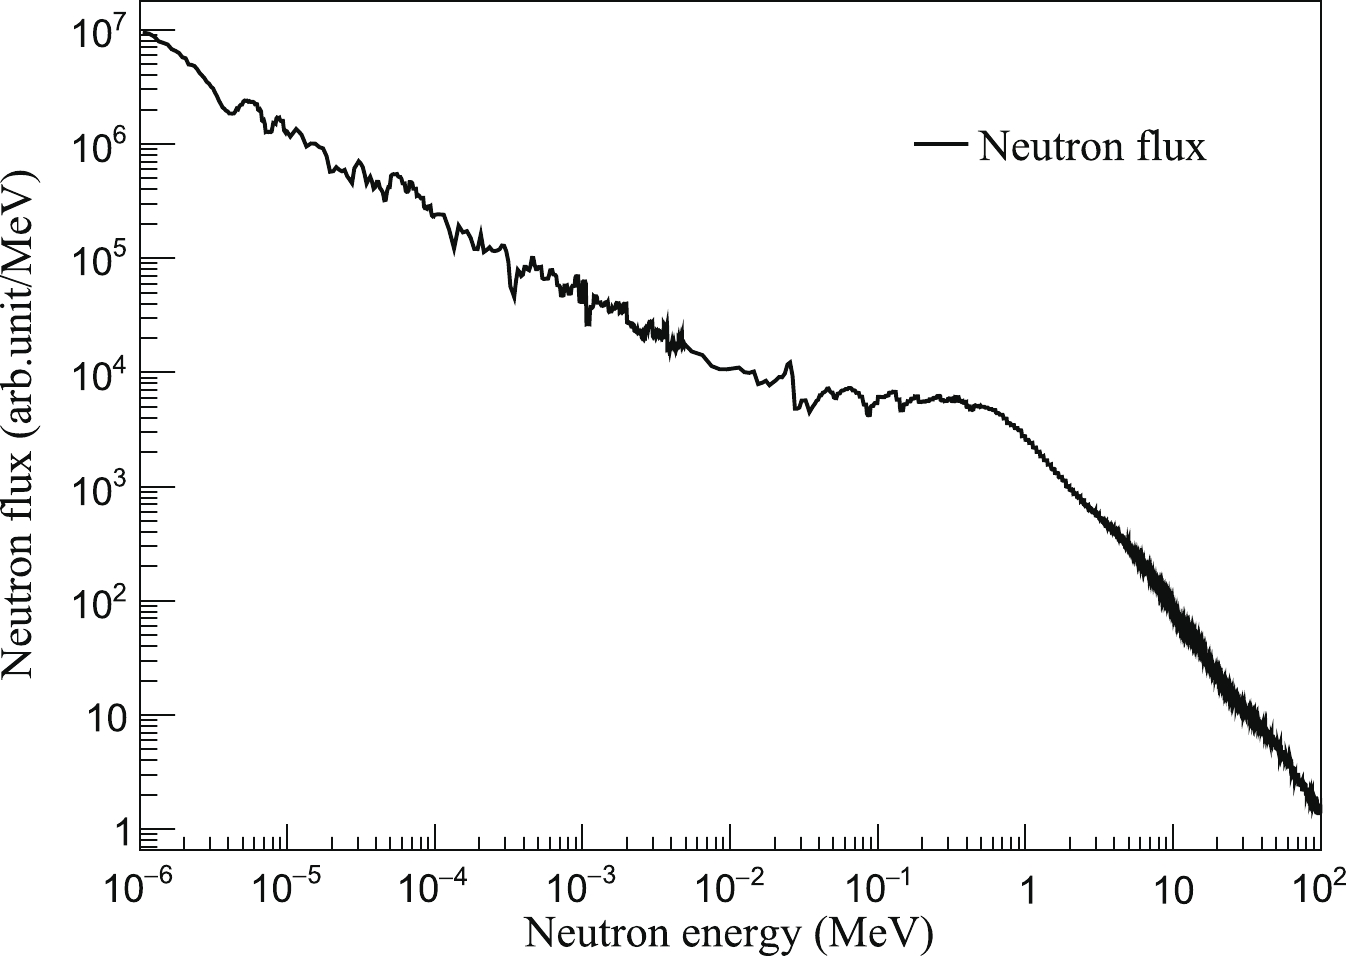
Figure 2. The neutron flux of Back-n.
-
The prompt γ-rays detection system with four C6D6 detectors (EJ-315) was installed at the center of ES#2, approximately 76 m away from the spallation target [18], shown in Fig. 3. The C6D6 liquid scintillator was 127 mm in diameter and 76.2 mm in length, contained in a 1.5-mm-thick aluminum capsule and coupled with a photomultiplier tube (ETEL 9390 KEB PMT). These detectors were placed upstream of the sample relative to the neutron beam, and the detector axis is at an angle of 125 degrees with respect to the neutron beam direction. The distance between the center of the front face of the detector and the sample center is approximately 150 mm.
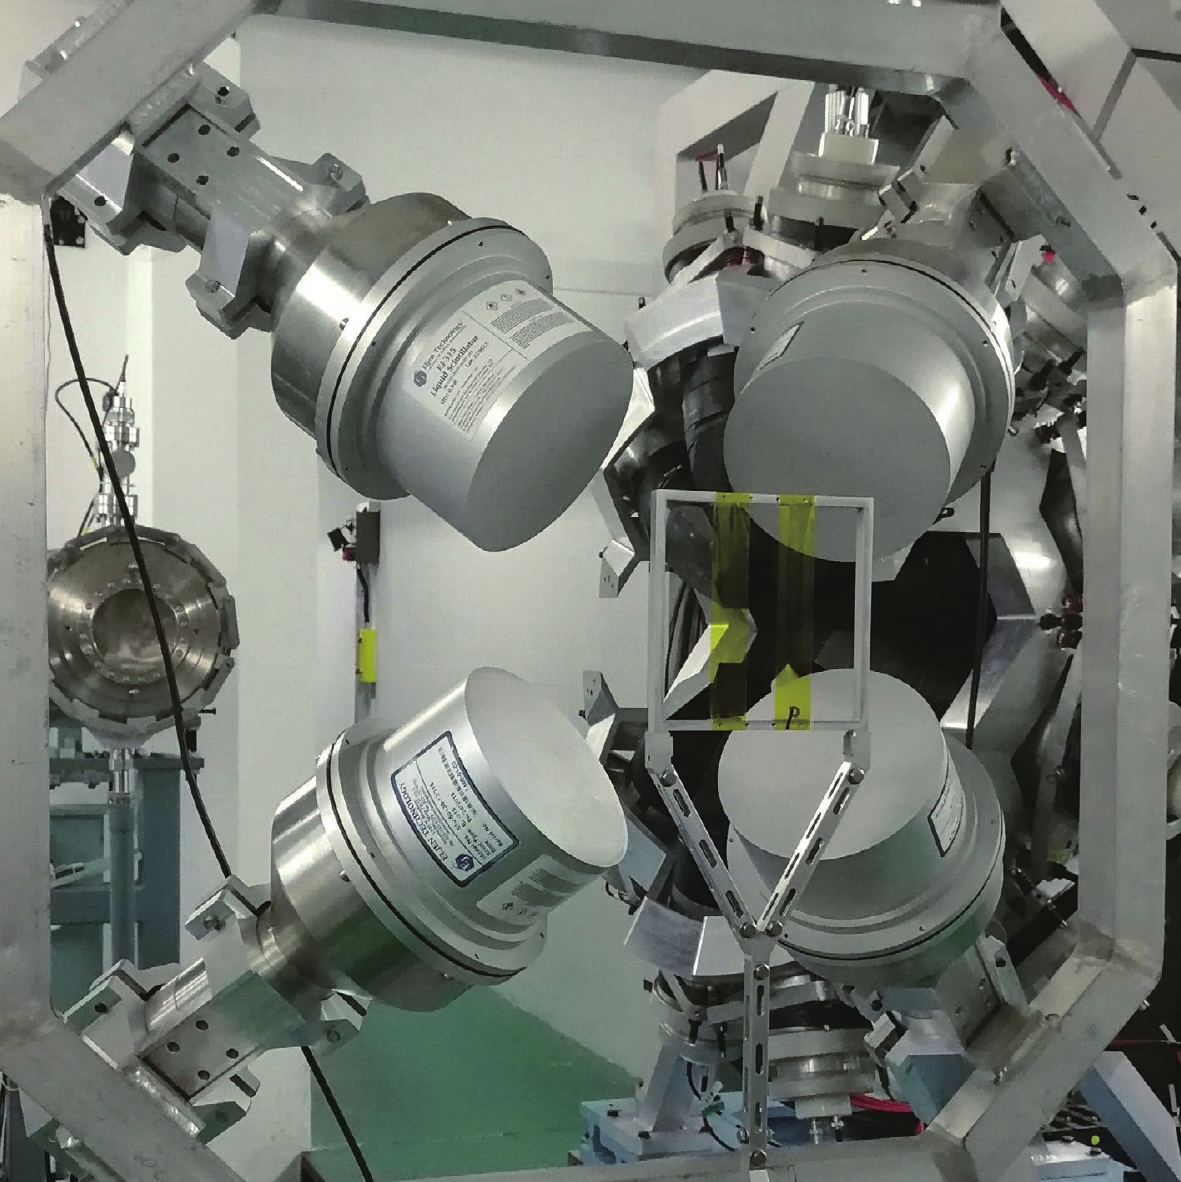
Figure 3. (color online) Photo of the C
$ _{6} $ D$ _{6} $ detector system at Back-n.Anode signals delivered by the PMTs were recorded by the Back-n general-purpose Data Acquisition System (DAQ) [19], which digitizes the analog signals into full-waveform data with a sampling rate of 1 GS/s and a 12-bit resolution. The DAQ was triggered by the pickup signal delivered by a Faraday tube in the proton beam-line. All the signals above the threshold were digitized. Data analysis was carried out offline. In addition, the signals of the neutron monitor were also recorded by this DAQ, and the count rates of the C6D6 detectors were normalized by the integration of the neutron monitor in the data analysis routine.
-
Samples used in this study included the target sample 169Tm, the standard sample 197Au, a natural carbon sample (
$ ^{\rm nat} $ C), a natural lead sample ($ ^{\rm nat} $ Pb), and an empty sample holder for experimental backgrounds evaluation. The 169Tm and 197Au samples were$ \sim $ 40.0 mm in diameter and$ \sim $ 0.2 mm in thickness, while the$ ^{\rm nat} $ C and$ ^{\rm nat} $ Pb were$ \sim $ 40.0 mm in diameter and$ \sim $ 1.0 mm in thickness. The samples were fastened in the middle of the sample holder with 50 μm-thick KAPTON tapes. To determine the shape of the experimental background with the black resonance filter technique [20], a nat Ag filter and a 59Co filter were installed before the beam shutter,$\sim$ 26 m away from the spallation target. The two filters were 0.4 mm in thickness. A$ ^{\rm nat} $ Cd filter 1.0 mm in thickness was installed behind the neutron beam window to absorb neutrons below 0.3 eV to avoid the overlap between adjacent neutron pulses,. The characteristics of the samples and filters are listed in Table 1.Sample/Filter Shape Diameter/mm Mass/g Purity(%) 169Tm circular 40.0±0.02 2.42±0.003 99.995 197Au circular 40.0±0.02 4.99±0.006 99.995 $ ^{\rm nat} $ C

circular 40.0±0.02 2.30±0.003 99.99 $ ^{\rm nat} $ Pb

circular 40.0±0.02 15.07±0.019 99.99 $ ^{\rm nat} $ Ag

circular 80.0±0.1 21.11±0.022 99.95 59Co circular 80.0±0.1 17.90±0.018 99.95 $ ^{\rm nat} $ Cd

circular 80.0±0.1 39.72±0.041 99.95 Table 1. The characteristics of the samples.
-
The efficiency of C6D6 detectors in detecting the cascading γ-rays emitted in neutron capture reactions depends on the deexcitation paths of the compound nucleus, which are too complex to be calculated accurately. Therefore, the pulse-height-weighting technique (PHWT) [21-23] has to be employed in the measurements, and the responses of the C6D6 detector are weighted in such a way that the detection efficiency (
$ \epsilon_{\gamma} $ ) increases linearly with the energy of the incident γ-ray ($ E_{\gamma} $ ) as$ \epsilon_\gamma = kE_\gamma . $

(1) When the
$ \epsilon_{\gamma} $ is low enough ($ \epsilon_{\gamma}<< $ 1), the efficiency for detecting a capture event ($ \epsilon_{c} $ ) can be described as$ \epsilon_c(E_n)\approx k\sum_{i}E_{\gamma i} \approx kE_c = k(S_n+E_n), $

(2) where
$ E_c $ is the total excitation energy which is equal to the sum of the neutron binding energy$ S_n $ and the incident neutron energy$ E_n $ in the center of the mass system and independent of the actual deexcitation path. Therefore, the experimental yield can be expressed as$ Y_{\rm exp}(E_n) = \frac{Net^w (E_n)}{\Phi(E_n)\cdot kE_c}, $

(3) where
$ Net^{w} $ is the normalized and corrected net weighted count rate after background subtraction,$ kE_c $ denotes the detection efficiency for a capture event, and Φ is the neutron flux.The weighting functions (WFs) used to weight the detector responses for the present measurement were parametrized as polynomial functions
$ WF_i = \sum\limits_{m = 0}^{4} a_m E_{d i}^{m}, $

(4) where
$ E_d $ is the deposited energy in the C6D6 detector, and i is the bin number of the deposited energy spectrum. In this study, WFs were obtained from the response functions for monoenergetic γ-rays, which were calculated using detailed Monte-Carlo simulations of the experimental setup with the Geant4 toolkit (version 10.2.p01) [24]. A least-squares method minimizing$ \chi ^2 = \sum\limits_{j}(kE_{\gamma j} - \int_{E_L}^{\infty}{R(E_d,E_{\gamma j})\cdot WF(E_d){\rm d}E_d})^2, $

(5) was used to determine the parameters (
$ a_m $ ), where j is the group of mono-energetic γ-rays used in the simulation,$ E_L $ is the energy threshold of the deposited energy$ E_d $ of γ-ray in the C6D6 detector, and R($ E_d $ ,$ E_{\gamma} $ ) is the detector’s response to γ-ray with an energy$ E_{\gamma} $ . Twenty-six groups of mono-energetic γ-rays with an energy range from 0.15 MeV to 12.0 MeV were simulated, which covered the energy range from$ E_L $ (180 keV) to the maximum deposition energy ($ \sim $ 7.0 MeV) in the current measurement. To obtain accurate response function, energy and resolution calibrations for each individual C6D6 detector were performed using standard γ-ray sources, including 137Cs (662 keV),22Na (511 and 1272 keV), and Pu/C (6131 keV from 16O). The detailed description of the energy calibration is outlined in Ref. [18]. In addition, the three-dimensional spatial distributions of primary γ-rays, which are varied with samples and neutron energy, were considered in the simulation. For example, neutrons with an energy of approximately 4.9 eV were strongly absorbed by the 197Au sample, which means that the prompt γ-rays can only be generated near the front layer surface of the sample, while the cascading γ-rays induced by the capture of tens keV neutron were homogeneously distributed throughout the same sample. Therefore, two kinds of WFs were calculated for both 169Tm and 197Au samples:$ W_{\rm H} $ was calculated with a homogeneous distribution of γ-rays, while$ W_{\rm S} $ was calculated with the spatial distribution of the prompt γ-rays at the first resonance energy (4.9 eV for 197Au and 3.9 eV for 169Tm). As shown in Fig. 4, the difference between$ W_{\rm H} $ and$ W_{\rm S} $ increases with the increase of deposited energy and is almost negligible below 6.5 MeV for both 169Tm and 197Au.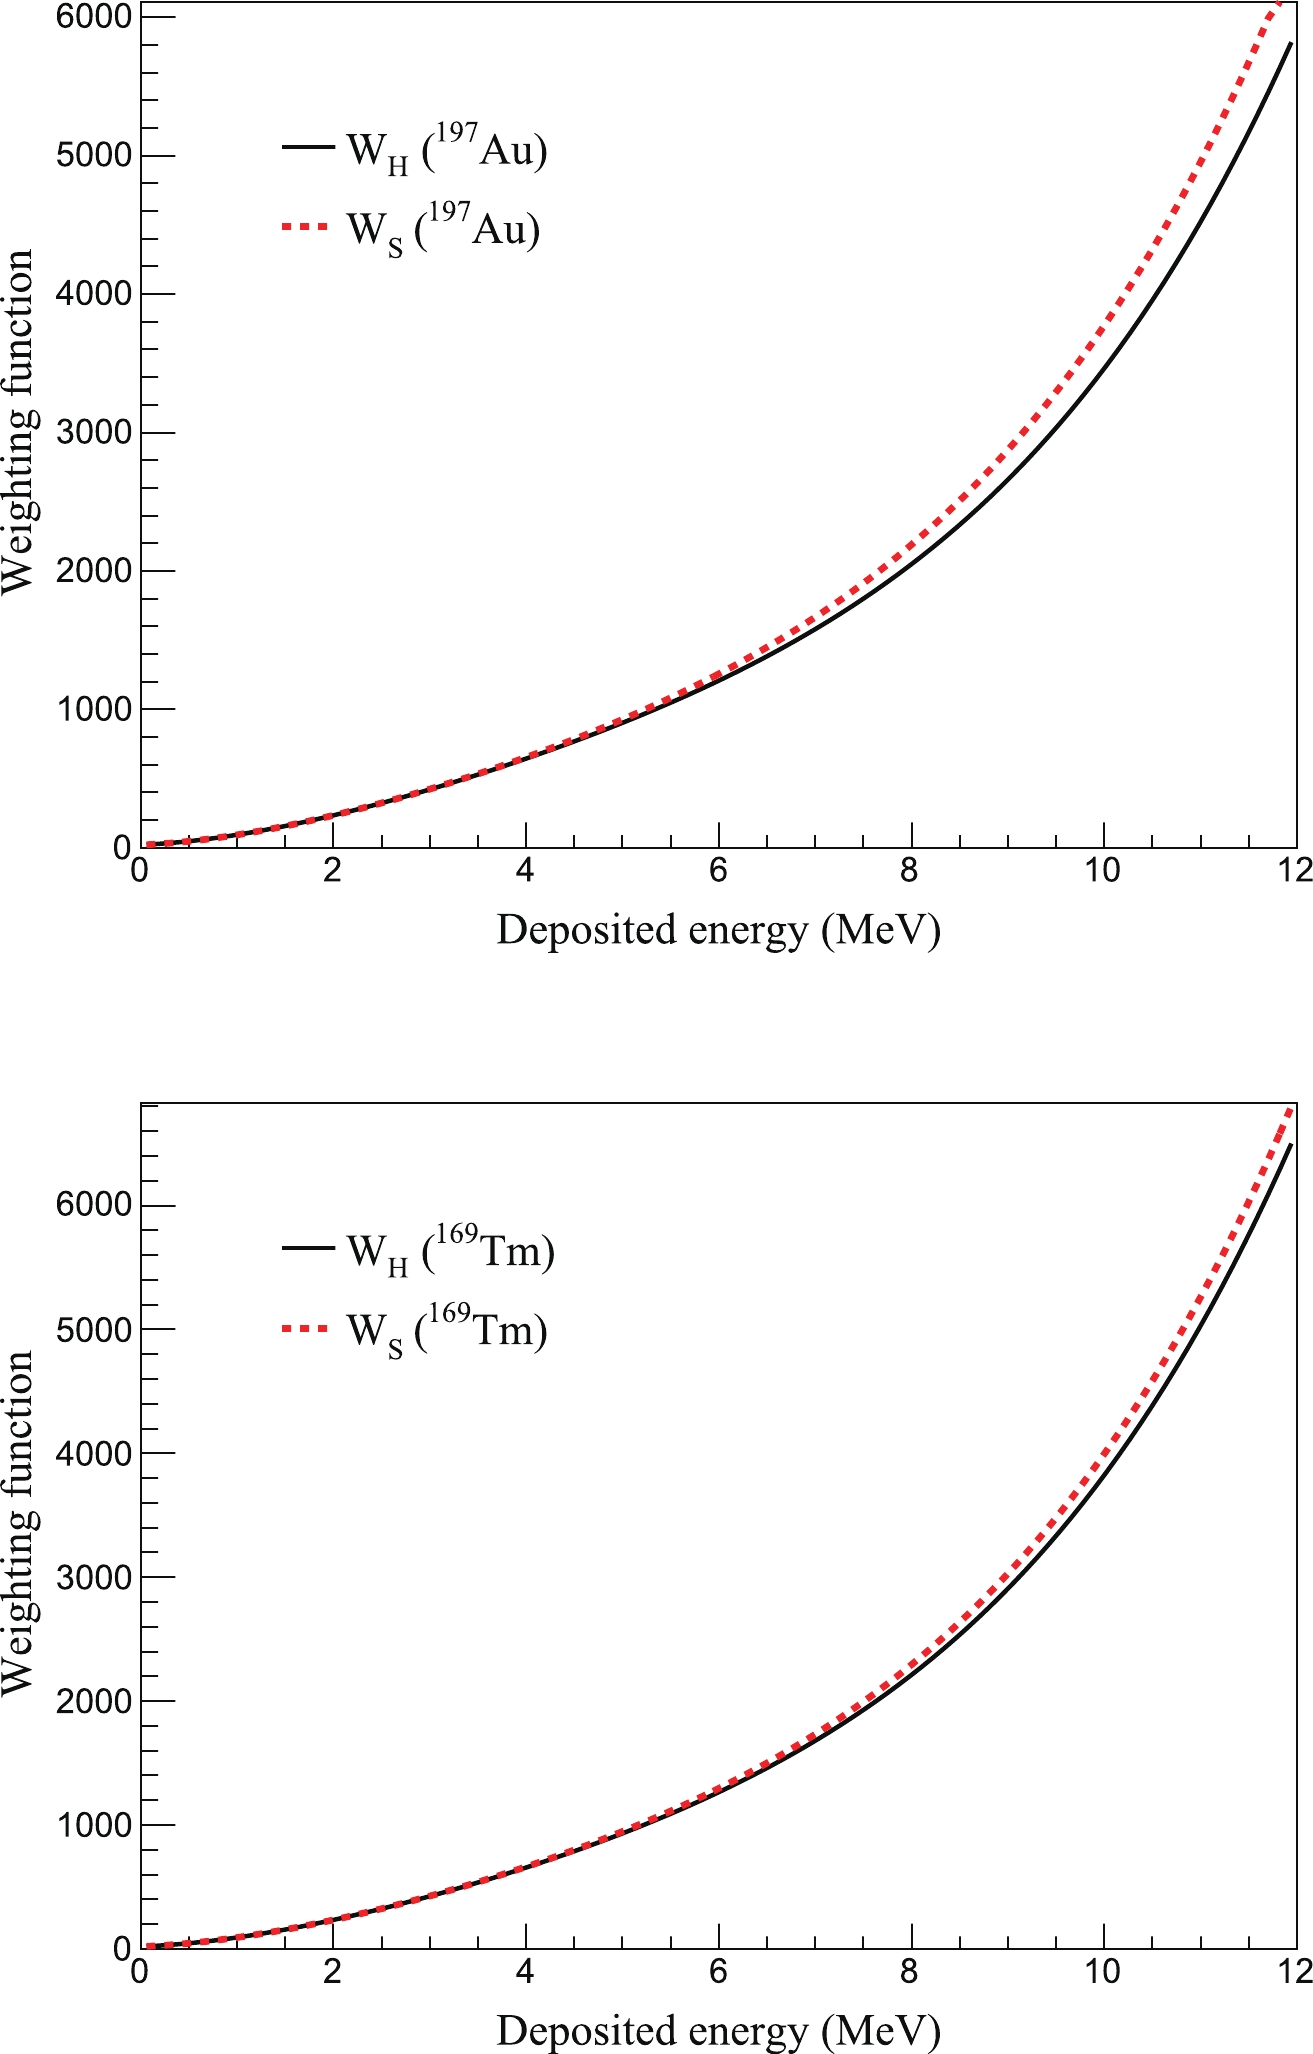
Figure 4. (color online) Weighting functions of 197Au (top panel) and 169Tm (bottom panel) calculated with different distributions of γ-rays.
-
The incident neutron energy (
$ E_n $ ) in the energy region below 1 MeV is determined with the time-of-flight (TOF) technique at the Back-n facility via the relation$ E_n = \left(\frac{72.2977\times L}{t_n}\right)^2, $

(6) where
$ E_n $ is non-relativistic in MeV, L is in m, and$ t_n $ is expressed in ns. The flight time of incident neutron ($ t_n $ ) is determined with$ t_n = (t_{mn}-t_{m\gamma})+L_0/c, $

(7) where
$ t_{mn} $ is the observed time of neutrons,$ t_{m\gamma} $ is the time of the γ-flash from the impact of proton pulse on the spallation target,$ L_0 $ is the distance between the spallation target and the experimental sample, and c is the speed of light. The effective length of flight path L in Eq. (6) includes$ L_0 $ and the moderation path followed by neutrons inside the spallation target [25]. In this study, L was given as an average length, which was equal to 76.72±0.15 m determined by fitting the resonance energies and resonance peaks in the TOF spectra of 169Au and 169Tm [26], as shown in Fig. 5. According to Eq. (6), the relative energy resolution can be calculated by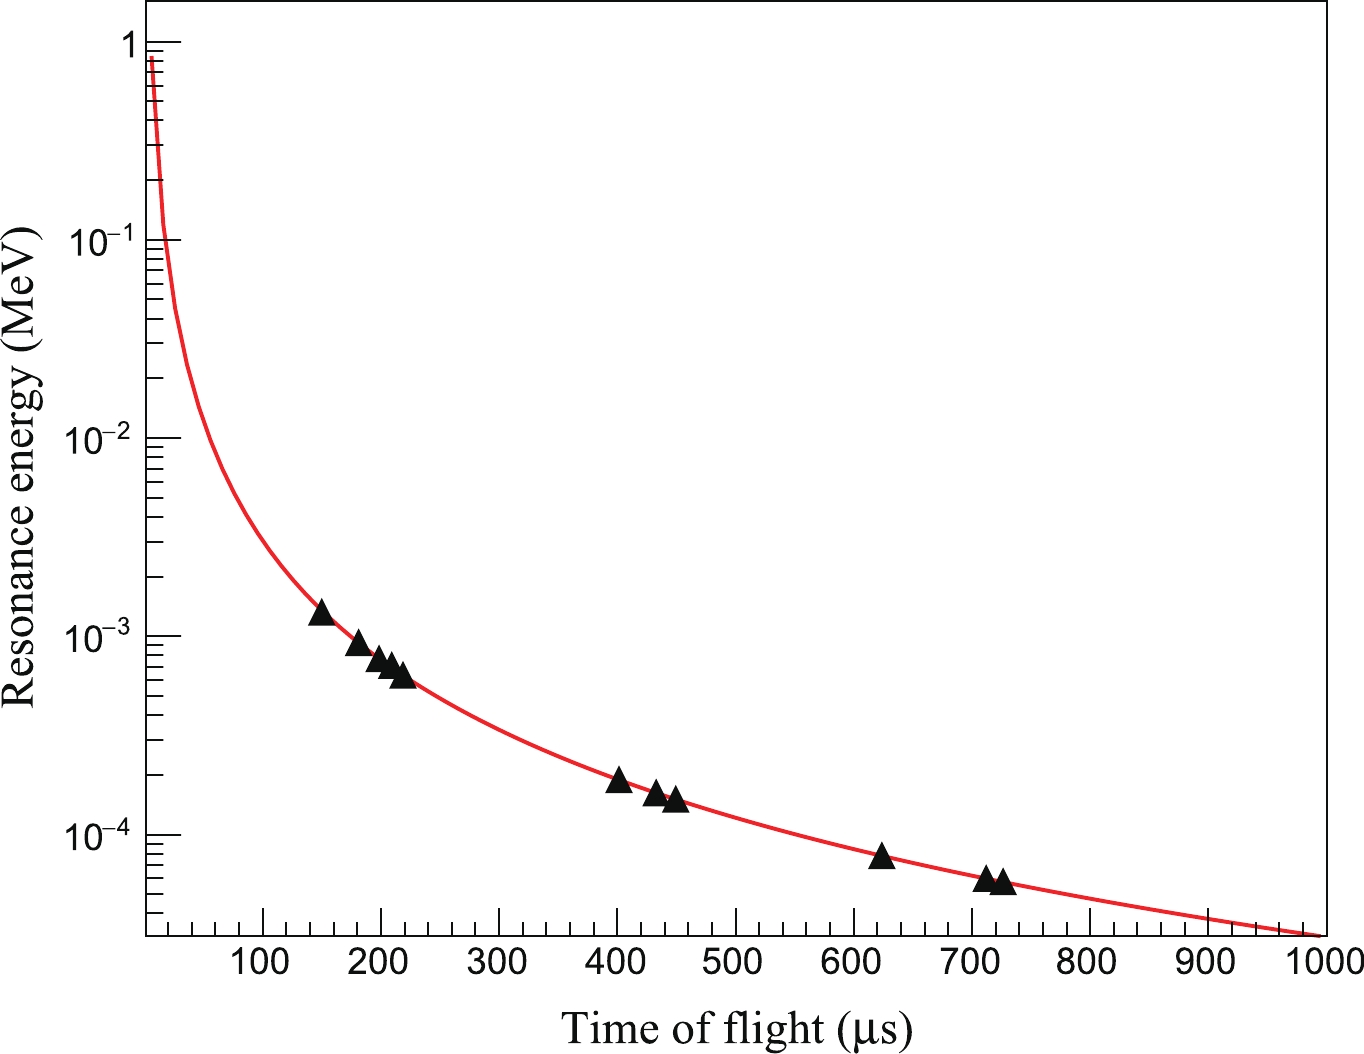
Figure 5. (color online) Fitting result of the average length of the neutron flight path.
$ \frac{\Delta E}{E} = 2\sqrt{\left(\frac{\Delta t}{t}\right)^2+\left(\frac{\Delta L}{L}\right)^2}. $

(8) In the current measurement, the
$ \Delta t $ was mainly because of the time interval ($ \sim $ 410 ns) between the two bunches of a proton beam pulse, and the$ \Delta L $ was estimated to be 15.0 cm according to the fitting result of the average length of the flight path.With the TOF technique, the experimental capture yield (
$ Y_{\rm exp} $ ) was related to$ t_n $ as$ Y_{\rm exp}(t_n) = \frac{1}{A}\cdot f\cdot \frac{C^w(t_n)-B^w(t_n)}{\Phi(t_n)\cdot E_c}. $

(9) The
$ Net^w $ in Eq. (3) can be expressed as the products of the reciprocal of the normalization factor A and the correction factor f, and the difference between the weighted count rate$ C^w $ and the weighted background$ B^w $ . In this study, the homogeneous weighting function ($ W_{\rm H} $ ) was used to weight the events with deposited energy above 180 keV to obtain the$ C^w $ . The weighted TOF spectra of 197Au and 169Tm are shown in Fig. 6. The TOF spectrum of the sample-out background was weighted by the same weighting function as that used for the sample, which is also shown in Fig. 6. The bins of the TOF spectrum were converted directly from the energy bins of the neutron flux in Fig. 2.
Figure 6. (color online) Weighted TOF spectra of 197Au sample (top panel) and 169Tm sample (bottom panel) and the none-sample background (red dashed line).
-
There are two kinds of components contributing to the background level in the capture cross section measurement with C6D6 detectors [27, 28]: the time-independent background comes from natural and sample radioactivity, and the time-dependent background, which is also beam-related, arises from scattered neutrons and in-beam γ-rays. Furthermore, the time-dependent background can be separated into the sample-dependent background and sample-independent background. The time-independent background can easily be measured with the sample in and the neutron beam switched off, while the sample-independent background can be determined experimentally with a sample-out run. However, the sample-dependent background is much more complex. Two different methods, including Monte-Carlo simulation and dedicated measurement, were performed to study the sample-dependent background to assess its contribution.
The Geant4 toolkit in conjunction with the ENDF/B-VIII.0 library was used to simulate the background in this study. With the same method outlined in Ref. [28], a complete experimental setup was considered to calculate the background due to neutron scattering and interaction with the surrounding materials. The simulated results of the 197Au sample and the 169Tm sample are shown in Fig. 7. According to the simulation results, the scattered neutron background of the 197Au sample (the green line in Fig. 7 (a)) was higher than that of the 169Tm sample (the green line in Fig. 7 (b)) between
$ 1.0\times10^4 $ ns and$ 2.0\times10^4 $ ns, while the transmission neutron backgrounds of the two samples (the blue dashed and dotted lines) were almost the same. The simulation result indicated that the signal to background ratio for the 169Tm sample was better than that of the 197Au sample because of its smaller neutron elastic scattering cross section and longer half-life.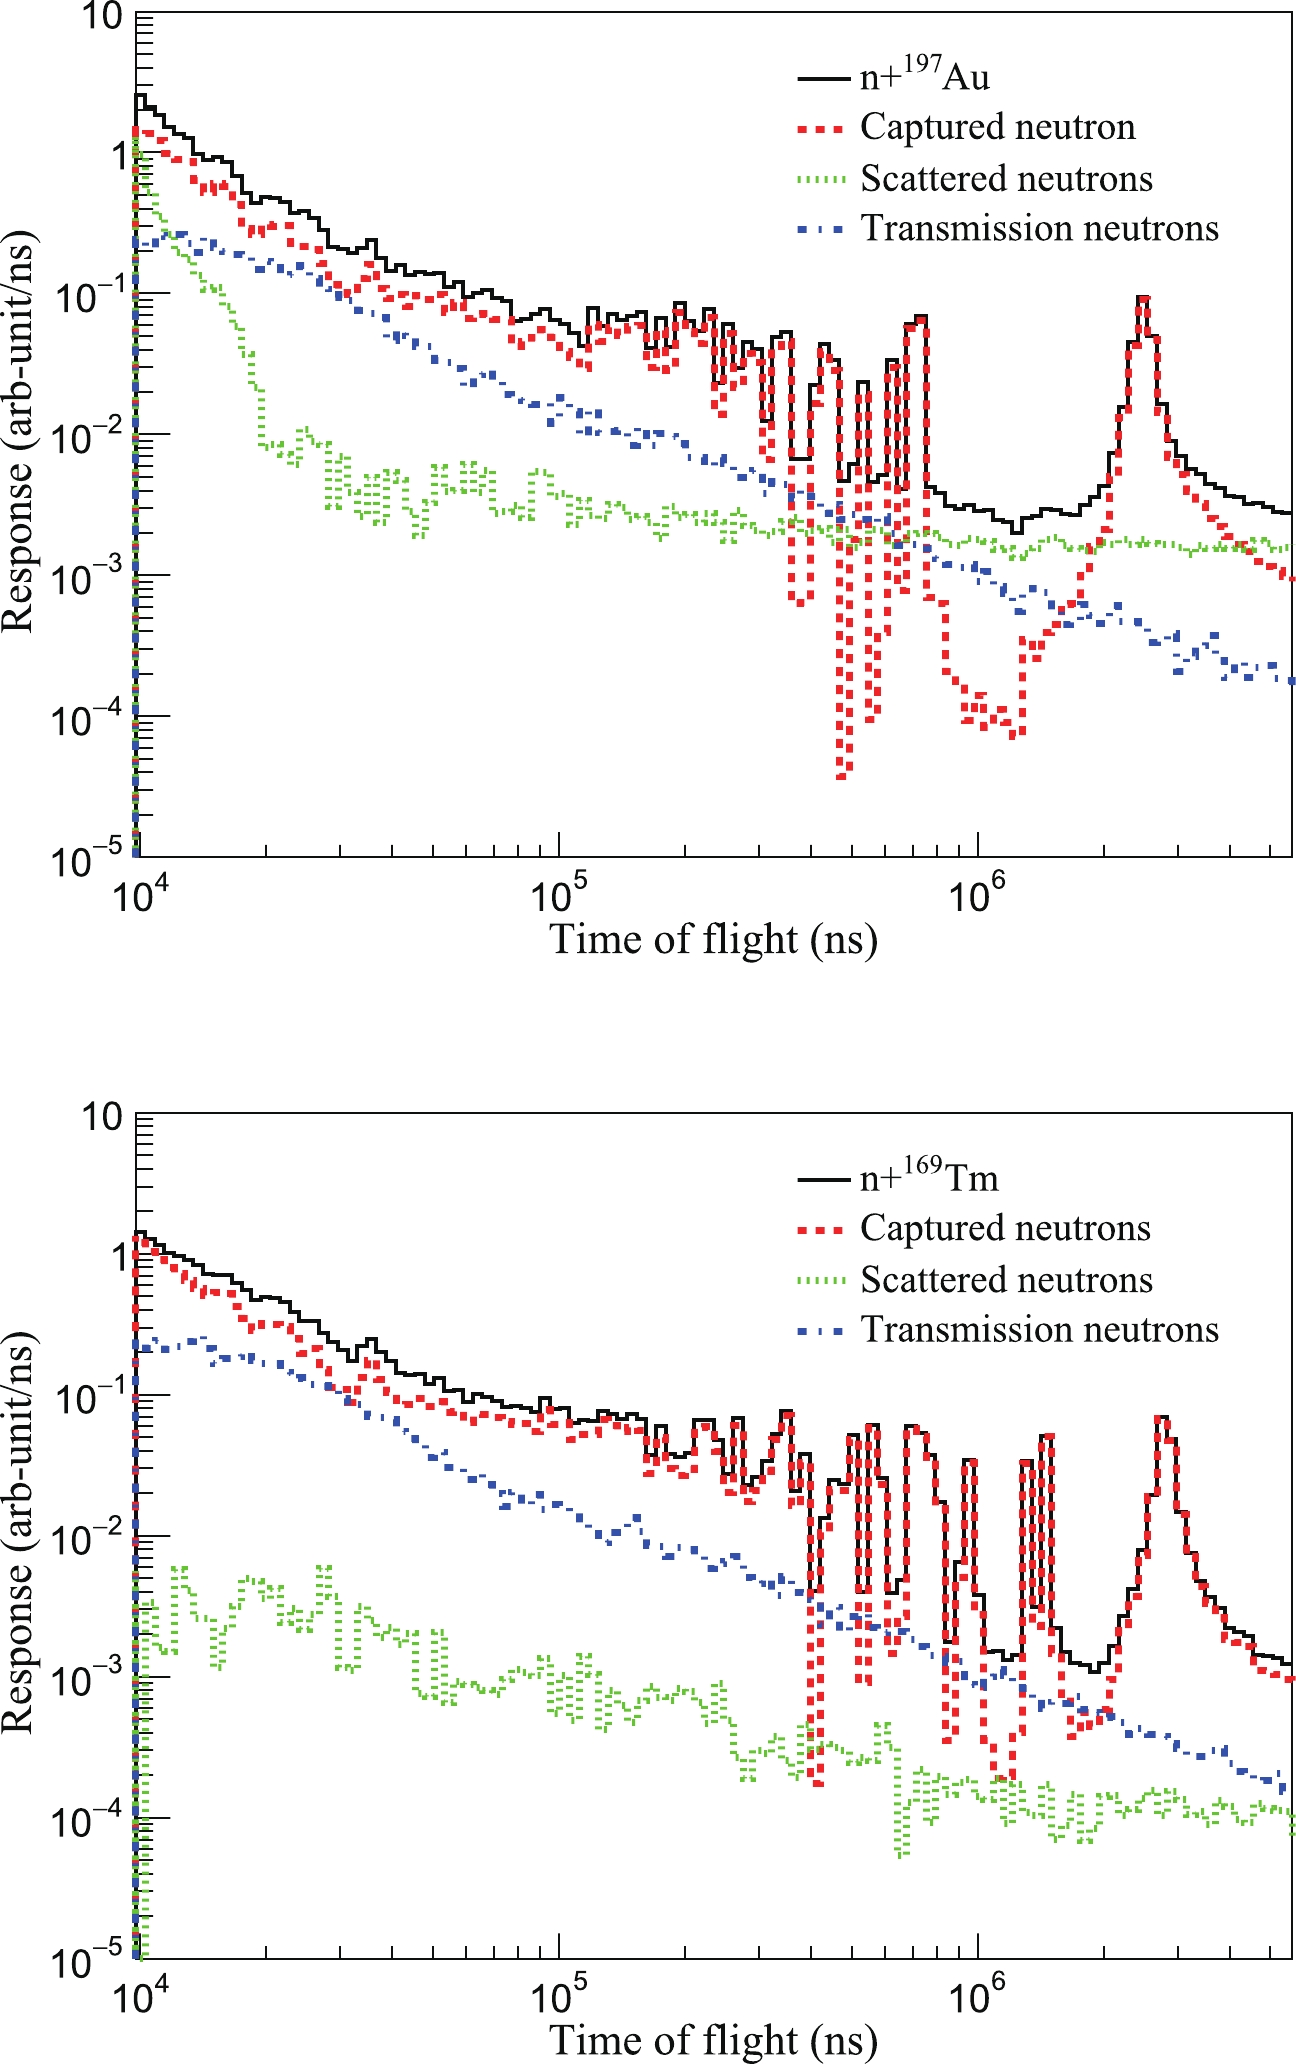
Figure 7. (color online) Simulated TOF spectra sorted by neutron interaction with the 197Au sample (top panel) and the 169Tm sample (bottom panel). The black solid line is the spectrum of all events, the red dashed line is the spectrum of capture events, the green dotted line indicates the scattered neutron events, and the blue dashed and dotted line is the spectrum of the transmission events.
Experimental backgrounds were determined with dedicated measurements in this study. The
$ ^{\rm nat} $ C samples were used to evaluate the scattered neutron background for the low neutron capture-to-scattering ratio, while the$ ^{\rm nat} $ Pb sample can be used to evaluate the in-beam γ-rays background owing to its large scattering cross section for γ-ray. The TOF spectrum induced by the scattered neutron (the green dotted line in Fig. 8) and in-beam γ-rays (the blue dashed and dotted line in Fig. 8) were determined with the same method used in Ref. [28]. The shape of the overall background was determined with the black resonance filters such as Ag and Co. For the black resonances of Ag and Co at 5.19 and 132 eV, all neutrons are removed from the beam, and the remaining part was the background. Dips due to black resonances were clearly visible in the TOF spectra, which can be used to fit the overall background level. Fig. 8 shows the experimental TOF spectra of the 197Au sample and the 169Tm sample with filters (the black solid line) and the overall background (the red dashed line), which were fitted to match the minimum of the filter dips. According to the result of the dedicated measurement, the signal-to-background ratio of 169Tm is better than that of the 197Au sample, which was consistent with the simulation result.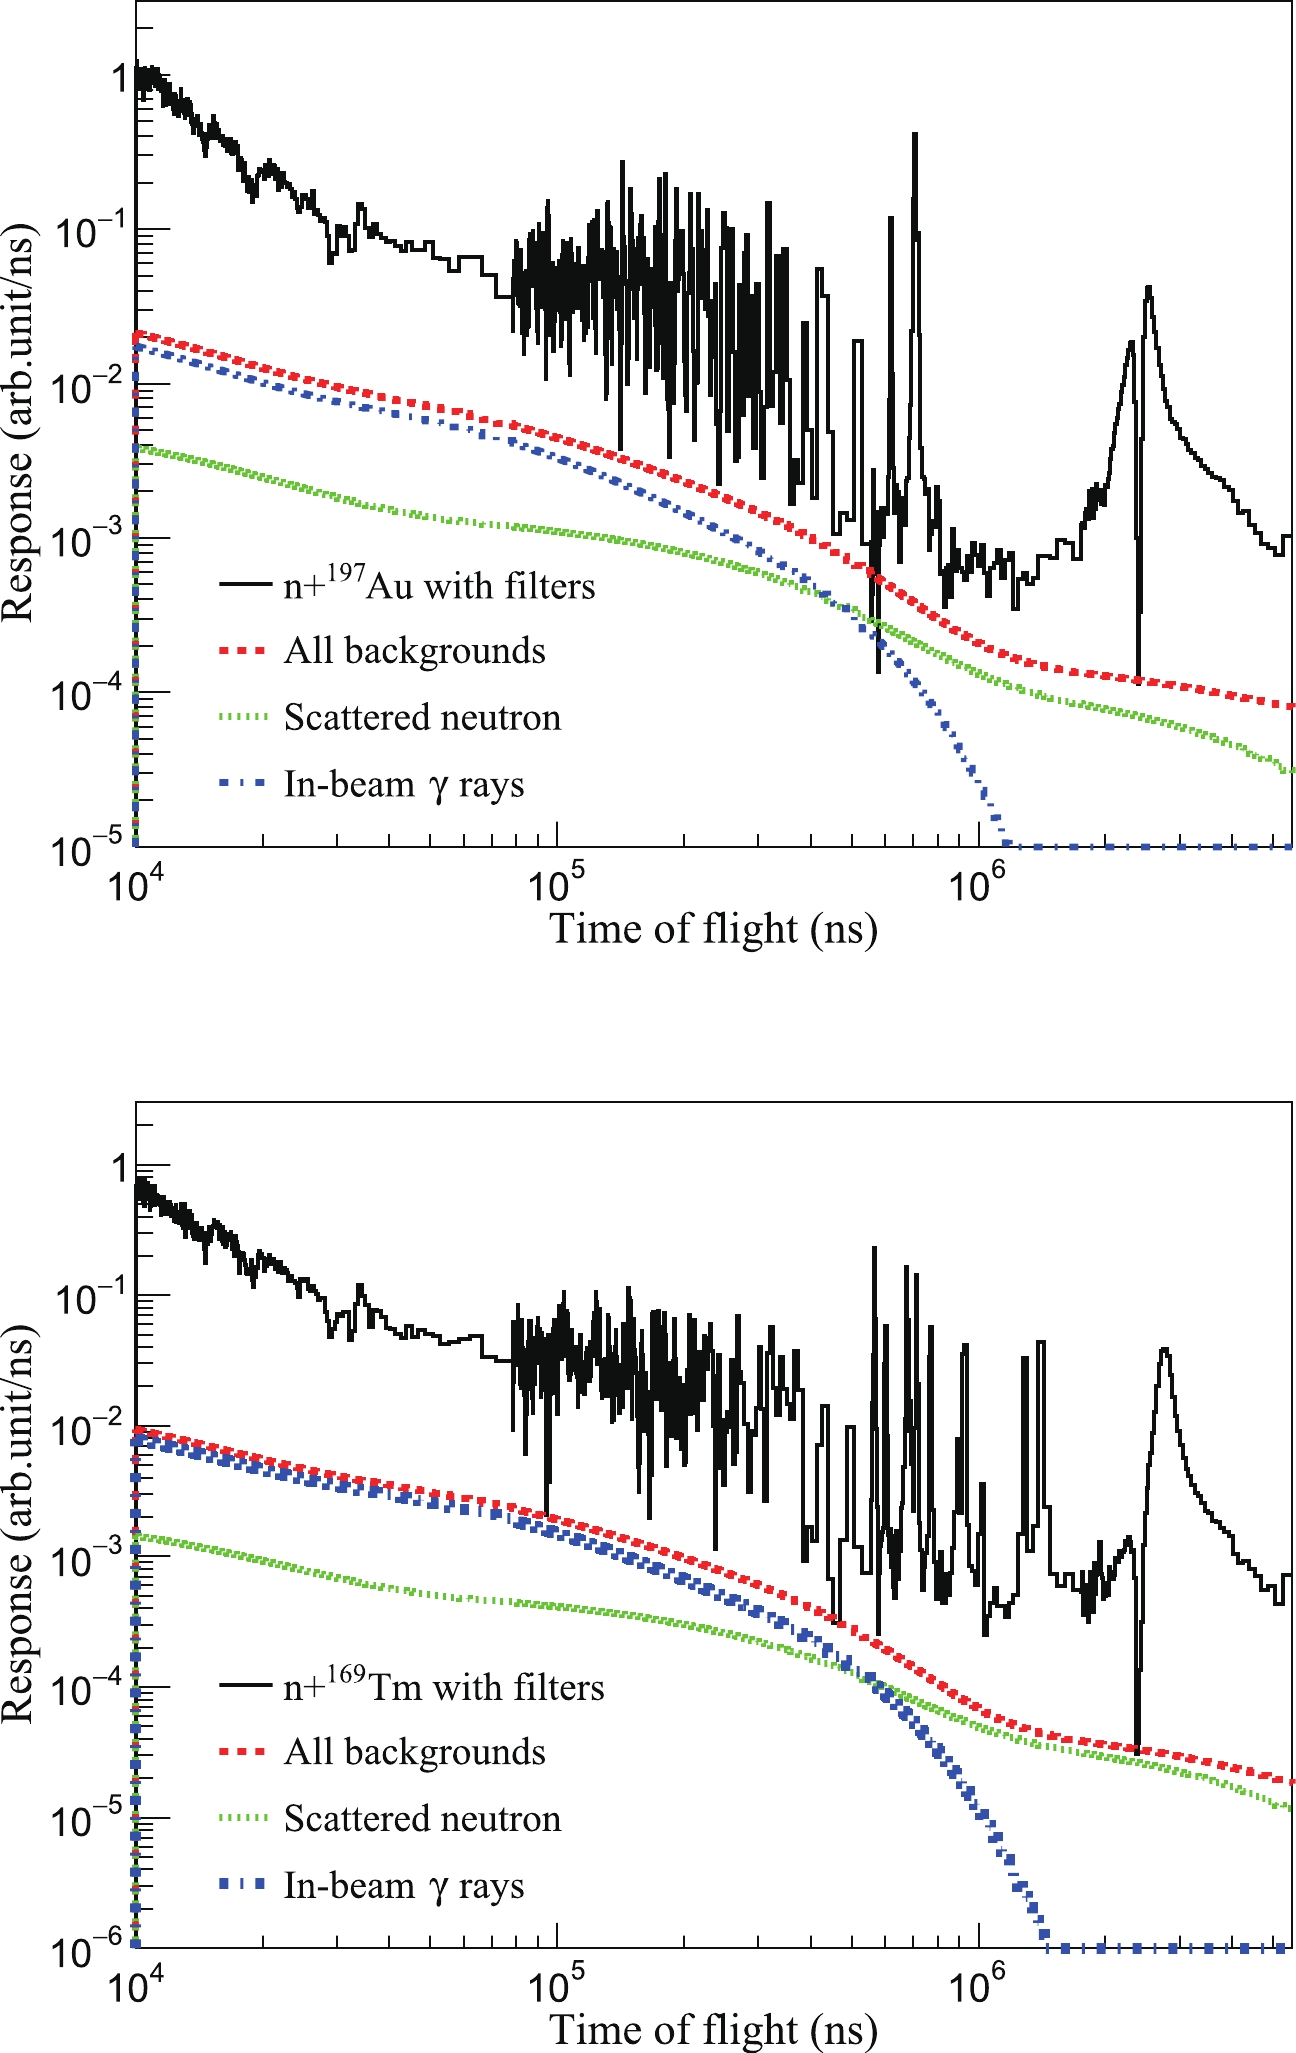
Figure 8. (color online) Levels of various background components of the 197Au sample (top panel) and the 169Tm sample (bottom panel) determined by the black resonance filter method. The black solid line is the experimental spectrum, the red dashed line is the total background, the green dotted line is the scattered neutron background, and the blue dashed and dotted line indicates the in-beam γ-ray background.
The attenuation of neutron beam and in-beam γ-rays were considered based on the neutron flux and energy distribution of the in-beam γ-rays to determine the background level without the filters. Simulations with the Geant4 toolkit were performed using the same geometry with the Ag and Co filters in and out. The attenuation factors of 0.94 for neutron and 0.89 for γ-rays were obtained. Consequently, the backgrounds of the 197Au sample and 169Tm sample can be determined without filters in the beam-line, as shown in Fig. 9. After background subtraction, the TOF spectrum of the net count rate can be transformed to energy spectrum with Eq. 6. The experimental yield can be obtained by dividing the neutron flux and the excitation energy, as shown in Fig. 10.
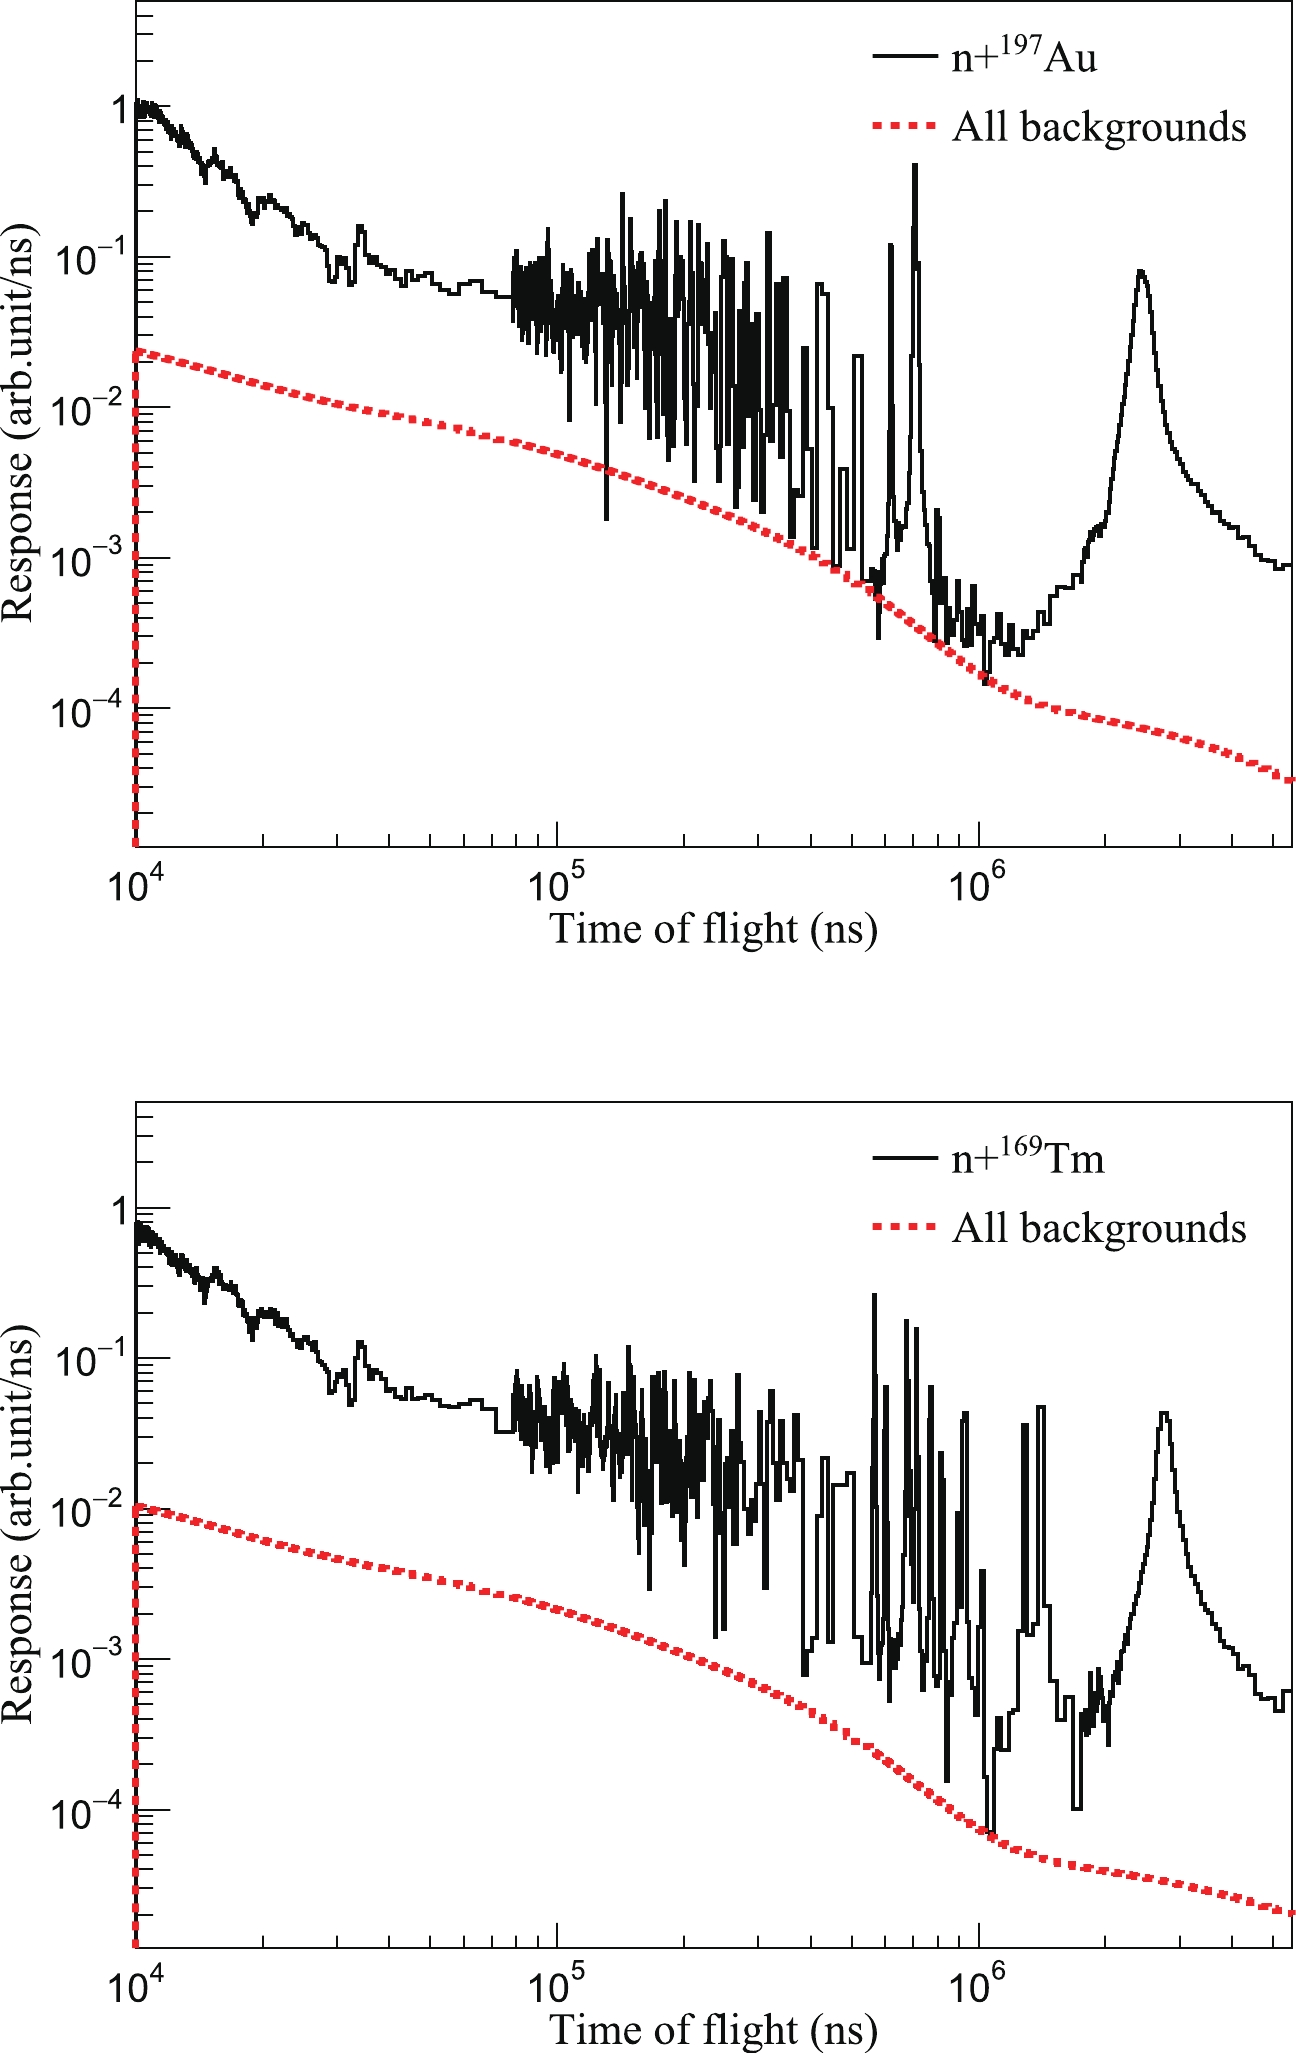
Figure 9. (color online) Level of the overall background of the 197Au sample (top panel) and the 169Tm sample (bottom panel) with the filters off-line. The black solid line is the measured spectrum without filters, and the red dashed line is the total background corrected by attenuation factors.
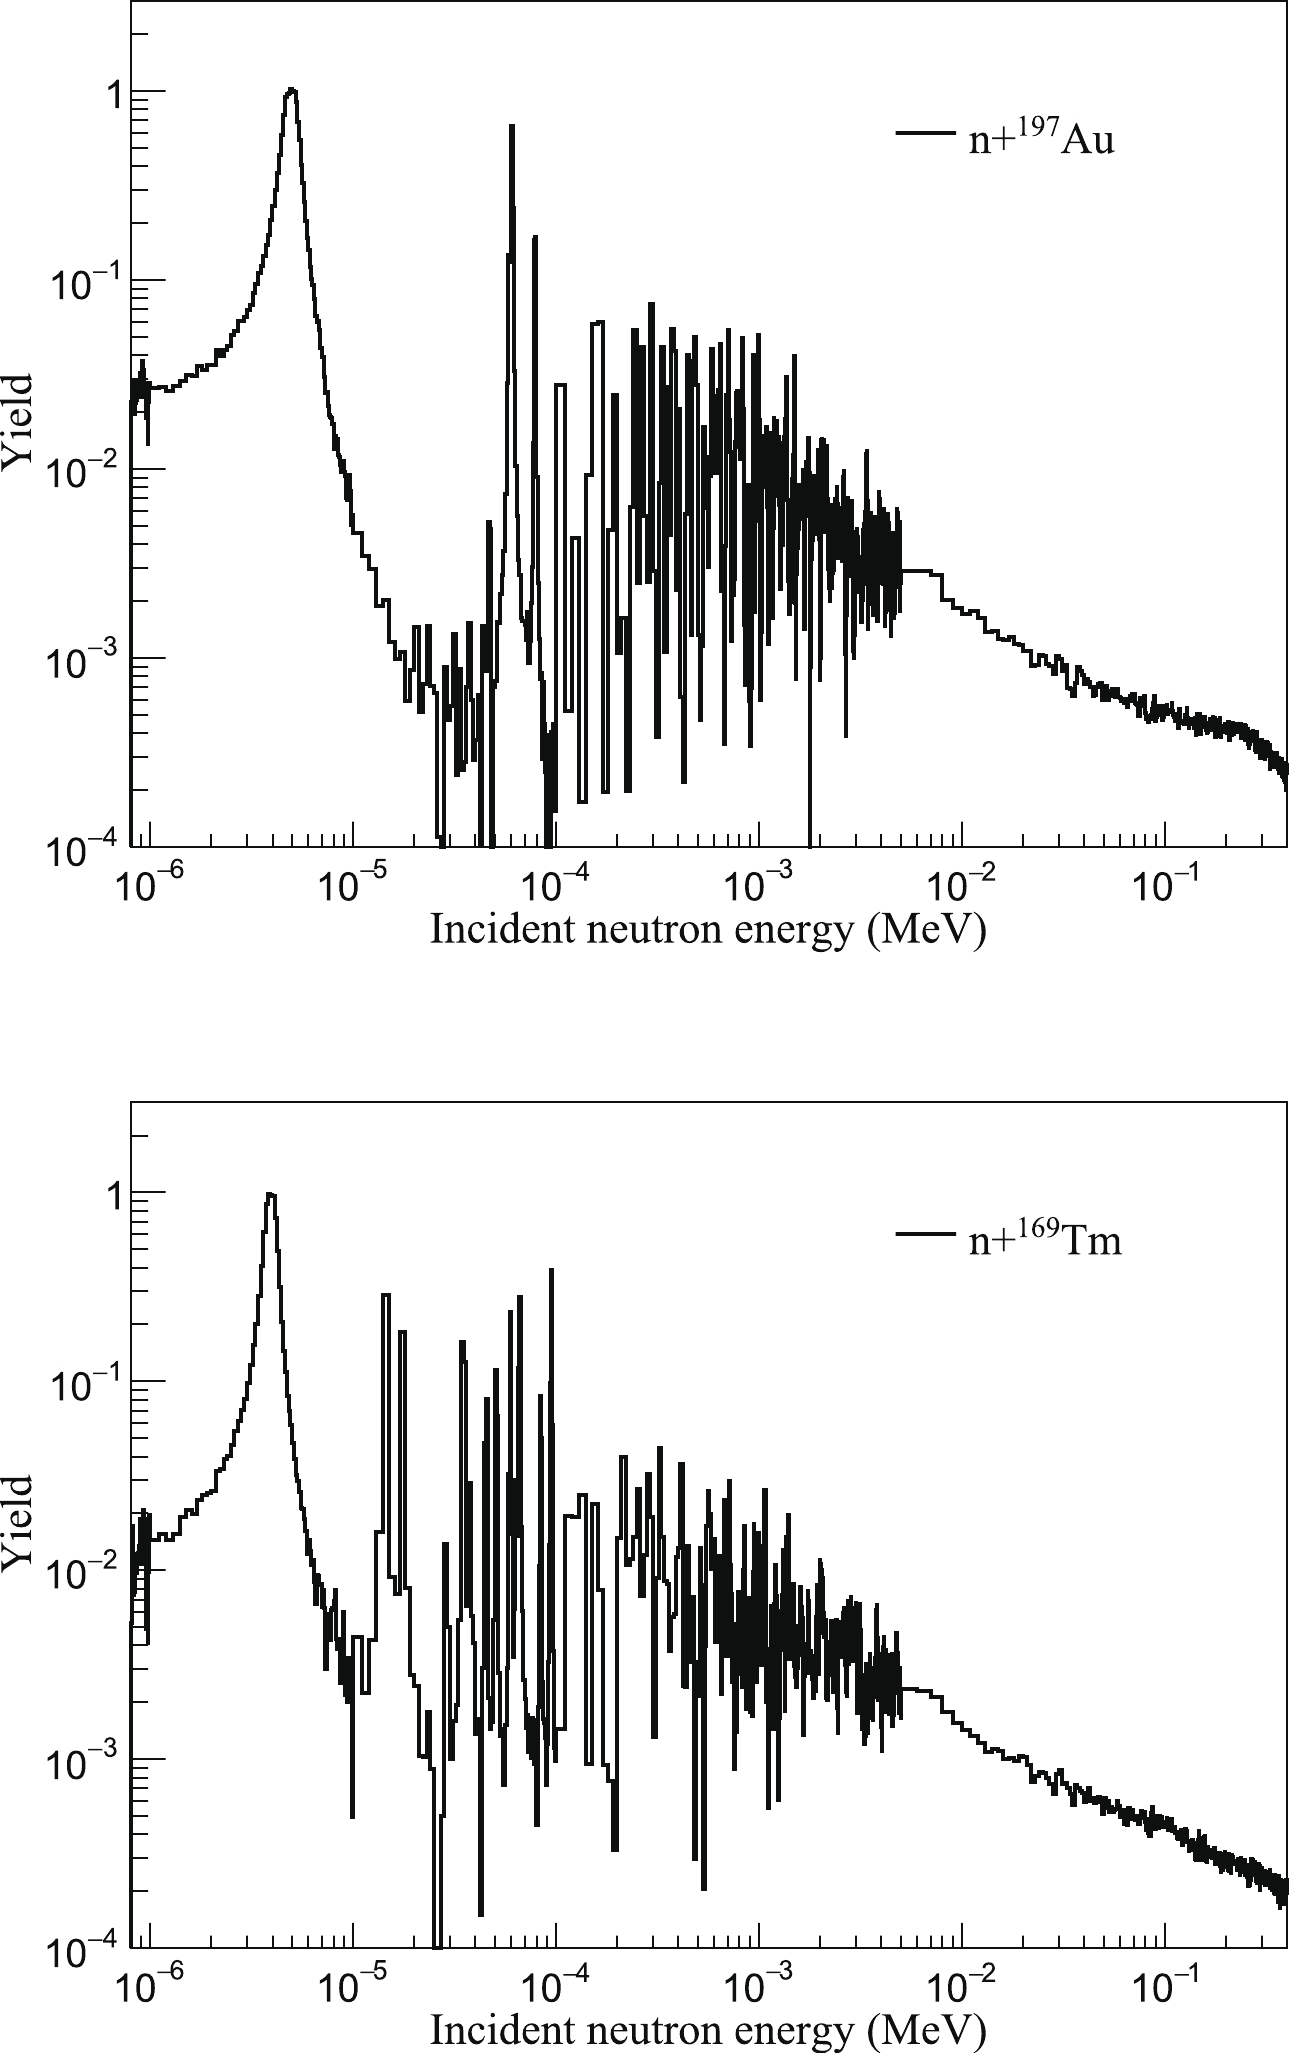
Figure 10. (color online) Experimental yield of the 197Au sample (top panel) and the 169Tm sample (bottom panel) with background subtraction.
The uncertainty related to the background subtraction was propagated to the final capture yield in correlation to the signal-to-background ratio. In the energy region between 10 and 300 keV, the signal-to-background ratio is above 5.0 for 197Au and above 9.0 for 169Tm according to the 10
$\sim$ 100 μs time region in Fig. 9. Given the uncertainty of the level of the background a conservative value of 15.0%, the uncertainty of the background subtraction is less than 3.0% for 197Au and less than 1.6% for 169Tm. -
Since the 4.9 eV resonance of 197Au and the 3.9 eV resonance of 169Tm are saturated for the thickness of the used samples, the experimental capture yields of 197Au and 169Tm were internally normalized in this study. Neutrons with energies close to the resonance may interact with the sample, and the capture γ-rays originate only in a thin layer of the sample thickness. It means that the weighting function in a saturated resonance should be different from that in the unresolved resonance region where capture γ-rays originated throughout the sample. Two weighting functions,
$W_{\rm H}$ and$W_{\rm S}$ , were used to weight the TOF spectra between 1 and 10 eV to determine the normalization factor. The normalization was performed by fitting the top of the saturated resonances with the R-matrix code SAMMY. Resonance parameters of 197Au and 169Tm from the ENDF/B-VIII.0 data library were used as initial values of the SAMMY code. Bayes method was used to fit the experimental yield to obtain the new resonance parameters. In this work, multiple neutron scattering in the samples and neutron self-shielding were taken into account within the SAMMY code. A temperature of 300 K was used to correct the Doppler effect. In addition, the resonance broadening due to the resolution of the Back-n facility was also considered in the fitting procedure [29]. The fitting results are shown in Fig. 11, and the resonance parameters and normalization factors obtained with the SAMMY code are listed in Table 2. The resonance parameters obtained in this study were in agreement with the values of the evaluated data libraries within the uncertainty range. The uncertainties of the normalization and the fitted resonance parameters are less than 1.5%.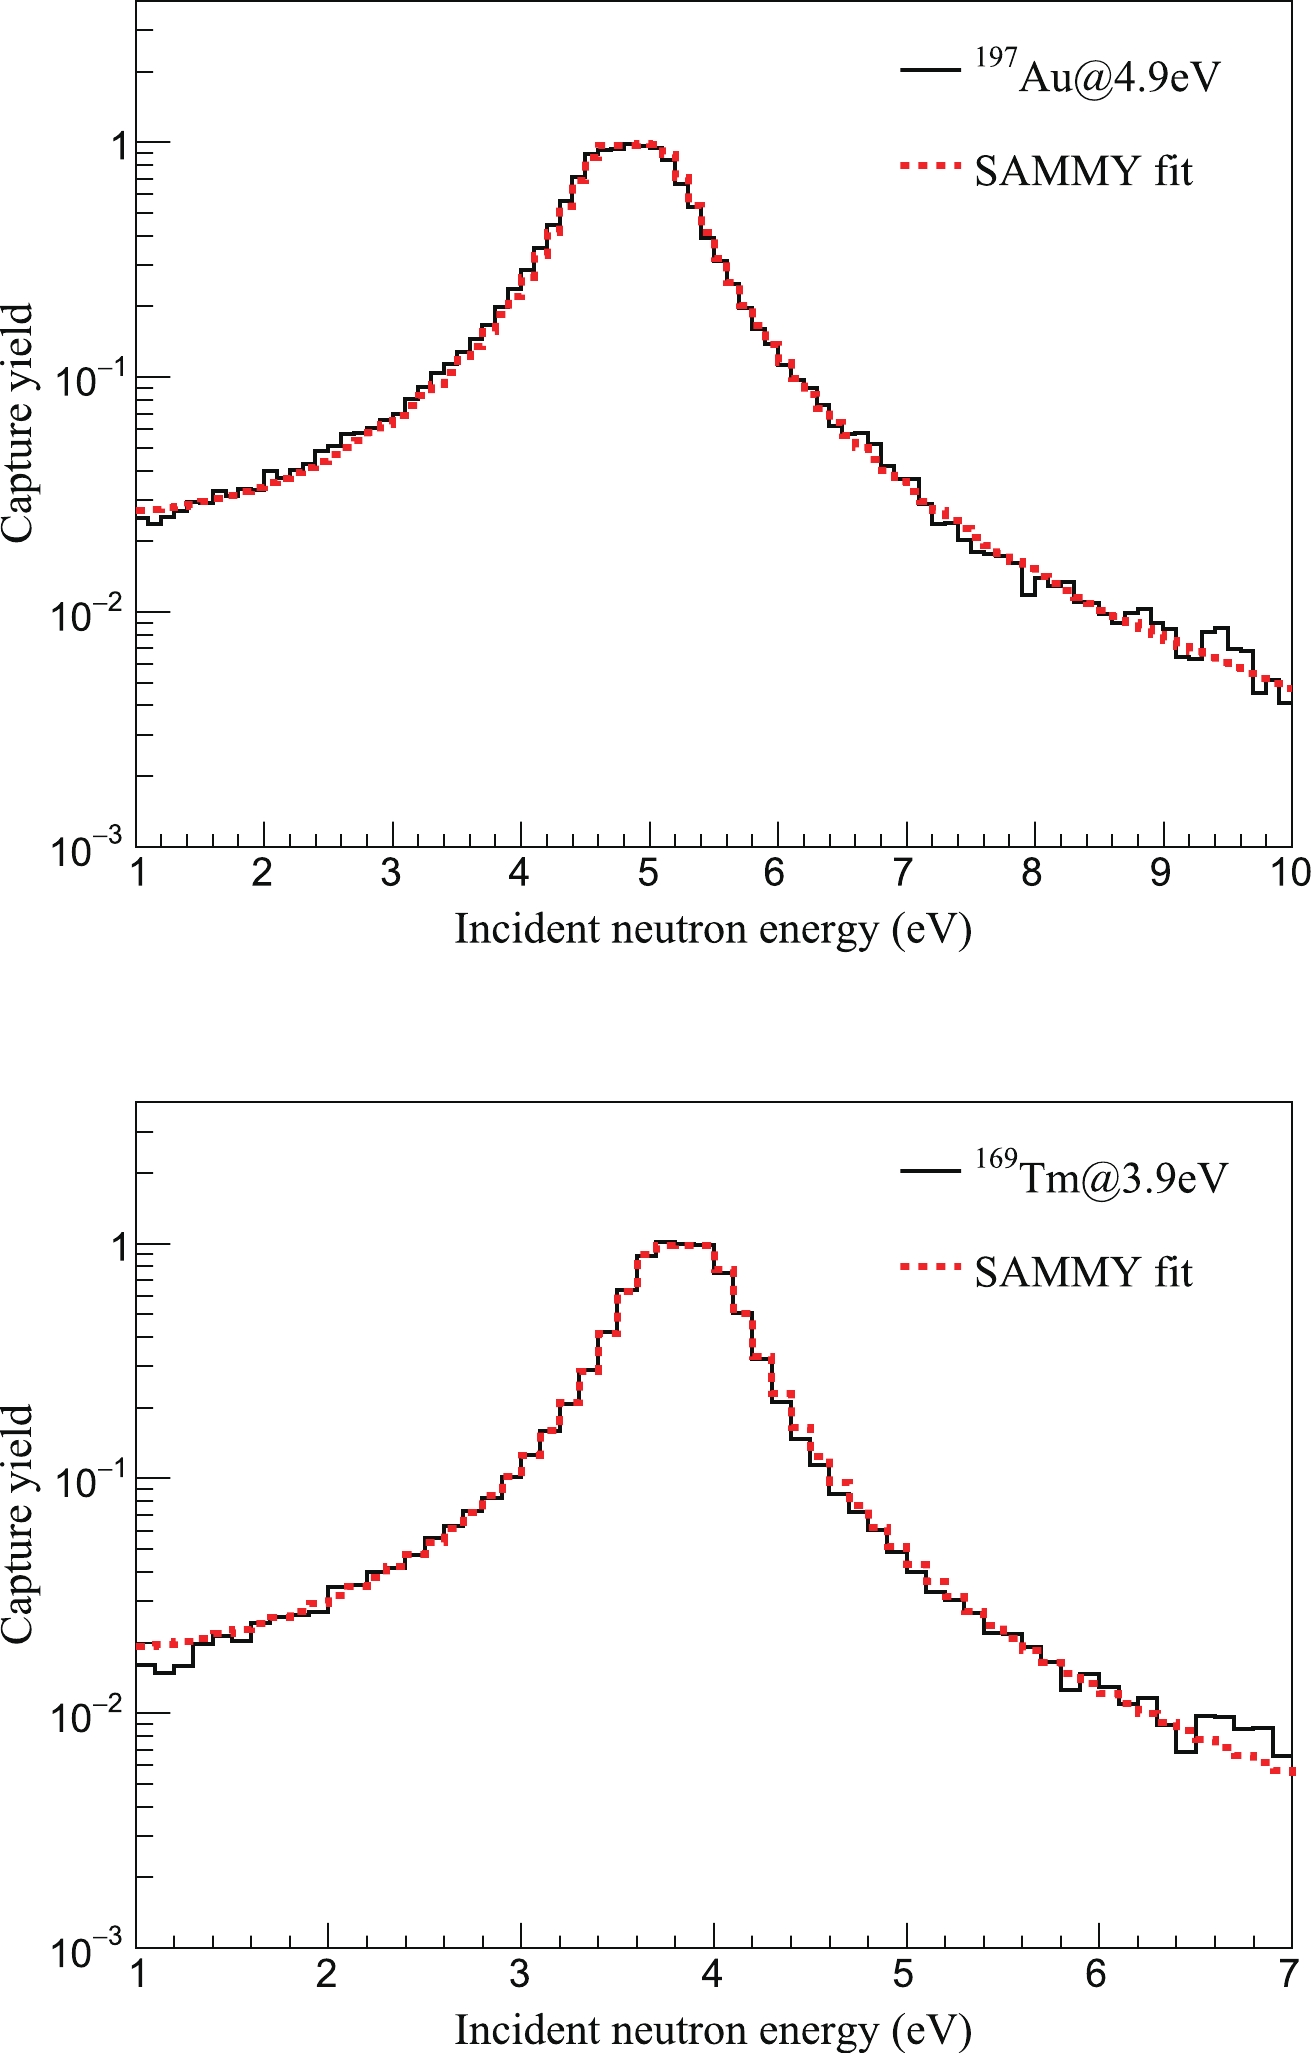
Figure 11. (color online) Normalization at the saturated resonance of 197Au (top panel) and 169Tm sample (bottom panel) by SAMMY. The black solid line is the measured spectrum, and the red dashed line is the fitting result of SAMMY.
$E_n/{\rm eV}$ 

$ \Gamma_{\gamma} $ /meV

$ \Gamma_{n} $ /meV

A( $W_{\rm H}$ )

A( $W_{\rm S}$ )

197Au This work 4.88±0.05 125.50±0.13 15.16±0.15 1.045±0.015 1.051±0.015 ENDF/B-VIII.0 4.8997 121.4 14.96 CENDL-3.2 [30] 4.906 122.5 15.20 JEFF-3.3 4.8997 121.4 14.96 JENDL-4.0 [31] 4.89 124.0 15.20 169Tm This work 3.89±0.04 105.70±0.11 7.44±0.07 0.982±0.015 0.983±0.015 ENDF/B-VIII.0 3.906 102.4 7.466 CENDL-3.2 no data no data no data JEFF-3.3 3.906 102.4 7.466 JENDL-4.0 3.906 102.4 7.466 Table 2. Resonance parameters and normalization factors of 197Au and
$ ^{169}{\rm Tm} $ obtained by fitting the saturated resonances with SAMMY.In Eq. (9), the correction factor f can be expressed as
$ f = f_A \cdot f_{\rm th} \cdot f_{\rm dt} \cdot f_{\rm ms} $

(10) where
$ f_A $ is the correction factor for normalization factor A,$ f_{\rm th} $ is due to the loss of low energy counts below the threshold of the detectors,$ f_{\rm dt} $ is used to correct the dead time during data acquisition and data analysis, and$ f_{\rm ms} $ is a sample related correction factor for neutron multiple scattering and self-shielding.The normalization factor is corrected because the weighting function in the saturated resonance energy is different from that used in the keV energy region. According to Table 2, the ratio of the normalization factors obtained with the two WFs was less than 1.005 for the 197Au sample, while that of the 169Tm sample was approximately 1.002. The uncertainty of the normalization factor was less than 1.5%, thus the uncertainty owing to this correction was estimated to be less than 0.01%, which can be ignored.
In this study, the measurement was self-normalized for both 197Au and 169Tm samples. Correction for the energy threshold applied to the deposited γ-rays was not necessary, assuming that the decay spectra of the compound nucleus are similar for different neutron energies [32]. Therefore, the
$ f_{\rm th} $ values for both 197Au and 169Tm were 1.0 in this study. The uncertainty of the threshold correction was given a conservative value of 1.0%.The DAQ used in this study recorded almost all signals that followed the trigger and can be treated as a zero dead-time system. However, to distinguish the pileup signals, a time interval τ was involved in the data analysis routine, in which all signals that occurred were treated as one signal pulse. The time τ, equal to 50 ns in this study, can be treated as a dead time, and the correction factor
$ f_{\rm dt} $ is as$ f_{\rm dt} = \frac{1}{1-\tau N_i}. $

(11) $ f_{\rm dt} $ is obtained from experimental TOF spectra.$ N_{i} $ denotes the count rate which can be expressed as counts per second in the$ i_{\rm th} $ bin. Fig. 12 gives the difference between$ f_{\rm dt} $ and 1.0 as a function of incident neutron energy, which was converted using Eq. (6) from the TOF spectrum. According to the calculated result, the loss of the count rate due to the dead time was less than 0.8% in the energy region below 300 keV and was almost negligible in the first saturation resonance energy for both 197Au and 169Tm. The uncertainty of the dead time correction was estimated to be 5.0%, leading to a maximum uncertainty of 0.04% in the corrected count rate.
Figure 12. (color online) Dead time correction factor of 197Au (the black solid line) and 169Tm (the red dashed line) as a function of neutron energy.
The experimental yield has to be corrected for sample-related effects, such as self-shielding and neutron scattering followed by capture [33]. In the tens to hundreds keV energy region, the relation between the averaged capture cross section
$ <\sigma_{\gamma}> $ and the averaged experimental yield$ <Y_{\rm exp}> $ is expressed as$ <Y_{\rm exp}> = f_{\rm ms} \cdot \rho \cdot <\sigma _\gamma>, $

(12) where
$ f_{\rm ms} $ is the multiple scattering and self-shielding correction factor, and ρ is the area density of the sample used in this measurement, which is 1.18×$ 10^{-3} $ atoms/barn for the 197Au sample and 6.64×$ 10^{-4} $ atoms/barn for the 169Tm sample. The Geant4 toolkit was used to calculate the factor$ f_{\rm ms} $ with the geometry of the experimental sample fully modeled, including the sample itself and the Kapton tapes used to fasten the sample. The averaged capture cross sections$ <\sigma_{\gamma}> $ used in this study were obtained from the ENDF/B-VIII.0 data library. As shown in Fig. 13, the difference between$ f_{\rm ms} $ and 1.0 was smaller than 3.0% in the energy region between 10 and 300 keV for the 197Au sample, and the$ f_{\rm ms} $ of the 169Tm sample was even smaller than that of the 197Au sample owing to its smaller area density. Assuming a conservative value for the uncertainty of 10.0%, the$ f_{\rm ms} $ will enter into the final uncertainty with 0.3%.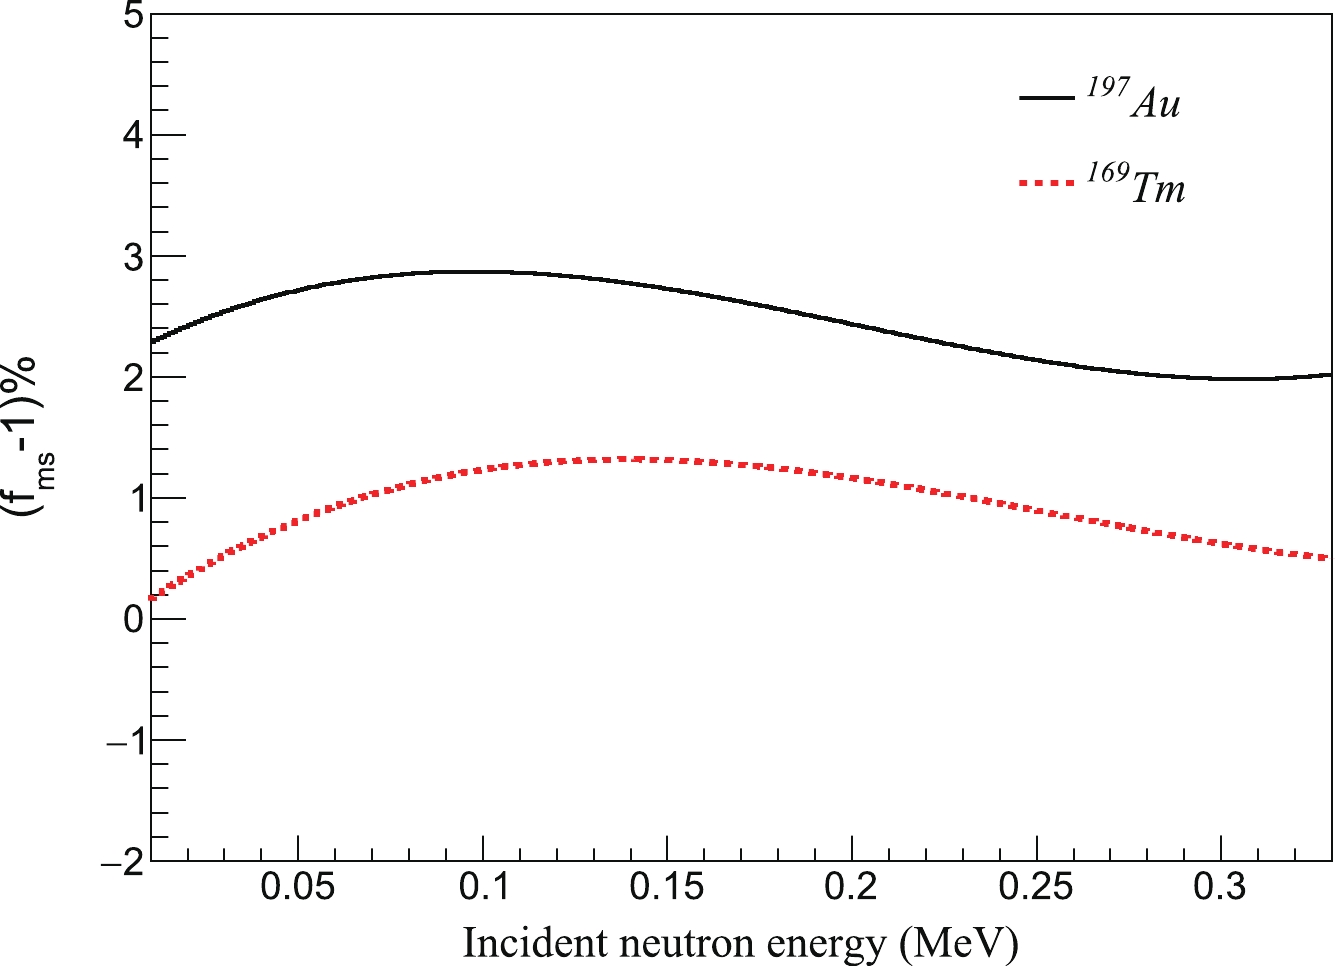
Figure 13. (color online) Correction factor for multiple scattering and self-shielding calculated with the Geant4 toolkit: black solid line for 197Au and red dashed line for 169Tm.
-
The normalized and corrected capture yield (
$ Y^{\prime} $ ) is related to the capture cross section$ \sigma_{\gamma} $ and to the total cross section$ \sigma_{\rm tot} $ , as$ Y^{\prime}(E_n ) = (1-{\rm e}^ {-\rho\sigma_{\rm tot}(E_n)})\frac{\sigma _\gamma(E_n)}{\sigma _{\rm tot}(E_n)}, $

(13) where ρ is the area density of the sample. The total cross section
$ \sigma_{\rm tot} $ from the ENDF/B-VIII.0 data library was used to derive the$ \sigma_{\gamma} $ from the experimental yield. The$ \sigma_{\gamma} $ for 197Au$ (n, \gamma) $ and 169Tm$ (n, \gamma) $ reactions calculated from Eq. (13) are shown in Fig. 14.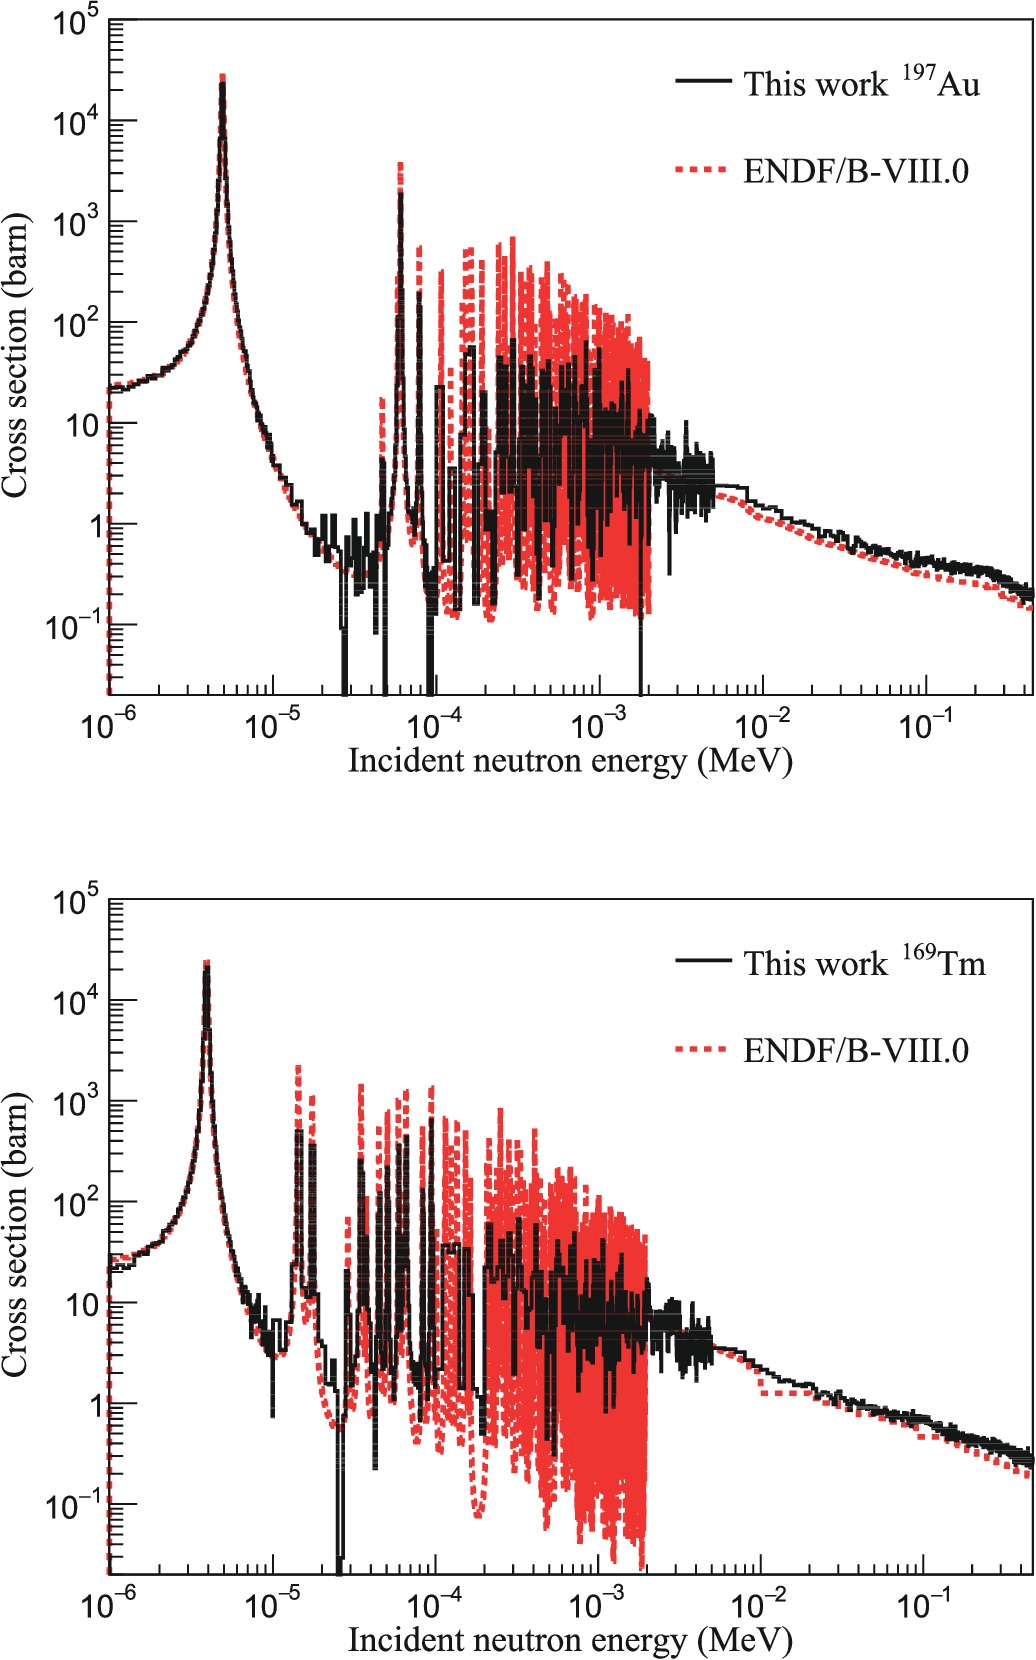
Figure 14. (color online) Capture cross sections of 197Au (top panel) and 169Tm (bottom panel) derived from the experimental yield (the black solid line) compared with the evaluated data of ENDF/B-VIII.0 (red dashed line).
The comparison results between the experimental data and the values from the ENDF/B-VIII.0 data library in Fig. 14 show that the experimental results agreed well with the evaluation values in the energy range between 1 and 10 eV, while in the energy range above 5 keV, the current results showed the same shape but were systematically higher than the data of ENDF/B-VIII.0 for both 197Au and 169Tm. According to the uncertainty calculated in Sec. III, the overall uncertainty of the experimental cross section in the energy region above 10 keV due to background subtraction, normalization, and correction was less than 3.5%. The statistical uncertainty was less than 1.5% above 10 keV in the energy spectrum with 1 keV per bin in Fig. 14, and the systematic uncertainty induced by the PHWT was less than 1.8% as stated in Ref. [18]. However, the overall uncertainty that included all the issues above is about 4.2%, which can not explain the divergence between the current result and the evaluation data. Considering that the neutron flux used in Eq. (3) was measured by the 6LiF-silicon detector, which was
$ \sim $ 20 m away from the sample position of the present measurement [17], the neutron flux used in this study may be different from that on the 197Au and 169Tm samples. Therefore, the neutron flux at the sample position of the C6D6 detectors of Back-n should be measured to clarify the difference between the current result and the evaluation data in the future. -
To avoid the effect of the neutron flux, the capture cross section of 169Tm (
$ \sigma_{\rm Tm} $ ) was obtained relative to the experimental results of the 197Au sample as$ \sigma _{\rm Tm} = \frac{<\sigma_{\rm Tm}>}{<\sigma_{\rm Au}>} \cdot \sigma _{\rm Au}, $

(14) where
$ <\sigma _{\rm Tm}> $ and$ <\sigma _{\rm Au}> $ were the measured average cross sections in this study, and$ \sigma_{\rm Au} $ was the evaluated cross section of 197Au recommended by the ENDF/B-VIII.0 data library. Fig. 15 shows the$ \sigma_{\rm Tm} $ in the energy region from 20 to 400 keV in logarithmically equidistant energy bins with 20 bins per energy decade, as well as the values of evaluated nuclear data libraries and the experimental data reported in the EXFOR database [34].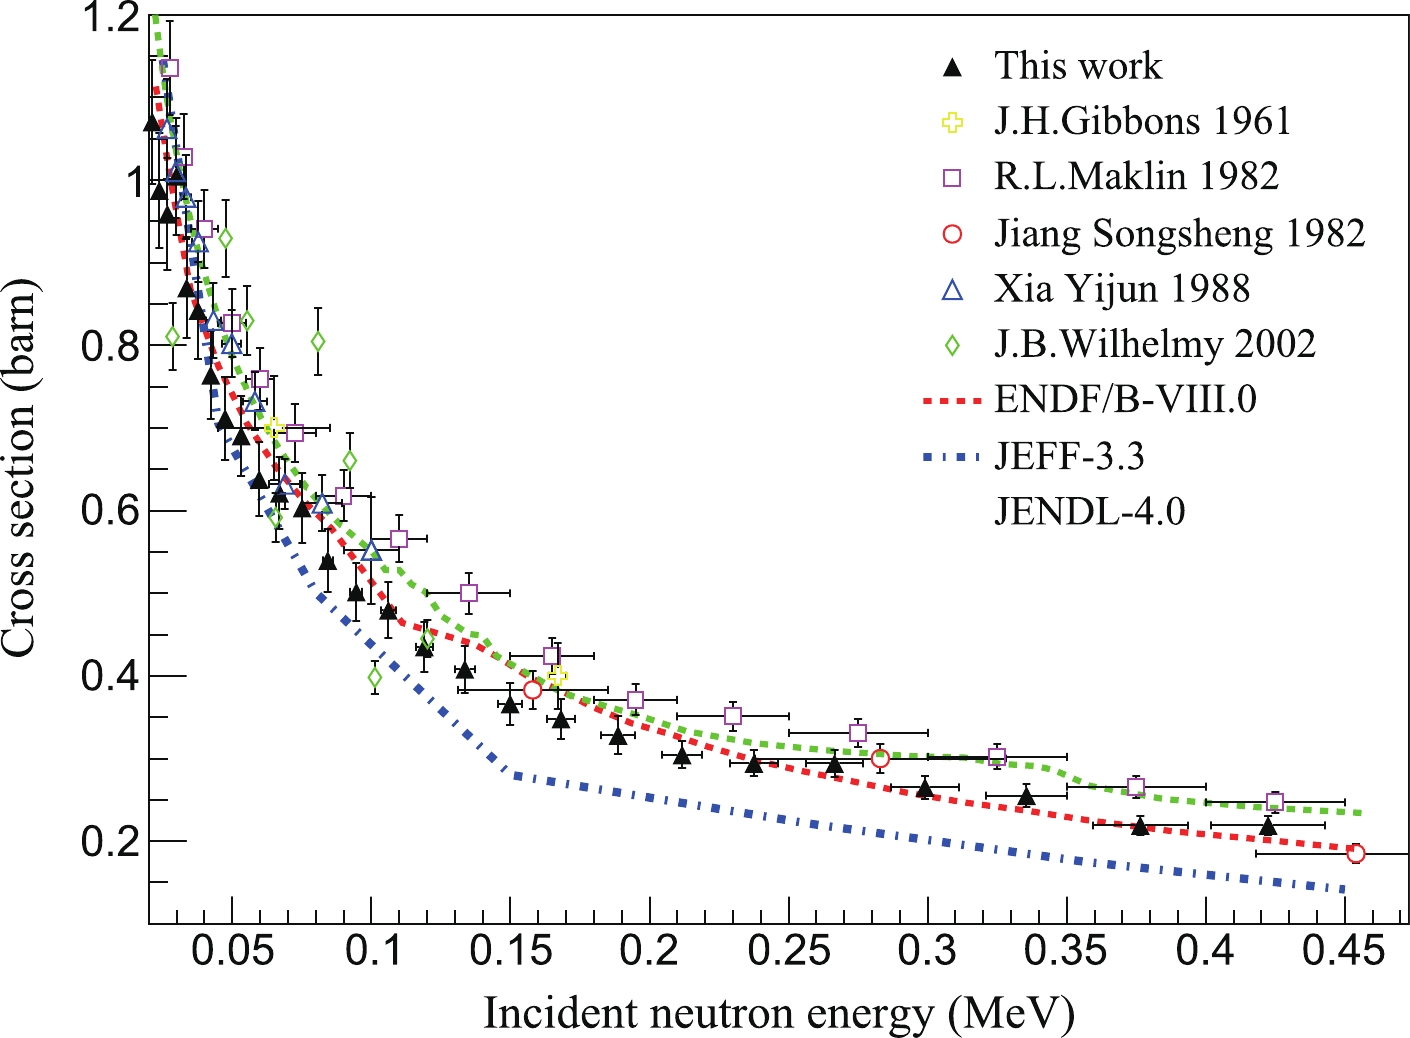
Figure 15. (color online) The capture cross sections of 169Tm obtained by the relative measurement of 197Au
$ (n, \gamma) $ .The capture cross sections of 169Tm have been measured in five laboratories before in the tens and hundreds keV energy range [3-8]. Among them, the activation method was used by Jiang Songsheng, while the others were performed using the prompt γ-rays method. In the energy range from 20 to 430 keV, the
$ \sigma_{\rm Tm} $ obtained in this study agreed well with the ENDF/B-VIII.0 data and was systematically higher than the data in the JEFF-3.3 and lower than the data in the JENDL-4.0. In the energy range between 20 keV and 80 keV, the$ \sigma_{\rm Tm} $ of this study was consistent with the existing data within the uncertainty range. Above 100 keV, the current results show fair agreement with Jiang Songsheng’s data [6], while being systematically lower than those of Macklin [5]. The same divergence was also found in the energy range from 0.5 to 3.0 MeV between Chen Jinxiang’s measurement [35] and Macklin’s data. The data obtained with the activation method were lower than Macklin’s data.The
$ \sigma_{\rm Tm} $ obtained in the present measurement in the energy region between 30 keV and 300 keV is listed in Table 3. In the 20$\sim$ 30 keV energy region, there were fluctuations in the spectra of the experimental yields for the 197Au and 169Tm samples, which fluctuated the cross sections in this energy region. The energy resolution became worse for the incident neutron above 300 keV owing to the double-bunched proton pulse. Furthermore, the deposited energies in the C6D6 detectors of the γ-rays induced by the inelastic reaction of 169Tm could be higher than the experimental threshold used in the current measurement and became non-negligible in the data analysis. Therefore, the$ \sigma_{\rm Tm} $ above 300 keV was not listed in Table 3.$ E_{\rm low} $ /keV

$ E_{\rm high} $ /keV

$ \sigma_{\rm Tm} $ /mb

Uncertainty(%) 28.18 31.62 992.0 7.0 31.62 35.48 878.9 7.0 35.48 39.81 812.5 7.0 39.81 44.67 781.1 7.0 44.67 50.12 711.5 7.0 50.12 56.23 690.5 7.0 56.23 63.10 645.5 7.0 63.10 70.80 612.9 7.0 70.80 79.43 603.2 7.0 79.43 89.13 543.4 7.0 89.13 100.00 500.7 7.0 100.00 112.20 483.1 7.0 112.20 125.89 433.9 7.0 125.89 141.25 408.0 7.0 141.25 158.49 365.5 7.0 158.49 177.83 348.9 7.0 177.83 199.53 328.5 7.0 199.53 223.87 305.0 5.4 223.87 251.19 293.8 5.4 251.19 281.84 293.7 5.4 281.84 316.23 265.1 5.4 Table 3. The averge capture cross sections of 169Tm and the overall uncertainties.
In Fig. 15, the overall uncertainties of the
$ \sigma_{\rm Tm} $ were contributed by the data analysis of 169Tm and the experimental results of the 197Au sample. The statistical uncertainty was less than 0.7% between 30$\sim$ 300 keV with 20 bins per decade for the 169Tm and 197Au samples. The systematic uncertainty included the uncertainties due to background subtraction, normalization, and corrections for both 169Tm and 197Au as well as the uncertainty caused by the PHWT method. The uncertainty of the standard cross section recommended by the ENDF/B-VIII.0 library was estimated to be in the order of 6.0% below 200 keV and 4.0% between 200 and 300 keV. The overall uncertainties of the$ \sigma_{\rm Tm} $ are also listed in Table 3. -
In the Unresolved Resonance Region (URR), only resonance-average, seemingly smooth cross sections, can be considered because of the overlap of resonances. Two methods can be used to describe the smooth cross sections in the URR: the Hauser-Feshbach calculation [36] and the optical model calculations [37]. The analysis of the
$ \sigma_{\rm Tm} $ in this study was performed using the Hauser-Feshbach formalism with width fluctuations, which is based on a description of the average cross section using statistically generated overlapping resonances. These fictitious resonances can be used to calculate the average cross sections, self-shielding factors, and probability tables for applications.In this study, the code FITACS [38] included in SAMMY [13] was used to fit the average capture cross section of 169Tm in the energy region between 10 keV and 400 keV. There were a few average resonance parameters that can be adjusted in the FITACS code, such as the neutron strength function
$ S_l $ , the level spacing$ D_l $ , the average radiation width$ <\Gamma_{\gamma}>_l $ , and the distant level parameter$ R_l^{\infty} $ , where l is the orbital momentum. The detailed definition for each parameter can be found in Ref. [38]. In addition, the energy, spin, and parity of the 169Tm energy levels were used as the input parameters in the FITACS code, which were extracted from the ENSDF database [39] in this study.It is best to fit the capture and total cross sections simultaneously when calculating average resonance parameters in URR because the average resonance parameters are largely correlated and sensitive in a different way to the capture or total cross sections. However, there were no experimental total cross section for 169Tm in the energy range between 10 and 400 keV in EXFOR. Therefore, in this study, only the capture cross section data was used to calculate the average resonance parameters. The evaluation parameters recommended by ENDF/B-VIII.0 were used as initial values of the FITACS code, and the level spacing (
$ D_0 $ ) was fixed to 7.28 eV [40] in the fitting procedure. The average resonance parameters obtained in this study and the evaluation parameters of ENDF/B-VIII.0 are listed in Table 4. The calculation average cross sections are shown in Fig. 16 together with the contribution of the first three partial waves (l = s, p, d). According to the calculation results, the s-wave dominated the cross section below 15 keV, while the p-wave and d-wave dominated in most of the energy range studied. Furthemore, the d-wave contribution became relevant above 50 keV and overcame the p-wave contribution above 210 keV.Parameters This work ENDF/B-VIII.0 $ S_0 $ (×

$ 10^4 $ )

2.26±0.05 2.22 $ S_1 $ (×

$ 10^4 $ )

1.13±0.05 1.01 $ S_2 $ (×

$ 10^4 $ )

2.21±0.09 2.22 $<\Gamma_{\gamma}>_{0,2} $ /meV

131.7±4.8 121.9 $<\Gamma_{\gamma}>_1 $ /meV

70.1±2.6 61.0 Table 4. Average resonance parameters obtained in this work and the recommended values in ENDF/B-VIII.0.
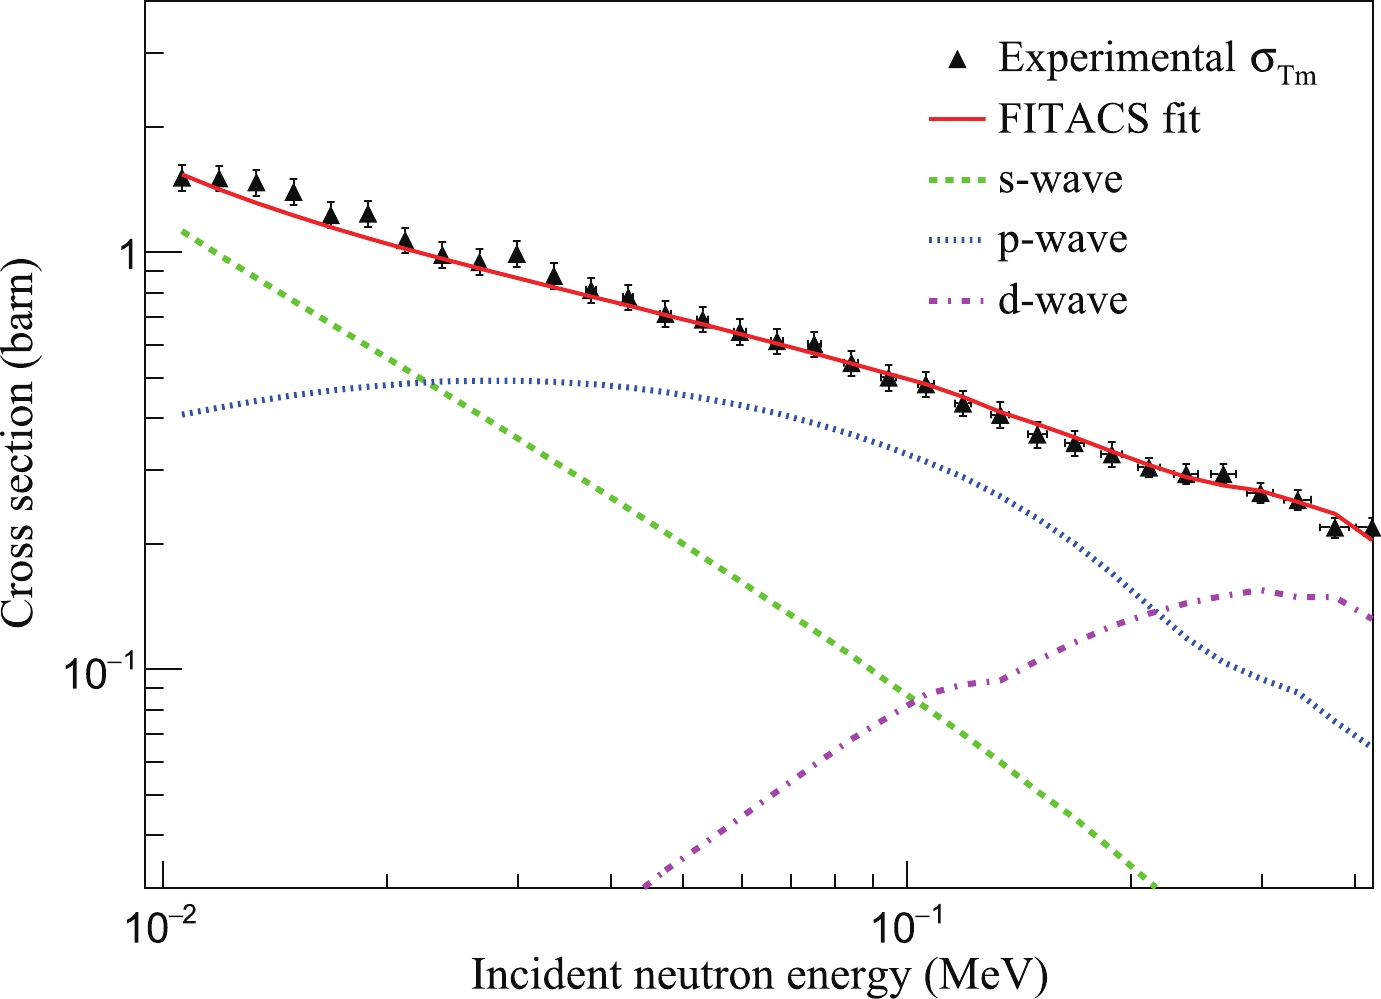
Figure 16. (color online) Calculation results of the FITACS code for the measured capture cross section of 169Tm. The black triangle points are the measured values in this work; the red solid line is the calculation of the FITACS code; and the green, blue, and purple dashed lines indicate the contributions of the s-wave, p-wave, and d-wave, respectively.
-
The 169Tm
$ (n, \gamma) $ reaction cross sections were measured at the Back-n facility using an array of four C6D6 detectors. Monte-Carlo simulations and dedicated measurements were used to study the experimental backgrounds to obtain accurate cross sections. The saturated resonance at 3.9 eV was used in the data analysis to normalize the capture yield of 169Tm. The corrections due to the experimental threshold, the dead-time of data acquisition, the multiple scattering, and self-shielding related to the sample were all considered. The uncertainties of the normalization and correction were also carefully evaluated in this study.In the energy region between 1 and 10 eV, the SAMMY code was used to analyze the resonance parameters for 169Tm. Good agreement was obtained between the experimental results and the evaluation data. In the energy region between 30 and 300 keV, the cross sections for the 169Tm
$ (n, \gamma) $ reaction were extracted relative to the 197Au$ (n, \gamma) $ reaction. The point-wise data were reported in logarithmically equidistant energy bins with 20 bins per energy decade. The cross sections of the current measurement, the existing data in EXFOR, and the values in the evaluated nuclear data libraries were compared. The result showed that the current cross sections were consistent with Jiang's data [6] and the evaluation values of ENDF/B-VIII.0. Moreover, the average resonance parameters for the 169Tm$ (n, \gamma) $ reaction were also obtained by fitting the measured cross sections with the FITACS code.In addition, in the current measurement, a systematic deviation was observed between the measured radiative capture cross sections of 197Au and the data in the evaluated nuclear data libraries, which puts forward the need for further measurement of the neutron spectrum at the Back-n facility.
-
The authors are indebted to the operating crew of the CSNS Back-n white neutron source. Dr. Peter Schillebeeckx from EU-JRC-IRMM is appreciated for the beneficial discussions.
Neutron capture cross section of 169Tm measured at the CSNS Back-n facility in the energy region from 30 to 300 keV
- Received Date: 2021-09-28
- Available Online: 2022-04-15
Abstract: The capture cross sections of the 169Tm


 DownLoad: