-
The fusion reactions of heavy nuclei have been extensively investigated to understand the mechanism of quantum tunneling in complex multi-body systems. Analyzing fusion reaction data provides an abundance of information about the synthesis of new elements or superheavy nuclei to extend the periodic table. Many fusion reactions are usually described using the nucleus-nucleus potential, which is composed of the nuclear attractive potential and Coulomb repulsive potential. In the simplest picture of nuclear fusion reactions, the one-dimensional potential model is employed to calculate the fusion cross sections [1]. The fusion barrier height, radius, and curvature generated by the nuclear and Coulomb potentials alone describe the fusion process, such as the Wong formula [2]. However, when the colliding energy is in the sub-barrier energy region, the coupling effects resulting from the vibrational, rotational, and nucleon transfer degrees of freedom must be taken into account [3-5]. The single fusion barrier can be considered as splitting into a distribution of barriers. Several coupled-channels (CC) codes have been successfully applied to achieve a description of the fusion cross sections [6-9]. For example, the CCFULL code is widely employed in fusion reaction calculations [10-12].
As one of the most important ingredients, the nucleus-nucleus potential between a projectile and target has attracted a lot of attention. Since the Coulomb potential can be exactly defined, the only uncertainty is from the nuclear potential. Significantly, the nuclear potential determines not only the height of the Coulomb barrier, but also the shape of the potential inside the Coulomb barrier. Additionally, the nuclear coupling to the excitation states of the colliding nucleus is also dependent on the nuclear potential of the ground state. Therefore, various nuclear potentials between two colliding nuclei have been proposed to describe the fusion process of heavy ions [13-18].
The double folding (DF) model, derived from the superposition of effective nucleon-nucleon potential, has widely been used to calculate the nucleus-nucleus potential [19]. For elastic and inelastic scattering of
$ \alpha $ particles and heavy ions, the DF potential provides a good description of the experimental data [19, 20]. For heavy-ion fusion reactions with strong density overlap, it has been suggested that the DF potential is not appropriate for the inner part of the Coulomb barrier [21], and the repulsive interaction owing to the Pauli exclusion principle must be included [22-25]. Meanwhile, a large discrepancy between the diffuseness parameters used in the Woods-Saxon potential (a$ \approx $ 1.3 fm) to explain the fusion process and that extracted from scattering data (a$ \approx $ 0.63 fm) further indicates a shallow potential inside the Coulomb barrier [26-28].In order to describe the fusion process in strong density overlapping regions, a repulsive core with an adjustable diffuseness parameter of the densities is taken into account in the DF potential [23]. A shallow pocket is formed in the inner part of the total potential between two colliding nuclei and the experimental fusion cross sections at deep sub-barrier energies are described well [29, 30]. In recent studies [31-33], the radioactive
$ \alpha $ decay in heavy nuclei, as a reverse quantum tunneling process with fusion, was successfully carried out using microscopic calculations. The Pauli blocking effect from the density overlap of the$ \alpha $ cluster and daughter nucleus was introduced and successfully applied to the radioactive$ \alpha $ decay,$ ^{212} $ Po$ \rightarrow $ $ ^{208} $ Pb +$ \alpha $ . More recently, a preliminary work about Pauli blocking effects in$ \alpha $ -induced and n$ \alpha $ -nuclei-induced fusion reactions also proposed a good description of the fusion cross sections for$ \alpha $ +$ ^{208} $ Pb,$ ^{16} $ O +$ ^{208} $ Pb, etc. reactions based on the sudden approximation [34-36].In this study, the Pauli blocking potential of single nucleon from the surrounding matter is obtained from the Pauli blocking effect of radioactive
$ \alpha $ -decay in$ ^{212} $ Po. As a consequence of antisymmetrization, the exchange term of the Michigan-3-Yukawa (M3Y) effective nucleon-nucleon interaction is replaced and a global strength parameter of a direct term is renormalized to describe the fusion process. The fusion cross sections at above- and sub-barrier energies are also investigated in detail. The rest of the paper is organized as follows. In Section II, we introduce how to construct the auli blocking potential of a single nucleon from the surrounding matter. The DF model with Pauli blocking potential is presented in Section III. Section IV analyzes the fusion cross sections at above and sub-barrier energies. The summary is displayed in Secction V. -
When the projectile and target nuclei come into contact, the Pauli blocking effects become increasingly important owing to the density overlap. Thus, there is a nonnegligible Pauli repulsive interaction in addition to the attractive nuclear interaction and repulsive Coulomb interaction between the two colliding nuclei. By solving the in-medium wave function, a good fit formula for Pauli blocking potential of
$ \alpha $ particles from surrounding nuclear matter has been proposed by using the local density approximation [31]$ V_p^{\alpha}(\rho) = 4515.9\rho-100935\rho^2+1202538\rho^3, $

(1) where
$ \rho $ denotes the density of the target nucleus. As a reverse quantum tunneling process with fusion, this Pauli blocking potential has been successfully applied to radioactive$ \alpha $ -cluster decay in heavy nuclei and superheavy nuclei [31-33]. Our preliminary studies demonstrate that this Pauli blocking potential can additionally describe the fusion process of$ \alpha $ -induced and$ n\alpha $ -nucleus-induced reactions well [34-36]. However, our previous method was limited in that the projectile must be an$ n\alpha $ nucleus. To amend this, the Pauli blocking potential of a single nucleon from surrounding matter is constructed by fitting the Pauli blocking potential of$ \alpha $ decay in$ ^{212} $ Po.We postulate the form of the Pauli blocking potential of a single nucleon as follows:
$ V_p^{s}(\rho) = \lambda _1 \rho+ \lambda _2 \rho^2, $

(2) where the fitting parameters
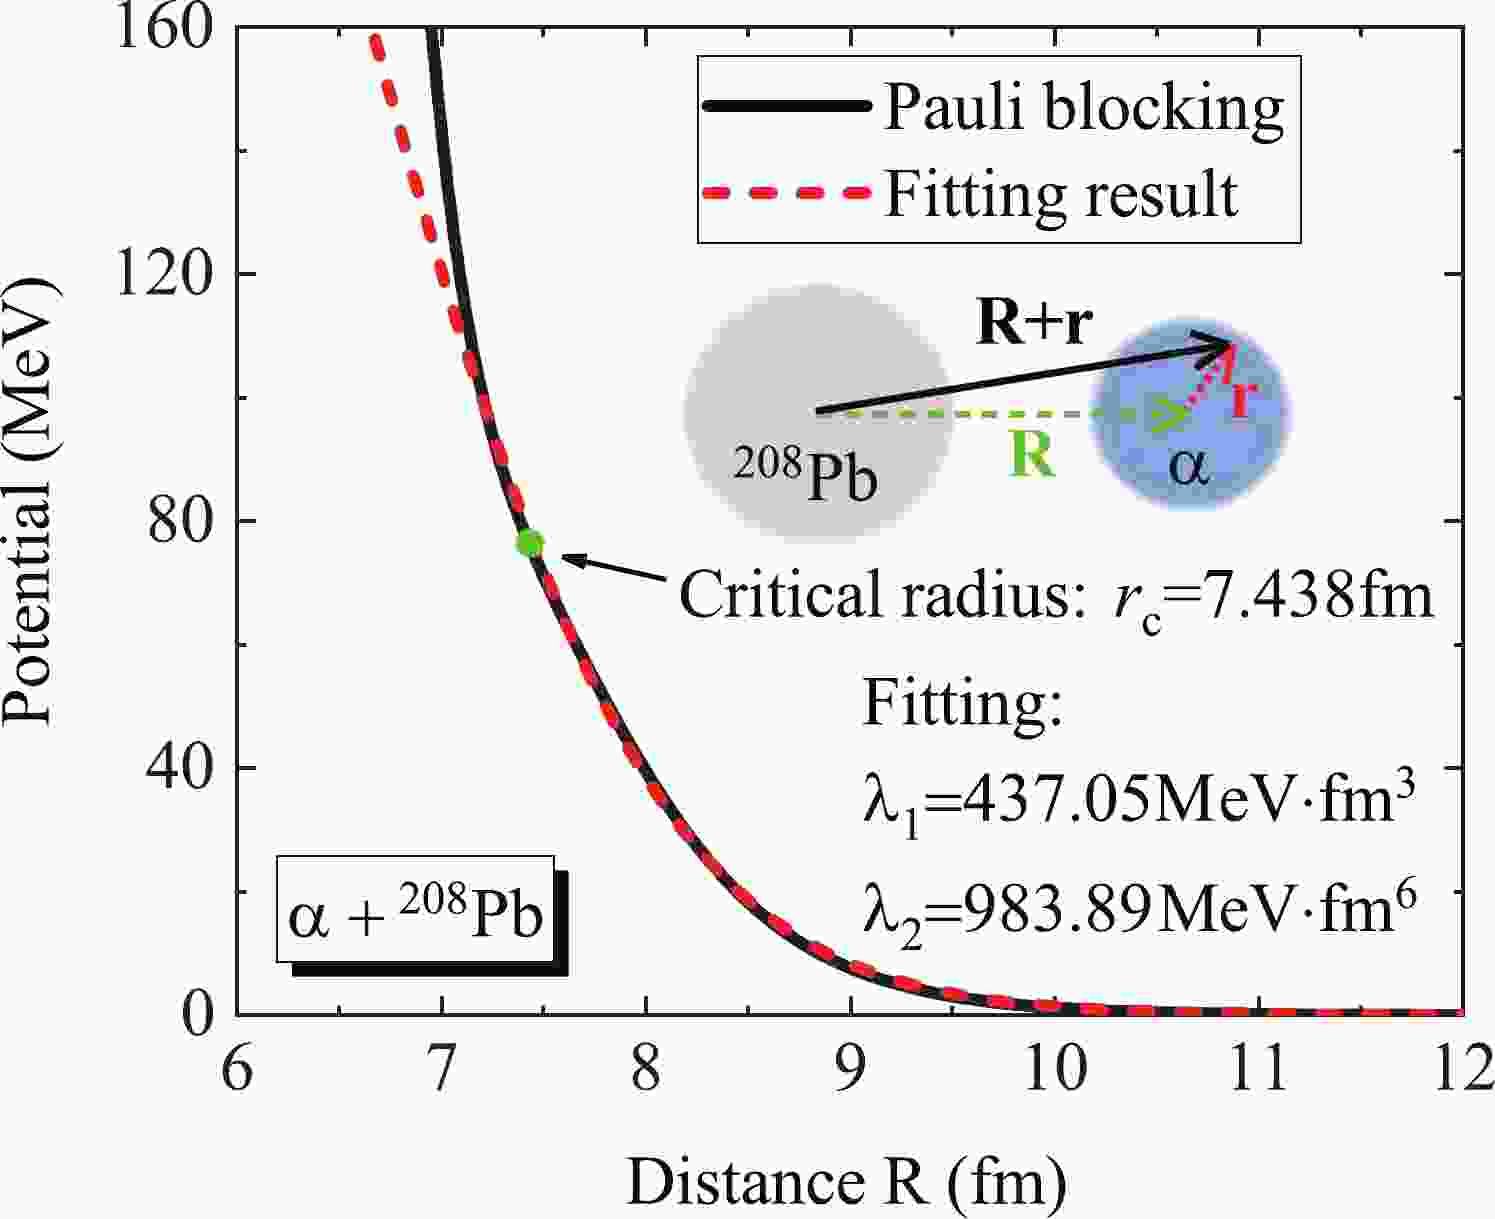
$ \lambda _1 $ and$ \lambda _2 $ are 437.05 MeV$ \cdot $ fm$ ^{3} $ and 983.89 MeV$ \cdot $ fm$ ^{6} $ , respectively, and$ \rho $ denotes the density of the target associated with the distance between the nucleon and the centroid of the target nucleus. Therefore, the Pauli blocking potential of$ \alpha $ decay in$ ^{212} $ Po may also be expressed by a single folding procedure (insert in Fig. 1),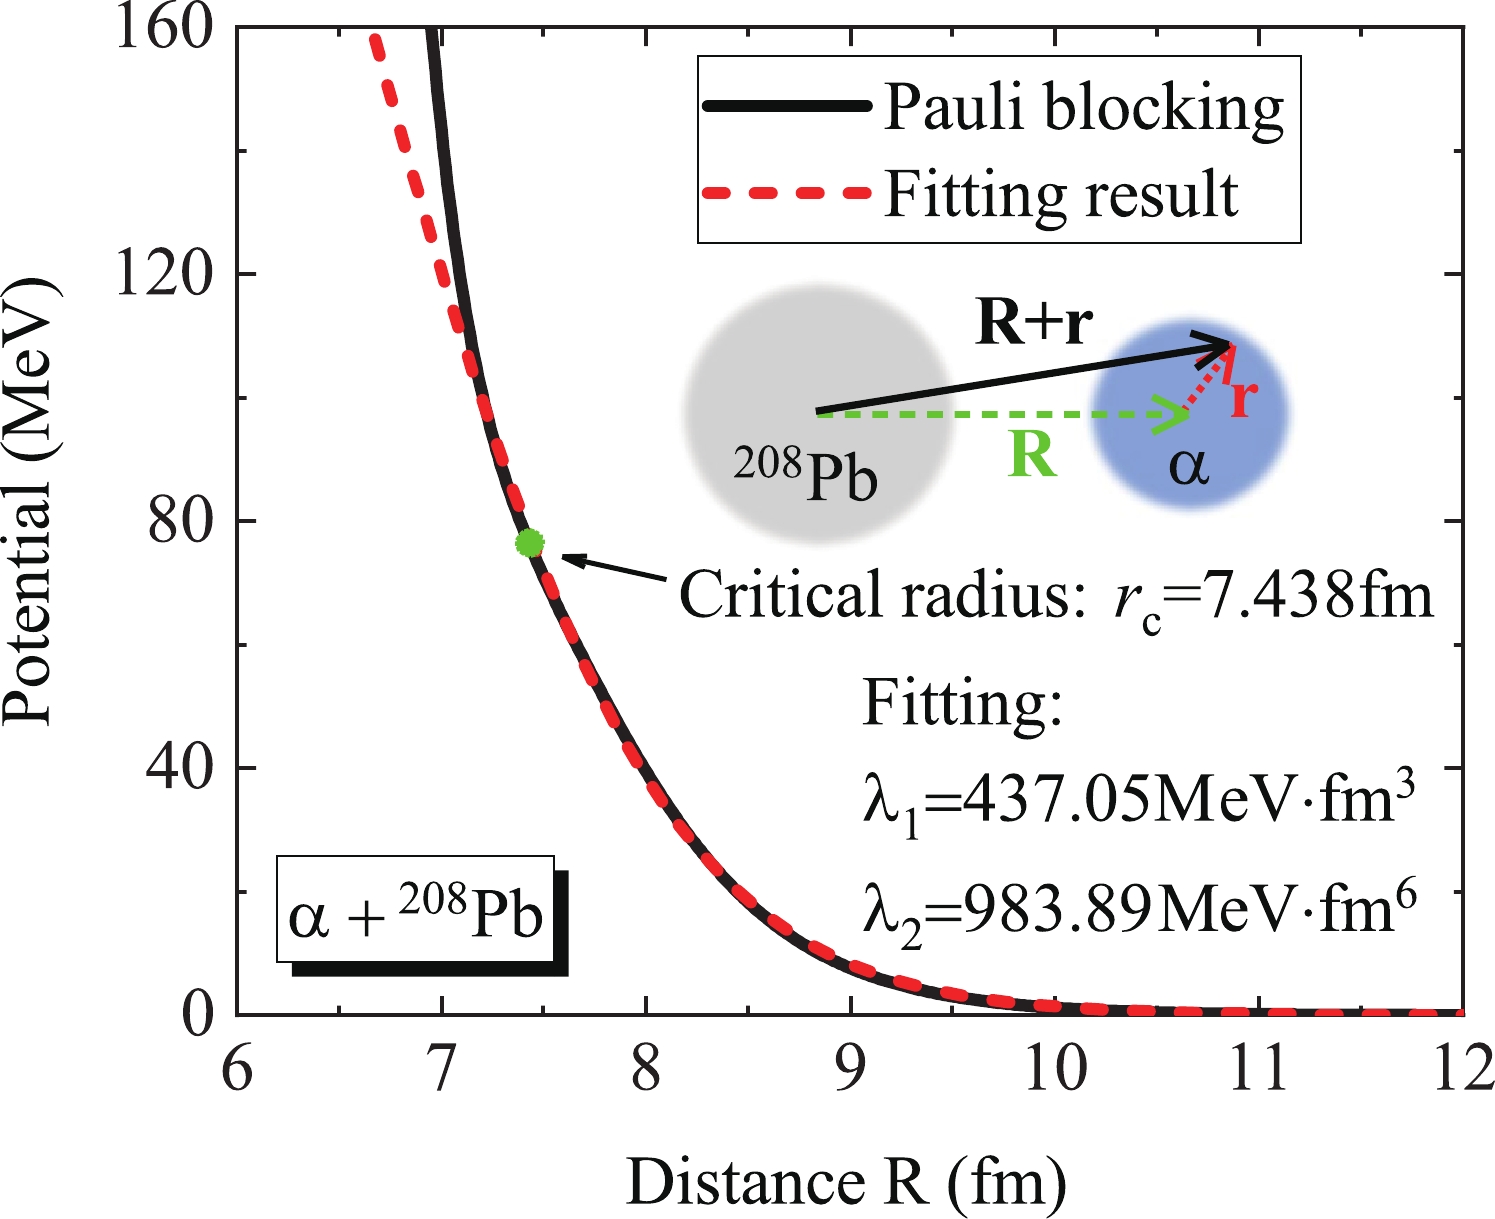
Figure 1. (color online) Pauli blocking potential in the
$ \alpha $ +$ ^{208} $ Pb fusion reaction. The solid line denotes the potential of$ \alpha $ decay in$ ^{212} $ Po and the dashed line is the fitted result using the Pauli blocking potential of a single nucleon. The solid dot is the critical radius provided in the literature [32]. The insert is a schematic illustration of the Pauli blocking potential of an$ \alpha $ particle constructed by single nucleon potential.$ V_p^{\alpha}({\bf{R}}) = \int \rho_{\alpha} ({\bf{r}}) V_p^{s}({\bf{R}}+{\bf{r}}) {\rm d}{\bf{r}}. $

(3) Here,
$ \rho_{\alpha} $ denotes the density distributions of$ \alpha $ particles and is taken in the standard Gaussian form [19]$ \rho_{\alpha}(r) = 0.4229\exp(-0.7024 r^2). $

(4) However, Eq. (1) is only valid at low densities,
$ \rho < \rho_c \approx $ 0.03 fm$ ^{-3} $ , where$ \rho_c $ is the critical density. At higher densities, the$ \alpha $ particle will be dissolved into nearly free single-quasiparticle states [31, 32]. Therefore, in Fig. 1, only the potential beyond the distance of critical radius$ r_c = 7.438 $ fm is fitted accurately using the single nucleon potential. -
In the literature [34-36], it is accepted that there is a nonnegligible Pauli repulsive interaction between two colliding nuclei at a density overlap region in addition to the attractive nuclear interaction and the repulsive Coulomb interaction. When the projectile and target nuclei touch, the Pauli blocking effects become increasingly important owing to this density overlap. Therefore, a Pauli blocking potential,
$V_{\rm P}$ , as a consequence of antisymmetrization, is introduced to replace the exchange term in the standard M3Y potential as follows:$ \begin{align} V_N(\mathbf{R}) = \int {\rm d} \mathbf{r_1} {\rm d} \mathbf{r_2} \rho_p(\mathbf{r_1}) \rho_t(\mathbf{r_2}) g(|\mathbf{s}|) + V_{\rm P}(\mathbf{R}), \end{align} $

(5) with
$ \begin{aligned} g(|\mathbf{s}|) = c_1\frac{\exp(-4s)}{4s}-c_2\frac{\exp(-2.5s)}{2.5s}. \end{aligned} $

(6) In Eq. (5), R denotes the distance between the center of mass of the two colliding nuclei and
$ |\mathbf{s}|(\mathbf{s} = \mathbf{R-r_1+r_2}) $ is the distance between a nucleon in the target and a nucleon in the projectile. The Pauli blocking potential$V_{\rm P}$ in Eq. (5) can be obtained by$ \begin{aligned} V_{\rm P}(\mathbf{R}) = \int \rho_p(\mathbf{r})V_{\rm P}^s(\mathbf{R+r}) {\rm d} \mathbf{r}. \end{aligned} $

(7) The parameters
$ c_1 $ and$ c_2 $ in Eq. (6) are the strength of the Yukawa interactions, with two global values,$ c_1 $ = 9846 MeV and$ c_2 $ = 3139 MeV, being used to calculated the fusion cross sections for the 95 fusion reactions investigated in this study. For convenience, we label this nuclear interaction as "M3Y + Pauli" potential.The density distribution of the nuclei adopted in Eq. (5) is given by the standard Fermi form,
$ \begin{aligned} \rho_i(r) = \frac{\rho_{0i}}{1+\exp\left(\dfrac{r-c}{a}\right)}, \end{aligned} $

(8) where
$ c $ and$ a $ are the half-density radius and diffuseness parameters for the projectile ($ i = p $ ) or target ($ i = t $ ). For simplicity, the values of$ c $ and$ a $ are obtained from the formulae in Ref. [37].The Coulomb potential employed in the calculations is the double-folding integral of the proton-proton Coulomb interaction,
$ \begin{align} V_{\rm C}(\mathbf{R}) = \int {\rm d} \mathbf{r_1} {\rm d} \mathbf{r_2} \frac{e^2}{|\mathbf{s}|} \rho_{pp}(\mathbf{r_1}) \rho_{tp}(\mathbf{r_2}), \end{align} $

(9) where
$ \rho_{pp} $ and$ \rho_{pt} $ denote the proton density distributions of the projectile and target nucleus, respectively.To assess the validity of the Pauli blocking potential, in Table 1 the calculated Coulomb barrier parameters, namely, the barrier energy
$ V_b $ , barrier radius$ R_b $ , and curvature$ \hbar \omega $ , are compared with the values obtained using the Akyüz-Winther (AW) potential, which provides a good description of the fusion data in the barrier and high-energy region [38]. The empirical barrier energies$V_b^{\rm emp}$ in the second column were taken from the corresponding references. The barrier radius$ R_b $ , which relates to the maximum cross section of the fusion reactions, displays almost no variation between the AW potential and M3Y + Pauli potential. A detailed comparison of barrier energy and curvature is presented in Fig. 2.System $V_b^{\rm emp}$ 

Akyüz-Winther M3Y + Pauli Ref. $ V_b $ 

$ R_b $ 

$ \hbar \omega $ 

$ V_b $ 

$ R_b $ 

$ \hbar \omega $ 

$ ^{6} $ Li +

$ ^{64} $ Zn

13.22 13.37 9.04 4.07 12.61 9.43 3.23 [39] $ ^{6} $ Li +

$ ^{144} $ Sm

24.65 24.34 10.33 4.91 23.36 10.57 3.87 [40] $ ^{6} $ Li +

$ ^{152} $ Sm

25.1 24.04 10.47 4.85 23.08 10.72 3.83 [41] $ ^{6} $ Li +

$ ^{159} $ Tb

24.48 25.02 10.55 4.91 24.03 10.79 3.88 [42] $ ^{6} $ Li +

$ ^{198} $ Pt

28.9 28.85 11.00 5.13 27.71 11.25 4.00 [43] $ ^{6} $ Li +

$ ^{208} $ Pb

30.1 30.08 11.09 5.20 28.87 11.35 4.04 [44] $ ^{6} $ Li +

$ ^{209} $ Bi

30.1 30.43 11.10 5.22 29.21 11.36 4.06 [45] $ ^{7} $ Li +

$ ^{159} $ Tb

23.81 24.67 10.70 4.48 23.61 11.01 3.59 [46] $ ^{7} $ Li +

$ ^{198} $ Pt

28.6 28.49 11.14 4.67 27.25 11.47 3.71 [43] $ ^{7} $ Li +

$ ^{209} $ Bi

29.7 30.04 11.24 4.76 28.73 11.58 3.76 [45] $ ^{9} $ Be +

$ ^{89} $ Y

21.6 21.40 9.81 3.94 20.51 10.09 3.23 [47] $ ^{9} $ Be +

$ ^{124} $ Sn

25.87 26.01 10.38 4.14 25.04 10.63 3.38 [48] $ ^{9} $ Be +

$ ^{144} $ Sm

31.2 31.63 10.59 4.46 30.54 10.80 3.62 [49] $ ^{9} $ Be +

$ ^{208} $ Pb

38.1 39.20 11.34 4.71 37.79 11.58 3.77 [45] $ ^{9} $ Be +

$ ^{209} $ Bi

39.4 39.66 11.34 4.74 38.24 11.59 3.79 [50] $ ^{11} $ B +

$ ^{197} $ Au

46.7 47.27 11.31 4.65 45.86 11.48 3.76 [43] $ ^{12} $ C +

$ ^{92} $ Zr

32.3 32.43 9.95 4.13 31.49 10.09 3.41 [21] $ ^{12} $ C +

$ ^{198} $ Pt

56.2 55.88 11.33 4.79 54.54 11.41 3.85 [43] $ ^{12} $ C +

$ ^{204} $ Pb

57.6 58.53 11.37 4.87 57.11 11.45 3.90 [21] $ ^{16} $ O +

$ ^{92} $ Zr

42 42.47 10.12 4.06 41.55 10.19 3.39 [21] $ ^{16} $ O +

$ ^{144} $ Sm

60.5 61.68 10.83 4.49 60.66 10.83 3.69 [51] $ ^{16} $ O +

$ ^{148} $ Sm

59.4 61.31 10.90 4.46 60.30 10.91 3.68 [51] $ ^{16} $ O +

$ ^{154} $ Sm

58.4 60.77 11.01 4.42 59.76 11.01 3.65 [51] $ ^{16} $ O +

$ ^{186} $ W

68.3 70.36 11.36 4.59 69.17 11.37 3.75 [51] $ ^{16} $ O +

$ ^{208} $ Pb

75.5 76.52 11.59 4.70 75.15 11.60 3.80 [43] $ ^{16} $ O +

$ ^{116} $ Sn

50.94 51.35 10.47 4.26 50.42 10.50 3.54 [52] $ ^{16} $ O +

$ ^{238} $ U

80.81 83.84 11.87 4.80 82.17 11.90 3.84 [53] $ ^{17} $ O +

$ ^{144} $ Sm

60.6 61.26 10.91 4.33 60.22 10.93 3.60 [51] $ ^{18} $ O +

$ ^{124} $ Sn

49.3 49.98 10.78 3.92 48.99 10.85 3.31 [54] $ ^{19} $ F +

$ ^{197} $ Au

80.8 82.76 11.60 4.47 81.48 11.60 3.68 [21] $ ^{19} $ F +

$ ^{208} $ Pb

83 85.07 11.72 4.49 83.69 11.73 3.69 [21] $ ^{26} $ Mg +

$ ^{30} $ Si

24.8 24.42 9.19 3.27 23.48 9.45 2.76 [55] $ ^{28} $ Si +

$ ^{58} $ Ni

52.9 53.29 9.84 3.82 52.41 9.86 3.24 [51] $ ^{28} $ S +

$ ^{62} $ Ni

51.3 52.62 9.98 3.74 51.82 9.99 3.19 [51] $ ^{28} $ Si +

$ ^{64} $ Ni

50.4 52.30 10.04 3.70 51.53 10.05 3.17 [51] $ ^{28} $ Si +

$ ^{92} $ Zr

70.9 71.44 10.52 3.93 70.89 10.44 3.35 [21] $ ^{28} $ Si +

$ ^{120} $ Sn

85.89 85.93 10.94 4.04 85.53 10.82 3.43 [56] $ ^{28} $ Si +

$ ^{144} $ Sm

104 104.12 11.20 4.23 103.74 11.06 3.54 [21] $ ^{28} $ Si +

$ ^{198} $ Pt

120.9 124.15 11.85 4.32 123.52 11.71 3.57 [51] Continued on next page Table 1. The fusion barrier energy
$ V_b $ (MeV), barrier radius$ R_b $ (fm), and curvature$ \hbar \omega $ (MeV) obtained using the Akyüz-Winther potential and M3Y + Pauli potential for 95 fusion reactions. The symbol$V_b^{\rm emp}$ (MeV) denotes the empirical values of the barrier energy from the corresponding references.Table 1-continued from previous System $ V_b^{\rm emp} $ 

Akyüz-Winther M3Y + Pauli Ref. $ V_b $ 

$ R_b $ 

$ \hbar \omega $ 

$ V_b $ 

$ R_b $ 

$ \hbar \omega $ 

$ ^{28} $ Si +

$ ^{208} $ Pb

128.1 129.53 11.94 4.36 128.79 11.80 3.58 [21] $ ^{30} $ Si +

$ ^{58} $ Ni

52.8 52.72 9.96 3.70 51.90 9.97 3.16 [51] $ ^{30} $ Si +

$ ^{62} $ Ni

52.1 52.09 10.09 3.62 51.32 10.10 3.11 [51] $ ^{30} $ Si +

$ ^{64} $ Ni

51.4 51.80 10.15 3.58 51.04 10.17 3.09 [51] $ ^{32} $ S +

$ ^{58} $ Ni

59.6 60.22 9.95 3.82 59.43 9.93 3.25 [51] $ ^{32} $ S +

$ ^{64} $ Ni

57.3 59.11 10.16 3.70 58.43 10.13 3.18 [51] $ ^{32} $ S +

$ ^{89} $ Y

77.8 79.15 10.57 3.89 78.76 10.46 3.33 [21] $ ^{32} $ S +

$ ^{110} $ Pd

86.3 90.54 10.92 3.95 90.31 10.77 3.37 [51] $ ^{32} $ S +

$ ^{116} $ Sn

97.36 97.93 10.96 4.02 97.75 10.80 3.42 [52] $ ^{34} $ S +

$ ^{58} $ Ni

58.5 59.64 10.06 3.72 58.91 10.04 3.19 [51] $ ^{34} $ S +

$ ^{64} $ Ni

56.9 58.60 10.25 3.60 57.94 10.23 3.11 [51] $ ^{34} $ S +

$ ^{89} $ Y

76.9 78.49 10.67 3.78 78.10 10.57 3.27 [21] $ ^{34} $ S +

$ ^{168} $ Er

121.5 124.99 11.72 4.03 124.76 11.55 3.43 [51] $ ^{35} $ Cl +

$ ^{54} $ Fe

58.59 59.27 9.97 3.73 58.52 9.96 3.19 [57] $ ^{35} $ Cl +

$ ^{92} $ Zr

82.9 85.09 10.72 3.83 84.82 10.60 3.30 [21] $ ^{35} $ Cl +

$ ^{106} $ Pd

94.3 96.09 10.92 3.90 95.96 10.76 3.35 [58] $ ^{36} $ S +

$ ^{48} $ Ca

43.3 42.69 10.05 3.30 41.83 10.14 2.86 [59] $ ^{36} $ S +

$ ^{58} $ Ni

58.4 59.10 10.16 3.62 58.40 10.14 3.12 [51] $ ^{36} $ S +

$ ^{64} $ Ni

58.5 58.11 10.34 3.50 57.44 10.33 3.05 [59] $ ^{36} $ S +

$ ^{90} $ Zr

78 79.82 10.76 3.70 79.43 10.67 3.22 [21] $ ^{36} $ S +

$ ^{96} $ Zr

76.7 78.87 10.90 3.64 78.46 10.82 3.17 [21] $ ^{36} $ S +

$ ^{110} $ Pd

85.8 89.16 11.10 3.72 88.85 10.99 3.24 [51] $ ^{37} $ Cl +

$ ^{73} $ Ge

69.2 69.48 10.50 3.62 68.99 10.43 3.15 [60] $ ^{40} $ Ar +

$ ^{58} $ Ni

50.94 65.91 10.24 3.65 65.32 10.19 3.15 [46] $ ^{40} $ Ar +

$ ^{112} $ Sn

104 108.35 11.15 3.82 108.39 10.98 3.31 [51] $ ^{40} $ Ar +

$ ^{116} $ Sn

103.3 107.62 11.23 3.79 107.65 11.07 3.29 [51] $ ^{40} $ Ar +

$ ^{122} $ Sn

103.6 106.59 11.35 3.74 106.56 11.20 3.26 [51] $ ^{40} $ Ar +

$ ^{144} $ Sm

124.4 129.64 11.57 3.89 129.78 11.38 3.35 [51] $ ^{40} $ Ar +

$ ^{148} $ Sm

124.7 128.94 11.64 3.86 129.04 11.45 3.34 [51] $ ^{40} $ Ar +

$ ^{154} $ Sm

121 127.92 11.74 3.83 127.95 11.56 3.32 [51] $ ^{40} $ Ca +

$ ^{40} $ Ca

53.6 54.91 9.74 3.77 54.00 9.75 3.20 [51] $ ^{40} $ Ca +

$ ^{44} $ Ca

51.8 54.00 9.91 3.63 53.20 9.92 3.12 [51] $ ^{40} $ Ca +

$ ^{46} $ Ti

57.3 59.36 9.91 3.73 58.58 9.90 3.19 [51] $ ^{40} $ Ca +

$ ^{48} $ Ca

51.8 53.17 10.08 3.51 52.42 10.09 3.03 [51] $ ^{40} $ Ca +

$ ^{48} $ Ti

57.1 58.91 10.00 3.68 58.18 9.98 3.16 [51] $ ^{40} $ Ca +

$ ^{50} $ Ti

57.3 58.48 10.08 3.62 57.79 10.06 3.12 [51] $ ^{40} $ Ca +

$ ^{90} $ Zr

96.9 99.58 10.77 3.88 99.61 10.59 3.33 [21] $ ^{40} $ Ca +

$ ^{96} $ Zr

94.6 98.33 10.92 3.81 98.38 10.74 3.29 [21] $ ^{40} $ Ca +

$ ^{124} $ Sn

113.4 118.66 11.32 3.89 119.01 11.10 3.33 [51] $ ^{40} $ Ca +

$ ^{192} $ Os

167.9 169.45 12.06 4.06 169.88 11.80 3.38 [51] Continued on next page Table 1-continued from previous System $ V_b^{\rm emp} $ 

Akyüz-Winther M3Y + Pauli Ref. $ V_b $ 

$ R_b $ 

$ \hbar \omega $ 

$ V_b $ 

$ R_b $ 

$ \hbar \omega $ 

$ ^{40} $ Ca +

$ ^{194} $ Pt

171 173.83 12.06 4.08 174.26 11.80 3.37 [51] $ ^{46} $ Ti +

$ ^{46} $ Ti

63.3 64.21 10.08 3.69 63.56 10.04 3.18 [61] $ ^{48} $ Ca +

$ ^{48} $ Ca

51.9 51.74 10.38 3.26 50.94 10.42 2.85 [59] $ ^{48} $ Ca +

$ ^{48} $ Ca

51.2 51.74 10.38 3.26 50.94 10.42 2.85 [51] $ ^{48} $ Ti +

$ ^{58} $ Ni

78.8 79.28 10.40 3.70 78.94 10.30 3.21 [62] $ ^{48} $ Ti +

$ ^{208} $ Pb

190.1 195.26 12.41 3.82 195.63 12.19 3.26 [63] $ ^{56} $ Fe +

$ ^{208} $ Pb

223 228.16 12.53 3.68 229.34 12.25 3.14 [63] $ ^{58} $ Ni +

$ ^{58} $ Ni

95.8 99.39 10.55 3.80 99.40 10.39 3.28 [51] $ ^{58} $ Ni +

$ ^{60} $ Ni

96.6 98.80 10.62 3.76 98.86 10.45 3.26 [51] $ ^{58} $ Ni +

$ ^{64} $ Ni

94.6 97.69 10.75 3.67 97.79 10.59 3.21 [51] $ ^{58} $ Ni +

$ ^{74} $ Ge

106.8 109.82 10.93 3.68 110.22 10.73 3.22 [51] $ ^{64} $ Ni +

$ ^{64} $ Ni

92.7 96.15 10.94 3.54 96.24 10.79 3.13 [51] $ ^{64} $ Ni +

$ ^{74} $ Ge

103.2 108.14 11.12 3.54 108.49 10.93 3.14 [51] $ ^{64} $ Ni +

$ ^{208} $ Pb

236 241.91 12.72 3.47 243.10 2.47 3.06 [63] $ ^{70} $ Zn +

$ ^{208} $ Pb

250.6 257.53 12.79 3.38 259.04 12.52 3.00 [63] $ ^{86} $ Kr +

$ ^{208} $ Pb

299.2 303.25 13.00 3.08 305.61 12.70 2.82 [63] 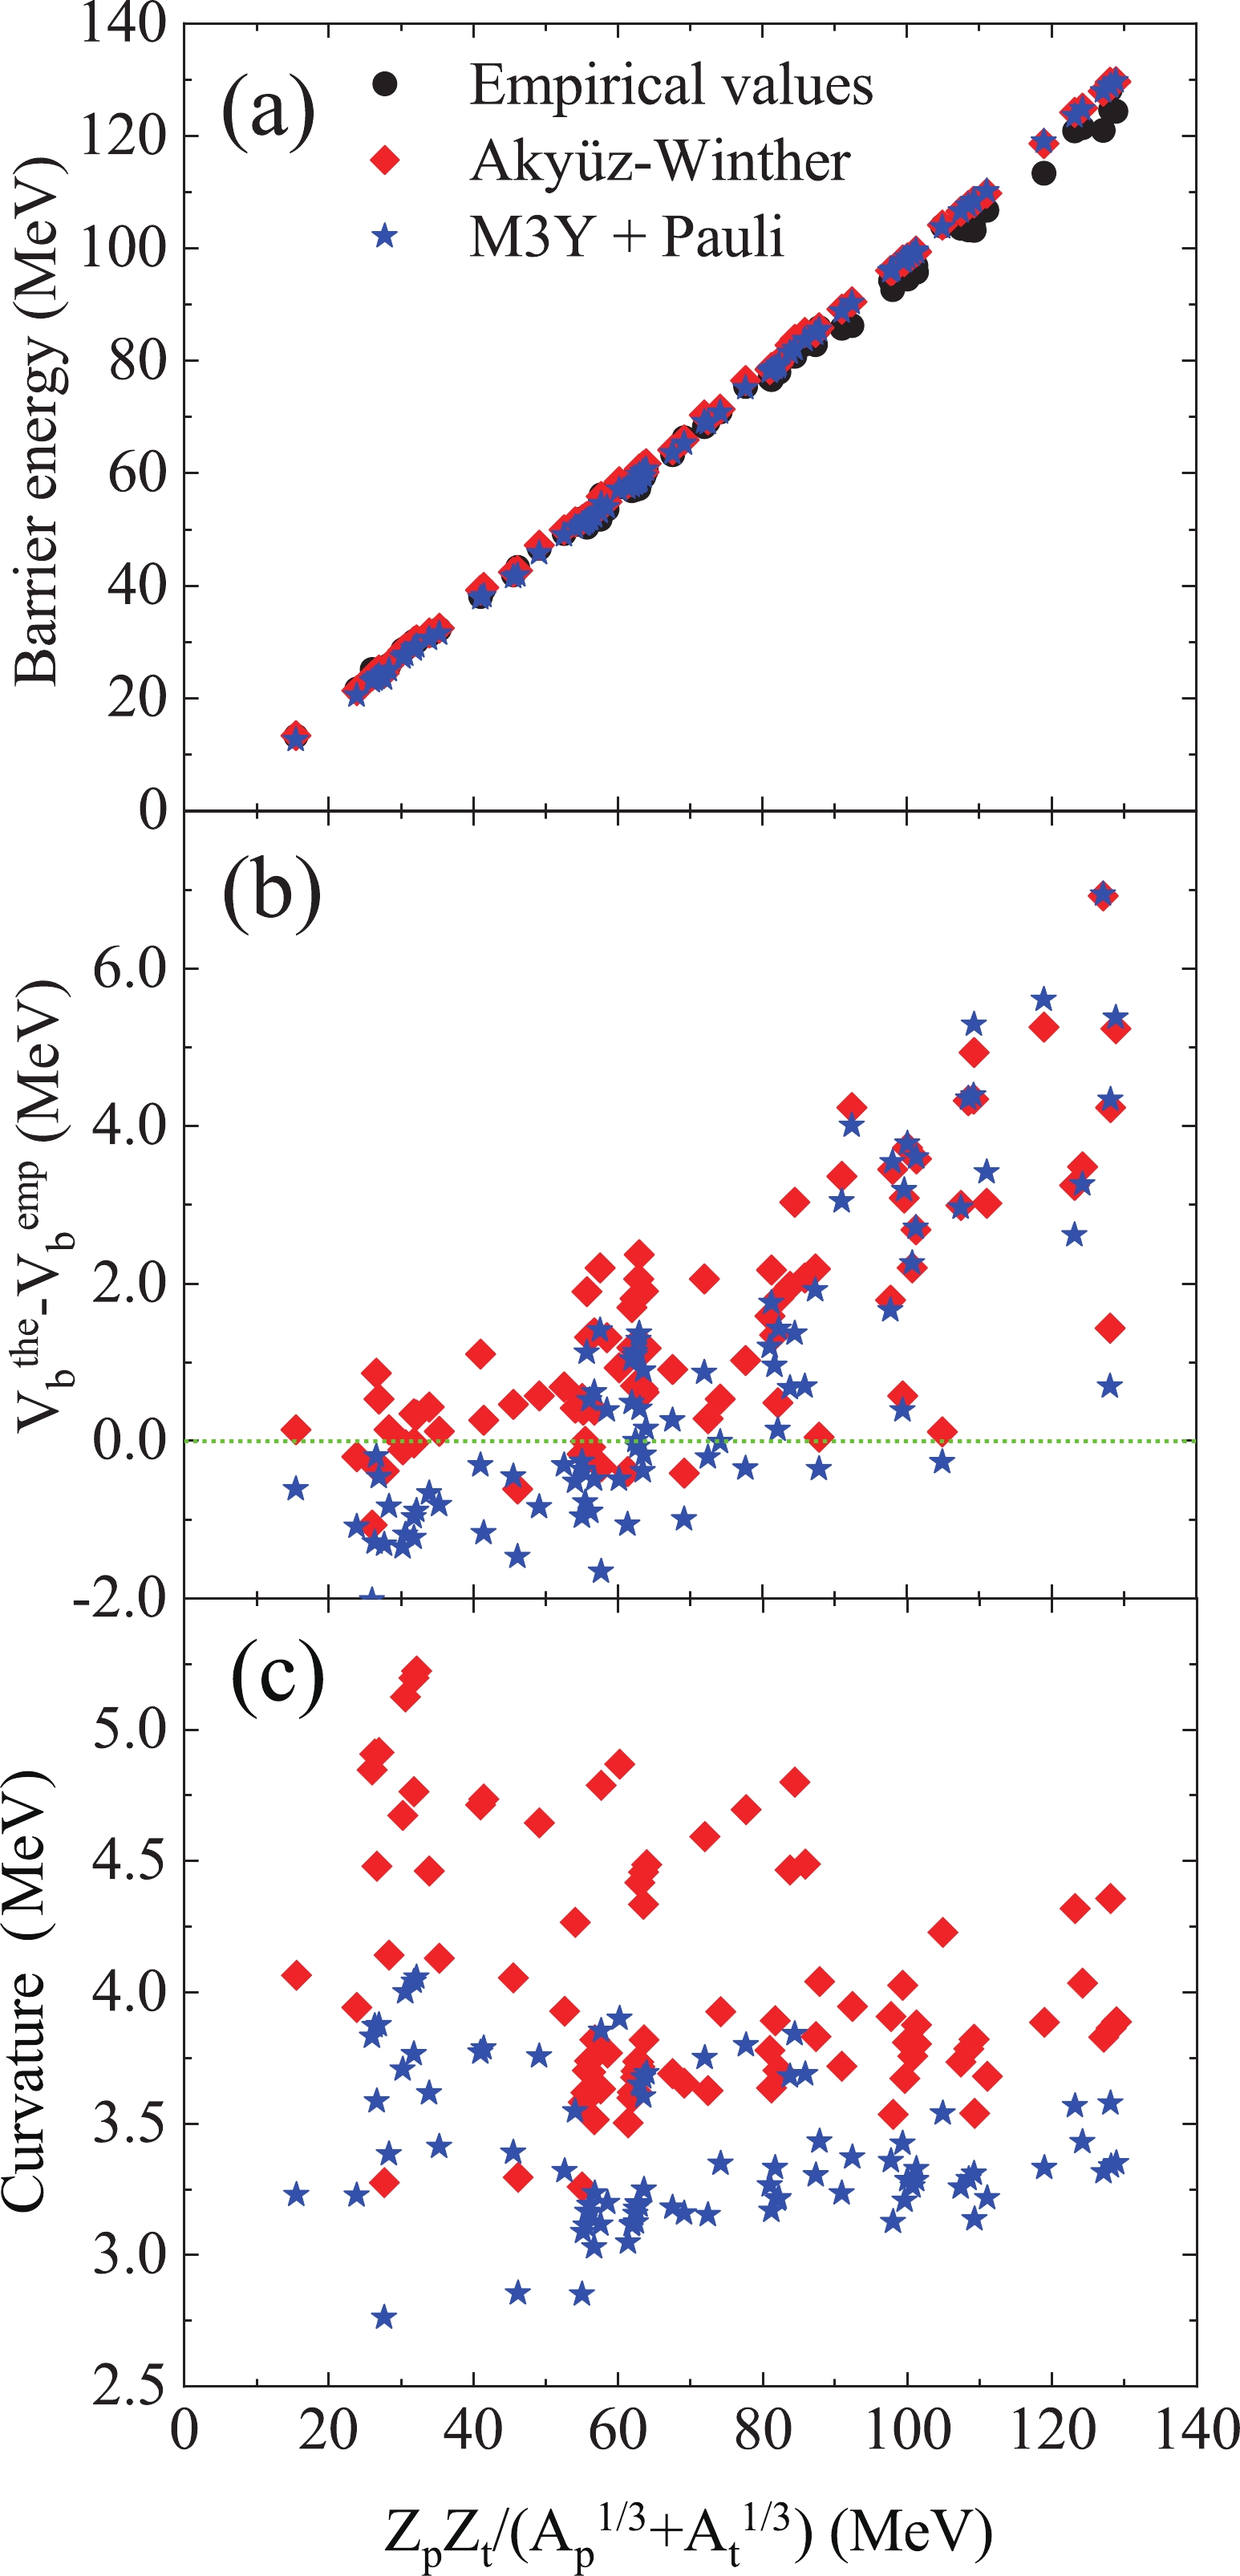
Figure 2. (color online) The barrier energy (a) and the curvature (c) versus the parameter
$ B = Z_pZ_t(A_p^{1/3}+A_t^{1/3}) $ (MeV) for the Akyüz-Winther potential (diamonds) and M3Y + Pauli potential (stars). (b) The difference in barrier energy between empirical and calculated values.In Fig. 2(a), the barrier energies calculated using the AW potential (diamonds) and M3Y + Pauli potential (stars) exhibit good agreement with the empirical values (circles) against the parameter
$ B = Z_pZ_t(A_p^{1/3}+A_t^{1/3}) $ (MeV). The differences between the empirical and calculated barrier energies are displayed in Fig. 2(b). For fusion reactions with$ B< 50 $ MeV, the energies calculated using the M3Y + Pauli potential are lower than both the empirical values and the AW potential values. However, in the medium or heavy mass fusion region ($ B > 70 $ MeV), the calculated barrier energies are approximately the same and are greater than the empirical values. For the barrier curvature, there is an obvious difference between the calculated values, as displayed in Fig. 2(c). By considering the Pauli blocking effect, the curvature of the M3Y + Pauli potential is significantly lower than that calculated using the AW potential, which means that the interaction potential with a Pauli blocking term has a wider barrier width. -
In Fig. 3, taking the fusion systems
$ ^{7} $ Li +$ ^{198} $ Pt [64],$ ^{16} $ O +$ ^{92} $ Zr [9],$ ^{30} $ Si +$ ^{58} $ Ni [65],$ ^{35} $ Cl +$ ^{92} $ Zr [9],$ ^{64} $ Ni +$ ^{64} $ Ni [38], and$ ^{40} $ Ar +$ ^{144} $ Sm [66] as examples, the calculated fusion cross sections at above barrier energies for various mass systems ($ B = 30.23 $ ,$ 45.49 $ ,$ 56.75 $ ,$ 87.34 $ ,$ 98.00 $ ,$ 128.00 $ MeV, respectively) are compared with experimental results. The solid and dashed lines denote the calculated results using the AW potential and M3Y + Pauli potential, respectively. The arrows denote the position of the empirical barrier energies. For simplicity, the fusion cross sections are calculated using the Wong formula [2],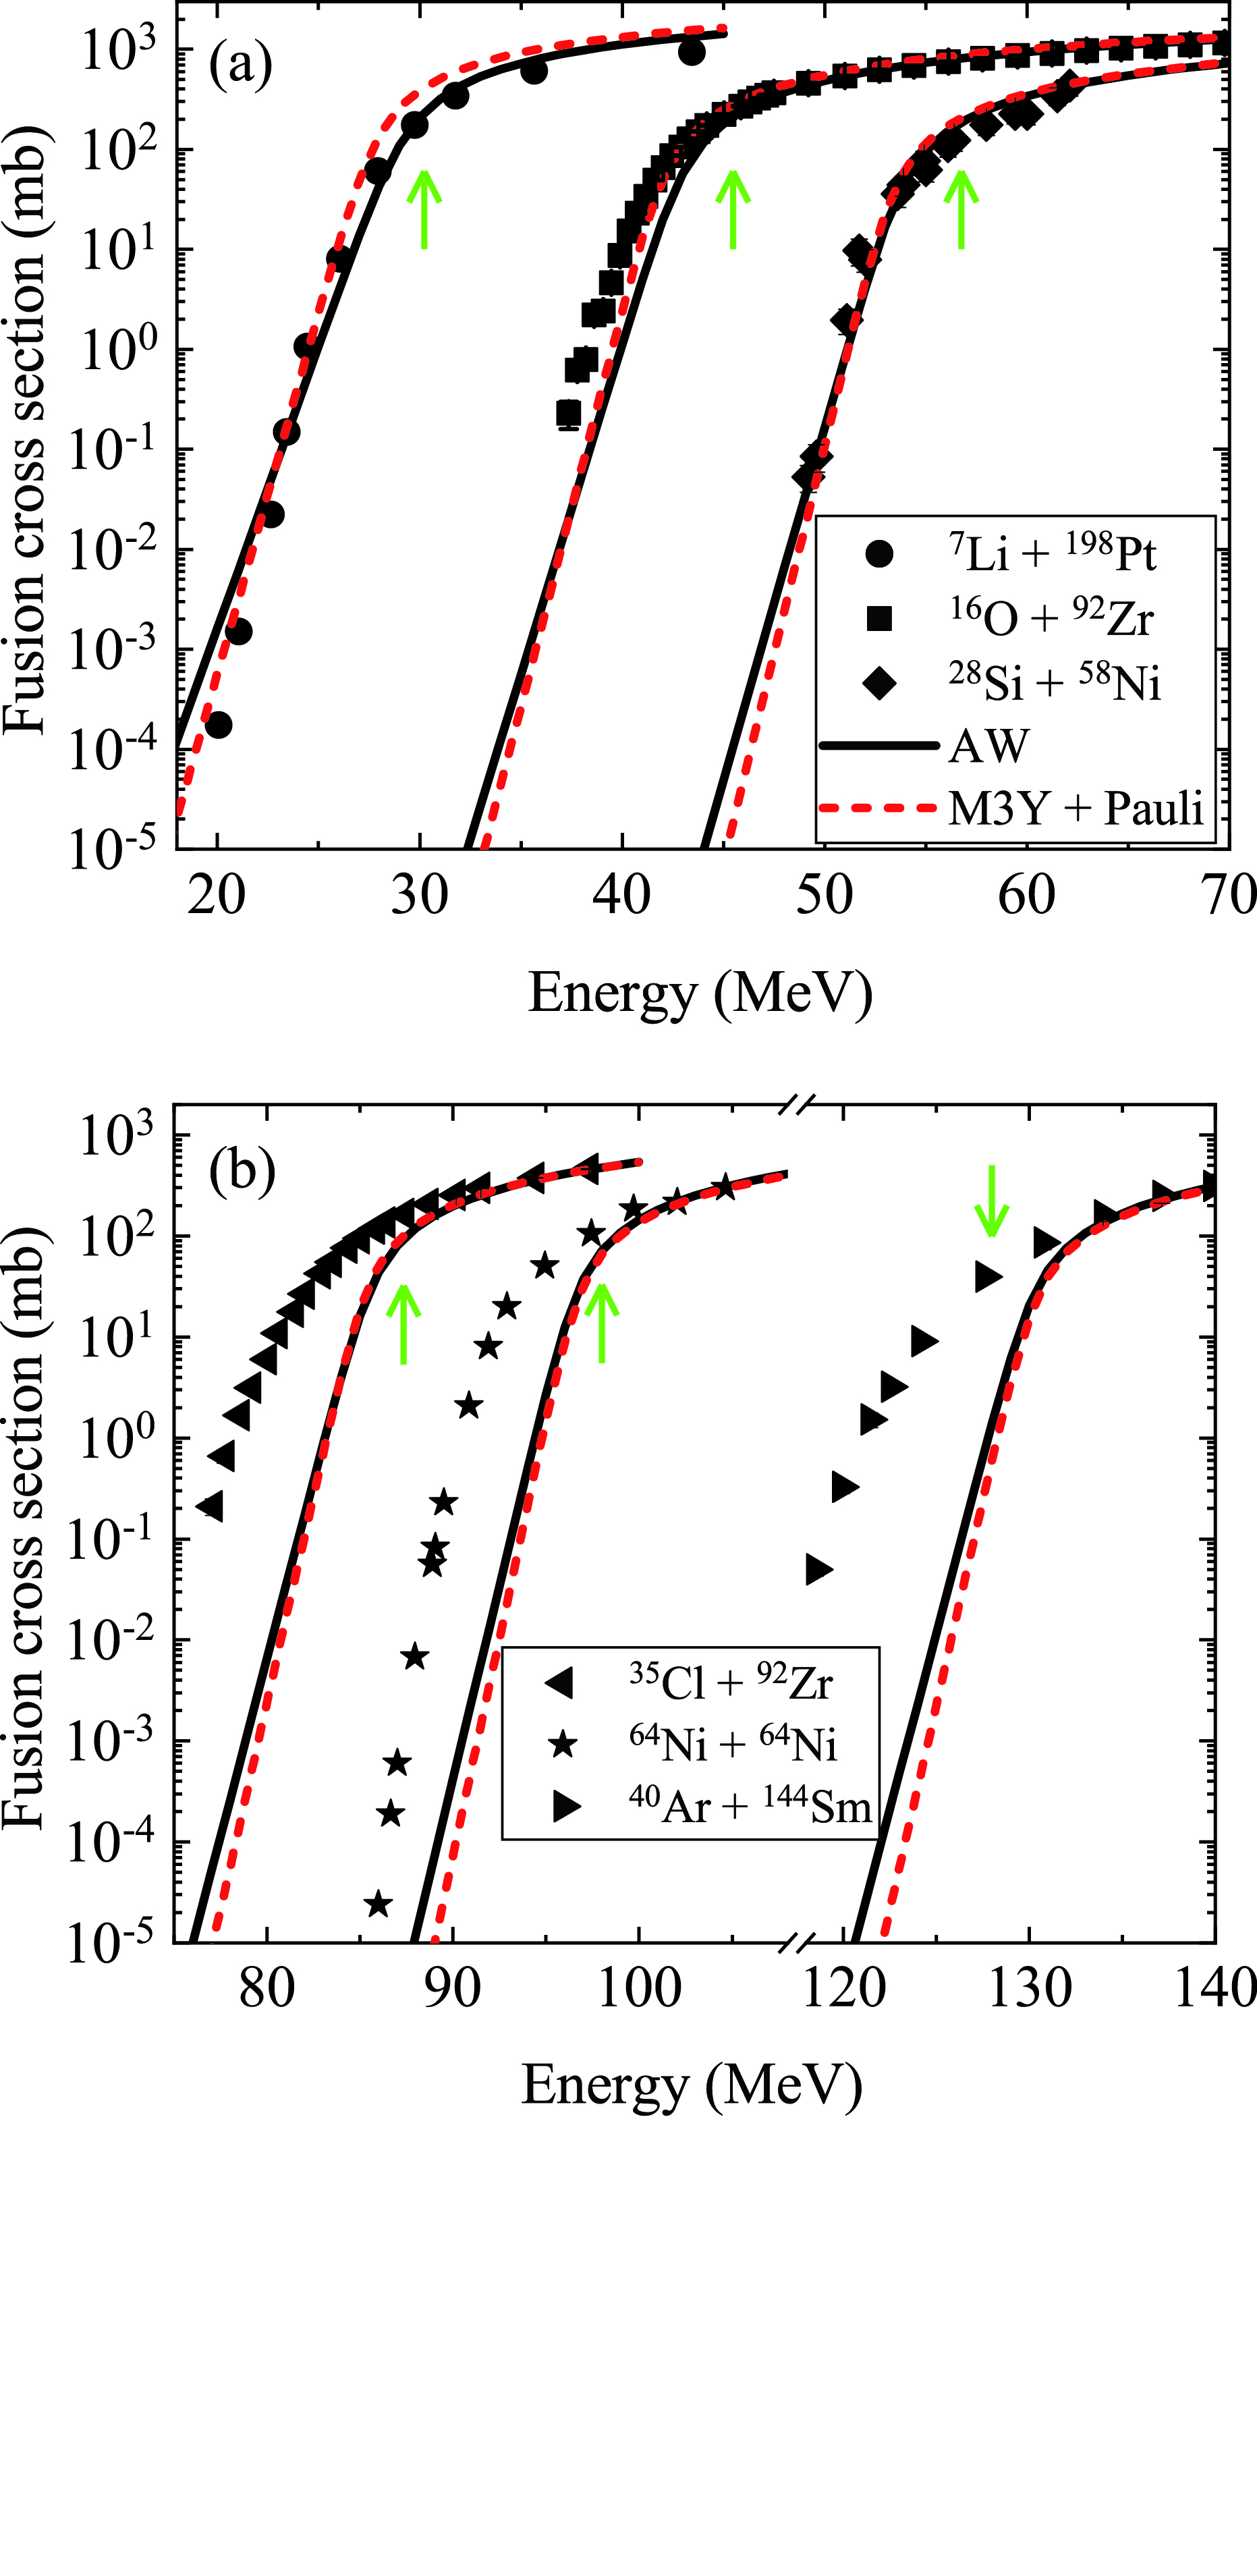
Figure 3. (color online) The fusion cross sections calculated using the AW potential (solid lines) and M3Y + Pauli potential (dashed lines) compared with experimental data for
$ ^{7} $ Li +$ ^{198} $ Pt [64],$ ^{16} $ O +$ ^{92} $ Zr [9],$ ^{30} $ Si +$ ^{58} $ Ni [65],$ ^{35} $ Cl +$ ^{92} $ Zr [9],$ ^{64} $ Ni +$ ^{64} $ Ni [38], and$ ^{40} $ Ar +$ ^{144} $ Sm [66]. The arrows denote the position of the barrier energies for the specified systems.$ \begin{align} \sigma_{\rm fus} = \frac{R_b^2 \hbar \omega}{2E_{\rm c.m.}} \ln \left\{1+\exp \left[\frac{2\pi}{\hbar \omega}(E_{\rm c.m.}-V_b)\right]\right\}, \end{align} $

(10) where
$E_{\rm c.m.}$ is the center-of-mass energy. At above barrier energies, the fusion cross sections calculated with the AW potential and the M3Y + Pauli potential for the considered fusion systems are in good agreement with the experimental data. With decreasing colliding energies, the Wong formula works well for relatively light mass fusion systems, and the calculated cross sections describe the experimental data well, as displayed in Fig. 3(a). For heavy mass fusion systems, such as the reactions$ ^{35} $ Cl +$ ^{92} $ Zr,$ ^{64} $ Ni +$ ^{64} $ Ni, and$ ^{40} $ Ar +$ ^{144} $ Sm in Fig. 3(b), the experimental cross sections are severely underestimated at sub-barrier energies, where the CC and deformation effects play an important role. -
At colliding energies down to the Coulomb barrier, the one-dimensional potential model is unable to describe the fusion process. Additionally, the coupling effects from the vibrational, rotational, and nucleon transfer degrees of freedom must be taken into account. Furthermore, as the colliding energies decrease far below the Coulomb barrier, namely, at deep sub-barrier energies, the experimental fusion cross sections are overestimated by the AW potential (as shown in Fig. 4). This phenomenon, referred to as "fusion hindrance," has generated renewed interest in heavy-ion fusion reactions in recent studies [29, 67-69].
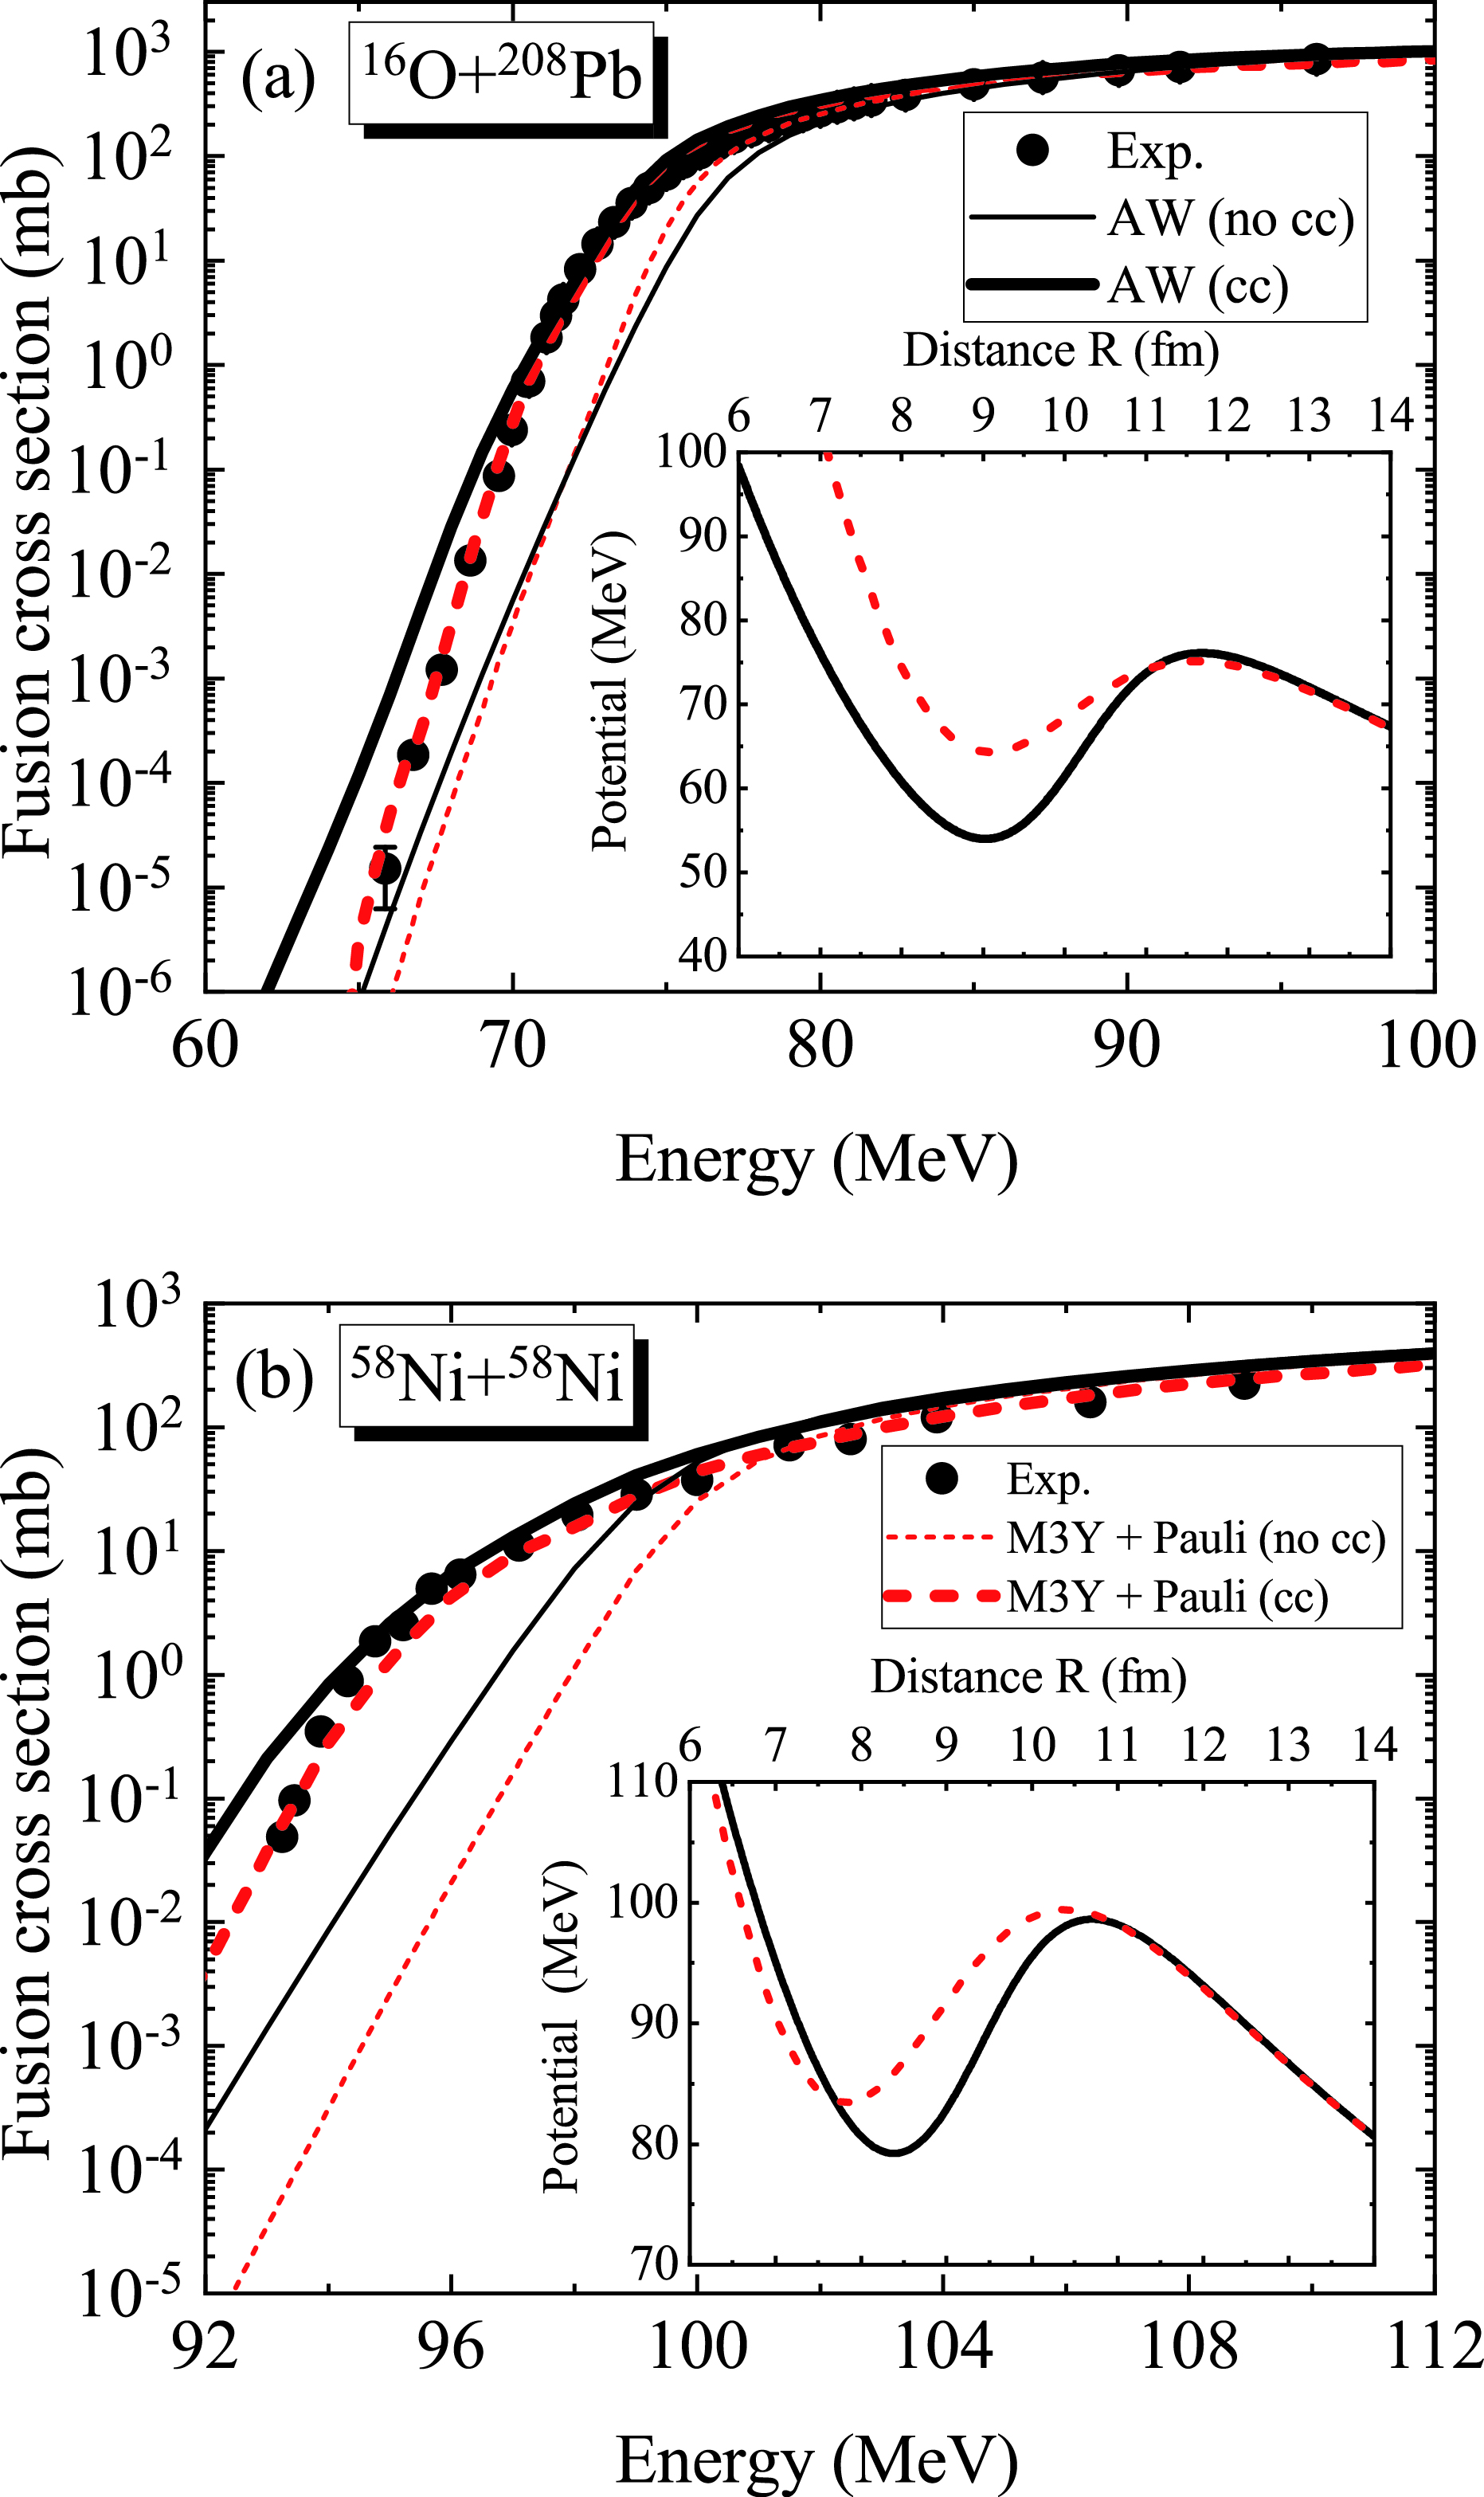
Figure 4. (color online) The experimental fusion cross sections for (a)
$ ^{16} $ O +$ ^{208} $ Pb [67] and (b)$ ^{58} $ Ni +$ ^{58} $ Ni [70] compared to the CC calculations obtained with the AW potential (solid line) and M3Y + Pauli potential (dashed line). The thin solid line and thin dashed line denote the calculated results without CC effects. The inserts display the shape of the total potential obtained from the AW nuclear potential (solid line) and M3Y + Pauli nuclear potential (dashed line).Taking two typical fusion reactions
$ ^{16} $ O +$ ^{208} $ Pb [67] and$ ^{58} $ Ni +$ ^{58} $ Ni [70] as examples, in Fig. 4, the fusion cross sections and total interaction of the AW potential (solid line) and M3Y + Pauli potential (dashed line) are compared. The inserts of Fig. 4 display the shape of the total interaction using the AW nuclear potential (solid line) and M3Y + Pauli nuclear potential (dashed line). In the outer region, the two total potentials exhibit the same behavior, which is dominated by the Coulomb potential. However, as the two colliding nuclei approach each other, the Pauli blocking effect becomes more important owing to the density overlap. Therefore, in the inner region the total potential obtained from the M3Y + Pauli potential exhibits a shallower pocket compared to that of the AW potential. It is noted that the shallow pocket obtained here is derived from the Pauli antisymmetrization effects, which is different from the Pauli repulsive core based on the incompressibility of nuclear matter [23].The fusion cross section is calculated using the CCFULL program [8]. The input parameters for the coupling strengths in the CC calculations are the same as in Ref. [68]. In Fig. 4, the thick and thin lines denote the fusion cross sections with and without considering CC effects, respectively. Compared with the cross sections omitting CC effects, the results with CC effects show an obvious improvement at sub-barrier energies. However, at deep sub-barrier energies, the cross sections of the AW potential overestimate the experimental data. The fusion cross sections calculated with the M3Y+ Pauli potential for the two fusion systems decrease faster with colliding energy and are in better agreement with the experimental data. It is indicated that the Pauli blocking effect in strong density overlapping regions between projectiles and targets at extremely low colliding energies hinders the synthesis of the compound nucleus.
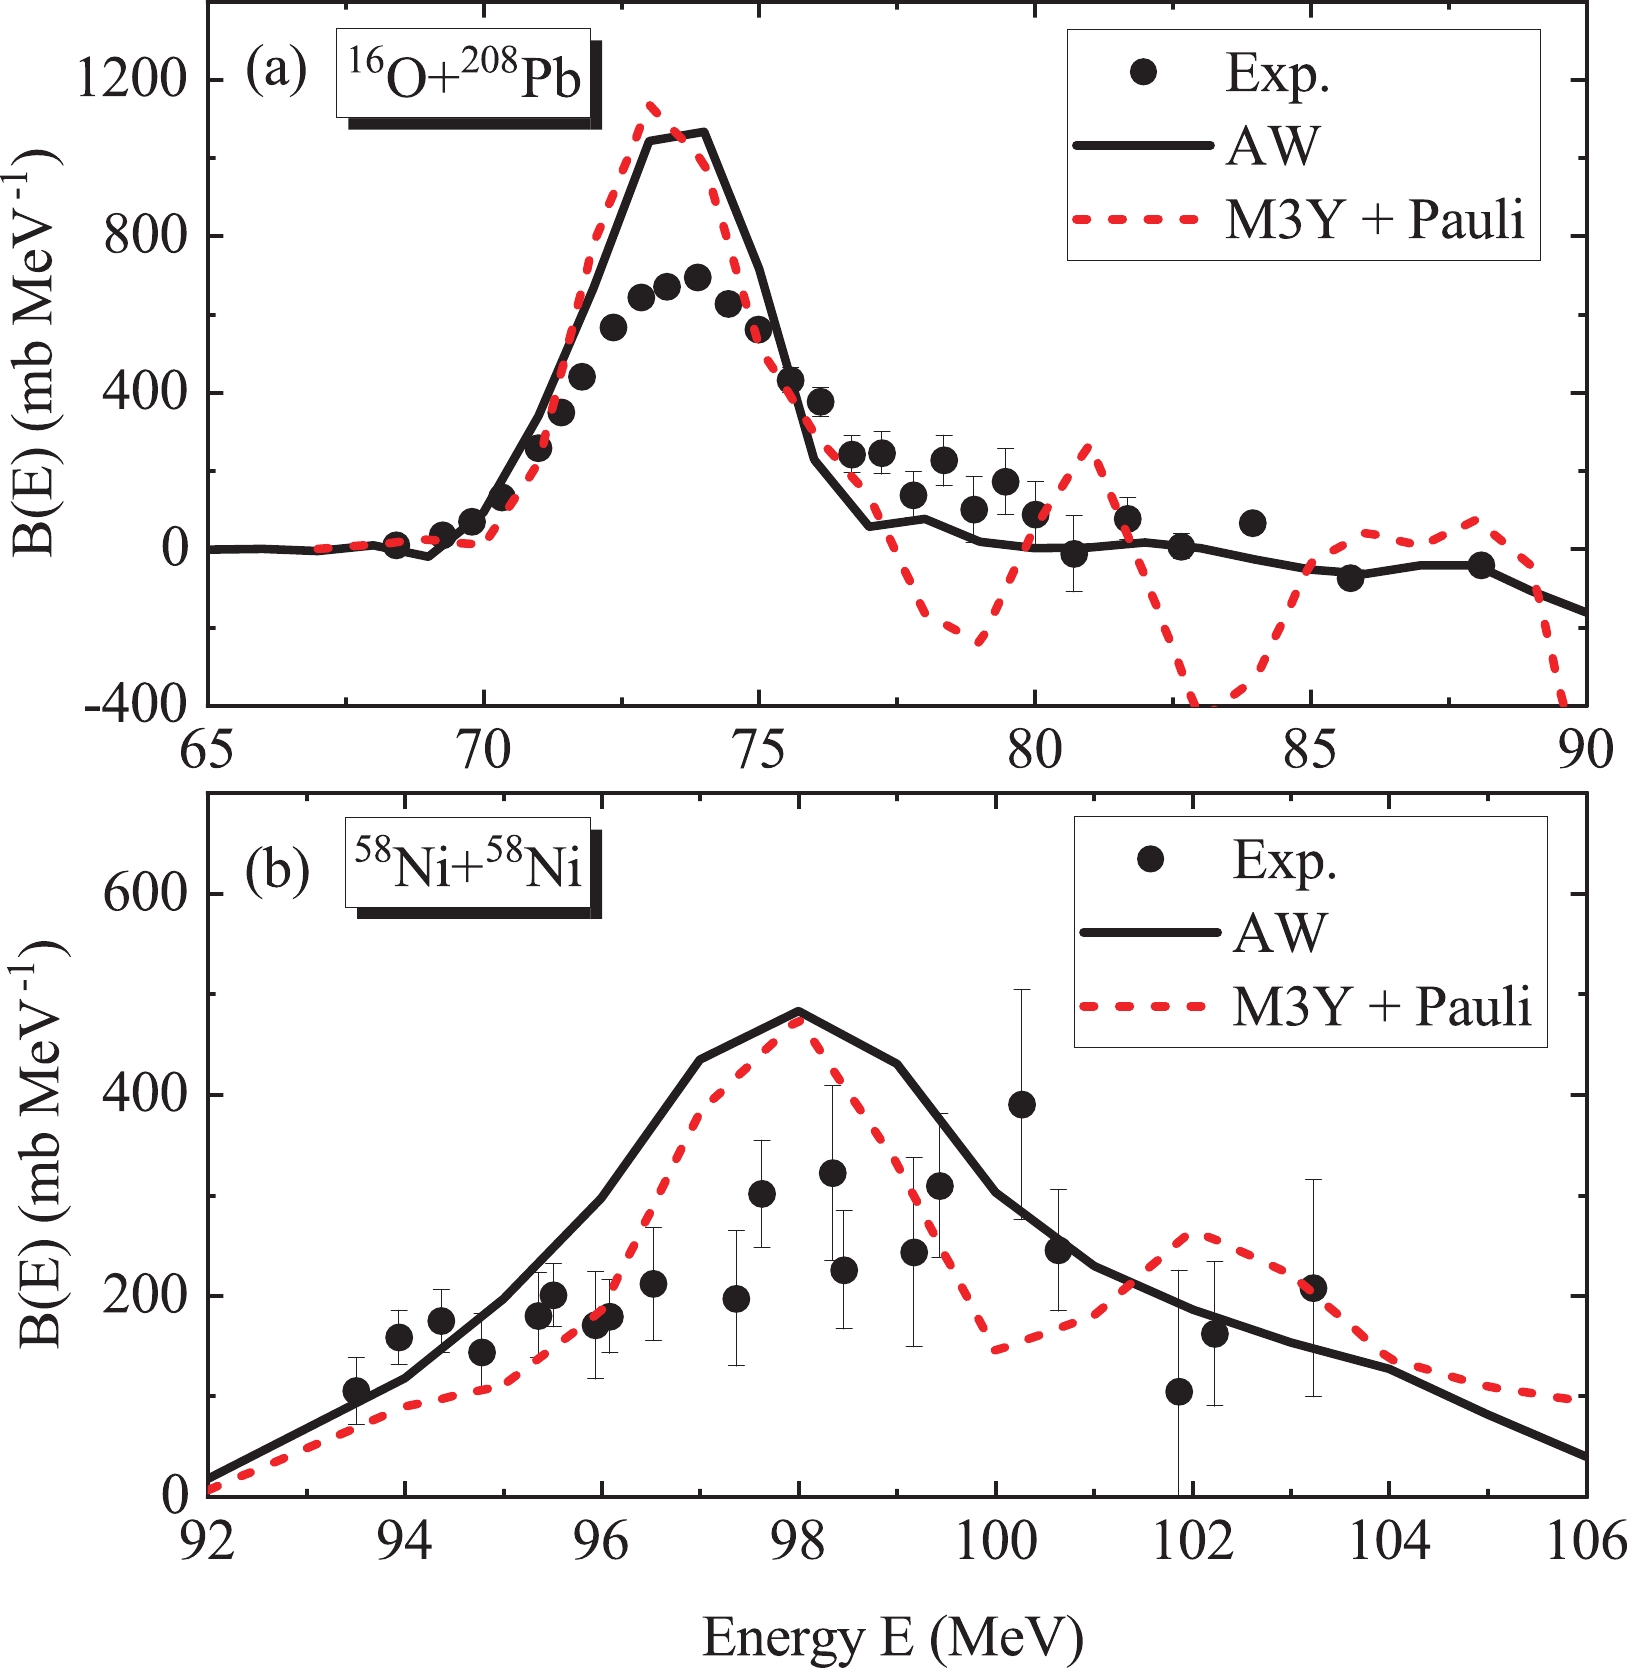
The barrier distribution focusing on the energy dependence of the fusion cross section at energies close to the Coulomb barrier is defined as the second derivative of the energy weighted fusion cross section [71],
$ B(E) = \frac{{\rm d} ^2 (E\sigma_{\rm fus}(E))}{{\rm d} E^2}. $

(11) The barrier distributions calculated from the AW potential and M3Y + Pauli potential are compared in Fig. 5 to the results extracted from experimental data [29, 72]. The theoretical results are extracted from the fusion cross sections with the energy step
$ \Delta E = 1 $ MeV. In Fig. 5, the height and position of the peak of the barrier distribution calculated with and without Pauli blocking effects are almost identical, as the same vibrational states of the nuclei are considered. A difference between the two potentials, seen more clearly in Fig. 5(b), is the width of the peak. A wide Coulomb barrier with a Pauli blocking term leads to a rapid decrease in tunneling probability and brings about a narrower barrier distribution peak. -
Based on the Pauli blocking effect in the
$ \alpha $ -decay of heavy nuclei, the Pauli blocking potential of a single nucleon from the surrounding matter is obtained. The Pauli blocking potential between two colliding nuclei at the density overlap region in fusion reactions is constructed by using a single folding procedure. A total of 95 fusion reactions are investigated using the double folding model with the Pauli blocking potential. It is found that the potential, considering the Pauli blocking effect, is wider (or a lower barrier curvature) and has a shallower pocket compared to that obtained using the Akyüz-Winther potential. At above barrier energies, the fusion process is usually considered to have been completed before the projectile and target touch each other, and the Pauli blocking effects can be ignored. However, at sub-barrier energies, the Pauli blocking potential becomes more important in the inner region of the Coulomb barrier, and the fusion hindrance phenomenon at the lowest colliding energies for$ ^{16} $ O +$ ^{208} $ Pb and$ ^{58} $ Ni +$ ^{58} $ Ni fusion systems are described well by considering the Pauli blocking effect.In this study, the Pauli blocking interaction resulting from the antisymmetrization condition at the overlapping region is applied to heavy-ion fusion reactions. In addition to the Pauli effect, the energy dependence or dissipative effect [24, 25, 67], dynamical density rearrangement (transition from two-nucleus potential to the one-nucleus adiabatic potential) [36, 68], and multinucleon transfer [73-75] may also be involved in the formation of a neck and compound nuclei. It may be interesting to incorporate the effects mentioned above into our future research.
Pauli blocking potential applied to heavy-ion fusion reactions
- Received Date: 2021-09-18
- Available Online: 2022-02-15
Abstract: In this study, the Pauli blocking potential between two colliding nuclei in the density overlapping region is applied to describe the heavy nuclei fusion process. Inspired by the Pauli blocking effect in the


 Abstract
 HTML
HTML Reference
 Related
 PDF
PDF






 DownLoad: