


 Abstract
 HTML
HTML Reference
 Related
 PDF
PDF


-
Nickel plays an important role in the field of nuclear engineering [1-3]. In the MeV neutron energy region, the radiation damage of structural materials due to the α-particles emitted from the (n, α) reactions are non-negligible. The abundances of 58Ni, 60Ni and 61Ni in natural nickel are 68.077%, 26.223% and 1.140%, respectively [4]. Therefore, accurate cross sections of the 58,60,61Ni(n, α)55,57,58Fe reactions in the MeV energy region are important to the safety design for nuclear engineering. Also, measurements of the cross sections of the 58,60,61Ni(n, α)55,57,58Fe reactions can enhance the understanding of nuclear structure and nuclear reaction mechanisms.
For the cross sections of the 58Ni(n, α)55Fe (Q = 2.899 MeV) reaction, the residual nucleus 55Fe is radioactive so the cross section can be measured using the activation method. In the MeV neutron energy region, there are eleven existing measurement results, but most of them were obtained in the region below 8 MeV or around 14 MeV [5-15]. In the 8.50–10.50 MeV region, there are only two measurement data [6, 12] for the 58Ni(n, α)55Fe reaction, and the cross sections of Qaim [12] are higher by ~18% than those of Fessler [6], showing apparent disagreement.
For the cross sections of the 60Ni(n, α)57Fe (Q = 1.355 MeV) and 61Ni(n, α)58Fe (Q = 3.580 MeV) reactions, measurement data are scarce because the activation method is unavailable. In the MeV energy region, for the 60Ni(n, α)57Fe reaction, there are only two measurement data [5, 16], both measured below 8 MeV. For the 61Ni(n, α)58Fe reaction, there is only one measurement datum obtained by our group [5], and this datum was measured below 6 MeV. So, there is no data for the 60Ni(n, α)57Fe and 61Ni(n, α)58Fe reactions in the 8.50–10.50 MeV region.
Thus, experimental data are scarce for all the 58,60,61Ni(n, α)55,57,58Fe reactions in the 8.50–10.50 MeV region. According to the JENDL-4.0 [17] and TENDL-2019 [18] libraries, the cross sections of the 58,60,61Ni(n, α)55,57,58Fe reactions are nearly equal to those of the 58,60,61Ni(n, xα) reactions in the energy region below 11 MeV. So, the cross sections of the (n, xα) reactions can be used as the reference for the analysis of the excitation functions of the (n, α) reactions below 11 MeV. In the 8.50–10.50 MeV energy region, there are six measurement data [19-24] for the 58Ni(n, xα) reaction, four measurement data [21-24] for the 60Ni(n, xα) reaction, and one measurement datum [22] for the 61Ni(n, xα) reaction. Among these data, discrepancies are apparent. Furthermore, most of the experimental data for the 58,60,61Ni(n, xα) reactions are characterized by large uncertainties (>10%).
Because the existing measurement data are either scarce or show discrepancies, deviations among different evaluation libraries are noticeable. For example, in the 8.50–10.50 MeV region, the amount of variation among different evaluation libraries [17, 18, 25-30], are 10.5%, 19.9% and 23.9% for the 58Ni(n, α)55Fe, 60Ni(n, α)57Fe and 61Ni(n, α)58Fe reactions, respectively.
In our previous work, the cross sections of the 58,60,61Ni(n, α)55,57,58Fe reactions in the 4.50
$ \leqslant E{_{\rm n}} \leqslant $ 5.50 MeV region were measured based on the 4.5 MV Van de Graaff accelerator at Peking University (PKU) [5]. In the present work, measurements were extended to the 8.50$ \leqslant E{_{\rm n}} \leqslant $ 10.50 MeV region on the HI-13 tandem accelerator at China Institute of Atomic Energy (CIAE). Details of the experiment are described in section II, data processing and results are presented in section III, theoretical analysis is described in section IV, and the conclusions are drawn in section V. -
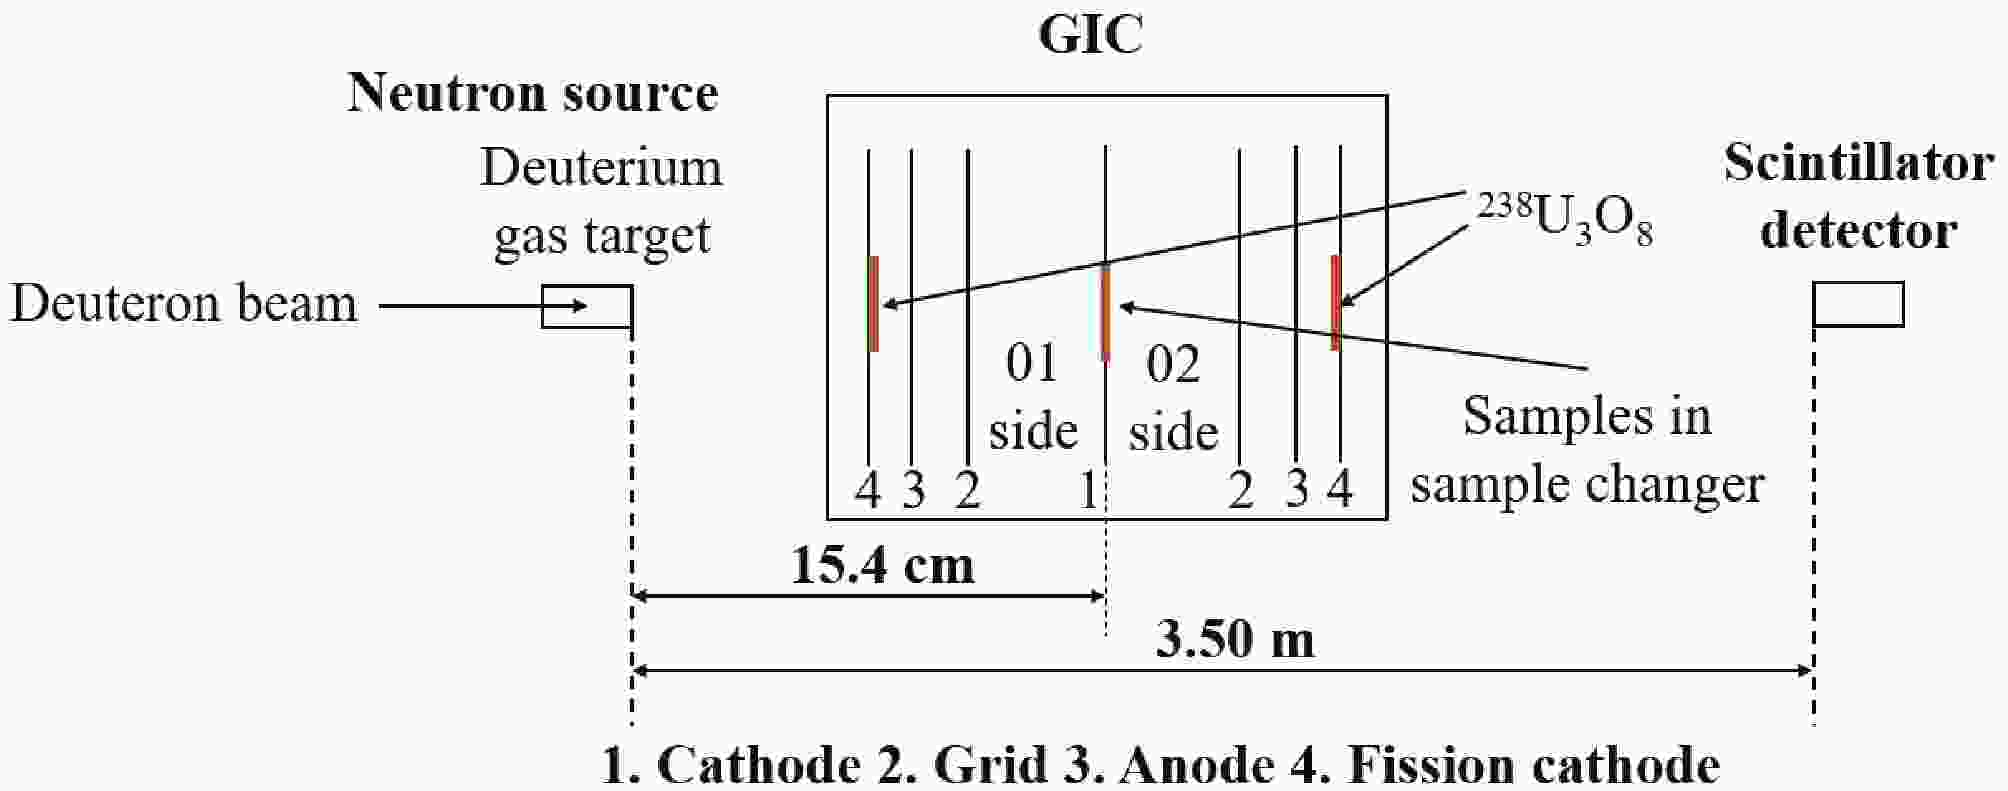
The experiments were performed using the HI-13 tandem accelerator of the China Institute of Atomic Energy (CIAE). The experimental apparatus is shown in Fig. 1, which was similar to the previous measurement [5], except that the scintillator detector was further away from the neutron source because of the strong γ-background from the source.
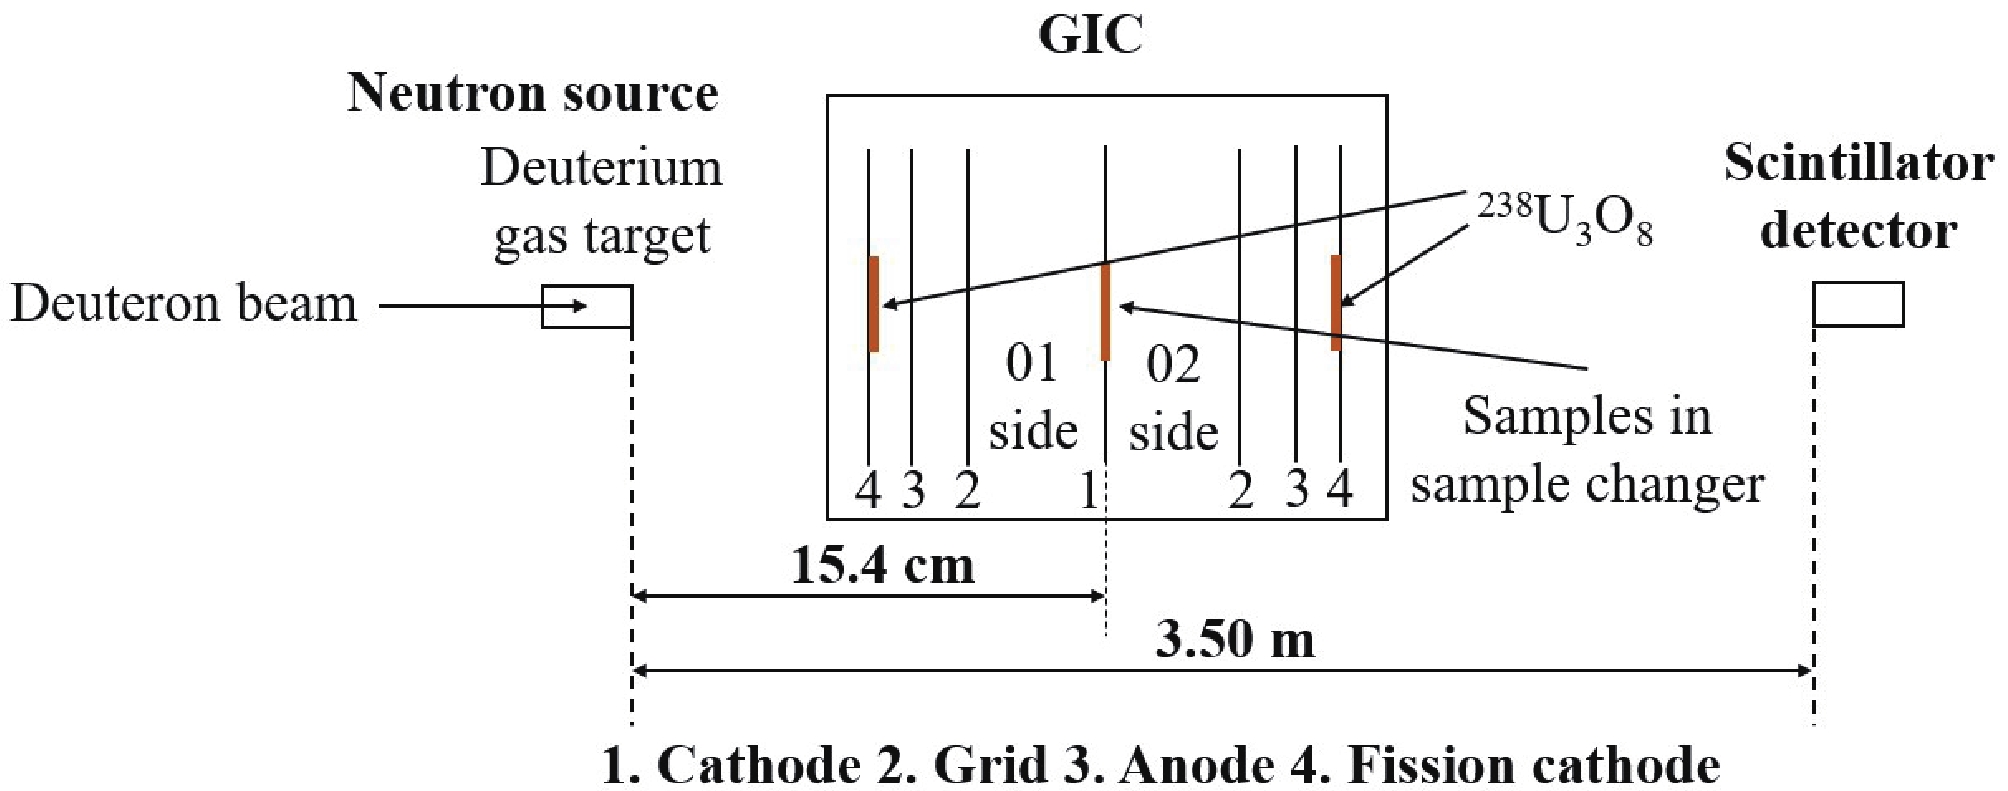
Figure 1. (color online) Schematic drawing of the experimental apparatus.
Through the 2H(d, n)3He reaction, neutrons with kinetic energies of 8.50, 9.50, and 10.50 MeV were generated using the energetic deuteron beam from the accelerator to bombard the deuterium gas target with incident energies of 5.95, 6.91, and 7.90 MeV. The deuteron beam current was about 2.0 μA throughout the measurement. The deuterium gas target was 3.0 cm in length, 1.0 cm in diameter and 3.0 atm in pressure. It was separated from the vacuum tube of the accelerator by a molybdenum foil 10.0 μm in thickness. In addition to the main neutrons, low-energy neutrons will also be generated through the 2H(d, np)2H reaction. To correct for this interference, the neutron energy spectra were measured using an EJ-309 liquid scintillator detector. Unfolding the pulse height spectra measured with the scintillator detector [31], the neutron energy spectra were obtained as shown in Fig. 2.
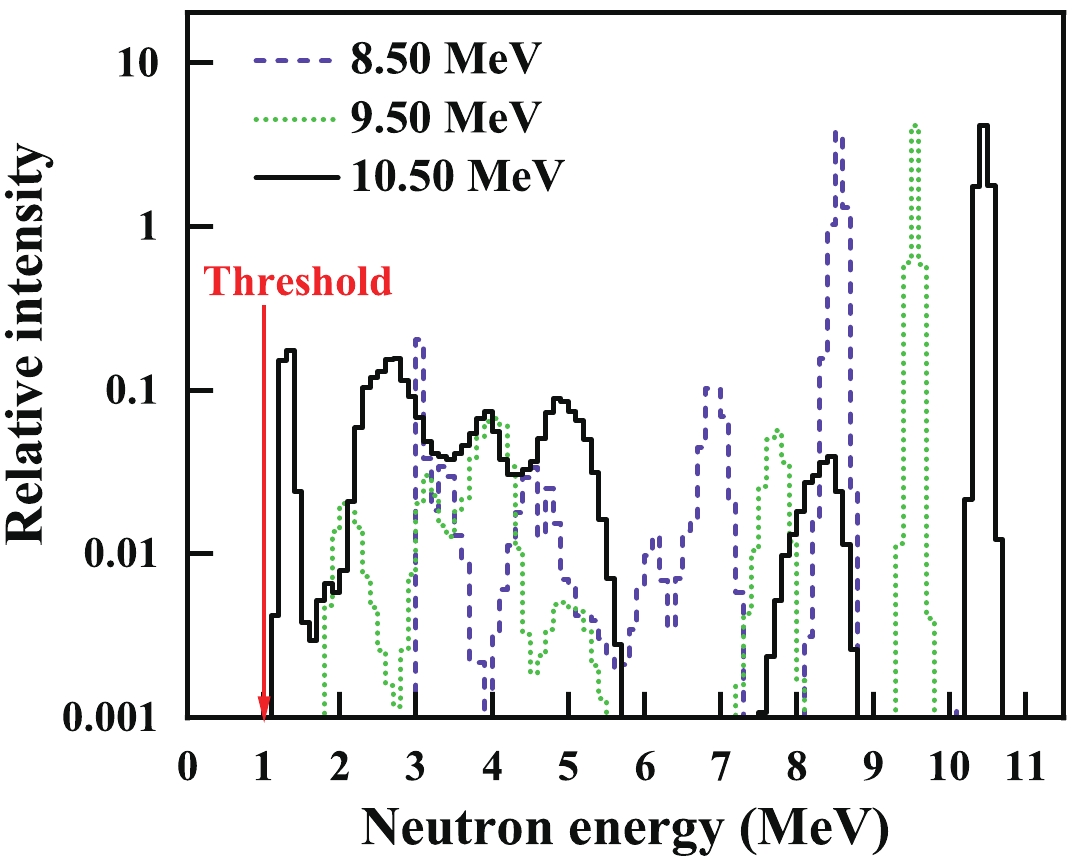
Figure 2. (color online) Measured neutron energy spectra from the EJ-309 liquid scintillator detector.
A twin gridded ionization chamber (GIC) with sides labelled '01 side' and '02 side' was used as the charged particle detector. The working gas of the GIC was Xe + 5.0% H2 with the pressure of 1.161 atm. The high voltages applied on the cathodes and anodes were -1500 V and 750 V, and the grid electrodes were grounded. There is a sample changer at the common cathode of the GIC with five sample positions, on which these samples were mounted: 1) back-to-back compound α-sources for the detection system calibration, 2) 238U3O8#III/Ta samples for the absolute neutron flux measurement, 3) back-to-back 58Ni#II/58Ni#I foil samples for the measurement of the 58Ni(n, α)55Fe reaction (the 58Ni#II sample was broken, so the cross section was obtained using the 58Ni#I sample), 4) back-to-back 60Ni/61Ni foil samples for the measurements of the 60Ni(n, α)57Fe and 61Ni(n, α)58Fe reactions, and 5) Ta/Ta backings for the measurement of the background events. To monitor the relative neutron flux, the 238U3O8#I and 238U3O8#II samples were glued on each of the fission cathode electrodes of the GIC, respectively. Details of the GIC, including the measurement principle, structure and electronics, together with information of the samples, including the isotopic enrichment, thickness, diameter, unevenness and impurity content can be found in Ref. [5].
The 58,60,61Ni(n, α)55,57,58Fe reactions were measured at En = 8.50, 9.50 and 10.50 MeV. For each neutron energy point, measurements were performed with the sample set sequentially at the five sample positions, then the GIC was rotated by 180° and measurements were performed for each sample position again, so that the forward (0°–90°) and the backward (90°–180°) cross sections of the (n, α) reaction could be measured. The experiment was conducted in October 2020, and the total neutron beam duration was ~ 30 h.
-
The data processing procedures are presented in Fig. 3, which were the same as the previous measurements in the 4.50–5.50 MeV range [5] except that the unfolding method for reducing the uncertainty of En was not used in the present work. The uncertainty of the En at CIAE was small enough (<1%) due to the higher energy of the incident deuteron beam, therefore the unfolding method is not necessary.
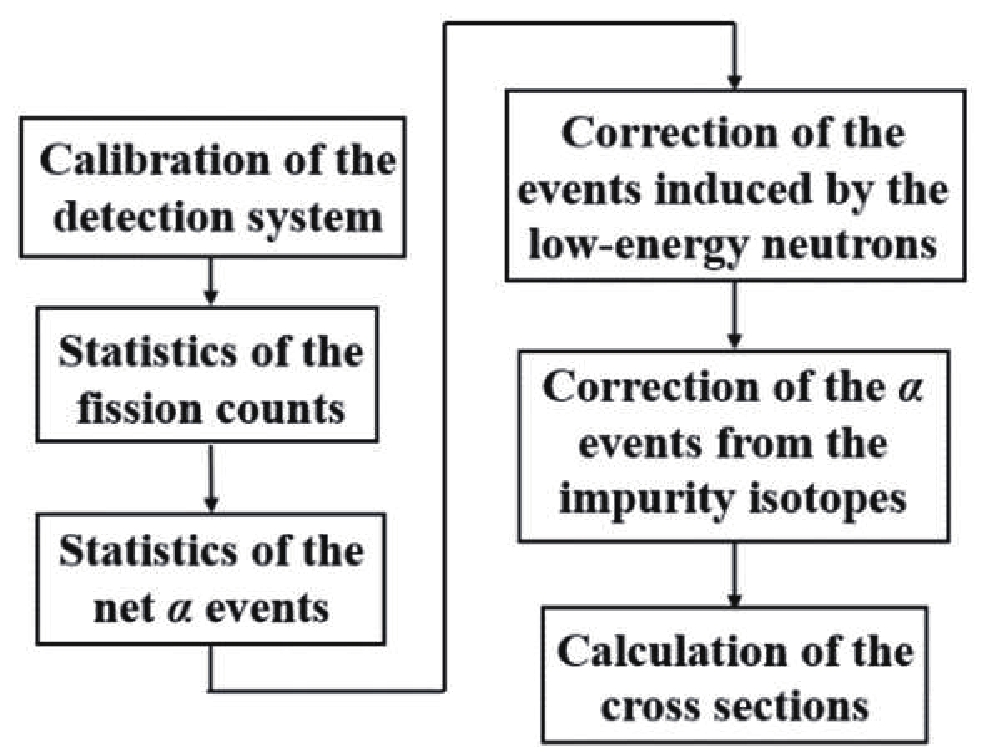
Figure 3. Data processing procedure.
The forward or backward cross sections σα of the (n, α) reactions can be calculated by
$ {\sigma _\alpha }{\text{ }} = {\sigma _f} \cdot \frac{{{N_{\text{U}}} \cdot {N_\alpha } \cdot {\varepsilon _f} \cdot {\rho ^{{\rm low}}} \cdot (1 - {k^{{\text{impurity}}}})}}{{{N_{{\text{Ni}}}} \cdot {N_f} \cdot {\varepsilon _\alpha } \cdot G \cdot {C^{{{f}}\_{\rm fission}}}}} , $

(1) where σf is the standard cross section of the 238U(n, f) reaction [32]. NU and NNi are the numbers of the 238U and 58,60,61Ni nuclei in the samples, respectively. Nα is the count of the net α events within the threshold in the anode projection spectrum after the valid-event-area determination in the cathode–anode two-dimensional spectrum and background subtraction. A typical cathode–anode two-dimensional spectrum and an anode projection spectrum are shown in Fig. 4 (a) and (b), respectively. Nf is the count of the fission events within the threshold in the fission anode projection spectrum as shown in Fig. 5. εα and εf are the detection efficiencies for the α particles from the 58,60,61Ni(n, α)55,57,58Fe reactions and fission fragments from the 238U(n, f) reaction at the specific neutron energy, respectively. ρlow is the correction coefficient of the α and fission events induced by the low-energy neutrons. kimpurity is the correction coefficient of the α events from the nickel and oxygen impurity isotopes. G is the ratio of the average neutron flux in the area of nickel sample to that of the 238U3O8#III sample area at the sample changer. Cf_fission is the ratio of the fission counts from the 238U3O8#I or 238U3O8#II sample glued on the fission cathode during the foreground measurement to that during the absolute neutron flux measurement. εα, εf, ρlow, kimpurity and G were obtained using simulation methods; whose details can be found in Ref. [5]. Values of the parameters in Eq. (1) for the three reactions are presented in Tables 1–3.
Parameters Values En = 8.50 MeV En = 9.50 MeV En = 10.50 MeV NU 1.872×10¹⁹ a, b 1.872×10¹⁹ a, b 1.872×10¹⁹ a, b NNi 9.526×10¹⁹ a, b 9.526×10¹⁹ a, b 9.526×10¹⁹ a, b σf /mb 1015.0 a, b 1013.5 a, b 1009.5 a, b Nα 6890 a
5976 b7260 a
6927 b11335 a
7867 bNf 16366 a
14085 b17128 a
16801 b20307 a
19284 bρlow 1.031 a
1.026 b1.097 a
1.030 b1.154 a
1.150 bεf (%) 82.62 a
84.23 b81.18 a
83.26 b81.40 a
83.25 bεα (%) 93.97 a
91.49 b87.05 a
94.06 b89.05 a
93.02 bG 1.007 a
1.002 b1.010 a
0.999 b1.007 a
1.000 bkimpurity 0.007 a
0.006 b0.021 a
0.008 b0.096 a
0.007 ba For the forward cross section. b For the backward cross section. Table 2. Values of the parameters in Eq. (1) for the 60Ni(n, α)57Fe reaction.
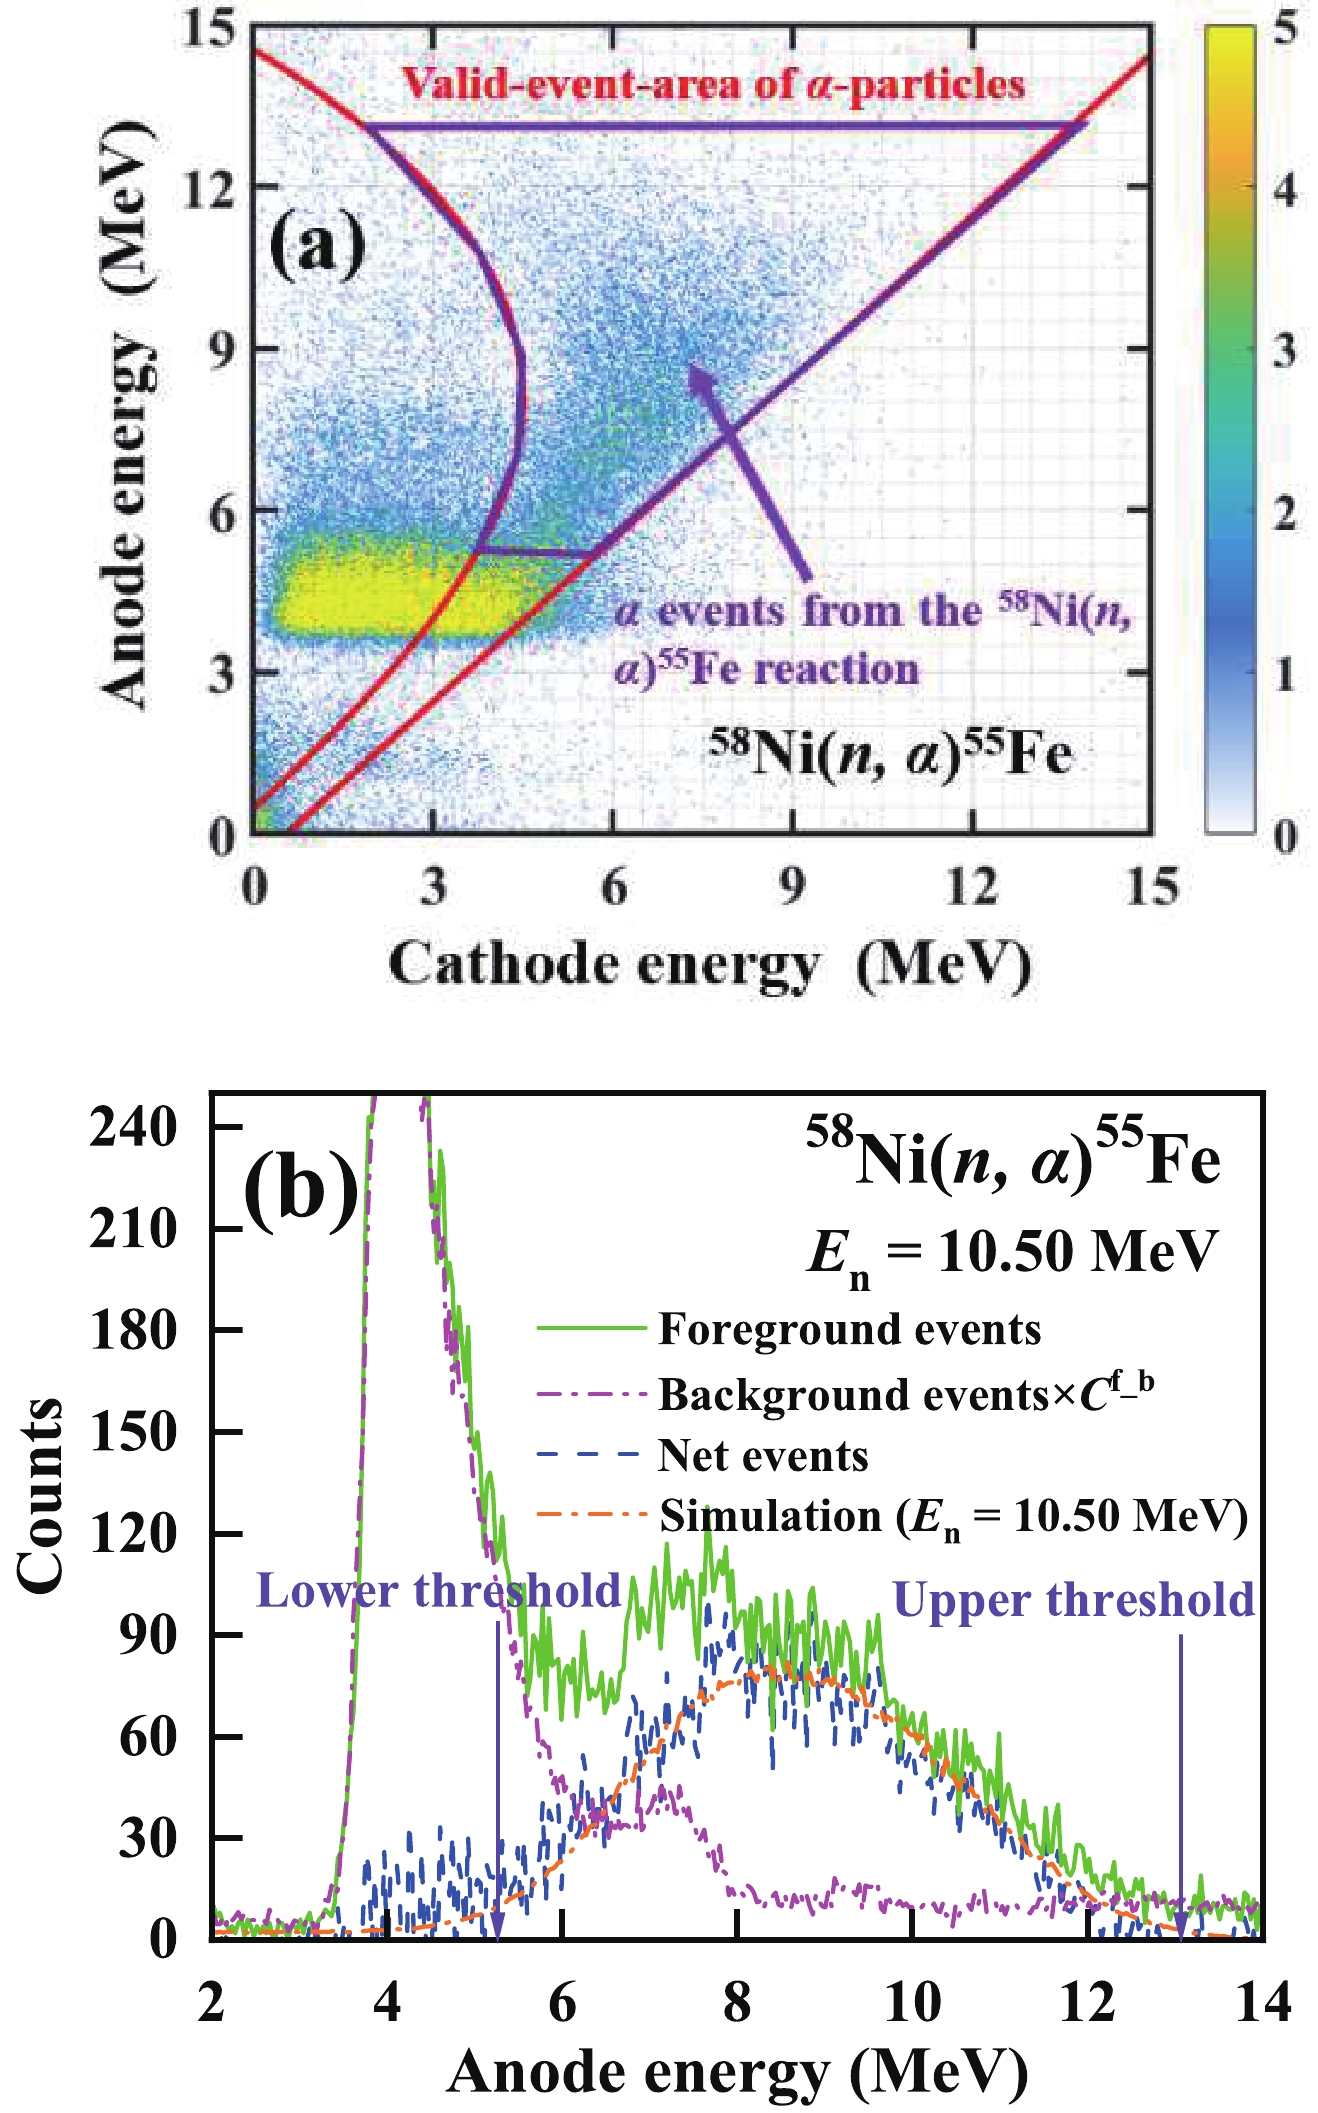
Figure 4. (color online) (a) Cathode–anode two-dimensional spectrum of the foreground events (the area between the red line is the valid-event-area of α particles determined using the two-dimensional spectrum obtained from the α sources). (b) Anode projection spectrum of the foreground, background and net events together with the simulated spectrum for the measurement of the 58Ni(n, α)55Fe reaction in the forward direction at En = 10.50 MeV.
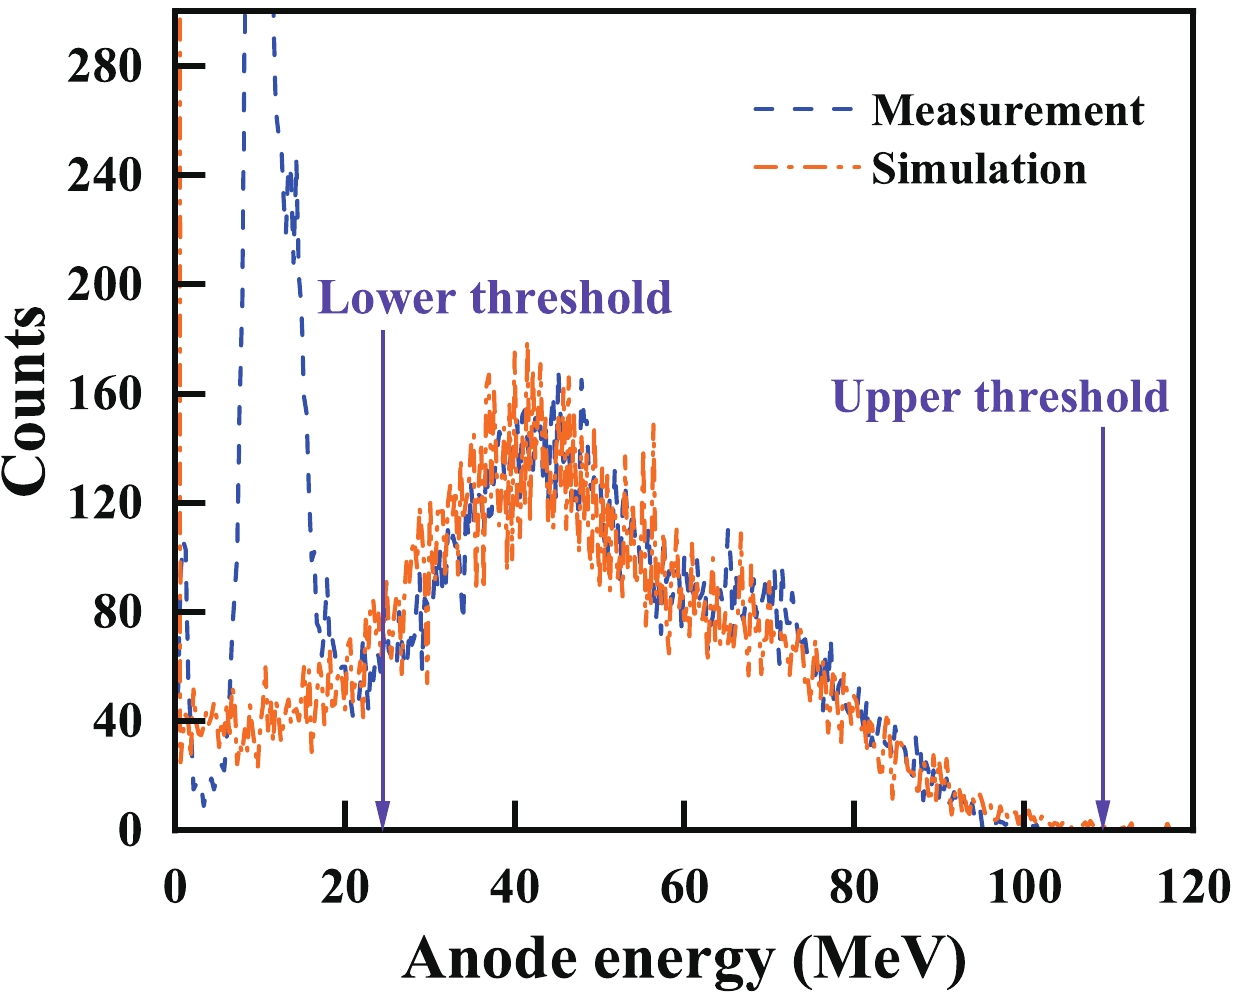
Figure 5. (color onlne) Anode spectrum of the fission fragments for the absolute neutron flux measurement at En = 10.50 MeV.
Parameters Values En = 8.50 MeV En = 9.50 MeV En = 10.50 MeV NU 1.872×10¹⁹ a, b 1.872×10¹⁹ a, b 1.872×10¹⁹ a, b NNi 1.039×10²⁰ a b 9.526×10¹⁹ a b 4.883×10¹⁹ a b σf /mb 1015.0 a b 1013.5 a b 1009.5 a b Nα 4764 a
4768 b4570 a
6221 b9592 a
8401 bNf 14085 a
16366 b16801 a
17128 b19284 a
20307 bρlow 1.009 a
1.008 b1.058 a
1.048 b1.010 a
1.080 bεf (%) 84.23 a
82.62 b83.26 a
81.18 b83.25 a
81.40 bεα (%) 90.01 a
92.81 b89.45 a
93.48 b92.30 a
88.02 bG 1.012 a
1.006 b1.008 a
1.006 b1.004 a
1.009 bkimpurity ~ 0 a, b ~ 0 a, b ~ 0 a, b a For the forward cross section. b For the backward cross section. Table 1. Values of the parameters in Eq. (1) for the 58Ni(n, α)55Fe reaction.
Parameters Values En = 8.50 MeV En = 9.50 MeV En = 10.50 MeV NU 1.872×10¹⁹ a, b 1.872×10¹⁹ a, b 1.872×10¹⁹ a, b NNi 4.883×10¹⁹ a, b 4.883×10¹⁹ a, b 4.883×10¹⁹ a, b σf /mb 1015.0 a, b 1013.5 a, b 1009.5 a, b Nα 2155 a
1937 b2556 a
2191 b3343 a
3091 bNf 14085 a
16366 b16801 a
17128 b19284 a
20307 bρlow 1.024 a
1.023 b1.031 a
1.075 b1.139 a
1.124 bεf (%) 84.23 a
82.62 b83.26 a
81.18 b83.25 a
81.40 bεα (%) 94.88 a
92.60 b91.18 a
90.35 b93.02 a
85.58 bG 1.010 a
0.994 b0.999 a
1.002 b1.007 a
1.005 bkimpurity 0.1724 a
0.1768 b0.1607 a
0.1600 b0.1573 a
0.1445 ba For the forward cross section. b For the backward cross section. Table 3. Values of the parameters in Eq. (1) for the 61Ni(n, α)58Fe reaction.
-
Using Eq. (4), the forward and backward cross sections of the 58Ni(n, α)55Fe, 60Ni(n, α)57Fe and 61Ni(n, α)58Fe reactions can be calculated. Total (n, α) cross section can be acquired by adding the forward cross section and backward one together. Sources of uncertainty and their magnitudes are presented in Table 4. The measured cross sections of the three reactions are shown in Tables 5–7 and Fig. 6 (a) – (c).
Source Magnitude (%) 58Ni(n, α)55Fe 60Ni(n, α)57Fe 61Ni(n, α)58Fe NU 1.0 a, b 1.0 a, b 1.0 a, b NNi 1.0 a, b 5.0 a, b 1.0 a, b σf 1.4 – 1.5 a, b 1.4 – 1.5 a, b 1.4 – 1.5 a, b Nα 2.1 – 3.8 a, 2.7 – 6.5 b 2.8 – 5.3 a, 4.6 – 8.2 b 6.4 – 8.4 a, 10.2 – 13.9 b Nf 0.7 – 0.9 a, b 0.7 – 0.9 a, b 0.7 – 0.9 a, b ρlow 2.7 – 3.3 a, 2.8 – 4.6 b 4.4 – 4.6 a, 4.0 – 4.6 b 4.4 – 5.3 a, 4.0 – 4.8 b εf 2.0 – 2.5 a, b 2.0 – 2.5 a, b 2.0 – 2.5 a, b εα 2.6 – 3.5 a, 2.2 – 4.0 b 3.0 – 6.5 a, 3.0 – 4.5 b 1.7 – 2.9 a, 2.5 – 4.8 b G 0.5 – 1.3 a, b 0.5 – 1.6 a, b 0.5 – 1.9 a, b kimpurity ~ 0 0.1 – 4.6 a, < 0.2 b 3.0 – 3.1 a, 3.1 – 3.2 b σα 6.0 – 6.5 a, 5.6 – 9.5 b
5.9 – 7.8 c7.2 – 10.7 a, 8.3 – 10.3 b
7.7 – 9.6 c9.9 – 10.7 a, 12.3 – 16.0 b
11.0 – 12.9 cEn 0.7 – 0.9 a, b 0.7 – 0.9 a, b 0.7 – 0.9 a, b a For the forward cross section. b For the backward cross section. c For the total (n, α) cross section. Table 4. Sources of uncertainty and their magnitudes.
En/MeV Cross section/mb Forward/backward ratio Measurement Calculation Measurement Calculation 8.50 ± 0.07 73.4 ± 4.3 76.4 1.22 ± 0.10 1.08 9.50 ± 0.08 72.6 ± 4.4 76.3 1.10 ± 0.09 1.17 10.50 ± 0.08 75.7 ± 5.9 77.0 1.16 ± 0.13 1.25 Table 5. Measured 58Ni(n, α)55Fe cross sections and forward/backward ratios in the laboratory reference system (results obtained from the 58Ni#I sample) compared with TALYS-1.9 [33] calculations using the adjusted input parameters.
En/MeV Cross section/mb Forward/backward ratio Measurement Calculation Measurement Calculation 8.50 ± 0.07 32.6 ± 2.5 33.7 1.06 ± 0.11 1.08 9.50 ± 0.08 33.2 ± 3.0 34.5 1.18 ± 0.16 1.10 10.50 ± 0.08 33.3 ± 3.2 34.8 1.27 ± 0.18 1.15 Table 6. Measured 60Ni(n, α)57Fe cross sections and forward/backward ratios in the laboratory reference system compared with TALYS-1.9 [33] calculations using the adjusted input parameters.
En/MeV Cross section/mb Forward/backward ratio Measurement Calculation Measurement Calculation 8.50 ± 0.07 16.5 ± 2.0 18.1 1.18 ± 0.21 1.10 9.50 ± 0.07 18.0 ± 2.0 18.5 1.12 ± 0.18 1.16 10.50 ± 0.08 19.7 ± 2.5 19.6 1.09 ± 0.21 1.26 Table 7. Measured 61Ni(n, α)58Fe cross sections and forward/backward ratios in the laboratory reference system compared with TALYS-1.9 [33] calculations using the adjusted input parameters.
-
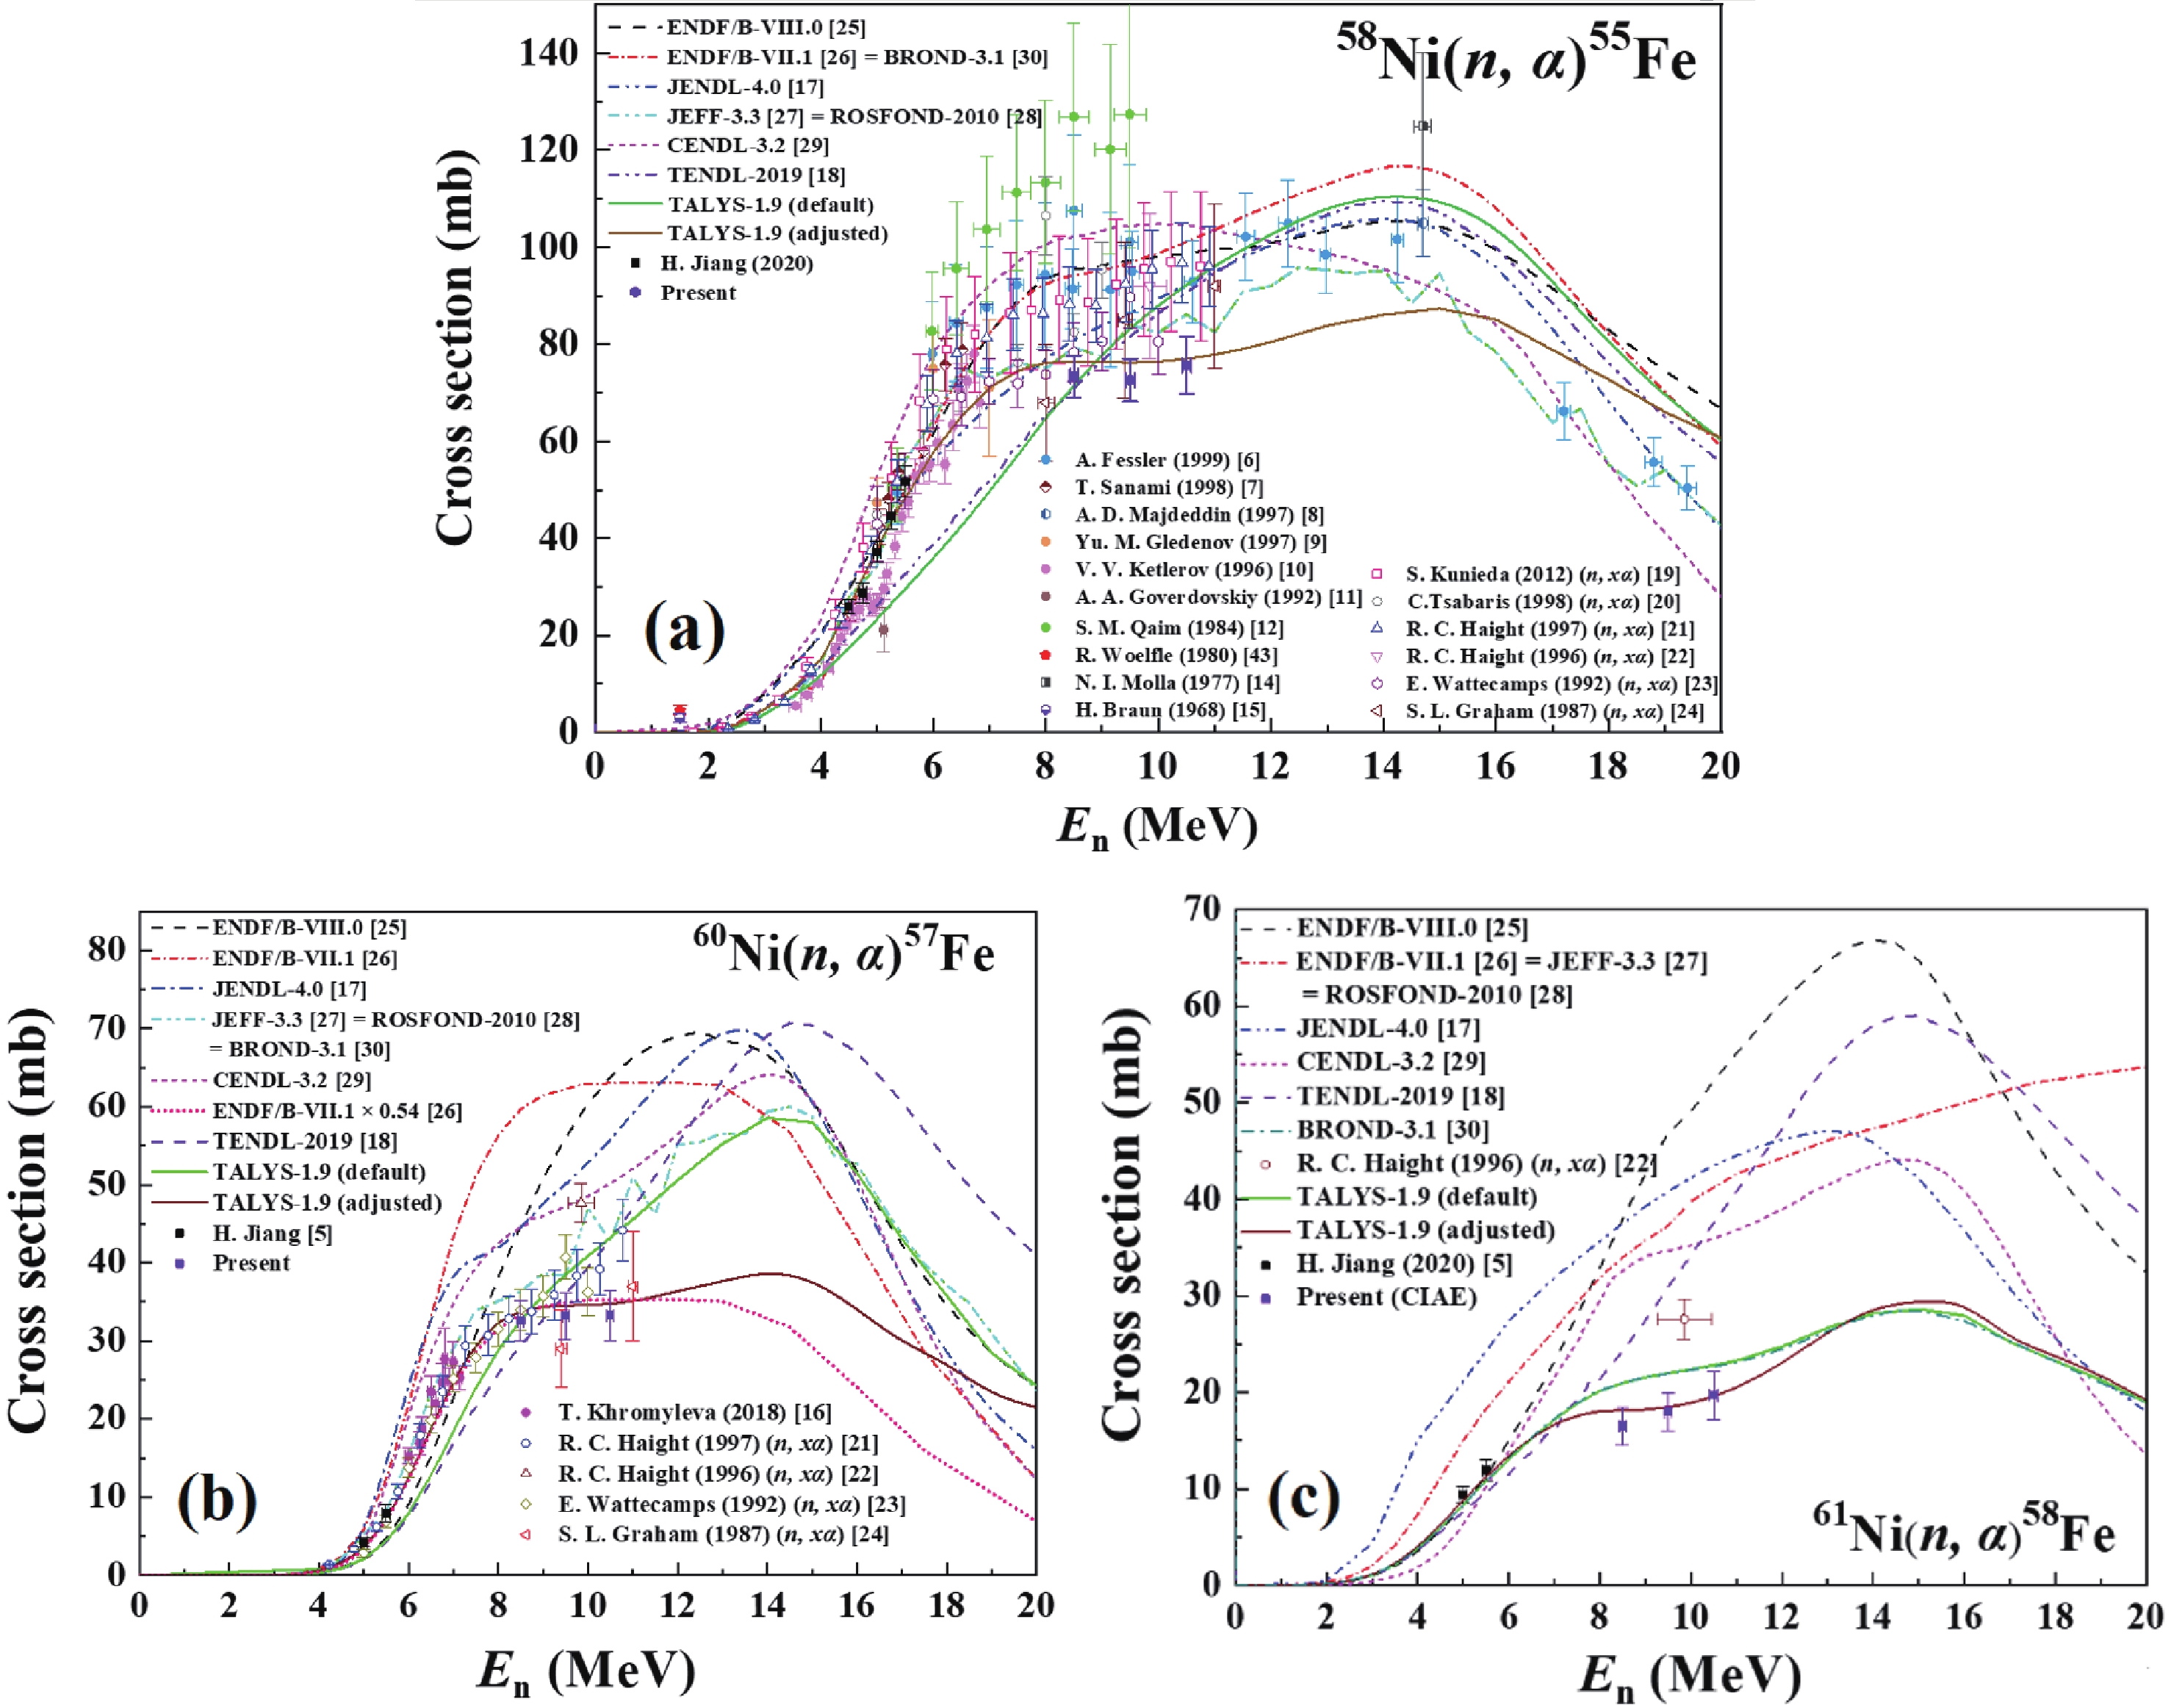
As Fig. 6 (a) – (c) show, the present reaction cross sections were compared with the data from different evaluations [17, 18, 25-30], as well as existing measurement data of the 58,60,61Ni(n, α)55,57,58Fe reactions and the 58,60,61Ni(n, xα) reactions below 11 MeV [5-16, 19-24]. The three reactions are discussed as following:
1) For the 58Ni(n, α)55Fe reaction, compared with different evaluations, the present results are lower by 8.1%–28.8% [17, 18, 25-30]. In the 8.50
$ \leqslant E{_{\rm n}}\leqslant $ 10.50 MeV region, the present results show that the change of cross section of the 58Ni(n, α)55Fe reaction with the increasing of En is quite small, and the ENDF/B-VII.1 [26] evaluation shows the similar trend.Compared with existing measurements, the present cross sections in the 8.50
$ \leqslant E{_{\rm n}} \leqslant $ 10.50 MeV region are close to the experimental data of S. L. Graham (1987, 5.0–14.0 MeV, (n, xα)) [24] and E. Wattecamps (1992, 8.0–11.0 MeV, (n, xα)) [23] within the error range. However, the present cross sections are 42.6% and 25.9% lower than the results of S. M. Qaim (1984, 5.36–9.49 MeV) [12] and Fessler (1999, 5.36–19.4 MeV) [6]. Both Qaim [12] and Fessler [6] used the activation method, but their measurement data were characterized by large uncertainties due to the small counts and low energy of the X-ray (Kα = 5.89 keV and Kβ = 6.49 keV) of the activation product 55Fe (T1/2 = 2.7 yr). Average uncertainties of the results of Qaim [12] and Fessler [6] are 15.8 % and 11.7 %, respectively, while that of the present result is 6.6%.Also, the present cross sections are 19.9%, 20.2%, and 20.6% lower than the experimental data of R. C. Haight (1996, 9.85 MeV, (n, xα)) [22], R. C. Haight (1997, 2.0–48.5 MeV, (n, xα)) [21], and S. Kunieda (2012, 1.7–25.0 MeV, (n, xα)) [19], respectively. The three existing measurements were all carried out using the α-particle counting method. Average uncertainties of these three results are 16.3%, 8.5%, and 14.6% which are greater than that of the present results.
2) For the 60Ni(n, α)57Fe reaction, compared with different evaluations [17, 18, 25-30], the present results are lower by 3.8%–46.4%. The present results show that the cross section of the 60Ni(n, α)57Fe reaction are nearly invariable with the increasing of En in the 8.50
$ \leqslant E{_{\rm n}} \leqslant $ 10.50 MeV region, which is similar to the trend of the ENDF/B-VII.1 [26] evaluation. As shown in Fig. 6 (b), the present results in the 8.50$ \leqslant E{_{\rm n}} \leqslant $ 10.50 MeV region together with the data measured by our group in the 5.00$ \leqslant E{_{\rm n}} \leqslant $ 5.50 MeV region [5] agree well with the evaluation results of the ENDF/B-VII.1 [26] library multiplied by the coefficient of 0.54.Compared with existing measurements, the present cross sections in the 8.50
$ \leqslant E{_{\rm n}} \leqslant $ 10.50 MeV region agree well with the measurement data of S. L. Graham (1987, 5.0–14.0 MeV, (n, xα)) [24] and E. Wattecamps (1992, 8.0–11.0 MeV, (n, xα)) [23] within the error range.R. C. Haight has measured the cross sections of the 60Ni(n, α)57Fe reaction in 1996 [22] and 1997 [21], yet his data in 1997 are ~20% lower than those in 1996. Compared with the data of his two measurements, the present cross sections are close to his data measured in 1997.
3) For the 61Ni(n, α)58Fe reaction, compared with different evaluations, the present results are lower by 17.5%–60.1% [17, 18, 25-30]. In the 8.50
$ \leqslant E{_{\rm n}} \leqslant $ 10.50 MeV region, the present results show that the cross section of the 61Ni(n, α)58Fe reaction grows gradually with the increasing of En, which is similar to the trend of evaluations of the CENDL-3.2 [29] and BROND-3.1 [30] libraries. The present cross sections are lower by 13.9% than the experimental data of R. C. Haight (1996, 9.85 MeV, (n, xα)) [22]. -
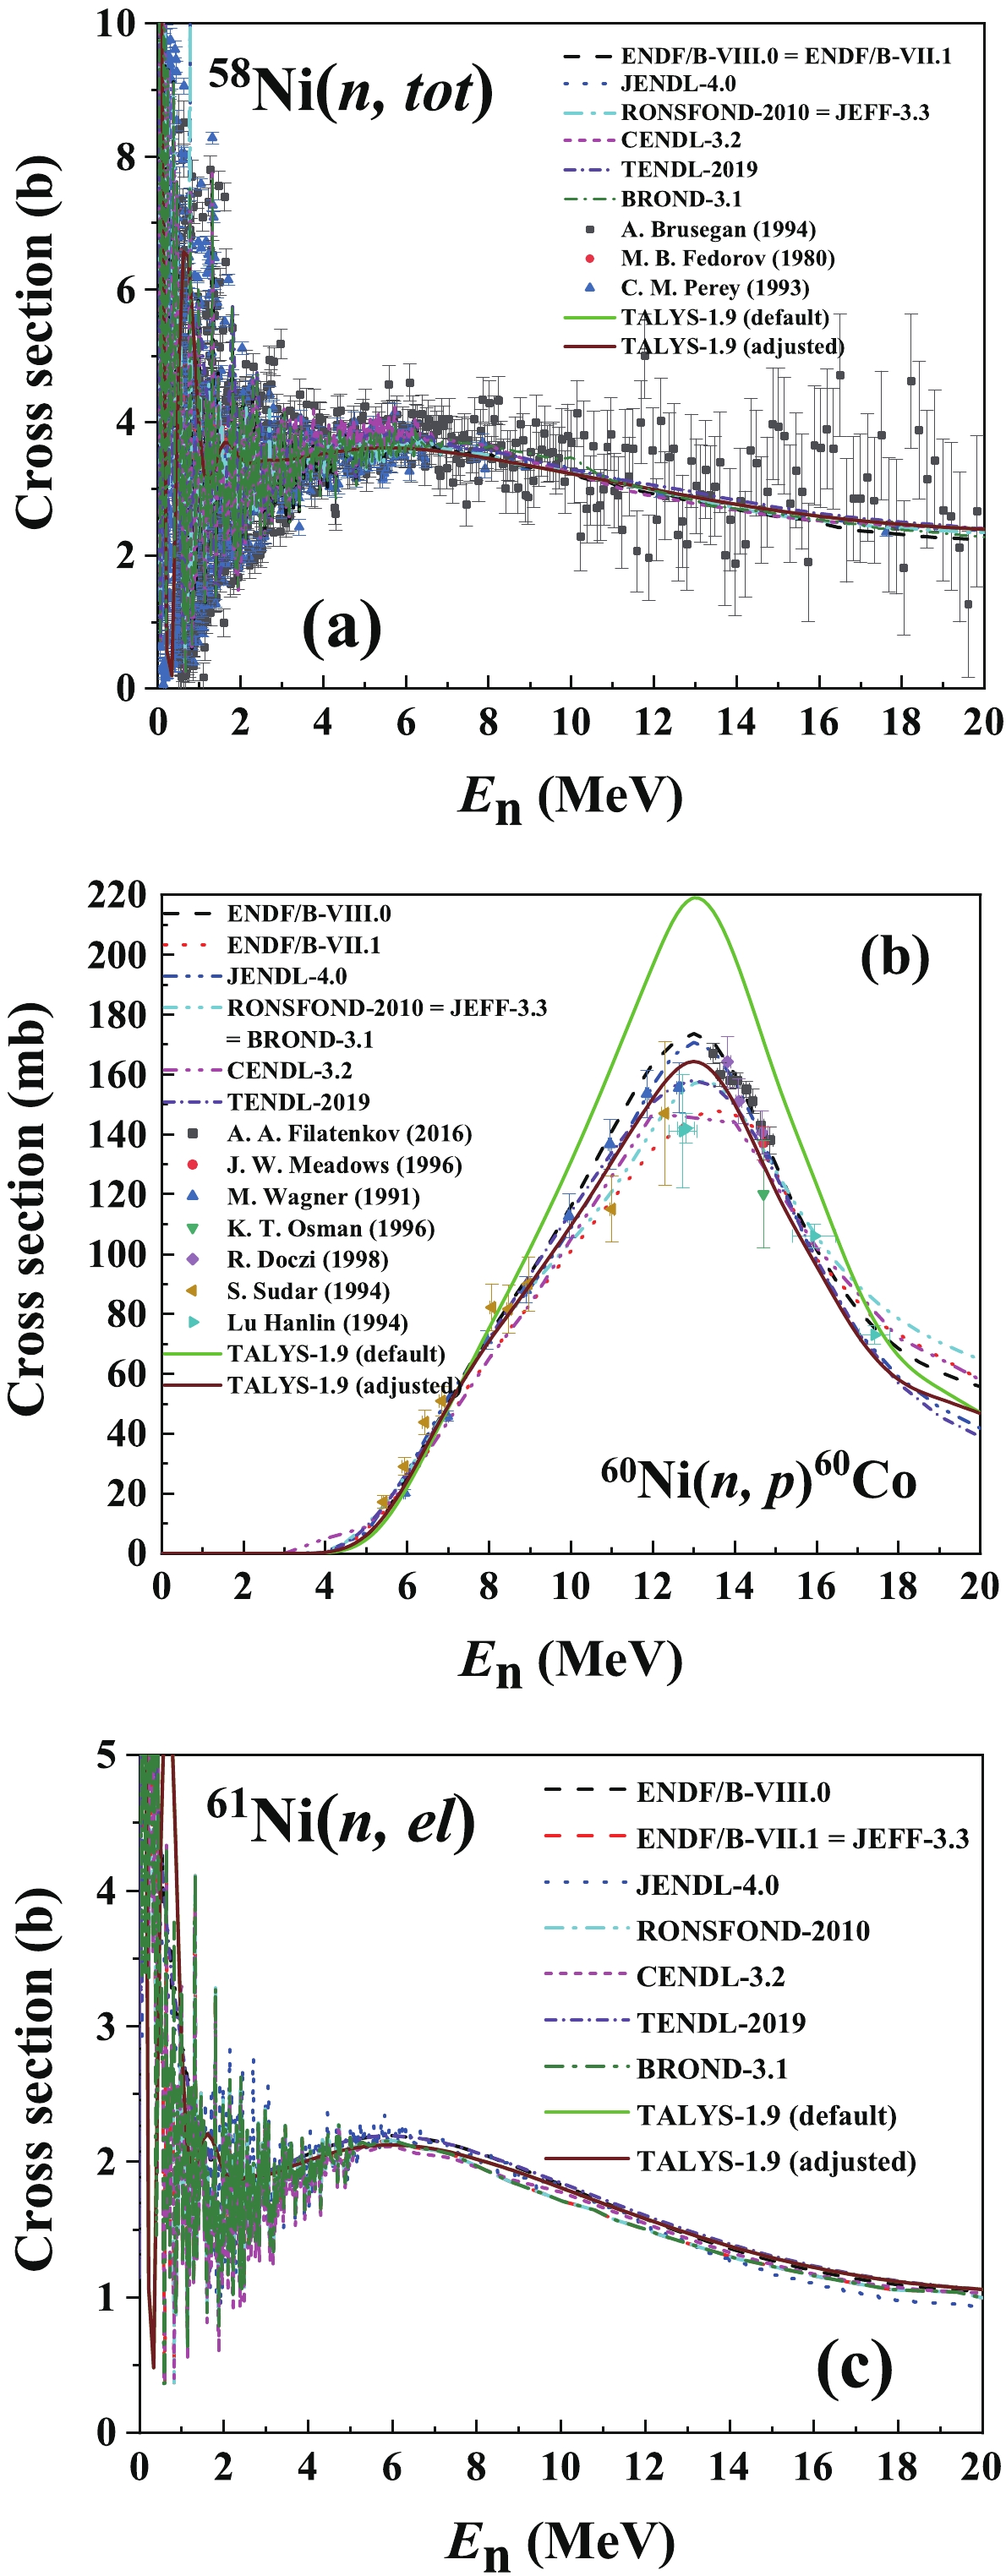
The cross sections of the 58Ni(n, α)55Fe, 60Ni(n, α)57Fe and 61Ni(n, α)58Fe reactions were calculated using TALYS-1.9 [33]. To better agree with the present results, several input parameters of the TALYS-1.9 [33] including those of the optic model, the level density and stripping parameters were adjusted from the default values as Table 8 lists. As shown in Tables 5-7 and Fig. 6 (a) – (c), the calculated cross sections and forward/backward ratios agree well with both the present measurement results and the results measured by our group in the 4.50
$ \leqslant E{_{\rm n}} \leqslant $ 5.50 MeV region [5]. Using the adjusted parameters, the calculated cross sections of other major reaction channels, including the (n, tot), (n, el), (n, inl), (n, p) reactions and the angular distributions of elastic scattering, also agree well with the results of most evaluations [34] and existing measurements [35] (three calculations are shown in Fig. 7 as examples), by which the reliability of the adjusted parameters was verified.58Ni(n, α)55Fe 60Ni(n, α)57Fe Keyword Parameters Keyword Parameters Tljadjust a a 2.00 0 rvadjust b a 1.08 Tljadjust a a 2.00 1 rvadjust b p 1.57 Tljadjust b a 1.75 2 aadjust d 28 60 1.22 rvadjust b a 0.95 aadjust d 27 60 1.06 rwadjust c a 1.62 Tadjust e 28 59 0.80 rvadjust b p 1.05 cstrip f a 0.90 aadjust d 26 55 0.85 61Ni(n, α)58Fe Tadjust e 26 55 0.92 Keyword Parameters cstrip f a 0.80 rvadjust b a 1.01 maxlevelsbin g a 8 rvadjust b p 1.12 aadjust d 26 58 1.04 Tadjust e 26 58 0.93 a Tljadjust: Multiplier to adjust the optical model potentials (OMP) transmission coefficient per l-value [33], whose parameters are “particle symbol, value and l-value”.
b rvadjust: Multiplier to adjust the OMP parameter rv of Eq. (3) of Ref. [36]. whose parameters are “particle symbol and value”.
c rwadjust: Multiplier to adjust the OMP parameter rw of Eq. (3) of Ref. [36], whose parameters are “particle symbol and value”.
d aadjust: Multiplier to adjust the level density parameter a of Eq. (15) of Ref. [37], whose parameters are “atomic number, atomic mass number, and value”.
e Tadjust: Normalization factor for the nuclear temperature T of Eq. (53) of Ref. [37], whose parameters are “atomic number, atomic mass number, and value”.
f cstrip: Adjustable parameter for the stripping or pick-up process to scale the complex-particle pre-equilibrium cross section per outgoing particle [38], whose parameters are “particle symbol and value”.
g maxlevelsbin: The number of included discrete levels for the nuclides resulting from binary emission that is considered in Hauser-Feshbach decay and the gamma-ray cascade [33], whose parameters are “particle symbol and value”.Table 8. Adjusted input parameters for TALYS-1.9 [33].
For En < 10.5 MeV, if the angular distributions of emitted α particles of the 58,60,61Ni(n, α)55,57,58Fe reactions are isotropic in the center-of-mass system, the forward/backward ratio in the laboratory system should be less than 1.07. However, as shown in Tables 5 – 7, the forward/backward ratios of the 58,60,61Ni(n, α)55,57,58Fe reactions are generally larger than 1.07, which reveals the non-statistical mechanisms of the 58,60,61Ni(n, α)55,57,58Fe reactions in the 8.50–10.50 MeV region. Using TALYS-1.9 [33] with the adjusted parameters, the ratio of the direct, pre-equilibrium and compound components of the (n, α) cross sections were calculated as shown in Fig. 8.
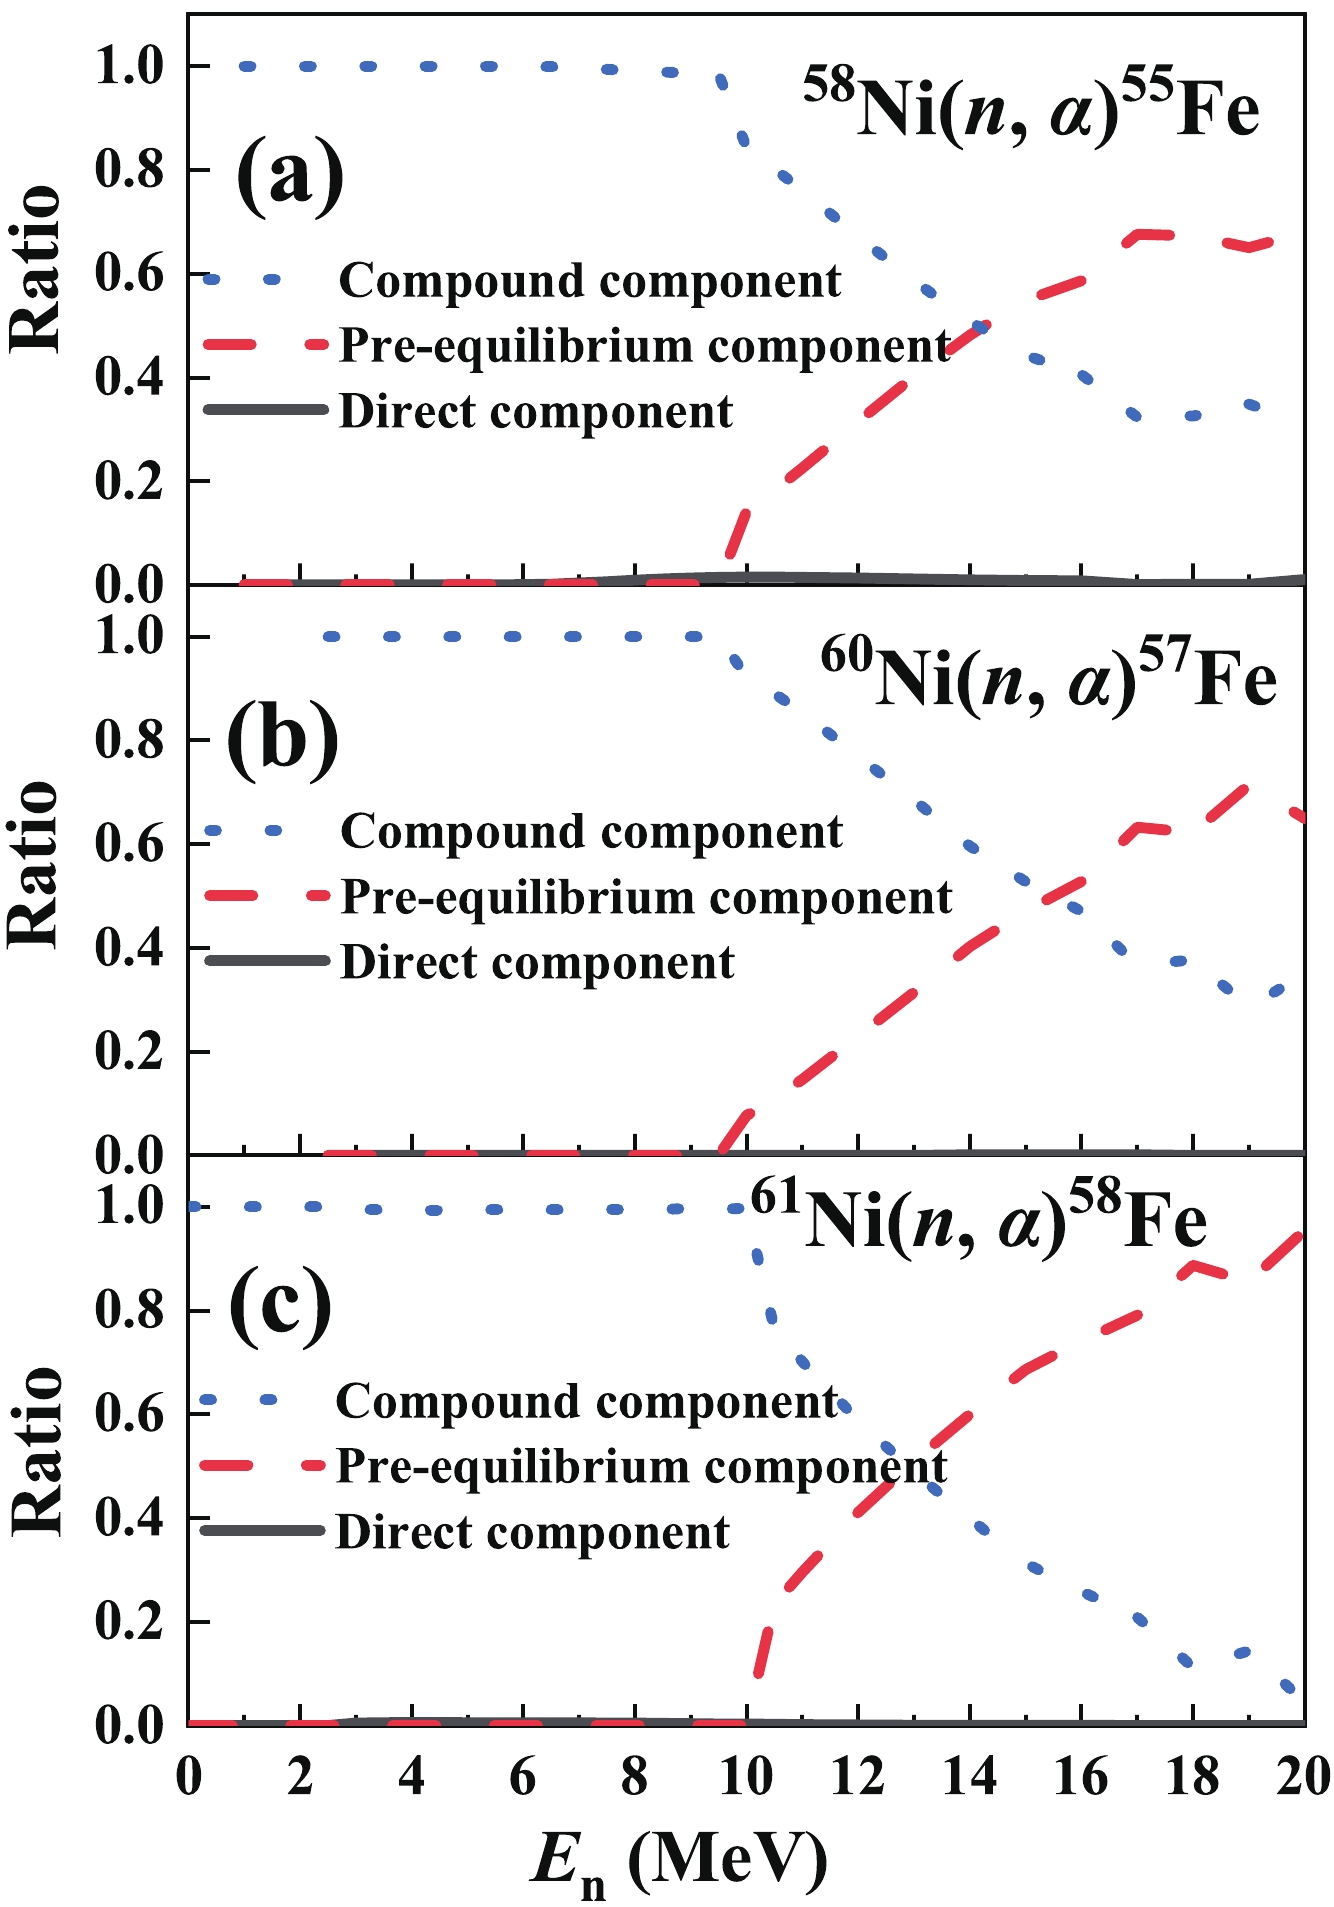
Figure 8. (color online) Ratios of the direct, pre-equilibrium and compound components of the (a) 58Ni(n, α)55Fe, (b) 60Ni(n, α)57Fe, and (c) 61Ni(n, α)58Fe cross sections calculated using the TALYS-1.9 [33] code with the adjusted parameters.
As shown in Fig. 8, for the 58,60,61Ni(n, α)55,57,58Fe reactions, the compound mechanism predominates below ~ 9 MeV, and then the pre-equilibrium mechanism gradually comes into effect. The direct mechanism has little effect on the final cross sections for all three reactions below 20 MeV.
-
In the present work, the cross sections of the 58Ni(n, α)55Fe, 60Ni(n, α)57Fe and 61Ni(n, α)58Fe reactions have been measured at 8.50, 9.5 and 10.50 MeV neutron energies using the HI-13 tandem accelerator, a GIC charged-particle detector, enriched nickel isotopic foil samples, 238U3O8 samples, and EJ-309 liquid scintillator detector. In the 8.50
$ \leqslant E{_{\rm n}} \leqslant $ 10.50 MeV region, the present cross sections of the 58,60,61Ni(n, α)55,57,58Fe reactions change slowly with the increase of En, and they are generally ~20% lower than most existing measurement data and evaluations. By adjusting several default values of theoretical model parameters, the present experimental data could be reasonably reproduced by calculations with TALYS-1.9. Analyses show that for the three reactions the compound mechanism predominates below ~ 9 MeV, and then as the neutron energy increases the pre-equilibrium mechanism gradually comes into effect. The uncertainty of the present cross sections of the 58Ni(n, α)55Fe reaction is smaller than most of the data of existing measurements. The present cross sections of the 60Ni(n, α)57Fe and 61Ni(n, α)58Fe reaction are the first measurement results above 8.0 MeV region. Considering the difference and scarcity of existing measurements and the discrepancy among evaluations, the present results are useful in the clarification of the deviations and can provide valuable information for future evaluations. -
The authors are indebted to the operating crew of Beijing HI-13 Tandem Accelerator of China Institute of Atomic Energy. Prof. Zhenpeng Chen from Tsinghua University and Prof. Vlad Avrigeanu from Bucharest University are acknowledged for their helpful suggestions.
Cross-section measurements for the 58,60,61Ni(n, α)55,57,58Fe reactions at 8.50, 9.50 and 10.50 MeV neutron energies
- Received Date: 2021-09-27
- Available Online: 2022-02-15
Abstract: Cross sections of the 58,60,61Ni(n, α)55,57,58Fe reactions were measured at 8.50, 9.50 and 10.50 MeV neutron energies based on the HI-13 tandem accelerator of China Institute of Atomic Energy (CIAE) with enriched 58Ni, 60Ni, and 61Ni foil samples with backings. A twin gridded ionization chamber (GIC) was used as the charged particle detector, and an EJ-309 liquid scintillator was used to obtain the neutron energy spectra. The relative and absolute neutron fluxes were determined via three highly enriched 238U3O8 samples inside the GIC. The uncertainty of the present data of the 58Ni(n, α)55Fe reaction is smaller than most existing measurements. The present data of 60Ni(n, α)57Fe and 61Ni(n, α)58Fe reactions are the first measurement results above 8 MeV. The present experimental data could be reasonably reproduced by calculations with TALYS-1.9 by adjusting several default values of theoretical model parameters.


 DownLoad: