


 Abstract
 HTML
HTML Reference
 Related
 PDF
PDF


-
Neptunium isotopes have received much attention in both fundamental and applied physics, especially
$ ^{237} $ Np, which has been used in the reprocessing of spent nuclear fuel and in the study of the odd-even effect. Therefore, the properties of this nucleus have been studied for many years [1-18]. On the other hand, the determination of kinetic energy leads to a better understanding of the fission process, of reprocessing methods for spent nuclear fuel, and of the odd-even effect. However, the kinetic energy of neptunium isotopes has been measured in only a few works [16-18] and there are limited experimental data available on the <TKE> distributions (the mean total kinetic energy as a function of fission fragments) for actinide fission [19-30]. It therefore seems necessary to explore the <TKE> values of neptunium isotopes.There has been little theoretical work on different methods to calculate fission total kinetic energy (TKE) [31-36]. None of them has studied the fission of neptunium isotopes. Ivanyuk [37, 38] has calculated deformation energy with the two-center shell model parameterization and has estimated TKE and total excitation energy (TXE) of fission fragments in a quasi-static approximation. Some researchers, such as Morariu [39], have calculated TXE using TKE. Ruben [40] presented the two spheroid model (TSM) model for calculating TXE and TKE, but in that work, TKE was calculated with the prescission energy which was approximated by Ref. [41]. A similar model, presented recently by Adamian [42], is the dinuclear system, in which two near-touching coaxial nuclei are assumed at a particular scission point while their volume is conserved. With this model, Andreev [43] obtained the fine structure in the TKE of neutron-induced fission fragments. In this formalism, the TKE distribution is calculated with Coulomb energy and nuclear energy.
The TSM model is a scission point model in which the scission configuration is assumed to consist of two spheroidal fragments. In this model, two spheres are separated by a distance d
$ \approx $ 1.44 fm [44], and the Coulomb repulsion energy between the two spheres, which is actually located effectively at the center point between them, indicates the Coulomb energy of the system at the scission point. The deformation parameters are taken as quadratic in radius change ($ \beta_ i $ ; i = L and H for the light and heavy fragments, respectively). Here we try to obtain TKE values using this method but with Denisov's [32] and Blocki's [45] expressions for Coulomb energy and nuclear energy, respectively.This article is organized as follows. In Section II, the calculation framework is presented. In the next section, the calculated results are compared with the experimental data and two other methods. Then, the deformation parameters are discussed at the scission point. In Section IV, the TKE distributions are studied for neutron-induced fission of odd/even nuclei, especially for the <TKE> distribution of neutron-induced fission of
$ ^{238} $ Np. The TKE distributions are then evaluated for neutron-induced fission of other neptunium isotopes in Section V. -
Andreev [43] used the following equation to calculate the TKE of fission fragments:
$ TKE(A_{i},\beta_{i}) = V_{\rm coul}(A_{L}/A_{H},\beta_{i},d) +V_{\rm nuc}(A_{L}/A_{H},\beta_{i},d), $

(1) where d is the distance between the fragment surfaces at the scission point, and
$ \beta_{i} $ are the quadratic deformation parameters for each fragment.The Coulomb energy is defined by [32]
$\begin{aligned}[b] V_{\rm coul} =& {\frac { Z_L \, Z_H \, e^2}{D}} \left( 1+ 0.3785\,{\frac {R_2^2 \beta_2 + R_1^2 \, \beta_1}{D^2}} \\&+ 0.3164\,{\frac {R_1^2{\beta_1^2}+{R_2^2}\beta_2^2}{D ^2}}+ 0.20472\,{\frac {R_1^ 4{\beta_1^2}+{R_2^4} {\beta_2^2}}{D^4}}\\&\left.+ 0.8598\,{\frac {R_1^2 {R_2^2} {\beta1}\,{\beta2}}{D ^4}} \right),\end{aligned} $

(2) where
$ D = d+R_1+R_2 $ . The nuclear potential is presented as the proximity potential [45, 46]$ V_{\rm prox}(d) = 4 \pi \gamma b \left[\frac{C_1 C_2}{C_1+ C_2}\right] \Phi(\varepsilon) , \qquad \left(\varepsilon = \frac{d}{b}\right), $

(3) where the width (diffuseness) of the nuclear surface is b
$ \approx $ 0.88. The surface tension coefficient of the nucleus$ \gamma $ is obtained from the Lysekil mass formula proposed by Ref. [47]$ \gamma = 0.9517\sqrt{(1-2.61I_{1}^2)(1-2.61I_{2}^2)} \quad {\rm MeV/fm^2}, \qquad $

(4) $ I_i = \frac{(N_i-Z_i)}{A_i}, $

(5) where
$ N_i $ ,$ Z_i $ , and$ A_i $ are the neutron, atomic, and mass numbers of each fission fragment, respectively.$ C_1 $ and$ C_2 $ are the Süsmann central radii of light and heavy fragments, which are related to the sharp radius$ R_i $ by:$ C_{i} = R_{i}-\left[\frac{b^2}{R_{i}} \right], $

(6) where
$ R_i $ is the net radius of each fission fragment obtained through a semi-empirical equation that is a function of the mass number of fission fragments [46]$ R_i({\rm fm}) = 1.28R_{0,i}-0.76+0.8 R_{0,i}^{-1}, $

(7) where
$ R_{0,i} $ is the radii of deformed nuclei, which can be evaluated using the deformation dependent expansion of nuclear radii [48]:$ R_{0,i}(\theta) = R_0(1+\beta_iY_{20}(\theta_i)), $

(8) where
$ \theta_i $ is the angle made by the axis of symmetry with the fission axis and$ Y_{20} $ is the spherical harmonic functions.In Eq. (3), the universal proximity relation
$ \Phi $ is a function of the distance between two interaction fragments [45]$ \Phi (\varepsilon ) = \left\{ {\begin{array}{*{20}{l}} { - 1.7817 + 0.9270\varepsilon + 0.0169{\varepsilon ^2} - 0.0514{\varepsilon ^3}}\\ {\qquad {\rm{for}}\quad 0 \leqslant \varepsilon \leqslant 1.9475},\\ { - 4.41\exp ( - \varepsilon /0.7176)}\\ {\qquad {\rm{for}}\quad \varepsilon \geqslant 1.9475.} \end{array}} \right.$

(9) The atomic numbers of the fission fragments are calculated by the most probable charge based on the unchanged charge-density distribution [49]
$ Z_{\rm UCD} = {\frac {{\it Z_{cn}}\,{\it (A+ \nu})}{{\it A_{cn}}}}, $

(10) where
$ \nu $ is the post-scission neutrons [50, 51]. For neutron-induced fission of$ ^{238} $ Np, the kinetic energy of the light fragment$ E_{L} $ is available, so the TKE values are calculated with the law of momentum conservation as:$ TKE = E_{L} {\frac{{\it A_{cn}}}{{\it A_{H}}}}. $

(11) -
In this section, the <TKE> values are calculated by the method described in the previous section, and by another method. In the method presented above, the atomic numbers of fission fragments are calculated by Eq. (10) and the distance between two fragments, d, is 1.44 fm, following Wilkins [44].
The calculated <TKE> values from the two methods for the neutron-induced fission of
$ ^{237} $ Np are compared with the experimental data in Fig. 1(a). The <TKE> values of the first method (calculated results I) are calculated by the framework presented in the previous section and the deformation parameter values of the fragments used to plot this figure are presented in Table 1. In Table 1, it can be seen that the sum of deformation parameters for complementary fragments ($ \beta_1+ \beta_2 $ ) increases significantly for fragments near the symmetric region. This indicates a reduction in the probability of formation of symmetric fragments, which makes fission of$ ^{237} $ Np asymmetric. Also, the lowest values for the sum of deformation parameters occur for fission fragments with mass number 131. This fission fragment is one of the most common fragments in actinide fission. This is because it is possible to form a stable nucleus with an atomic number 50 and neutron number 82.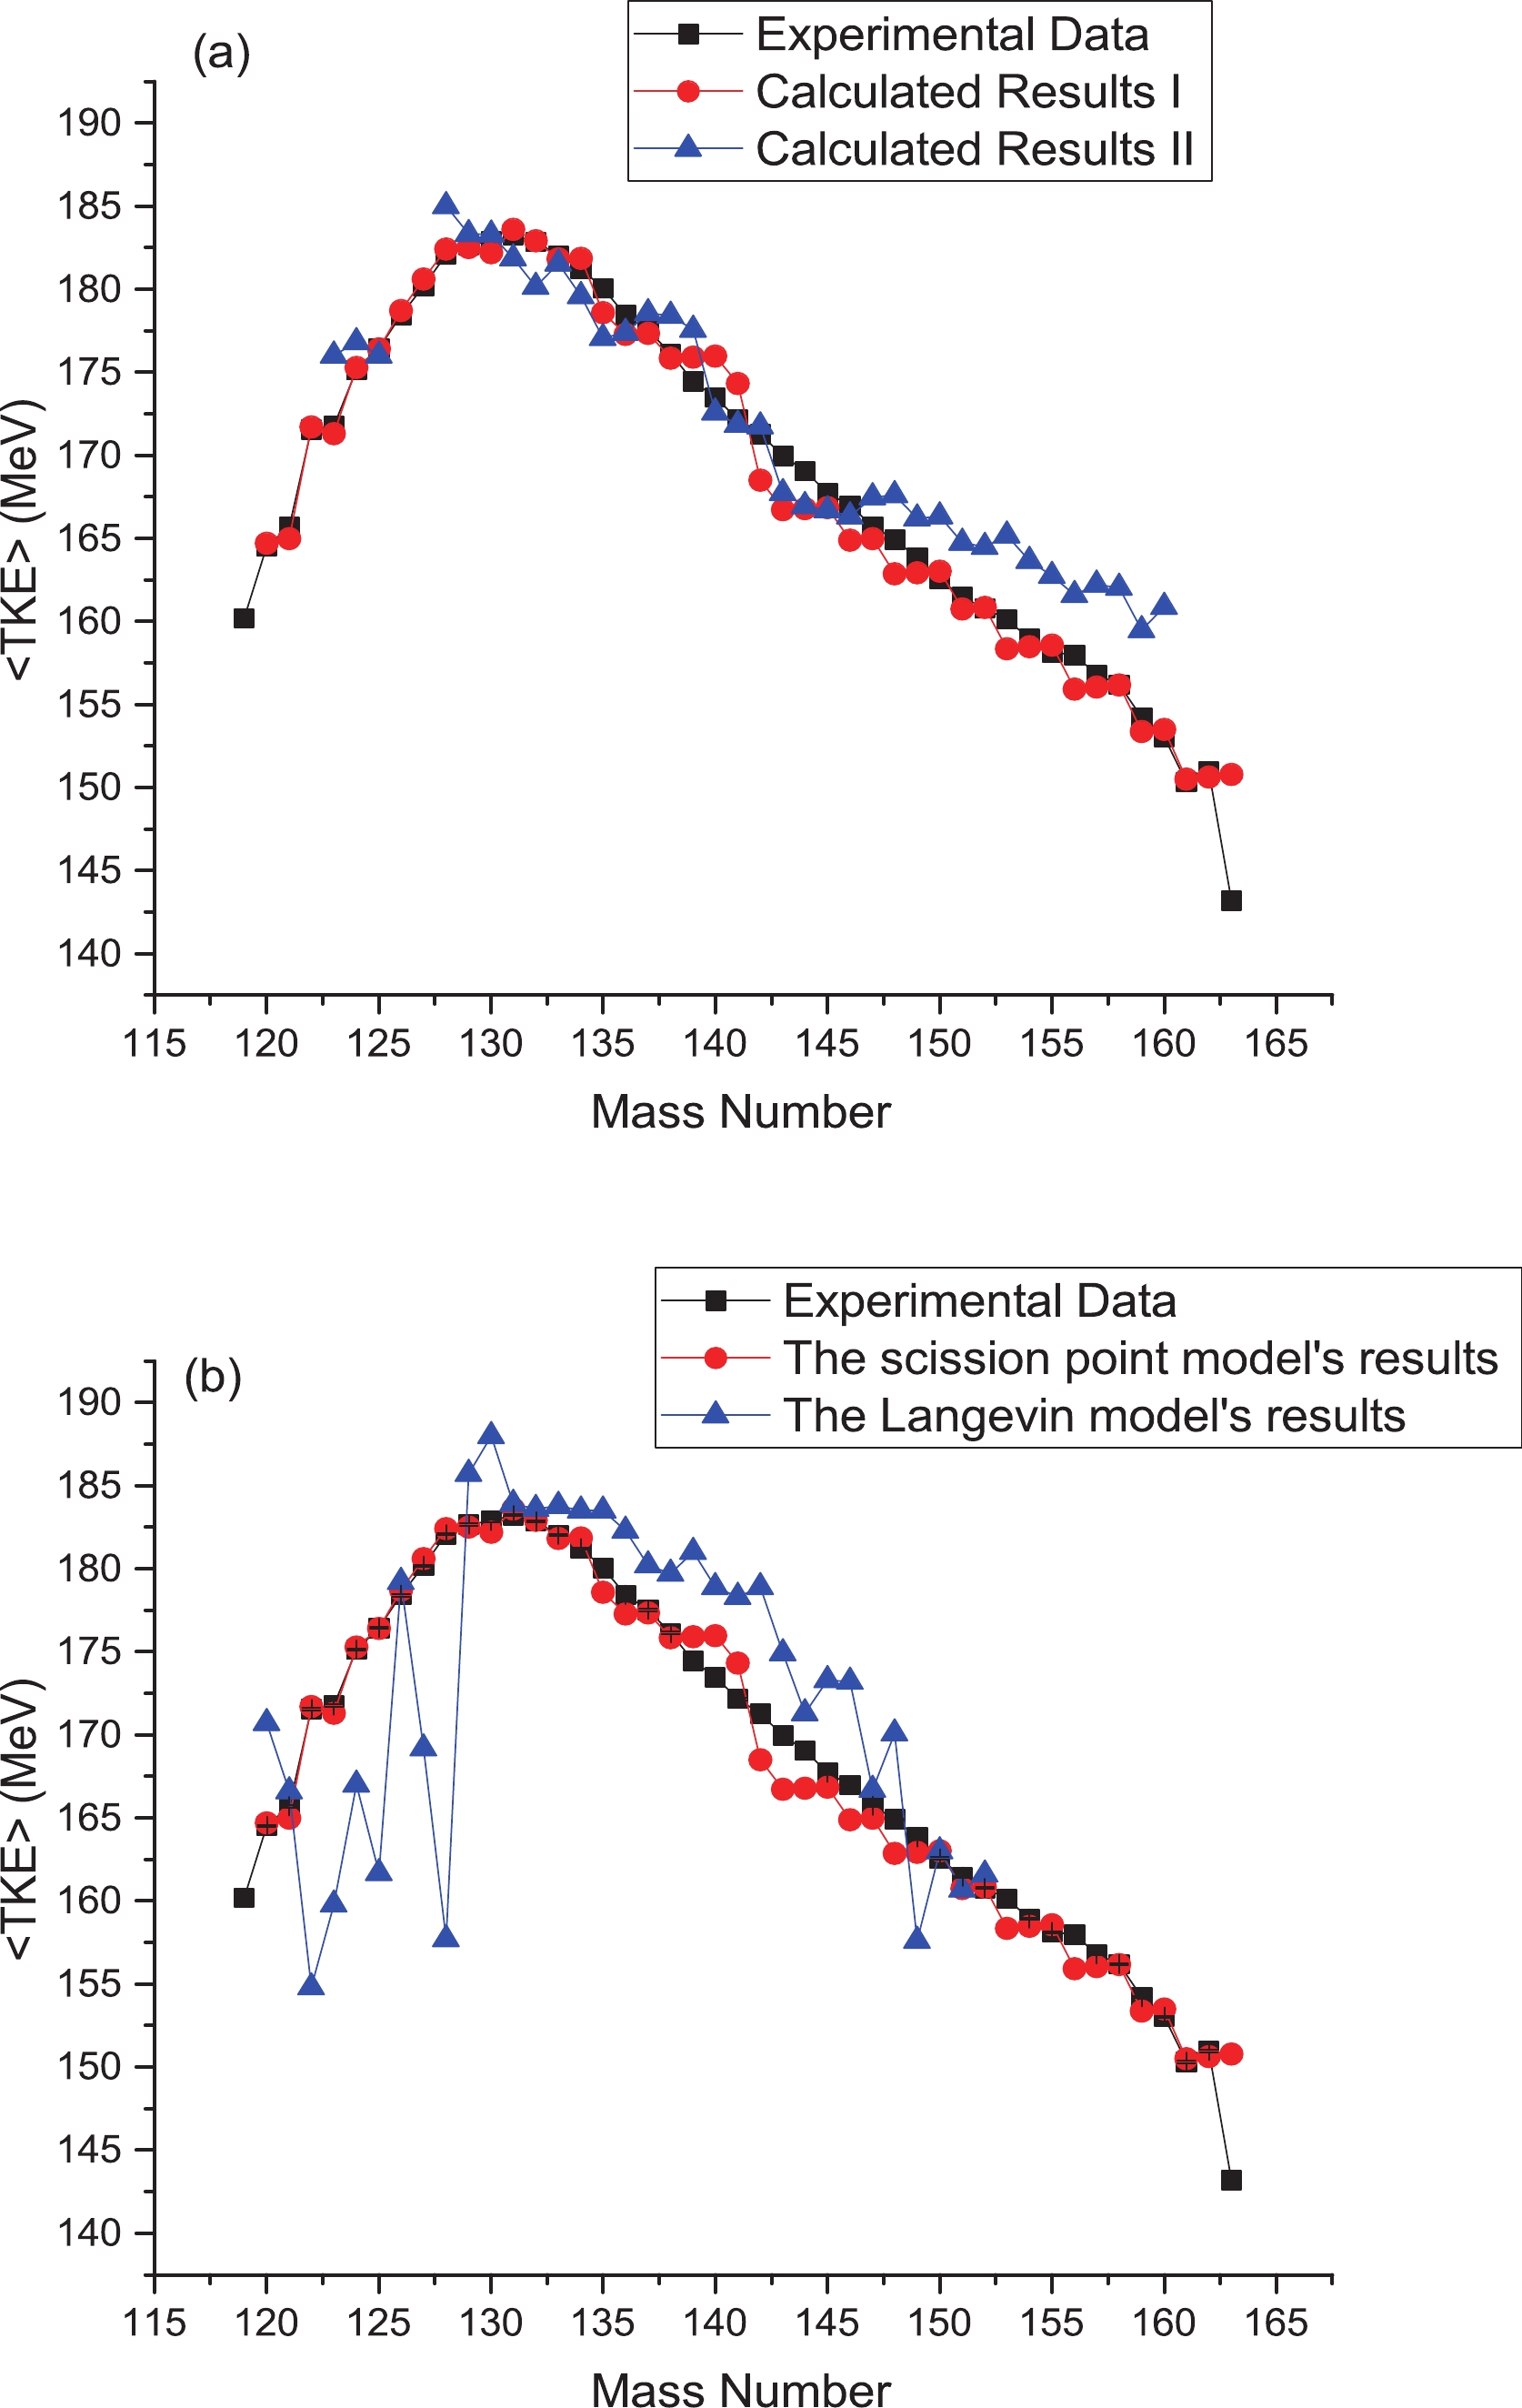
Figure 1. (color online) (a) Calculated mean total kinetic energy as a function of fragment mass for neutron-induced fission of
$ ^{237} $ Np by two methods, with experimental data [52]. Calculated results I are obtained as described in the previous section and calculated results II are obtained according to the method of Ref. [53]. (b) <TKE> distribution calculated by two models: the scission point model presented in the previous section and the Langevin model, along with experimental data [52].$ A_{i} $ 

$ \beta_i $ 

$ A_{i} $ 

$ \beta_i $ 

120 0.86 128 0.47 121 0.85 129 0.47 122 0.69 130 0.46 123 0.69 131 0.44 124 0.61 132 0.45 125 0.58 133-135 0.45 126 0.54 135-142 0.5 127 0.51 142-170 0.65 Table 1. Change in
$ \beta_i $ values of neutron-induced fission of$ ^{237} $ Np.The second method of calculation (calculated results II) is based on Ref. [53]. There is good agreement between the results from this model and experimental data for fission fragments with mass numbers greater than
$ A_i $ = 130. In the following, the parameters and relations in this method are discussed for neutron-induced fission of$ ^{237} $ Np. In this method, the TKE is approximated as:$ \begin{aligned}[b] TKE(A_{L}/A_{H})\approx & E_{\rm Coul}(A_{L}/A_{H})+E_{\rm shell}(A_{L},A_{H}) \\&+\Delta(A_{L},A_{H})-E_{\rm def}(A_{L},A_{H})+C_{cn}, \end{aligned} $

(12) where the constant value,
$ C_{cn} $ , depends on the compound nucleus.$ E_{\rm Coul}(A_{L}/A_{H}) $ is the Coulomb energy between complementary fission fragments,$ E_{\rm shell}(A_{L},A_{H}) $ is the shell correction energy of two complementary fragments,$ \Delta(A_{L},A_{H}) $ is the pairing correction energy of the fission fragments and$ E_{\rm def}(A_{L},A_{H}) $ is the deformation energy of two complementary fragments. The constant value is$ C_{cn} = $ 5 MeV for fission fragments with mass numbers between$ A_i $ = 140-142 and$ \tilde{A} = 140 $ . Also, the deformability parameter value of each fragment,$ \alpha $ , changes as:$ \alpha = \left\{ {\begin{array}{*{20}{l}} {5 + 0.4|{A_i} - 135|\qquad {\rm{for}}\qquad 125 < {A_i} < 140},\\ {4.86 - 0.063{\mkern 1mu} \dfrac{{{Z^2}}}{A}\qquad {\rm{for}}\qquad {\rm{other}}.} \end{array}} \right. $

(13) In this formalism,
$ \alpha $ values are calculated by a simple empirical formula in the liquid drop model, following Terrell [54], for most fragments. They are approximated by a linear function of the fission fragment mass numbers for the magical fission fragments region$ 125<A_i<140 $ . This magical fission fragments region corresponds to the lowest$ \beta_i $ values (about 0.45) in Table 1. This indicates that there is good agreement between these models.In Fig. 1(b), the calculated results of the scission point model and the Langevin model are compared with the experimental results. For fission fragments with mass numbers greater than 133, the results of both models are in good agreement with the experimental results. For fission fragments with mass numbers less than 133, however, there are large variations in <TKE> values for the results calculated with the Langevin model. These large variations can also be seen in some of the experimental results; this is related to the influence of target thickness, according to Gook [55]. Of course, the <TKE> results calculated with the scission point model are close to the experimental data because the experimental data are reproduced by fitting the
$ \beta_i $ values. Therefore, this model properly evaluates TKE values.In Fig. 2, the mean kinetic energy values (
$ E_L $ ) for neutron-induced fission of$ ^{238} $ Np are presented as a function of light fission fragment mass number. There are many variations in these experimental data [16]. These drastic changes may be due to kinetic energy measurements after prompt neutron decay, as some components emit neutrons more easily than others. Tsekhanovich [16] has measured the average kinetic energy for light fission fragments, although usually the average total kinetic energy values are discussed. Therefore, by using Eq. (11), <TKE> values as a function of heavy fission fragments are calculated and presented for thermal neutron-induced fission of$ ^{238} $ Np in Fig. 3.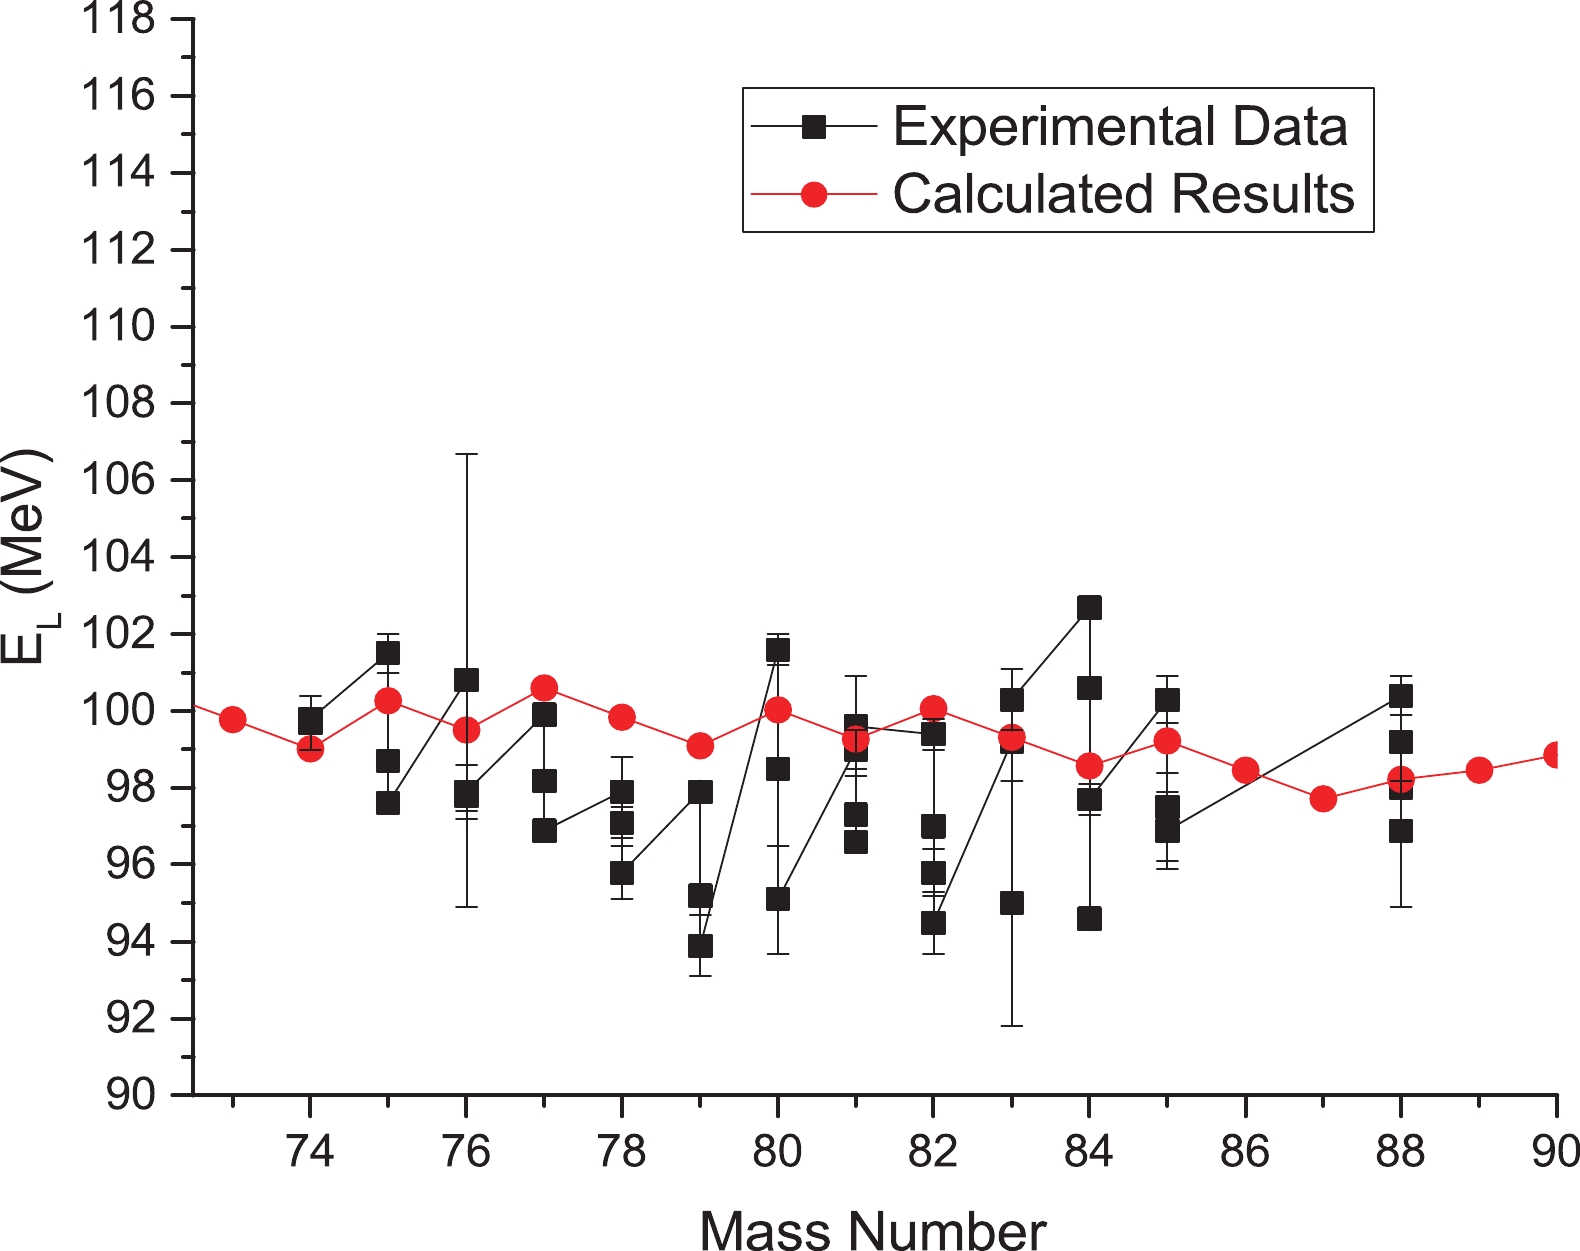
Figure 2. (color online) Calculated mean kinetic energy of light fragment
$ E_{L} $ for thermal neutron-induced fission of$ ^{238} $ Np, with experimental data [16].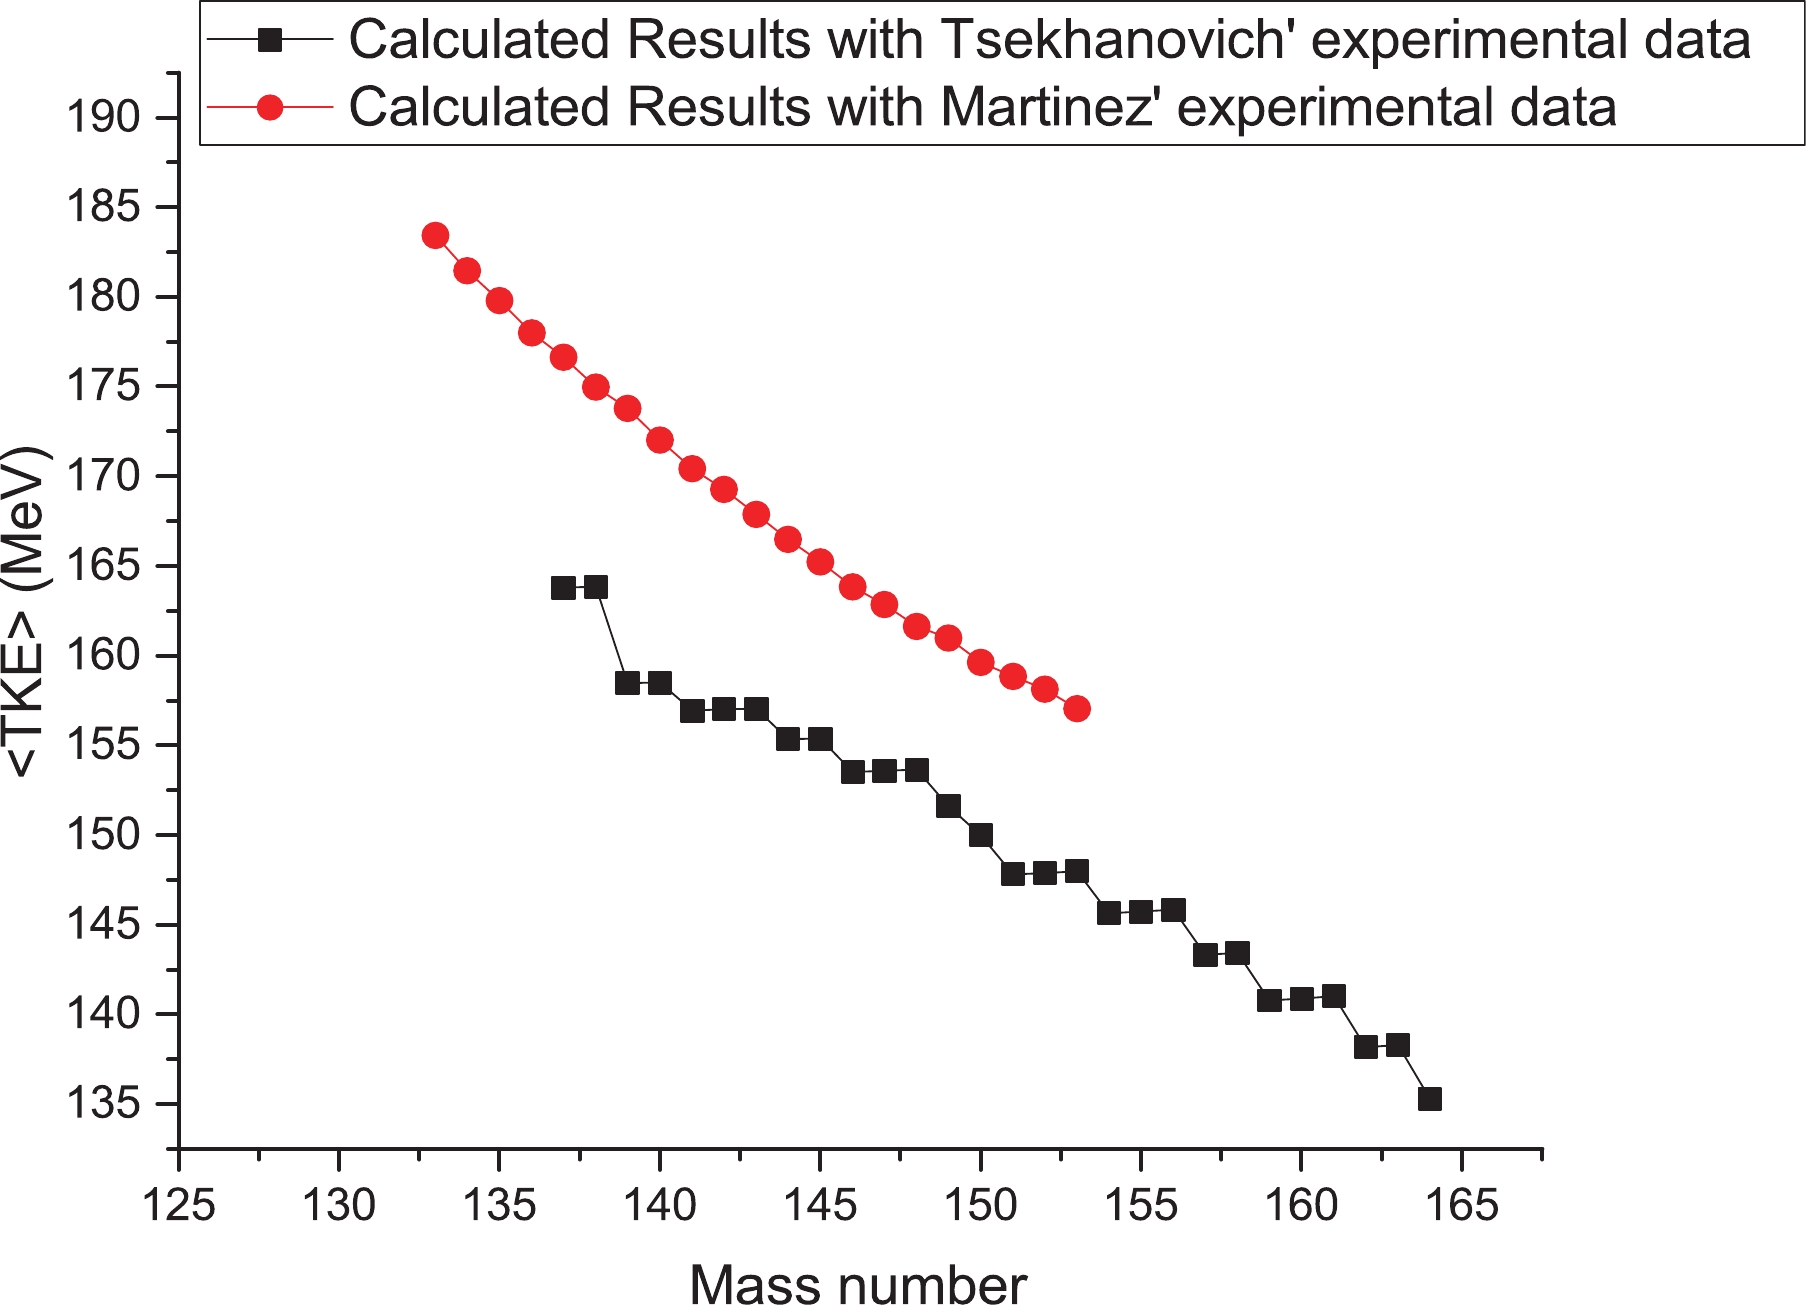
By fitting the calculated results to the experimental data, the deformation parameters of light fission fragments are presented for neutron-induced fission of
$ ^{238} $ Np in Table 2. These deformation values are too large. This indicates that these results are not normal. Fortunately, there are other experimental kinetic energy values for neutron-induced fission of$ ^{238} $ Np [56]. In Table 3, the deformation parameter values of the fission fragments are presented by fitting these new experimental (Martinez's) data. The obtained$ \beta_i $ values from Martinez's data are lower, which indicates that these results are more realistic than Tsekhanovich's experimental data.$ A_{L} $ 

$ \beta_i $ 

74-89 0.9 89-100 0.85 100-105 0.75 Table 2. Change in
$ \beta_i $ values of neutron-induced fission of$ ^{238} $ Np according to Tsekhanovich's data (series 1) [16].$ A_{L} $ 

$ \beta_i $ 

$ A_{L} $ 

$ \beta_i $ 

85-89 0.66 97 0.58 89-93 0.64 98 0.56 94 0.57 99 0.64 95 0.61 100-105 0.52 96 0.56 Table 3. Change in
$ \beta_i $ values of neutron-induced fission of$ ^{238} $ Np according to Martinez's data (series 2) [56].Martinez [56] has measured the average kinetic energy values for fission of
$ ^{239} $ Np after double thermal neutron capture in a$ ^{237} $ Np target, but the mean kinetic energy of light fission fragments is also measured. Using Eq. (11), <TKE> values are evaluated and presented in Fig. 3. In Fig. 3, the <TKE> values obtained from the two series of experimental data are presented. This figure indicates that the <TKE> values evaluated from Martinez's results (series 2) are much greater than those evaluated from Tsekhanovich's results (series 1). In the next section, these <TKE> results are investigated and compared to the fission of other nuclei. -
In Fig. 4(a), the experimental <TKE> distribution for neutron-induced fission of
$ ^{241} $ Am [57],$ ^{238} $ Pu [58],$ ^{238} $ U [59],$ ^{237} $ Np [52], and$ ^{235} $ U [60] are compared. As can be seen in Fig. 4, the <TKE> values for neutron-induced fission of actinides with odd mass numbers are greater than for those with even mass numbers. Especially, the <TKE> values for neutron-induced fission of$ ^{237} $ Np are quite close to the <TKE> values for neutron-induced fission of$ ^{238} $ Pu. Therefore, the <TKE> values of neptunium isotopes with even mass numbers are evaluated with the deformation parameters of neutron-induced fission of$ ^{238} $ Np, and the <TKE> values of neptunium isotopes with odd mass numbers are evaluated with the deformation parameters of neutron-induced fission of$ ^{237} $ Np.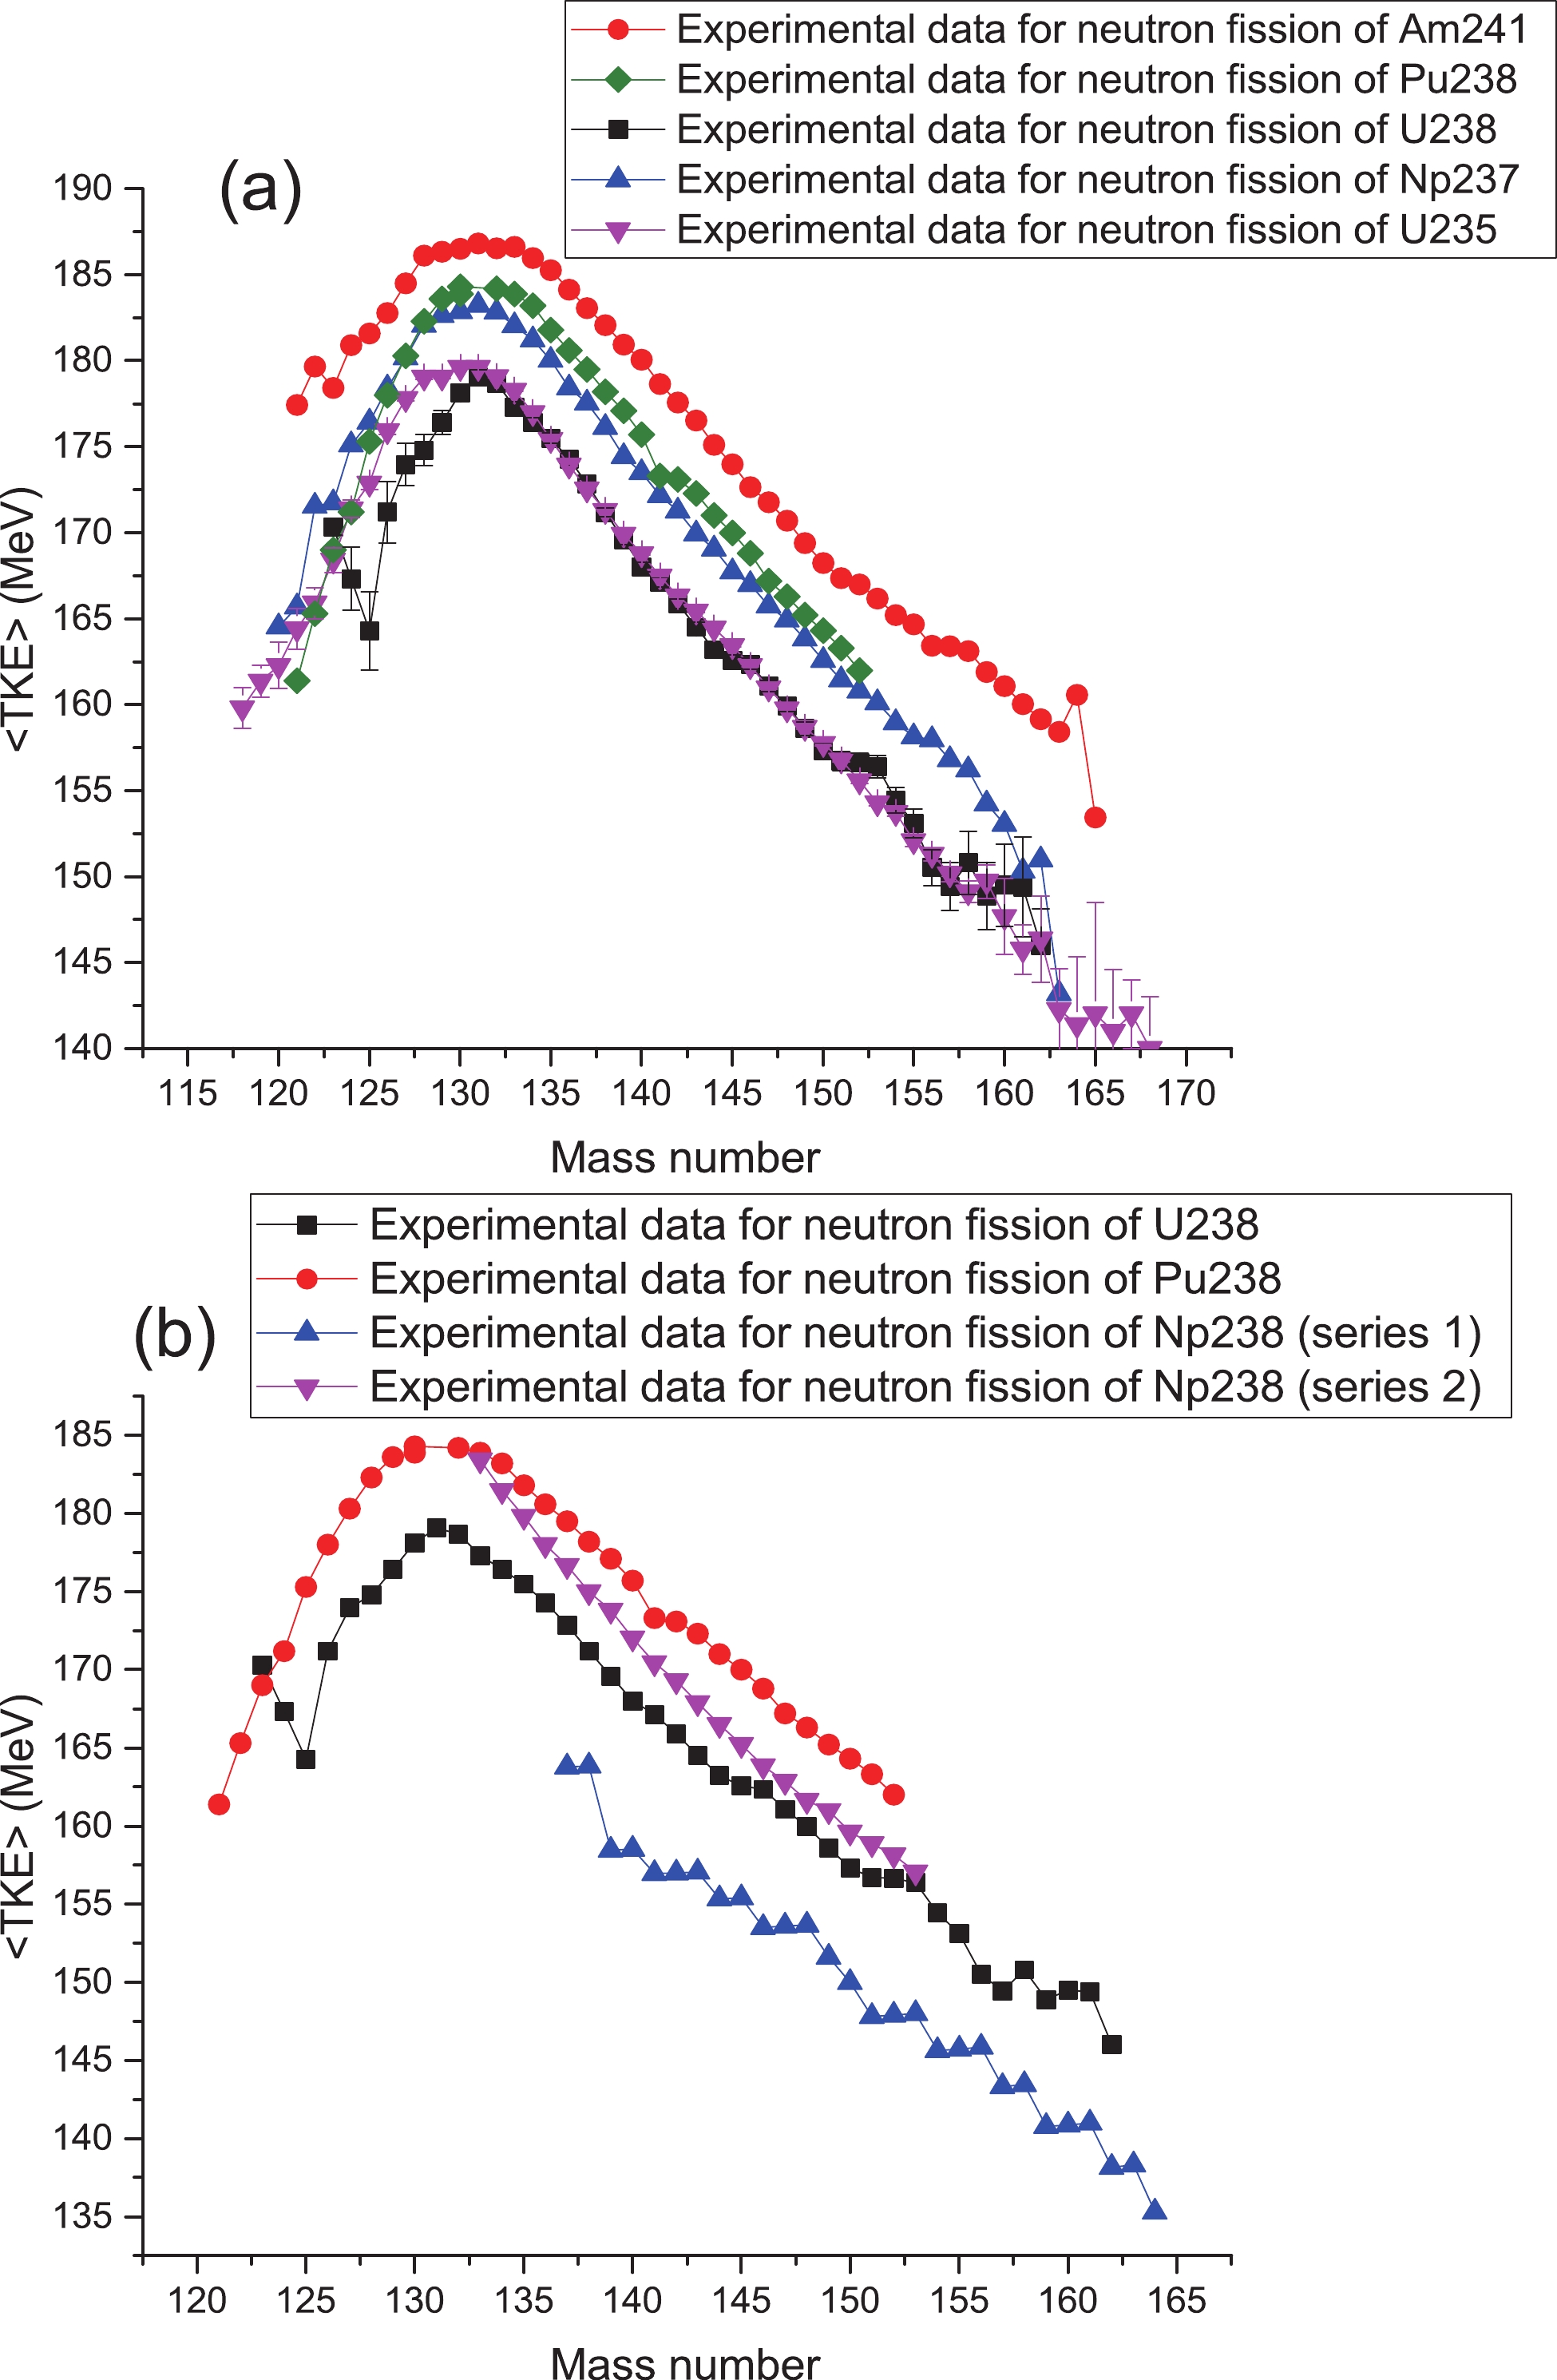
Figure 4. (color online) (a) Comparison of experimental values of total kinetic energy for neutron-induced fission of
$ ^{241} $ Am [57],$ ^{238} $ Pu [58],$ ^{238} $ U [59]$ ^{237} $ Np [52],$ ^{235} $ U [60]. (b) Experimental values of total kinetic energy for neutron-induced fission of nuclei with mass number 238, such as$ ^{238} $ Np (series 1) [16] and (series 2) [56].Furthermore, it is seen that the <TKE> values of odd-odd or even-even fissioning systems are greater than the <TKE> values of even-odd or odd-even fissioning systems. Also, the behavior of the <TKE> distribution for neutron-induced fission of odd-odd and even-even fissioning systems is the same. For example, the <TKE> values for neutron-induced fission of
$ ^{237} $ Np and$ ^{235} $ U have the same trend. Therefore, this increase in <TKE> values is not related to the odd atomic number of the fissioning systems, but to their odd mass number. This indicates that this increase is related to the collective effect of nucleons (neutrons and protons).In Fig. 4(b), the experimental values of <TKE> for neutron-induced fission of nuclei with mass number 238 are compared. The experimental data for neutron-induced fission of
$ ^{238} $ Np are presented in two series: the <TKE> values of series 1 are obtained with the experimental data of Tsekhanovich [16] for average kinetic energy of light fission fragments, and the <TKE> values of series 2 are obtained with the experimental data of Martinez [56] for average kinetic energy of light fission fragments. This figure indicates that the <TKE> values of series 2 for neutron-induced fission of$ ^{238} $ Np are closer to the <TKE> values of other nuclei with the same mass number. The decrease in the <TKE> values of series 1 is due to the energy emitted by prompt neutrons, as mentioned before. This shows that Tsekhanovich's results [16] may not be appropriate for discussion of TKE distributions. -
The TKE distributions for neutron-induced fission of actinides were investigated in Ref. [61]. This work indicated that the TKE distributions for the isotopes are close to each other. Furthermore, the results of the scission point model are very close to the experimental results (Fig. 1(b)). Therefore, using this model and the achieved deformation parameters, the mean total kinetic energy values were evaluated for neutron-induced fission fragments of other neptunium isotopes and are presented in Figs. 5-7.
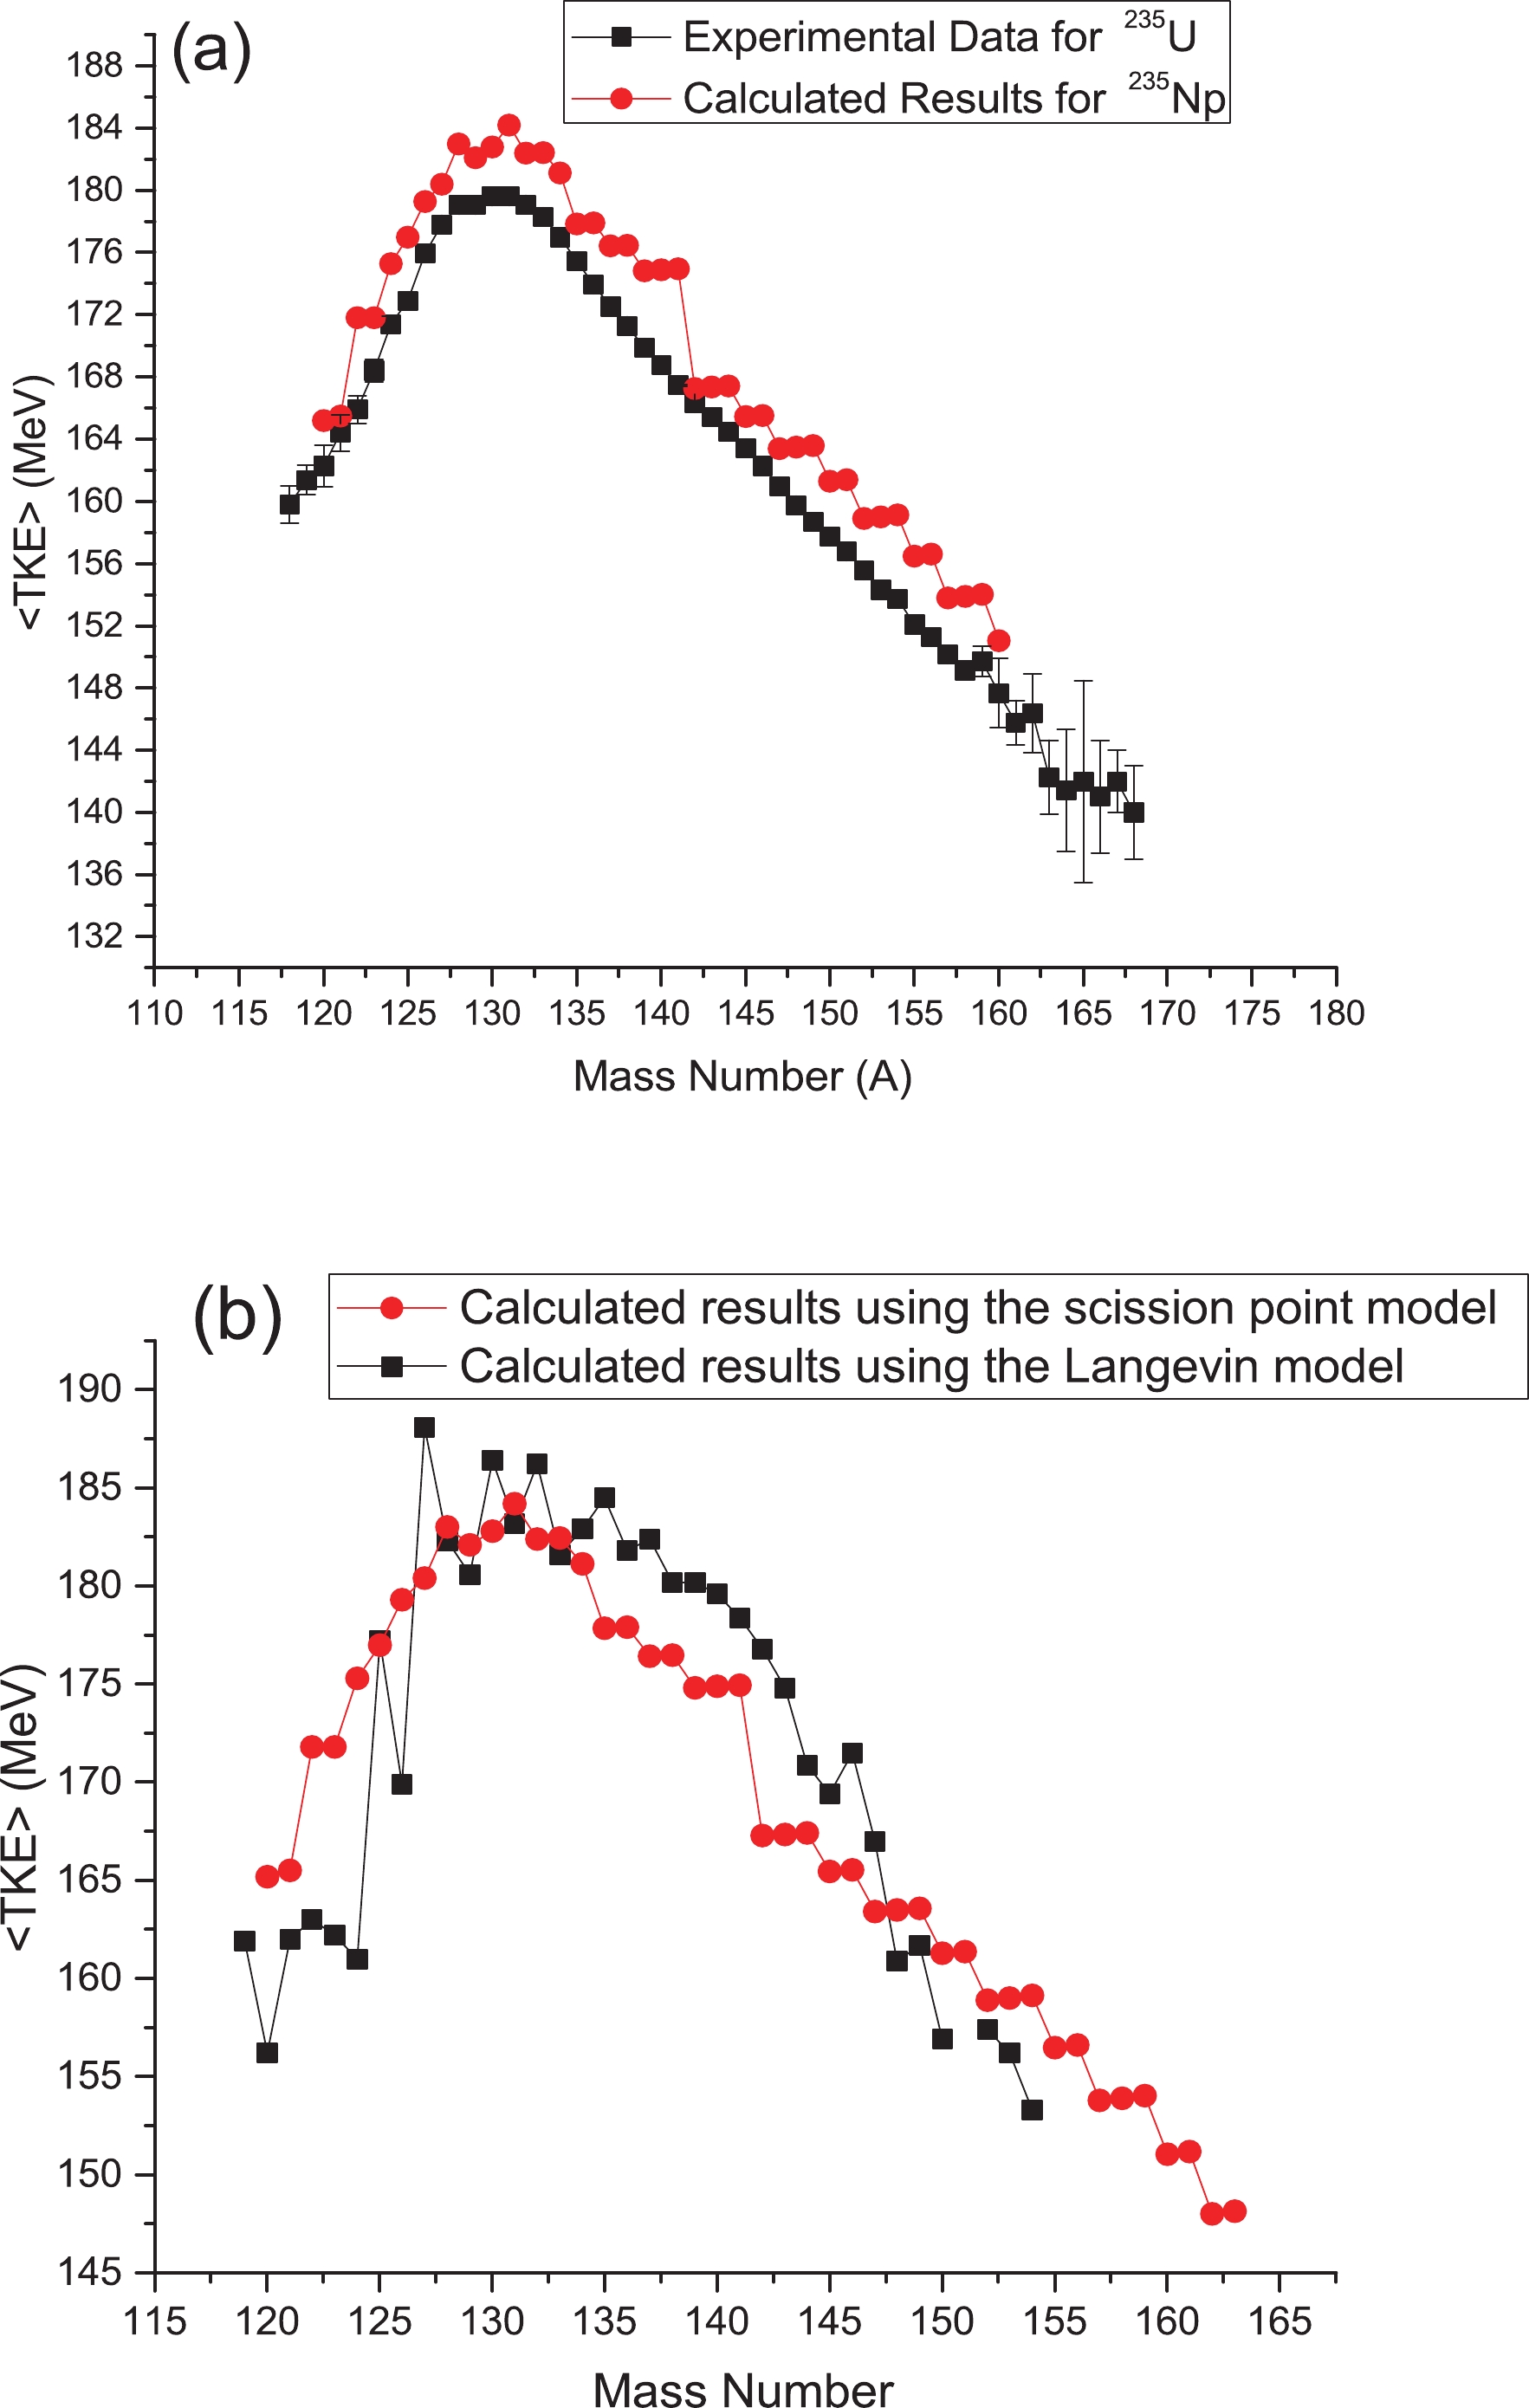
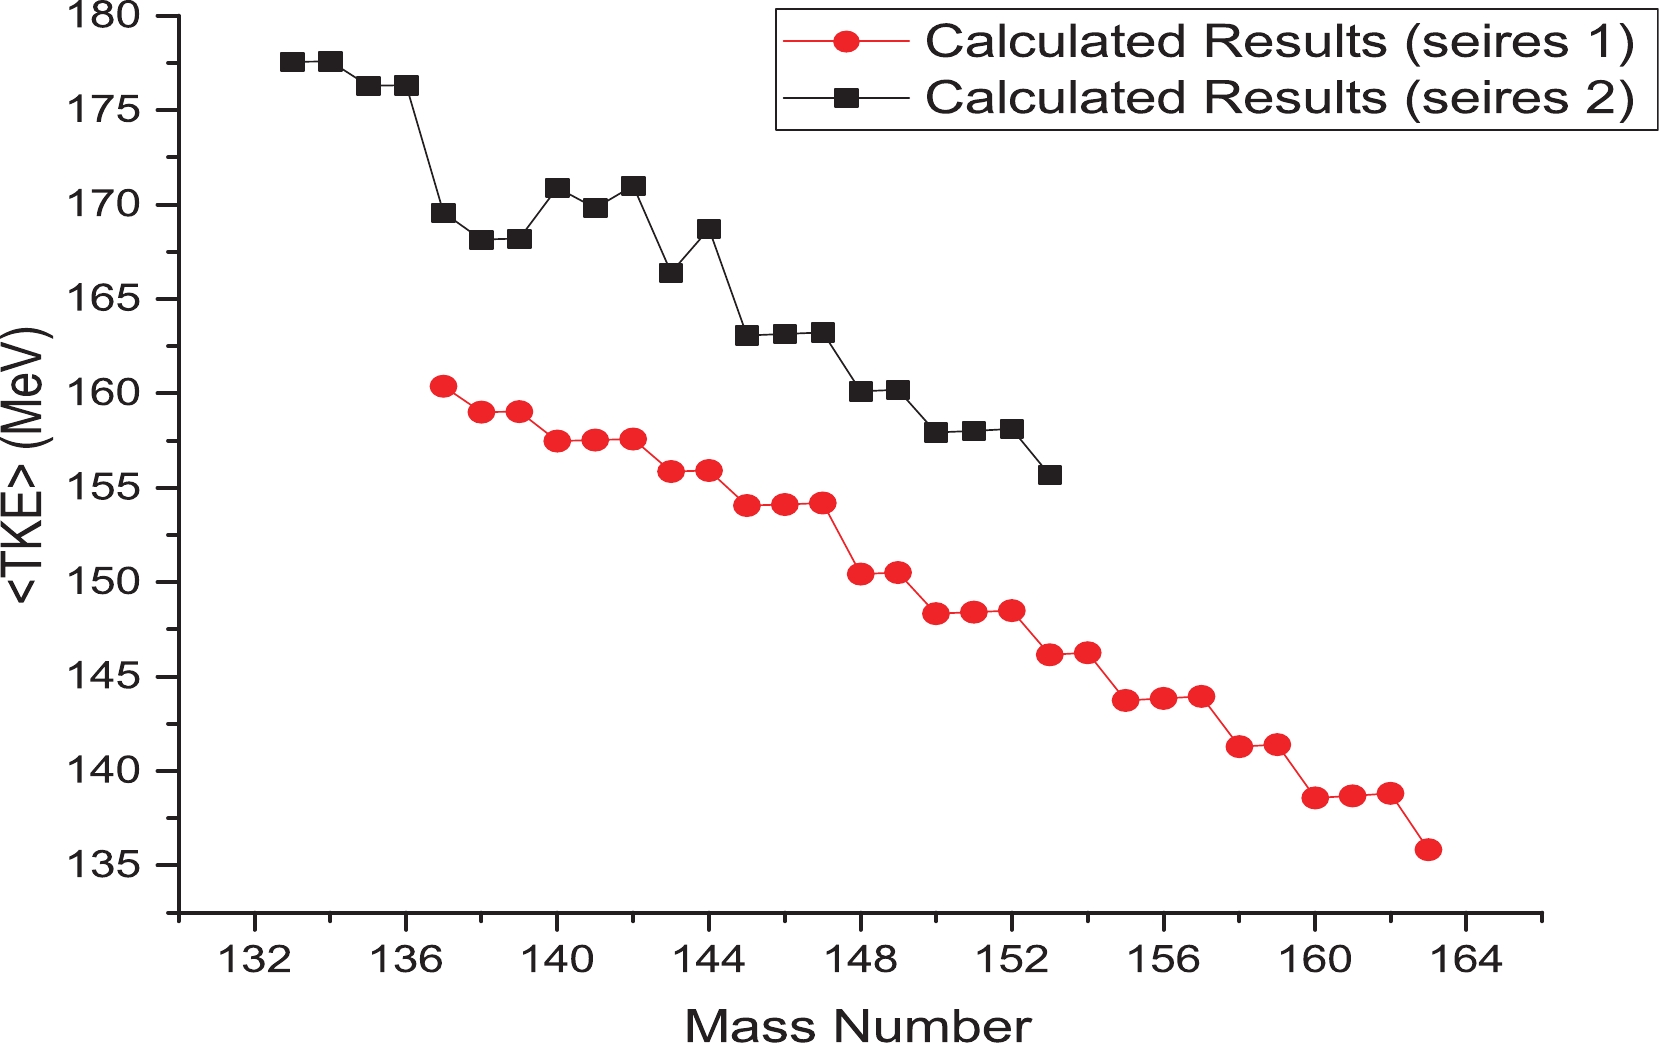
Figure 6. (color online) Calculated <TKE> as a function of fragment mass number for neutron-induced fission of
$ ^{236} $ Np.
Figure 7. (color online) Calculated <TKE> as a function of fragment mass number for neutron-induced fission of
$ ^{239} $ Np, with <TKE> experimental data for neutron-induced fission of$ ^{239} $ Pu [64].The <TKE> distribution for neutron-induced fission of
$ ^{235} $ Np is presented in Fig. 5(a), using the deformation parameters of neutron-induced fission of$ ^{237} $ Np. In this figure, the <TKE> distribution of experimental data for neutron-induced fission of$ ^{235} $ U and calculated results for neutron-induced fission of$ ^{235} $ Np are compared. The <TKE> values of$ ^{235} $ Np are higher than those of$ ^{235} $ U, which is normal because the higher proton number of$ ^{235} $ Np increases the <TKE>. This indicates that the calculated results are reliable for this case.In Fig. 5(b), the <TKE> distribution for neutron-induced fission of
$ ^{235} $ Np is presented with the results from two models: the presented model and the Langevin model. By comparing Figure 11 of Ref. [61] and this figure, it can be seen that the results of the Langevin model are similar to those from spontaneous fission, but these values are lower. This could be due to the analysis of fission in this model, especially the definition form of initial excitation energy (adding neutron separation energy) [33]. Of course, this model explains the <TKE> changes well by separating the mode of fission [63]. Also, the difference in <TKE> values is less for fission fragments with mass numbers greater than 130. For fission fragments with mass numbers smaller than 130, this difference is normal, as mentioned before. Furthermore, it is clear that in the scission point model, only one parameter (i.e. deformation of fragments) is approximated, but in the Langevin model there are more parameters which must be fitted for each fissioning system.In Fig. 6, the <TKE> distribution for neutron-induced fission of
$ ^{236} $ Np is presented, using the deformation parameters of neutron-induced fission of$ ^{238} $ Np. The <TKE> values of series 1 are calculated using the$ \beta_i $ values in Table 2 and the <TKE> values of series 2 are calculated using the$ \beta_i $ values in Table 3. As shown in Fig. 4(b), the <TKE> values of series 2 are closer to the other experimental data. This is due to the energy of prompt neutrons in Tsekhanovich's experimental data.In Fig. 7, the calculated <TKE> values for neutron-induced fission of
$ ^{239} $ Np are presented and compared with experimental values for the <TKE> of neutron-induced fission of$ ^{239} $ Pu [64]. These nuclei have the same mass number. This figure shows that the average of total kinetic energy values for nuclei with higher proton number is higher than for nuclei with the same mass number but lower proton number. These results are in good agreement with the Viola and Unik systematic models [65, 66], in which the <TKE> values strongly depend on the proton number of the fissioning system. -
The mean total kinetic energy as a function of fission fragment mass numbers, the <TKE> distribution, has been presented for neutron-induced fission of
$ ^{235-239} $ Np using the scission point model. The sum of deformation parameters of fission fragments decreases for magic fragments with mass numbers between 127 to 142, which are the most common fragments in actinide fission. Also, the sum of deformation parameters of fission fragments is large for symmetric fragments, due to the asymmetric mode of neptunium fission.The results of this method have been compared with the results of other methods, showing that the best results are obtained using the scission point model. There are some dramatic variations in some experimental data, which may be due to kinetic energy measurements after prompt neutron decay.
Also, it is seen that the <TKE> values of odd-odd or even-even fissioning systems is greater than the <TKE> values of even-odd or odd-even fissioning systems. This increase in <TKE> values for neutron-induced fission of nuclei with odd mass numbers, compared with those of nuclei with even mass numbers, does not depend on the atomic number being even or odd. It means this increase in <TKE> values is not related to the odd atomic number of the nuclei, but to the odd mass number.
-
I am grateful to Dr. Mark Dennis Usang for providing the data and for helpful discussions via email.
Kinetic energy distribution for neutron-induced fission of neptunium isotopes
- Received Date: 2020-08-24
- Available Online: 2021-02-15
Abstract: The mean total kinetic energy as a function of fission fragments, the <TKE> distribution, is presented for neutron-induced fission of


 DownLoad: