


 Abstract
 HTML
HTML Reference
 Related
 PDF
PDF


-
Molybdenum (Mo) has been identified as one of the top five refractory metals with high resistance to intense pressure and heat. It is resistant to pressure, corrosion, and high temperature, rendering it an ideal material for nuclear reactors, like the International Thermonuclear Experimental Reactor (ITER), together with accelerator-driven subcritical systems (ADSs) [1]. Mo, a kind of plasma-facing material, has been utilized in fusion reactors. The 3H(d,n)4He reaction can be employed to obtain an output as high as 14 MeV, and the flux rate is approximately 3×10¹⁴n/s [2]. Natural Mo occurs as seven isotopes: 92Mo, 94Mo, 95Mo, 96Mo, 97Mo, 98Mo, and 100Mo, accounting for 14.53%, 9.15%, 15.84%,16.67%, 9.60%, 24.39%, and 9.82%, respectively [3]. Therefore, structural material activation within the fusion reactor should be taken into consideration. Various nuclear reactions can be induced through neutrons at the incident neutron energy of 14 MeV, such as (n,2n), (n,α), (n,p), (n,d), and (n,t) [4]. Consequently, for Mo isotopes, the cross-sectional data induced by neutrons can be used as a vital approach to estimate the radiation damage; integral calculations; and nuclear heating on the shield, blanket, and first wall for the conceptual fusion power reaction [5, 6] together with more associated nuclear engineering calculations. Nonetheless, for Mo isotopes, the reaction cross sections of 92Mo(n,2n)91Mo, 94Mo(n,2n)93mMo, 100Mo(n,2n)99Mo, 98Mo(n,α)95Zr, 100Mo(n,α)97Zr, 92Mo(n,p)92mNb, 96Mo(n,p)96Nb, 97Mo(n,p)97Nb, and 98Mo(n,p)98mNb at about 14 MeV have been determined by various studies [7-68]; nevertheless, substantial differences are found among results obtained from the Exchange Format (EXFOR) experimental nuclear reaction database [69]. The probable cause is the dissimilarities in nuclear parameters, data processing approaches, experimental methodology, and devices. For instance, for the 92Mo(n,2n)91Mo reaction, we found 27 laboratories [7-33] reporting these neutron-induced cross-section profiles obtained experimentally based on the D–T reaction. Typically, only one study used the characteristic gamma-ray method to determine the daughter nucleus activity [22], and the rest used the annihilation radiation or beta counting method. For the 94Mo(n,2n)93mMo reaction, we found that only ten laboratories [5, 6, 21, 31, 34-39] provided neutron-induced cross-section profiles obtained experimentally based on the D–T reaction; meanwhile, four studies reported a single cross-section datum based on a single neutron energy. The energy region at about 14 MeV has been extensively investigated, and 100Mo(n,2n)99Mo data are classified into three bands differing by approximately 30% and 20%, respectively. These include the experimental values from refs. [21, 24, 30, 33, 41, 44], clustered at the 1800 mb cross-section value, as well as values reported in refs. [1, 6, 8, 15, 34, 35, 39-40, 42, 43, 46-49] concentrated at about 1400 mb. However, the values in ref. [45] are focused at about 1130 mb, while those in ref. [9] vary widely in the range of 3790 ± 1895 mb at the 14.5 MeV energy point. Furthermore, there are also significant differences in the nuclear model calculations at about 14 MeV neutron energy, and they are discovered based on results obtained from the software packages EMPIRE-3.2.3 [70] and TALYS-1.95 [71]. For example, in the 98Mo(n,α)95Zr reaction, EMPIRE-3.2.3 calculations produce results that are about three times those produced by TALYS-1.95 calculations at about 14 MeV neutron energy. Similarly, in the 100Mo(n,α)97Zr reaction, EMPIRE-3.2.3 calculation results are also about three times those obtained from the TALYS-1.95 calculations at about 14 MeV neutron energy. In 92Mo(n,p)92mNb and 96Mo(n,p)96Nb reactions, such divergence between the early experimental data is also substantial. For the 14 MeV energy region, these experimental data are distributed in the intervals of 40~85 mb [6, 7, 12, 14, 21, 22, 34-40, 43, 45, 49, 50, 52, 53, 56] and 10~35 mb [5, 6, 12, 19, 21, 22, 24, 31, 34, 35, 37, 40, 43, 45, 47, 50-54, 62], respectively. With regard to the cross-section data obtained from the nuclear reaction 98Mo(n,p)98mNb, such divergence among the early literature results is more prominent, as seen from the distribution of values in the wide range of 2–20 mb [5, 6, 12, 19, 21, 22, 31, 34, 35, 38-40, 43, 45, 50, 53, 56, 63, 66-68], with the maximum value being nearly ten times the minimum value. For the 97Mo(n,p)97Nb reaction, we found just 15 laboratories [5, 6, 21, 22, 35, 37, 40, 43, 45, 50, 51, 54, 63-65] providing neutron-induced cross-section values obtained experimentally based on the D–T reaction, among which two reported abnormal data. One gave significantly larger results at the 14.7 MeV energy point (72.7 ± 4.3 mb) [63] than those reported by others , and the other used inappropriate decay data (Eγ = 743.32 keV, Iγ = 97.95%; obviously, this ray comes from the excited state of the 97Nb product, and not the ground state) [64]. For the 92Mo(n,d)91mNb [51, 72, 73] and 92Mo(n,t)90Nb [74-76] reactions, only three laboratories examined neutron-induced cross-section values obtained at about 14 MeV neutron energy, with the majority at one single neutron energy. Moreover, no consensus has been reached among such values.
Consequently, precisely measuring these reaction cross-sections for Mo isotopes at 14 MeV neutron energy is necessary. In this study, we measured the 92Mo(n,2n)91Mo, 94Mo(n,2n)93mMo, 100Mo(n,2n)99Mo, 98Mo(n,α)95Zr, 100Mo(n,α)97Zr, 92Mo(n,p)92mNb, 96Mo(n,p)96Nb, 97Mo(n,p)97Nb, 98Mo(n,p)98mNb, 92Mo(n,d)91m1Nb, and 92Mo(n,t)90Nb reaction cross sections at three neutron energies in the 13–15 MeV region. Specifically, we used a data acquisition system and gamma-ray counting based on a high-resolution gamma-ray spectrometer. In addition, a coaxial high-purity germanium (HPGe) detector was utilized to absolutely measure the gamma activities of the product nuclei, so as to obtain reaction yields. In the process of irradiation, we wrapped each sample in a pure cadmium foil to avoid the effects of 98Mo(n,γ)99Mo and 92Mo(n,γ)93mMo reactions induced by thermal neutrons on the 100Mo(n,2n)99Mo and 94Mo(n,2n)93mMo reactions, respectively. All results obtained were analyzed and compared with those previously reported, those evaluated using ENDF/B-VIII.0 [77], JEFF-3.3 [78], BROND-3.1 [79], and CENDL-3.1 [80], and the theoretical values acquired through the EMPIRE-3.2.3 [70] and TALYS-1.95 [71] nuclear-reaction modeling tools.
-
The radioactive products were identified to measure the cross sections of nuclear reactions. The detailed procedure is available from published works [81-85]. Only a few salient characteristics associated with our measurements are presented in this report.
-
Natural Mo foil (purity 99.99%; thickness 0.5 mm) circular samples were prepared (diameter 20 mm). Then, they were sandwiched by two layers of Nb foil (thickness 0.5 mm; purity 99.99%) or Al foil (thickness 0.3 mm; purity 99.999%) as neutron flux monitors with the same diameter as the circular Mo foil. Afterwards, Cd foil (thickness 1 mm; purity 99.95%) was used for wrapping to decrease the impacts of the 98Mo(n,γ)99Mo and 92Mo(n,γ)93mMo reactions induced by thermal neutrons on the 100Mo(n,2n)99Mo and 94Mo(n,2n)93mMo reactions, respectively.
A Pd-300 Neutron Generator was used for sample irradiation for 2 h at the Institute of Nuclear Physics and Chemistry, China Academy of Engineering Physics, and the yield was around (3~4)×1010 n/s. Then, the 3H(d,n)4He reaction was utilized to generate neutrons at 14 MeV energy by means of a 200 μA beam current and 135 keV deuteron beam energy. For this neutron generator, a solid tritium–titanium (T–Ti) target, with a thickness of approximately 2.4 mg cm−2, was adopted. At the time of irradiation, the accompanying α-particles were utilized to monitor neutron flux, and an Au–Si surface barrier detector placed at 135° was used to detect them. In this way, the small changes in neutron flux were corrected. We put all samples at 0°, 90°, and 135° compared with the deuteron beam direction. All samples were approximately 5 cm away from the T–Ti target center.
-
For the present experiment, the average neutron energy values adopted for sample irradiation at the emergent angles of 0°, 90°, and 135° were measured according to the following formulae: [86]
$ \overline E ({0^ \circ }) = \frac{{2{L^2}}}{{{R^2}}}\int_0^{{\rm{arctan}}\left( {R/L} \right)} {{E_{{n}}}(\theta )\frac{{{\rm{tan}}\theta }}{{{{\cos }^2}\theta }}} {\rm{ d}}\theta ,$

(1) $ \begin{split} \overline E ({90^ \circ }) = & \frac{{2L}}{{\pi {R^2}}}\int_{\frac{\pi }{2} - \arctan (R/L)}^{\frac{\pi }{2} + \arctan (R/L)} {{E_n}(\theta )}\\ &\times\sqrt {{R^2} - {L^2}{{\tan }^2}\left(\frac{\pi }{2} - \theta \right)} \frac{1}{{{{\cos }^2}\left(\dfrac{\pi }{2} - \theta \right)}}{\rm d}\theta, \end{split} $

(2) $ \begin{split} \overline E ({135^ \circ }) = & \frac{{2L}}{{\pi {R^2}}}\int_{\frac{{3\pi }}{4} - \arctan (R/L)}^{\frac{{3\pi }}{4} + \arctan (R/L)} {{E_n}(\theta )}\\ & \times\sqrt {{R^2} - {L^2}{{\tan }^2}\left(\frac{{3\pi }}{4} - \theta \right)} \frac{1}{{{{\cos }^2}\left(\dfrac{{3\pi }}{4} - \theta \right)}}{\rm d}\theta, \end{split} $

(3) where R stands for target sample radius, and L represents the distance from the T–Ti target to the target sample. Theoretically, the neutron energy was determined according to the formula below [87]:
${E_n}(\theta ) = {\left[ {\frac{{{{({M_d}{M_n}{E_d})}^{\tfrac{1}{2}}}\cos \theta \pm {{({M_d}{M_n}{E_d}{{\cos }^2}\theta + ({M_\alpha } + {M_n})[{M_\alpha }Q + {E_d}({M_\alpha } - {M_n})])}^{\tfrac{1}{2}}}}}{{{M_\alpha } + {M_n}}}} \right]^2},$

(4) where En(θ) and Ed represent the neutron kinetic energy and deuteron beam energy emitted at angle θ, respectively. Additionally, Md indicates the deuteron mass, Mn stands for neutron mass, and Mα represents the mass of an α-particle. In the d–T reaction, the Q-value was 17.6 MeV; as a result, the “±” sign in Eq. (4) was appropriately changed to a “+” sign. In addition, we measured the neutron energies based on cross-sectional ratios of 90Zr(n,2n)89m+gZr and 93Nb(n,2n)92mNb reactions ahead of time [88]. Consequently, at 135°, 90°, and 0° irradiation positions with respect to beam direction, these neutron energy values were measured to be 13.5, 14.1, and 14.8 MeV, respectively. The neutron energy uncertainty at a distance of approximately 5 cm was predicted as 0.2 MeV after taking the sample size and d+ ~4 mm beam diameter into consideration [88].
-
The samples were cooled for 5–1800 min after irradiation, as required in each case, and we measured the gamma-ray activities of 91Mo, 93mMo, 99Mo, 95Zr, 97Zr, 92mNb, 96Nb, 97Nb, 98mNb, 91mNb, 90Nb, and 24Na nuclei through the well-calibrated GEM-60P coaxial HPGe detector (crystal length 72.3 mm; crystal diameter 70.1 mm) at the 1.69 keV energy resolution at 1.332 MeV and about 68% relative efficiency. Individual Mo samples were measured three times at a distance of less than 80 mm from the cap of the detector, with each measuring step approximately lasting for 28 to 32,248 s. The detector efficiency was subject to pre-calibration by means of different normalized γ-ray sources. Partial γ-ray spectra acquired based on Mo samples at around 30 h, 1 h, and 21 min following irradiation completion are shown in Figs. 1-3, respectively. ORTEC® GammaVision® Gamma Spectrum Analysis Software was used to analyze peak area [89] (with the ORTEC® MAESTRO® MCA emulation software package being adopted to obtain and analyze data [89]).
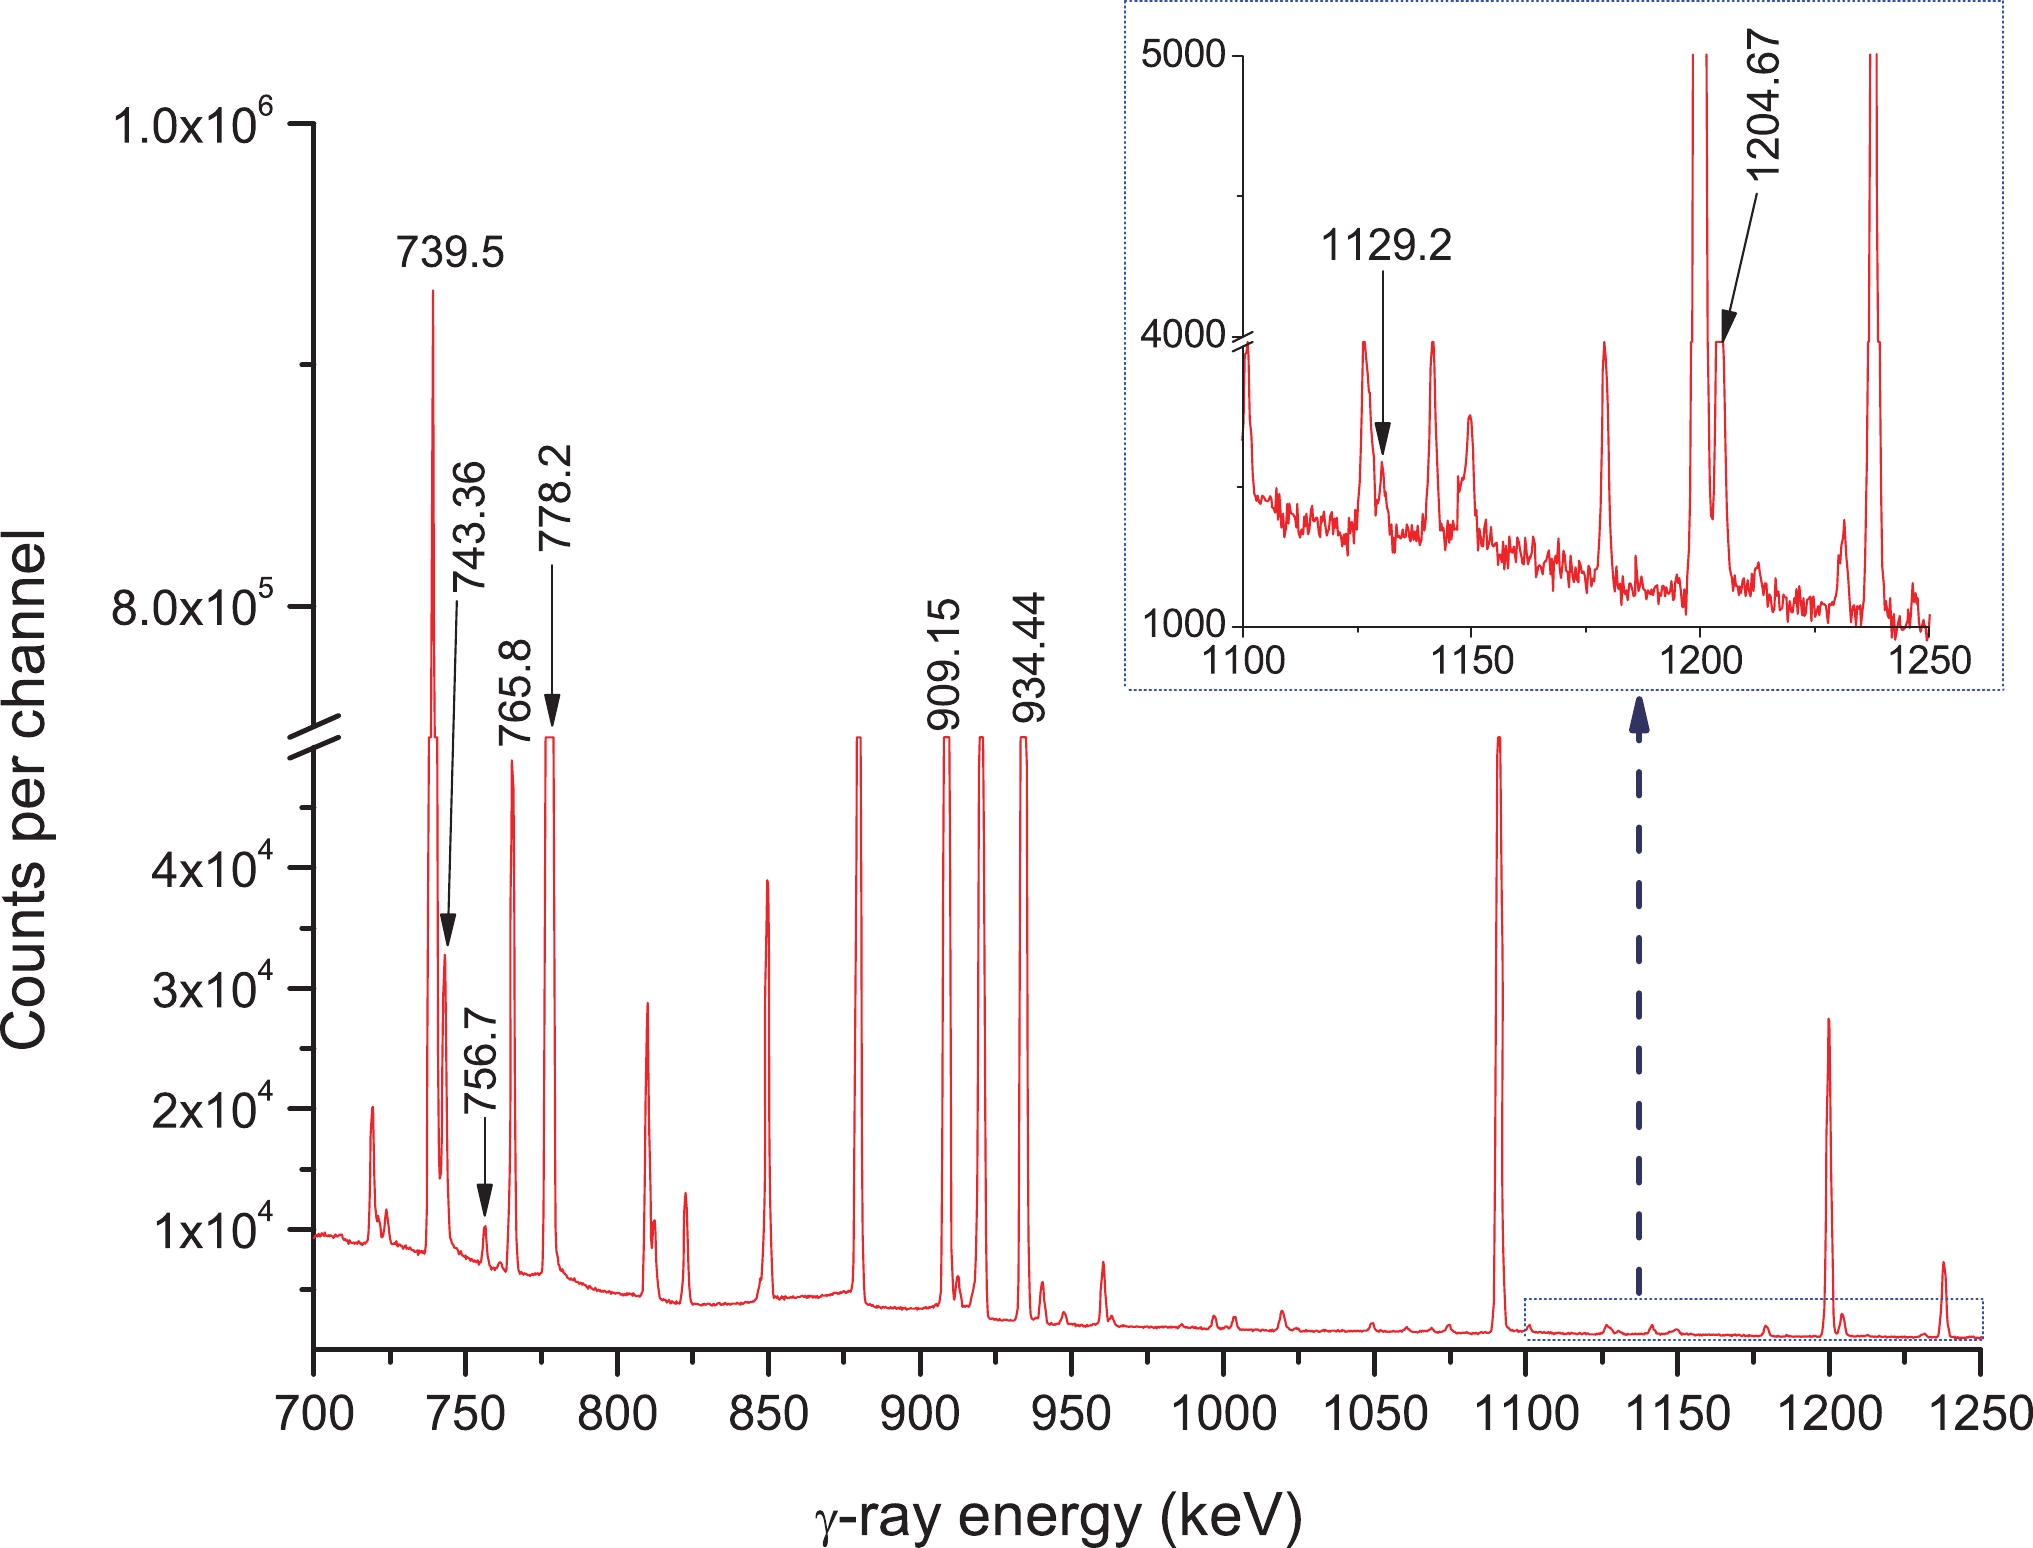
Figure 1. (color online) γ-ray spectrum of Mo obtained after 30 h of cooling following the end of irradiation; acquisition time: about 8.96 h.
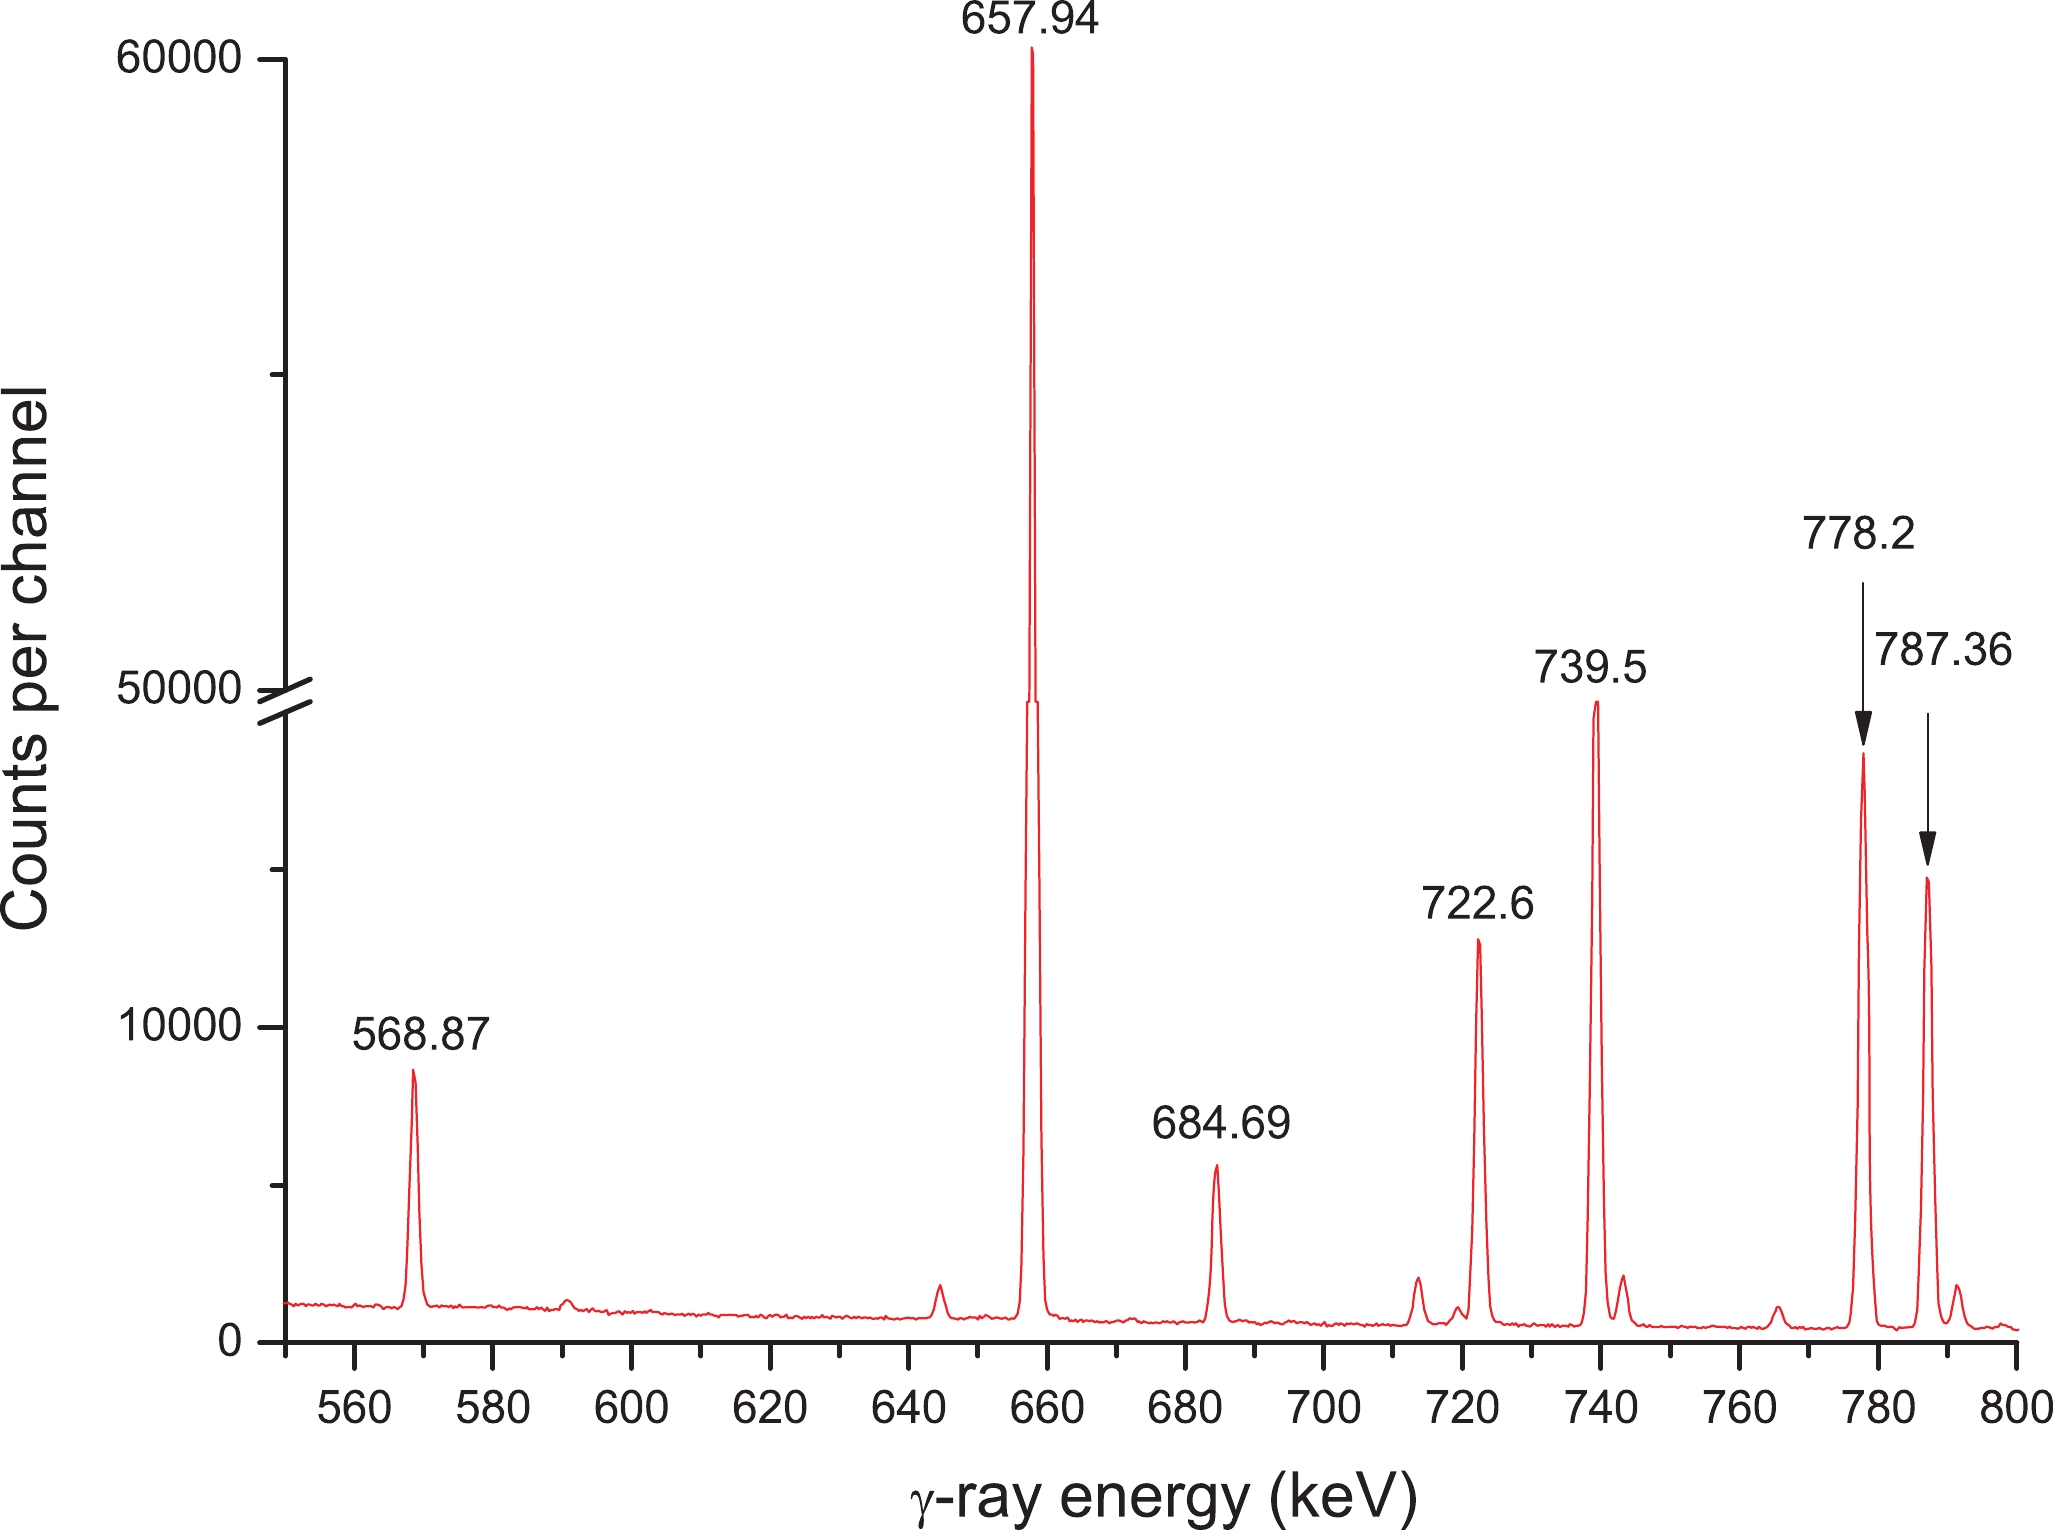
Figure 2. (color online) γ-ray spectrum of Mo obtained after 1 h of cooling following the end of irradiation; acquisition time: about 9 min.
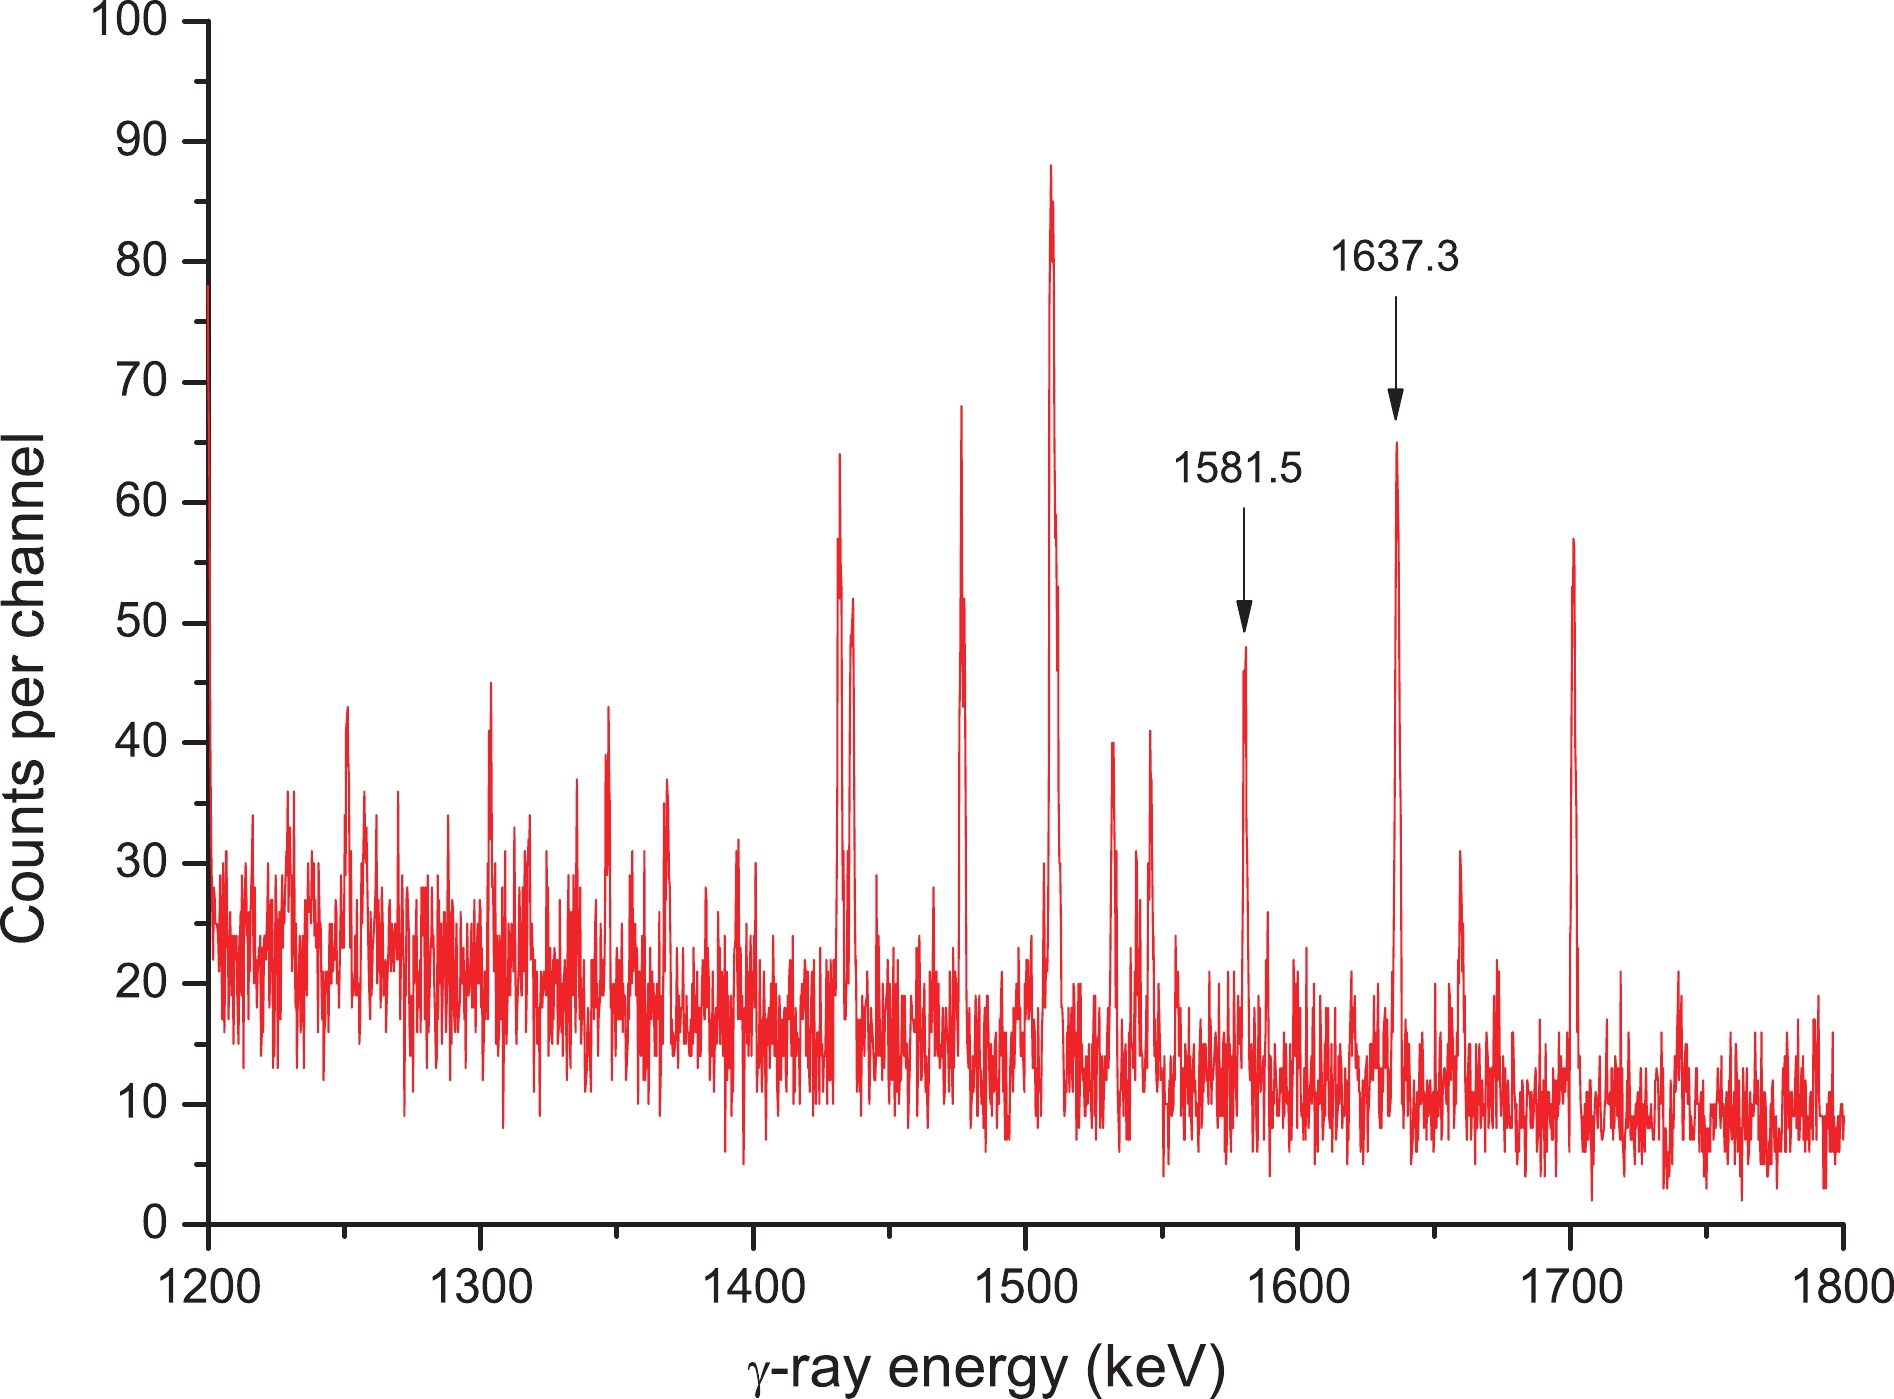
Figure 3. (color online) γ-ray spectrum of molybdenum obtained after 21 min of cooling following the end of irradiation; acquisition time: about 15 min.
Table 1 presents the above-mentioned reactions, together with corresponding reaction product radioactive decay characteristics in addition to the natural abundances of the target isotopes covered in this study.
abundance of target isotope (%) reaction E-threshold /MeV mode of decay (%) half-life of product Eγ /keV Iγ (%) 14.5330 92Mo(n,2n)91Mo 12.810 EC(100) 15.49 m1 1637.3 0.32921 9.159 94Mo(n,2n)93mMo 12.233 IT(99.88) 6.85 h7 684.693 99.98 9.8231 100Mo(n,2n)99Mo 8.378 β-(100) 65.796 h24 739.5 12.2016 24.3937 98Mo(n,α)95Zr 0.000 β-(100) 64.032 d6 756.725 54.3822 9.8231 100Mo(n,α)97Zr 0.000 β-(100) 16.749 h8 743.36 93.0916 14.5330 92Mo(n,p)92mNb 0.000 EC(100) 10.15 d2 934.44 99.154 16.6715 96Mo(n,p)96Nb 2.435 β-(100) 23.35 h5 778.224 96.4522 9.6014 97Mo(n,p)97Nb 1.169 β-(100) 72.1 m7 657.94 98.238 24.3937 98Mo(n,p)98mNb 3.933 β-(99.90) 51.3 m4 787.363 93.4020 14.5330 92Mo(n,d)91mNb 5.398 IT(96.6) 60.86 d22 1204.67 2.03 14.5330 92Mo(n,t)90Nb 11.147 EC(100) 14.60 h5 1129.224 92.75 100 27Al(n,α)24Na 3.249 β-(100) 14.997 h12 1368.6 100 100 93Nb(n,2n)92mNb 8.972 EC (100) 10.15 d2 934.44 99.154 The lower index and italic numbers represent the uncertainties; for example, 14.5330% means 14.53% ± 0.30%, and 15.49 m1 means 15.49 ± 0.01 m. Table 1. Neutron-induced nuclear reactions on Mo and decay data of the associated activation products (taken from ENSDF (2020) [3]).
-
The cross sections for the reactions of interest were determined according to the formula below [82-84]:
${\sigma _x} = \frac{{{{[S\varepsilon {I_\gamma }\eta KMD]}_0}}}{{{{[S\varepsilon {I_\gamma }\eta KMD]}_x}}}\frac{{{{[\lambda AFC]}_x}}}{{{{[\lambda AFC]}_0}}}{\sigma _0},$

(5) where the subscript 0 stands for standard monitor reaction-related terms, the subscript x represents measured reaction-related terms, and F represents the overall activity correction factor:
$F = {f_c} \times {f_s} \times {f_g}.$

(6) In the formula, fc, fs, and fg stand for correction factors for the coincidence sum effect of cascade γ-rays generated from the investigated nuclide, sample self-absorption for the specific gamma-ray energy, and sample counting geometry, respectively. The approach reported in refs. [90, 91] was used in sequence to calculate the coincidence summing correction factor. For the Mo foil, the gamma-ray attenuation correction factor fs as well as geometry correction factor fg were determined based on the equations below, respectively.
${f_s} = \frac{{\mu h}}{{1 - \exp ( - \mu h)}},$

(7) $ {f_g} = \frac{{{{(L + h/2)}^2}}}{{{L^2}}}, $

(8) where μ stands for the linear attenuation coefficient of gamma-rays in Mo at every photon energy E (shown in Table 1), h represents the thickness of sample, and L indicates the distance from the investigated sample to germanium crystal surface. The mass attenuation coefficient (μ/ρ) was calculated based on gamma-ray energies obtained based on ref. [92]. For Mo, its linear attenuation coefficient was determined based on the formula
$\mu = 10.23(\mu /\rho )$ , where 10.23 (in g/cm3) is the density of the Mo sample [93]. With regard to correction factors for sample self-absorption under the specific gamma-ray energy, the h value in Eqs. (7, 8) was deemed to be the sample thickness.In the process of calculating the cross sections of the 96Mo(n,p)96Nb and 97Mo(n,p)97Nb reactions, the contributionsof the interfering reactions 97Mo(n,d)96Nb and 98Mo(n,d)97Nb were subtracted using Eqs. (9, 10) [85], respectively.
$ \begin{split} \sigma {(^{{\rm{nat}}}}{\rm{Mo}(}n,x{{\rm{)}}^{{\rm{96}}}}{\rm{Nb}}) = & 0.1667\sigma {(^{{\rm{96}}}}{\rm{Mo}(}n,p{{\rm{)}}^{{\rm{96}}}}{\rm{Nb}}) \\ &+ 0.0960\sigma {(^{{\rm{97}}}}{\rm{Mo}(}n,d{{\rm{)}}^{{\rm{96}}}}{\rm{Nb}})\\ = & \frac{{{{[S\varepsilon {I_\gamma }\eta KMD]}_0}}}{{{{[S\varepsilon {I_\gamma }KMD]}_x}}}\frac{{{{[\lambda AFC]}_x}}}{{{{[\lambda AFC]}_0}}}{\sigma _0}, \end{split} $

(9) $ \begin{split} \sigma {(^{{\rm{nat}}}}{\rm{Mo}(}n,x{{\rm{)}}^{{\rm{97}}}}{\rm{Nb}}) = & 0.0960\sigma {(^{{\rm{97}}}}{\rm{Mo}(}n,p{{\rm{)}}^{{\rm{97}}}}{\rm{Nb}}) \\ & + 0.2439\sigma {(^{{\rm{98}}}}{\rm{Mo}(}n,d{{\rm{)}}^{{\rm{97}}}}{\rm{Nb}})\\ = & \frac{{{{[S\varepsilon {I_\gamma }\eta KMD]}_0}}}{{{{[S\varepsilon {I_\gamma }KMD]}_x}}}\frac{{{{[\lambda AFC]}_x}}}{{{{[\lambda AFC]}_0}}}{\sigma _0}. \end{split} $

(10) The cross sections of the interfering reactions 97Mo(n,d)96Nb and 98Mo(n,d)97Nb, which are 1.10, 1.96, and 3.29 mb, and 0.40, 0.84, and 1.63 mb at 13.5, 14.1, and 14.8 MeV neutron energies, respectively, were obtained by interpolating the evaluated values of the CENDL-3.1 [80]. The small contribution to the activities of the product nuclei 96Nb and 92mNb from interfering reactions 98Mo(n,t)96Nb and 94Mo(n,t)92mNb could be safely ignored because of the small cross section (<0.2 mb in the neutron energy 13−15 MeV region [80]).
-
In this study, the major sources of uncertainties were due to the detector efficiency (2%−4%), counting statistics (0.1%−15%), sample weight (0.1%), standard uncertainty of cross sections (0.5%−1.5%), measuring and cooling times (0.1%−1%), and γ-ray self-absorption (1%). In addition, other sources include investigated and standard nuclear parameters, such as the characteristic γ-ray branching ratio (0.01%−15%), nuclear half-lives of radioactive products (0.01%−1%), and abundance of target isotopes (0.7%−3.2%). In this study, the quadratic sum rule was applied to analyze uncertainties [94].
-
The 92Mo(n,2n)91Mo, 94Mo(n,2n)93mMo, 100Mo(n,2n)99Mo, 98Mo(n,α)95Zr, 100Mo(n,α)97Zr, 92Mo(n,p)92mNb, 96Mo(n,p)96Nb, 97Mo(n,p)97Nb, 98Mo(n,p)98mNb, 92Mo(n,d)91mNb, and 92Mo(n,t)90Nb reaction cross sections were estimated using TALYS-1.95 code [71] at diverse neutron energies (range, threshold of reaction to 20 MeV). TALYS-1.95 has been developed as the nuclear model code utilized for replicating diverse nuclear reactions involving protons, photons, neutrons, tritons, deuterons, 3He, and α-particles as the projectiles for the target nuclei in order to cover incident energies as high as 200 MeV. Koning and Delaroche had put forward candidate parameters for use in the local optical model, which were adopted to simulate proton and neutron emissions adopted in the ECIS06 code to directly calculate the reaction and transmission coefficients [95]. Accordingly, the Hauser−Feshbach model was used to calculate the total nuclear contribution [96]. For α-particles, we used the folding method shown in ref. [97]. Kalbach [98] established a two-component exciton model, which was utilized to calculate the nuclear contribution before equilibrium. Using the TALYS-1.95 code, the calculation was done by means of the default parameterization available in the code for the prediction of the reaction cross section [99].
EMPIRE-3.2.3 serves as another nuclear reaction code modular system. It was developed by the ENEA/IAEA/BNL joint venture in 1980. Using the EMPIRE-3.2.3 reaction code, the calculations can include each pre-equilibrium (PE), direct nuclear (DI), and potential compound nuclear (CN) reaction. Feshbach et al. (1980) obtained the model for treating the neutron emission data before equilibrium based on multistep direct (MSD) and multistep compound (MSC) theories [100], whereas the DEGAS exciton model code was used to treat proton PE (Herman et al., 2013 [101]). The PCROSS exciton model code was utilized to obtain γ-ray emission data before equilibrium [96]. Coupled-channels calculation was performed using the suitable optical potential (OP), which was then used to describe deformed nuclear direct reactions at low-lying collective states (ECIS code was utilized for such a purpose). We depicted γ-ray CN emission and α-particles in statistical theory parameters put forward by Feshbach and Hauser (1952) [96] using appropriate OPs, γ-ray strength functions (γSF), and nuclear level densities (NLD) based on the RIPL-2 database [102]. This work completed EMPIRE-3.2.3 calculations by the use of default parameters.
-
We used the offline γ-ray spectroscopic measuring technique to measure the cross sections of the92Mo(n,2n)91Mo, 94Mo(n,2n)93mMo, 100Mo(n,2n)99Mo, 98Mo(n,α)95Zr, 100Mo(n,α)97Zr, 92Mo(n,p)92mNb, 96Mo(n,p)96Nb, 97Mo(n,p)97Nb, 98Mo(n,p)98mNb, 92Mo(n,d)91mNb, and 92Mo(n,t)90Nb reactions. In addition, neutron flux for lower threshold reactions like100Mo(n,α)97Zr, 98Mo(n,α)95Zr, 92Mo(n,p)92mNb, 96Mo(n,p)96Nb, 97Mo(n,p)97Nb, 98Mo(n,p)98mNb, and 92Mo(n,d)91mNb was monitored by the27Al(n,α)24Na reaction (Eth = 3.249 MeV). For the reaction 27Al(n,α)24Na, the cross sections were 125.7 ± 0.8, 121.6 ± 0.6, and 111.9 ± 0.5 mb at 13.5, 14.1, and 14.8 MeV neutron energies, respectively [103]. Moreover, the neutron flux for higher-threshold reactions such as 92Mo(n,2n)91Mo, 94Mo(n,2n)93mMo, 100Mo(n,2n)99Mo, and 92Mo(n,t)90Nbwas monitored using the 93Nb(n,2n)92mNb reaction (Eth = 8.792 MeV). For the reaction 93Nb(n,2n)92mNb, the cross sections were 457.9 ± 6.8, 459.8 ± 6.8, and 459.7 ± 5.0 mb at 13.5, 14.1, and 14.8 MeV neutron energies, respectively [103]. We then compared these experimental data with the evaluated data from the ENDF/B-VIII.0 [77], JEFF-3.3 [78], BROND-3.1 [79], and CENDL-3.1 [80] data libraries. In addition, we compared these results with those obtained by employing the theoretical model codes EMPIRE-3.2.3 [70] and TALYS-1.95 [71]. The present experimental results are given in Table 2. The various reactions are discussed below.
reaction cross-sections (in mb) at various
neutron energies (in MeV)En=13.5±0.2 En=14.1±0.2 En=14.8±0.2 92Mo(n,2n)91Mo 94±10 112±12 141±15 94Mo(n,2n)93mMo 1.1±0.1 2.1±0.2 3.7±0.3 100Mo(n,2n)99Mo 1466±88 1400±98 1436±101 98Mo(n,α)95Zr 5.5±0.5 5.6±0.4 5.8±0.4 100Mo(n,α)97Zr 1.8±0.2 2.1±0.2 2.3±0.2 92Mo(n,p)92mNb 85±6 73±5 67±5 96Mo(n,p)96Nb 23±2 25±2 29±2 97Mo(n,p)97Nb 15.7±1.1 18.6±1.2 19.5±1.2 98Mo(n,p)98mNb 2.9±0.2 3.2±0.2 3.5±0.3 92Mo(n,d)91mNb 128±23 135±24 171±29 92Mo(n,t)90Nb 29±5 (μb) 32±6 (μb) 41±6 (μb) Table 2. Measurements of cross-sections
-
As shown in Table 2 and Fig. 4, the evaluation excitation curves obtained via ENDF/B-VIII.0 [77], JEFF-3.3 [78], BROND-3.1 [79] as well as CENDL-3.1 [80] are nearly identical to the theoretical excitation curves obtained using the EMPIRE-3.2.3 [70] and TALYS-1.95 [71] nuclear-reaction modeling tools. The results obtained from our experiment at about 14 MeV neutron energy increase as the neutron energy increases, which is also similar to the theoretical data and the data obtained from the databases, but there are slight differences among these. The result obtained in the present experiment mildly increased compared with the EMPIRE-3.2.3-obtained theoretical excitation curve and the four evaluation excitation curves obtained at 13.5 MeV neutron energy. However, at 14.1/14.8 MeV neutron energy, the values obtained in this experiment slightly decreased compared with those obtained from the TALYS-1.95-derived theoretical excitation curve and four evaluation excitation curves. With regard to the reaction 92Mo(n,2n)91Mo, 27 laboratories [7-33] reporting the neutron-induced experimental cross-section data based on the D–T reaction were found. Of these, 26 used the annihilation radiation (511 keV) or beta counting method, while only one used the characteristic gamma-ray method to determine the daughter nucleus activity. Our report within the limits of experimental error is consistent with the results obtained from TALYS-1.95 and the value reported by Abboud et al. [26] at the energy point of 13.5 MeV. At the 14.1 and 14.8 MeV neutron energies, the experimentally established cross-section values conformed to the limits of experimental error and were consistent with those reported by Yasumi [13], Kanda [14], and Karolyi et al. [29] at related energy values. Additionally, Brollry et al. [10], Strohal et al. [24], and Araminowicz and Dresler [30] reported apparently higher cross-section values compared with those from the ENDF/B-VIII.0 [77], JEFF-3.3 [78], and BROND-3.1 [79] evaluations, as well as those from theoretical calculations with the EMPIRE-3.2.3 [70] and TALYS-1.95 [71] codes.

Figure 4. (color online) Plot of 92Mo(n,2n)91Mo reaction cross-section values from the present work along with the literature data, evaluated data obtained from the ENDF/B-VIII.0, BROND-3.1, JEFF-3.3, and CENDL-3.1 libraries, as well as the values calculated using TALYS-1.95 and EMPIRE-3.2.3 as a function of neutron energy.
-
For the reaction 94Mo(n,2n)93mMo, only ten measurements have so far been presented in the related field [5, 6, 21, 31, 34-39]. For the reaction 94Mo(n,2n)93mMo, we determined the cross section by the 93Nb(n,2n)92mNb monitor reaction with a high threshold, and each sample was packaged within pure Cd foil, to avoid the impact of deuterium accumulation-derived low-energy neutrons within the tritium target over a period of time, as well as that of background neutrons. Figure 5 shows the cross sections for thereaction 94Mo(n,2n)93mMo and the calculation results obtained fromTALYS-1.95 code as continuous lines. As observed from Fig. 5, within the 13−15 MeV energy region, except for the value reported by Ikeda et al. [35] at 13.52 MeV, all other previous experimental data, as well as the results obtained in the present work, are lower than those acquired based on TALYS-1.95. Within the energy range of 13−14.5 MeV, we obtained consistent outcomes relative to those reported from refs. [6, 38] in the limit of the experimental uncertainty; nevertheless, our results are lower than those obtained from refs. [35, 37]. Clearly, at the neutron energy point of 14.8 MeV, the value obtained by Amemiya et al. [14] conformed to ours. However, such experimental data nonetheless are lower than those acquired based on TALYS-1.95 and those reported in refs. [35, 37-39]. Regarding the experimental results reported by Ikeda et al. [35] at 13.52 MeV, we highly suspect that there was an error in the data entry.
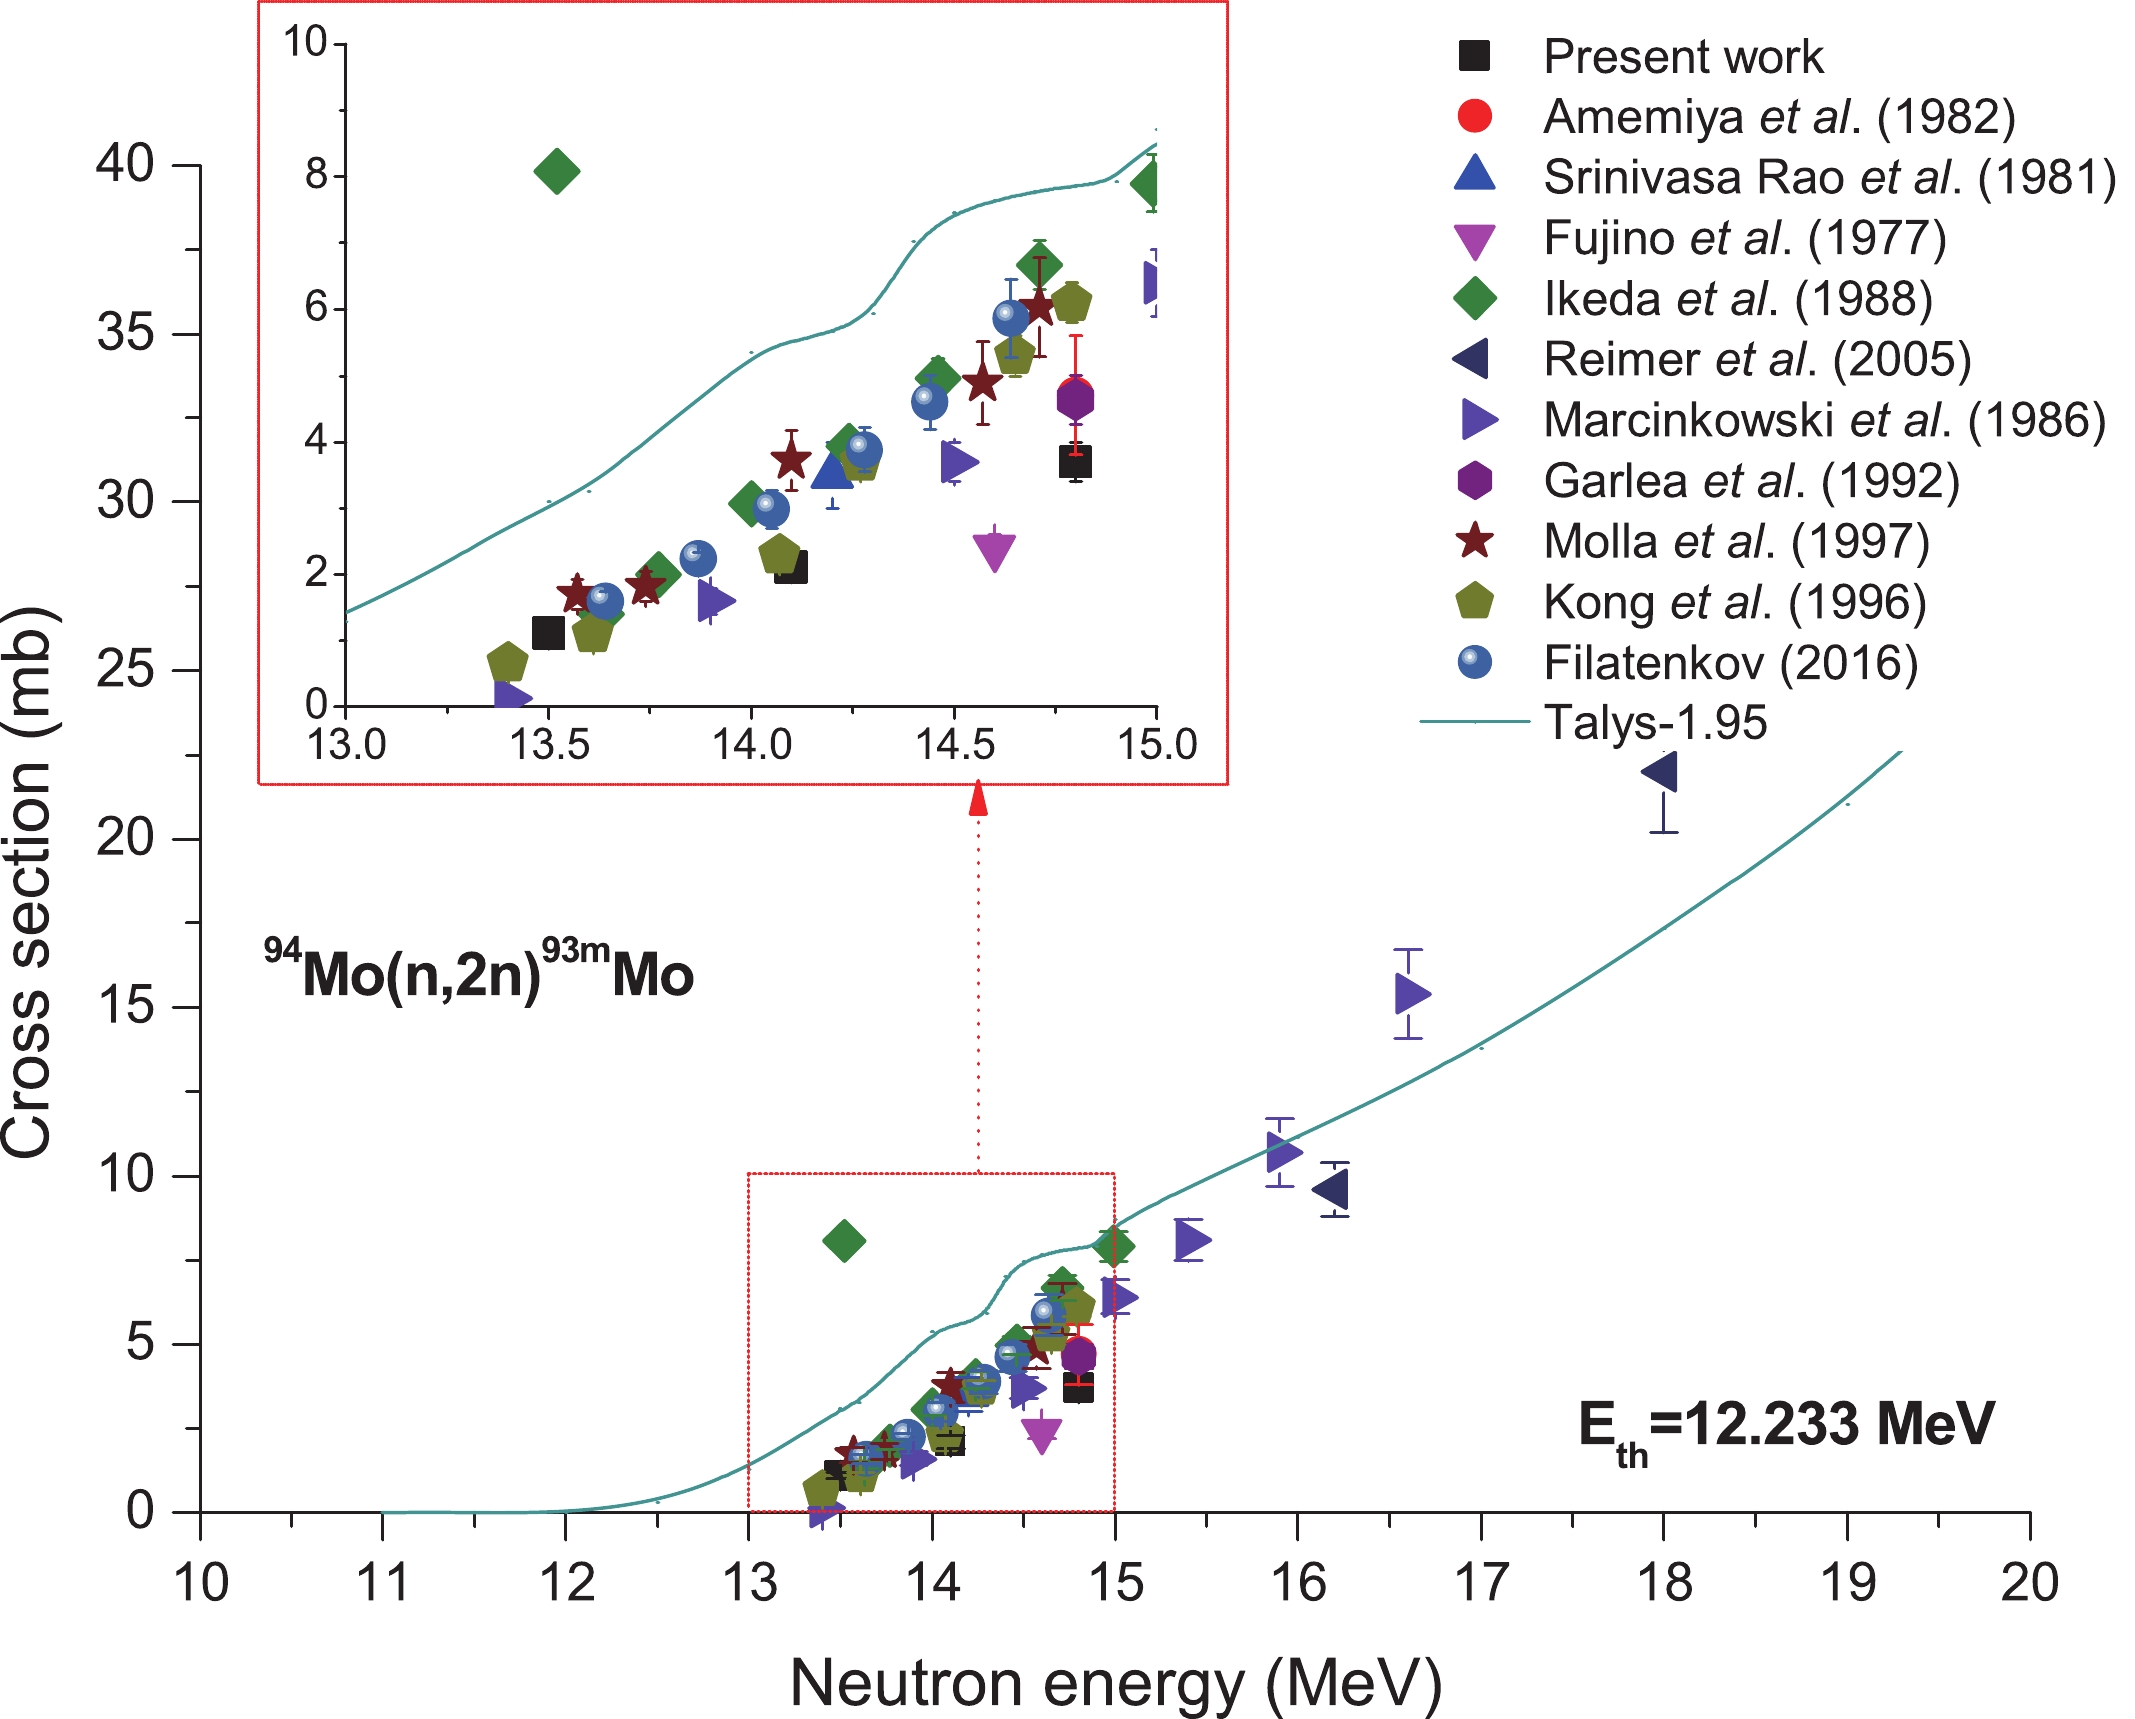
Figure 5. (color online) Plot of 94Mo(n,2n)93mMo reaction cross-section values obtained in the present work along with the literature data and the values calculated from TALYS-1.95 as a function of neutron energy.
-
So far, 23 laboratories have reported the cross-section values for this reaction based on experiments; these can be found in the nuclear reaction database regarding Mo isotopes at about 14 MeV neutron energy. As a result, this database serves as a solid foundation to verify the experimental result reliability as well as theoretical calculation model correctness in this study. As shown in Fig. 6, the trends and shapes of excitation curves taken from the ENDF/B-VIII.0 [77] (the same as CENDL-3.1 [80]), JEFF-3.3 [78] and BROND-3.1 [79] databases are almost identical to those obtained from the theoretical excitation curves through EMPIRE-3.2.3 [70] together with TALYS-1.95 [71] nuclear-reaction modeling tools within the range of neutron energy of threshold−20 MeV, and there were only minor heterogeneities among them. The cross-section data of the 100Mo(n,2n)99Mo reaction obtained from the experiment are classified as three bands with differences of approximately 30% and 20%, respectively. In addition, the experimental data reported by refs. [21, 24, 30, 33, 41, 44] can be classified at about 1800 mb cross-section values. The data reported by refs. [1, 6, 8, 15, 34, 35, 39, 40, 42, 43, 46-49] are centered around 1400 mb, whereas those reported by ref. [45] are concentrated at about 1130 mb. The data reported by ref. [9], however, vary over a large region of 3790 ± 1895 mb at the energy point of 14.5 MeV.
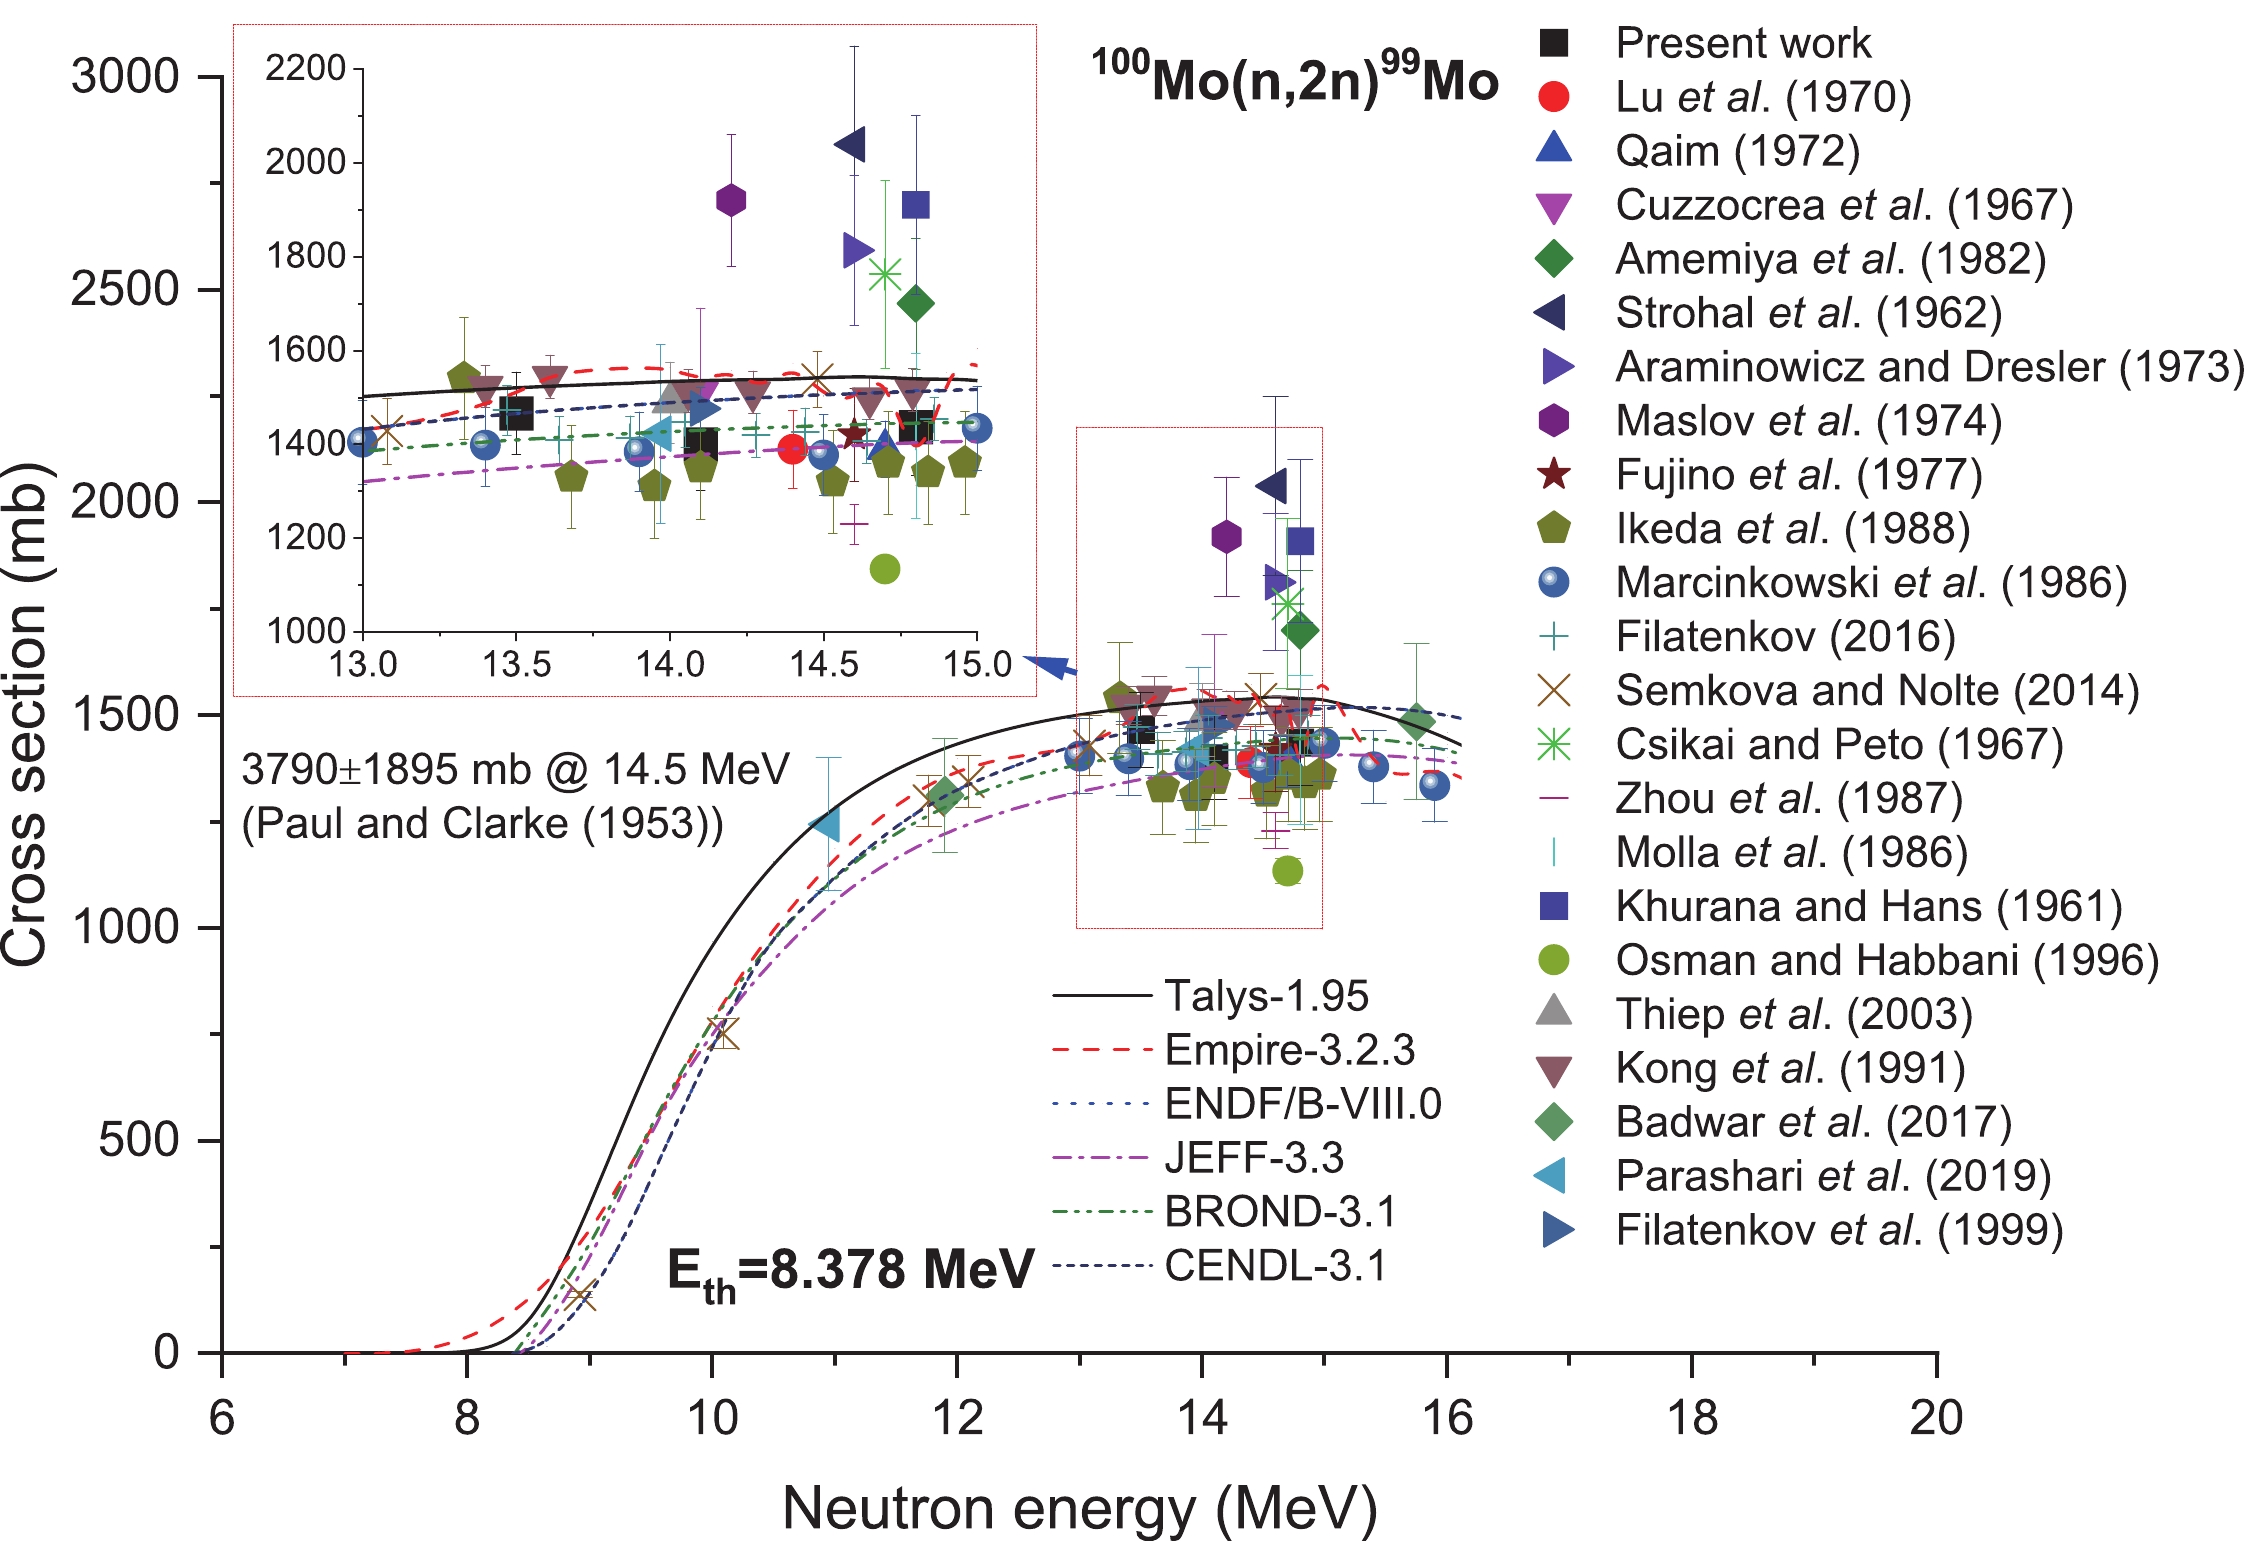
Figure 6. (color online) Plot of 100Mo(n,2n)99Mo reaction cross-section values from the present work along with the literature data, evaluated data obtained from ENDF/B-VIII.0, BROND-3.1, JEFF-3.3, and CENDL-3.1 libraries as well as the calculated values from TALYS-1.95 and EMPIRE-3.2.3 as a function of neutron energy.
The experimental data obtained from this work, within the limits of experimental error, conform to results obtained from three ENDF/B-VIII.0 [77], CENDL-3.1 [80], and BROND-3.1 [79] database-obtained evaluation excitation curves. The two theoretical excitation curves at 13.5 MeV neutron energy are somewhat larger than those obtained by JEFF-3.3 [78] at this neutron energy point. However, at the 14.1 and 14.8 MeV neutron energies, the experimental data conform to the data of the two evaluation excitation curves taken from JEFF-3.3 [78] and BROND-3.1 [79], but are somewhat lower than the values obtained via ENDF/B-VIII.0 [77] and CENDL-3.1 [80], together with the two theoretical excitation curves at the corresponding energies. Within the 13−15 MeV energy region, Parashari et al. [1], Marcinkowski et al. [6], Lu et al [8], Qaim [15], Cuzzocrea et al. [19], Fujino et al. [34], Ikeda et al. [35], Filatenkov [39], Kong et al. [47], and Filatenkov et al. [49] reported the same results as our values obtained based on the fitting line at identical neutron energy points. As for cross-section data obtained from Amemiya et al. [21], Strohal et al. [24], Araminowicz and Dresler [30], Maslov et al. [33], and Khurana and Hans [44], they are significantly larger than those from the four evaluation excitation curves as well as two theoretical excitation curves and the present results in addition to the values reported in refs. [1, 6, 8, 15, 19, 34, 35, 39, 47, 49] at the corresponding energies. The result of Paul and Clarke [9], 3790 ± 1895 mb at the neutron energy of 14.5 MeV, is not included because it is too high to be clearly displayed compared to the other data near 14 MeV.
-
Figure 7 presents the experimental cross-section values for reaction 98Mo(n,α)95Zr. The values obtained based on TALYS-1.95 and EMPIRE-3.2.3 calculation and the evaluation values acquired based on the ENDF/B-VIII.0 [77], JEFF-3.3 [78], BROND-3.1 [79], and CENDL-3.1 [80] libraries are shown in Fig. 7 as continuous lines. Clearly, within the energy range of 13−15 MeV, our values conform to those reported from refs. [21, 35, 37, 39, 40, 49, 51-55] in the limit of experimental uncertainties, but are lower than the values obtained from ref. [50] and data obtained from EMPIRE-3.2.3 calculation. However, the values are higher than those obtained from TALYS-1.95 calculation. Consistent with the trends for the 92Mo(n,2n)91Mo and 94Mo(n,2n)93mMo reactions, the cross section for reaction 98Mo(n,α)95Zr in the 13−15 MeV energy range increases as the neutron energy increases.
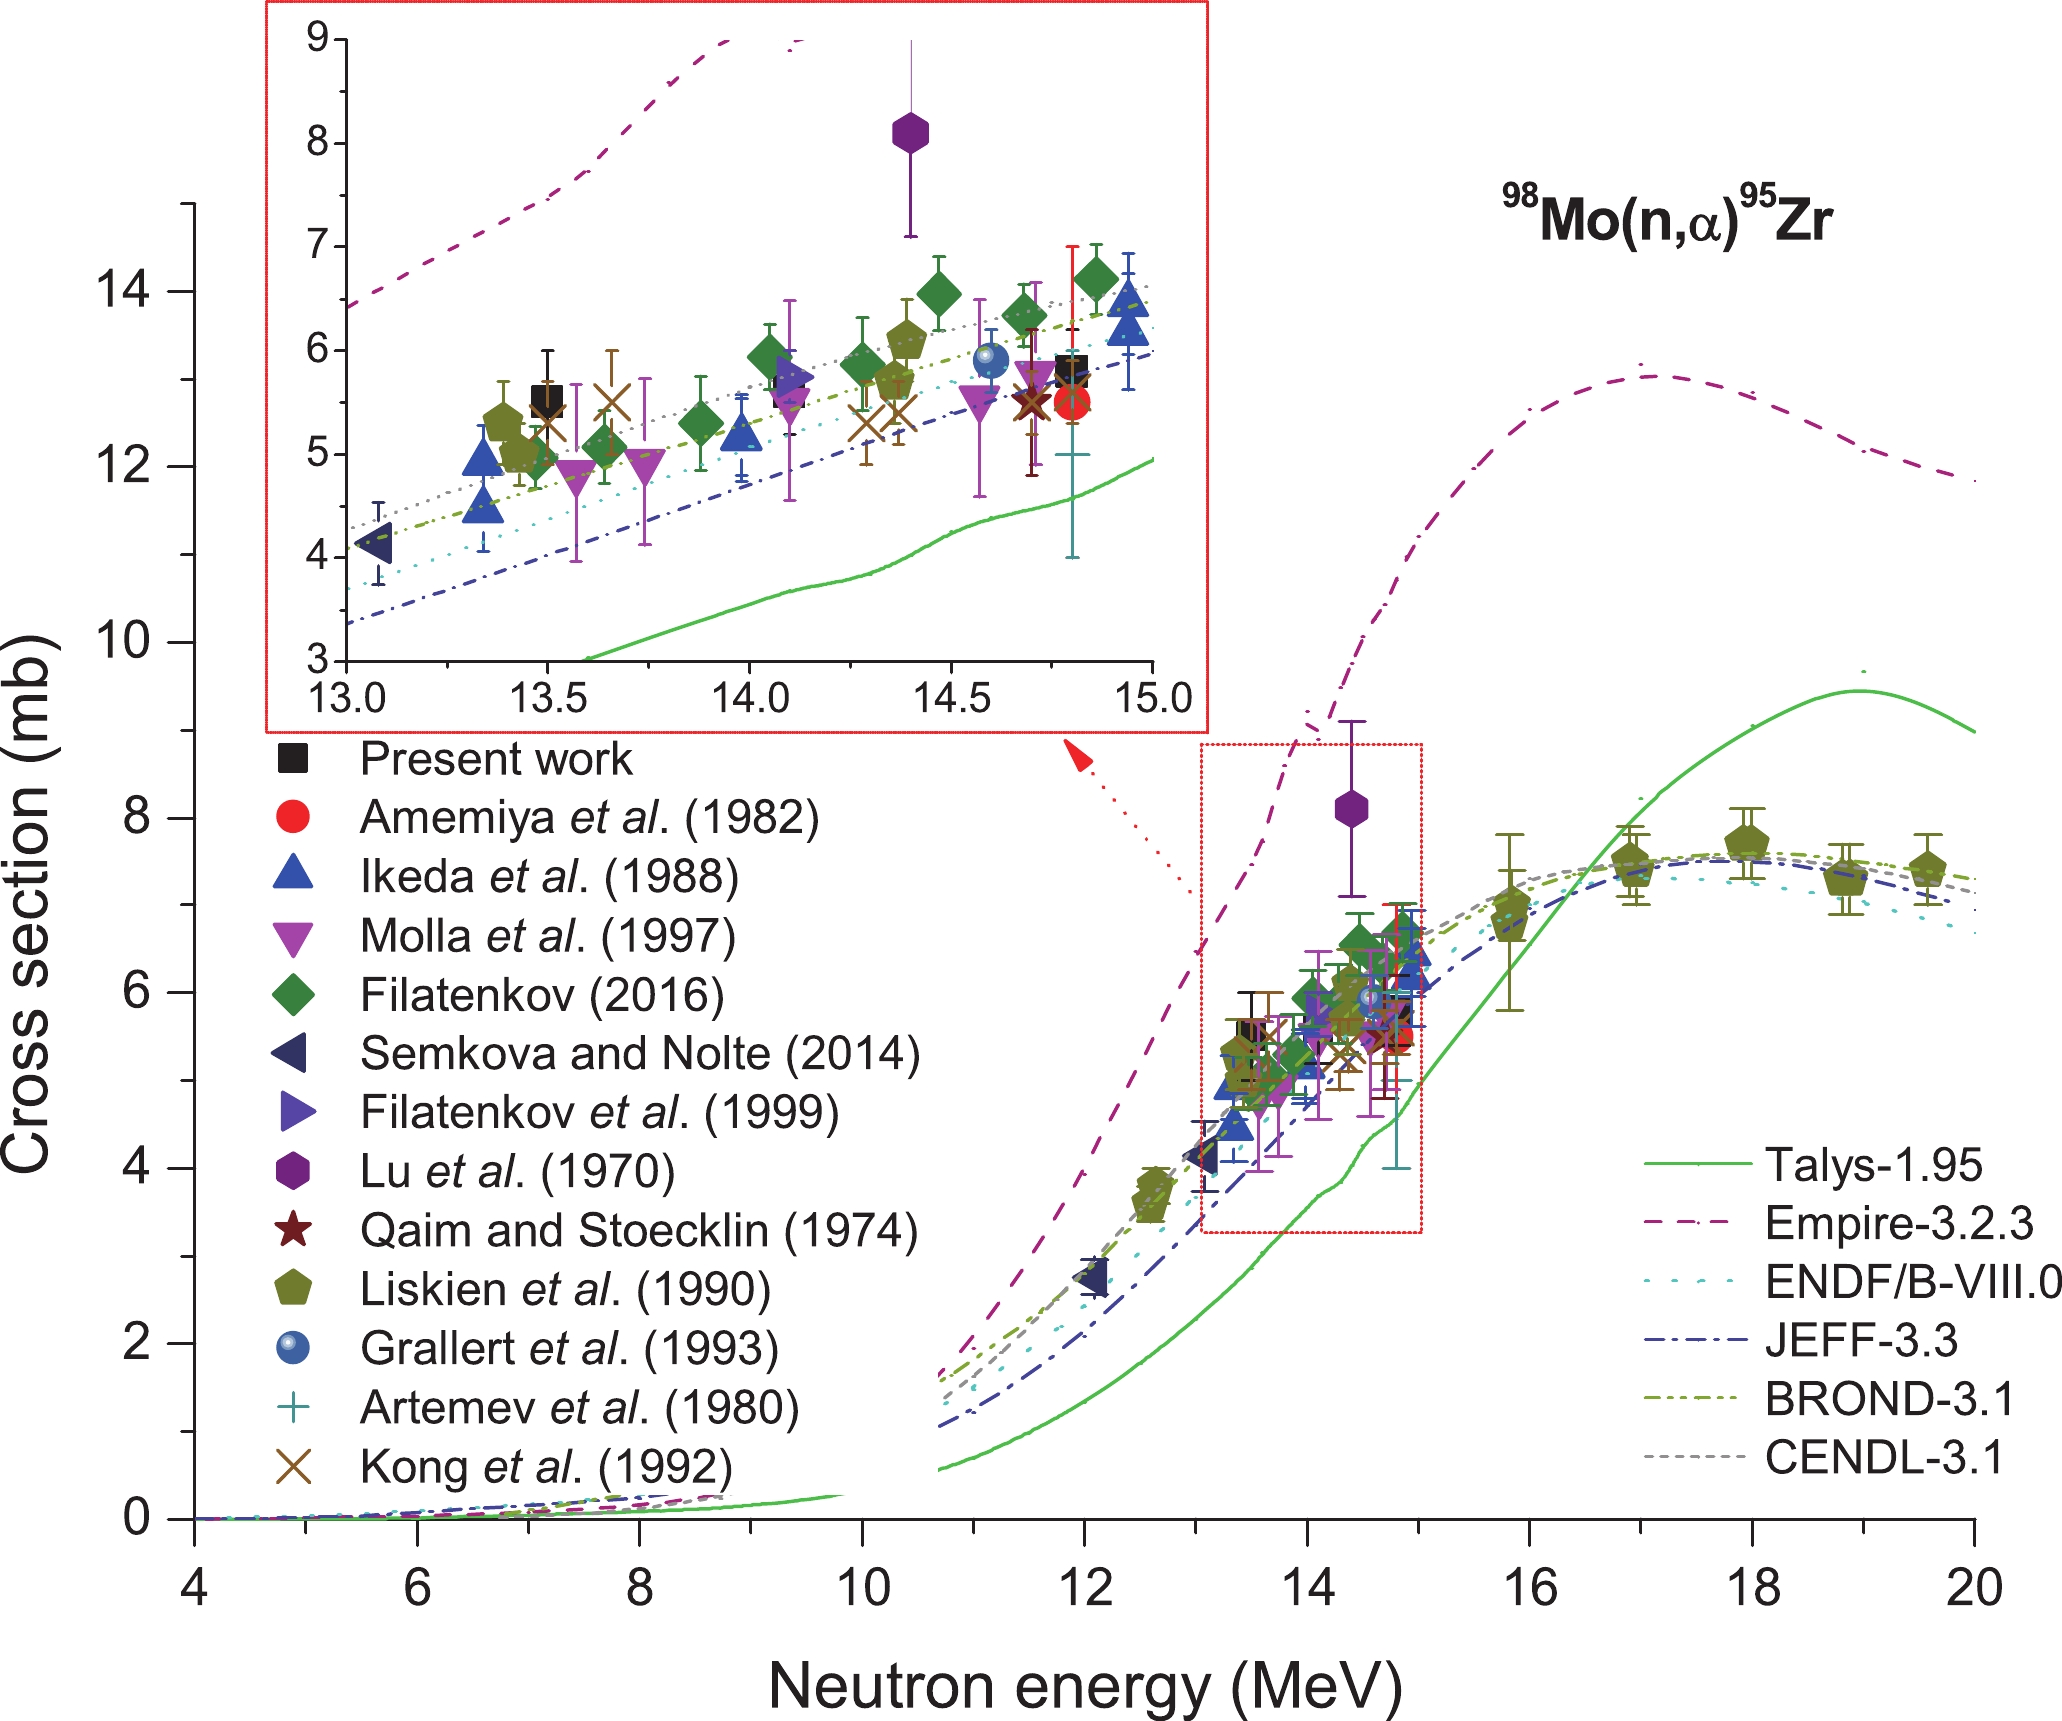
Figure 7. (color online) Plot of 98Mo(n,α)95Zr reaction cross-section values from the present work along with the literature data, evaluated data obtained from ENDF/B-VIII.0, BROND-3.1, JEFF-3.3 and CENDL-3.1 libraries, and calculated values obtained from TALYS-1.95 and EMPIRE-3.2.3 as a function of neutron energy.
-
Figure 8 shows the cross sections of reaction 100Mo(n,α)97Zr based on the results obtained in refs. [6, 19, 24, 35, 39, 40, 51-54]. In Fig. 8, the values acquired based on EMPIRE-3.2.3 and TALYS-1.95 calculations and evaluated data obtained based on the ENDF/B-VIII.0 [77], BROND-3.1 [78], JEFF-3.3 [79], and CENDL-3.1 [80] libraries are expressed as continuous lines. As shown in Fig. 8, there are great dissimilarities in the results obtained from the nuclear model calculations, namely EMPIRE-3.2.3 [70] and TALYS-1.95 [71], around 14 MeV neutron energy. In reaction 100Mo(n,α)97Zr, those EMPIRE-3.2.3 calculation results are about three times the TALYS-1.95 calculation results at about 14 MeV neutron energy. Meanwhile, the present result is consistent with results taken from refs. [35, 52] and the evaluation values acquired based on ENDF/B-VIII.0 [77] and JEFF-3.3 [79] at 13.5 MeV neutron energy, within the limits of experimental error. At the neutron energy of 14.8 MeV, our results conform to those reported by Artemev et al. [54] and results obtained based on TALYS-1.95 within the scope of experimental error, but are lower compared with the values obtained from refs. [6, 35, 51, 53], the EMPIRE-3.2.3 calculations, and the evaluated data obtained from the JEFF-3.3 [78], BROND-3.1 [79], and CENDL-3.1 [80] libraries under this neutron energy point.
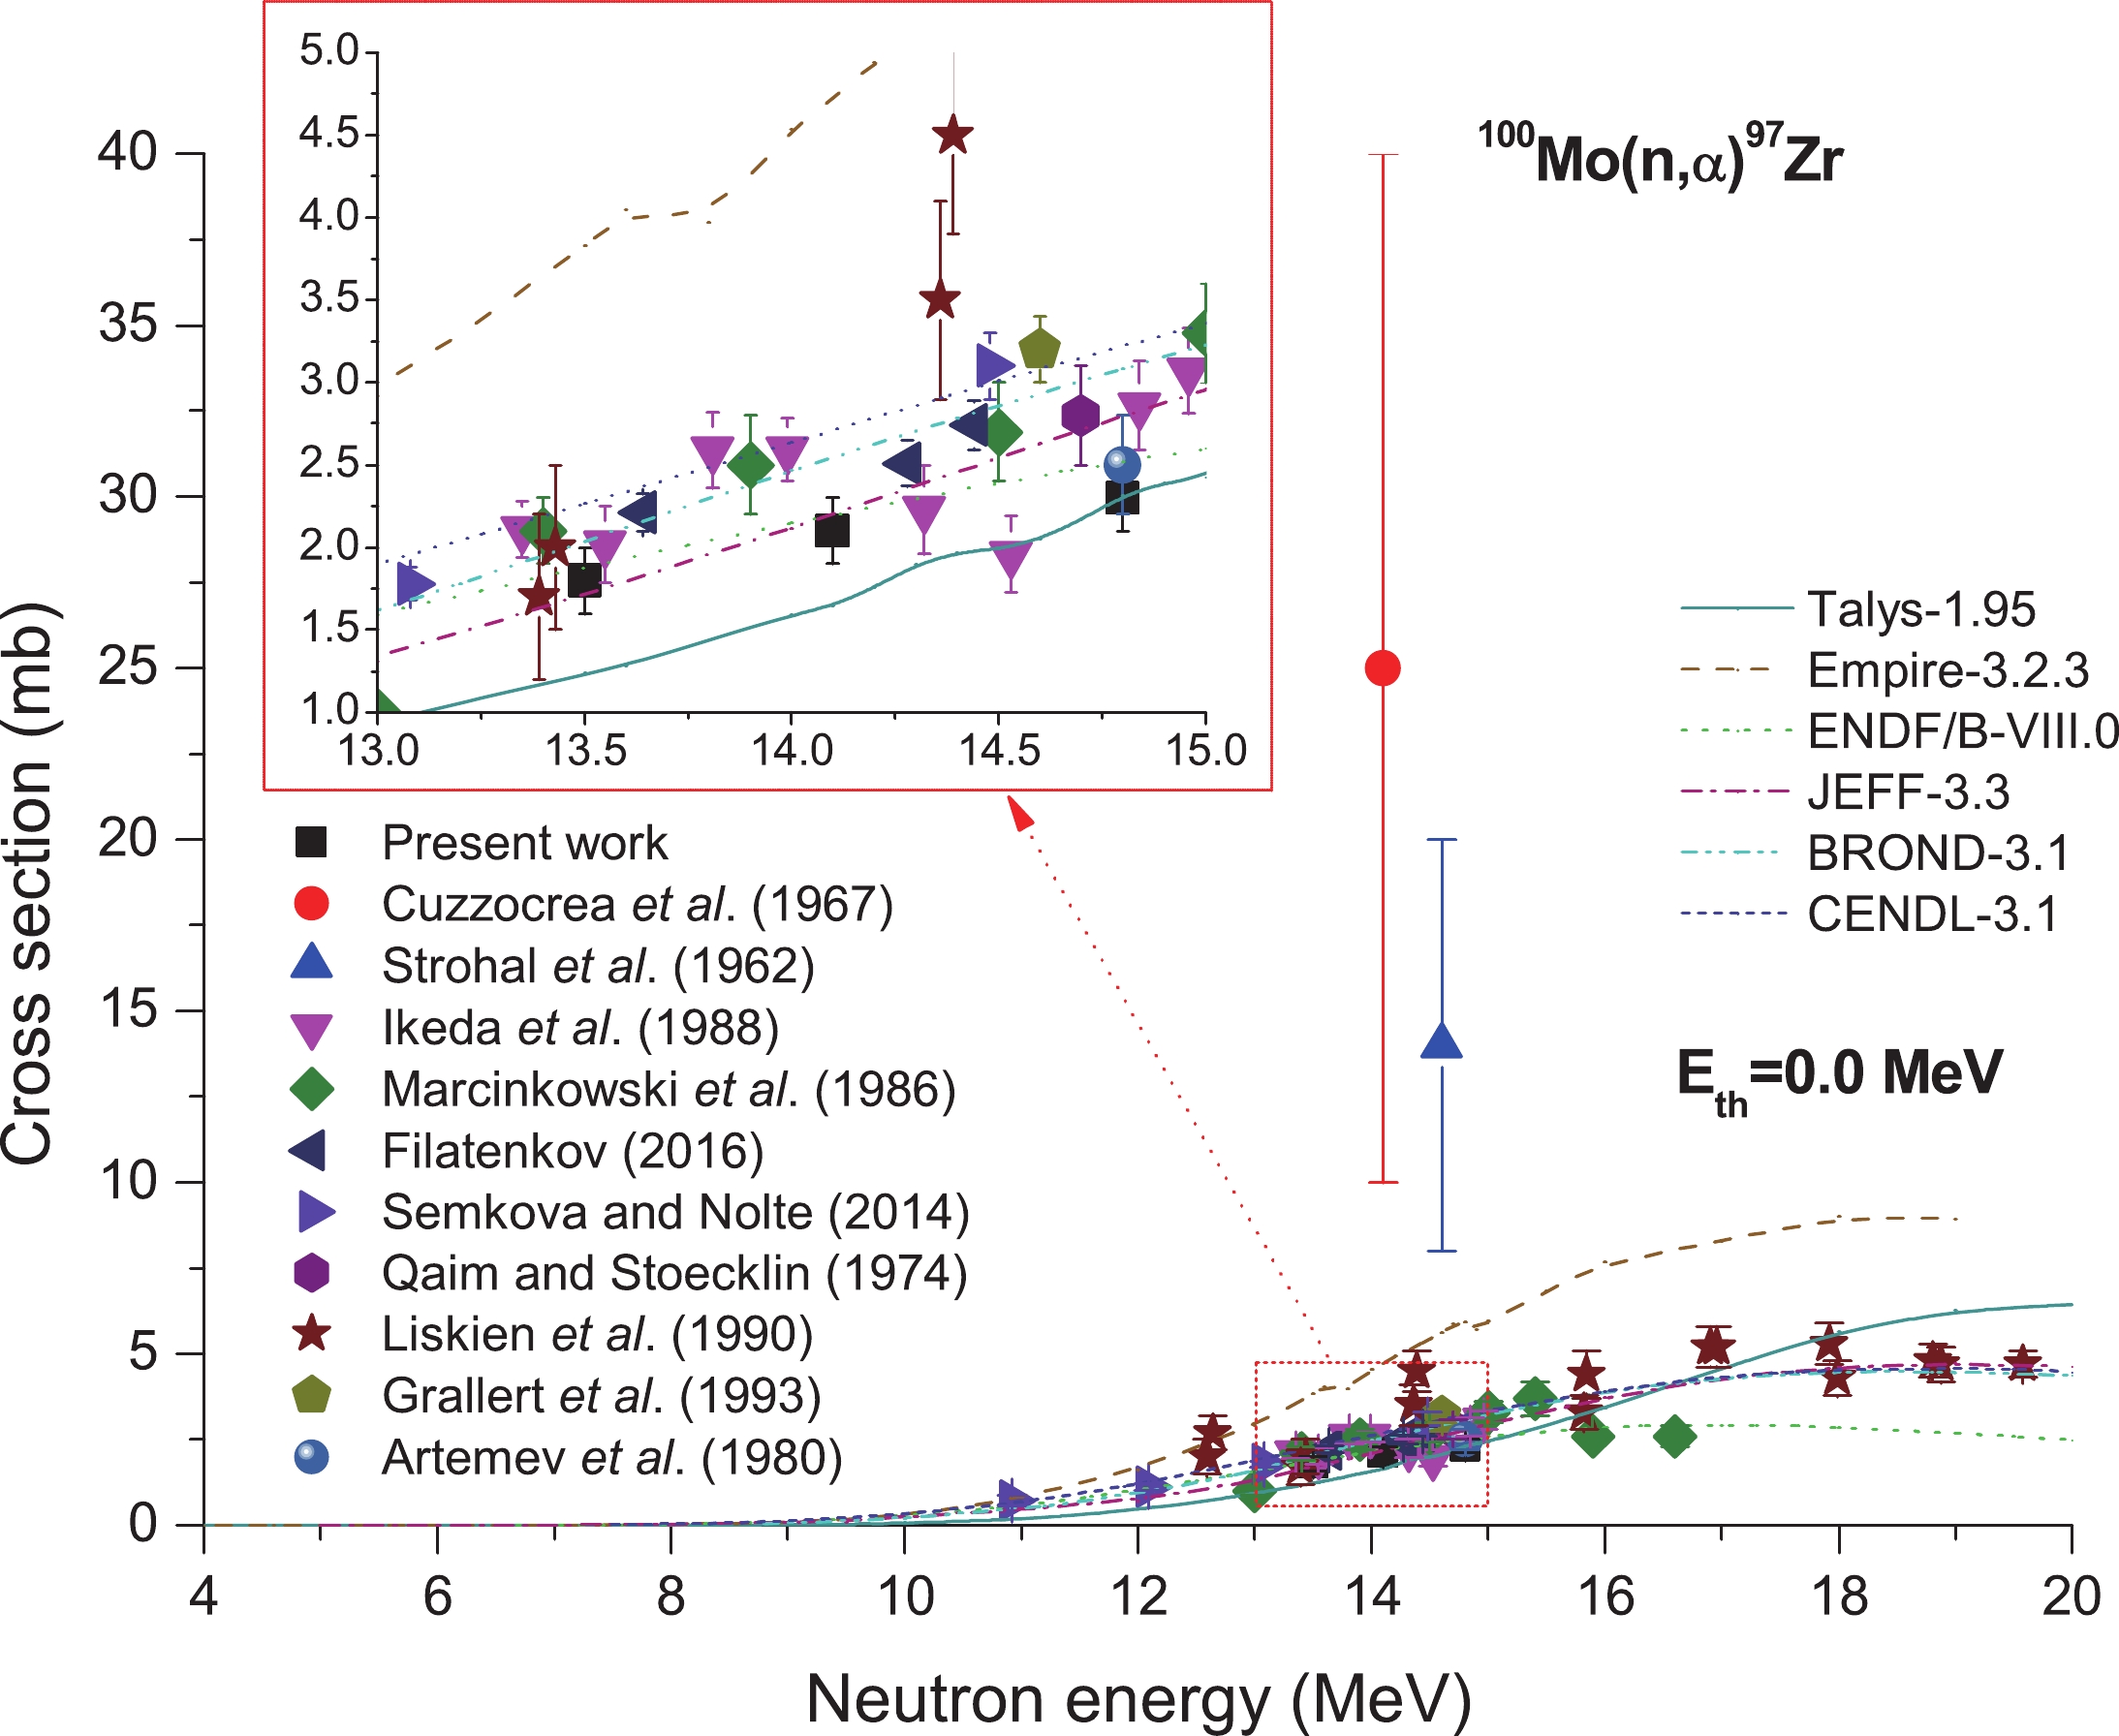
Figure 8. (color online) Plot of 100Mo(n,α)97Zr reaction cross-section values from the present work along with the literature data, evaluated data obtained from ENDF/B-VIII.0, BROND-3.1, JEFF-3.3, and CENDL-3.1 libraries, and calculated values obtained from TALYS-1.95 and EMPIRE-3.2.3 as a function of neutron energy.
-
In the reaction 92Mo(n,p)92mNb, the following conditions were adopted for measurement, including gamma-rays at 934.4 keV (Iγ = 99.15%) emitted via 92mNb (half-life, T1/2 = 10.15 d). Almost all the measurements reported in the literature also use the same decay data as the present work. Figure 9 shows our obtained data and those provided by refs. [6, 7, 12, 14, 21, 22, 34-40, 43, 45, 49, 50, 52-54, 56-60], and the values obtained from TALYS-1.95 calculations. As can be seen from Fig. 9, in the 13.5−14.8 MeV region, although a high amount of experimental data are present in the early stage, the divergence is also very obvious. Within 13.5−14.8 MeV neutron energy, our values conform to the experimental data obtained from refs. [6, 12, 21, 22, 34-40, 43, 45, 49, 50, 56-60] within the limits of experimental uncertainty. As shown in Fig. 8, all data in the present study are lower than the values reported by Sigg and Kuroda [7] as well as Liskien et al. [52]. The values are, however, somewhat higher than those published by Kanda [14], Grallert et al. [53], and Artemev et al. [54].

Figure 9. (color online) Plot of 92Mo(n,p)92mNb reaction cross-section values from the present work along with the literature data and the calculated values obtained from TALYS-1.95 as a function of neutron energy.
-
For the reaction 96Mo(n,p)96Nb, 21 previous reports are available in refs. [5, 6, 12, 19, 21, 22, 24, 31, 34, 35, 37, 40, 43, 45, 47, 50-54, 62]. As clearly seen from Fig. 10, at 13.5−14.8 MeV neutron energy, our cross-section data conform to the theoretical values obtained from EMPIRE-3.2.3 [70] and the values reported by Kong et al. [47] in the scope of experimental uncertainty. Nonetheless, these values are higher than those obtained from ref. [15] and those obtained based on ENDF/B-VIII.0 [77], JEFF-3.3 [78], BROND-3.1 [79], and CENDL-3.1 [80], but smaller than those obtained from Bramlitt and Fink [12].
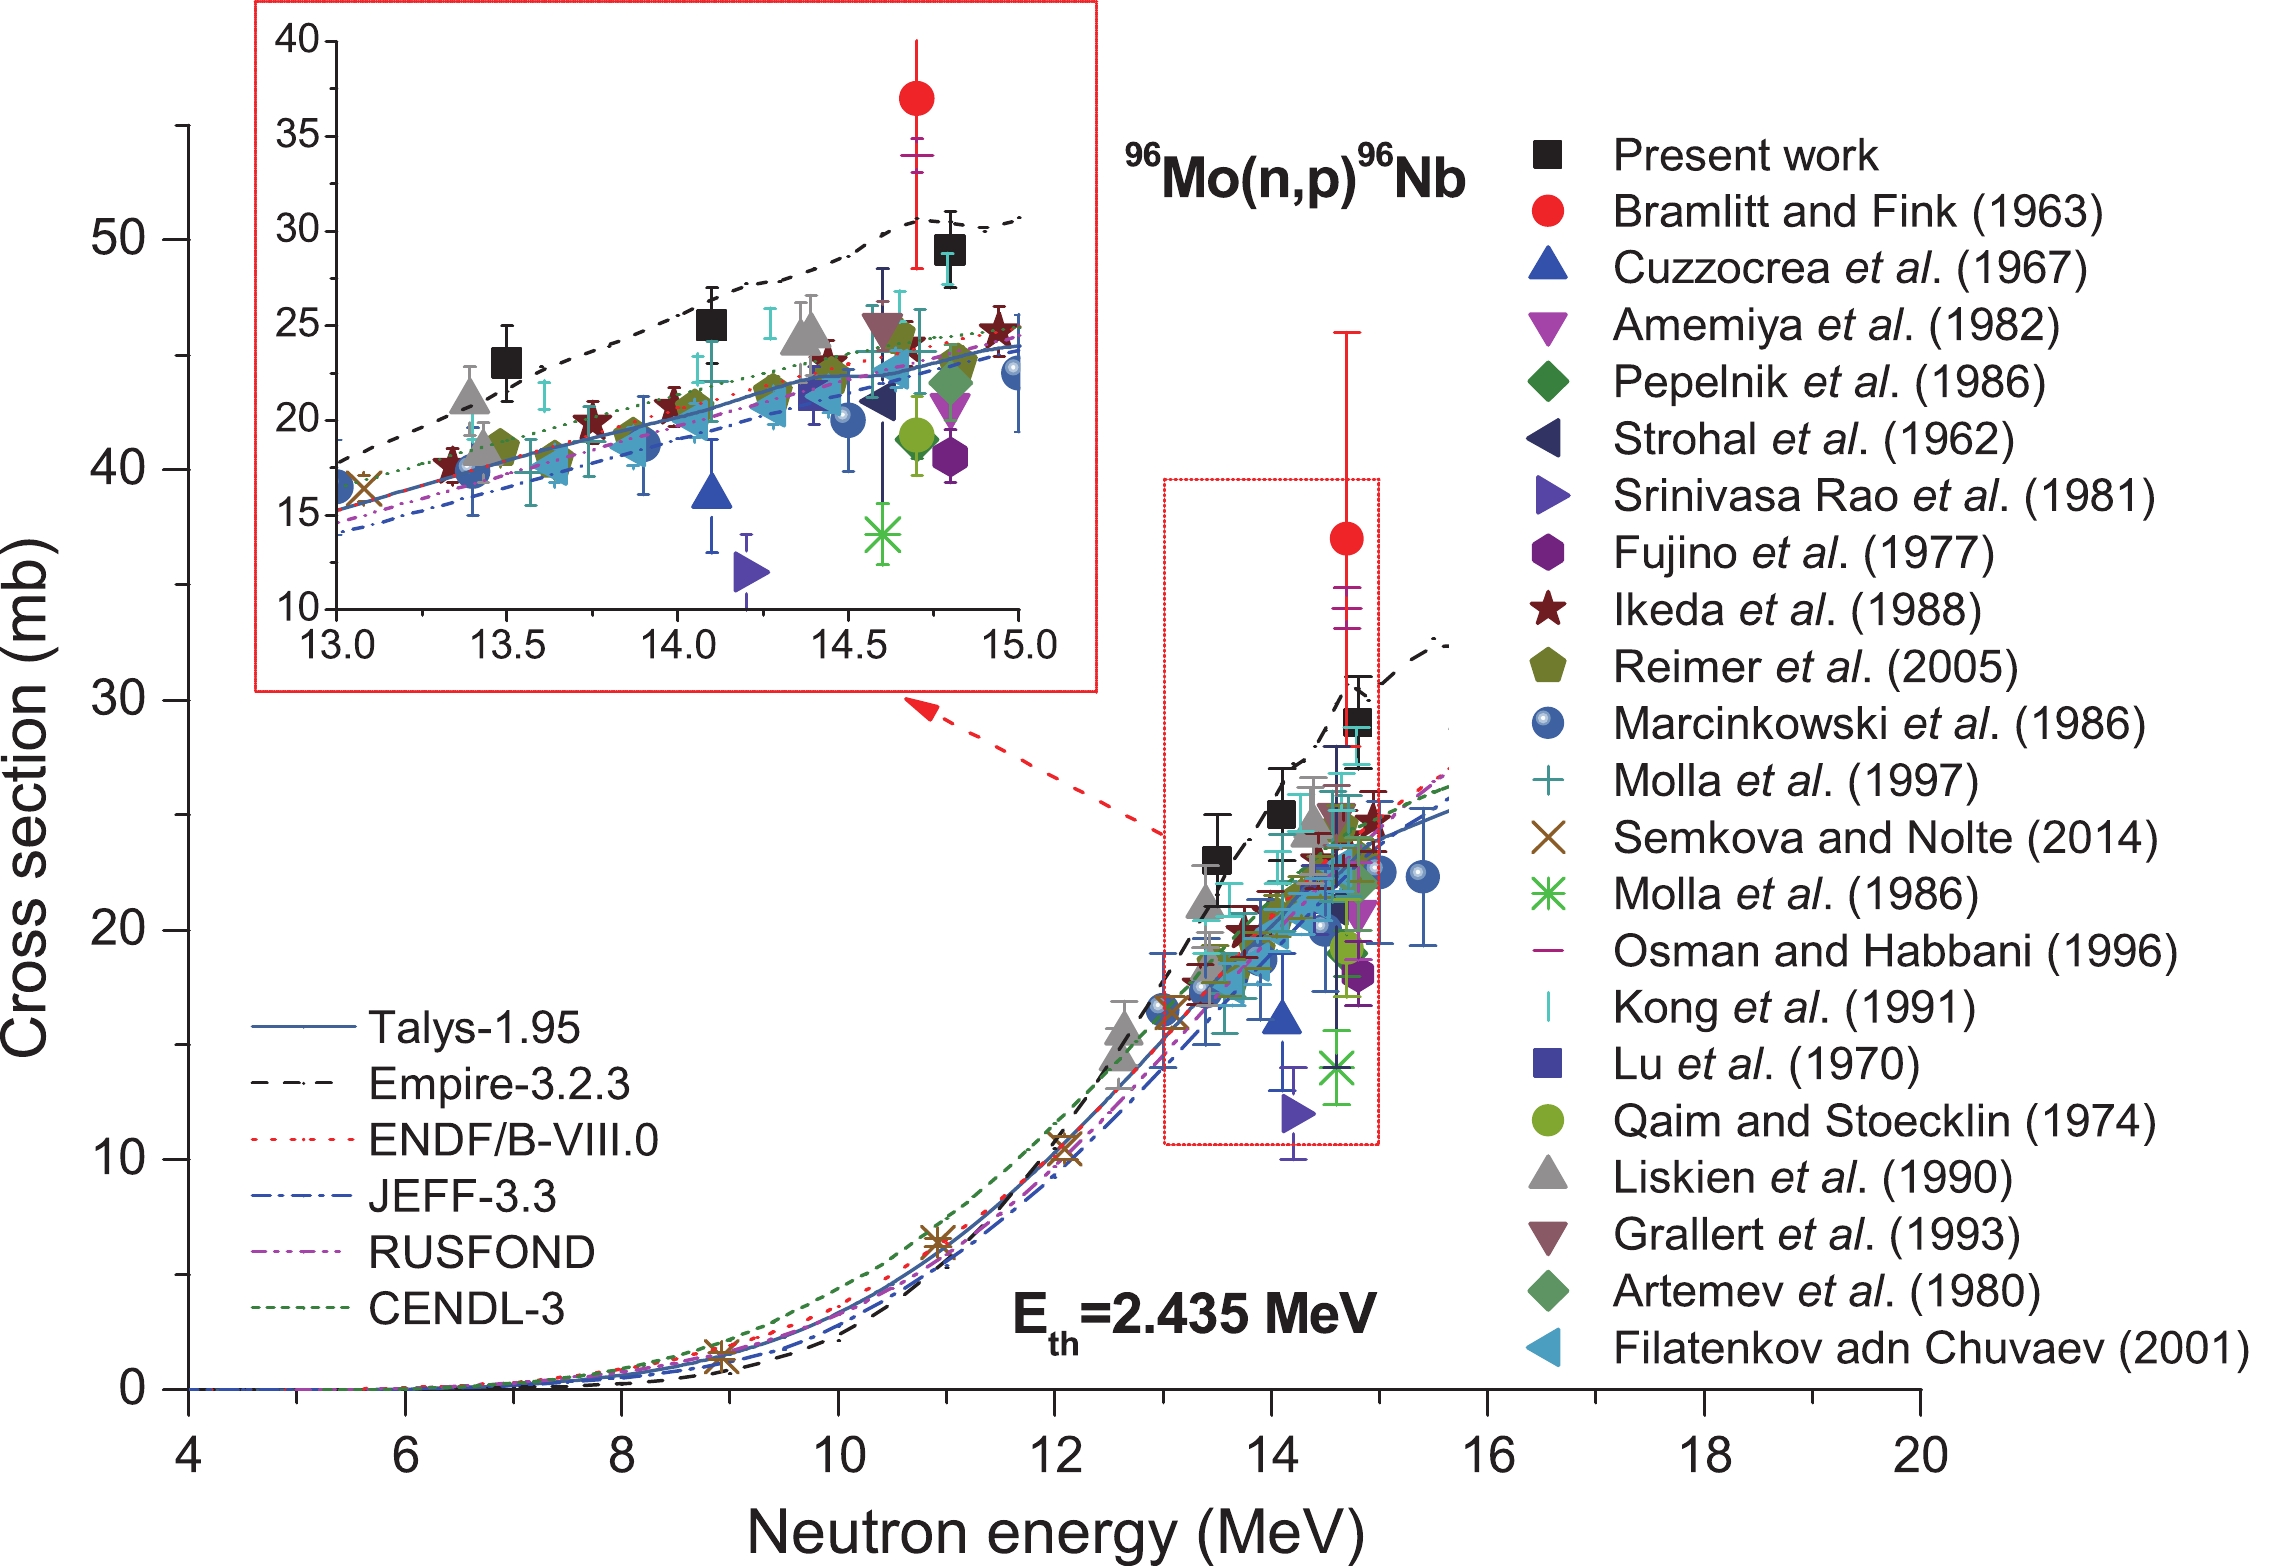
Figure 10. (color online) Plot of 96Mo(n,p)96Nb reaction cross-section values from the present work along with the literature data, evaluated data obtained from ENDF/B-VIII.0, BROND-3.1, JEFF-3.3, and CENDL-3.1 libraries as well as the calculated values obtained from TALYS-1.95 and EMPIRE-3.2.3 as a function of neutron energy.
-
Likewise, Fig. 11 presents the cross-section of the reaction 97Mo(n,p)97Nb. As observed, 15 previous reports are available, including Reimer et al. (2005) [5], Marcinkowski et al. (1986) [6], Amemiya et al. (1982) [21], Pepelnik et al. (1986) [22], Ikeda et al. (1988) [35], Molla et al. (1997) [37], Semkova and Nolte (2014) [40], Molla et al. (1986) [43], Osman and Habbani (1996) [45], Lu et al. (1970) [50], Qaim and Stoecklin (1974) [51], Artemev et al. (1980) [54], Tikku et al. (1972) [63], Kong et al. (1992) [64], and Lalremruata et al. (2012) [65]. According to Fig. 11, within 13.3−15 MeV neutron energy, diverse experimental data are highly consistent within the experimental uncertainty limits, in addition to the shapes of the excitation curves obtained from TALYS-1.95 [71], ENDF/B-VIII.0 [77], JEFF-3.3 [78], BROND-3.1 [79], and CENDL-3.1 [80]. These also exhibit a trend similar to that reported by Reimer et al. (2005) [5], Marcinkowski et al. (1986) [6], Ikeda et al. (1988) [35], Molla et al. (1997) [37], and Kong et al. (1992) [64] and that exhibited by the present data set. We do not consider the result reported by Tikku et al. (1972) [63], 72.7 ± 4.3 mb at 14.7 MeV, as it is exceptionally high for displaying any clear relation with other values around 14 MeV.

Figure 11. (color online) Plot of 97Mo(n,p)97Nb reaction cross-section values from the present work along with the literature data, evaluated data obtained from ENDF/B-VIII.0, BROND-3.1, JEFF-3.3and CENDL-3.1 libraries, and values calculated using TALYS-1.95 and EMPIRE-3.2.3 as a function of neutron energy.
-
Concerning the 98Mo(n,p)98mNb reaction, there are 21 earlier reports that can be found in the literature [5, 6, 12, 19, 21, 22, 31, 34, 35, 38-40, 43, 45, 50, 53, 56, 63, 66-68]. The measured cross sections for the 98Mo(n,p)98mNb reaction are shown in Fig. 12. Regarding the nuclear model calculations in Fig. 12, the results obtained from TALYS-1.95 calculations with default parameters are represented as continuous lines. We can see from Fig. 12 that in the neutron energy region of 14.8 ± 0.2 MeV, the present result is in excellent agreement with the previously published results of Pepelnik et al. [22], Fujino et al. [34], and Molla et al. [43] within the limits of experimental uncertainties. Nonetheless, in this energy region, the results previously published by Bramlitt and Fink [12], Srinivasa Rao et al. [31], and Gujrathi and Mukherjee [68] are 1.8 times higher, and the results published by Bramlitt and Fink [12] and Prasad and Sarkar [66] are 4.4 times higher than the values we report herein. However, at the neutron energy points of 13.5 and 14.1 MeV, the results from the present work are lower than the previously published results of Marcinkowski et al. [6], Ikeda et al. [35], Kong et al. [38], and Filatenkov [39] and the results obtained from TALYS-1.95 calculations.

Figure 12. (color online) Plot of 98Mo(n,p)98mNb reaction cross-section values from the present work along with the literature data and the values calculated using TALYS-1.95 as a function of neutron energy.
-
There are no evaluation cross-section values for the 92Mo(n,d)91mNb reaction in the evaluation database of IAEA, and only a few experimental cross-section values are available in the 13.5−14.8 MeV region (cf. refs. Qaim and Stoecklin (1974) [51], Haight et al. (1981) [72], and Konno et al. (1993) [73]). The cross-section data for this reaction are given in Fig. 13. In the neutron energy range of 13.5−14.8 MeV, the results obtained in the present experiment are in agreement with the experimental results reported in ref. [73] within experimental uncertainty limits. We can also see from Fig. 13 that the data reported in the present work have lower values than those obtained from TALYS-1.95 code. At the 14.8 MeV energy point, the results from the present work and those reported by Konno et al. (1993) [73] are about seven times higher than the values reported by Qaim and Stoecklin (1974) [51] and Haight et al. (1981) [72], whereas at the neutron energy point 13.5 MeV, the result reported herein is the first one.
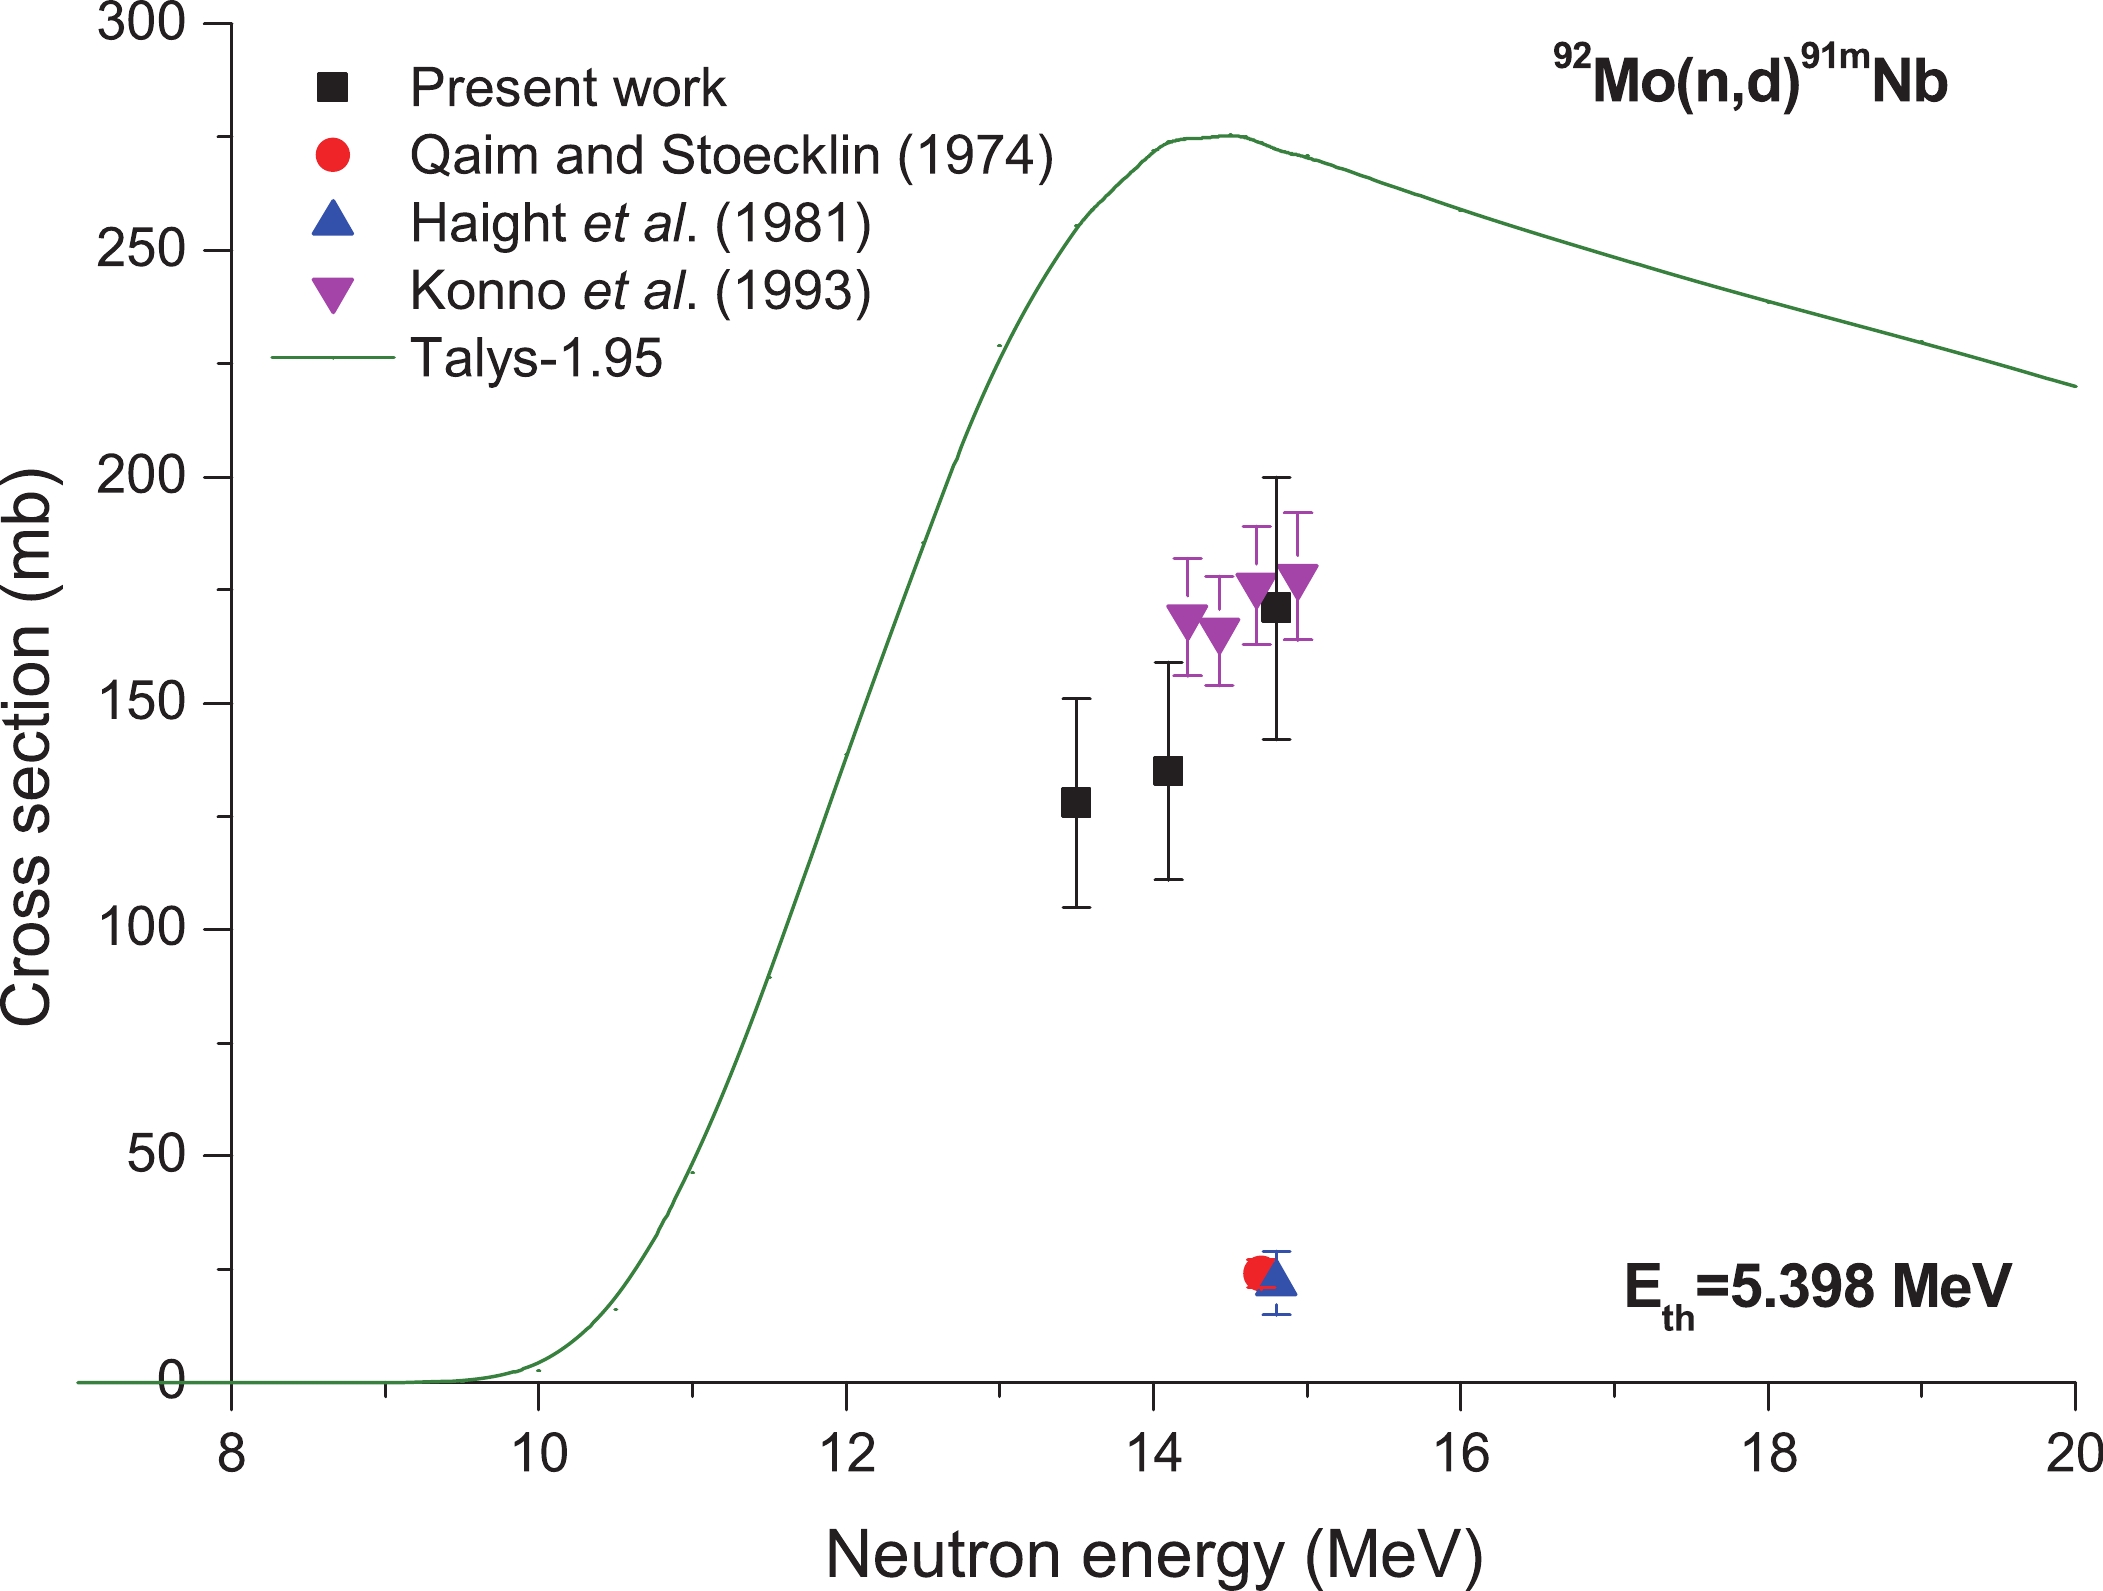
Figure 13. (color online) Plot of 92Mo(n,d)91mNb reaction cross-section values from the present work along with the literature data and the values calculated using TALYS-1.95 as a function of neutron energy.
-
Figure 14 shows the cross sections for the 92Mo(n,t)90Nb reaction. The results obtained from TALYS-1.95 and EMPIRE-3.2.3 calculations with default parameters and the evaluated data obtained from the ENDF/B-VIII.0 (the same as BROND-3.1), JEFF-3.3, and CENDL-3.1 libraries are represented as continuous lines. For this (n,t) reaction, only three laboratories [74-76] have reported the data at the single energy point of 14.8 MeV. The results obtained in the present work are in agreement with the experimental results reported in ref. [75] within experimental uncertainty limits, whereas at neutron energies 13.5 and 14.1 MeV, the results in the present work are the first of their kind.
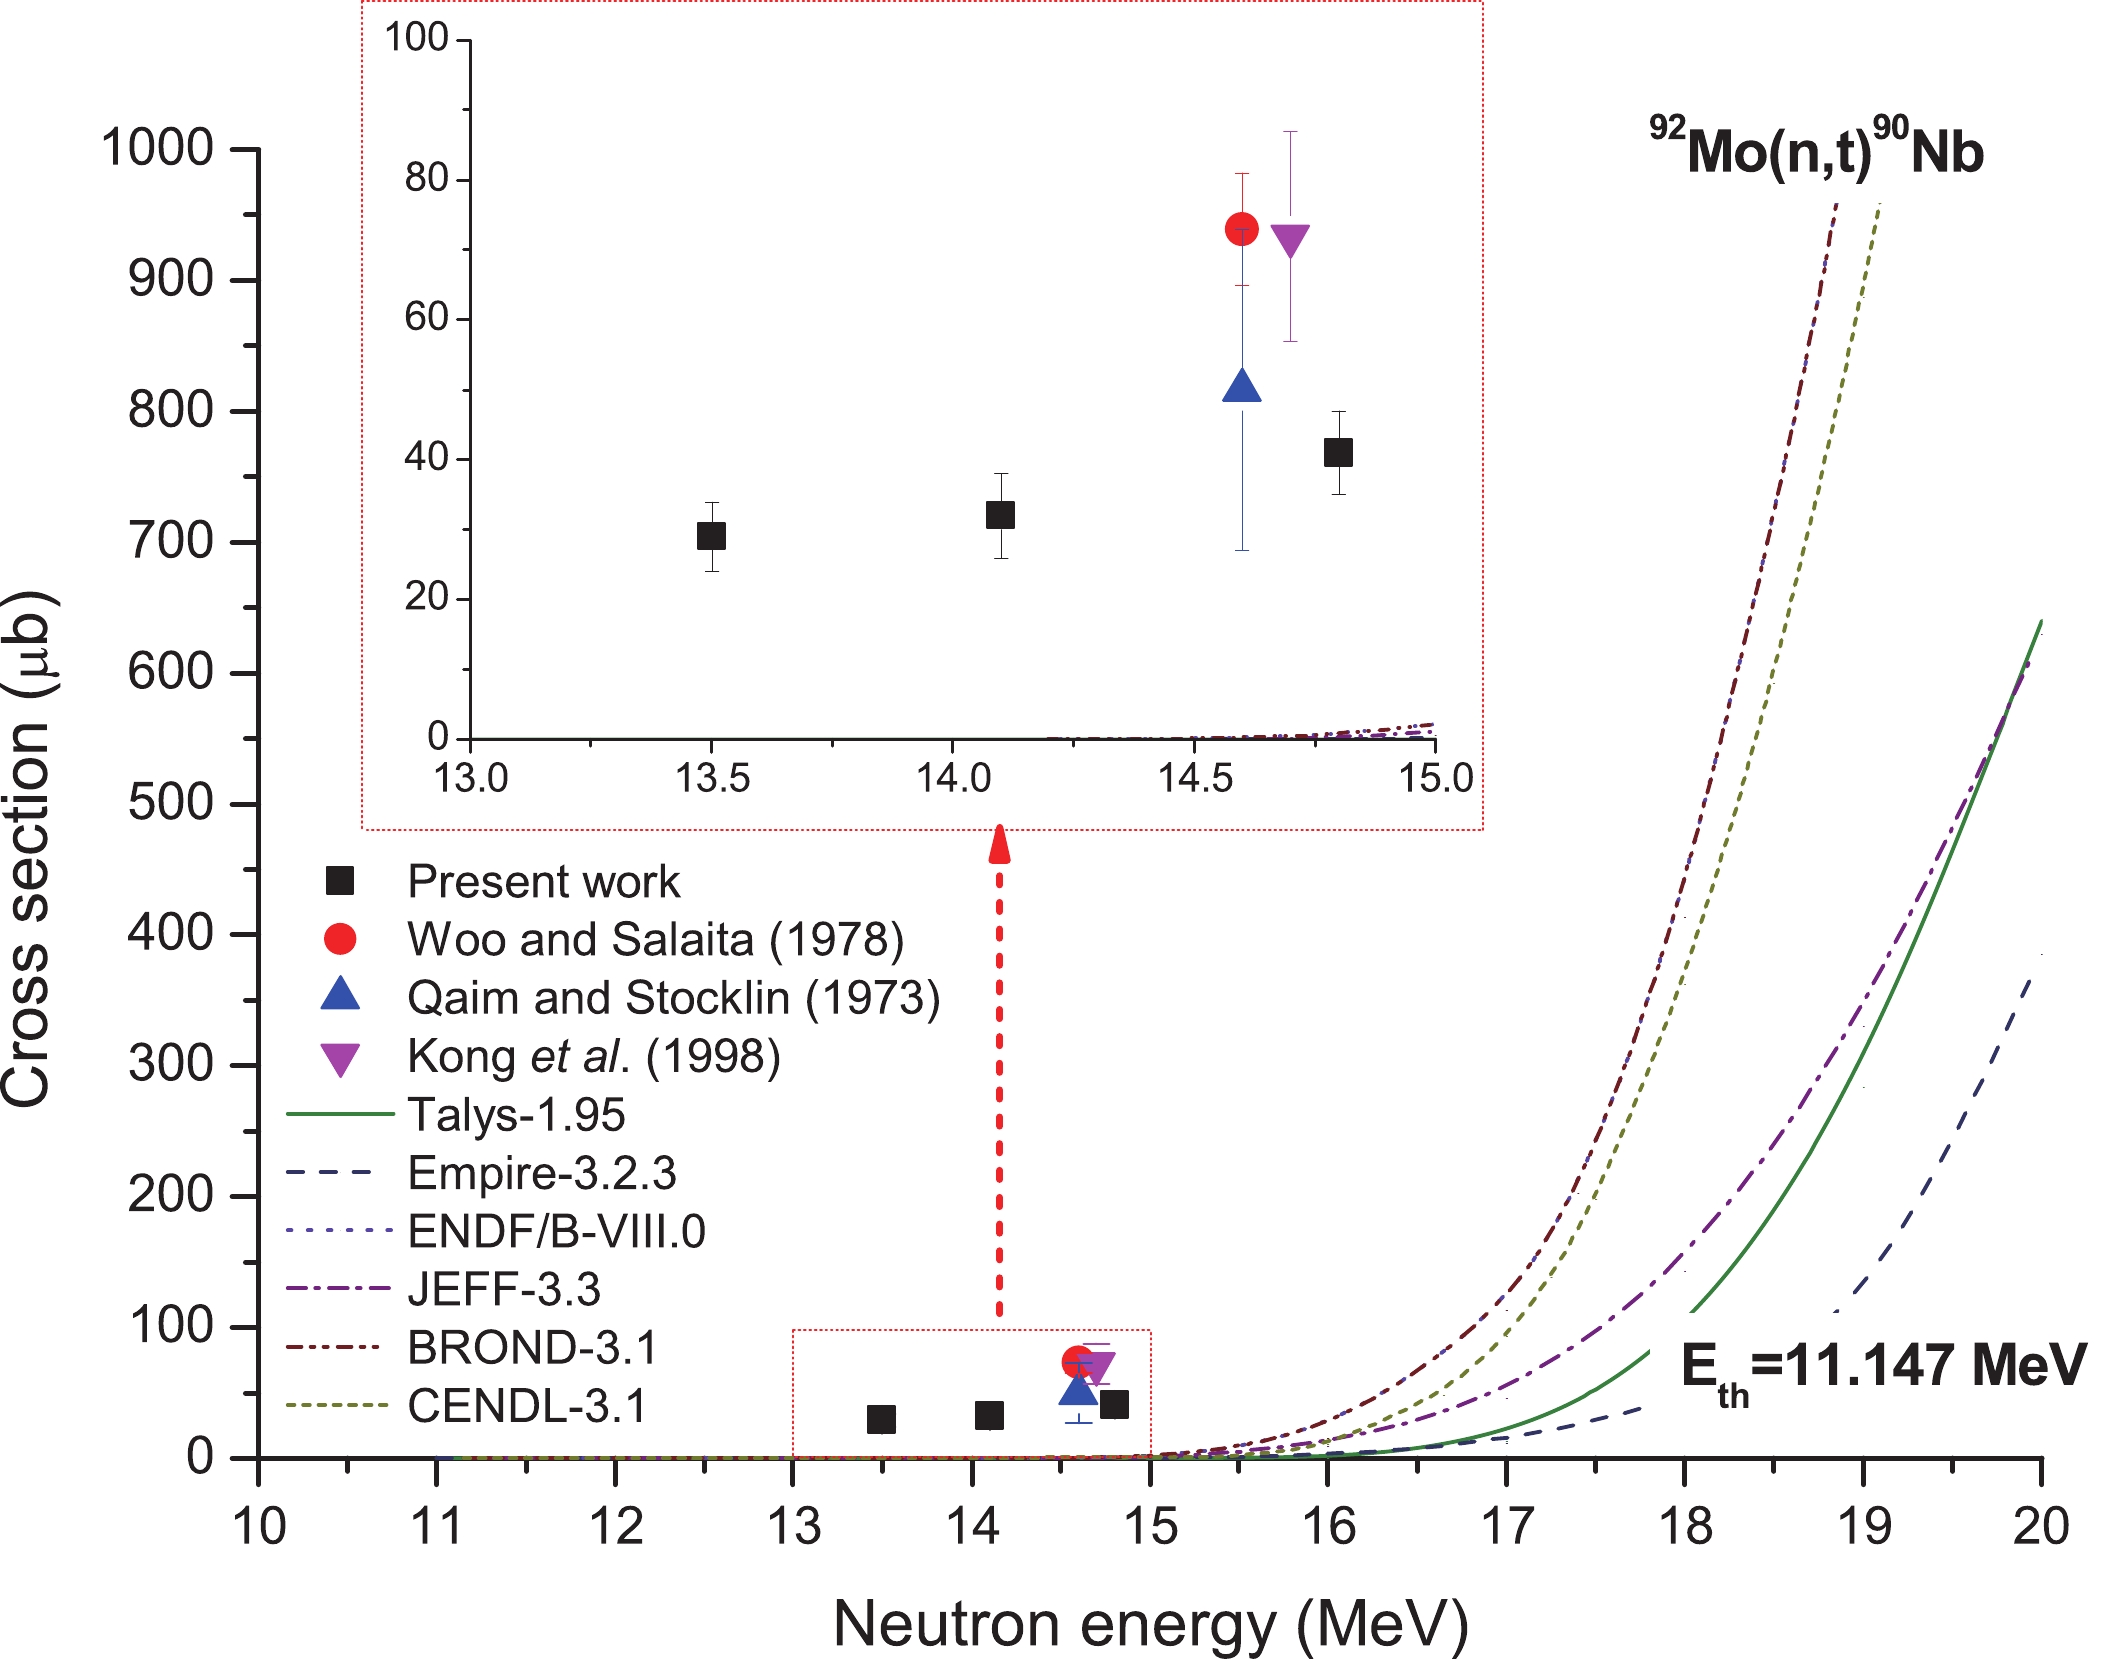
Figure 14. (color online) Plot of 92Mo(n,t)90Nb reaction cross-section values from the present work along with the literature data, evaluated data obtained from the ENDF/B-VIII.0 (the same as BROND-3.1), JEFF-3.3 and CENDL-3.1 libraries, and values calculated using TALYS-1.95 and EMPIRE-3.2.3 as a function of neutron energy.
-
We measured the reactions 92Mo(n,2n)91Mo, 94Mo(n,2n)93mMo, 100Mo(n,2n)99Mo, 98Mo(n,α)95Zr, 100Mo(n,α)97Zr, 92Mo(n,p)92mNb, 96Mo(n,p)96Nb, 97Mo(n,p)97Nb, 98Mo(n,p)98mNb, 92Mo(n,d)91mNb, and 92Mo(n,t)90Nbfor activation of Mo isotope cross sections for the neutron energies of 13.5 ± 0.2, 14.1 ± 0.2, and 14.8 ± 0.2 MeV. The uncertainties in the experimental results were calculated using the quadratic sum rule, and they were found to be within the range of 6%−18%. We then compared the measured data with the theoretical values acquired through the TALYS-1.95 and EMPIRE-3.2.3 nuclear-reaction modeling tools, together with evaluation data obtained based on the ENDF/B-VIII.0, JEFF-3.3, BROND-3.1, and CENDL-3.1 databases, as well as literature data. In general, our research has produced experimental data at about 14 MeV neutron energy, and the results conform well to some previous experimental values reported in the literature within the experimental error scope. Nonetheless, there are certain differences across the literature-reported data, and this may be due to the variations in experimental methodology, equipment type, adopted nuclear parameters, and data-processing techniques. According to theoretical calculations based on the TALYS-1.95 and EMPIRE-3.2.3 nuclear-reaction modeling approaches, for a specific channel being considered, its reaction cross section can be well reproduced at around 14 MeV neutron energy through the use of default parameters. As a result, the theoretical calculation model can be suitably used to simulate the cross section of a reaction for a specific channel at about 14 MeV neutron energy. Taken together, the experimental values presented herein can significantly enhance the neutron cross-section database quality, which can assist in evaluating the cross sections of Mo isotopes at about 14 MeV neutron energy. Moreover, this study also sheds light on the TALYS-1.95 and EMPIRE-3.2.3 theoretical model codes. In addition, it is important to report these experimental values at moderate−fast neutron energy points for testing diverse nuclear model codes as well as advancing modern nuclear reactor techniques. Noticeably, this study first reports the experimental cross-section values at 13.5 and 14.1 MeV neutron energies for the reaction 92Mo(n,t)90Nb, and at 13.5 MeV neutron energy for the reaction 92Mo(n,d)91mNb.
We would like to thank the Intense Neutron Generator group at the Chinese Academy of Engineering Physics for performing the irradiations.
Cross-sections for ${{(n,2n)},\, {(n,\alpha)},\, {(n,p)},\, {(n,d)}} $ , and ${{(n,t)}} $ reactions on molybdenum isotopes in the neutron energy range of 13 to 15 MeV
- Received Date: 2020-05-11
- Available Online: 2020-11-01
Abstract: Given the insufficient cross-sectional data regarding the 14-MeV-neutron experiment of molybdenum, the vital fusion reactor structural material, and the significant heterogeneities among the reported values, this study examined the (n,2n), (n,α), (n,p), (n,d), and (n,t) reaction cross sections in molybdenum isotopes based on the neutrons produced via a T(d,n)4He reaction carried out in the Pd-300 Neutron Generator at the China Academy of Engineering Physics (CAEP). A high-resolution gamma-ray spectrometer, which was equipped with a coaxial high-purity germanium detector, was used to measure the product nuclear gamma activities. In addition, 27Al(n,α)24Na and 93Nb(n,2n)92mNb reactions were utilized as the neutron fluence standards. The experimental 92Mo(n,2n)91Mo, 94Mo(n,2n)93mMo, 100Mo(n,2n)99Mo, 98Mo(n,α)95Zr, 100Mo(n,α)97Zr, 92Mo(n,p)92mNb, 96Mo(n,p)96Nb, 97Mo(n,p)97Nb, 98Mo(n,p)98mNb, 92Mo(n,d)91mNb, and 92Mo(n,t)90Nb reaction cross sections were acquired within the 13–15 MeV neutron energy range. Thereafter, we compared and analyzed these obtained cross sections based on the existing IAEA-EXFOR database-derived experimental data, together with evaluation results corresponding to ENDF/B-VIII.0, JEFF-3.3, BROND-3.1, and CENDL-3.1 and the theoretical outcomes acquired through TALYS-1.95 and EMPIRE-3.2.3 (nuclear-reaction modeling tools).


 DownLoad: