


 Abstract
 HTML
HTML Reference
 Related
 PDF
PDF


-
The 6Li(n, t)4He reaction is one of the most important nuclear reactions for the following reasons. Firstly, this is a tritium production nuclear reaction, and tritium is a key material (T1/2 = 12.4 a) for fusion energy production [1]. Secondly, the 6Li(n, t)4He reaction is widely used in neutron spectrometry and calibration of detectors because its Q-value is high, 4.78 MeV, and the cross-sections have been adopted as standards from 0.0253 eV to 1.0 MeV [2]. Thirdly, the only neutron-induced reactions on 6Li below 1 MeV are the (n, el), (n, γ), and (n, t) reactions [3]. Therefore, 6Li(n, t)4He is one of the best choices for experimental and theoretical study of nuclear reactions with light nuclei.
At thermal neutron energy, the cross-section of the 6Li(n, t)4He reaction is large (938.5 b) [4]. Below 0.01 MeV, the cross-section shows a 1/v behavior [5], and at ~0.24 MeV there is a strong resonance peak due to the 7.46 MeV level of the compound nucleus 7Li. At higher energies, the cross-section decreases. Because of the importance of this reaction, a number of measurements have been conducted since 1950 [6]. However, discrepancies among different measurements and evaluations are noticeable in the MeV region. The cross-sections of the latest measurement conducted by Kirsch et al. [7] in 2017 are slighty smaller than the results of most evaluations above 0.5 MeV. For example, the cross-section at 1.0 MeV measured in Ref. [7] is smaller by ~8% than the one reported in the ENDF/B-VIII.0 library [8]. Furthermore, the measured differential cross-sections, which are very helpful in the research of nuclear reaction mechanisms, are scanty except for the energy region on the right side of the resonance peak around ~0.24 MeV. In particular, there are no differential cross-section measurements below 0.1 MeV up to date [6]. In addition, the discrepancies among the existing measured differential cross-sections are significant [6].
In the present work, the LPDA (Light charged Particle Detector Array facility) [9], consisting of 15 silicon detectors mounted in a vacuum chamber, was developed to study neutron-induced charged particle emission reactions at the CSNS (China Spallation Neutron Source) Back-n white neutron source. The measurement of the 6Li(n, t)4He reaction was the first experiment of this kind. The differential cross-sections (15 detection angles ranging from 19.2° to 160.8°), as well as the angle-integrated cross-sections, were obtained from 1.0 eV to 3.0 MeV (80 neutron energy points). In addition, the present results are compared with the existing measurements and evaluations.
-
The present experiment was performed at Endstation #1 of the CSNS Back-n white neutron source [10]. The neutrons were generated using the proton beam (double-bunch, 25 Hz, 1.6 GeV, ~20 kW) to bombard a tungsten target [11]. The time width of each proton bunch was ~41 ns, and the interval between the two proton bunches was 410 ns. The diameter of the neutron beam was ~5.0 cm at Endstation #1, the neutron flight path was 57.99 m, and the neutron flux was ~3.5×10⁶ n/cm2/s.
The neutron energy spectrum [12] was measured using a multi-layer fission chamber at Endstation #2 of the CSNS Back-n white neutron source with a flight path of 75.78 m, and with the accelerator operated in the single-bunch mode [10]. In the calculations of the neutron energy spectrum from the measured fission events, the cross-sections of the 235U(n, f) reaction were taken from the ENDF/B-VIII.0 library [8] below 0.15 MeV, and from the standard library [4] above 0.15 MeV. The neutron energy resolution (mainly caused by the moderation length of the neutron source for neutron energies below 0.01 MeV) was used to smooth the evaluated cross-sections of the 235U(n, f) reaction. In the neutron energy region below 2.5 keV, deviations between the measured and actual neutron energy spectra were expected because of: a) the cross-sections of the 235U(n, f) reaction were not standard; and b) the moderation length of the neutron source was not accurately known.
In the present experiment, the samples and the detectors were placed in a vacuum chamber with an entrance window (tantalum sheet 0.10 mm in thickness), so that the neutron energy spectrum was corrected according to
${\varphi _{\rm{C}}} = {\varphi _{\rm{O}}}{{\rm e}^{ - {\sigma _{{\rm{tot}}}}Nd}},$

(1) where φC is the corrected relative neutron fluence, φO is the relative neutron fluence, σtot is the cross-section of the 181Ta(n, tot) reaction [8] which is smoothed using the neutron energy resolution, N is the atomic density of 181Ta, and d is the thickness of the tantalum sheet.
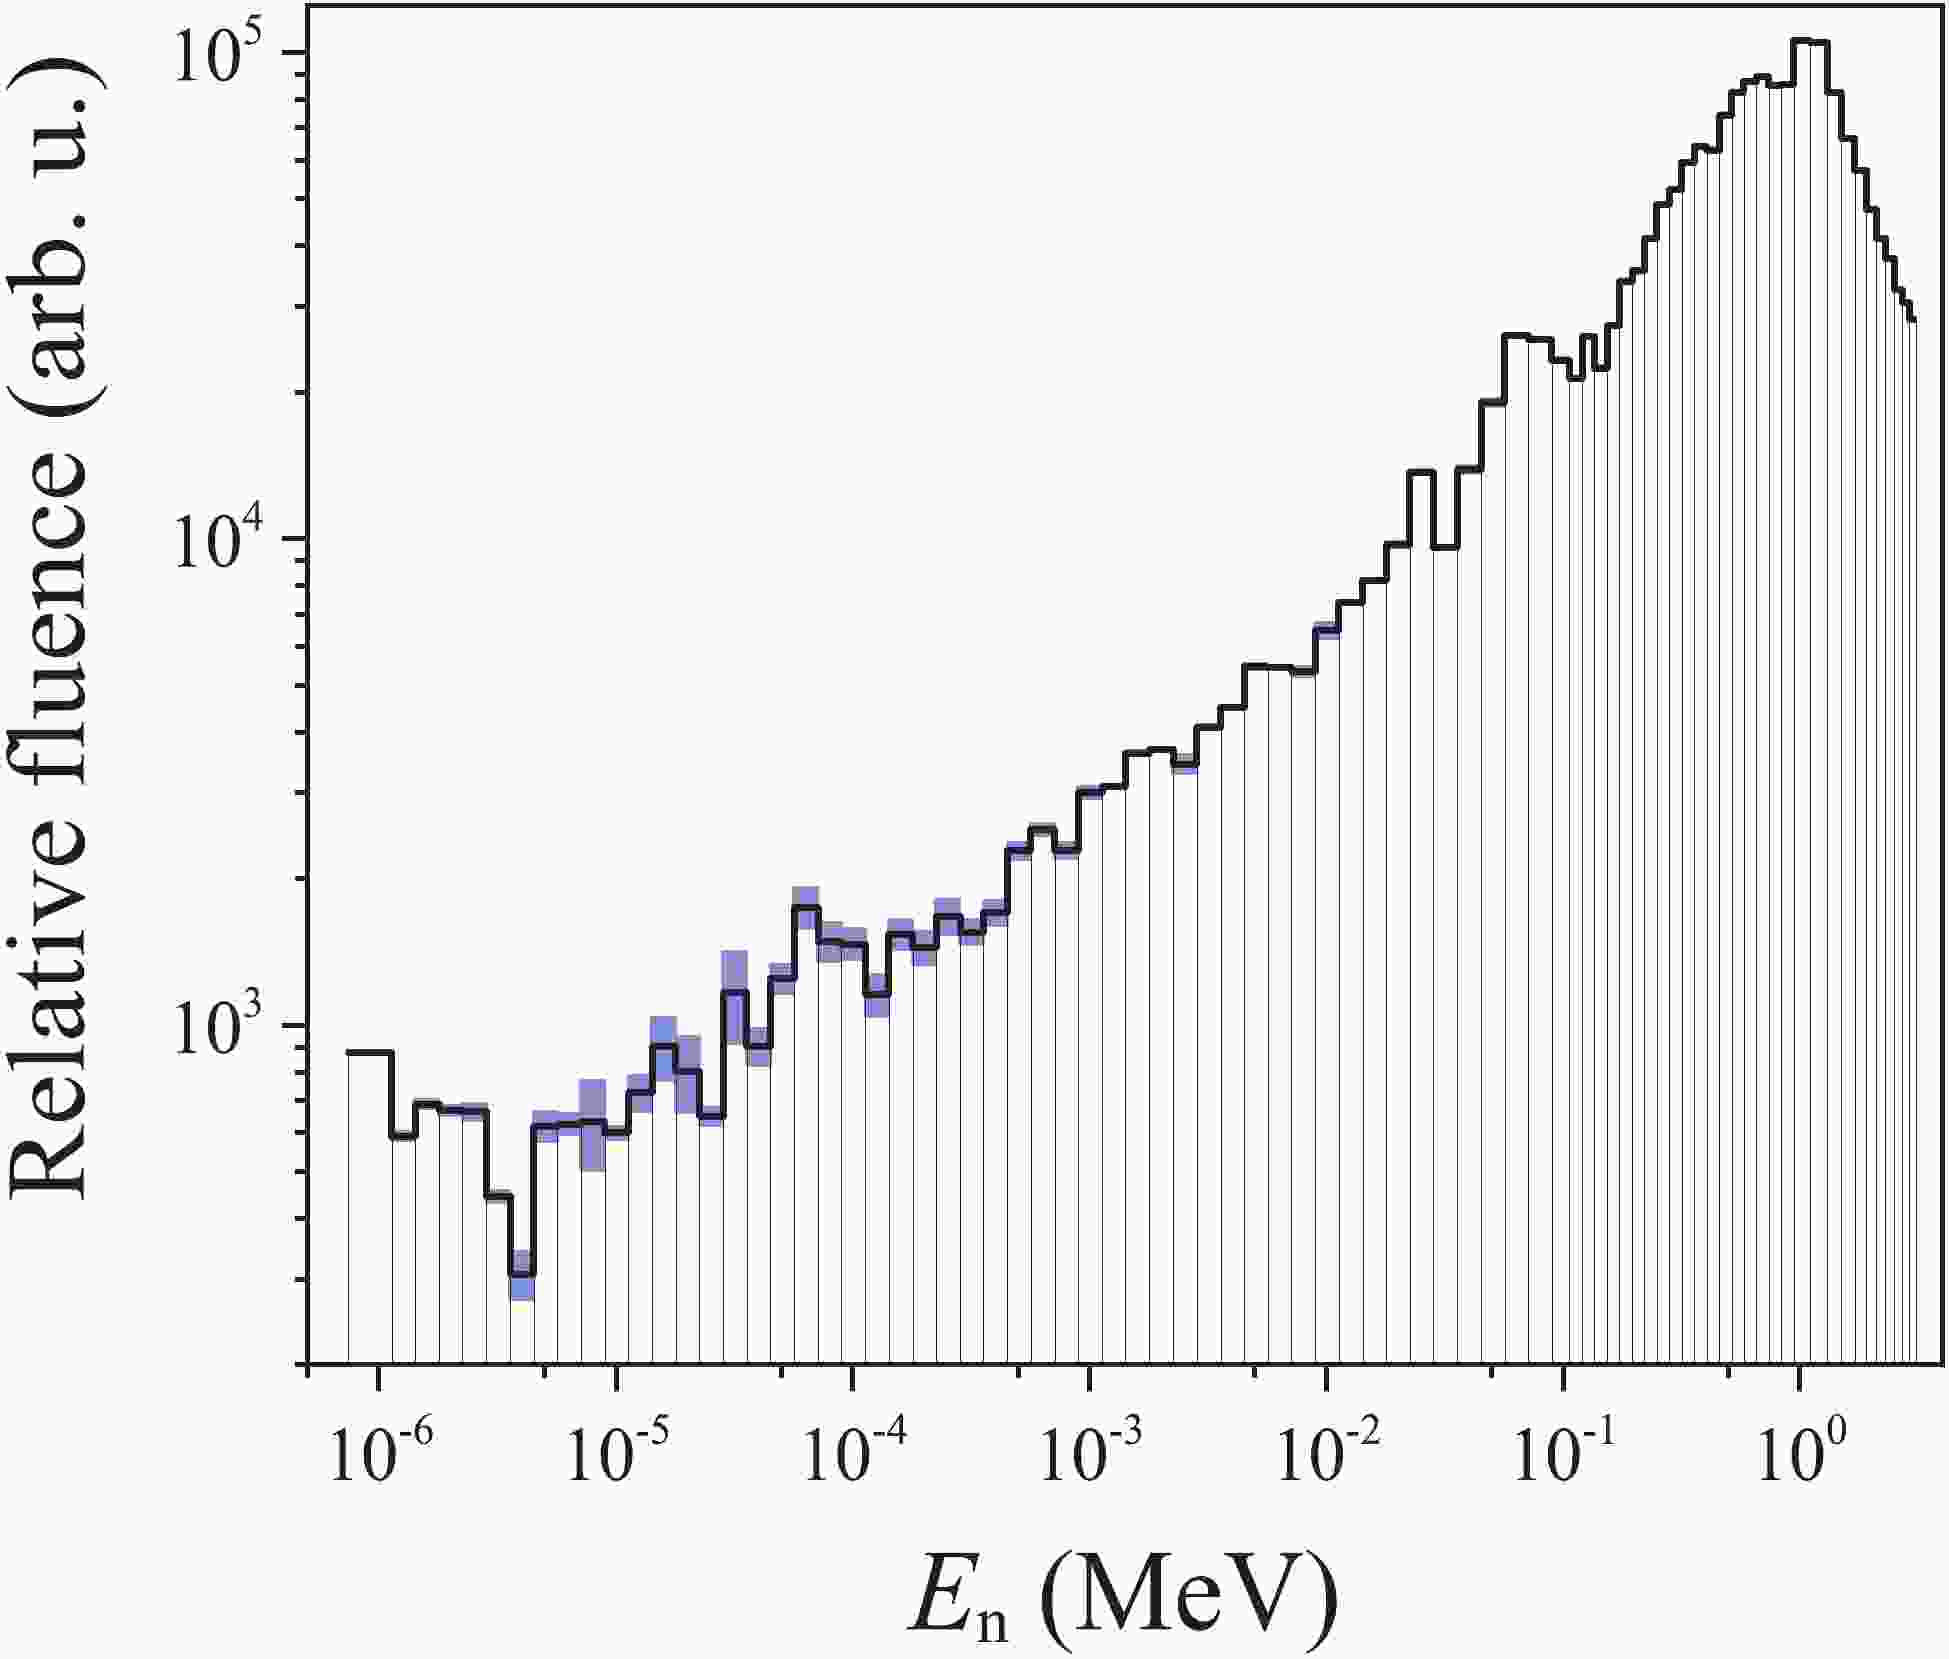
The neutron energy bins and the neutron energy spectrum, with the uncertainties presented by the blue bars, is shown in Fig. 1. In the present work, 80 energy points (E-bins) were chosen from 1.0 eV to 3.0 MeV: a) 50 energy points in the neutron energy region from 1.0 eV to 0.1 MeV are distributed in equal logarithm intervals; 20 energy points in the region from 0.1 to 1.0 MeV are distributed in equal logarithm intervals to show better the resonance peak of the 6Li(n, t)4He reaction from ~0.1 to ~0.4 MeV; and 10 energy points in the region from 1.0 to 3.0 MeV are distributed with equal separation of 0.2 MeV. The centers of two adjacent E-bins are their boundaries.
Figure 1. (color online) Neutron energy bins and the neutron energy spectrum with uncertainties presented by the blue bars.
It should be pointed out that the position of the experiment (Endstation #1) was ~17.8 m away from where the neutron energy spectrum was measured (Endstation #2), so that the neutron energy spectra at these two positions were expected to be slightly different.
-
Two enriched (90%) 6LiF samples were separately evaporated on each side of a stainless steel sheet 0.10 mm thick. Their thickness was 776 and 787 μg/cm2. Their diameter and non-uniformity were 50 mm and 5%, respectively. The 6LiF samples were installed in one of the four sample positions of the LPDA sample holder, as shown in Fig. 2. In the other sample positions, two back-to-back 241Am α sources and a stainless steel sheet 0.10 mm thick were installed. The 241Am α sources were used to calibrate the detection system, and the stainless steel sheet was used for background measurement. To minimize the energy loss of the charged particles in the samples, the angle between the normal lines to the samples and the neutron beam line was 60°, as shown in Fig. 3.
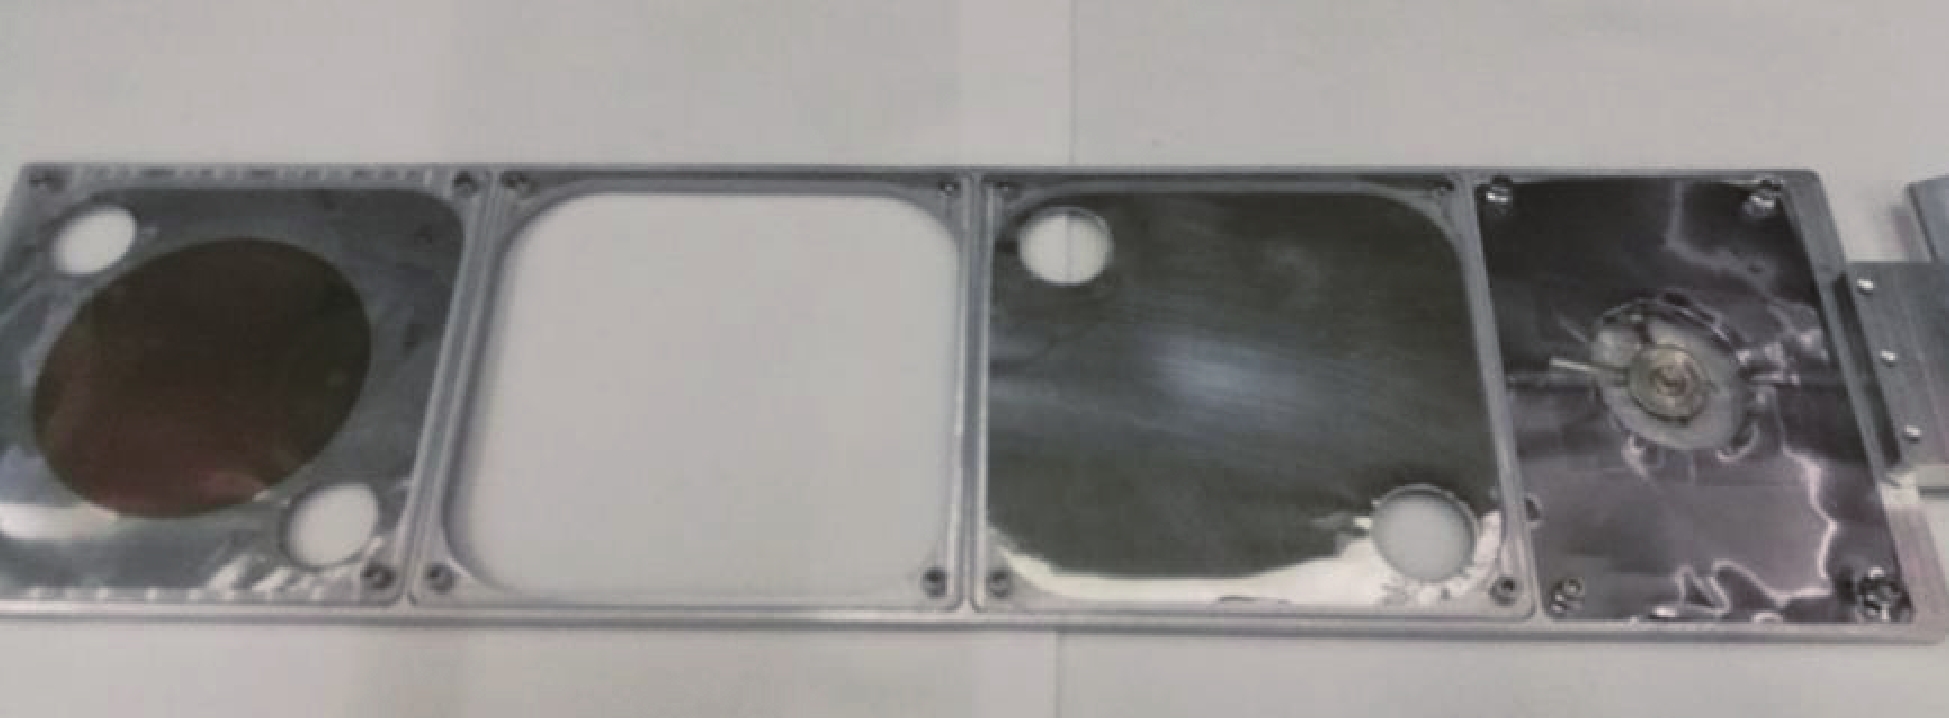
Figure 2. Photo of the samples and the sample holder. In three of the four sample positions, the back-to-back 241Am α sources (right), the stainless steel sheet (second from right) and the 6LiF samples (left) were installed.
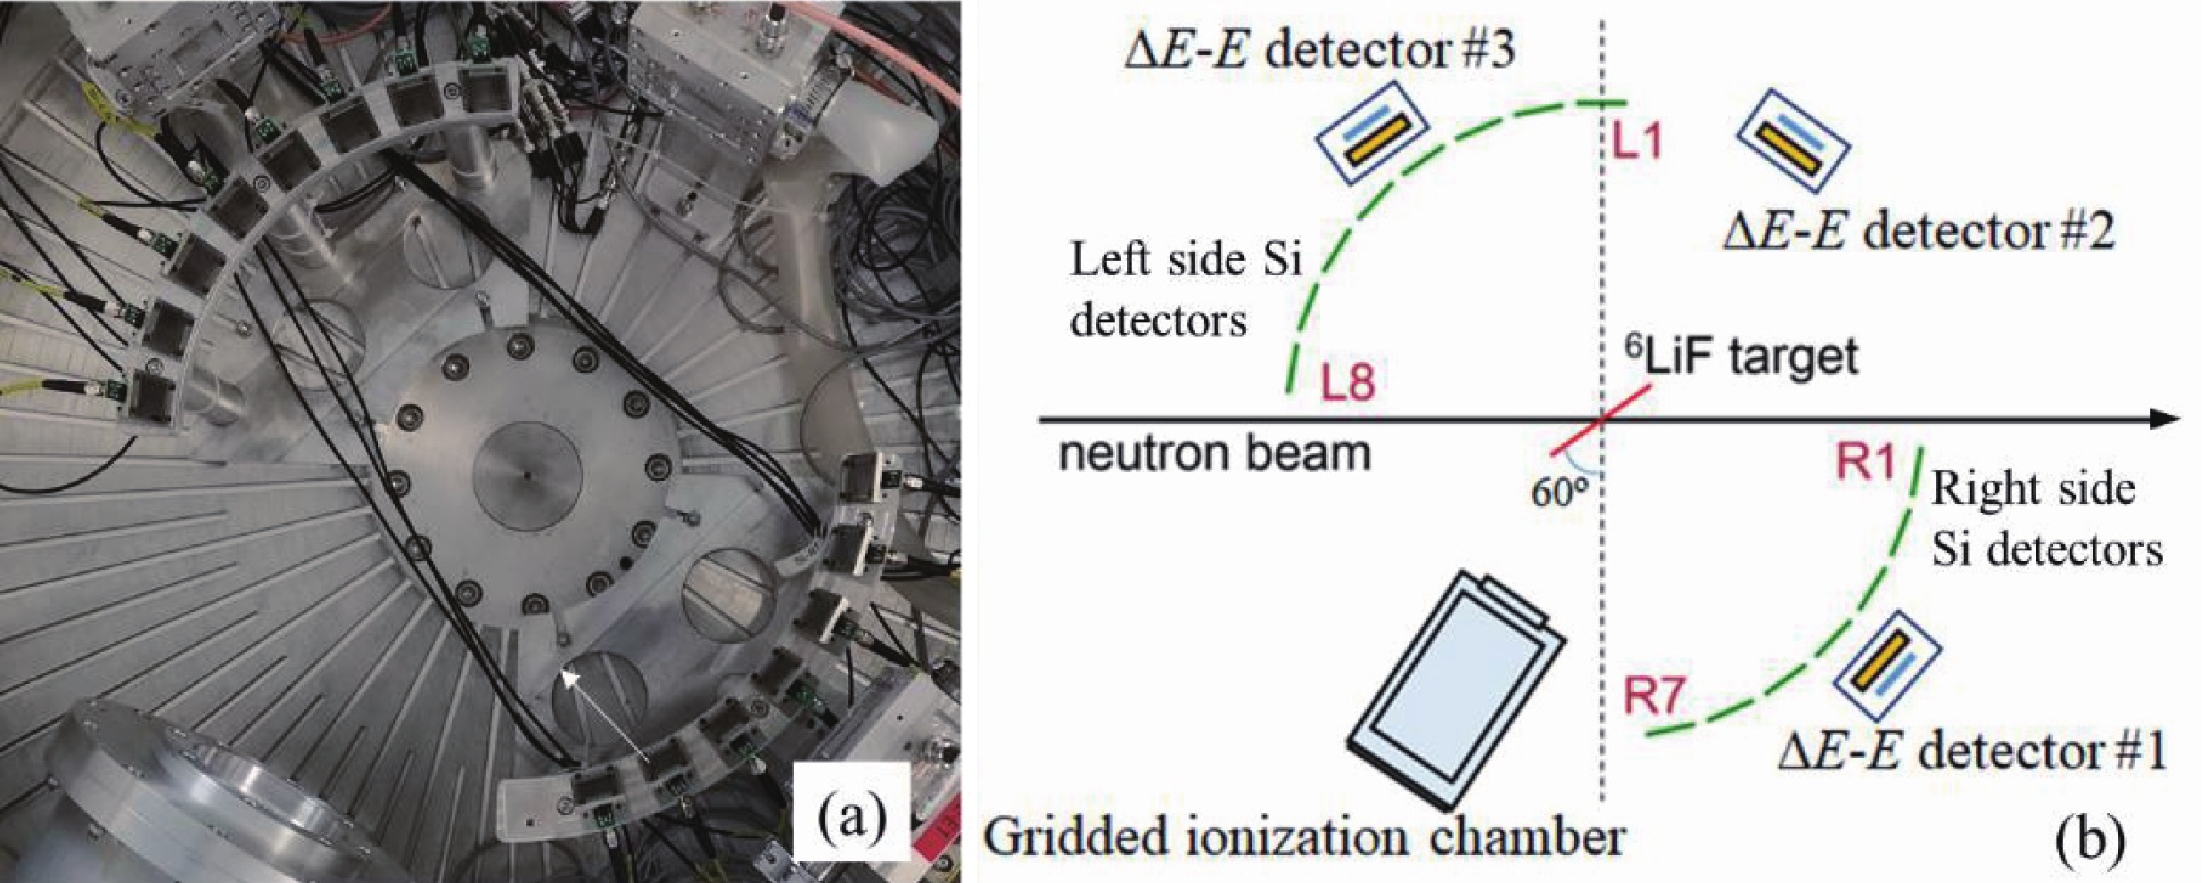
Figure 3. (color online) Configuration of the detectors: (a) photo of the detectors in the vacuum chamber; (b) sketch of the configuration of the detectors.
-
The samples and the detectors were placed in a vacuum chamber 50 cm in radius and 50 cm high. Fifteen rectangular silicon detectors (2 cm × 2.5 cm, 500 μm thick), 20 cm away from the center of the 6LiF samples and covering angles from 19.2° to 160.8°, were used to measure the emitted charged particles, as shown in Fig. 3. To keep away from the neutron beam, the detection angle could not be smaller than 19.2° or larger than 160.8°. In addition to the 15 silicon detectors, 3 ΔE-E detectors and 1 GIC (gridded ionization chamber) were also installed and tested. To avoid shielding the ΔE-E detectors, the centers of the silicon detectors were lower than the beam line. The angle between the normal line to each silicon detector and the horizon was 16°. In this configuration, the solid angles of the silicon detectors with respect to the 6LiF samples were (0.0123 − 0.0125) (±0.3%) sr, calculated using a Monte Carlo simulation. The distribution of the receiving angles of the detectors is shown in Fig. 4.
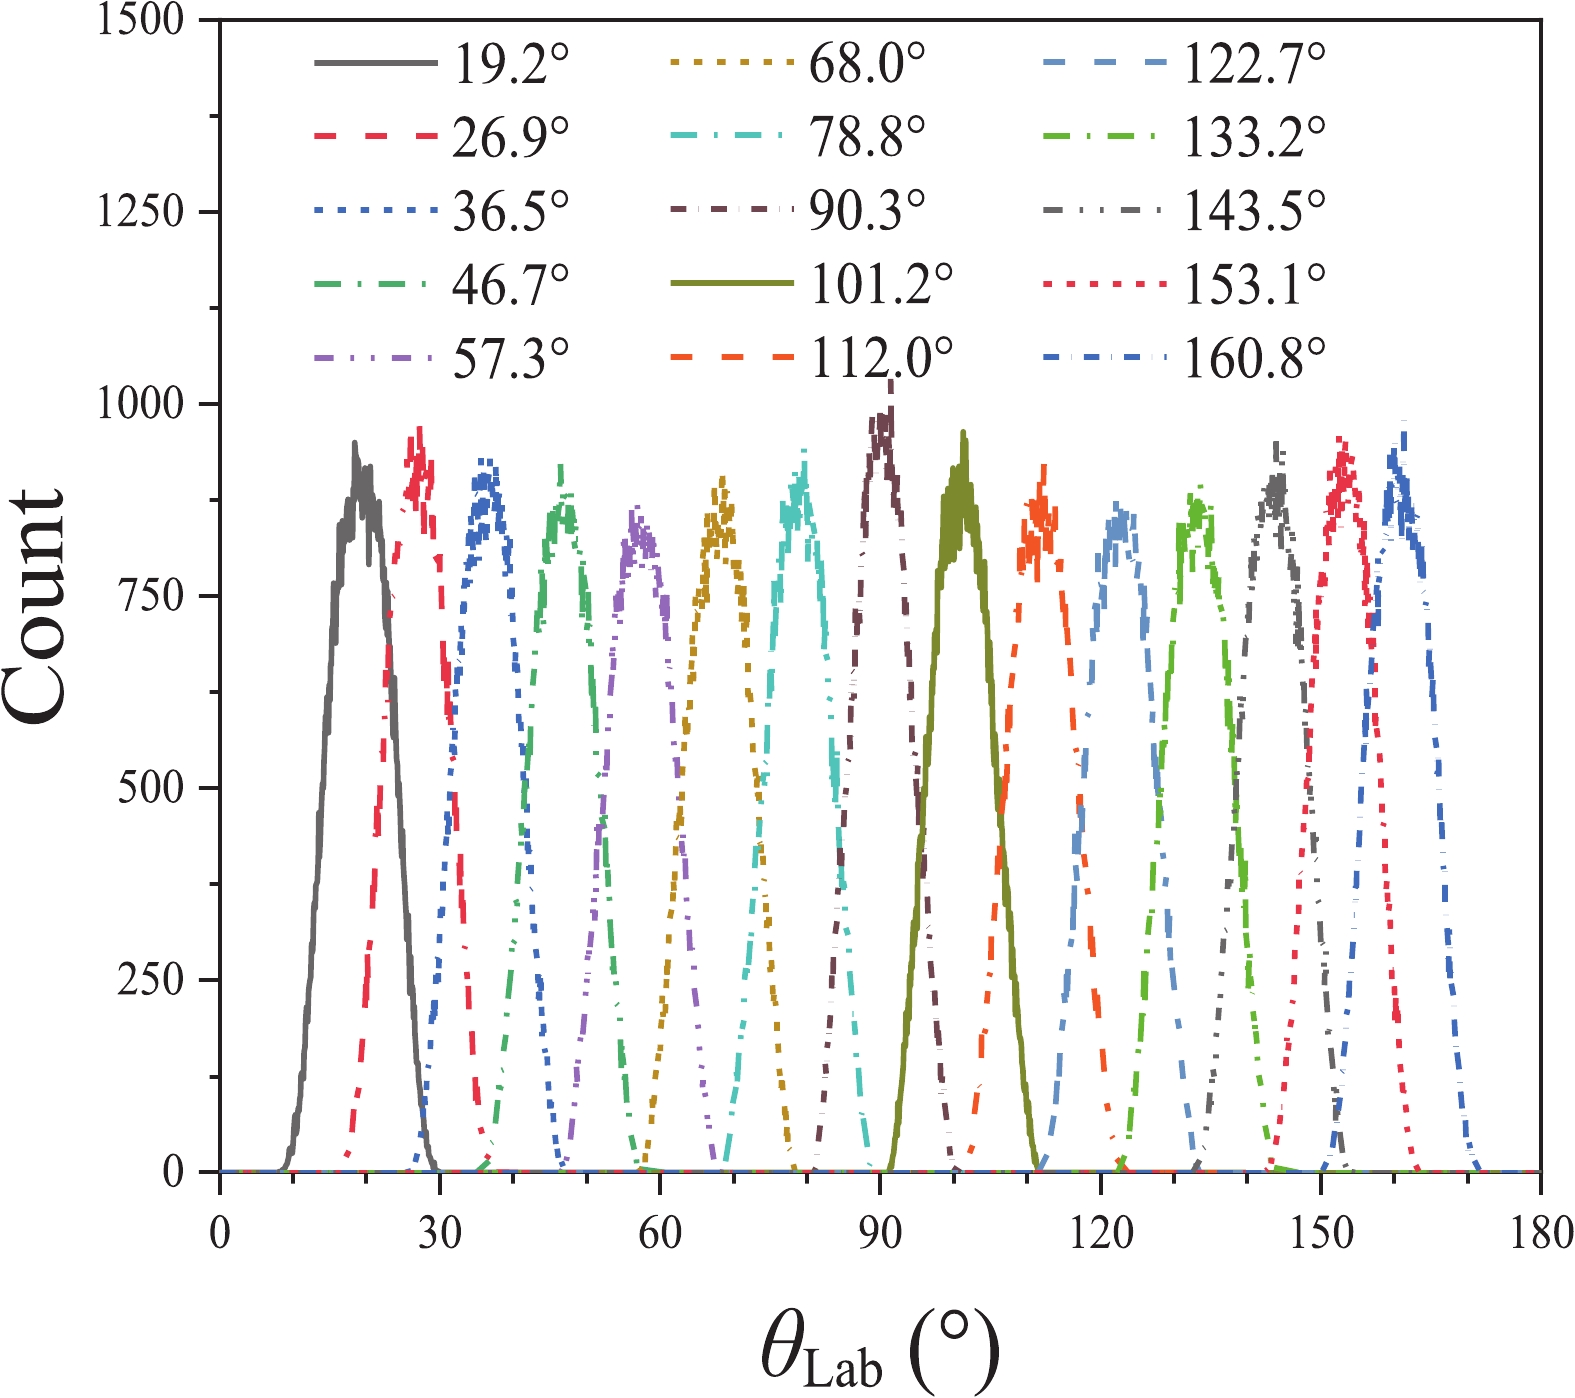
Figure 4. (color online) Distribution of the receiving angles of the detectors. The numbers in the legend are the average receiving angles of the corresponding detectors.
-
The DAQ (data acquisition) system [13] was designed based on a PXIe platform. The sampling rate of the DAQ system was 1 GHz, and the resolution was 12 bits. If the amplitude of the signal surpassed the trigger threshold of the DAQ system, the signal waveform of the corresponding silicon detector was recorded in the ~15 μs time window. Also, the duration between the start of each recorded waveform and the moment when the corresponding proton bunch hits the tungsten target was recorded by the DAQ system. Thus, TOF (time-of-flight) of neutrons producing the detected events could be calculated. Since the silicon detectors were also sensitive to γ rays, the generation time (T0) of neutrons could be determined using the detected γ flash events. The width of the detected γ peak was ~8 ns, indicating that the time resolution of the detection system was smaller than 8 ns because the width of the γ flash events also contributed to their time distribution. As the time resolution of the detection system was much smaller than ~41 ns, the length of the proton bunches, the time resolution of the detection system could not noticeably degrade the total time resolution, and was ignored in the present work.
-
The detection system was first calibrated using the 241Am α sources. The 6LiF samples (foreground) and the stainless steel sheet (background) events were then measured in turn. The beam duration for each turn was ~24 h, and the total beam duration was ~196 h. The number of protons hitting the tungsten target was used as the normalization factor for background subtraction. The uncertainty of the normalization factor was less than 0.03%, calibrated using the Si-Li detector array installed on the neutron beam line.
-
With the recorded signal waveforms, the measured foreground and background events could be extracted and counted. The background events were then subtracted from the foreground to obtain the net events. The convolution effects, caused by the double-bunched proton beams and the spread of receiving angles of the silicon detectors, were then unfolded using an iterative method. Finally, the measured results were obtained. The flowchart of the data analysis is presented in Fig. 5.
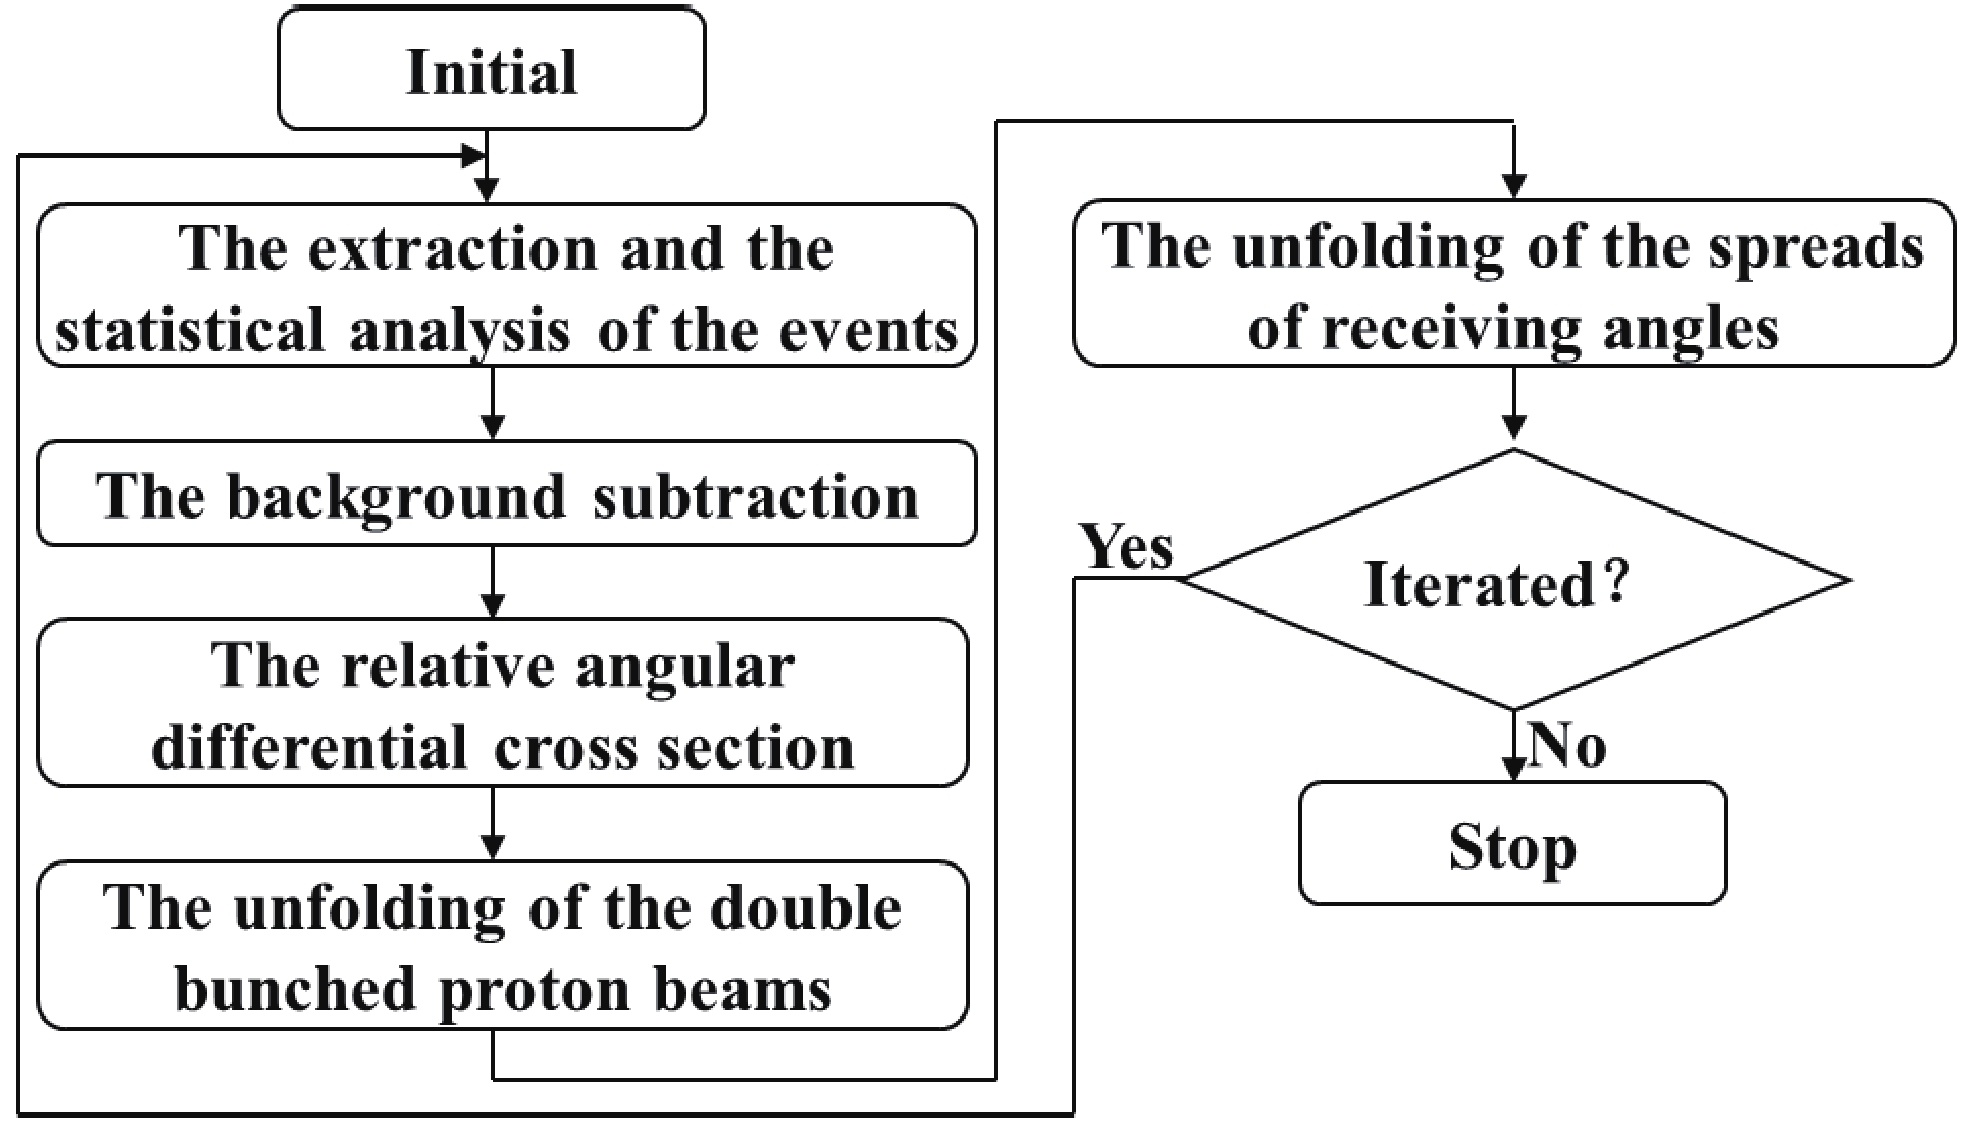
Figure 5. Flowchart of the data analysis.
-
From the recorded signal waveforms of each silicon detector, the amplitude and TOF of each event were obtained. Using TOF of each event, the corresponding neutron energy could be determined. The En-Amplitude two dimensional spectra at the corresponding detection angle were so obtained. An example is shown in Fig. 6. Since a 1.0 mm thick cadmium plate was placed in the neutron beam line to suppress the very low energy neutrons that could mix with neutrons generated by the next arriving proton bunch, there are no tritium events for neutron energies below 0.5 eV.
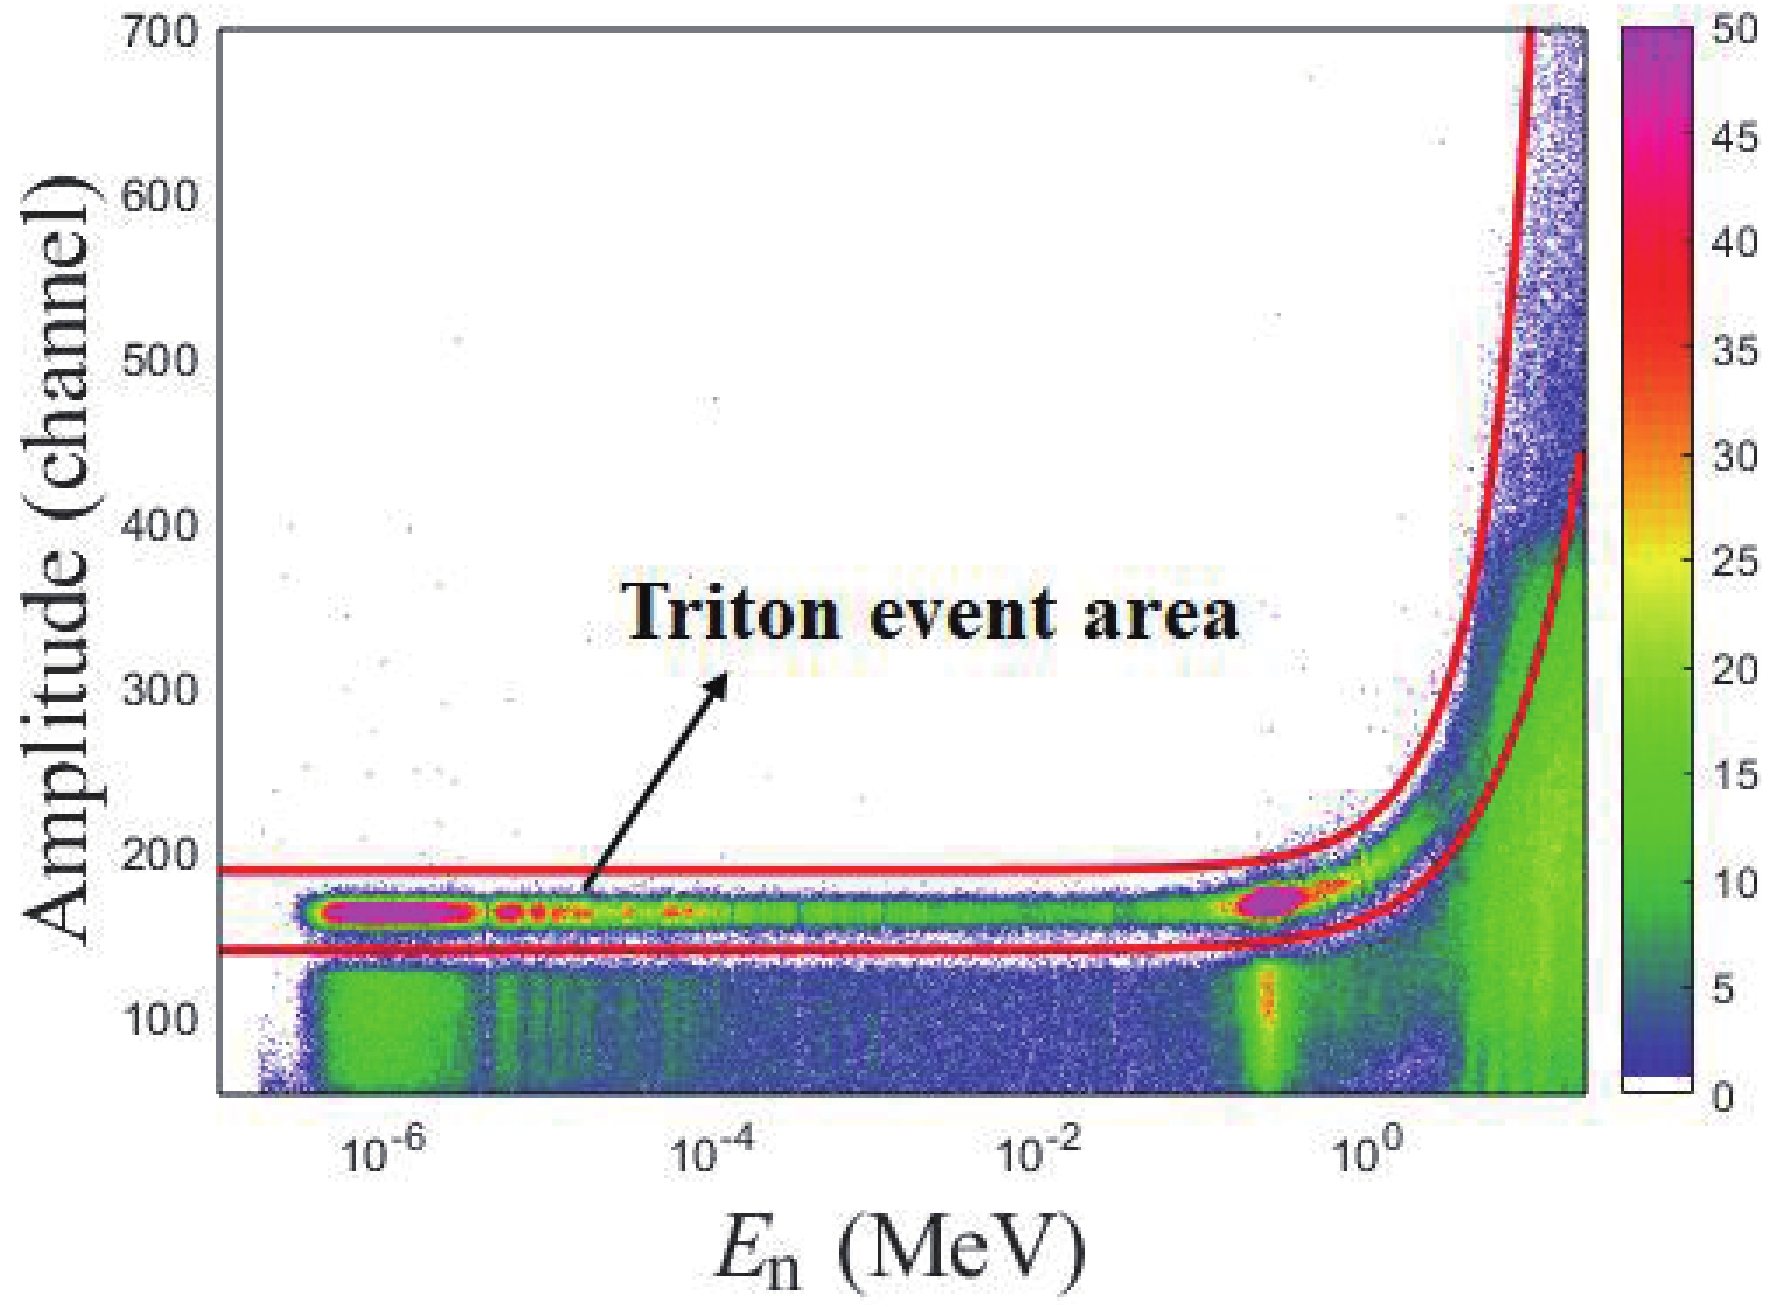
Figure 6. (color online) En-Amplitude two dimensional spectrum at 90.3° in the laboratory system.
From the En-Amplitude two dimensional spectrum, the area of tritium events could be determined as shown in Fig. 6. These events were counted into the corresponding neutron energy bins shown in Fig. 1. As the width of the neutron energy bin must be taken into account, each event was weighed as
$w = \frac{{{}^{{\rm{cor}}}\sigma _{E{\rm{ - bin, }}\theta }^{\rm re}}}{{{}^{{\rm{cor}}}\sigma _{E{\rm{, }}\theta }^{\rm re}}},$

(2) where w is the weight of the event,
${}^{{\rm{cor}}}\sigma _{E{\rm{ - bin, }}\theta }^{\rm re}$ and${}^{{\rm{cor}}}\sigma _{E{\rm{,}} \theta }^{\rm re}$ are the relative differential cross-sections of the 6Li(n, t)4He reaction for the emission angle θ and neutron energies E-bin and E, respectively, where E-bin is the neutron energy bin and E is the energy of neutrons producing the event.${}^{{\rm{cor}}}\sigma _{E{\rm{ - bin,}}\theta }^{\rm re}$ is the measured result, described in Sec. 3.5, and${}^{{\rm{cor}}}\sigma _{E{\rm{,}}\theta }^{\rm re}$ is the result of linear interpolation. Starting from the initial w of 1, this iteration process was repeated until the difference between the last two iteration results was smaller than 1%, or the number of iterations reached 10. -
The net events in each energy bin and for each detection angle were obtained after background subtraction. An example is shown in Fig. 7. The normalization factor for the background subtraction was the ratio of the total number of protons hitting the tungsten target during the foreground measurement to that during the background measurement. Although the background from the sample (7Li and 19F) cannot be subtracted, the interference of the background from 7Li and 19F can be ignored. Among the neutron-induced charged particle emission reactions with neutron energies below 3 MeV, only the reaction channels 7Li(n, nt)4He (Q-value = −2.5 MeV) and 19F(n, α)16N (Q-value = −1.5 MeV) are open [14]. However, the energies of the emitted tritium and α particles are too low and are outside the tritium event area shown in Fig. 6. For the same reason, the background from 6Li(n, nd)4He (Q-value = −1.5 MeV) was ignored.
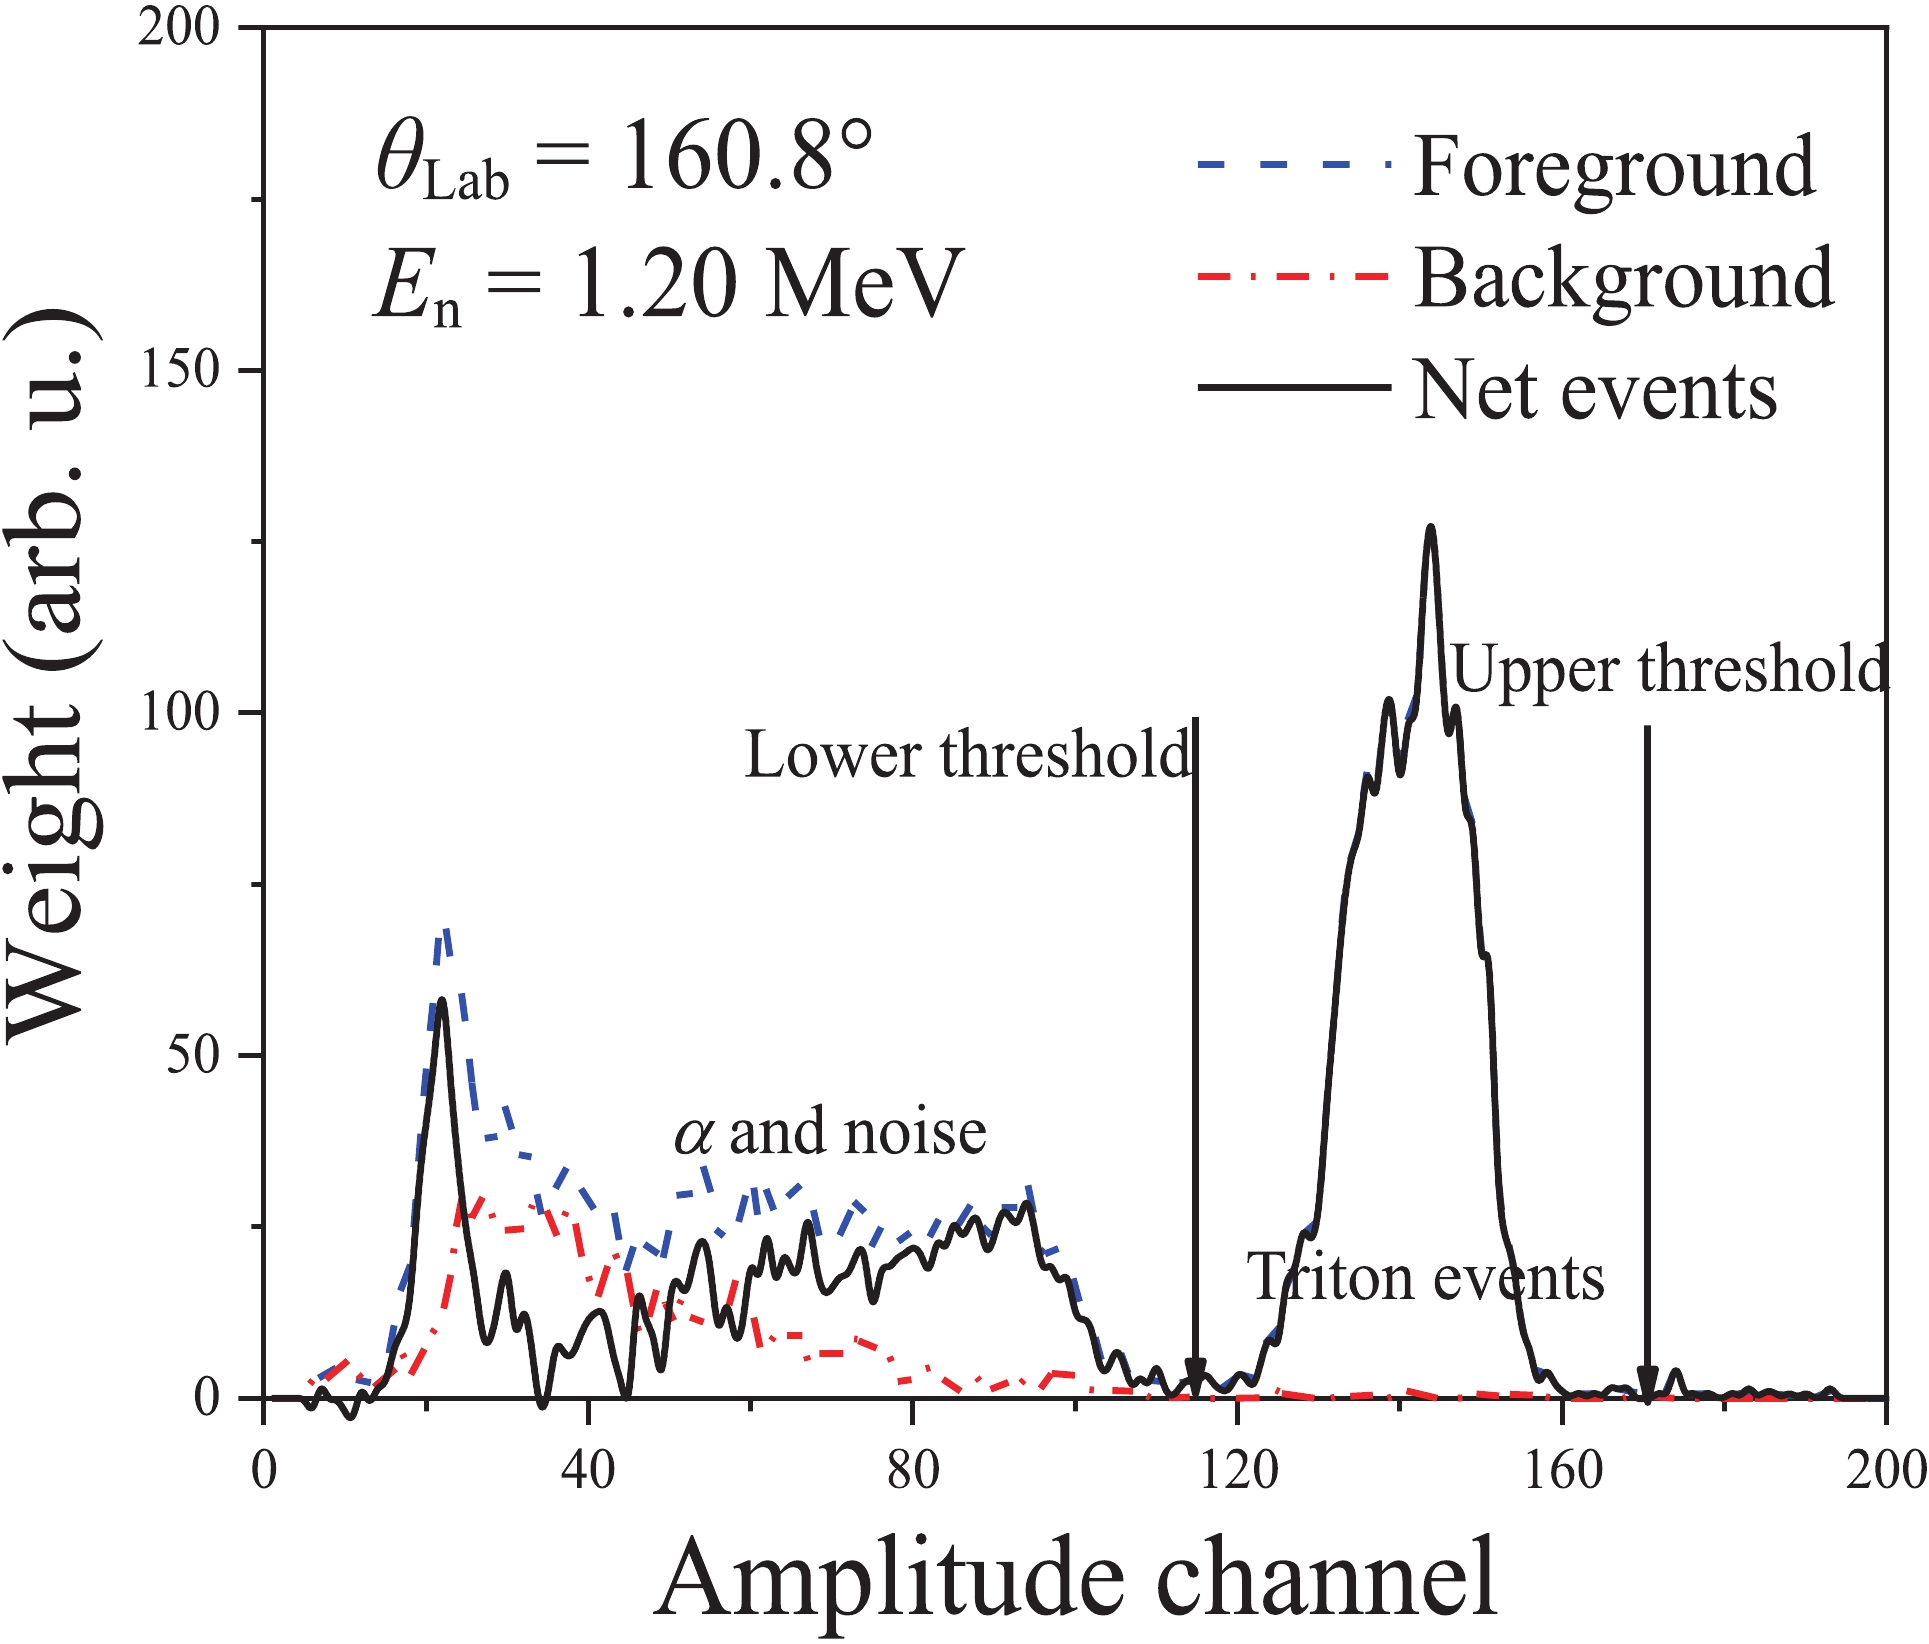
Figure 7. (color online) Measured tritium events for the detection angle of 160.8° and neutron energy of 1.20 MeV.
-
With the neutron energy spectrum, the number of 6Li nuclei in the sample and the detection solid angles of the silicon detectors, the relative differential cross-section
$\sigma _{E{\rm{ - bin,}}\theta }^{\rm re}$ is calculated as$\sigma _{E{\rm{ - bin,}}\theta }^{\rm re} = \frac{{{w_{E{\rm{ - bin,}}\theta }}}}{{{\varphi _{E{\rm{ - bin}}}}{\Omega _\theta }{N_{{\rm{Li}}}}}},$

(3) where wE-bin,θ is the total weight of the net events, φE-bin is the relative neutron fluence, Ωθ is the detection solid angle of the corresponding silicon detector, and NLi is the number of 6Li nuclei (the two samples are not the same). The subscripts E-bin and θ represent the neutron energy bin and the detection angle. The uncertainties of wE-bin,θ, φE-bin, Ωθ, and NLi are <11.5%, 0.5% − 21.4%, 0.3%, and 1.0%, respectively. An example is shown in Fig. 8 labeled “Measured”.
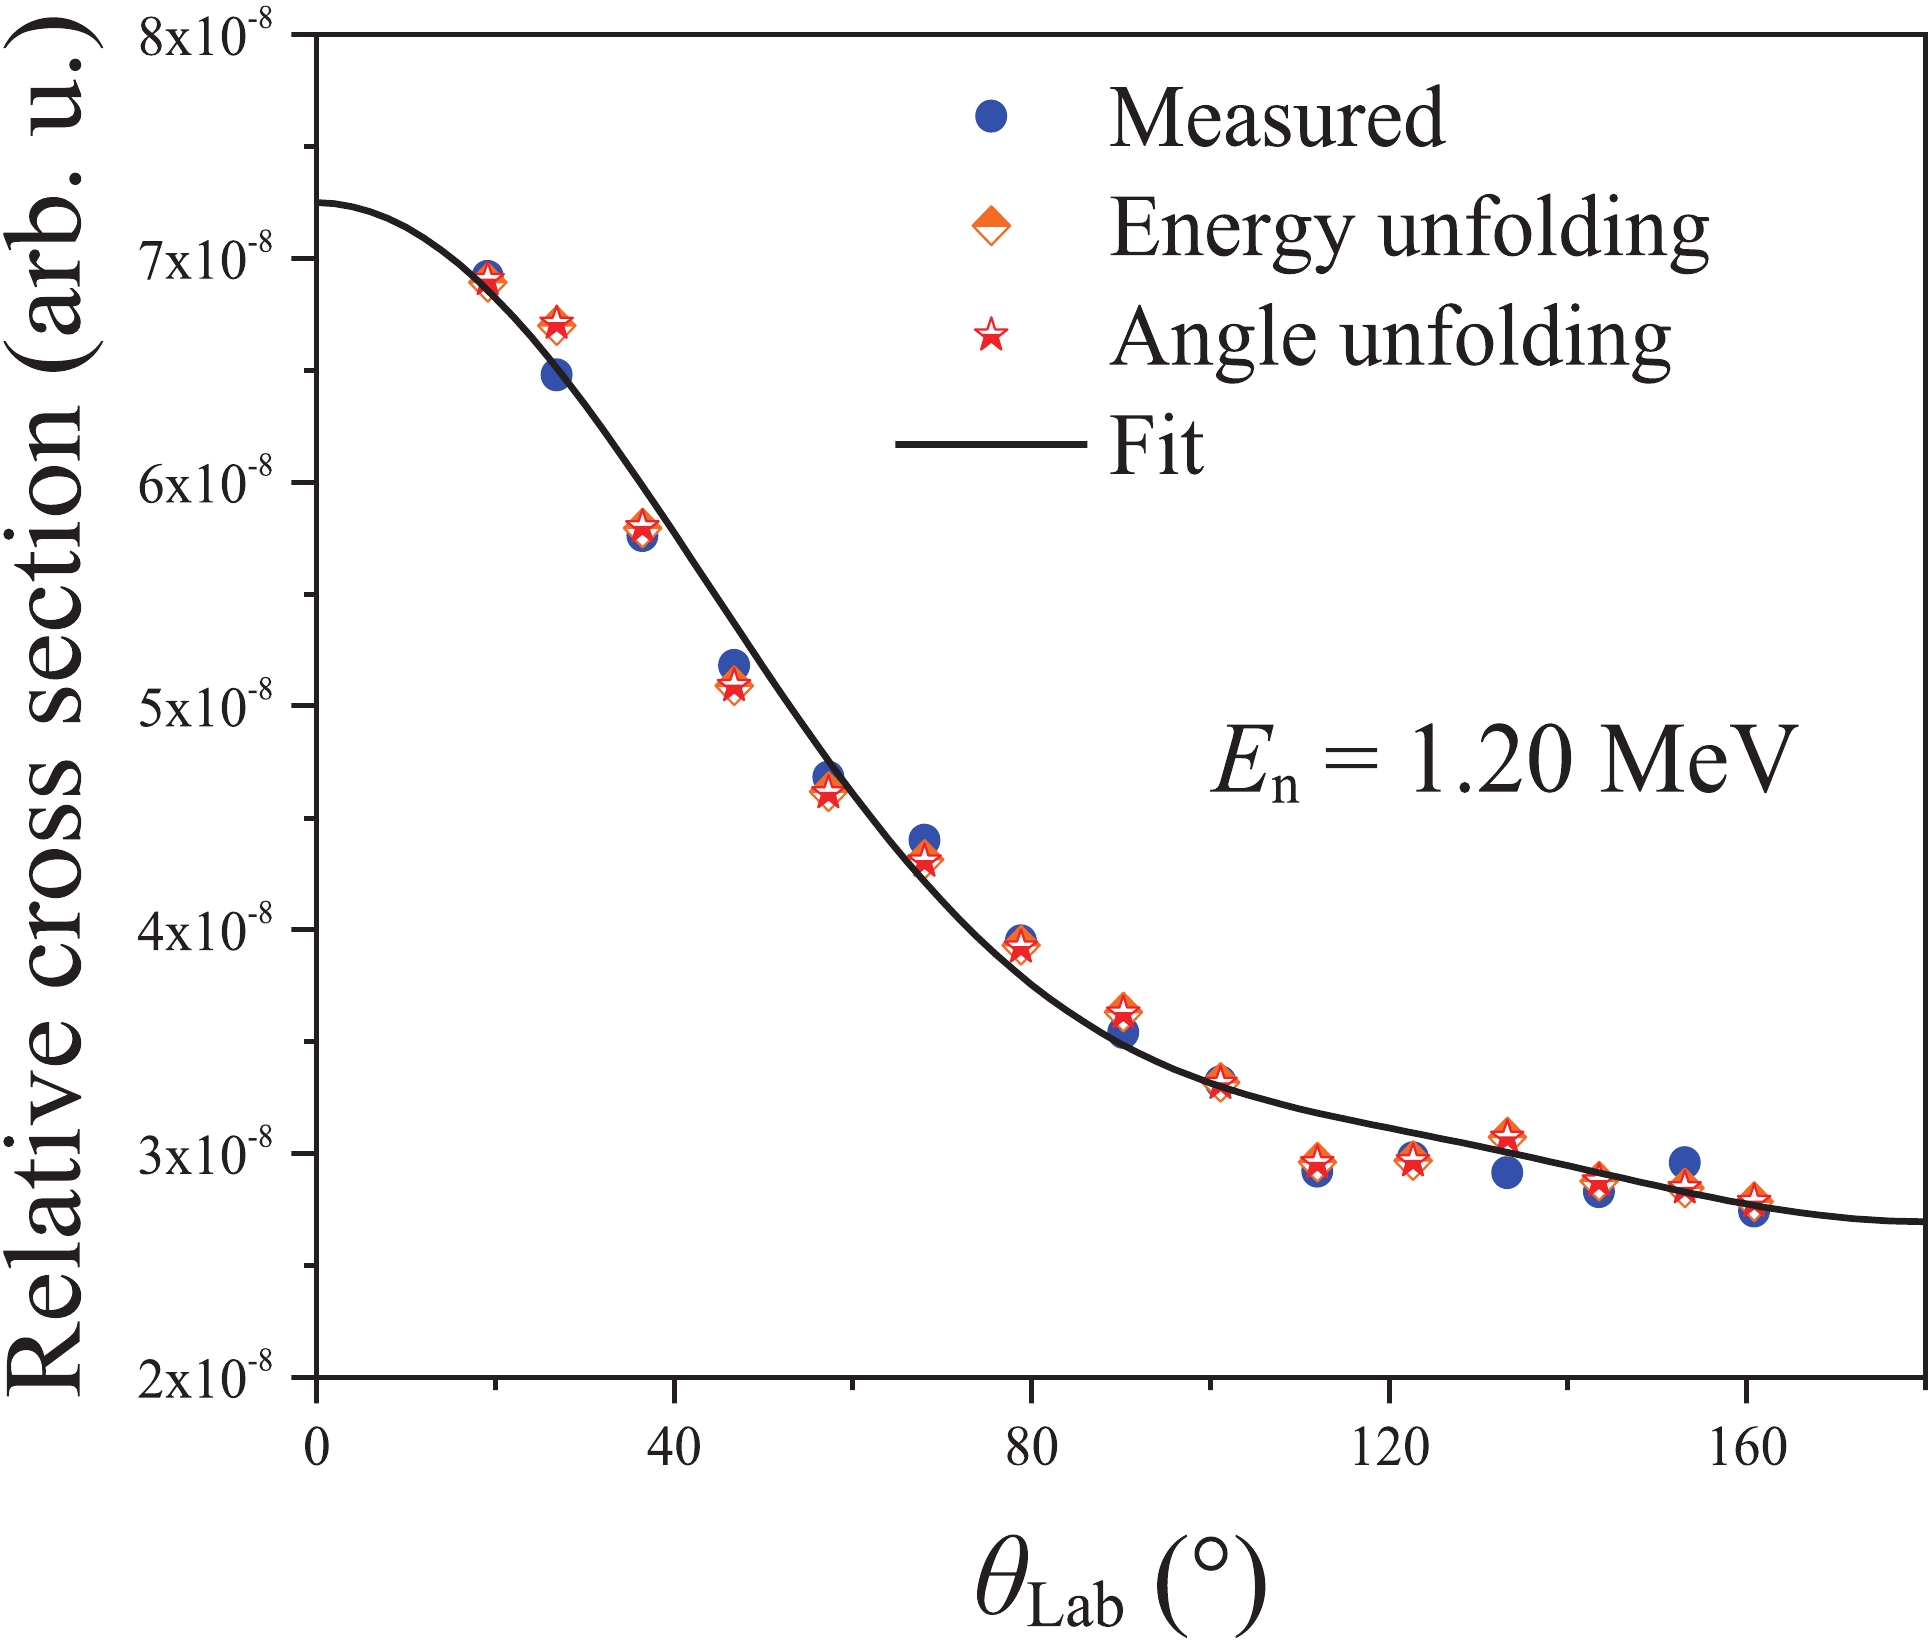
Figure 8. (color online) Relative differential cross-section at En = 1.20 MeV in the laboratory system.
-
The neutrons are generated using double-bunched proton beams, such that the bunches hit the tungsten target with a spacing of 410 ns. This results in an incorrect determination of the neutron energy, especially for high energies. Therefore, the influence of the double bunched proton beams was unfolded using an iterative method [15]. In the unfolding process, every event is split into two child events and each is weighed. As the interval between the two proton bunches is 410 ns centered at T0, the TOF of one child event equals the TOF of the event plus 205 ns, while that of the other equals the TOF of the event minus 205 ns [15]. The neutron energies En_1 and En_2 of the two child events can then be calculated. Using the obtained relative differential cross-sections, and multiplying the number of neutrons in unit duration of TOF (i.e. n/ns) corresponding to the TOFs of the two child events, the relative counts C1 and C2 at En_1 and En_2 are calculated. The weights of the two child events are C1/(C1+C2) and C2/(C1+C2) [15]. With the known energies and weights, the two child events were counted in the corresponding bins, and the new relative differential cross-sections were obtained using the methods presented in Sec. 3.1, 3.2 and 3.3. This iteration process was repeated until the difference between the last two iteration results was smaller than 1%, or the number of iterations reached 10. An example of the result is shown in Fig. 8 labeled “Energy unfolding”.
Although the unfolding decreases the spread of neutron energies, it brings additional uncertainties in the obtained differential cross-sections. As the energy resolution, determined by the interval between the two proton bunches, is relatively small for low neutron energies, the full neutron energy range does not need to be corrected. In the present work, the correction was performed for neutron energies above 0.1 MeV, and the corresponding uncertainties are 0.7% − 73.9% (97% of which are smaller than 10%).
-
As the spreads of the receiving angles of the detectors are 3.8° − 4.0°, their influence should also be corrected. For each neutron energy bin, the relative angular distribution curve was obtained by fitting the 15 measured relative differential cross-sections
$\sigma _{E{\rm{ - bin,}}\theta }^{\rm re}$ using Legendre polynomials of the third order and the least-squares method [16] (second order Legendre polynomials cannot fit the data very well for some neutron energy points). For each detection angle θ, the fitted curve was normalized to$\sigma _{E{\rm{ - bin,}}\theta }^{\rm re}$ . The normalized fitted curve was then convoluted with the distribution of the receiving angles of the detectors (shown in Fig. 4) to obtain a new relative differential cross-section${}^{{\rm{fit}}}\sigma _{E{\rm{ - bin,}}\theta }^{\rm re}$ . The corrected relative differential cross-section${}^{{\rm{cor}}}\sigma _{E{\rm{ - bin,}}\theta }^{\rm re}$ is${}^{{\rm{cor}}}\sigma _{E{\rm{ - bin,}}\theta }^{\rm re} = \sigma _{E{\rm{ - bin,}}\theta }^{\rm re}\frac{{\sigma _{E{\rm{ - bin,}}\theta }^{\rm re}}}{{{}^{{\rm{fit}}}\sigma _{E{\rm{ - bin,}}\theta }^{\rm re}}}.$

(4) New relative angular distribution curves were obtained by fitting the 15
${}^{{\rm{cor}}}\sigma _{E{\rm{ - bin,}}\theta }^{\rm re}$ for each neutron energy bin. New${}^{{\rm{fit}}}\sigma _{E{\rm{ - bin,}}\theta }^{\rm re}$ and new${}^{{\rm{cor}}}\sigma _{E{\rm{ - bin,}}\theta }^{\rm re}$ were calculated using the new relative angular distribution curves. The unfolding process was iterated until the difference between the last two iteration results was smaller than 1%, or the number of the iterations reached 10. The final relative differential cross-sections are shown in Fig. 8 labeled “Angle unfolding” and “Fit”. After the correction, the uncertainties of the receiving angles were reduced to ~0.01°, resulting in uncertainties of the relative differential cross-sections of <1.1%.It should be noted that the distribution of the receiving angles of the detectors shown in Fig. 4 deviate from the actual distribution because in the simulations the charged particles are assumed to be emitted isotropically while in fact they are not isotropic. Fortunately, the influence of these deviations is small since the spreads of the detection angles are small, and the change of the differential cross-sections inside the receiving angle spread is tiny.
-
Fitting the relative differential cross-sections
${}^{{\rm{cor}}}\sigma _{E{\rm{ - bin,}}\theta }^{\rm re}$ with Legendre polynomial of the third order and integrating the fitted curves over the 4π solid angle, the relative angle-integrated cross-sections of the 6Li(n, t)4He reaction were obtained. As the cross-section of the 6Li(n, t)4He reaction is adopted as the standard below 1.0 MeV, the cross-sections from the ENDF/B-VIII.0 library [8] in the range 0.1 − 0.4 MeV, where a strong resonance peak exists, were used for normalization. Finally, the differential cross-sections σE-bin,θ and the angle-integrated cross-sections σ of the 6Li(n, t)4He reaction after normalization are shown in Figs. 9 and 10. The measured data are presented in Appendix A, and the differential cross-sections as a function of the tritium emission angle are presented in Appendix B. The uncertainty of fitting is <0.4%, and that of normalization is 1.0% , based on experience. The uncertainties of the differential cross-sections σE-bin,θ are 1.7% − 74.3% (1.7% − 21.5% below 0.1 MeV; 2.1% − 11.4% in the region 0.1 − 1.0 MeV; 2.3% − 74.3% in the region 1.0 − 3.0 MeV), and of the angle-integrated cross-sections σ are 1.5% − 21.5% (1.5% − 21.5% below 0.1 MeV; 1.8% − 3.1% in the region 0.1 − 1.0 MeV; 1.8% − 3.7% in the region 1.0 − 3.0 MeV). The sources and magnitudes of the uncertainties are given in Table 1.
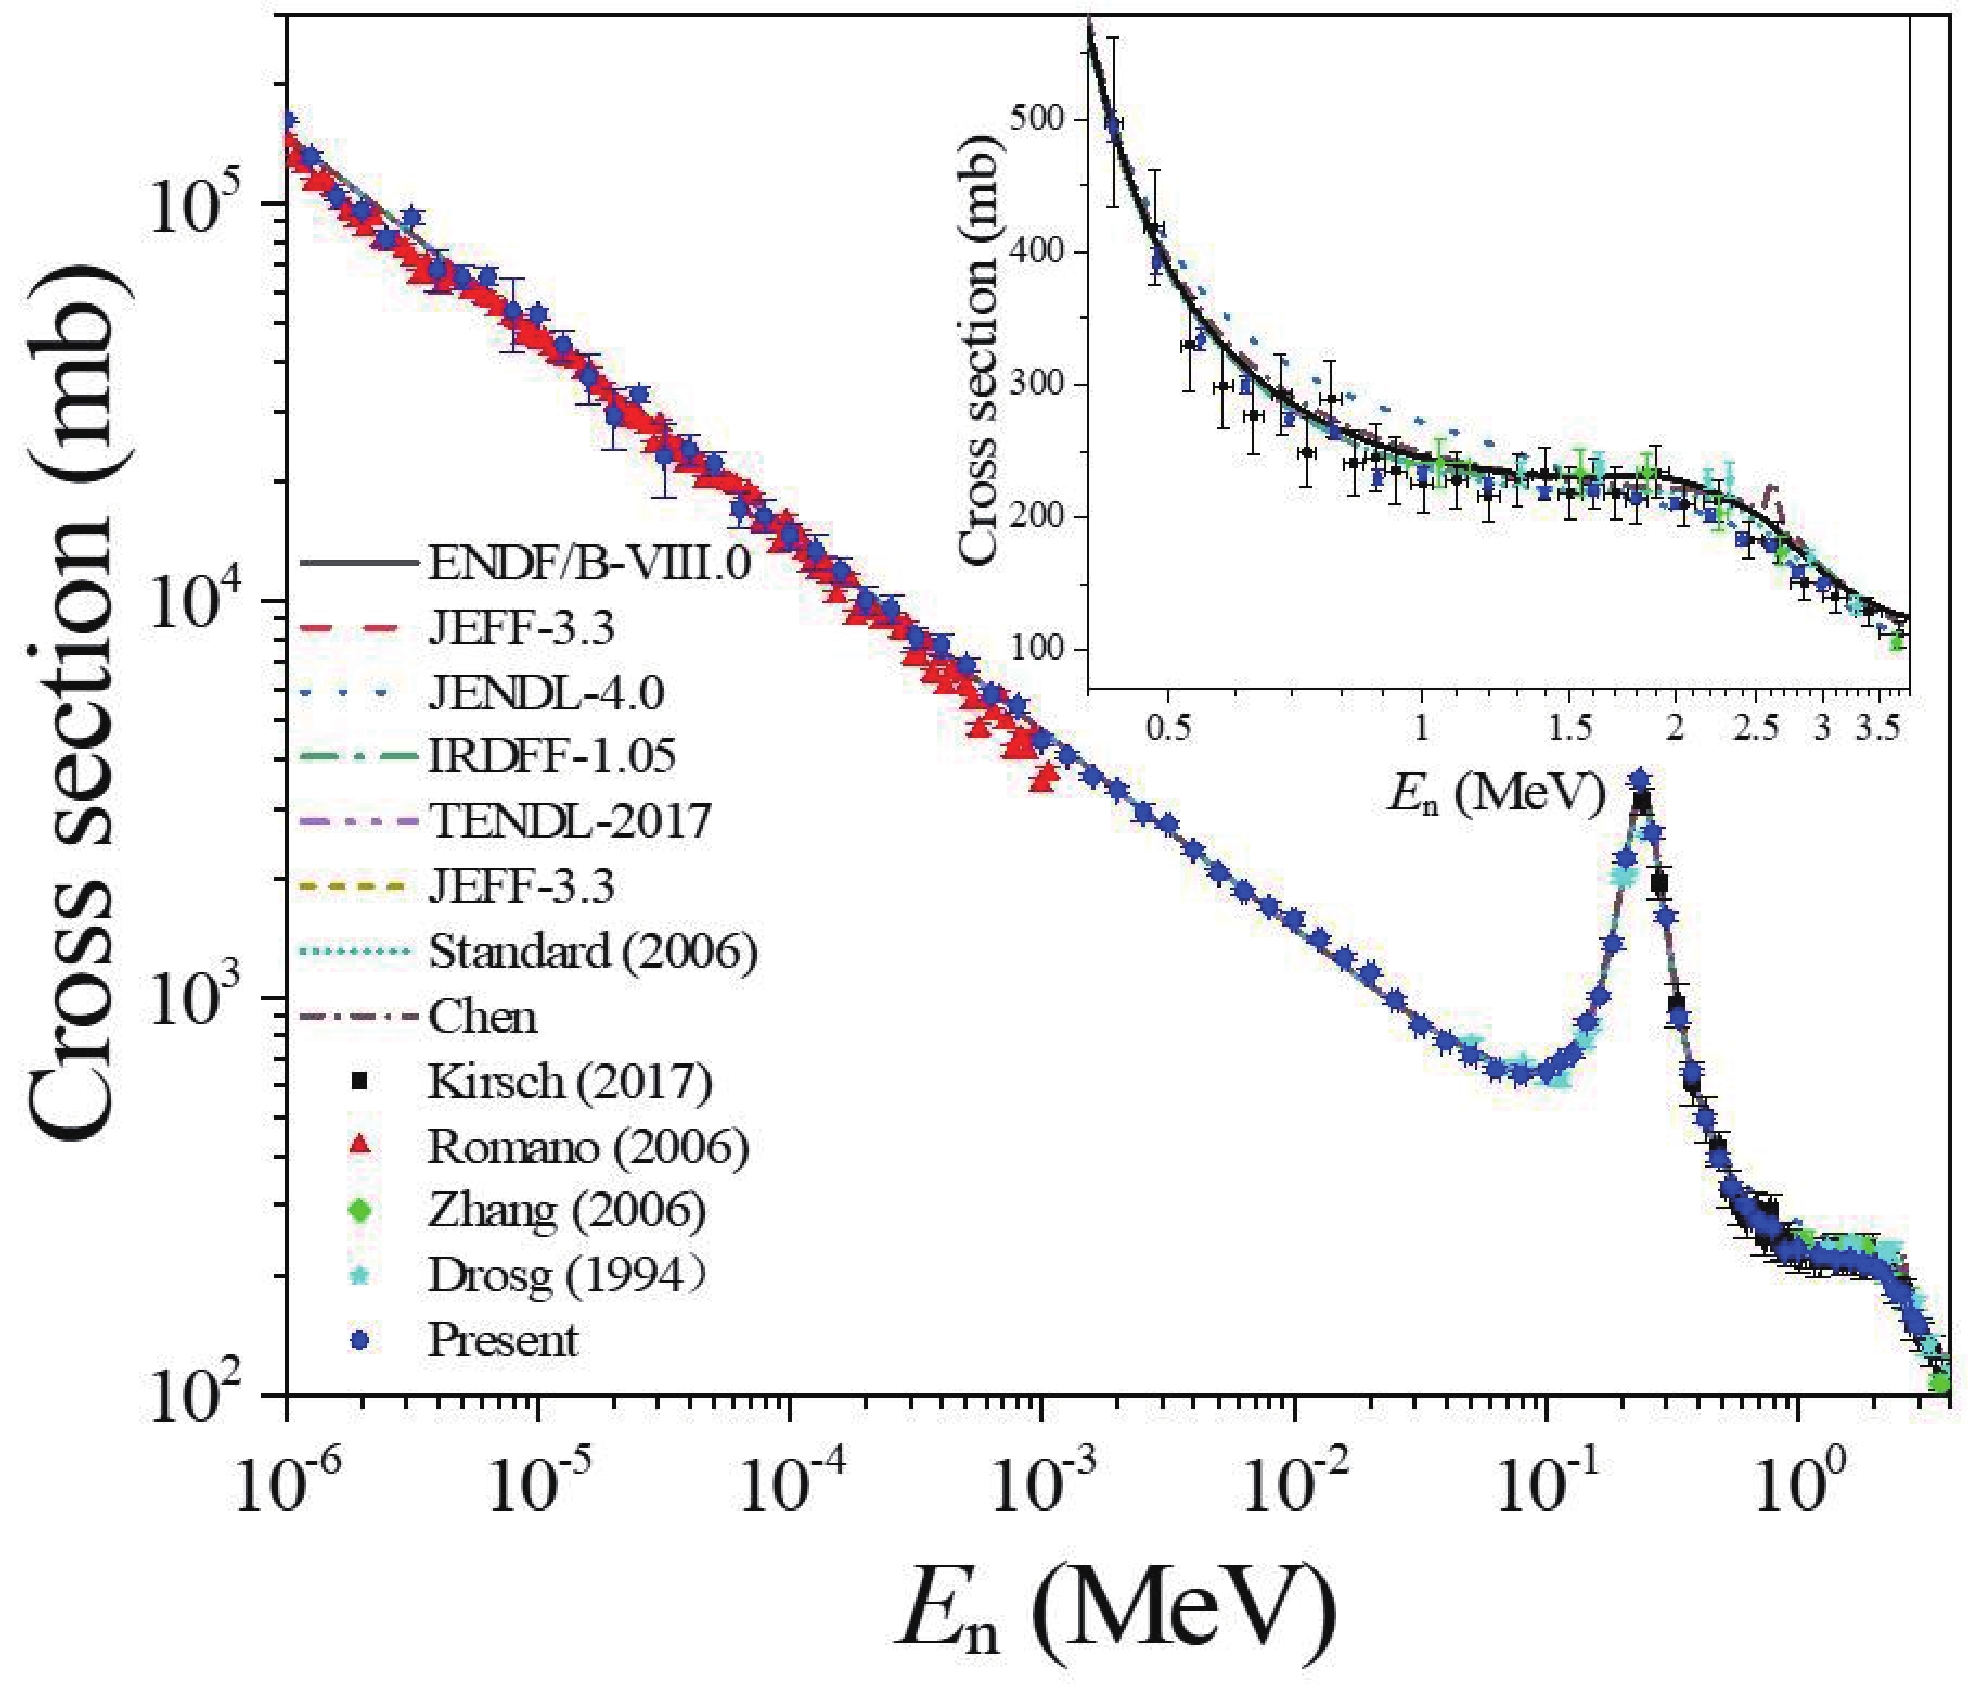
Figure 10. (color online) Angle-integrated cross-sections of the 6Li(n, t)4He reaction obtained in the present experiment, compared with the existing evaluations and measurements since 1990. The evaluations are taken from the ENDF library [8]. “Chen” is the result of the R-matrix analysis performed by Prof. Zhenpeng Chen from Tsinghua University. The experimental data are taken from the EXFOR library [6].
source magnitude (%) source magnitude (%) wE-bin, θ <11.5a; 0.1−2.2b UDB 0.7−73.9a; 0.2−2.9b φE-bin 0.5−21.4 URA <1.1a; <0.1b Ωθ 0.3a; 0.1b Fit <0.4 NLi 1.0 normalization 1.0 a: for differential cross-sections; b: for angle-integrated cross-sections; UDB: unfolding of the double-bunched proton beams; URA: unfolding of the spreads of receiving angles. Table 1. Sources and magnitude of the uncertainties.
-
As shown in Figs. 9 and 10, the measured differential cross-sections and angle-integrated cross-sections fluctuate below 0.1 keV. This is due to the fluctuation of the neutron energy spectrum in this region. The obtained angle-integrated cross-sections of the 6Li(n, t)4He reaction agree well with most evaluations in the region 0.1 keV − 0.5 MeV, which demonstrates the reliability of the present results.

The measured differential cross-sections indicate that the anisotropy of tritium is noticeable above 100 eV (shown in Appendix B). Compared with the evaluations of ENDF/B-VIII.0, JEFF-3.3 [8] and the “Chen” result, which is the R-matrix analysis performed by Prof. Zhenpeng Chen from Tsinghua University, there is a general agreement, but also some differences in the details. 1) The present differential cross-sections agree well with the results of evaluations and the “Chen” result below 0.5 MeV, except in the region around 60 keV where the measured differential cross-sections are lower for emission angles above 130°. 2) In the neutron energy region 0.5 − 3.0 MeV: (a) for emission angles below 50°, the measurement results are generally smaller than the evaluation results in the region ~1.0 − ~2.5 MeV, and for emission angles 30° − 50° our measurements are generally larger than the evaluation results above ~2.5 MeV; (b) for emission angles 50° − 110°, the measured differential cross-sections are generally smaller than the evaluation results, except in the region around 1.5 MeV where our measurements agree with the evaluation results; and (c) for emission angles above 110°, the measured differential cross-sections are generally smaller than the evaluation results above ~0.7 MeV.
Compared with the existing measurements of the angle-integrated cross-sections of the 6Li(n, t)4He reaction included in the EXFOR library since 1990 [6], the present results are in good agreement with the results of Kirsch (2017), Romano (2006) and Zhang (2006) (our previous results) within uncertainties, as shown in Fig. 10. Compared with the existing evaluations, the present results generally agree better with the evaluation of Standard (2006) than with the other evaluations shown in Fig. 10. In the region 0.5 − 3.0 MeV, the present results are smaller than most evaluations [8] beyond the uncertainties of the measurements. Compared with the evaluation of Standard (2006) [4], the present results agree with the evaluations below 1.6 MeV, and are smaller above 1.6 MeV. According to the measured results, the cross-sections decrease by ~5 mb when the neutron energy increases from 1.6 to 1.8 MeV. However, the cross-sections in most evaluations (except JENDL-4.0) do not decrease noticeably. Above 1.6 MeV, the present results agree with the evaluation of JENDL-4.0 which is based on the measurements of Bartle [17, 18]. The decrease of the cross-section from 1.6 to 1.8 MeV is very likely due to the competing reactions 6Li(n, inl)6Li and 6Li(n, nd)4He. According to the ENDF/B-VIII.0 and CENDL-3.1 libraries [8], the cross-sections of the 6Li(n, inl)6Li and 6Li(n, nd)4He reactions increase respectively from 0 to 5 mb, and from 0 to 2 mb, when the neutron energy increases from 1.6 to 1.8 MeV. These values agree with the decrease (~5 mb) of our measured cross-section of the 6Li(n, t)4He reaction from 1.6 to 1.8 MeV.
It should be stressed that the position where the neutron energy spectrum was measured was not the exact position of the present experiment. The actual neutron energy spectrum is expected to deviate from the one used in the present work, which will bring deviations in the measured cross-sections. As the measured cross-sections are normalized to the evaluations of the ENDF/B-VIII.0 library [8] in the region 0.1 − 0.4 MeV, the relative deviations between the actual and present cross-sections are small in the region 0.4 − 3.0 MeV. According to our simulations, the deviations should be smaller than 5%. In the lower neutron energy region, e.g. below 1.0 keV, the deviations may be larger, but the angular distributions are not affected. More precise results require better measurements of the neutron energy spectrum.
-
In the present work, the 6Li(n, t)4He reaction was measured in the neutron energy range 1.0 eV − 3.0 MeV at 80 energy points. Differential cross-sections at 15 angles ranging from 19.2° − 160.8° were obtained. For 50 neutron energy points below 0.1 MeV, there are no previous measurements in the EXFOR library [6]. Compared with the evaluations shown in Fig. 9, the present differential cross-sections in general agree well with the evaluations, although there are some differences in the details. The present angle-integrated cross-sections of the 6Li(n, t)4He reaction agree well with the evaluation results of Standard (2006) below 1.6 MeV, demonstrating the reliability of the present results [4]. The measured data are listed in Appendix A, and the differential cross-sections as a function of the tritium emission angle (in the laboratory reference system) are plotted in Appendix B.
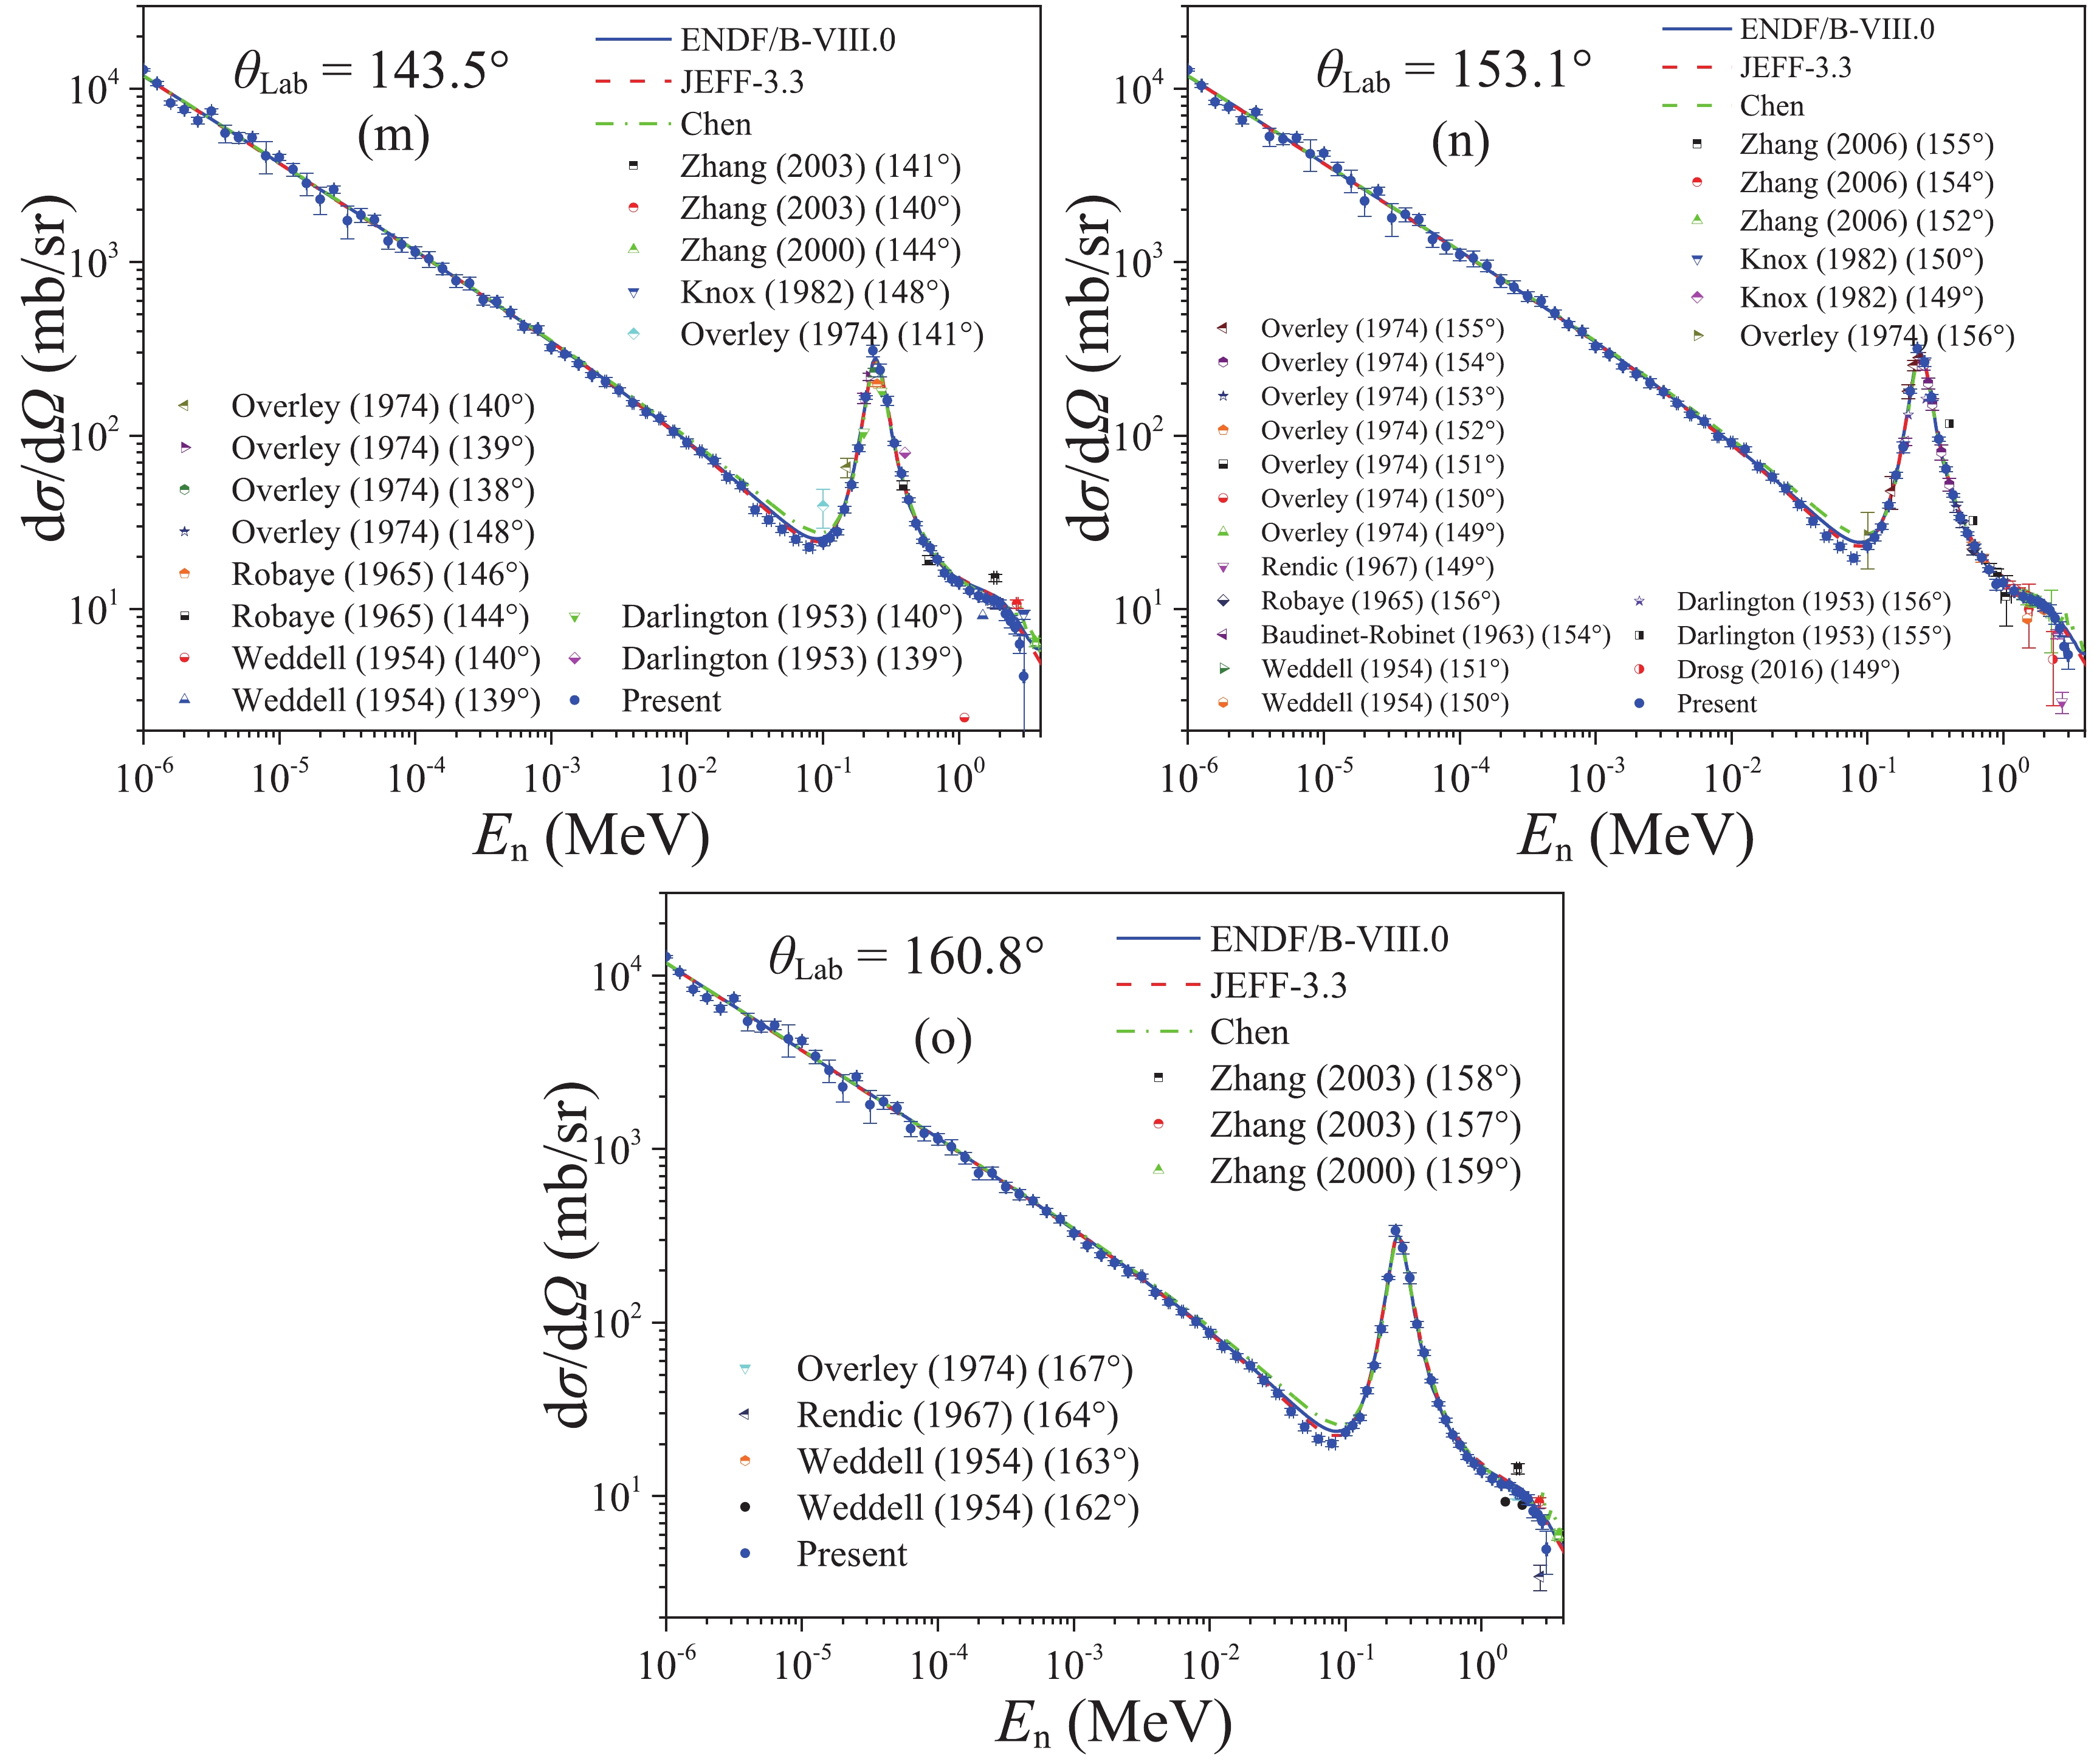
Figure 9. (color online) Differential cross-sections of the 6Li(n, t)4He reaction as a function of the incident neutron energy obtained in the present experiment, compared with the existing evaluations and measurements. The evaluations of ENDF/B-VIII.0 and JEFF-3.3 and the experimental data are taken from the ENDF [8] and EXFOR [6] libraries, respectively. “Chen” is the result of the R-matrix analysis performed by Prof. Zhenpeng Chen from Tsinghua University.
As the present results are systematic and consistent, they are important for the evaluation of the 6Li(n, t)4He reaction, especially in the neutron energy regions beyond the standard cross-sections for this reaction. They can also be useful in the studies of nuclear reaction mechanisms with light nuclei, and in the measurements of neutron fluence and energy spectrum. It is important to note that the present results indicate that the cross-sections of the 6Li(n, t)4He reaction might be overestimated by most evaluations in the region 0.5 − 3.0 MeV, although the cross-sections below 1.0 MeV are adopted as standards. This observation is also supported by the latest measurement results of Kirsch (2017) [7]. However, this conclusion is not yet definitive and more measurements are required for further verification.
The authors are indebted to the operations crew of CSNS, and are grateful to Dr. Qiwen Fan for preparing the samples.
-
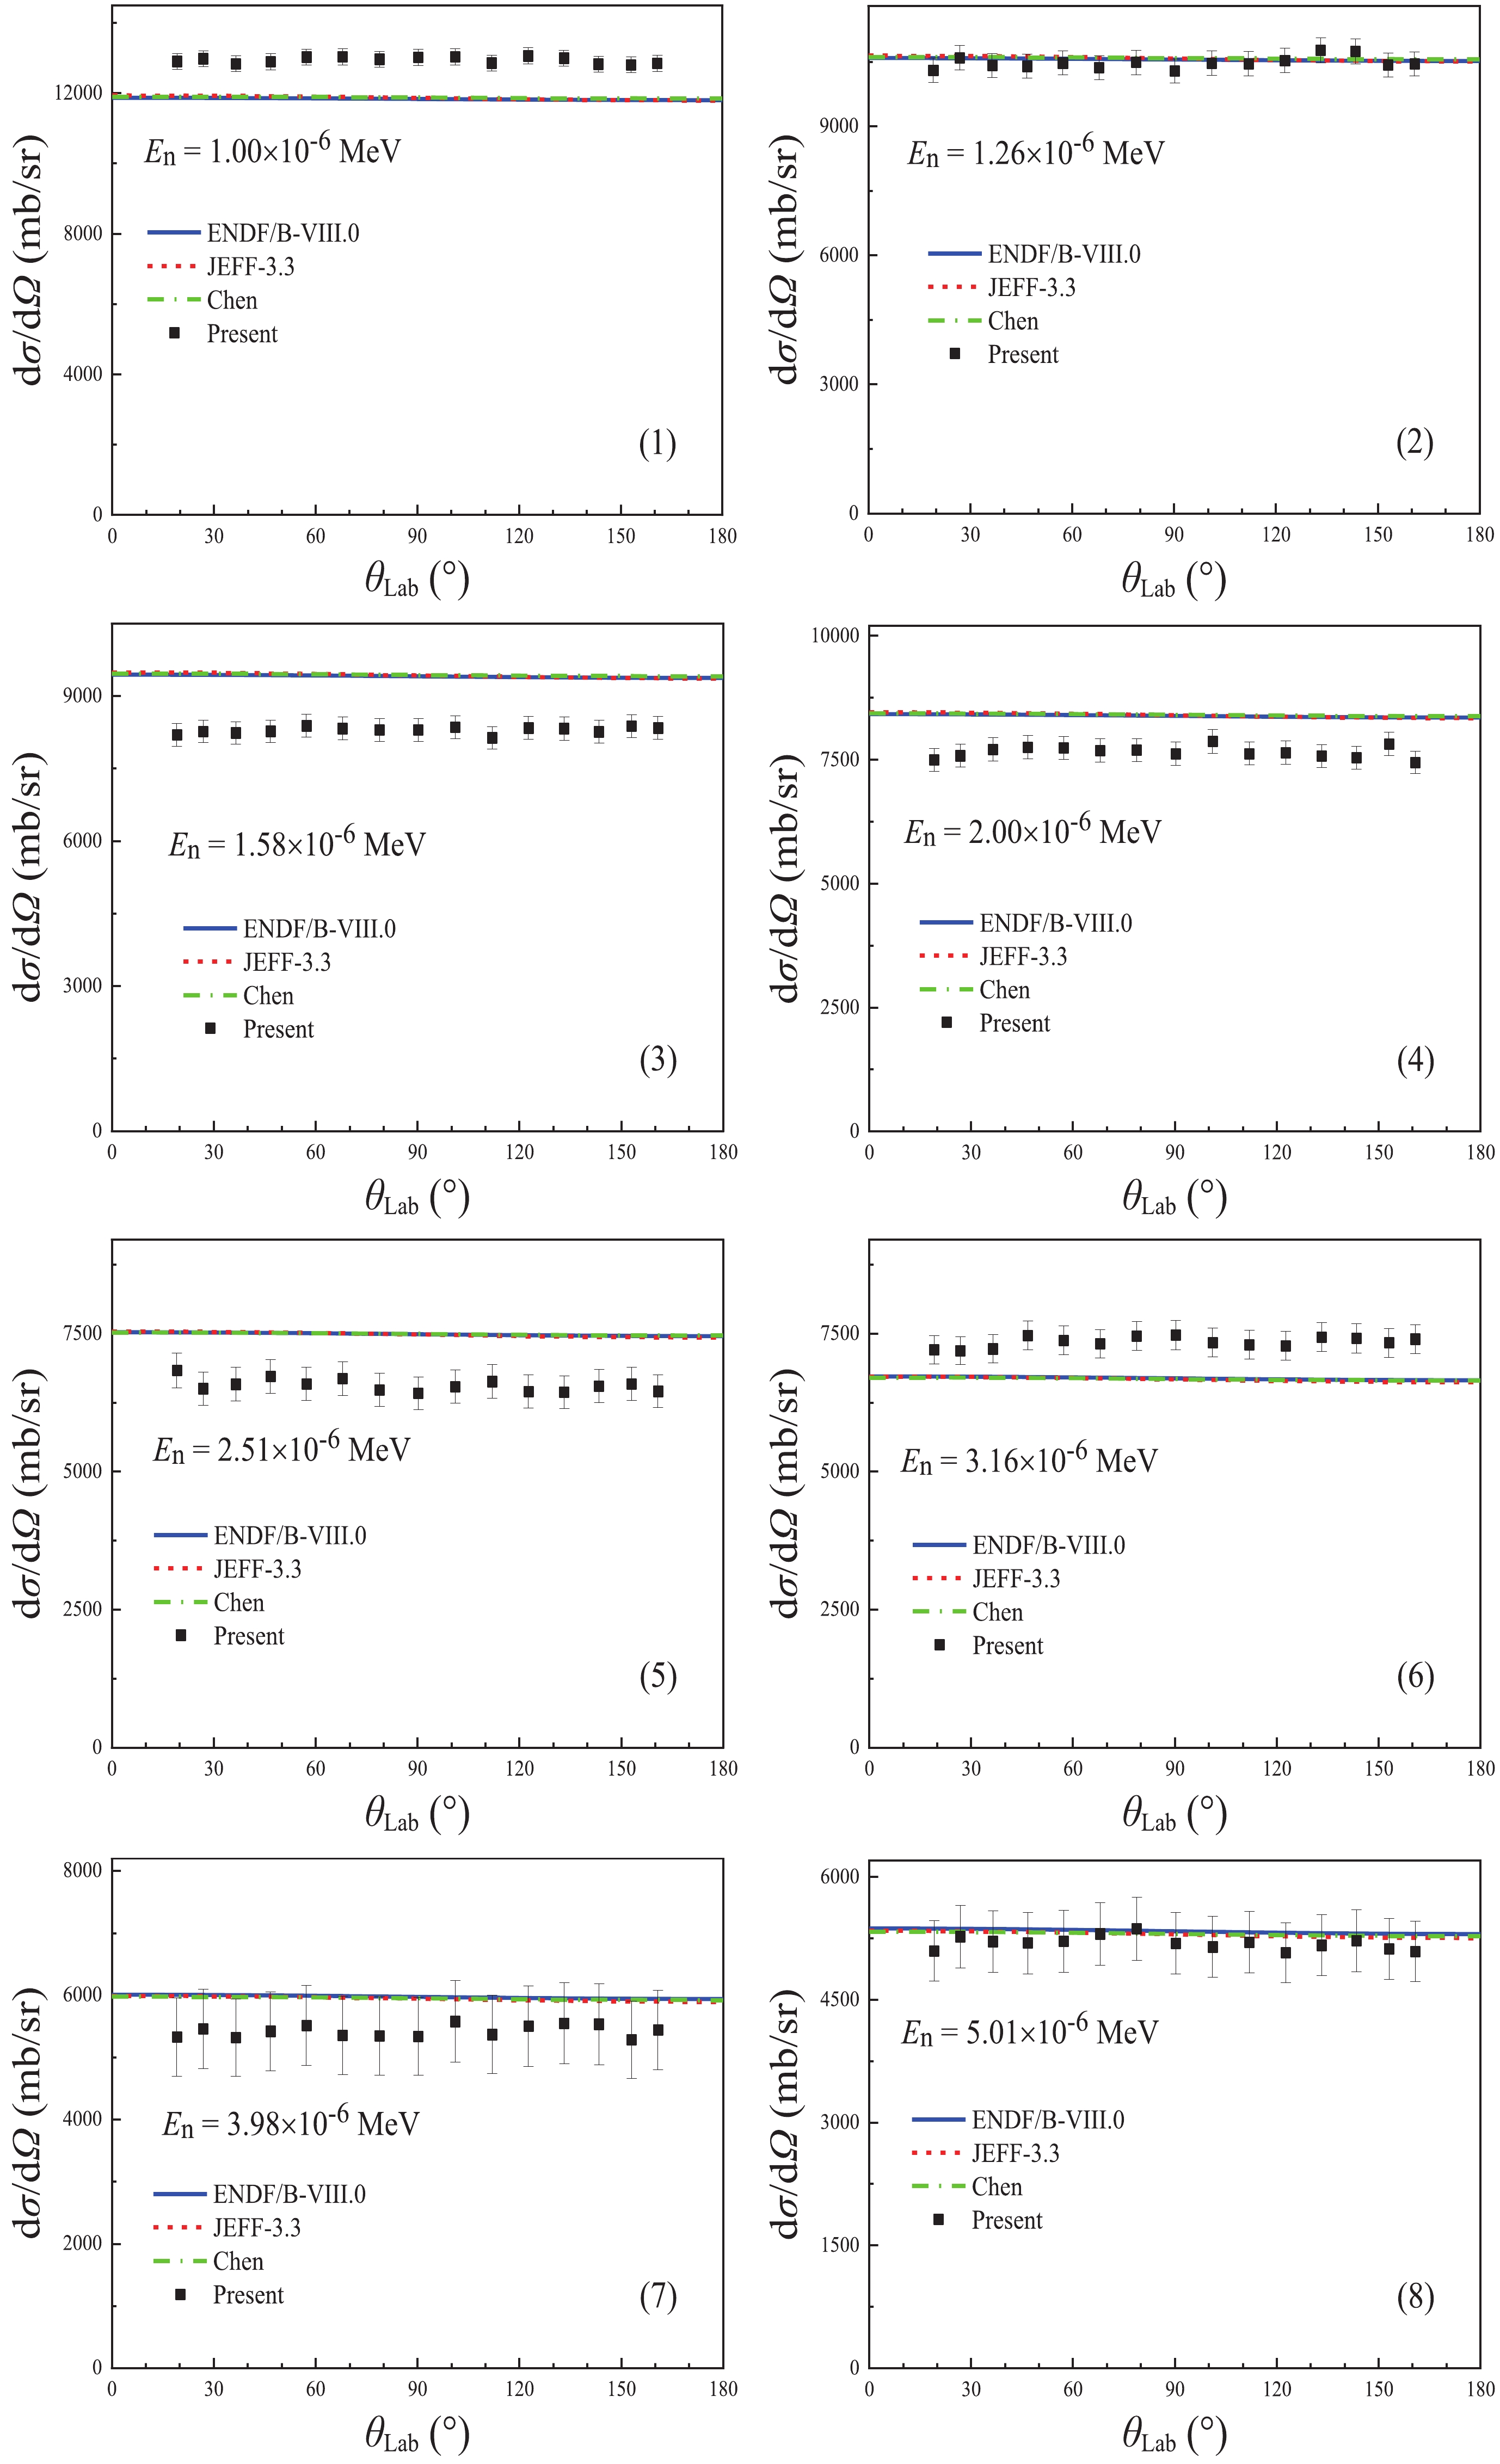
En /MeV σE−bin, θ /(mb/sr) 19.2° 26.9° 36.5° 46.7° 57.3° 68.0° 1.00×10⁻⁶±4.2×10⁻⁹ 1.29×10⁴±2.3×10² 1.30×10⁴±2.3×10² 1.28×10⁴±2.2×10² 1.29×10⁴±2.2×10² 1.30×10⁴±2.3×10² 1.30×10⁴±2.3×10² 1.26×10⁻⁶±5.3×10⁻⁹ 1.03×10⁴±2.8×10² 1.06×10⁴±2.8×10² 1.04×10⁴±2.8×10² 1.04×10⁴±2.8×10² 1.05×10⁴±2.8×10² 1.04×10⁴±2.8×10² 1.58×10⁻⁶±6.7×10⁻⁹ 8.19×10³±2.3×10² 8.26×10³±2.3×10² 8.23×10³±2.3×10² 8.26×10³±2.3×10² 8.38×10³±2.4×10² 8.32×10³±2.4×10² 2.00×10⁻⁶±8.5×10⁻⁹ 7.49×10³±2.3×10² 7.58×10³±2.3×10² 7.71×10³±2.4×10² 7.75×10³±2.4×10² 7.73×10³±2.3×10² 7.68×10³±2.3×10² 2.51×10⁻⁶±1.1×10⁻⁸ 6.83×10³±3.2×10² 6.50×10³±3.0×10² 6.58×10³±3.0×10² 6.72×10³±3.1×10² 6.59×10³±3.0×10² 6.68×10³±3.1×10² 3.16×10⁻⁶±1.4×10⁻⁸ 7.20×10³±2.6×10² 7.19×10³±2.5×10² 7.22×10³±2.6×10² 7.47×10³±2.6×10² 7.37×10³±2.6×10² 7.31×10³±2.6×10² 3.98×10⁻⁶±1.7×10⁻⁸ 5.33×10³±6.3×10² 5.46×10³±6.4×10² 5.32×10³±6.2×10² 5.42×10³±6.4×10² 5.51×10³±6.5×10² 5.35×10³±6.3×10² 5.01×10⁻⁶±2.2×10⁻⁸ 5.10×10³±3.7×10² 5.27×10³±3.8×10² 5.21×10³±3.8×10² 5.19×10³±3.8×10² 5.21×10³±3.8×10² 5.30×10³±3.8×10² 6.31×10⁻⁶±2.8×10⁻⁸ 5.28×10³±2.8×10² 5.13×10³±2.7×10² 5.34×10³±2.8×10² 5.12×10³±2.7×10² 5.24×10³±2.8×10² 5.21×10³±2.8×10² 7.94×10⁻⁶±3.7×10⁻⁸ 4.16×10³±8.7×10² 4.33×10³±9.0×10² 4.40×10³±9.2×10² 4.30×10³±9.0×10² 4.38×10³±9.1×10² 4.28×10³±8.9×10² 1.00×10⁻⁵±4.7×10⁻⁸ 4.39×10³±1.7×10² 4.26×10³±1.6×10² 4.18×10³±1.6×10² 4.18×10³±1.6×10² 4.22×10³±1.6×10² 4.18×10³±1.6×10² 1.26×10⁻⁵±6.1×10⁻⁸ 3.54×10³±3.1×10² 3.60×10³±3.1×10² 3.55×10³±3.1×10² 3.55×10³±3.1×10² 3.58×10³±3.1×10² 3.58×10³±3.1×10² 1.58×10⁻⁵±7.9×10⁻⁸ 2.92×10³±4.3×10² 2.97×10³±4.4×10² 2.97×10³±4.4×10² 2.97×10³±4.4×10² 2.99×10³±4.4×10² 2.91×10³±4.3×10² 2.00×10⁻⁵±1.0×10⁻⁷ 2.35×10³±4.2×10² 2.38×10³±4.3×10² 2.37×10³±4.3×10² 2.35×10³±4.2×10² 2.37×10³±4.3×10² 2.26×10³±4.1×10² 2.51×10⁻⁵±1.3×10⁻⁷ 2.66×10³±1.3×10² 2.78×10³±1.3×10² 2.68×10³±1.3×10² 2.63×10³±1.3×10² 2.61×10³±1.3×10² 2.73×10³±1.3×10² 3.16×10⁻⁵±1.8×10⁻⁷ 1.87×10³±4.0×10² 1.80×10³±3.9×10² 1.86×10³±4.0×10² 1.89×10³±4.1×10² 1.86×10³±4.0×10² 1.90×10³±4.1×10² 3.98×10⁻⁵±2.4×10⁻⁷ 1.85×10³±1.7×10² 1.94×10³±1.8×10² 1.95×10³±1.8×10² 2.00×10³±1.8×10² 1.91×10³±1.7×10² 1.95×10³±1.8×10² 5.01×10⁻⁵±3.2×10⁻⁷ 1.79×10³±1.3×10² 1.83×10³±1.3×10² 1.77×10³±1.3×10² 1.76×10³±1.3×10² 1.76×10³±1.2×10² 1.81×10³±1.3×10² 6.31×10⁻⁵±4.4×10⁻⁷ 1.38×10³±1.4×10² 1.39×10³±1.4×10² 1.39×10³±1.4×10² 1.41×10³±1.4×10² 1.37×10³±1.4×10² 1.38×10³±1.4×10² 7.94×10⁻⁵±6.0×10⁻⁷ 1.28×10³±1.2×10² 1.37×10³±1.3×10² 1.33×10³±1.3×10² 1.34×10³±1.3×10² 1.32×10³±1.2×10² 1.34×10³±1.3×10² 1.00×10⁻⁴±8.5×10⁻⁷ 1.15×10³±8.8×101 1.17×10³±8.9×101 1.18×10³±8.9×101 1.21×10³±9.2×101 1.19×10³±9.0×101 1.22×10³±9.3×101 1.26×10⁻⁴±1.1×10⁻⁶ 1.08×10³±1.1×10² 1.09×10³±1.1×10² 1.08×10³±1.1×10² 1.07×10³±1.1×10² 1.10×10³±1.1×10² 1.10×10³±1.1×10² Continued on next page Table A1. The measured differential cross-sections of the 6Li(n, t)4He reaction in the laboratory system.
En /MeV σE−bin, θ /(mb/sr) 78.8° 90.3° 101.2° 112.0° 122.7° 1.00×10⁻⁶±4.2×10⁻⁹ 1.30×10⁴±2.2×10² 1.30×10⁴±2.3×10² 1.30×10⁴±2.3×10² 1.29×10⁴±2.2×10² 1.31×10⁴±2.3×10² 1.26×10⁻⁶±5.3×10⁻⁹ 1.05×10⁴±2.8×10² 1.03×10⁴±2.8×10² 1.05×10⁴±2.8×10² 1.04×10⁴±2.8×10² 1.05×10⁴±2.9×10² 1.58×10⁻⁶±6.7×10⁻⁹ 8.29×10³±2.4×10² 8.29×10³±2.4×10² 8.35×10³±2.4×10² 8.13×10³±2.3×10² 8.33×10³±2.4×10² 2.00×10⁻⁶±8.5×10⁻⁹ 7.69×10³±2.3×10² 7.62×10³±2.3×10² 7.87×10³±2.4×10² 7.62×10³±2.3×10² 7.64×10³±2.3×10² 2.51×10⁻⁶±1.1×10⁻⁸ 6.48×10³±3.0×10² 6.42×10³±3.0×10² 6.53×10³±3.0×10² 6.63×10³±3.1×10² 6.45×10³±3.0×10² 3.16×10⁻⁶±1.4×10⁻⁸ 7.46×10³±2.6×10² 7.47×10³±2.7×10² 7.34×10³±2.6×10² 7.30×10³±2.6×10² 7.27×10³±2.6×10² 3.98×10⁻⁶±1.7×10⁻⁸ 5.34×10³±6.3×10² 5.34×10³±6.3×10² 5.58×10³±6.6×10² 5.37×10³±6.3×10² 5.50×10³±6.5×10² 5.01×10⁻⁶±2.2×10⁻⁸ 5.36×10³±3.9×10² 5.19×10³±3.8×10² 5.14×10³±3.7×10² 5.20×10³±3.8×10² 5.07×10³±3.7×10² 6.31×10⁻⁶±2.8×10⁻⁸ 5.29×10³±2.8×10² 5.29×10³±2.8×10² 5.19×10³±2.8×10² 5.23×10³±2.8×10² 5.24×10³±2.8×10² 7.94×10⁻⁶±3.7×10⁻⁸ 4.38×10³±9.2×10² 4.29×10³±9.0×10² 4.23×10³±8.8×10² 4.14×10³±8.6×10² 4.29×10³±9.0×10² 1.00×10⁻⁵±4.7×10⁻⁸ 4.32×10³±1.7×10² 4.11×10³±1.6×10² 4.24×10³±1.7×10² 4.07×10³±1.6×10² 4.21×10³±1.6×10² 1.26×10⁻⁵±6.1×10⁻⁸ 3.60×10³±3.1×10² 3.41×10³±3.0×10² 3.44×10³±3.0×10² 3.48×10³±3.0×10² 3.53×10³±3.1×10² 1.58×10⁻⁵±7.9×10⁻⁸ 3.00×10³±4.5×10² 2.87×10³±4.3×10² 2.94×10³±4.4×10² 2.86×10³±4.3×10² 2.85×10³±4.2×10² 2.00×10⁻⁵±1.0×10⁻⁷ 2.32×10³±4.2×10² 2.32×10³±4.2×10² 2.26×10³±4.1×10² 2.31×10³±4.2×10² 2.32×10³±4.2×10² 2.51×10⁻⁵±1.3×10⁻⁷ 2.63×10³±1.3×10² 2.57×10³±1.3×10² 2.64×10³±1.3×10² 2.55×10³±1.2×10² 2.64×10³±1.3×10² 3.16×10⁻⁵±1.8×10⁻⁷ 1.85×10³±4.0×10² 1.80×10³±3.9×10² 1.84×10³±4.0×10² 1.80×10³±3.9×10² 1.90×10³±4.1×10² 3.98×10⁻⁵±2.4×10⁻⁷ 1.97×10³±1.8×10² 1.86×10³±1.7×10² 1.95×10³±1.8×10² 1.91×10³±1.7×10² 1.86×10³±1.7×10² Continued on next page Table A2. The measured differential cross-sections of the 6Li(n, t)4He reaction in the laboratory system.
En /MeV σE−bin, θ /(mb/sr) σ /mb 133.2° 143.5° 153.1° 160.8° 1.00×10⁻⁶±4.2×10⁻⁹ 1.30×10⁴±2.3×10² 1.28×10⁴±2.2×10² 1.28×10⁴±2.2×10² 1.28×10⁴±2.3×10² 1.63×10⁵±2.5×10³ 1.26×10⁻⁶±5.3×10⁻⁹ 1.08×10⁴±2.9×10² 1.07×10⁴±2.9×10² 1.04×10⁴±2.8×10² 1.04×10⁴±2.8×10² 1.32×10⁵±3.3×10³ 1.58×10⁻⁶±6.7×10⁻⁹ 8.32×10³±2.4×10² 8.25×10³±2.4×10² 8.37×10³±2.4×10² 8.33×10³±2.4×10² 1.04×10⁵±2.7×10³ 2.00×10⁻⁶±8.5×10⁻⁹ 7.57×10³±2.3×10² 7.54×10³±2.3×10² 7.82×10³±2.4×10² 7.44×10³±2.3×10² 9.63×10⁴±2.7×10³ 2.51×10⁻⁶±1.1×10⁻⁸ 6.43×10³±3.0×10² 6.55×10³±3.0×10² 6.59×10³±3.0×10² 6.45×10³±3.0×10² 8.24×10⁴±3.6×10³ 3.16×10⁻⁶±1.4×10⁻⁸ 7.43×10³±2.6×10² 7.41×10³±2.6×10² 7.33×10³±2.6×10² 7.40×10³±2.6×10² 9.24×10⁴±3.0×10³ 3.98×10⁻⁶±1.7×10⁻⁸ 5.55×10³±6.5×10² 5.53×10³±6.5×10² 5.28×10³±6.2×10² 5.44×10³±6.4×10² 6.82×10⁴±7.9×10³ 5.01×10⁻⁶±2.2×10⁻⁸ 5.16×10³±3.7×10² 5.22×10³±3.8×10² 5.12×10³±3.7×10² 5.09×10³±3.7×10² 6.53×10⁴±4.6×10³ 6.31×10⁻⁶±2.8×10⁻⁸ 5.15×10³±2.8×10² 5.22×10³±2.8×10² 5.20×10³±2.8×10² 5.18×10³±2.8×10² 6.57×10⁴±3.4×10³ 7.94×10⁻⁶±3.7×10⁻⁸ 4.30×10³±9.0×10² 4.09×10³±8.5×10² 4.21×10³±8.8×10² 4.31×10³±9.0×10² 5.37×10⁴±1.1×10⁴ 1.00×10⁻⁵±4.7×10⁻⁸ 4.14×10³±1.6×10² 4.02×10³±1.6×10² 4.24×10³±1.7×10² 4.20×10³±1.6×10² 5.27×10⁴±1.8×10³ Continued on next page Table A3. The measured differential cross-sections in the laboratory system and the angle-integrated cross-sections of the 6Li(n, t)4He reaction.
-
The angular distribution changes with the energy of the incident neutron. a) It approaches the isotropic distribution for neutron energies below ~100 eV; b) It tends to forward directions in the neutron energy region from ~100 eV to ~0.13 MeV; c) For large emission angles, it increases in the neutron energy region from ~0.13 to ~0.34 MeV; d) For large emission angles, it decreases in the region from ~0.34 to ~1.6 MeV; and e) For small emission angles, it decreases in the neutron energy region from ~1.6 to ~3.0 MeV.
Measurement of the differential cross sections and angle-integrated cross sections of the 6Li(n, t)4He reaction from 1.0 eV to 3.0 MeV at the CSNS Back-n white neutron source
- Received Date: 2019-08-25
- Accepted Date: 2019-10-21
- Available Online: 2020-01-01
Abstract: The 6Li(n, t)4He reaction was measured as the first experiment involving neutron-induced charged particle emission reactions at the CSNS (China Spallation Neutron Source) Back-n white neutron source. The differential cross-sections of the 6Li(n, t)4He reaction at 15 detection angles ranging from 19.2° to 160.8° are obtained from 1.0 eV to 3.0 MeV at 80 neutron energy points; for 50 energy points below 0.1 MeV they are reported for the first time. The results indicate that the anisotropy of the emitted tritium is noticeable above En = 100 eV. The angle-integrated cross-sections are also obtained. The present differential cross-sections agree in general with the previous evaluations, but there are some differences in the details. More importantly, the present results indicate that the cross-sections of the 6Li(n, t)4He reaction might be overestimated by most evaluations in the 0.5 − 3.0 MeV region, although they are recommended as standards below 1.0 MeV.


 DownLoad: