


 Abstract
 HTML
HTML Reference
 Related
 PDF
PDF


-
Study of the muonic component of the extensive air showers (EAS) is of great importance for understanding the process of EAS. Most muons come from the hadronic interactions in EAS. The gamma ray shower contains far less muons than the hadronic shower, which makes the muon number an important parameter to discriminate the overwhelming cosmic ray background from the gamma ray signal. Similarly to the so called NKG distribution, which accurately describes the lateral distribution of secondary particles in an electromagnetic shower, the muon density in a hadronic shower is high at the shower core and decreases gradually with the lateral distance. Due to the non-perturbative behavior of the QCD theory, exact calculations of the hadronic shower and of the muon lateral distribution are impossible. Therefore, hadronic models are usually adopted in the numerical calculations. Experimental measurements of the hadronic and muon components are very important to test the models. On the other hand, lateral muon distribution contains the information on the nature of the primary particles.
To measure the muon lateral distribution, a hybrid experiment is preferred. As an example, a surface detector array may be used to measure the primary energy, angular direction and core position of a shower event, and a muon detector array for the number density of muons at various locations. With such a design, the KASCADE-Grande experiment has measured lateral muon distributions with a muon-to-shower-axis distance from 100 m to 610 m, and reconstructed energy from 1016 – 1017eV [1]. With a smaller scale experiment, this work reports a similar measurement with the lateral distance between 20 – 100 m, which is much closer to the shower core. Besides, the punch-through effect in our analysis is carefully evaluated via simulation.
-
YBJ-HA is a hybrid experiment constructed on the site of the YangBaJing cosmic ray observatory (
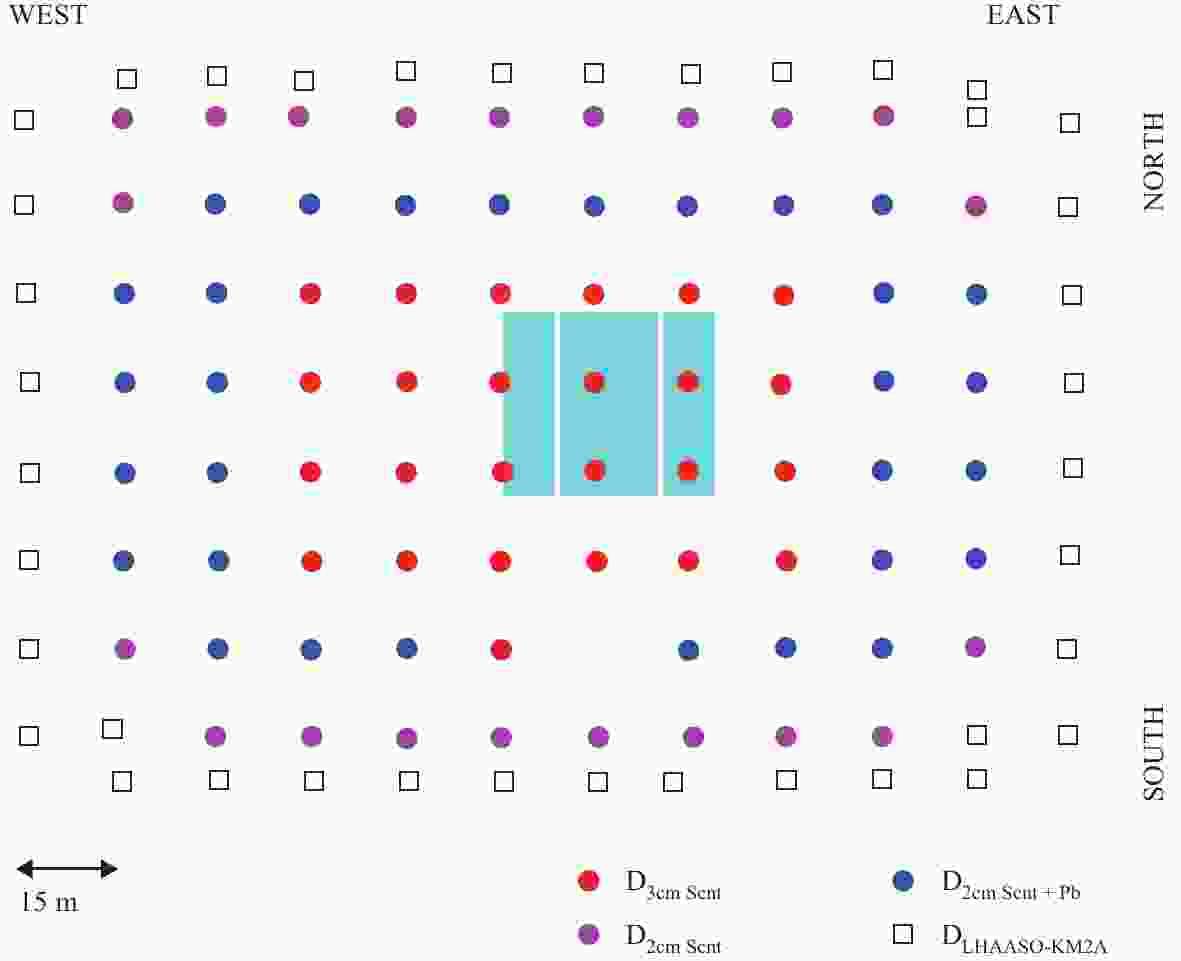
$ 90^\circ 31^\prime $ E,$ 30^\circ 60^\prime $ N; 4300 m a.s.l.) in Tibet, which has been in operation since the end of 2016. This experiment consists of a scintillation detector array (SA) and an underground water Cherenkov muon detector array (MDA). SA is designed for the detection of electromagnetic particles in EAS, and MDA for recording the muon information of EAS. YBJ-HA adopts the electronics of the Large High Altitude Air Shower Observatory Square Kilometer Complex Array (LHAASO-KM2A) and the white rabbit clock synchronization system. It served as the up-to-date largest debugging and testing platform for LHAASO-KM2A.SA consists of 116 plastic scintillation detectors. As shown in Fig. 1, the circles represent the light guide scintillation detector, where three colors indicate three types of detectors. Scintillation detectors with the same specification but different thickness and surface treatment are used. The red circles in the center of the array indicate 3 cm thick scintillator with polished surface, while blue and pink indicate 2 cm thick scintillator without polish on the surface. Besides, blue detectors are covered with 0.5 cm thick lead plates to convert gamma rays into electron-positron pairs, which increases the sensitivity in detecting the electromagnetic component. Serving as a guarding ring, the open squares along the edges are the prototype electromagnetic detectors of LHAASO-KM2A [2], which are fiber scintillation detectors. SA is divided into two groups. The detectors along the edge of the array are defined as the outer detectors, while the others are defined as the inner detectors. If a detector with the highest number of particles is in the inner group, this shower is labeled as the “in-array” event, otherwise it is the “out-array” event.
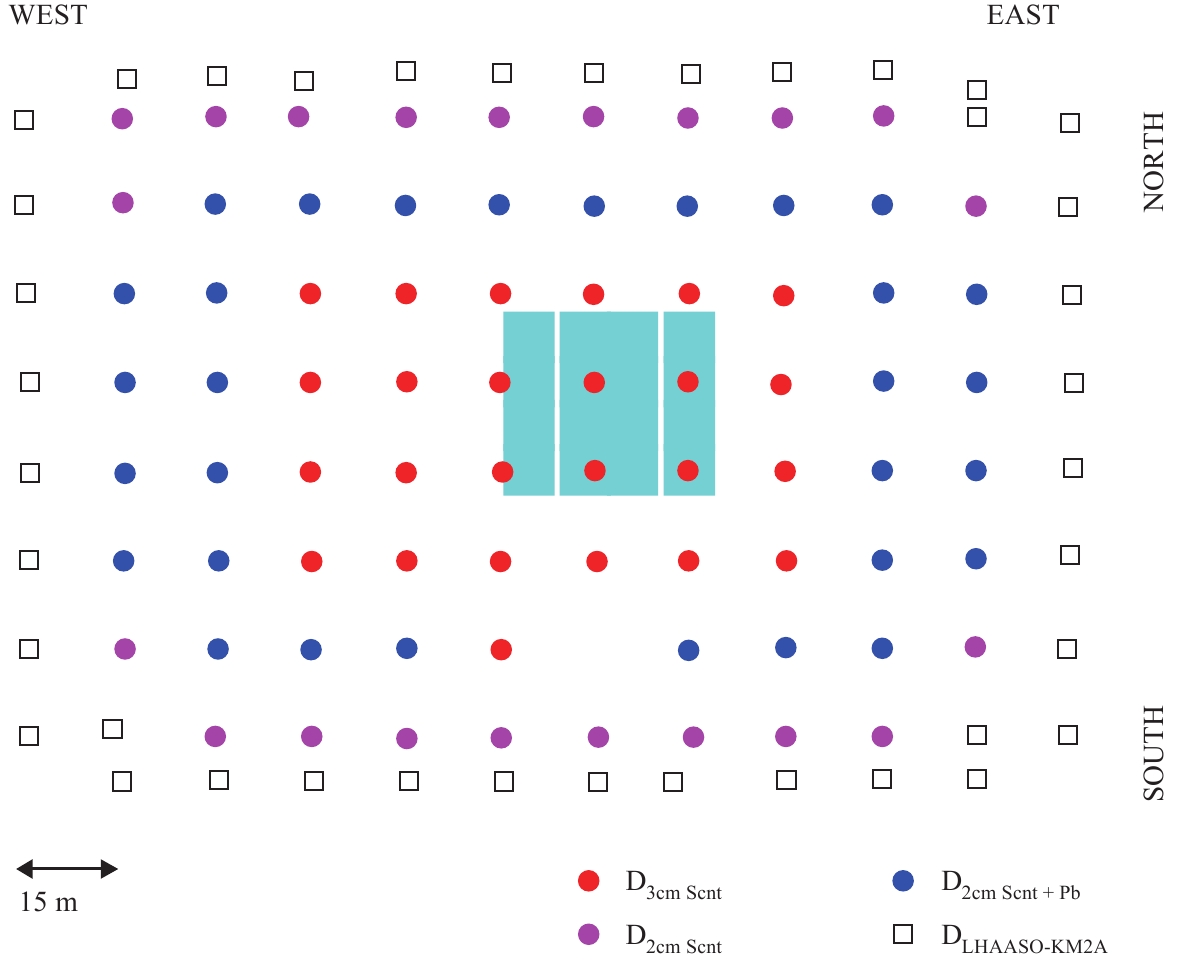
Figure 1. (color online) Layout of the YBJ-HA experiment. Circles represent surface scintillation detectors. In particular, red circles are detectors with a 3 cm thick scintillator; pink circles are detectors with a 2 cm thick scintillator; blue circles are detectors with a 2 cm thick scintillator and a lead plate. The squares are the prototype detectors of LHAASO-KM2A. Cyan shaded area is the water Cherenkov muon detector array buried 2.5 m underground.
The detectors are deployed on a grid with 15 m spacing, covering 20000 m2. The detectors at the northern edge of the array are 7.5 meters away from the inner detectors, as is the case at the southern edge. A schematic diagram of the light guide scintillation detector unit is shown in Fig. 2. It is in the shape of an inverted pyramid. At the top, each detector has a plastic scintillator with an area of 0.5 m2. At the bottom of the detector, a photomultiplier tube (PMT) is installed as the photon collector. The whole detector surface is covered with a layer of white plastic film. The performance of the detector has been described in a previous paper [3].
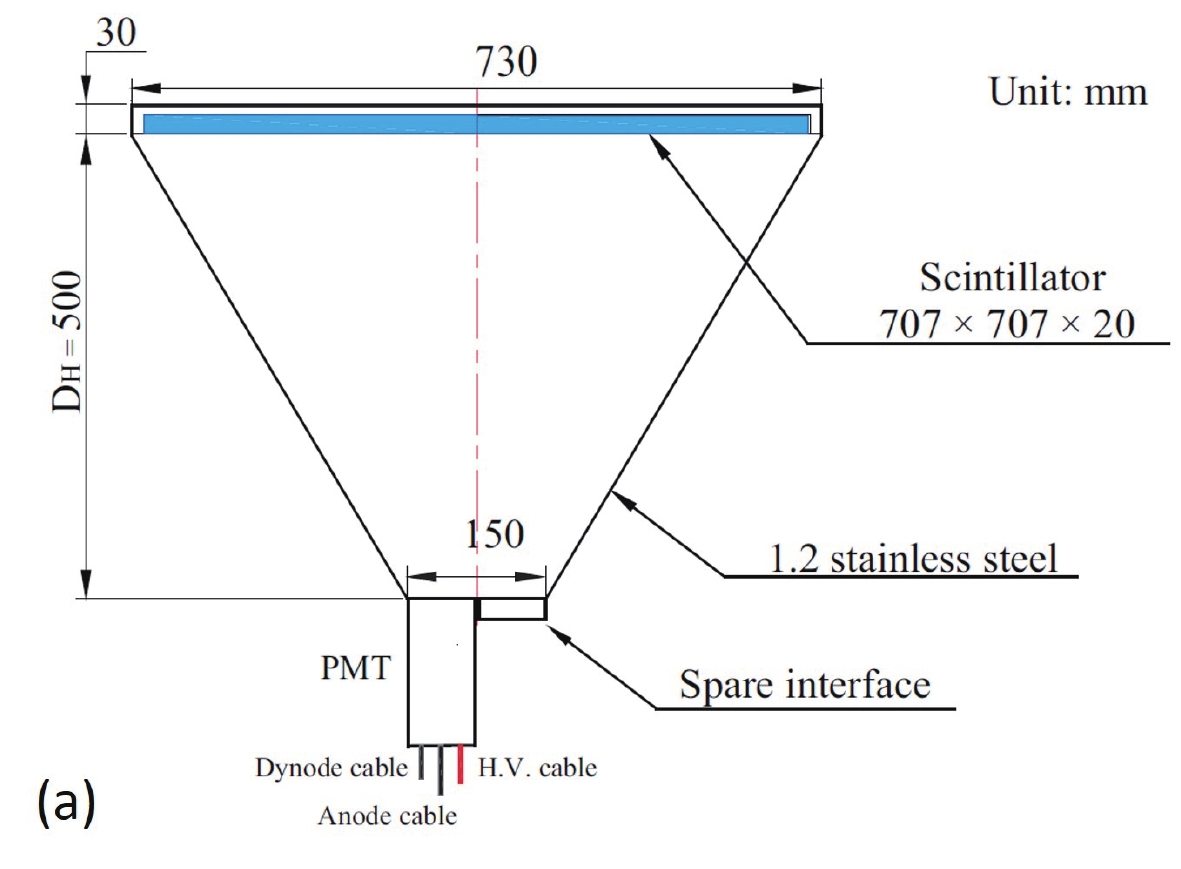
Figure 2. (color online) Schematic diagram of the prototype scintillation detector.
MDA, which uses the water Cherenkov technique, started taking data in autumn of 2013. It consists of 16 detection units with 2.5 m of soil shield, covering an area of 800 m2. Cyan shaded square in Fig. 1 indicates the position of the muon detector array with respect to SA. Each unit is a waterproof concrete pool 7.2 m wide × 7.2 m long × 1.9 m deep, equipped with a face-down 20 inch diameter PMT mounted on the ceiling. Fig. 3 shows the schematic view of one pool. These detectors are shielded by overburdened soil to prevent low energy electromagnetic particles from reaching the water, with the threshold energy of 1 GeV for vertical muons. Besides, we used a Tyvek bag to prevent water contamination, and to keep good reflection of Cherenkov photons in each pool [4]. The dynamic range of the unit detector is between 1 and 12.5 minimum ionization particles (MIPs).
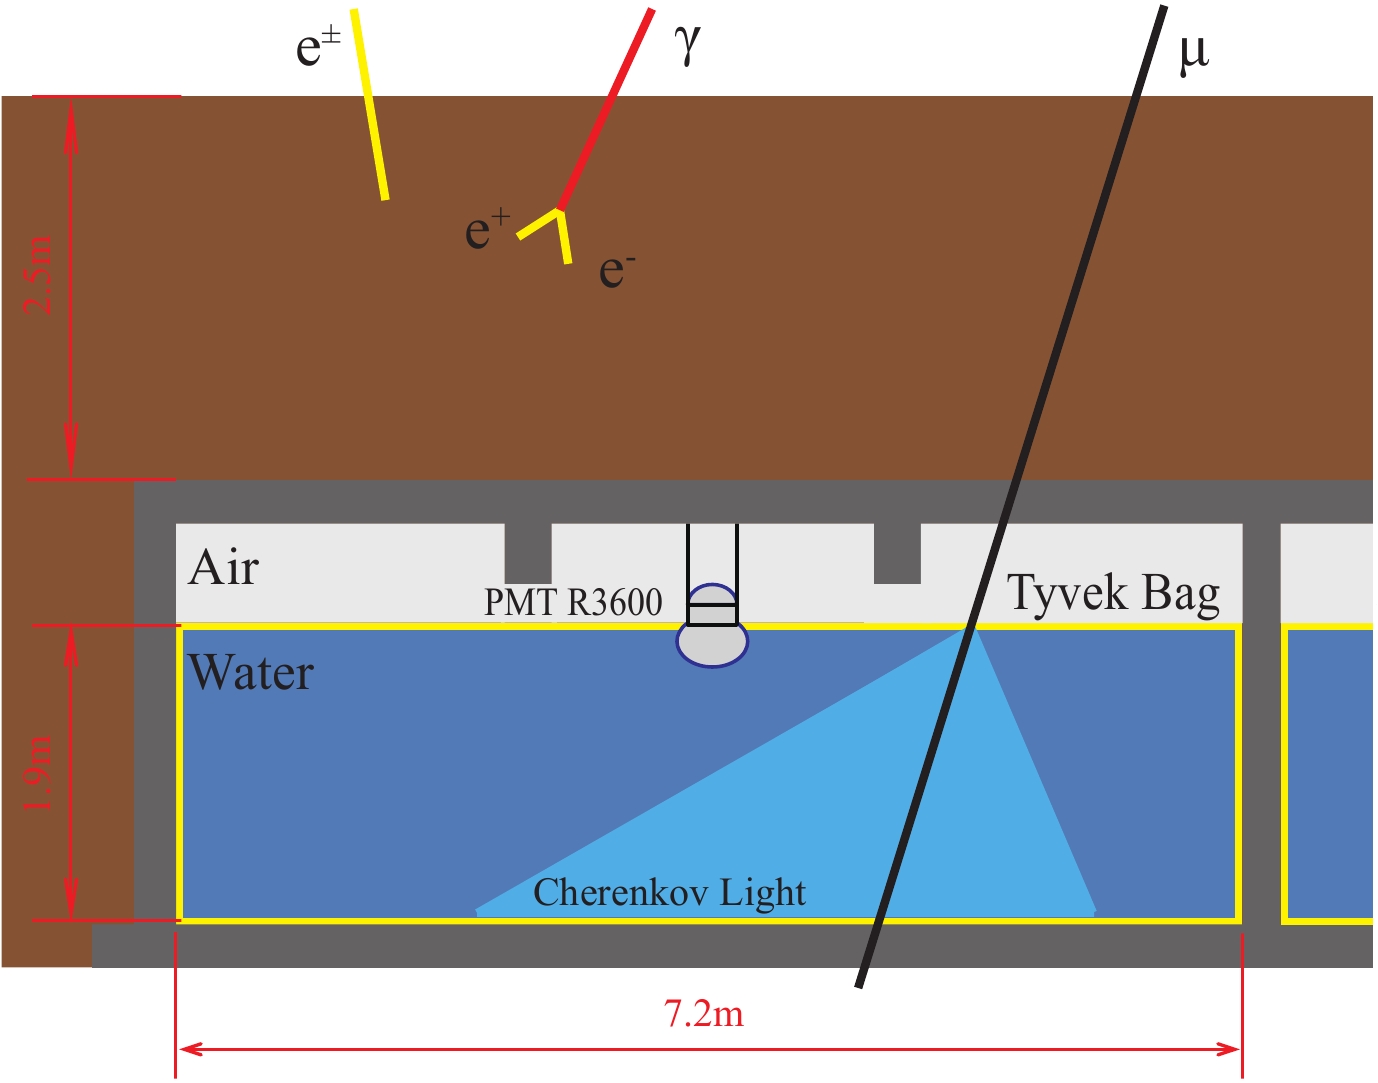
Figure 3. (color online) Schematic view of one MDA pool.
-
All processes, including the shower development in the atmosphere and the response of the detectors, are simulated. The development of EAS in the atmosphere is generated by the CORSIKA package [5] version number 74005. For the high and low energy hadronic interaction models we used QGSJET2 [6] and GHEISHA, respectively. Different primaries (H, He, CNO, MgAlSi and Fe) are generated in the energy range from 1 TeV to 10 PeV. These events are properly weighed to resemble the spectra of two CR component models: the Hillas model [7] and the Horandel model [8]. All events are generated in a uniform shower core distribution, scattering in a 400 m × 400 m area around the array center, to ensure a large enough sampling area containing almost all events that can trigger the array. The response of the scintillation detectors and water Cherenkov muon detectors is simulated by a special GEANT4 package. The reliability of this simulation software has been verified in previous analysis [9].
-
This analysis is based on the data collected in the period from December 2016 till August 2017. The events were selected by imposing the following five criteria on the reconstructed data:
1) The shower labeled as the “in-array” event.
2) Each shower event should fire four or more detectors.
3) The average time residual should be smaller than 1 m.
4) The sum of the number of particles from all fired detectors should be larger than 60 MIPs.
5) The reconstructed zenith angle of the shower should be less than 45 degrees.
To obtain high quality data, some essential parameters of the experiment were compared with the MC data. The sum of particle densities in all scintillation detectors (
$ \sum \rho $ ) can be a good indicator for the true energy of CRs. The correlation of$ \sum \rho $ and energy has been demonstrated by the Tibet ASγ experiment [10]. Figure 4 shows the distribution of$ \sum \rho$ from the experiment and from MC simulation. The black points are the experimental data and the red line indicates the MC samples. The upper axis represents the true energy of the primary particles given by the simulation. The experimental data and MC show good agreement when$\sum \rho $ is less than 103.8. The deviation above 103.8 is due to energy truncation above 10 PeV in the MC simulation. Apparently, the energy spectrum of the experimental data shows a break at the energy around a few PeV, consistent with the expected “knee” structure.
Figure 4. (color online) Distribution of the sum of particle densities in all detectors (
$ \sum \rho$ ) from the experiment and MC simulation.The resolution of the shower core position is important for the measurement of the lateral distribution of muons. The commonly used method for core reconstruction is to fit the particle density with the NKG function [11]. The resolution of the core position is evaluated using the even-odd method [3]. Figure 5 shows the distribution of the difference of the core position between the even array and the odd array. The position resolution is defined such that the confidence region contains 50% of the events. With this method, the position resolution in our experiment is 4.8 meters with the reconstructed energy of 100 TeV. Figure 6 shows the resolution of shower core positions for different primary energies.
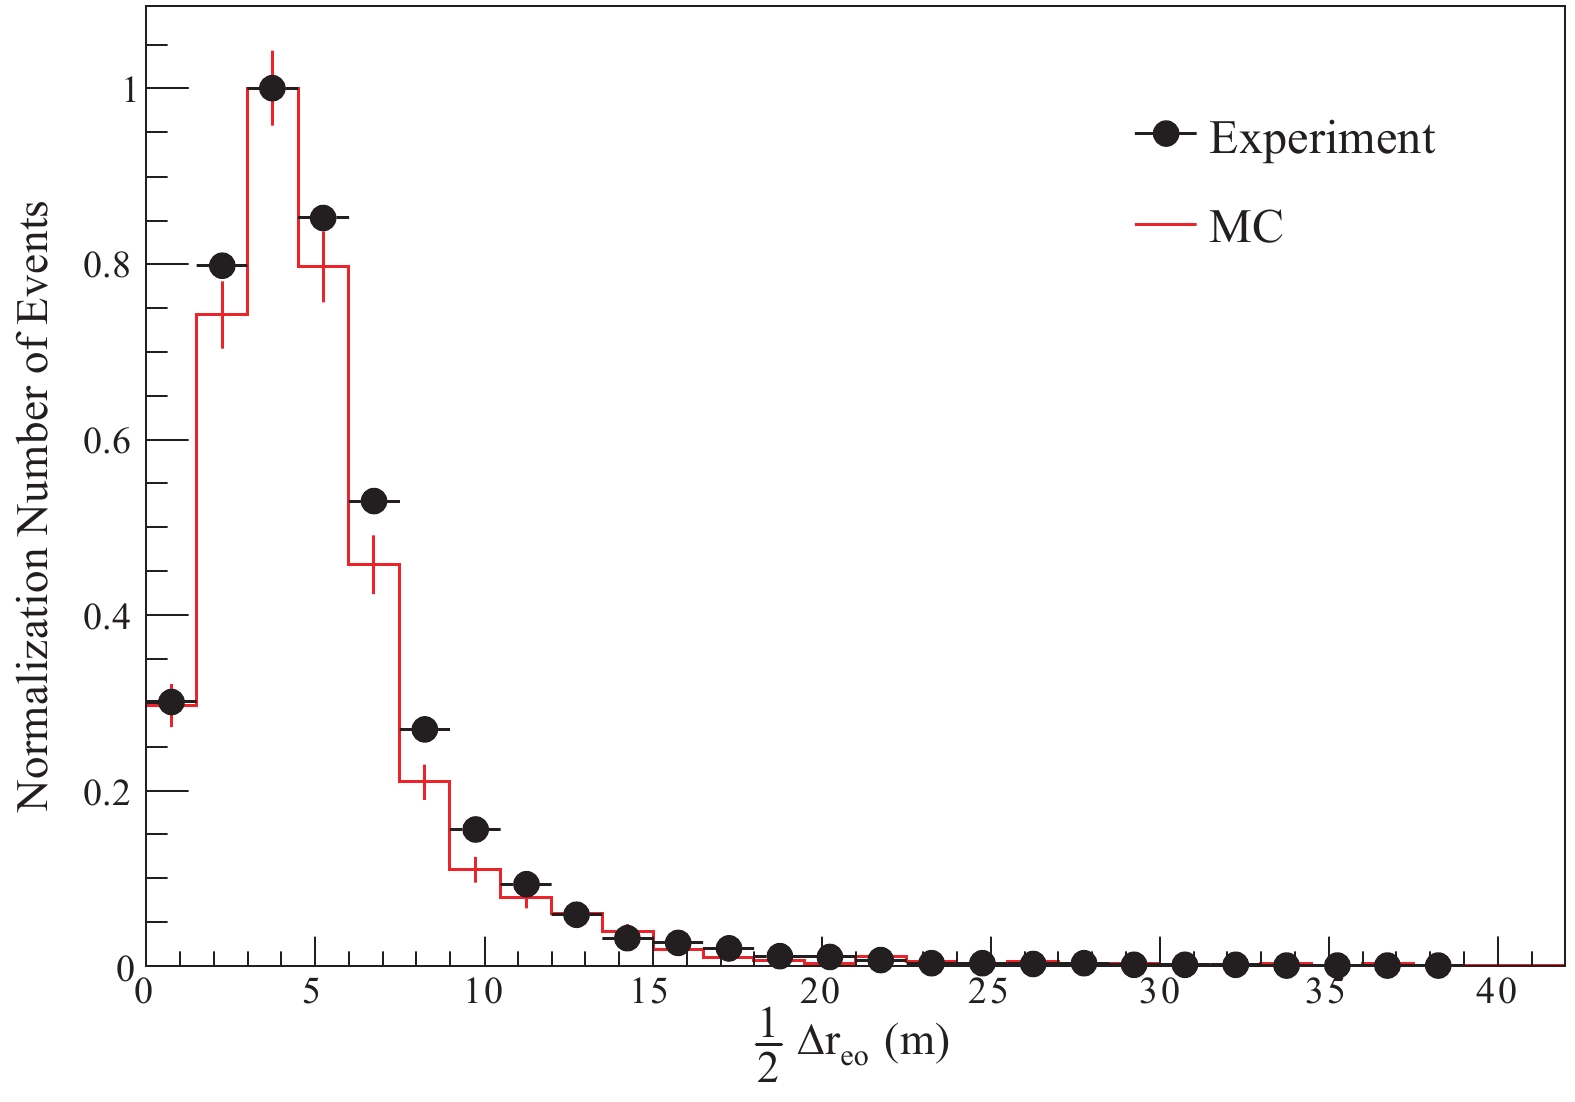
Figure 5. (color online) Distribution of
$\frac {1}{2} \Delta r_{\rm eo} $ for the experimental data and MC data. Each event has two shower cores, derived from the even array and the odd array. Δreo is the distance between the two shower cores.
Figure 6. Resolution of the shower core position for different primary energies.
After applying the above criteria, a sample of the showers with high quality parameters in energy, core position and direction is selected. In order to rule out the background muons from the other irrelevant showers, a cut on the time residual of muons is applied. Figure 7 shows a comparison of the time residual of muons between the experimental data and MC. The black points are the experimental data and the red line indicates the MC samples. The peak indicates the muon signals from EAS, while the flat sections on both sides of the peak indicate background. Therefore, we can select the events whose time residual is in the range from –90 ns to 210 ns. The very wide time window covers almost all muon signals from the shower, valid for both the experimental data and MC. In this case, the number of survival background events is only 0.002 for each detector. The spectrum of the selected muons is shown in Fig. 8. In this figure, the black points are the experimental data and the red line is MC. Apparently, the good agreement between the experiment and simulation shows that our data is well understood.
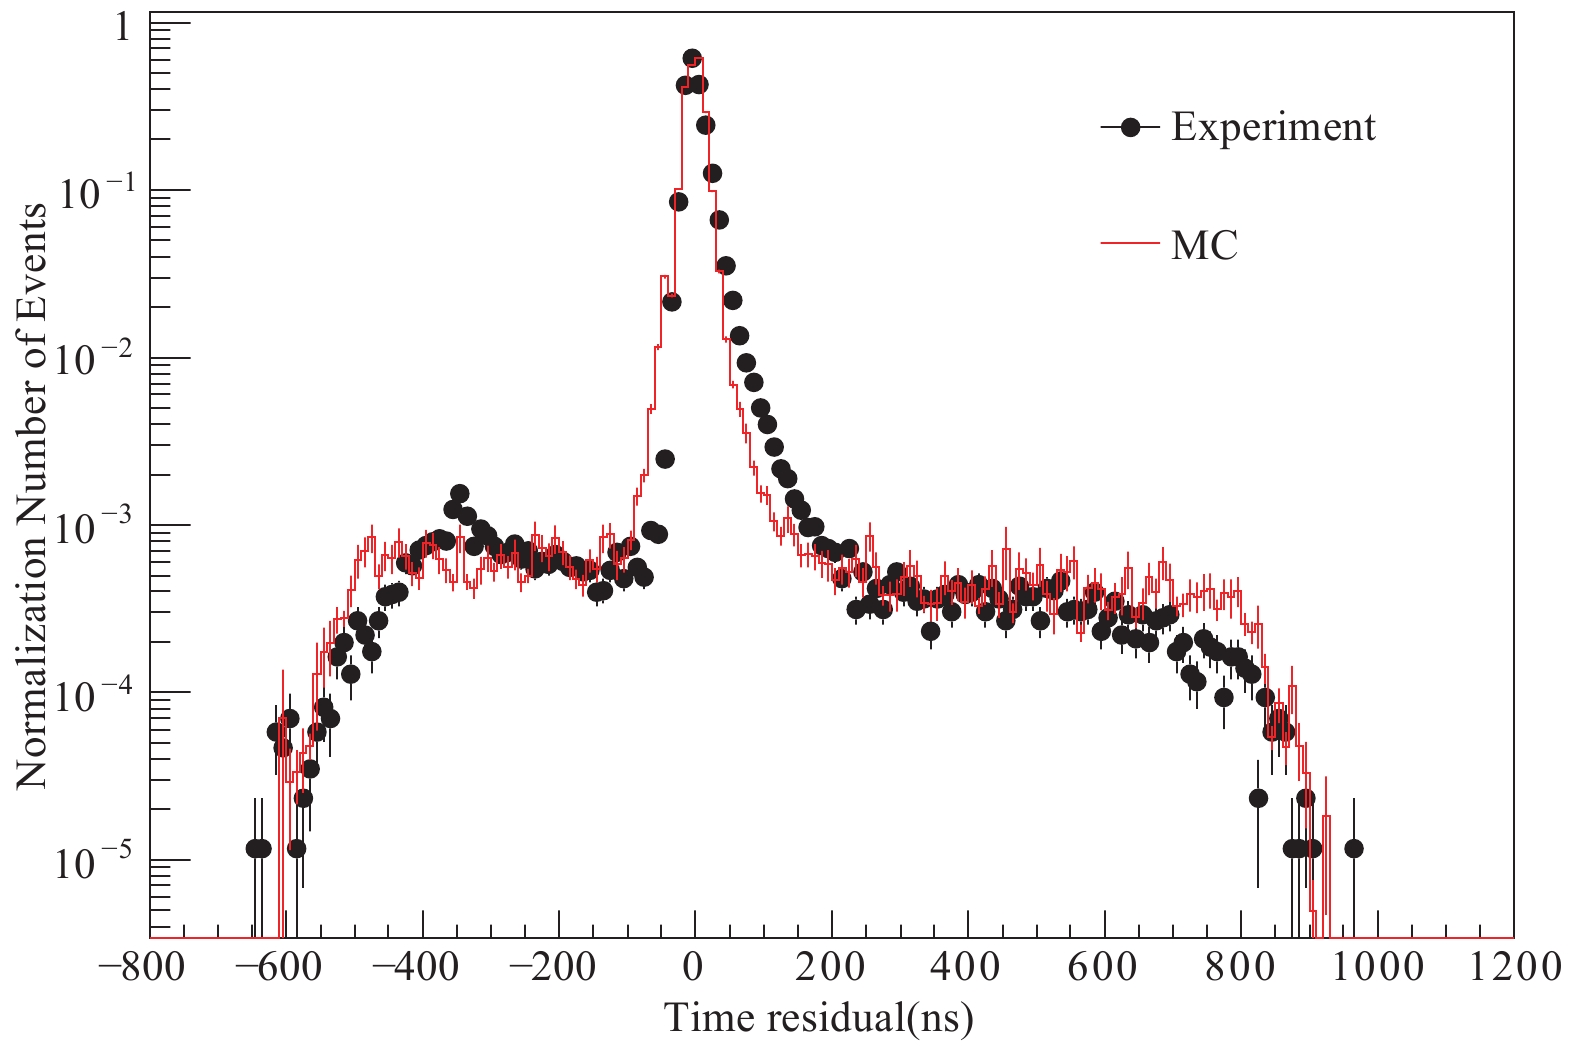
Figure 7. (color online) Distribution of the time residual of the muon detector.
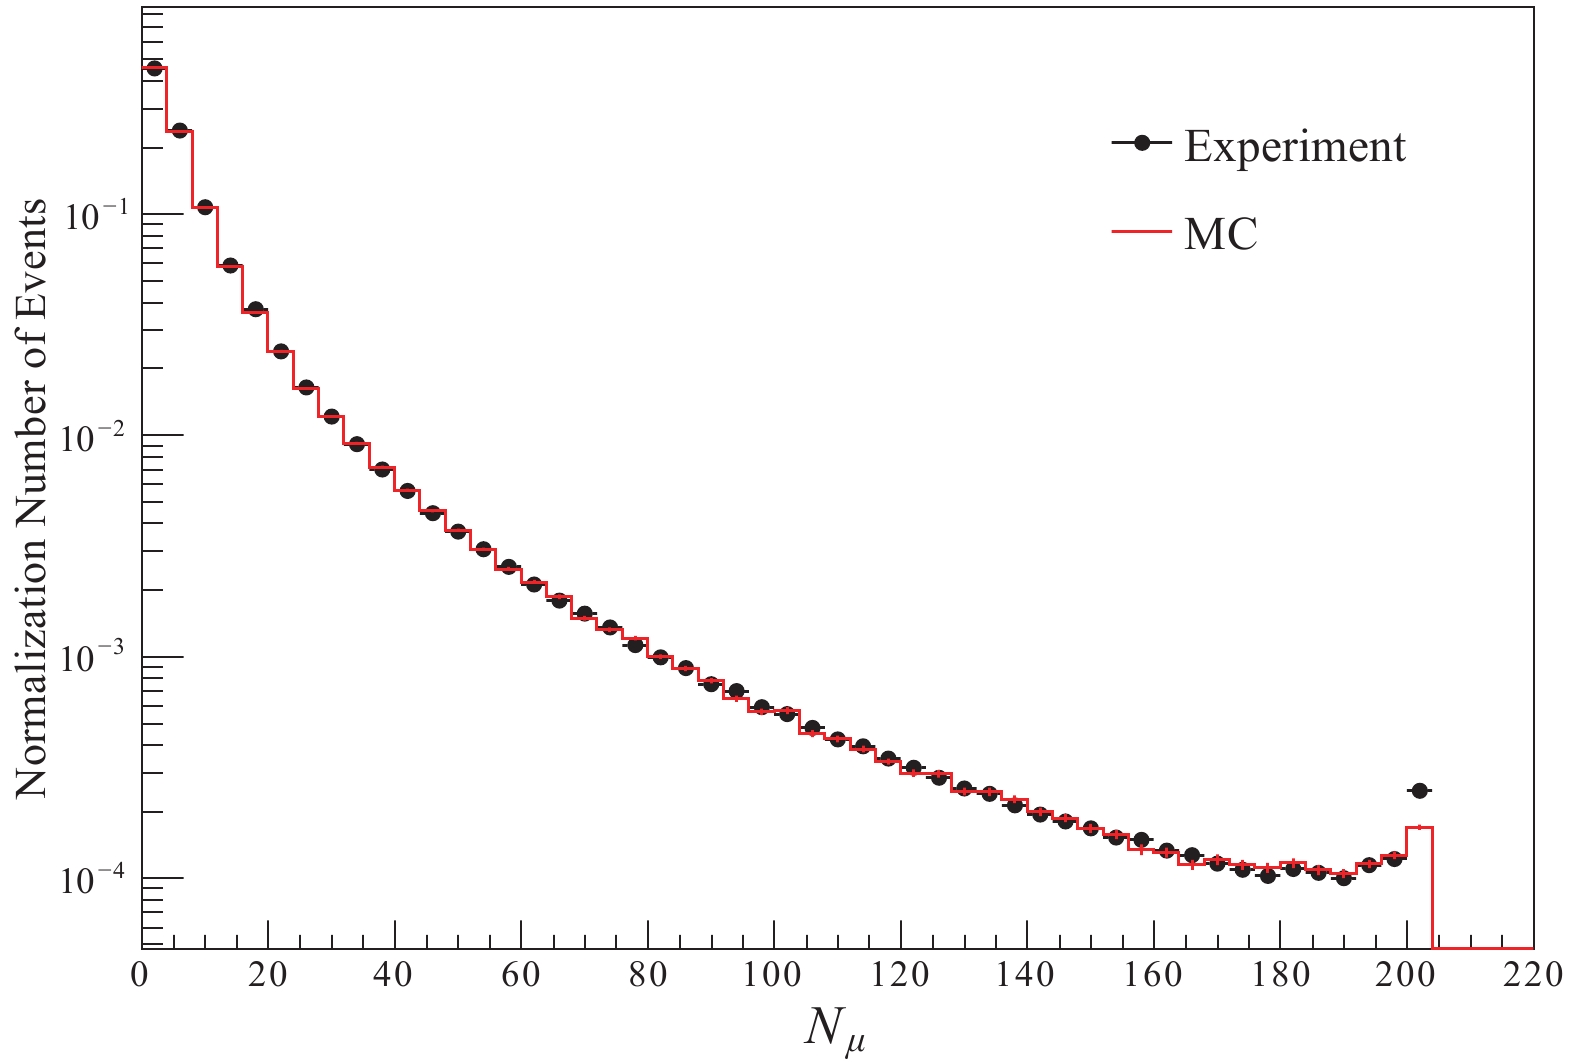
Figure 8. (color online) Muon spectrum from MD.
-
To measure the muon lateral distribution, the distance between the center of an MD unit and the shower axis is grouped in rings with a 5 m step. For the ring group Ri, the mean number of muons in a shower ρ(Ri) is then calculated as:
$\rho ({R_i}) = \frac{{{M_i}}}{{{K_i}}} \times \frac{1}{{S \cdot \cos\theta }},$

(1) where Mi is the total number of muons;
Ki is the number of events in the i-th group;
S is the effective area of the MD detection unit, 51.8 m2 in our case;
θ is the zenith angle of the CR event.
The high energy electromagnetic components in a shower core region can also penetrate the soil layer and emit a large amount of Cherenkov light in the pool, which is called the “punch-through” effect. This effect can be eliminated by requesting that the shower core is far away from the muon detector. For this reason, the distance between the core position and the MD center is set to be more than 20 m in this analysis. Similarly, due to the dynamic range of MD, if the shower energy is too high, or if they are too close to the shower core position, the number of muons would exceed an upper limit. This effect is even worse when punch-through appears. Saturation and punch-through effects can be corrected by MC, but the correction would introduce a systematic uncertainty. Therefore, in this work we limit the energy range between 50–300 TeV, and keep the lateral distance in the measurement larger than 20 m.
Figure 9 shows the measured lateral muon distribution around 100 TeV for the zenith angle less than 15 degrees. The blue squares are the experimental data, while the green stars and red triangles are simulations. From the plot, the simulated data are consistent with the experiment, and there is no obvious difference between the two models. The pink circles are signals produced by pure muons in EAS. They are obtained by subtracting the punch-through effect from the red plots. As a matter of fact, the particle type, energy and the number of emitted photons by secondary particles, which pass through the muon detector, are recorded in the simulation. Therefore, the signal produced by pure muons in EAS can be singled out, and the punch-through effect is then the result of other secondary particles.

Figure 9. (color online) Measured muon density distribution for the zenith angle of the shower
$ \theta \leqslant 15^\circ$ . The blue points represent muon density distribution obtained from the experimental data, while the green and red points represent the distributions from the Hillas model and the Horandel model, respectively. The pink points represent the distribution of pure muons in EAS obtained from MC simulation.We define the “punch-through” coefficient of the muon density distribution at distance R as P(R):
$ P(R) = \frac{\rho_{\rm exp}(R)-\rho_{\rm muon}(R)}{\rho_{\rm exp}(R)}\times 100 {\text{%}} . $

(2) Here,
$ \rho_{\rm exp}(R) $ is the muon density measured by the experiment and$ \rho_{\rm muon}(R) $ is the density of pure muons. Figure 10 shows the “punch-through” coefficient of the muon density distribution around 100 TeV for the zenith angle of the shower$ \theta \leqslant 15^\circ$ . It can be seen that when the distance between the core position and the center of MD is more than 30 meters, the “punch-through” coefficient is less than 20%; when this distance is more than 50 meters, the “punch-through” coefficient is less than 10%.
Figure 10. The “punch-through” coefficient of the muon density distribution around 100 TeV for the zenith angle of the shower
$\theta \leqslant 15^\circ $ . -
In all energy intervals, the lateral distributions obtained with YBJ-HA are fitted with a function proposed by Greisen for the muonic component (
$ E_\mu ^{\rm thr} > $ $1~{\rm GeV} $ ) [12]:$ \rho(R) = C \left(\frac{R}{r_{\rm G}}\right)^{-0.75}\times\left(1+\frac{R}{r_{\rm G}}\right)^{-2.5}, $

(3) where
$ C = {\rm const} \cdot N_{\mu} $ , rG is the Greisen radius. In this analysis, the fit parameters are rG and the scaling factor C of the distributions.The lateral distributions obtained for different zenith angles are presented in Fig. 11. The lines represent Greisen function fits to the data, and the values of the C and rG fit parameters are presented in Table 1. In these results, the punch-through effect has been properly estimated by MC simulation and removed from the measurements. As expected, the muon density decreases with increasing zenith angle. This is due to the fact that as the zenith angle increases the shower penetrates deeper into the atmosphere.

Figure 11. (color online) Lateral density distribution of muons in four primary energy ranges. Left, for zenith angle of the shower
$ \theta \leqslant 15^\circ$ ; middle, for$15^\circ < \theta \leqslant 30^\circ $ ; right, for$30^\circ < \theta \leqslant 45^\circ $ . Statistical and systematic errors are included in this analysis. The lines represent Greisen function fits to the data.θ energy/TeV C/m−2 rG/m θ≤15° 50 $ (3.94\pm1.27)\times 10^{-3} $ 

$ (2.88\pm0.86)\times 10^{2} $ 

100 $ (1.06\pm0.26)\times 10^{-2} $ 

$ (1.98\pm0.40)\times 10^{2} $ 

200 $ (2.64\pm0.62)\times 10^{-2} $ 

$ (1.60\pm0.29)\times 10^{2} $ 

300 $ (3.12\pm0.87)\times 10^{-2} $ 

$ (1.81\pm0.41)\times 10^{2} $ 

15°<θ≤30° 50 $ (3.66\pm1.74)\times 10^{-3} $ 

$ (2.84\pm1.23)\times 10^{2} $ 

100 $ (1.04\pm0.29)\times 10^{-2} $ 

$ (1.97\pm0.45)\times 10^{2} $ 

200 $ (2.54\pm0.59)\times 10^{-2} $ 

$ (1.57\pm0.28)\times 10^{2} $ 

300 $ (3.31\pm0.93)\times 10^{-2} $ 

$ (1.68\pm0.37)\times 10^{2} $ 

15°<θ≤30° 50 $ (2.40\pm1.85)\times 10^{-3} $ 

$ (3.52\pm2.58)\times 10^{2} $ 

100 $ (8.01\pm4.12)\times 10^{-3} $ 

$ (2.14\pm0.94)\times 10^{2} $ 

200 $ (2.01\pm0.46)\times 10^{-2} $ 

$ (1.62\pm0.29)\times 10^{2} $ 

300 $ (2.65\pm0.78)\times 10^{-2} $ 

$ (1.74\pm0.42)\times 10^{2} $ 

Table 1. Fit parameters C and
$ r_G $ of the lateral density distribution of muons obtained with YBJ-HA. -
In this analysis, four sources of systematic errors were investigated. 1) The non-uniformity of the response of the muon detectors and the geometry of the detector array contribute about ±(1.4%–6.0%) to the total systematic error. This systematic error is estimated on the basis of the differences between the detectors. 2) The stability of the array performance. The response of the detectors over time fluctuates mainly due to the variation of ambient temperature and detector aging. To evaluate the systematic error from this fluctuation, the collected data were divided into two groups based on different time periods. The results obtained from the comparison and analysis of the two groups show that this fluctuation contributes about ±(0.9%–2.1%) to the total systematic error. 3) The exact composition of primary cosmic rays is still an open issue. The Hillas model and the Horandel model are two models accepted by the community. Calculations based on both models were carried out. The difference between the models is used to estimate the model dependent systematic error, which is approximately ±(1.4%–4.5%). 4) Not all surface detectors are covered with lead plates, which leads to a slight difference of the total measured secondary particles. Therefore, in the reconstruction process, a correction was carried out based on the comparison between detectors with and without lead plate covers. After correction, the error from the lead plates is around ±(0.2%–1.3%).
-
The YangBaJing Hybrid Array has been in continuous and stable operation since December 2016. The simulated data are consistent with the experiment. The measured lateral muon distribution for the primary cosmic ray energies between 50 to 300 TeV for various zenith angles was presented in this work. There is no obvious difference of the lateral muon distribution between the Hillas model and the Horandel model.
Lateral distribution of EAS muons measured for the primary cosmic ray energy around 100 TeV
- Received Date: 2019-02-20
- Available Online: 2019-07-01
Abstract: The muonic component of the extensive air showers (EAS) is of great importance for the astroparticle physics. It carries the information about the properties of primary cosmic ray (CR) particles, such as their mass, and electromagnetic and hadronic nature. It provides a sensitive test for the hadronic interaction models, which are inevitable for describing the cascade shower development of cosmic rays in EAS experiments. The YangBaJing Hybrid Array (YBJ-HA) experiment has been in operation since the end of 2016. Surface detectors are used for the measurements of primary energy, angular direction and core position of a shower event, while underground muon detectors are used for measuring the density of muons at various locations. Using the data obtained by the YBJ-HA experiment, this work reports the first measurement of the lateral muon distribution for the primary cosmic ray energy in the 100 TeV region. The punch-through effect is evaluated via MC simulation.


 DownLoad: